brp inc. fiscal 2014 q4 reports... · the purpose of the forward-looking statements is to provide...
TRANSCRIPT

QUARTERLY REVIEW THIRD QUARTER ENDED OCTOBER 31, 2014

2 BRP Inc. - FY15 Q3
Forward-Looking Statements Certain statements in this presentation about the Company’s current and future plans, expectations and intentions, results, levels of activity, performance, goals or achievements or any other future events or developments constitute forward-looking statements. The words “may”, “will”, “would”, “should”, “could”,
“expects”, “plans”, “intends”, “trends”, “indications”, “anticipates”, “believes”, “estimates”, “predicts”, “likely” or “potential” or the negative or other variations of
these words or other comparable words or phrases, are intended to identify forward-looking statements.
Forward-looking statements are based on estimates and assumptions made by the Company in light of its experience and perception of historical trends, current conditions and expected future developments, as well as other factors that the Company believes are appropriate and reasonable in the circumstances, but there can be no assurance that such estimates and assumptions will prove to be correct. Many factors could cause the Company’s actual
results, level of activity, performance or achievements or future events or developments to differ materially from those expressed or implied by the forward-looking statements, including, without limitation, the following factors, which are discussed in greater detail in the “Risk Factors” section of the Company’s
Management Discussion and Analysis for the quarter ended January 31, 2014 dated March 28, 2014: impact of adverse economic conditions on consumer spending; decline in social acceptability of the Company’s products; fluctuations in foreign currency exchange rates; high levels of indebtedness; unavailability of additional capital; unfavourable weather conditions; seasonal sales fluctuations; the Company’s ability to comply with product safety, health, environmental
and noise pollution laws; dependence on dealers, suppliers, financing sources and other strategic partners who may be sensitive to economic conditions; large fixed cost base; inability of dealers and distributors to secure adequate access to capital; supply problems, termination or interruption of supply arrangements or increases in the cost of materials; restrictive covenants in the Company’s financing and other material agreements; compet ition in product lines; loss of members of management team or employees who possess specialized market knowledge and technical skills; inability to maintain and enhance reputation and brands; adverse determination in any significant product liability claim against the Company; significant product repair and/or replacement due to product warranty claims or product recalls; reliance on a network of independent dealers and distributors to manage the retail distribution of products; dependence on customer relationships for the sale of original equipment manufacturer products; unsuccessful management of inventory; risks associated with international operations; inability to enhance existing products and develop and market new products; protection of intellectual property; failure of information technology systems; declining prices for used versions of products and oversupply by competitors; unsuccessful execution of manufacturing strategy; actual results may differ from financial outlook; changes in tax laws and unanticipated tax liabilities; higher fuel costs; deterioration in relationships with employees; pension plan liabilities; natural disasters; failure to carry proper insurance coverage; no prior public market for subordinate voting shares; volatile market price for subordinate voting shares; no current plans to pay dividends; public company expenses; conduct of business through subsidiaries; significant influence by principal shareholders; and future sales of shares by principal shareholders, directors, officers or senior management of the Company.
The purpose of the forward-looking statements is to provide the reader with a description of management’s expectations regarding the Company’s financial
performance and may not be appropriate for other purposes; readers should not place undue reliance on forward-looking statements made herein. Furthermore, unless otherwise stated, the forward-looking statements contained in this presentation are made as of the date of this presentation, and the Company has no intention and undertakes no obligation to update or revise any forward-looking statements, whether as a result of new information, future events or otherwise, except as required by applicable securities regulations. The forward-looking statements contained in this presentation are expressly qualified by this cautionary statement.

3 BRP Inc. - FY15 Q3
JOSÉ BOISJOLI CEO
QUARTERLY REVIEW THIRD QUARTER ENDED OCTOBER 31, 2014

4 BRP Inc. - FY15 Q3
Strong quarter driven by high volume of snowmobile vehicle and PAC
Gross profit margin percentage increased 20bps to 26.1%
Normalized EBITDA grew 13% to $134.1M
Normalized diluted earnings per share[1] increased 20% to $0.60
Net income of $37.2M compared to a net income of $48.2M for the same period last year
Strong quarter driven by high volume of snowmobile vehicles and PAC
Gross profit margin percentage increased 20bps to 26.1%
Normalized EBITDA[1] grew 13% to $134.1M
Normalized diluted earnings per share[1] increased 20% to $0.60
Net income of $37.2M compared to a net income of $48.2M for the same period last year
$0.50 $0.60
FY14 Q3 FY15 Q3
$866.0 $918.0
FY14 Q3 FY15 Q3
FY15 Q3 Revenues and Normalized EPS
Revenues CA$ millions
Financial Highlights
Normalized EPS - Diluted[1]
CA$ millions
20% 6%
[1] For a reconciliation of net income to Normalized Net Income and Normalized EBITDA, see the reconciliation tables in appendix
5 BRP Inc. - FY15 Q3
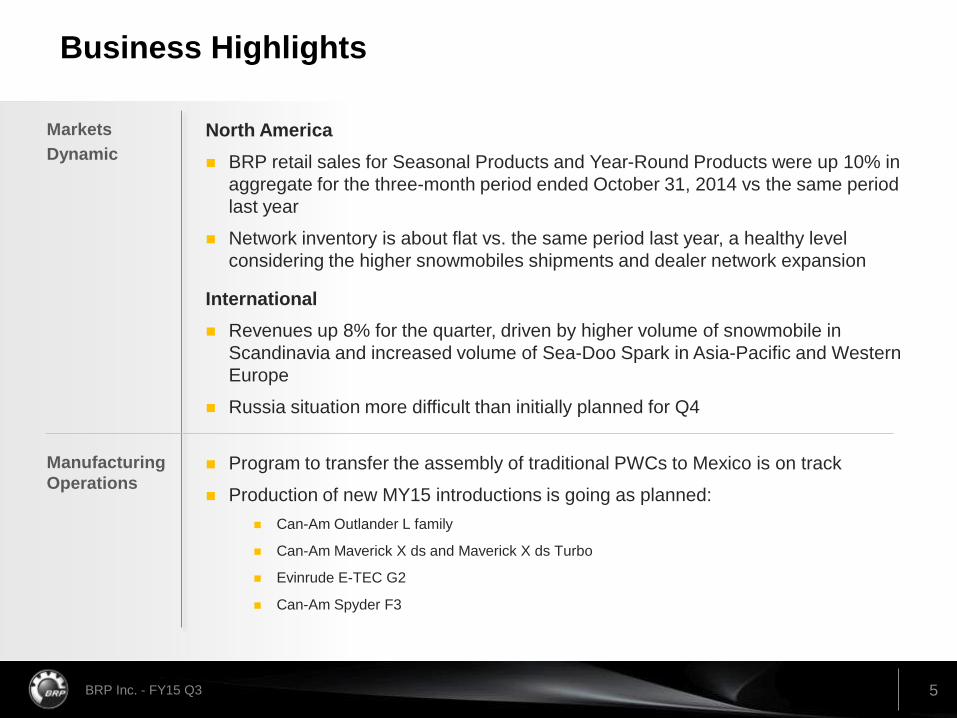
Business Highlights
Markets Dynamic
North America
BRP retail sales for Seasonal Products and Year-Round Products were up 10% in aggregate for the three-month period ended October 31, 2014 vs the same period last year
Network inventory is about flat vs. the same period last year, a healthy level considering the higher snowmobiles shipments and dealer network expansion
International
Revenues up 8% for the quarter, driven by higher volume of snowmobile in Scandinavia and increased volume of Sea-Doo Spark in Asia-Pacific and Western Europe
Russia situation more difficult than initially planned for Q4
Manufacturing Operations
Program to transfer the assembly of traditional PWCs to Mexico is on track
Production of new MY15 introductions is going as planned:
Can-Am Outlander L family
Can-Am Maverick X ds and Maverick X ds Turbo
Evinrude E-TEC G2
Can-Am Spyder F3

6 BRP Inc. - FY15 Q3
Russian ruble losing over 30% of its value since the Q2 earnings call is forcing us to adjust Q4 deliveries
Russia Snowmobile Orders Confirmation
Planned Snowmobile Shipments to Russia
Adjusting guidance to account for the expected financial impact
31-Jul-13 31-Oct-13 31-Jan-14 30-Apr-14 31-Jul-14 31-Oct-14
FY14Q3 FY14Q4 FY15Q1 FY15Q2 FY15Q3 FY15Q4
EUR/RUB Q2 Earnings Call - Sep 12
49.0 RUB/EUR
Orders - July
Avg. 47.0 RUB/EUR
Dec 10th Rate
68.1 RUB/EUR
Purchasing power lost :
-39% since Q2 Call
-45% since orders
Oct 31, 2013
43.6 RUB/EUR
Source : Capital IQ

7 BRP Inc. - FY15 Q3
Transfer of the traditional PWC assembly to Mexico is progressing as planned
Reconfiguration of the Spark assembly line was completed during the summer to support full PWC mix production
Assembly of traditional PWC models was fully operational at the end of September, in time for counter-season markets production
Smooth Transition
50% of MY15 traditional PWC will be manufactured in Mexico
Transfer of traditional PWC production will be 100% completed for MY16
Next Steps
This project is expected to generate annual gross profit improvement of $20M to $25M by FY17
Traditional PWC
Spark
Spark
Traditional PWC

8 BRP Inc. - FY15 Q3
Seasonal Products
LUXURY PERFORMANCE GSX
EXTREME MOUNTAIN Freeride
CROSSOVER Renegade
TRAIL MXZ
TOURING Grand Touring
TOURING-UTILITY Expedition
UTILITY Skandic
MOUNTAIN Summit
RECREATION-UTILITY Tundra
$382.5
$452.9
FY14 Q3 FY15 Q3
Snowmobile
Early in the season, the North American industry retail was up in the twenties %
Ski-Doo gained market share over the same period
PWC
N.A. PWC industry retail 2014 season ended on September 30, up high-double digits %
Sea-Doo PWC retail grew in the mid-twenties % driven by the new Sea-Doo Spark
Revenues CA$ millions
Business Dynamics
18%
MY15 Ski-Doo Line-up
The Most Extensive Line-up in the
Industry

9 BRP Inc. - FY15 Q3
Year-Round Products
$249.6 $227.5
FY14 Q3 FY15 Q3
Off-Road Vehicles
Season-to-date N.A. SSV industry up mid-teens digits, Can-Am SSV retail grew less than the industry
Four months into the season, N.A. ATV industry was down low-single digits %
Can-Am ATV retail was up low-single digits %
Broke ground for the construction of Juarez 2
Roadster
2014 N.A. motorcycle industry season ended on October 31 with retail up low-single digits %
Can-Am Spyder retail grew mid-single digits %, mostly driven by the favourable market reaction to the RT 1330
Revenues CA$ millions
Business Dynamics
9%
North American SSV Industry
REC-Ute Can-Am Commander
REC-Sport Can-Am Maverick
Season-to-date segment trend
Ute-REC No Can-Am Offering
10 BRP Inc. - FY15 Q3
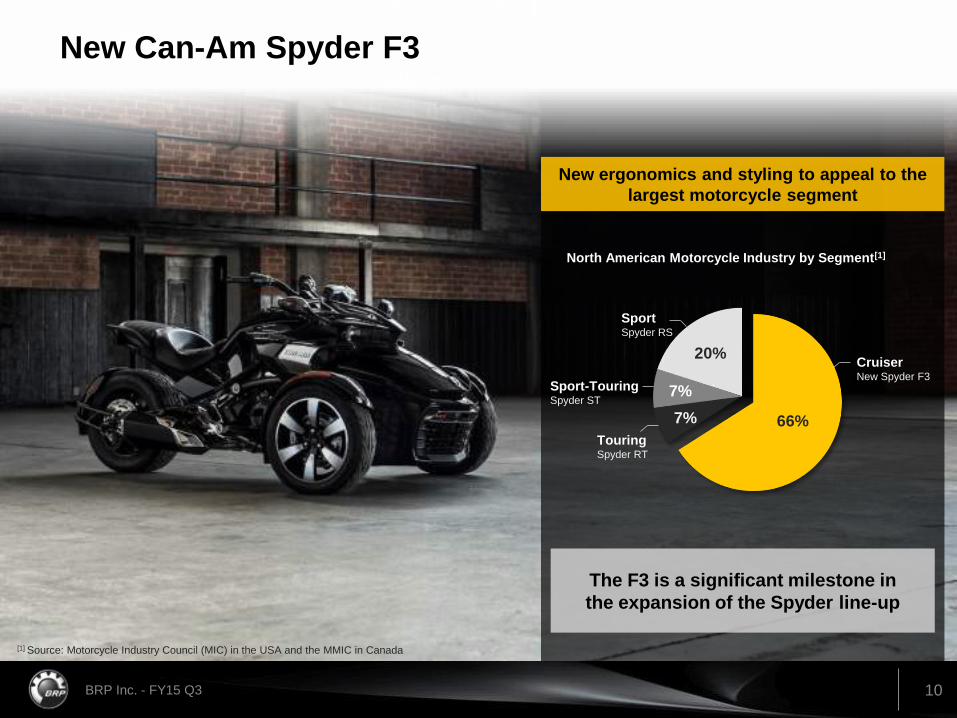
[1] Source: Motorcycle Industry Council (MIC) in the USA and the MMIC in Canada
New Can-Am Spyder F3
The F3 is a significant milestone in the expansion of the Spyder line-up
New ergonomics and styling to appeal to the largest motorcycle segment
Cruiser New Spyder F3
Touring Spyder RT
Sport-Touring Spyder ST
Sport Spyder RS
North American Motorcycle Industry by Segment[1]
66% 7%
20%
7%

11 BRP Inc. - FY15 Q3
Propulsion Systems
Revenues CA$ millions
Business Dynamics
Outboard Engines
Four months into the 2015 season, industry retail was up low-single digits %
BRP retail sales were down low-single digits % over the same period
Shipments of the Evinrude E-TEC G2 started in November
$89.6 $83.3
FY14 Q3 FY15 Q3
7%
Evinrude E-TEC G2 - OEM Update
9 OEM partners have their own unique G2 HERO package panels to match the colour of their boats

12 BRP Inc. - FY15 Q3
Parts, Accessories and Clothing
$144.3 $154.3
FY14 Q3 FY15 Q3
Revenues CA$ millions
Business Dynamics
Parts, Accessories and Clothing
Growth primarily driven by strong sales of snowmobile parts for the upcoming season
Good momentum in the sales of SSV accessories also contributing to the growth
7%
Extensive Spyder F3 PAC line-up
TOURING ESCAPE PACKAGE
URBAN NIGHTS PACKAGE
MUSCLE ATTITUDE PACKAGE
Over 60 new accessories offered in 3 packages or individually along with a new lifestyle-oriented clothing line

13 BRP Inc. - FY15 Q3
SÉBASTIEN MARTEL CFO
QUARTERLY REVIEW THIRD QUARTER ENDED OCTOBER 31, 2014

14 BRP Inc. - FY15 Q3
FY15 Q3 - Financial Highlights
1
Q3 comparison 9-month comparison CA$ millions FY15 FY14 Change FY15 FY14 Change
Total Revenues $918.0 $866.0 $52.0 $2,456.6 $2,291.2 $165.4
Growth +6.0% +7.2%
Gross Profit $239.6 $223.9 $15.7 $555.9 $584.5 ($28.6)
As a % of revenues 26.1% 25.9% 22.6% 25.5%
Operating Income $98.7 $95.0 ($3.7) $130.7 $216.9 ($86.2)
As a % of revenues 10.8% 11.0% 5.3% 9.5%
Net Income $37.2 $48.2 ($11.0) $61.6 $66.0 ($4.4)
As a % of revenues 4.1% 5.6% 2.5% 2.9%
Normalized Net Income[1] $71.9 $59.0 $12.9 $79.7 $120.0 ($40.3)
Normalized EBITDA[1] $134.1 $119.0 $15.1 $222.0 $274.2 ($52.2)
EPS - Diluted $0.31 $0.41 ($0.10) $0.52 $0.59 ($0.07)
Normalized EPS – Diluted[1] $0.60 $0.50 $0.10 $0.67 $1.08 ($0.41)
[1] For a reconciliation of net income to Normalized Net Income and Normalized EBITDA, see the reconciliation tables in appendix

15 BRP Inc. - FY15 Q3
FY15 Q3 - Revenues by Product Category and Geography
$382.5 $452.9
$249.6
$227.5
$89.6 $83.3
$144.3 $154.3
$866.0 $918.0
FY14 Q3 FY15 Q3
$342.5 $348.3
$217.5 $239.3
$306.0 $330.4
$866.0 $918.0
FY14 Q3 FY15 Q3
Seasonal Products
Year-Round Products
Propulsion Systems
PAC
+18%
-9%
+7%
-7%
United States
Canada
International
+2%
+10%
+8%
Revenues by Product Category CA$ millions
Revenues by Geography CA$ millions
6% 6%

16 BRP Inc. - FY15 Q3
Quarterly Normalized Net Income Bridge
59
72
20
9
3 (5)
(14)
FY14 Q3 Volume, Mix, Pricing and Sales
Programs
Operating Expenses
Net Financing Costs and Income
Tax Expense
Depreciation Foreign Exchange FY15 Q3
CA$ millions
Normalized Net Income increased 22% compared to FY14 Q3

17 BRP Inc. - FY15 Q3
As at Oct. 31 As at Jan. 31
CA$ millions 2014 2014 Change
Cash $45.1 $75.4 ($30.3)
Working capital 184.7 155.6 29.1
Revolving credit facilities 2.2 10.5 (8.3)
Long-term debt[1] 924.1 889.9 34.2
9-month comparison
CA$ millions FY15 FY14 Change
Capital expenditures ($107.5) ($93.5) ($14.0)
Free cash flow[2] (3.3) (52.0) 48.7
FY15 Q3 - Financial Position and Liquidity Profile
[1] Including current portion of long-term debt [2] Free cash flow is defined as net cash flow from operating activities minus capital expenditures

18 BRP Inc. - FY15 Q3
Q1 Q2 Q3 Q4
BRP North American Powersports Dealer Network
North American Dealer Inventory Level Units, Excluding Outboard Engines
Dealer inventory ended FY15 Q3 at the same level as FY14 Q3
Seasonal Products
Inventory up - driven by increased shipments of snowmobiles to meet higher demand for the current season
Year-Round Products
Inventory down - Driven by ORV
Dealer network expansion is progressing well and is in-line with our plan
FY15 FY13 FY14
Network inventory is at the same level as last year despite increased snowmobile shipments and dealer network expansion

19 BRP Inc. - FY15 Q3
FY15 Full-Year Guidance - as at December 12, 2014
[1] Effective tax rate based on Normalized Earnings before Income Tax
[3] The 4% to 11% increase assumes a constant weighted average number of diluted shares of 118.9 million for both FY15 and FY14.
[2] Assuming $116M Depreciation Expense
Financial Metric FY15 Guidance vs FY14
Revenues
Seasonal Products Up 10% to 14% (lowered from up 12% to 16%)
Year-Round Products Up 6% to 10%
Propulsion Systems Up 7% to 10%
PAC Up 10% to 15%
Total Company Revenues Up 8% to 12% (lowered from up 9% to 13%)
Normalized EBITDA Up 7% to 11% (lowered from up 11% to 15%)
Effective Tax Rate[1] 24.5% - 25.5% (lowered from up 26% - 27%)
Normalized Net Income[2] Up 4% to 11% (lowered from up 10% to 17%)
Normalized Earnings per Share – Diluted $1.47 to $1.57 (up 4% to 11%)[3]
(lowered from $1.55 to $1.65)
Capital Expenditures $165M to $175M
No change unless otherwise noted

20 BRP Inc. - FY15 Q3
Closing Remarks
QUARTERLY REVIEW THIRD QUARTER ENDED OCTOBER 31, 2014
© 2014 BRP Inc. all rights reserved. Ski-Doo, Lynx, Sea-Doo, Evinrude, Rotax, Can-Am and the BRP logo are trademarks of Bombardier Recreational Products Inc. or its affiliates.
SKI-DOO©
LYNX©
SEA-DOO©
EVINRUDE©
ROTAX©
CAN-AM©

21 BRP Inc. - FY15 Q3
Q&A Period
QUARTERLY REVIEW THIRD QUARTER ENDED OCTOBER 31, 2014
© 2014 BRP Inc. all rights reserved. Ski-Doo, Lynx, Sea-Doo, Evinrude, Rotax, Can-Am and the BRP logo are trademarks of Bombardier Recreational Products Inc. or its affiliates.
SKI-DOO©
LYNX©
SEA-DOO©
EVINRUDE©
ROTAX©
CAN-AM©

22 BRP Inc. - FY15 Q3
Outboard Engines
OEM Engines
Snowmobiles
Diversified Product Portfolio AND Powerful Brands
Global Leader in Powersports Vehicles and Engines
Propulsion Systems
Seasonal Products
Year-Round Products
All-Terrain Vehicles
Personal Watercraft
Roadsters Recreational Side-by-Side Vehicles

23 BRP Inc. - FY15 Q3
Appendix
QUARTERLY REVIEW THIRD QUARTER ENDED OCTOBER 31, 2014
© 2014 BRP Inc. all rights reserved. Ski-Doo, Lynx, Sea-Doo, Evinrude, Rotax, Can-Am and the BRP logo are trademarks of Bombardier Recreational Products Inc. or its affiliates.
SKI-DOO©
LYNX©
SEA-DOO©
EVINRUDE©
ROTAX©
CAN-AM©

24 BRP Inc. - FY15 Q3
Reconciliation Tables
1
Three-month periods ended Nine-month periods ended
CA$ millions Oct. 31, 2014 Oct. 31, 2013 Oct. 31, 2014 Oct. 31, 2013
Net Income $37.2 $48.2 $61.6 $66.0
Normalized Elements:
Foreign exchange loss on long-term debt 29.8 10.9 12.4 43.5
Increase in fair value of common shares - - - 19.6
Restructuring costs reversal [1] (0.4) (1.1) (1.0) (1.1)
Impairment charge reversal [2] - - - (0.3)
(Gain) reversal from insurance recovery [3] - - 1.4 (11.0)
Other elements [4] 7.3 1.2 8.3 2.4
Income taxes adjustment (2.0) (0.2) (3.0) 0.9
Normalized Net Income 71.9 59.0 79.7 120.0
Normalized income taxes expense 19.3 21.1 17.4 40.0
Financing costs 15.2 15.3 44.2 48.9
Financing income (0.8) (0.3) (1.9) (2.0)
Depreciation expense 28.5 23.9 82.6 67.3
Normalized EBITDA $134.1 $119.0 $222.0 $274.2
[1] The Company revised its estimates related to the exit of the sport boat business and reversed in net income restructuring costs of $0.4 million and $1.0 million for the three and nine-month periods ended October 31, 2014 compared to $1.1 million for the three and nine-month periods ended October 31, 2013. These costs were previously recorded during the twelve-month period ended January 31, 2013.
[2] During the nine-month period ended October 31, 2013, the Company reversed $0.3 million of the impairment charge that was previously recorded during Fiscal 2013 following the Company’s decision to exit the sport boat business.
[3] During the nine-month period ended October 31, 2014, the Company revised its estimates in relation of the payment received from the insurance coverage for the property, plant and equipment damaged by the explosion that occurred at the Company’s research & development centre in Valcourt, Canada, during Fiscal 2013 and reversed in net income $1.4 million of the $11.0 million gain that was previously recorded during the nine-month period ended October 31, 2013.
[4] During the three and nine-month periods ended October 31, 2014, other normalized elements include $6.7 million of employee’s severances following the Company’s decision to optimize its worldwide workforce. For all the reported periods,
other normalized elements include retention salaries related to the transfer of the assembly of PWC from Canada to Mexico and the outsourcing of the PAC distribution to third-party logistics providers. The retention salaries totalled $0.6 million and $1.6 million for the three and nine-month periods ended October 31, 2014 compared to $0.7 million and $1.9 million for the three and nine-month periods ended October 31, 2013. During the three and nine-month periods ended October 31, 2013, other normalized elements also include $0.5 million of fees and expenses related to the secondary offering transaction completed on October 9, 2013.

25 BRP Inc. - FY15 Q3