brown university department of computer science … · guidance from the programmer, ......
TRANSCRIPT

BROWN UNIVERSITY Department of Computer Science
Master's Project
CS-94-M13
"Information Query in Trace-based Debugging"
by
Shuang Ji
---
Information Query •In
Trace-based Debugging
by
Shuang Ji
Department of Computer Science Brown University
'\ ( Submitted in partial fulfillment of the requirements for the
Degree of Master of Science in the Department of Computer Science at Brown University
May 1994
Professor Steven P. Reiss Advisor
Infonnation Query in Trace-based Debugging
ShuangJi
1. Introduction·
Debuggers have always been an important software development aid. They let programmers locate bugs in their programs during execution. This dynamic debugging has become an essential supplement to static program analysis by the programmer. Through an effective combination of static analysis and dynamic debugging, bugs can be located very quickly. Most debuggers let the programmer set breakpoints, view the current state of the suspended program, and control how fast the program should go forward (e.g. step over, trace into). Based on this debugger model, the most common bug-hunting technique is the binary search method. The programmer continuously sets break points which divide the execution into halves, eventually isolating the section containing the bug. Even though very tedious, this method has not been changed since the introduction of debuggers about 20 years ago.
Given the rapid development in almost all fields of computer science, it is surprising this model has survived so long. One limitation of this model is that it restricts the program being debugged to only going forward, forcing the programmer to restart the execution again and again. Another limitation is that the validity of this model depends heavily on the reproducibility of the program's original behavior. For programs that do not interact with their environment (Le. only manipulate their own address space), this suffices. Most programs, however, do not fall into this category. Even the most simple program involving a file operation is interacting with its environment. Strictly speaking, some programs which do not interact with their environments are often not reproducible, either. These programs get the same sized virtual address space every time, but the number of pages which can get mapped in one run is still subject to the size of available secondary swapping storage on most operating systems. If swapping storage is short in a later run, some memory allocation requests that succeeded in previous runs might fail this time. Today's extensive use of windows systems (e.g. X windows) and distributed environments further exacerbates this problem. Without the assumption that program behavior is reproducible, the above binary search method totally loses its validity.
Even if the program behavior is fully reproducible, the binary search method can still be extremely tedious. The program must be started many times and stopped at different points to see when an assertion failed for the first time. If the buggy code happens to follow a large section of intense computation, this pro
lnfonnation Query in Trace-based Debugging May 19.1994

cess will be intolerably slow. For interactive applications, refeeding the whole input set can also be monotonous and often error-prone. Debugging without restarting execution would be very desirable, and has thus become a critical problem to solve.
Another desire of future debuggers is to emancipate programmers from tedious searches for where and when certain assertions failed during execution. In other words, we want to build an intelligent debugger which can, with some guidance from the programmer, dig into the execution history information and do some automatic analysis to help the programmer locate the bugs more qUickly.
Others have proposed trace-based debugging as a solution [Reiss93, AgDeSp91, ChMiNe91, Balzer69]. In trace-based debugging, we try to record all the events that happen during execution that are of debugging interest, such as memory stores, basic block entries, and function entries and exits. We also define a query interface, letting the user review the execution history. For example: when was the last time a variable was changed, what the control flow history was, and so on [ChMiNe91, Weiser84]. This is already sufficient for debugging purposes. With all the history information, we can tell the debugger to do many kinds of intelligent analysis to automate the debugging process [Reiss93].
In this paper, we provide a program-level query language on the trace information for debugging use and show how to efficiently organize all the information to quickly answer future queries, while still occupying affordable amounts of disk space.
2. Related Work
A fair amount of research has been conducted on tracing and replaying. The IGOR system [FeIBro88] uses the virtual memory system to periodically checkpoint the modified pages in the past interval. It can later restart the execution at the beginning of any interval by simply restoring the address space and letting it go. This replay mechanism is flawed, and can not guarantee the same program behavior during replay. Also, restoring the program state for replay might be slow, as it could involve scanning through all the checkpoint files to find out the contents of a page. It attempts to emulate the original execution environment during replay, but only provides an ad-hoc solution for naive I/O interactions.
The Spyder system [AgDeSp91] is a source-level debugger capable of backtracking. It does a static analysis on the source code during compilation and makes a conservative estimation of the set of variables that might be changed by a statement. During program execution, the old values of the variables in the change set are recorded before each statement is executed. After the program stops, backtracking is done by undoing the changes made by each statement. Because no real replay is performed, all the trace information must be stored. Spy-
Infonnation Query in Trace-based Debugging May 19,1994 2
der tries to reduce trace size by using composite statements as basic r-acing units. This makes it difficult to debug a program with a bug inside a long loop. Also, because of its static analysis mechanism, side effects are hard to deal with.
The AE system takes a different approach [Larus90]. It examines code at the RTL level defined in GNU compilers [Stallman89], and uses the program slice approach [Weiser84, HoReBi90] to extract the portion of code that contributes to address computations in memory accesses to generate a new program. This new program can reconstruct the execution trace from partial trace information generated from the program run. This system can only regenerate trace addresses, and the old memory values can not be inferred from the partial trace. Also, trace regeneration is slow. The system is good for program profiling and behavior analysis, but still not sufficient for debugging use.
A profiling tool and a trace system are provided in [BaILar92]. The profiling algorithm does a static analysis on the control flow graph, and chooses a placement of counters. This algorithm is optimized, and frequently optimal, with respect to the expected or measured execution frequency of each basic block and branch in the program. The trace system uses a similar algorithm to instrument a program to obtain a subsequence of the basic block trace. The length of the subsequence is optimized with respect to the program's execution, and an entire trace can be efficiently regenerated. These two systems achieve low run-time overhead. However, memory tracing is not done.
The PPD system [MiICho88] uses flowback analysis proposed by [Balzer69] to help debugging. The system uses incremental tracing based on the idea of need-to-generate. During program execution, PPD writes a prelog upon entry of each procedure, containing the variables that might be read in this procedure. Upon exit, it writes a postlog containing the variables that might have been modified in this procedure. It then constructs a dependence graph to help the user to locate the faulty procedure, and replay is needed only when the user wants to look into the detailed execution history in a procedure calL This actually shifts some tracing overhead from run-time to debug-time. Because the sets of variables that might be read or written in a procedure is statically computed, PPD tends to trace more than needed. Also, replay might be slow for long-running procedures, increasing query response time.
The demonic memory approach provides a good scheme for storing checkpointing information for future replay [WilMoh89]. An execution is divided into chapters, and snapshots are taken at the end of chapters for the modified pages in these chapters. Old execution chapters might be merged to save disk space. Therefore, retrieving old trace information will need more time. However, this system does not trace memory accesses.
The trace system in [NetWea94] divides execution into windows, and tries to bound the setup time and the replay time for each window. It traces the memory loads and stores, and achieves low run-time overhead and small disk storage
Infonnation Query in Trace-based Debugging May 19,1994 3

for traces. It is, however, difficult to examine the past program states ~'..I.ickly, even the ones at window boundaries. Also, no control flow history is recorded.
In general, previous work has been focusing on how to trace programs with less run-time overhead, reduce the size of trace information needed for replay, and start up a replay session quickly. Most of them are only interested in the memory history, neglecting the control flow history. They do not provide a notion of time during past execution, and fail to organize the trace information meaningfully so that the program state at any past time can be quickly examined. In general, tracing in these systems are mainly for program replay or performance study, rather than debugging. Also, the reproducibility of program behavior has not been well studied.
3. Objective
Our ultimate goal is to let the user examine the execution history easily and quickly. This work can be divided into collecting trace information, organizing it meaningfully, compressing it to save disk space, and providing a programlevel query language.
Collecting trace information from a program execution will inevitably introduce run-time overhead to the original program. In trace-based debugging, play refers to the first and only time we let the program run on its own while collecting trace data. Because the program will only be run once, we are not very concerned about the overhead during play. Currently, our tracing system can monitor all the explicit memory loads <through load instructions) and stores, basic block entries, function entries and exits, and system calls occurring in the program being debugged. For system calls, we use the trap code to find out their influence on the running program, for instance, whether it will read from memory or modify a memory region.
Since we are tracing all memory stores and basic block entries, the amount of raw trace information generated is huge. A small experiment shows that one second of real execution time can generate as much as 200M bytes of information. We certainly do not have this much disk storage even for program runs of modest lengths. Thus, trace compression is needed. There are two kinds of compression techniques applicable to our problem. One is to use a general-purpose compression algorithm <e.g. the one used in gzip). The other is to only keep a small amount of information and use it to regenerate the information we want later. The latter requires us to replay the program.
Guaranteeing the same program behavior during replay is crucial. The difficulty of doing this is that programs interact with their environment. Since the environment is ever changing, the programs' behavior is not reproducible. For a normal program running in user mode, all it can see is its address space and register values. The only way for it to get information which is outside its address
Infonnation Query in Trace-based Debugging May 19.1994 4

space (the environment) is through system calls. This suggests that a program's behavior solely depends on the initial state which includes the memory address space and the register values, and the results of system calls. As long as we can reconstruct the address space and the register values, and provide the original results of intermediate system calls, we can replay from any point in the past execution and get the same program behavior.
This requires us to trace all the changes to the address space during play, either by explicit instructions or by implicit operating system operations. Memory accesses done by the operating system are especially hard to catch. For instance, the register window technique is used in SPARe architecture [Sun90]. A save instruction in this architecture mayor may not generate a register dump to the stack area, depending on the availability of register windows. An interrupt can happen between any two instructions, and when it occurs, a kernel interrupt handling routine is executed. Inside the interrupt handler, several save instructions might be executed, causing some of the register windows used in user code to be dumped onto the user stack. Since we can not trace the kernel code, such memory accesses are difficult to detect. However, the kernel code will not implicitly modify the program-defined memory area (e.g. program variables). If we assume that the program will not try to access any system-defined memory, it is not necessary to detect the accesses made by the operating system.
Signals also need special care during play and replay. We need to record the time a signal is sent to a program and emulate it during replay. We can detect the occurrence of all signals by installing a master signal handler for all the system-defined signals. When the master signal handler is activated, we record the address of the instruction after which the program is interrupted by the signal, and the number of basic block entries so far to identify the occurring time. Then it will call the user-supplied signal handler. During replay, we can temporarily alter this instruction to branching to another instruction sequence, which checks if a signal handler needs to be called. Hardware interrupts are almost impossible to record and replay, however, because they are transparent to the user program.
Shared memory buffers used in UNIX and most other operating systems also present some problems for tracing. With shared memory, another process can modify the values in the buffer at any time, and the current process has no way of knowing memory was modified. In this case, tracing only the old values for store messages is not sufficient for replay, because future reads from the buffer might not be getting the value from the last store. Therefore, loads whose source addresses are in shared memory buffers are treated as a special case, and their values are always logged and provided during replay. In our current implementation, we do not check the memory accesses implicitly done by the operating system, and have not implemented emulation of signals during replay and catching shared memory loads.
Another problem we faced is although we want to reduce the size of trace data, we must maintain it in an easily accessible state so it is still of use. We com-
Infonnation Query in Trace-based Debugging May 19,1994 5

press or discard some of the trace information to reduce disk storage requirement, but we still want to be able to answer queries about past execution quickly. There is inevitably a trade-off between reducing response time and compressing trace information. The more the information is compressed, the slower the response time is likely to be. However, since the response time is only important to the user, and human beings are considerably slower than computers, as long as the response time is below a threshold, it will be acceptable. This observation gives us more freedom in compressing trace information. Also, from our past debugging experience, the user will normally stop the program shortly after the program began to behave wrongly. From this we can imply that the old trace information is less likely to be referenced. We do, however, need full details of the recent trace information because most queries will be centered around them. This led us to the design of a collapsible file format. For aging information, we only need to store the information that is adequate for regenerating the trace messages for that time frame. For the most recent information, we will keep full details. This is similar to the demonic memory approach as in [WilMoh89]. For most queries about recent information, we consider under one second as an acceptable response time. For queries about old trace information, a response time of two seconds or more is still tolerable. The algorithm presented in this paper does not have an upper bound on query response time, but for most queries, it can respond within one second. The query response time in our algorithm primarily depends on the detail level of the trace files.
While maintaining a quick response time is important, providing a query language to help the user to examine the memory history and the control flow history conveniently is vital as well. The program-level query language we provide in this paper is not intended to be used by end-users within the debugger. Instead, it is only able to answer assembly level queries about the execution history and has no knowledge about the source code and the high-level programming languages. The debugger front end has access to the source files as well as knowledge about the underlying programming language, and will try to translate source-code-oriented, user-level queries into the program-level ones.
To make trace-based debugging practical, we assume state-of-the-art machines with a fast CPU, a lot of RAM, and large disk capacity are being used, because trace-based debugging involves considerable run-time computation and disk I/O operation. The type of machine we are running our tests on is a Sun SPARC 10 model 41 with 32M RAM and 1GB disk.
As a summary, we want to be able to debug programs that do not access the memory areas that can be implicitly modified by operating systems. Ideally, we would like to see a slowdown factor of under ten during play to make tracebased debugging practical, but in our current implementation, it is much more as shown in section 10. We want to be able to debug programs running for about twenty minutes and generate less than 1GB of trace information, since 1GB disks are becoming popular. As for query response time, we consider being able to answer queries about recent trace information under one second acceptable. For
Infonnation Query in Trace-based Debugging May 19.1994 6
trace information that needs to be restored by replay, a response time of between ten seconds to one or two minutes is still tolerable, depending on how old it is.
4. Architecture Overview
-------------------------f---~~:~~~:-----l-i , f
,•, I fTrace Iorganizer
I f
:
If-------1~..Trace Messag:1
""
Control messQo~
I------- - -- ----- ------- ------. ....--....;:::,,------'---...,
Source I : Program-level . : query answerer
- ~----- ------....~
User I... IFront end
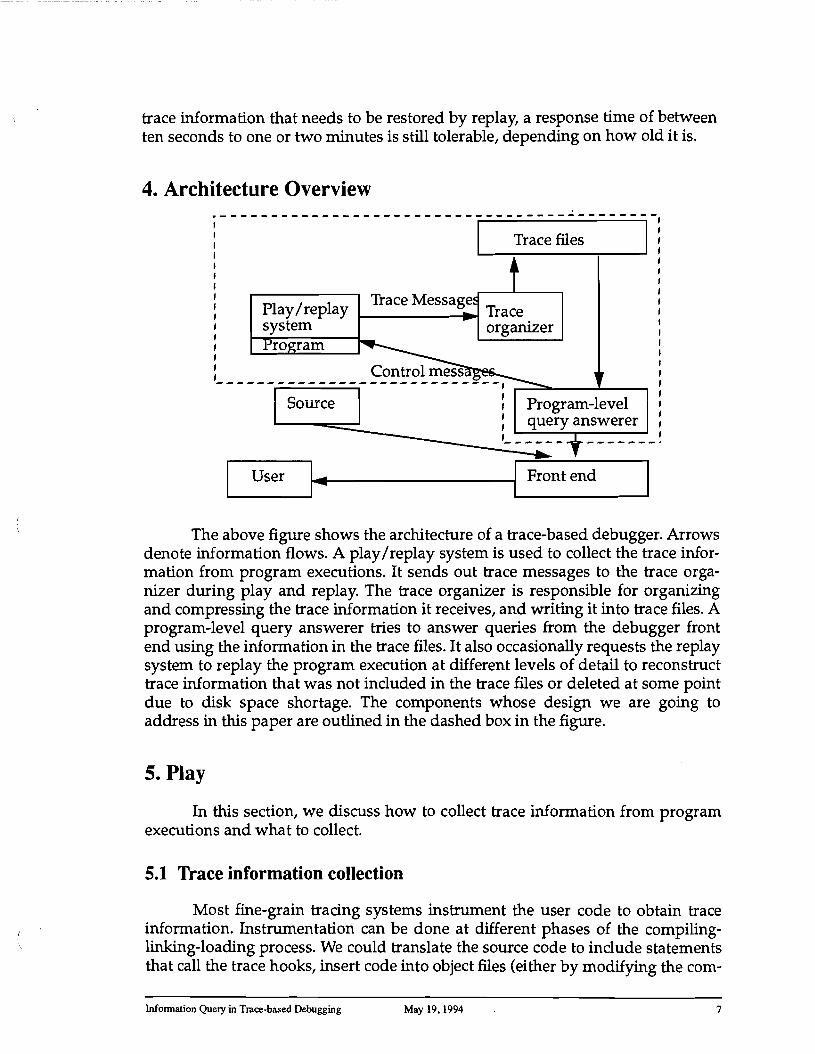
The above figure shows the architecture of a trace-based debugger. Arrows denote information flows. A play/replay system is used to collect the trace information from program executions. It sends out trace messages to the trace organizer during play and replay. The trace organizer is responsible for organizing and compressing the trace information it receives, and writing it into trace files. A program-level query answerer tries to answer queries from the debugger front end using the information in the trace files. It also occasionally requests the replay system to replay the program execution at different levels of detail to reconstruct trace information that was not induded in the trace files or deleted at some point due to disk space shortage. The components whose design we are going to address in this paper are outlined in the dashed box in the figure.
5. Play
In this section, we discuss how to collect trace information from program executions and what to collect.
5.1 Trace information collection
Most fine-grain tracing systems instrument the user code to obtain trace information. Instrumentation can be done at different phases of the compilinglinking-loading process. We could translate the source code to include statements that call the trace hooks, insert code into object files (either by modifying the com
lnfonnation Query in Tmce-based Debugging May 19,1994 7
pilers or by directly looking at the binary object code) [HasJoy92], translate the intermediate assembly files into ones containing hook-calling instructions [NetWea94], or instrument code into the executable after linking [MIPS88].
We collect trace information by dynamic patching. Dynamic patching refers to inserting monitoring-purpose instructions into the process image at runtime. Our monitoring code exists in the form of a shared library, and thus has an initialization routine which will be called before mainO is called. During initialization, we find out all the code segments existing in the process, including user code and shared libraries. We then patch all the code. For each code segment, we allocate another chunk of memory to accommodate the patch code. Patching is basically translating the original instructions into another sequence of instructions, which, for interesting instructions, prepares the trace information, calls the hooks, and finally executes that instruction. For instance, a store instruction will be translated into another instruction sequence which figures out the target address and sends it, along with the old value and the address of this instruction, to the trace hook. The trace hook will then send this store message to another process which is the message processor through a shared memory buffer. When the hook returns, the original store instruction is executed. Each patched instruction is repla...ed by a branch to the patch code sequence, while uninteresting instructions are left untouched. Unlike incremental patching, this approach allows us to do patching once and for all. Dynamic patching also lets us monitor shared library code very easily. However, because of the extra branches between the original code area and the patch area, this system is slower than Purify [HasJoy92] and PIXIE [:MIPS88]. We chose to use dynamic patching because it is relatively easier to build such a prototype system for research use. In section 10 we will see that the dynamic patching mechanism itself bears considerable run-time overhead.
We implemented our run-time trace collector on Sun SPARe architecture machines running SunOS 4.x and Solaris 2.3. As we might use different trace hooks and trace different events (e.g. load, stores, block entries) for different debugging purposes (e.g. play, replay), a mechanism that can easily change trace hooks and trace items is needed. To reduce run-time overhead, changing trace items requires us to repatch the code to avoid unnecessary patching for the events we are no longer interested in. Repatching can be done by putting back the instructions that do not need to be monitored back into the original code area, and replace the instructions that become interesting by branches to their patch code. To conveniently change the set of trace handlers, we use a global register to point to a branch table which has the addresses of the handlers of trace items. In each patch sequence, we put a jump and link instruction which uses that register and the current trace type to find the handler.
5.2 What to collect
During play, we need to gather trace information of debugging interest as well as information that is necessary for correct replay. Replaying from the very beginning of the program execution only to generate partial trace information is
Information QueI)' in Trace-based Debugging May 19, 1994 8

not necessary. We divide the whole execution into windows as in [WilMoh89, NetWea94]. An execution window is a consecutive segment of the original execution, and is the basic replay unit in our design. To limit the response time to a tolerable range, a window should not take long to replay. Currently, we decide to create a new window for every N basic block entries. To correctly replay a window, we need to reconstruct the address space and the register values at the beginning of that window, as well as providing the original results of intermediate system calls. We can also further relax our conditions. If we can restore the memory words the program is going to read in a window, together with the initial register values and intermediate system call results, we can fully reproduce the trace information for the window. This is sufficient because von Neumann computers are designed to be deterministic. As long as an uninterrupted program gets the same initial input, it will produce the same output. A program's only input methods are loading register values, reading from memory, and getting information outside its address space through system calls. Therefore, we only need to store these three kinds of information for each window.
We patch memory loads, stores, basic block entries, function entries and exits, and system calls during play. Patching loads is needed because we want to know which pages will be read in an execution window so that we can correctly replay it later. For loads, we only need the target address. For stores, we need the target address, the instruction address, the timestamp, and the old value. The timestamp is needed for identifying the address space state at a past execution moment. The instruction address is recorded because later we might need to replay the program execution up to this store event to check the then register values, which are part of the program state. For function entries, we collect the from and to addresses, and the incoming arguments. For function exits, we record its exit address and the return value. For basic blocks, we gather the addresses of their entry points. For a system call, if it involves writing to user address space, it is treated as a store message. Since system calls will be simulated during replay, which means we will only provide the return value and modify the memory locations it modified, the memory words they will read need not be traced.
Program address space
Loads .1 Load I Tracing
--I buffer 1
code Others I Messag~
-:-"1 buffer 1
System calls
Loads
Others
-.. ~ ...
-Trace organizer
Blocks.1 --_I
Block buffer
I 1
Blocks ..
In our implementation, we have three separate buffers, a load buffer, a
Infonnation Query in Trace-based Debugging May 19,1994 9

message buffer, and a block buffer, as illustrated in the above figure. The load handler just puts the target address into the load buffer. The load buffer is flushed once it is full and a message is sent out to the message processor. The block buffer holds basic block entry addresses. Since the number of basic block entries for an execution window is fixed, we can set the block buffer size accordingly so that it only needs to be flushed once for each window. Another global register is used to hold the current timestamp and is decremented upon each basic block entry. All the other messages are buffered in the message buffer and are flushed when it gets full. System call messages are sent out to the message processor immediately. Since they do not happen that often, this design choice will not slow down the execution significantly.
For load messages, we are actually only interested in which pages are read in a window. It is a little inefficient to send out all the load addresses since many of them might belong to the same page. We are considering having an in-core bitmap, in which each bit corresponds to whether a memory page is read in the current window or not. The load handler will then set the bit for the page the target address falls into. Therefore, the bitmap only needs be sent out once for a window. Currently our page size is lK. If the size of the virtual address space is 4G, the bitmap size will be 512K bytes, which is acceptable. The message processor can then check the bitmap to see which pages were read. This will reduce the workload of both the run-time load handler and the message processor.
We patch all the interesting instructions, instead of a subset of them from which the execution history can be reconstructed as in [BaILar92, Larus90]. This is because later, due to disk storage shortage, we might discard the trace information for some windows and only keep summaries for the execution in these windows. The summaries must be accurate so that we will not replay unnecessary windows to locate the window containing an interesting state. Thus, we need a complete execution trace during play to generate accurate summaries. Also, collecting partial trace information during play might increase query response time, since reconstructing is needed at debug-time.
6. Query Interface
With the trace information generated by the trace collector, we need a query language that can help the user to examine the past execution. We provide two classes of query commands: state-locating commands and state-examining commands. State-locating commands help the user to find a particular time in the past which is of debugging interest. Then the user can use the state-examining commands to check the program state at that time, including the whole address space, the program counter, and register values.
To do this, we must first provide a tangible notion of time. For our purposes, time is discrete. Each trace event generates a new program state, and each program state corresponds to a new discrete time. The wall clock times at which
lnfonnation Query in Trace-based Debugging May 19.1994 10
/I, \
events happen are generally not interesting to the programmer, nor are programmers usually interested in knowing that a specific instruction is the n-th instruction of the execution. What programmers seem to really be interested in is the relative ordering of events. For instance, programmers often want to know when a variable was last modified relative to current time, instead of specifying the n-th modification of that variable. We also find that the variable history information and the control flow history information are of particular interest to programmers.
The above observations lead to our design of the state-locating commands. A basic block is a sequence of straight-line code. For simplicity, we consider each basic block entry as a new discrete time. This is sufficient for reconstructing the normal control flow history. Interrupts are hard to catch, and we do not consider them as part of the normal control flow history because they are transparent to the user program. We also keep a notion of current time. When the program is stopped and the user wants to examine the execution history, current time is the last program state, namely, the stopped program state. Then the user can change current time by the following commands:
• Move current time to the first program state (when the program execution began), or the last program state (the stopped program state).
• Move current time to the n-th occurrence of a variable being modified, either forward or backward in time from the current program state.
• Move current time to the n-th occurrence of a specific basic block, function entry, or function exit, either forward or backward in time from the current program state.
• Move current time to the n-th previous or next program state.
These commands can easily help the user find out the variable and control flow histories, and are adequate for most debugging practices. Code is usually examined backwards to find the faulty section most recently executed, and then investigated further back to see what originally triggered the faulty code to be executed. Therefore, we make special efforts to speed up backward queries in organizing the trace information, as we will show later.
Based on these program-level commands, we can construct user-level query commands such as:
goto <from> <dir> <type> <count> where <context>
where <from> is one of current, first, and last, and <dir> is either forward or backward. <type> specifies the type of the trace message generating a new program state that the user is interested in. It can be func_enter, func_exit, block_entry, or store. <count> denotes how many times this search should be repeated. <context> is a boolean expression further describing the interesting state. The boolean
Infonnation Query in Trace-based Debugging May 19,1994 11

expression can involve any variable defined in the program, as well as some special variables pertaining to the interesting message. For instance, the special variable stack indicates the call stack at the time the trace message was generated and can be matched by a regular expression in the query, src denotes the source line that was being executed at that time, oldval shows the old value of the memory word in a store message, and so on. With this command, many complicated queries can be easily expressed. For instance, to find the second most recent state where the 7th line of file foo.c was executed and the top of the call stack looked like (a,b), we can say
goto current backward block_entry 2 where stack=<*,a,b> and src=<foo.c,7>
The state-examining commands are used to examine the program state at current time. The two basic operations we provide are:
• Check the value of any memory word in the address space.
• Check the values of hardware registers. The main reason we provide this is that on modern RISe machines, function call arguments are often put into registers to improve performance and their values are important to the programmer.
The address space and register values are all a program state entails. We can compute all the other information that might be interesting to the user from them, for instance, the current call stack. In order to reduce query response time, we do store some redundant information which will frequently be asked by the user. The user-level commands for examining current state will be very similar to the ones provided by traditional debuggers such as dbx.
All these query commands are virtual address-oriented as this is a program-level query language. In the future, we will have an interactive front end to the debugger which has knowledge about the underlying programming language and the source code, and will translate user-level SYmbol-oriented queries into this program-level language.
7. Trace Organization
In this section, we discuss how to organize the trace information in a meaningful way to speed up future queries, and compress it at the same time to save disk space.
Dividing the execution into windows has several advantages. Instead of having one single huge trace file, we associate with each window several files which describe the execution in this window. Different file formats might describe the execution in different levels of detail. Multiple files prove easier to maintain. Aging information is also easy to collapse since it is gathered in relatively small files. It also helps to clearly separate the information we will need to examine at
Infonnation Query in Trace-based Debugging May 19,1994 12
any given time. To save more space, we will compress many of the trace files using a general-purpose algorithm (e.g. gZip). As we will show later, our algorithm requires that only the trace file corresponding to the current window needs to be uncompressed to examine the address space at current time. This lets us compress most of the trace information without hurting query response time.
Each basic block entry marks a new discrete time. The number of basic block entries occurred so far in the current window will be used as a timestamp which will be attached to most other messages. For each window, we have a trace file and a block file associated with it. A trace file contains all the events that happened in this window listed in order of time. The events are stores generated by store instructions, stores generated by system calls, function entries, and function exits. Each event has a timestamp in the message. The block file is just a list of basic block entries that happened in this window listed in order of time. A trace file and a block file together give a full description of the execution history for a window. Note that trace files and block files might be compressed or deleted so as to save disk space and provide different levels of execution history details. Our internal representation for current time is a timestamp and a pointer which points to a message in the trace file to identify the address space at that time.
To speed up backward queries, we extensively use backlinks to link interesting events together. Backlinks will be inserted into store messages to point to the last store message which modified the same memory location [ChMiNe91]. Function entries and exits are also backlinked according to the entry and exit addresses. Block entries are not. We keep an in-core backlink table which uses memory addresses as keys and keeps the linked list heads for each memory word. If we are not careful, the size of the backlink table can get very large. For instance, on a 32-bit machine, the size of the address space is 4G bytes and each word is 4 bytes long. If we use a linear array and monitor each word, the size of the table will be 4G which is impossible to obtain on almost any machine. We observe that there are many unmapped holes in the address space and there is no sense in reserving table entries for them. In our implementation, we use three-Ievelsegmented tables. We divide an address into three parts. The first-level table uses the first part as the index and its entries are pointers to second-level tables. Similarly, second-level tables use the second part of an address as the index and their entries point to third-level tables, which use the third part as the index and whose entries are the backlinks of addresses. If there is no information about the addresses with the same first part, its entry in the first-level table will be nil and no other space is allocated. If there is no information about the addresses with the same first and second parts, its entry in the second-level table will be nil. If we have some information about an address, space is allocated for all the other addresses with the same first and second parts. Because of program localities, this works well and consumes considerably less space. Two-level segmented tables have been used to monitor address space state in the past [NetWea94, WaLuGr93]. In our case, threelevel segmented tables use even less space.
Since trace files and block files might be compressed or even deleted,
lnfonnation Query in Trace-based Debugging May 19,1994 13

restoring them to full detail is rather slow, we attach a Table Of Contents (TOC) file to each execution window which contains a summary of the execution window of debugging interest, information critical for the replay of the window, and the contents of the pages at the end of this window which are modified in the window. TOC files are very helpful to determine whether or not a window contains the information we are interested in and thus wheth~r to uncompress or reconstruct the other files for that window. TOC files are very important in improving response time and are usually left uncompressed. However, to save disk space, TOC files might have different levels of detail as well.
To help quickly find out a variable value at current time, we store the final contents of the pages modified in this window. They are never compressed. The algorithm to examine address space at current time is shown later in this section.
Information critical for the replay of a window consists of the initial register values, the values of memory words to be read in this window, and the intermediate system call results. As we save the dirty pages in each window, we can reconstruct any page at the beginning of a window very easily. So we only need to save the list of pages to be read in this window instead of all the contents. But having all the contents ready does speed up the replay of this window. Therefore, this gives two levels of detail, the to-be-read page list and to-be-read pages. Due to program locality, many pages that are modified in a window are likely to be read again in the next window. We do not need to record those pages because they are likely to be recorded in TOC file for the previous window. The details of the replay algorithm is shown in section 8.
The summary file is basically a snapshot of the backlink table at the end of the execution window. A count of message occurrences with an address as a key is also recorded in the snapshot. For store messages, this is the number of times a memory word was modified in this window. For basic block entries, this is the number of times a particular block was entered. Thus, for each memory word we have information for in this window, we have a backlink and a count for it in the backlink table snapshot, which occupies 8 bytes in our implementation. This suggests that the backlink table snapshot might get quite large. We provide an alternative which is to collapse the backlink and the count into just one bit indicating if we have some message for this address in the window. This bitmap approach supplies less detail and reduces disk storage significantly.
To avoid unnecessary replay, the information in back.link tables and bitmaps must be accurate about the execution history. Choosing a monitoring unit bigger than a word would reduce the size of backlink tables and bitmaps, but accuracy is compromised. For instance, if we only know a page is modified in a window, to decide whether a specific word is modified, we would have to replay the whole window. We choose to use a word as the monitoring unit because the target addresses of most stores and all instruction addresses are aligned at word boundary in 5PARC.
lnfonnation Query in Trace-based Debugging May 19.1994 14

For long running programs, we can even merge the trace information of consecutive windows [NetWea94, WilMoh89]. By doing this, we are actually creating bigger execution windows. We will not be able to save much by merging trace files and block files, but there is a lot of information in the TOC files that can be merged. To merge backlink tables, we take the last one and update the count fields by summing the counts in each backlink table. The ,size of the resulting backlink table will be the same as that of the last one. To merge summary bitmaps, we can just do a bitwise-or on them. Only the final contents of the pages modified in these windows need to be saved, and the intermediate contents of pages modified in more than one of these windows can be discarded. Similarly, to merge the to-be-read pages, we take the initial contents. Because of program locality, we expect that a lot of pages dumped in intermediate windows can be discarded. Our experiments showed that if we merge N consecutive TOC files, the size of the resulting file will be cut by a factor of approximately N/2.
In practice, we provide three levels of detail for the trace information of each window. Level 1 is the most compact one. It does not have a trace file or a block file. Its TOC file contains the initial register values, the system call results, the dirty pages, the to-be-read page list, and the bitmap. Level 2 is the same as level 1 except that we replace the bitmap with a backlink table snapshot. Backlink table snapshots are much more informative than bitmaps since they contain counts of occurrences which are especially useful for debugging long loops. Level 3 provides full detail. It includes the trace file, the block file, the backlink table snapshot, to-be-read pages, the dirty pages, and the other information needed to perform replay. These files are degradable over time. We only keep level 3 information for most recent windows, and will always expand the trace information about the window containing current time to level 3 when answering queries. We will discuss how to restore trace information from low detail level information in the next section.
Because we have trace information of detail level 3 for the current window and save the modified pages in each window in its TOe file, examining the address space at current time is very easy. To get the value of a memory word, we first check its entry in the backlink table in the current TOC. There are three cases:
• It points to somewhere in the current window. Then the page containing this memory word was modified and its final state is dumped in the current TOC. Since our store messages have the old values in them, all we need to do is to follow the chain to find a store message which is the first one that happened after current time. If we can find such a one, the memory word value is in the message. Otherwise, it is in the dumped page in the TOC.
• It points to somewhere in a previous window. Then the last time it was modified is in that window and we have dumped the page in the TOC for that window. Since dirty pages are not compressed, just pull that word out from the page.
lnfolTllation Query in Trace-based Debugging May 19,1994 15
• It points to nil. This means the memory word has not been changed since execution began. In our implementation, we fork the initial process image before the real execution begins. So the value can be found in that image very quickly.
From the above discussion we can see that address sp(ice examination only requires the trace information of current window be expanded to level 3. As long as we have all the dirty pages of each window readily available, no other trace information needs be uncompressed or expanded. This gives us a lot of flexibility on efficiently using the limited disk space.
8. Replay
There are two kinds of replay we need. One is used to regenerate trace information for execution windows, referred to as full replay. The other one, partial repla~ is used to reconstruct the register values at current time. Register values are almost always changing. It is impractical to record their values at run-time and in trace files, as it will slow down program execution significantly and use a lot of disk space. We choose to replay the current window up to current time to obtain the register values at current time.
8.1 Full replay for trace data
To prepare for a replay, we need to restore the pages to be read in this window to their initial states at the beginning of the window as well as register values. Resetting register values is trivial. If we have the to-be-read pages available in the TOC file, we can simply copy them into the user address space. If we only have the to-be-read page list, we again can use the TOC files to quickly find out the page contents at the beginning of the window. Getting the page contents at the beginning of a window is the same as getting the contents at the end of the previous window. First, we check the TOC file of the previous window. If it has a backlink table, we can immediately find out where the page was last dumped or if it has not been changed since execution. If it does not, we can still search the previous TOC files to locate the one that has the information about that page.
After we have restored the register values and the pages to be read, we use another set of trace hooks without repatching code. Because during full repla~ we are no longer interested in load traces, we need to repatch the code to turn off monitoring on loads. Also, system calls will be simulated by our monitoring code using the recorded results. For each system call, we supply the original return value and set the memory regions affected by this system call accordingly. All the other handlers work in the same way as in play. A global register is set to the number of basic block entries in this window, and is decremented on each basic block entry. Replay stops when the register reaches hits zero.
By fully replaying a window, we can restore the trace file and the block file.
lnfonnation Query in Trace-based Debugging May 19.1994 16
However, we can only reconstruct part of the backlink table. If the TOe file for the previous window does not have a backlink table, we are not able to chain messages across windows. This is not a serious problem, however. We use lazy evaluation to get around it. When the user tries to follow the chain to locate a message outside current window, the window containing that message will become the new current time in most cases. We then search the TOC files to locate that window and replay it. Now we have the backlink table for the new window and can reconnect the chain.
8.2 Partial replay for register values
This technique is mostly used to get the register values at current time. To do this, we restore the pages to be read and the initial register values. Replay will stop when the timestamp reaches the current time. No messages need to be sent out except the register values when the replay stops. We only patch the basic block entries, and keep updating the number of basic blocks entries replayed so far to determine when to stop. Only a small amount of on-line computation is carried out and the whole process is very fast (under one second in our current implementation).
Since a basic block usually contains more than one instructions, sometimes the user might wish to replay up to a certain instruction in current basic block.
\ Because basic blocks only contain straight-line code, a dynamic instance of an instruction in a basic block can be uniquely identified by its instruction address and the basic block instance it is in. The basic block instance can be identified by its timestamp. To replay up to an instruction in current basic block, we first use the same algorithm to replay up to the entry of current basic block. Then we temporarily change that instruction into a branch to a special hook. Inside the special hook, we execute the original instruction, put it back into the patch code, and stop replay.
9. Current Time Movement
We have showed how to examine the program state at current time in the previous sections. In this section, we discuss how to perform the state-locating commands based on our trace organization. Since the block file is not that big (about 1.6M in our current implementation which creates a new window for every 400K basic block entries), we keep the current block file in core so scanning through it is not expensive. We also expect that most of the current trace file is fetched in core by the operating system due to frequent references. TOe files are left uncompressed and are usually small, so searching through them is not expensive, either.
(
lnfonnation Query in Trace-based Debugging May 19,1994 I7
9.1 Fast location of the interesting window
Each execution window can be replayed fast (in about two seconds in our implementation), and once its trace information is expanded to level 3, most queries can be answered quickly. Therefore, it becomes very important for us to locate the window containing the interesting state and potentially expand or uncompress it in a short time.
TOC files are intended to help speed up this process. If the trace information of a window has a backlink table snapshot, we can find the last occurrences of messages (either in the current window or a previous window), and the counts of occurrences in the current window. This is sufficient for the query types we propose, because most of them provide interesting addresses and counts from current time as arguments. If the TOe file only has a bitmap summary, we still can infer from it whether an event concerning a specific address happened during this window or not. Then we can decide whether to expand it or not.
9.2 Current time movement
9.2.1 Move to the first/last state.
This is straightforward, simply go to the first or last window.
9.2.2 Move to the n-th occurrence of a variable being modified, either backward or forward.
At first we need to locate the window that contains the messages we are looking for. This can be done by looking at the counts in the backlink tables in the TOC files. If an intermediate window only has a bitmap summary, replay is needed. Since we keep the recent information in detail level 3, this situation is unlikely to happen frequently. Even if so, fully replaying a window is usually fast, taking under two seconds, as shown in section 10.
Once we have located the window containing the interesting state, we expand the trace information to level 3, if necessary. Then by following the backlink chains, we can quickly find the store message we are looking for. We update current time by setting it to the timestamp included in that store message. The address of the current basic block can be directly looked up in the block file using the timestamp as the index.
9.2.3 Move to the n-th occurrence of a specific basic block entry, function entry, or exit, either backward or forward.
If we are looking for a function entry or exit, we can use the same procedure we do for finding the n-th occurrence of a variable being modified.
Infonnation Query in Trace-based Debugging May 19.1994 18
i
If we are looking for a basic block entry, we use a similar procedure to locate the window containing the interesting state. We then expand that window to detail level 3 if necessary. Now we have the block file which is cached in memory, and can search through it to find out the interesting block entry. The current timestamp is just the index of that entry in the block file.
9.2.4 Move to the n-th previous or next program state.
This is really trivial. Since we have all the basic block entries listed in the block file, just find the n-th previous or next entry in the file. If the target state is going to be in another window, expand that window accordingly.
As we can see, in most of the cases, if we ever need to expand the trace information of a window, the new current time will be in that window. The user is likely to examine the program states contained in that window and it does not need to be expanded again.
10. Performance
The performance data presented in this section is collected from programs run on a Sun SPARC 10 model 41 with 32M memory running SunOS 4.1.3. We create a new window for every 400K basic block entries. We did our tests on three applications. Ray is a ray tracer program generating a 200 by 200 pixel image for a scene containing 26 spheres. Gzip is compressing a 2.8M file. They are both CPUbound programs. Nvi is a ten-minute text editing session using nvi, which is an improved version of the text editor vi.
Table 1 shows the average sizes of different information per window. Table 2 shows the average disk space each level of detail occupies. All the numbers are in Kbytes. The original execution time is the sum of user and system time used for the applications in seconds. The entries in Table 2 with ""s are the sizes of the information after being compressed by gzip. From the numbers we can see that it is impractical to keep all the trace information in detail level 3. However, if we collapse aging information into low detail levels, compress some of the trace files and block files, we can effectively use a 1GB disk to trace long running programs. Currently, each window corresponds to about 0.06 seconds of real CPU execution time. For really old information, we can merge consecutive old windows to significantly reduce the disk space occupied by level 1 information. Our experiments showed that if we merge N consecutive level 1 or level 2 trace files, the size of the
Information Query in Trace-based Debugging May 19. 1994 19
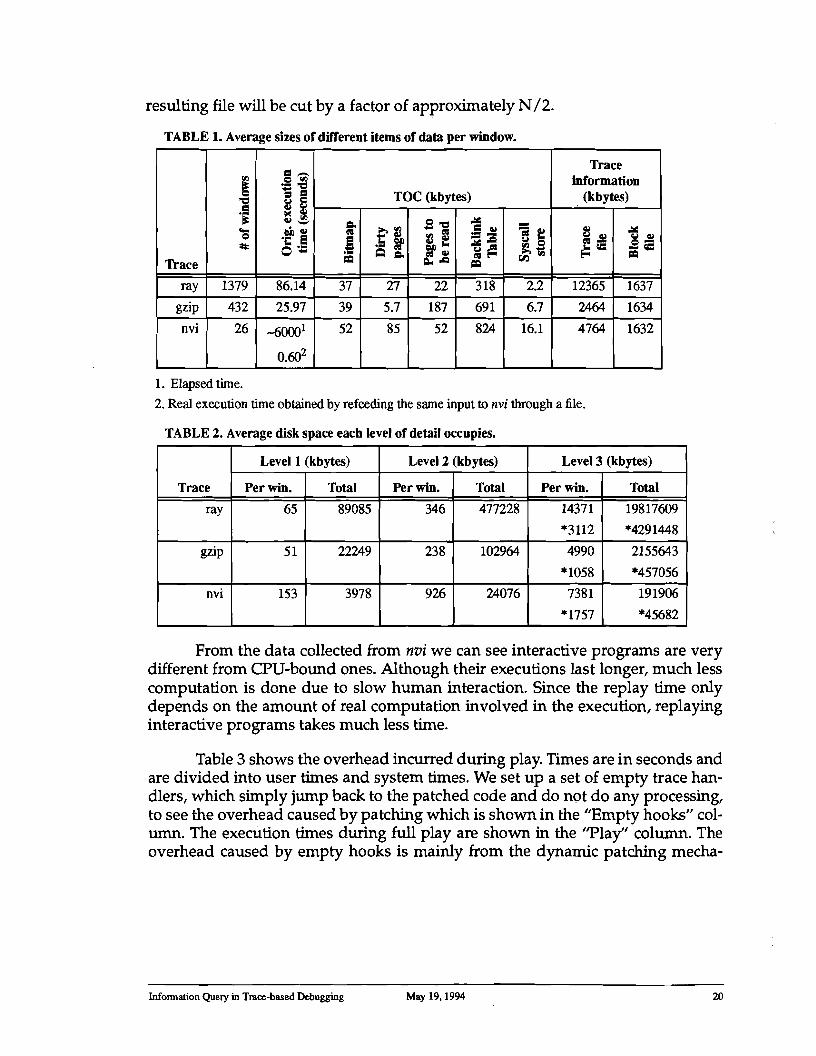
resulting file will be cut by a factor of approximately N /2.
TABLE 1. Average sizes of different items of data per window.
Trace
i 'g .~ ... Q ~
§~ ~oc=CI ~ 8 I< Gl Gl$
t=ilGl 'C El o~
TOe (kbytes)
Trace information
(kbytes)
=.. ~
!.• = .f iCl=..
Soc ~ ~ oal"'" ~ Gl ~,Q
~~ ,lII:,Q
~~ = -=t ~S ~rIJ
Gl ~ Gl
~= ~~ ilce:
ray 1379 86.14 37 27 22 318 2.2 12365 1637 gzip 432 25.97 39 5.7 187 691 6.7 2464 1634 nvi 26 -60001
0.602
52 85 52 824 16.1 4764 1632
1. Elapsed time.
2. Real execution time obtained by refeeding the same input to nvi through a file.
TABLE 2. Average disk space each level of detail occupies.
Trace
Levell (kbytes) Level 2 (kbytes) Level 3 (kbytes)
Per win. Total Per win. Total Per win. Total
ray 65 89085 346 477228 14371 *3112
19817609 *4291448
gzip 51 22249 238 102964 4990
*1058
2155643
*457056 nvi 153 3978 926 24076 7381
*1757
191906
*45682
From the data collected from nvi we can see interactive programs are very different from CPU-bound ones. Although their executions last longer, much less computation is done due to slow human interaction. Since the replay time only depends on the amount of real computation involved in the execution, replaying interactive programs takes much less time.
Table 3 shows the overhead incurred during play. Times are in seconds and are divided into user times and system times. We set up a set of empty trace handlers, which simply jump back to the patched code and do not do any processing, to see the overhead caused by patching which is shown in the "Empty hooks" column. The execution times during full play are shown in the "Play" column. The overhead caused by empty hooks is mainly from the dynamic patching mecha
lnfonnation Query in Trace-based Debugging May 19.1994 20
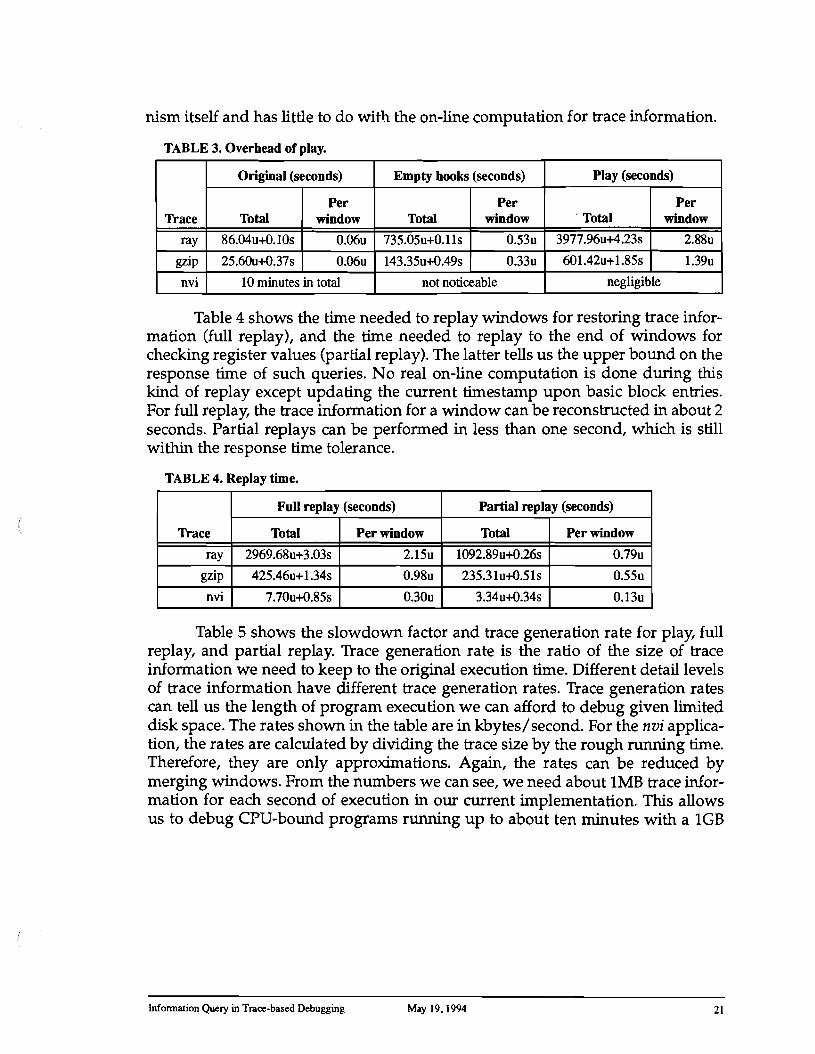
nism itself and has little to do with the on-line computation for trace information.
TABLE 3. Overhead of play.
Trace
Original (seconds) Empty hooks (seconds) Play (seconds)
Total Per
window Total Per
window ' Total Per
window
ray 86.04u+0.lOs O.06u 735.05u+O.lls 0.53u 3977.96u+4.23s 2.88u
gzip 25.60u+O.37s O.06u 143.35u+O.49s 0.33u 601.42u+1.85s 1.39u
nvi 10 minutes in total not noticeable negligible
Table 4 shows the time needed to replay windows for restoring trace information (full replay), and the time needed to replay to the end of windows for checking register values (partial replay). The latter tells us the upper bound on the response time of such queries. No real on-line computation is done during this kind of replay except updating the current timestamp upon basic block entries. For full replay, the trace information for a window can be reconstructed in about 2 seconds. Partial replays can be performed in less than one second, which is still within the response time tolerance.
TABLE 4. Replay time.
Trace
Full replay (seconds) Partial replay (seconds)
Total Per window Total Per window
ray 2969.68u+3.03s 2.15u 1092.89u+O.265 0.79u
gzip 425.46u+1.34s 0.98u 235.31u+O.51s 0.55u
nvi 7.70u+0.85s 0.30u 3.34u+O.34s O.13u
Table 5 shows the slowdown factor and trace generation rate for play, full replay, and partial replay. Trace generation rate is the ratio of the size of trace information we need to keep to the original execution time. Different detail levels of trace information have different trace generation rates. Trace generation rates can tell us the length of program execution we can afford to debug given limited disk space. The rates shown in the table are in kbytesl second. For the nvi application, the rates are calculated by dividing the trace size by the rough running time. Therefore, they are only approximations. Again, the rates can be reduced by merging windows. From the numbers we can see, we need about 1MB trace information for each second of execution in our current implementation. This allows us to debug CPU-bound programs running up to about ten minutes with a 1GB
Information Query in Trace-based Debugging May 19,1994 21
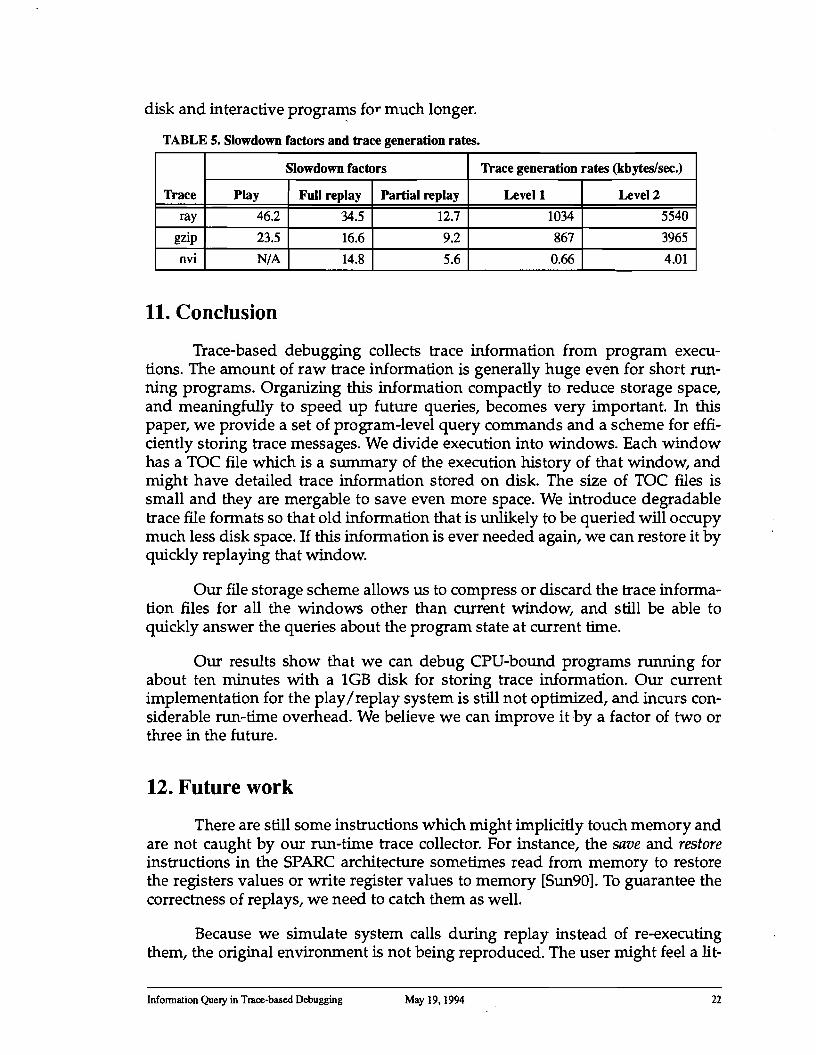
disk and interactive programs for much longer.
TABLE 5. Slowdown factors and trace generation rates.
Trace
Slowdown factors Trace generation rates (kbytes/sec.)
Play Full replay Partial replay Levell Level 2
ray 46.2 34.5 12.7 1034 5540
gzip 23.5 16.6 9.2 867 3965
nvi N/A 14.8 5.6 0.66 4.01
11. Conclusion
Trace-based debugging collects trace information from program executions. The amount of raw trace information is generally huge even for short running programs. Organizing this information compactly to reduce storage space, and meaningfully to speed up future queries, becomes very important. In this paper, we provide a set of program-level query commands and a scheme for efficiently storing trace messages. We divide execution into windows. Each window has a TOC file which is a summary of the execution history of that window, and might have detailed trace information stored on disk. The size of TOC files is small and they are mergable to save even more space. We introduce degradable trace file formats so that old information that is unlikely to be queried will occupy much less disk space. If this information is ever needed again, we can restore it by quickly replaying that window.
Our file storage scheme allows us to compress or discard the trace information files for all the windows other than current window, and still be able to quickly answer the queries about the program state at current time.
Our results show that we can debug CPU-bound programs running for about ten minutes with a 1GB disk for storing trace information. Our current implementation for the play/replay system is still not optimized, and incurs considerable run-time overhead. We believe we can improve it by a factor of two or three in the future.
12. Future work
There are still some instructions which might implicitly touch memory and are not caught by our run-time trace collector. For instance, the save and restore instructions in the SPARC architecture sometimes read from memory to restore the registers values or write register values to memory [Sun90]. To guarantee the correctness of replays, we need to catch them as well.
Because we simulate system calls during replay instead of re-executing them, the original environment is not being reproduced. The user might feel a lit-
Infonnation Query in Trace-based Debugging May 19,1994 22
tIe disoriented about this. For instance, whp!l. debugging an X application, what the user sees on the screen might well be inconsistent with the program state they are examining. Work still needs to be done in this area.
13. Acknowledgments
The author would like to thank Steven Reiss for the constant help he gives and Robert Netzer for his insightful suggestions.
14. References
[AgDeSp91] Hiralal Agrawal, Richard A. DeMilIo, and Eugene H. Spafford, "An Execution-Backtracking Approach to Debugging," IEEE Software, pp. 21-26, May 1991.
[BaILar92] Thomas Ball and James R Lams, "Optimally profiling and tracing programs," 19th Annual ACM Symposium on Principles of Programming Languages, pp. 59-70, January 1992.
[Balzer69] RM. Balzer, ''EXDAMS - EXtendable Debugging and Monitoring System," Proceedings of AFIPS Spring Joint Computer Conference, 34, pp. 567-580, 1969.
[ChMiNe91] Jong-Deok Choi, Barton P. Miller, and Robert H.B. Netzer, ''Techniques for Debugging Parallel Programs with Flowback Analysis," ACM Transactions on Programming Languages and Systems, 13(4), pp. 491-530, October 1991.
[FelBro88] Stuart 1. Feldman and Channing B. Brown, ''IGOR: A System for Program Debugging via Reversible Execution," Proceedings of the SIGPLAN/SIGOPS Workshop on Parallel and Distributed Debugging, Madison, WI, May 1988.
[HasJoy92] Reed Hastings and Bob Joyce, ''Purify: Fast Detection of Memory Leaks and Access Errors," Proceedings of the Winter 1992 USENIX Conference, pp. 125-136, January 1992.
[HoReBi90] Susan Horwitz, Thomas Reps, and David Binkley, ''Interprocedural Slicing Using Dependence Graphs," ACM Transactions on Programming Languages and Systems, 12(1):26-60, January 1990.
[Larus90] J. R Larus, "Abstract Execution: A Technique for Efficiently Tracing Programs," Software Practice and Experience, 20(12) pp. 1241-1258, December 1990.
[:MilCho88] Barton P. Miller and Jong-Deok Choi, "A Mechanism for Efficient Debugging of Parallel Programs," Proceedings of the SIGPLAN/ SIGOPS Workshop on Parallel and Distributed Debugging, pp. 141150, Madison, WI, May 1988.
Infonnation Query in Trace-based Debugging May 19,1994 23
[MIPS88] MIPS Computer Systems, Inc., "RISCompiler Languages Programmer's Guide," December 1988.
[NetWea94] Robert H.B. Netzer and Mark H. Weaver, "Optimal Tracing and Incremental Re-execution for Debugging Long-Running Programs," Technical Report C5-94-11, Brown University. To appear in the SIGPLAN Conference on Programming Language' Design and Implementation, June 1994.
[Reiss93] Steven P. Reiss, ''Trace-based Debugging," AADEBUG '93, Linkoping, Sweden, May 1993.
[Stallman89] Richard M. Stallman, ''Using and Porting GNU CC," Free Software Foundation, September 1989.
[Sun90] Sun Microsystems, "The SPARC Architecture Manual: Version 8," 1990.
[WaLuGr93] Robert Wahbe, Steven Lucco, and Susan L. Graham, ''Practical Data Breakpoints: Design and Implementation," SIGPLAN '93 Conference on Programming Language Design and Implementation, pp. 112, Albuquerque, NM, June 1993.
[Weiser84] Mark Weiser, ''Program Slicing," IEEE Transactions on Software Engineering, SE-10(4), pp. 352-357, July 1984.
[WilMoh89] Paul R. Wilson and Thomas G. Moher, "Demonic Memory for Process Histories," Proceedings of the SIGPLAN '89 PLDI Conference, pp. 330-343, June 1989.
Infonnation Query in Trace-based Debugging May 19,1994 24