broward county bb&t center arena alternative use case studies ... atlanta-sandy springs et al,...
TRANSCRIPT
BROWARD COUNTY BB&T CENTER
MARKET AND FINANCIAL ANALYSIS OF BB&T CENTER WITHOUT THE FLORIDA
PANTHERS
PREPARED BY: STIFEL, NICOLAUS & COMPANY, INC.
BARRETT SPORTS GROUP, LLC
OCTOBER 13, 2015
Page 1
I. INTRODUCTION
II. EXECUTIVE SUMMARY
III. BB&T CENTER OVERVIEW
IV. MARKET ANALYSIS
V. FINANCIAL ANALYSIS
VI. ECONOMIC IMPACT ANALYSIS
VII. POTENTIAL FUNDING OPTIONS
VIII. OTHER CONSIDERATIONS APPENDIX A: COMPARABLE ARENAS – CASE STUDIES APPENDIX B: COMPARABLE ARENAS – DEMOGRAPHICS APPENDIX C: FINANCIAL ANALYSIS – 15 YEAR ESTIMATE LIMITING CONDITIONS AND ASSUMPTIONS
TABLE OF CONTENTS

I. INTRODUCTION
Page 3
Overview
Stifel, Nicolaus & Company, Inc. and Barrett Sports Group, LLC (Hereinafter Referred to as the Consulting Team) are Pleased to Present Our Preliminary Findings and Observations to Broward County (County) – Initial Draft Prepared as of March 12, 2015
The Consulting Team was Retained by the County to Provide Financial Advisory Services in Connection with the BB&T Center (or Arena) and to Assist the County in On-Going Discussions with the Florida Panthers (Panthers)
It has been Well Reported that the Panthers have Experienced Financial Difficulties and New Ownership is Seeking Arena Lease Concessions/Relief from the County
As Part of the County’s Due Diligence Process, the Consulting Team was Asked to Examine the Potential Performance of the BB&T Center in the Event the Panthers are No Longer a Tenant in the Arena
It Should be Noted that the Findings Herein are Somewhat Limited Since the Contract Scope of Services Did Not Include Market Surveys and/or Focus Group Sessions – Consideration Could be Given to Completing these Tasks in the Future
I . INTRODUCTION
Page 4
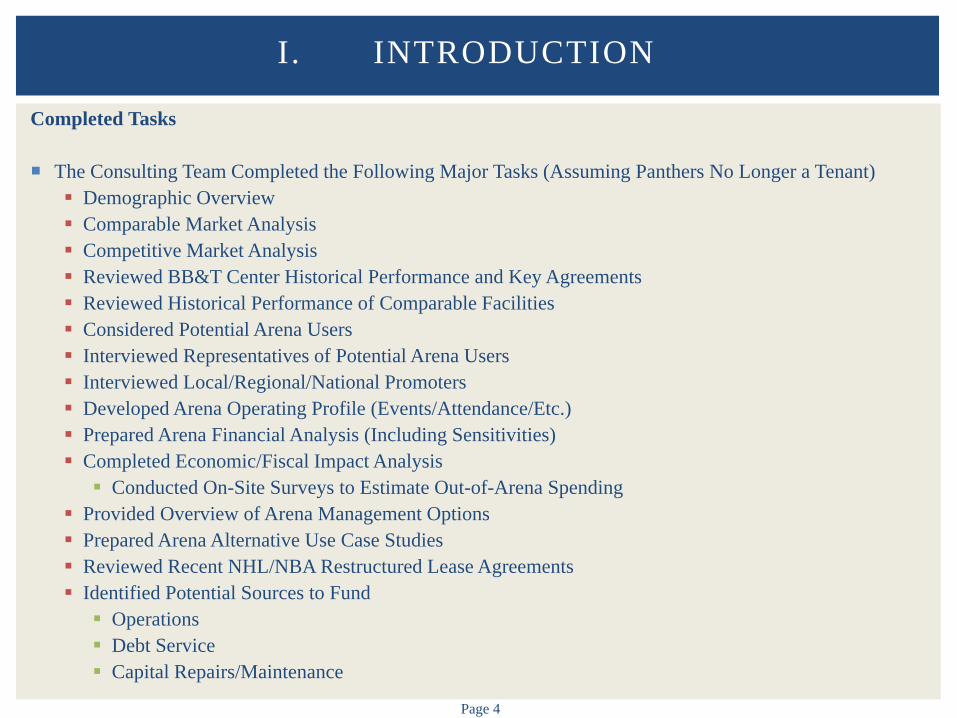
Completed Tasks
The Consulting Team Completed the Following Major Tasks (Assuming Panthers No Longer a Tenant) Demographic Overview Comparable Market Analysis Competitive Market Analysis Reviewed BB&T Center Historical Performance and Key Agreements Reviewed Historical Performance of Comparable Facilities Considered Potential Arena Users Interviewed Representatives of Potential Arena Users Interviewed Local/Regional/National Promoters Developed Arena Operating Profile (Events/Attendance/Etc.) Prepared Arena Financial Analysis (Including Sensitivities) Completed Economic/Fiscal Impact Analysis Conducted On-Site Surveys to Estimate Out-of-Arena Spending
Provided Overview of Arena Management Options Prepared Arena Alternative Use Case Studies Reviewed Recent NHL/NBA Restructured Lease Agreements Identified Potential Sources to Fund Operations Debt Service Capital Repairs/Maintenance
I . INTRODUCTION
II. EXECUTIVE SUMMARY
Page 6
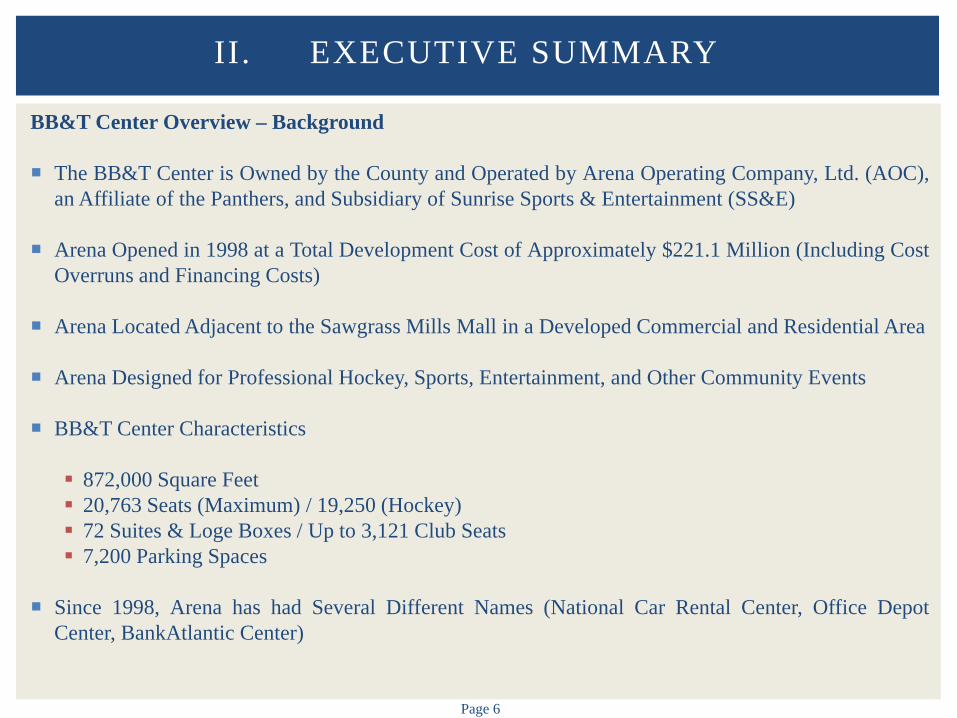
BB&T Center Overview – Background
The BB&T Center is Owned by the County and Operated by Arena Operating Company, Ltd. (AOC), an Affiliate of the Panthers, and Subsidiary of Sunrise Sports & Entertainment (SS&E)
Arena Opened in 1998 at a Total Development Cost of Approximately $221.1 Million (Including Cost Overruns and Financing Costs)
Arena Located Adjacent to the Sawgrass Mills Mall in a Developed Commercial and Residential Area
Arena Designed for Professional Hockey, Sports, Entertainment, and Other Community Events
BB&T Center Characteristics
872,000 Square Feet 20,763 Seats (Maximum) / 19,250 (Hockey) 72 Suites & Loge Boxes / Up to 3,121 Club Seats 7,200 Parking Spaces
Since 1998, Arena has had Several Different Names (National Car Rental Center, Office Depot
Center, BankAtlantic Center)
II. EXECUTIVE SUMMARY
Page 7
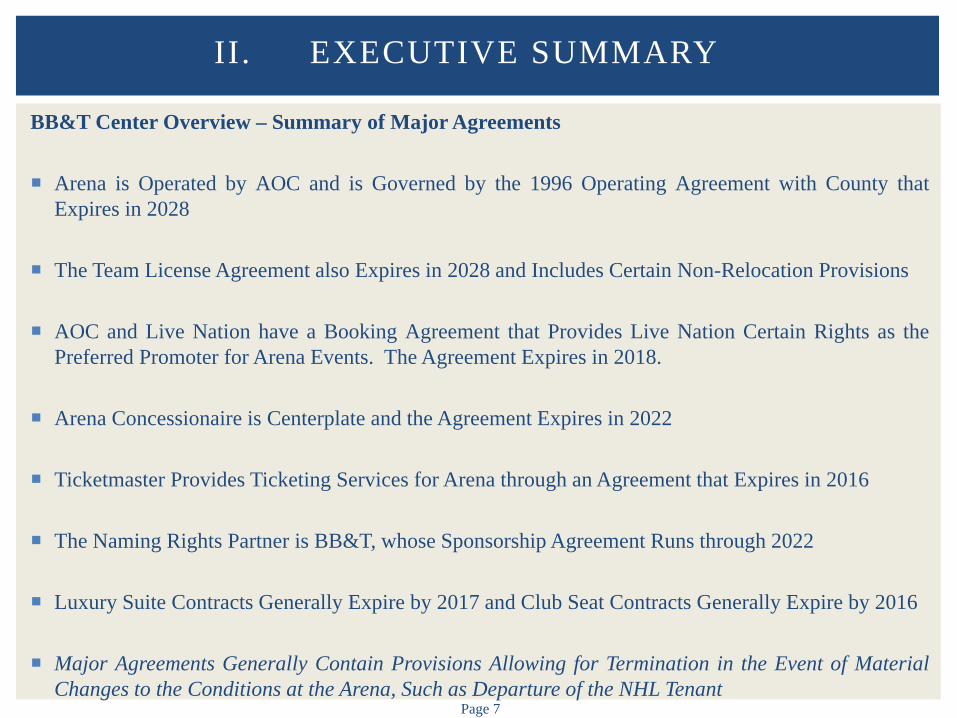
BB&T Center Overview – Summary of Major Agreements
Arena is Operated by AOC and is Governed by the 1996 Operating Agreement with County that Expires in 2028
The Team License Agreement also Expires in 2028 and Includes Certain Non-Relocation Provisions
AOC and Live Nation have a Booking Agreement that Provides Live Nation Certain Rights as the Preferred Promoter for Arena Events. The Agreement Expires in 2018.
Arena Concessionaire is Centerplate and the Agreement Expires in 2022
Ticketmaster Provides Ticketing Services for Arena through an Agreement that Expires in 2016
The Naming Rights Partner is BB&T, whose Sponsorship Agreement Runs through 2022
Luxury Suite Contracts Generally Expire by 2017 and Club Seat Contracts Generally Expire by 2016
Major Agreements Generally Contain Provisions Allowing for Termination in the Event of Material Changes to the Conditions at the Arena, Such as Departure of the NHL Tenant
II. EXECUTIVE SUMMARY
Page 8
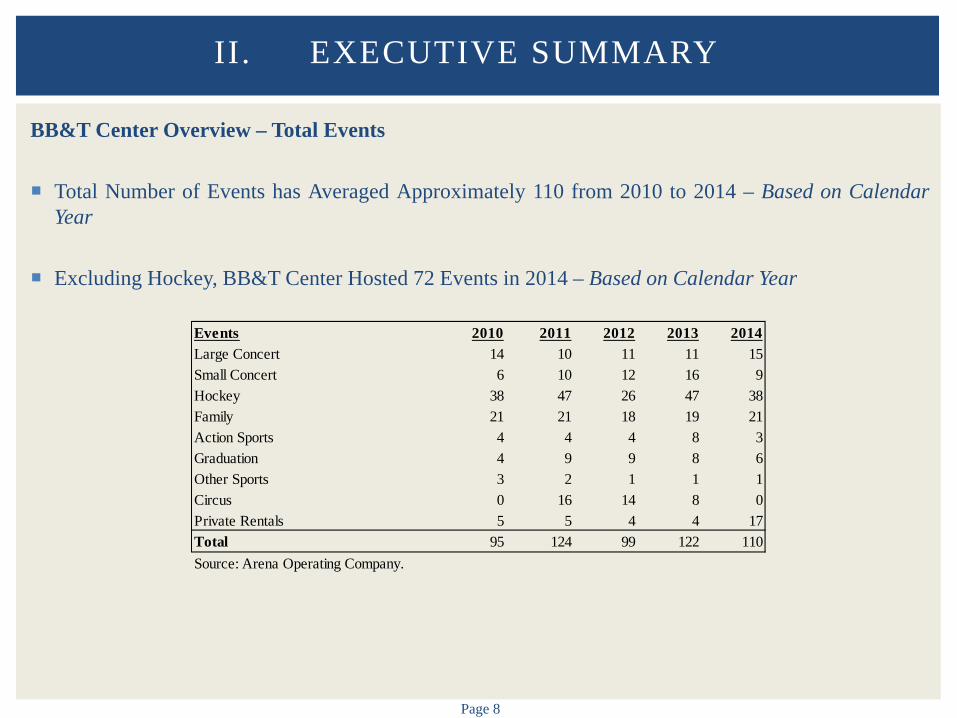
BB&T Center Overview – Total Events
Total Number of Events has Averaged Approximately 110 from 2010 to 2014 – Based on Calendar Year
Excluding Hockey, BB&T Center Hosted 72 Events in 2014 – Based on Calendar Year
II. EXECUTIVE SUMMARY
Events 2010 2011 2012 2013 2014Large Concert 14 10 11 11 15Small Concert 6 10 12 16 9Hockey 38 47 26 47 38Family 21 21 18 19 21Action Sports 4 4 4 8 3Graduation 4 9 9 8 6Other Sports 3 2 1 1 1Circus 0 16 14 8 0Private Rentals 5 5 4 4 17Total 95 124 99 122 110Source: Arena Operating Company.
Page 9
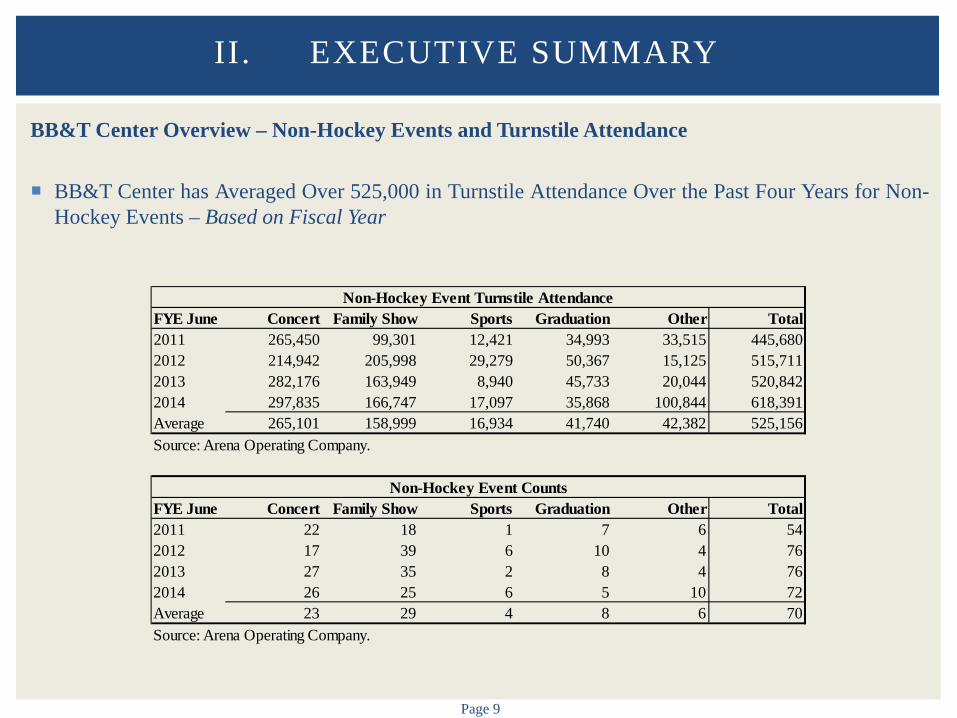
BB&T Center Overview – Non-Hockey Events and Turnstile Attendance BB&T Center has Averaged Over 525,000 in Turnstile Attendance Over the Past Four Years for Non-
Hockey Events – Based on Fiscal Year
II. EXECUTIVE SUMMARY
FYE June Concert Family Show Sports Graduation Other Total2011 265,450 99,301 12,421 34,993 33,515 445,6802012 214,942 205,998 29,279 50,367 15,125 515,7112013 282,176 163,949 8,940 45,733 20,044 520,8422014 297,835 166,747 17,097 35,868 100,844 618,391Average 265,101 158,999 16,934 41,740 42,382 525,156Source: Arena Operating Company.
FYE June Concert Family Show Sports Graduation Other Total2011 22 18 1 7 6 542012 17 39 6 10 4 762013 27 35 2 8 4 762014 26 25 6 5 10 72Average 23 29 4 8 6 70Source: Arena Operating Company.
Non-Hockey Event Counts
Non-Hockey Event Turnstile Attendance
Page 10
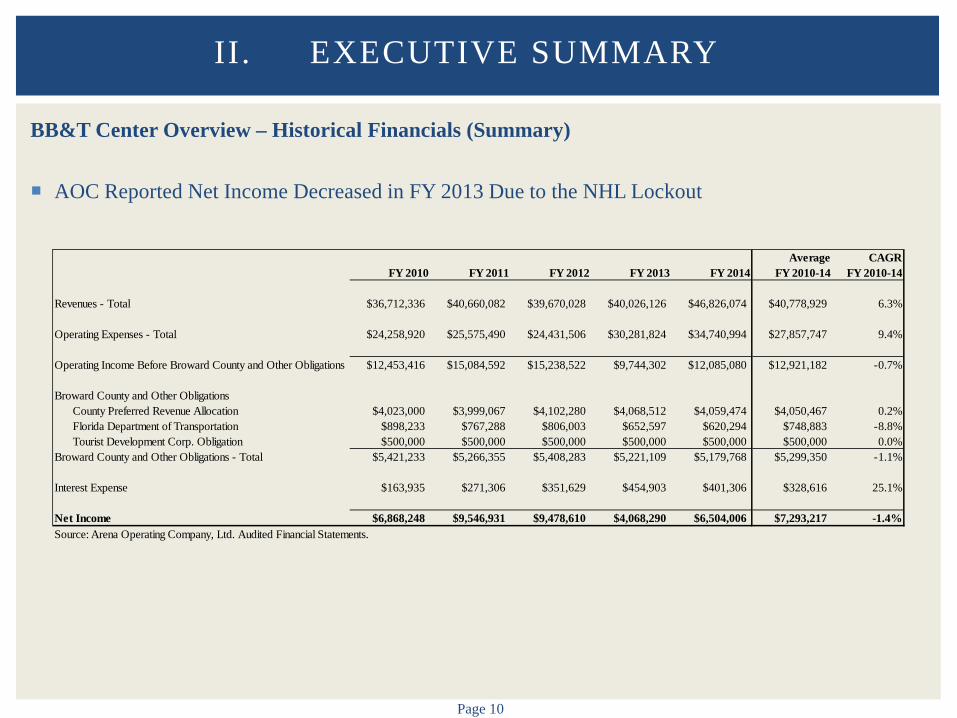
BB&T Center Overview – Historical Financials (Summary)
AOC Reported Net Income Decreased in FY 2013 Due to the NHL Lockout
II. EXECUTIVE SUMMARY
Average CAGRFY 2010 FY 2011 FY 2012 FY 2013 FY 2014 FY 2010-14 FY 2010-14
Revenues - Total $36,712,336 $40,660,082 $39,670,028 $40,026,126 $46,826,074 $40,778,929 6.3%
Operating Expenses - Total $24,258,920 $25,575,490 $24,431,506 $30,281,824 $34,740,994 $27,857,747 9.4%
Operating Income Before Broward County and Other Obligations $12,453,416 $15,084,592 $15,238,522 $9,744,302 $12,085,080 $12,921,182 -0.7%
Broward County and Other ObligationsCounty Preferred Revenue Allocation $4,023,000 $3,999,067 $4,102,280 $4,068,512 $4,059,474 $4,050,467 0.2%Florida Department of Transportation $898,233 $767,288 $806,003 $652,597 $620,294 $748,883 -8.8%Tourist Development Corp. Obligation $500,000 $500,000 $500,000 $500,000 $500,000 $500,000 0.0%
Broward County and Other Obligations - Total $5,421,233 $5,266,355 $5,408,283 $5,221,109 $5,179,768 $5,299,350 -1.1%
Interest Expense $163,935 $271,306 $351,629 $454,903 $401,306 $328,616 25.1%
Net Income $6,868,248 $9,546,931 $9,478,610 $4,068,290 $6,504,006 $7,293,217 -1.4%Source: Arena Operating Company, Ltd. Audited Financial Statements.
Page 11
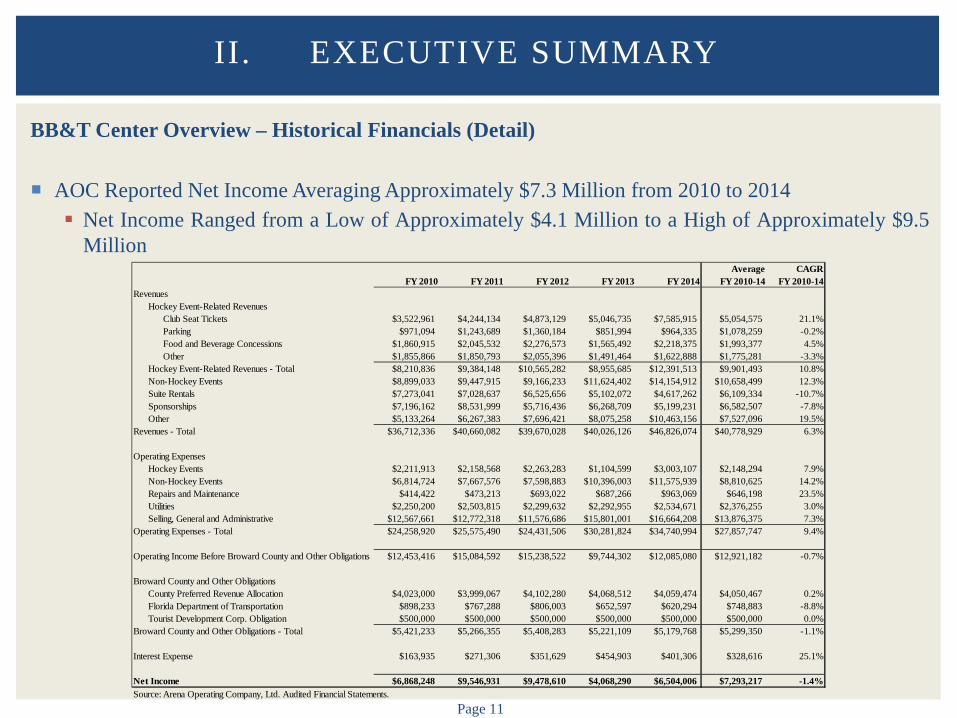
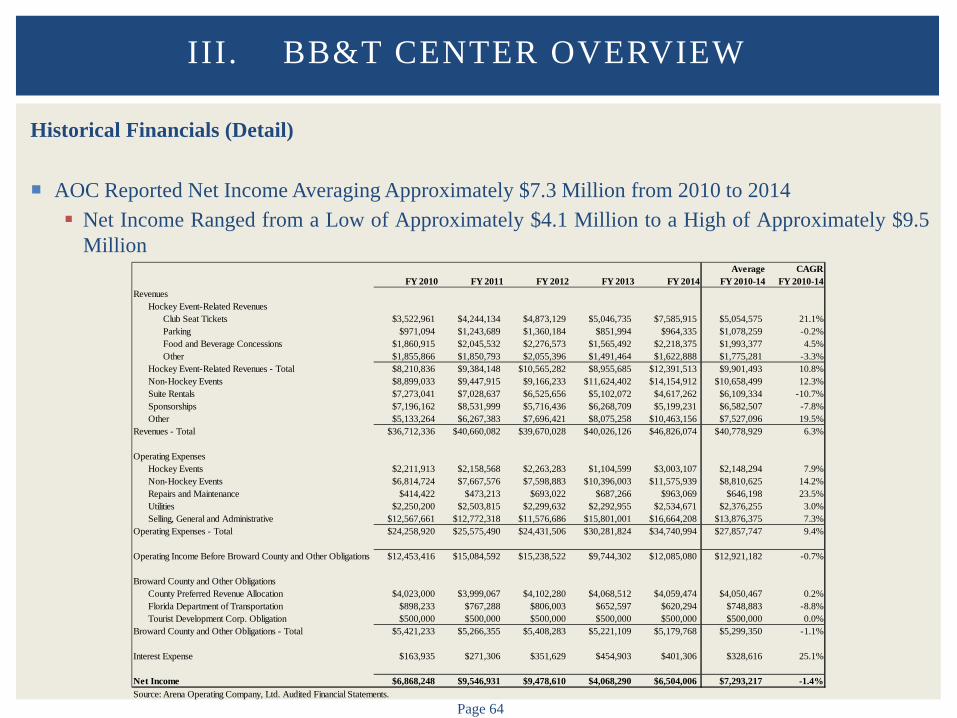
BB&T Center Overview – Historical Financials (Detail)
AOC Reported Net Income Averaging Approximately $7.3 Million from 2010 to 2014 Net Income Ranged from a Low of Approximately $4.1 Million to a High of Approximately $9.5
Million
II. EXECUTIVE SUMMARY
Average CAGRFY 2010 FY 2011 FY 2012 FY 2013 FY 2014 FY 2010-14 FY 2010-14
RevenuesHockey Event-Related Revenues
Club Seat Tickets $3,522,961 $4,244,134 $4,873,129 $5,046,735 $7,585,915 $5,054,575 21.1%Parking $971,094 $1,243,689 $1,360,184 $851,994 $964,335 $1,078,259 -0.2%Food and Beverage Concessions $1,860,915 $2,045,532 $2,276,573 $1,565,492 $2,218,375 $1,993,377 4.5%Other $1,855,866 $1,850,793 $2,055,396 $1,491,464 $1,622,888 $1,775,281 -3.3%
Hockey Event-Related Revenues - Total $8,210,836 $9,384,148 $10,565,282 $8,955,685 $12,391,513 $9,901,493 10.8%Non-Hockey Events $8,899,033 $9,447,915 $9,166,233 $11,624,402 $14,154,912 $10,658,499 12.3%Suite Rentals $7,273,041 $7,028,637 $6,525,656 $5,102,072 $4,617,262 $6,109,334 -10.7%Sponsorships $7,196,162 $8,531,999 $5,716,436 $6,268,709 $5,199,231 $6,582,507 -7.8%Other $5,133,264 $6,267,383 $7,696,421 $8,075,258 $10,463,156 $7,527,096 19.5%
Revenues - Total $36,712,336 $40,660,082 $39,670,028 $40,026,126 $46,826,074 $40,778,929 6.3%
Operating ExpensesHockey Events $2,211,913 $2,158,568 $2,263,283 $1,104,599 $3,003,107 $2,148,294 7.9%Non-Hockey Events $6,814,724 $7,667,576 $7,598,883 $10,396,003 $11,575,939 $8,810,625 14.2%Repairs and Maintenance $414,422 $473,213 $693,022 $687,266 $963,069 $646,198 23.5%Utilities $2,250,200 $2,503,815 $2,299,632 $2,292,955 $2,534,671 $2,376,255 3.0%Selling, General and Administrative $12,567,661 $12,772,318 $11,576,686 $15,801,001 $16,664,208 $13,876,375 7.3%
Operating Expenses - Total $24,258,920 $25,575,490 $24,431,506 $30,281,824 $34,740,994 $27,857,747 9.4%
Operating Income Before Broward County and Other Obligations $12,453,416 $15,084,592 $15,238,522 $9,744,302 $12,085,080 $12,921,182 -0.7%
Broward County and Other ObligationsCounty Preferred Revenue Allocation $4,023,000 $3,999,067 $4,102,280 $4,068,512 $4,059,474 $4,050,467 0.2%Florida Department of Transportation $898,233 $767,288 $806,003 $652,597 $620,294 $748,883 -8.8%Tourist Development Corp. Obligation $500,000 $500,000 $500,000 $500,000 $500,000 $500,000 0.0%
Broward County and Other Obligations - Total $5,421,233 $5,266,355 $5,408,283 $5,221,109 $5,179,768 $5,299,350 -1.1%
Interest Expense $163,935 $271,306 $351,629 $454,903 $401,306 $328,616 25.1%
Net Income $6,868,248 $9,546,931 $9,478,610 $4,068,290 $6,504,006 $7,293,217 -1.4%Source: Arena Operating Company, Ltd. Audited Financial Statements.
Page 12
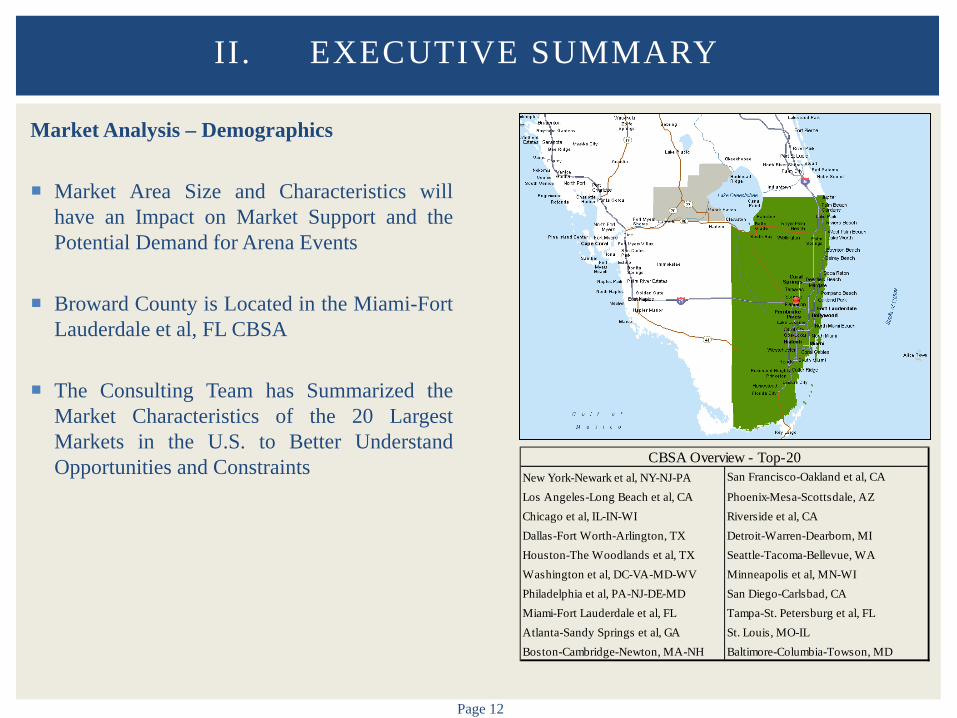
Market Analysis – Demographics
Market Area Size and Characteristics will have an Impact on Market Support and the Potential Demand for Arena Events
Broward County is Located in the Miami-Fort Lauderdale et al, FL CBSA
The Consulting Team has Summarized the Market Characteristics of the 20 Largest Markets in the U.S. to Better Understand Opportunities and Constraints
II. EXECUTIVE SUMMARY
New York-Newark et al, NY-NJ-PA San Francisco-Oakland et al, CA
Los Angeles-Long Beach et al, CA Phoenix-Mesa-Scottsdale, AZChicago et al, IL-IN-WI Riverside et al, CADallas-Fort Worth-Arlington, TX Detroit-Warren-Dearborn, MIHouston-The Woodlands et al, TX Seattle-Tacoma-Bellevue, WAWashington et al, DC-VA-MD-WV Minneapolis et al, MN-WIPhiladelphia et al, PA-NJ-DE-MD San Diego-Carlsbad, CAMiami-Fort Lauderdale et al, FL Tampa-St. Petersburg et al, FLAtlanta-Sandy Springs et al, GA St. Louis, MO-ILBoston-Cambridge-Newton, MA-NH Baltimore-Columbia-Towson, MD
CBSA Overview - Top-20
Page 13
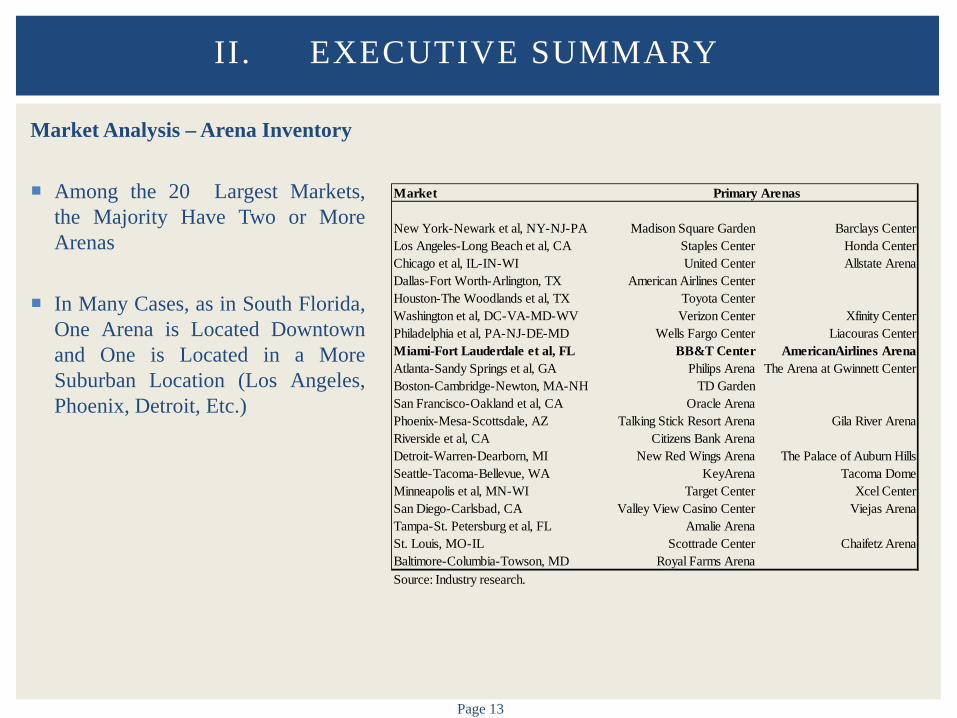
Market Analysis – Arena Inventory
Among the 20 Largest Markets, the Majority Have Two or More Arenas
In Many Cases, as in South Florida, One Arena is Located Downtown and One is Located in a More Suburban Location (Los Angeles, Phoenix, Detroit, Etc.)
II. EXECUTIVE SUMMARY
Market
New York-Newark et al, NY-NJ-PA Madison Square Garden Barclays CenterLos Angeles-Long Beach et al, CA Staples Center Honda CenterChicago et al, IL-IN-WI United Center Allstate ArenaDallas-Fort Worth-Arlington, TX American Airlines CenterHouston-The Woodlands et al, TX Toyota CenterWashington et al, DC-VA-MD-WV Verizon Center Xfinity CenterPhiladelphia et al, PA-NJ-DE-MD Wells Fargo Center Liacouras CenterMiami-Fort Lauderdale et al, FL BB&T Center AmericanAirlines ArenaAtlanta-Sandy Springs et al, GA Philips Arena The Arena at Gwinnett CenterBoston-Cambridge-Newton, MA-NH TD GardenSan Francisco-Oakland et al, CA Oracle ArenaPhoenix-Mesa-Scottsdale, AZ Talking Stick Resort Arena Gila River ArenaRiverside et al, CA Citizens Bank ArenaDetroit-Warren-Dearborn, MI New Red Wings Arena The Palace of Auburn HillsSeattle-Tacoma-Bellevue, WA KeyArena Tacoma DomeMinneapolis et al, MN-WI Target Center Xcel CenterSan Diego-Carlsbad, CA Valley View Casino Center Viejas ArenaTampa-St. Petersburg et al, FL Amalie ArenaSt. Louis, MO-IL Scottrade Center Chaifetz ArenaBaltimore-Columbia-Towson, MD Royal Farms ArenaSource: Industry research.
Primary Arenas
Page 14
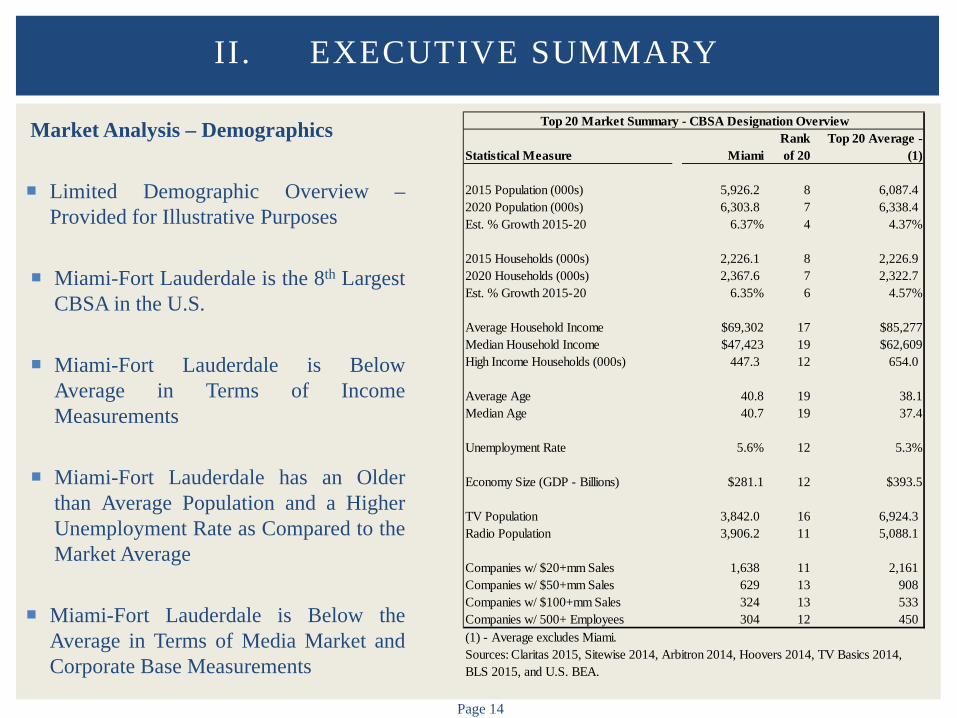
Market Analysis – Demographics
Limited Demographic Overview – Provided for Illustrative Purposes
Miami-Fort Lauderdale is the 8th Largest CBSA in the U.S.
Miami-Fort Lauderdale is Below Average in Terms of Income Measurements
Miami-Fort Lauderdale has an Older than Average Population and a Higher Unemployment Rate as Compared to the Market Average
Miami-Fort Lauderdale is Below the Average in Terms of Media Market and Corporate Base Measurements
II. EXECUTIVE SUMMARY
Statistical Measure MiamiRank of 20
Top 20 Average - (1)
2015 Population (000s) 5,926.2 8 6,087.4 2020 Population (000s) 6,303.8 7 6,338.4 Est. % Growth 2015-20 6.37% 4 4.37%
2015 Households (000s) 2,226.1 8 2,226.9 2020 Households (000s) 2,367.6 7 2,322.7 Est. % Growth 2015-20 6.35% 6 4.57%
Average Household Income $69,302 17 $85,277Median Household Income $47,423 19 $62,609High Income Households (000s) 447.3 12 654.0
Average Age 40.8 19 38.1Median Age 40.7 19 37.4
Unemployment Rate 5.6% 12 5.3%
Economy Size (GDP - Billions) $281.1 12 $393.5
TV Population 3,842.0 16 6,924.3 Radio Population 3,906.2 11 5,088.1
Companies w/ $20+mm Sales 1,638 11 2,161Companies w/ $50+mm Sales 629 13 908Companies w/ $100+mm Sales 324 13 533Companies w/ 500+ Employees 304 12 450
Top 20 Market Summary - CBSA Designation Overview
Sources: Claritas 2015, Sitewise 2014, Arbitron 2014, Hoovers 2014, TV Basics 2014, BLS 2015, and U.S. BEA.
(1) - Average excludes Miami.
Page 15
Market Analysis – Demographics: General Observations Miami-Fort Lauderdale is Generally a Strong Market in Terms of Population and Households
Miami-Fort Lauderdale has Strong Expected Population Growth Over Next 10 Years
Relative Weakness in Median Household Income is Somewhat Offset by Relatively High
Percentage of High Income Households in Miami-Fort Lauderdale
Miami-Fort Lauderdale Generally has an Older Population than the Comparable Markets
In Terms of Population Per Seat and Luxury Suites Per Company, the Miami-Fort Lauderdale Market is Not Overly Saturated as Compared to the Largest 20 U.S. Markets – In Terms of High Income Households to Club Seats, the Market Does Not Rank Favorably
Miami-Fort Lauderdale Benefits from being a Strong Tourist Market – Could Impact Arena Demand for Certain Events (Over 13 Million Tourists to Broward County in 2013)
II. EXECUTIVE SUMMARY
Page 16
Market Analysis – Competitive Facilities
Existing and Planned Inventory of Arenas/Stadiums in the Miami-Fort Lauderdale Market Provide Competition
Direct Competition from Comparable Arenas, as well as Indirect Competition from Stadiums, Amphitheaters, Performing Arts Centers (to a Lesser Degree), and Other Entertainment Alternatives Must be Considered
Patrons Events/Tenants Advertising/Sponsorships Premium Seating Other
II. EXECUTIVE SUMMARY

Page 17
Market Analysis – Competitive Facilities
Numerous Competitive Facilities in the Market, Including
AmericanAirlines Arena Hard Rock Live Arena Perfect Vodka Amphitheatre BankUnited Center Sun Life Stadium Marlins Stadium
Significant Inventory/Supply of Sponsorship Opportunities and Premium Seating (Luxury Suites/Club
Seats) in Market Area
AmericanAirlines Arena in Downtown Miami Provides the Most Significant Competition to BB&T Center
II. EXECUTIVE SUMMARY
Page 18
Market Analysis – Promoter/User Interviews Miami-Fort Lauderdale Considered a Very Strong Concert Market – High Level of Competition for Acts, Particularly
During Outdoor Concert Season
Alternative Concert Venues Such as the Hard Rock Live Arena and Perfect Vodka Amphitheatre Impact Economics of Two Main Arenas
Promoters Report Very Strong Competition Between the BB&T Center and AmericanAirlines Arena, Resulting in
Relatively High Performer Shares, Leaving Smaller Shares for the Arenas and Promoters
Promoters Indicated that BB&T Center and AmericanAirlines Arena Perform Similarly as Music Venues – No Major Difference in Economics
Promoters Indicated They Generally have Little Trouble Booking Desirable Dates Year Round – Promoters
Generally Do Not have to Settle for Non-Preferred Dates
One Promoter Strongly Cautioned that his Show Promoters Would Look Less Favorably at BB&T Center Without the Panthers Because of the Lack of a Strong Season Ticket Holder Database to Market Events Going Forward
One Promoter Commented that Without the Panthers, BB&T Center will Need to Market Itself Aggressively to Maintain its Brand as a Top Tier Venue on Par with AmericanAirlines Arena
One Promoter Commented that the Age of BB&T Center is a Concern and Indicated that Capital Repairs/Maintenance Need to be Diligently Performed to Keep the Building from Starting to Deteriorate in Terms of Performance
II. EXECUTIVE SUMMARY
Page 19
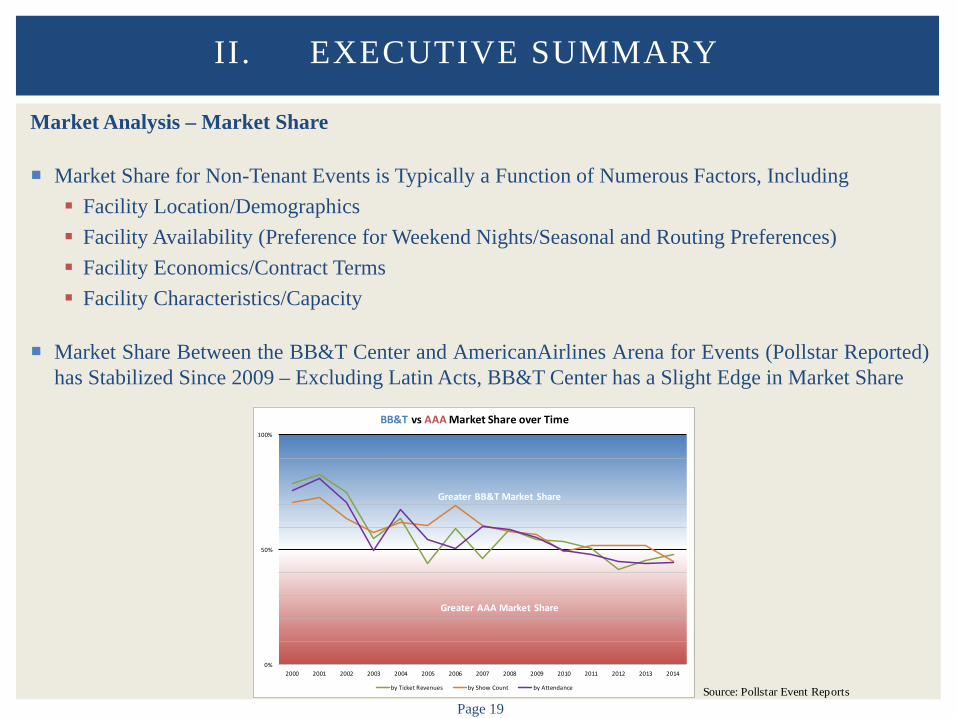
Market Analysis – Market Share
Market Share for Non-Tenant Events is Typically a Function of Numerous Factors, Including Facility Location/Demographics Facility Availability (Preference for Weekend Nights/Seasonal and Routing Preferences) Facility Economics/Contract Terms Facility Characteristics/Capacity
Market Share Between the BB&T Center and AmericanAirlines Arena for Events (Pollstar Reported) has Stabilized Since 2009 – Excluding Latin Acts, BB&T Center has a Slight Edge in Market Share
II. EXECUTIVE SUMMARY
0%
50%
100%
2000 2001 2002 2003 2004 2005 2006 2007 2008 2009 2010 2011 2012 2013 2014
BB&T vs AAA Market Share over Time
by Ticket Revenues by Show Count by Attendance
Greater BB&T Market Share
Greater AAA Market Share
Source: Pollstar Event Reports
Page 20
Market Analysis – Market Share (Opportunities)
The Consulting Team Examined the Performance of Events on Each Night of the Week as Compared to that Tour’s National Average from 2006-2013 as Reported by Pollstar
All Performances: 98% of National Average Friday – Sunday Performances: 100% of National Average Monday – Thursday Performances: 93% of National Average
It is Estimated that Potential Economic Gains Due to Capture of AmericanAirlines Arena Events
Historically Occurring During Panthers Games Could Approach $300,000-$600,000 Per Year, If BB&T Center were able to Capture All Such Events
In Addition to Potential Market Share Capture, it is Estimated that Potential Economic Gains Due to
Increased Scheduling of Weekend Shows Without the Panthers Could Approach $50,000-$100,000, Depending on the Mix of Shows and Scheduling
II. EXECUTIVE SUMMARY
Page 21
Market Analysis – Potential Users/Tenants
In Addition to Events Such as Concerts, Family Shows, and Community Events, Many Arenas Often Include One or More Anchor Tenants
BB&T Center Could Consider the Potential of a Replacement Anchor Tenant – Minor League Team
Candidate League Would Likely have a Presence in the Southeast and Team Available to Relocate or a Desire to Expand
Advantages of an Anchor Tenant Could Include
Stabilizing Revenue Streams During the Year and Across Years Increased Activity/Exposure of Arena Increases Sponsorship and Naming Rights Demand Ticket Buyer Database to Promote Concerts and Other Events
Certain Arena Operators Prefer to Operate Arenas with No Minor League Tenants to Provide More
Flexible Scheduling Opportunities for More Profitable Events
II. EXECUTIVE SUMMARY
Page 22
Market Analysis – Potential Users/Tenants
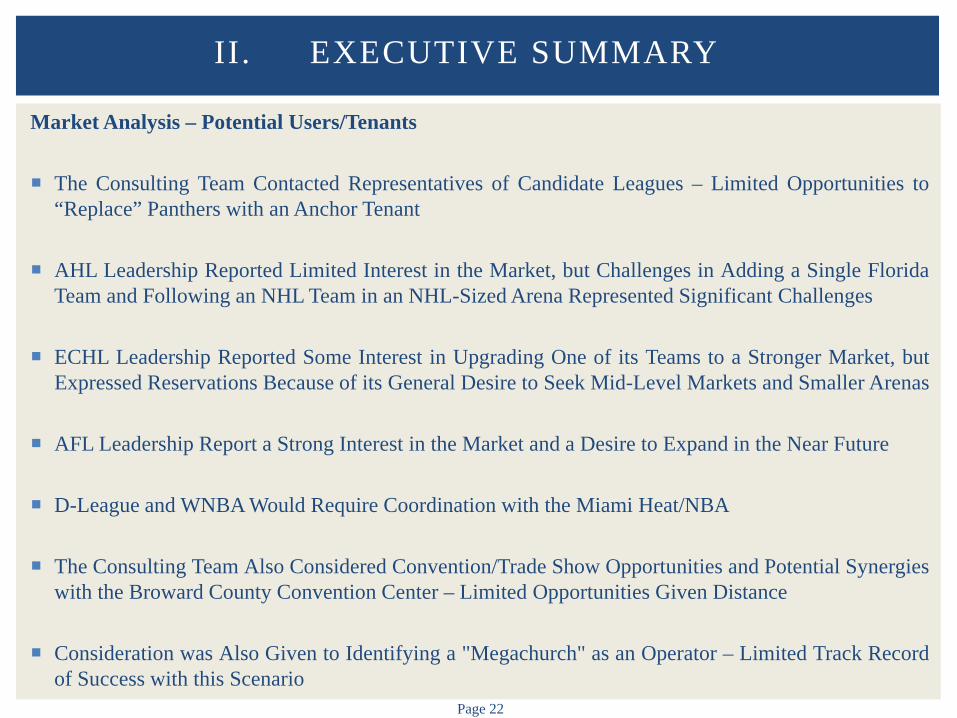
The Consulting Team Contacted Representatives of Candidate Leagues – Limited Opportunities to “Replace” Panthers with an Anchor Tenant
AHL Leadership Reported Limited Interest in the Market, but Challenges in Adding a Single Florida Team and Following an NHL Team in an NHL-Sized Arena Represented Significant Challenges
ECHL Leadership Reported Some Interest in Upgrading One of its Teams to a Stronger Market, but Expressed Reservations Because of its General Desire to Seek Mid-Level Markets and Smaller Arenas
AFL Leadership Report a Strong Interest in the Market and a Desire to Expand in the Near Future
D-League and WNBA Would Require Coordination with the Miami Heat/NBA
The Consulting Team Also Considered Convention/Trade Show Opportunities and Potential Synergies with the Broward County Convention Center – Limited Opportunities Given Distance
Consideration was Also Given to Identifying a "Megachurch" as an Operator – Limited Track Record of Success with this Scenario
II. EXECUTIVE SUMMARY
Page 23
Financial Analysis – Overview
The Consulting Team Developed Financial and Operating Assumptions for the BB&T Center to Understand the Potential Net Cash Flow from Operations Without the Panthers
The Consulting Team has Made Significant Assumptions Related to Arena Operating Revenues and Expenses
Although Assumptions Appear Reasonable Based on Current and Anticipated Market Conditions, Actual Results Depend on Actions of Arena, Management, Tenants, and Other Factors Both Internal and External to Project, which Frequently Vary
It is Important to Note that Because Events and Circumstances May Not Occur as Expected, there May be Significant Differences Between Actual Results and those Estimated in this Analysis, and those Differences May Be Material
The Consulting Team Reviewed Historical Operating Performance of the BB&T Center and Utilized Comparable Arena Information from Our Proprietary Internal Database to Develop Key Assumptions
Information Obtained from Numerous Sources Including Comparable Facilities, Industry Sources, Etc. In Order to Obtain Accurate and Relevant Information, the Consulting Team Agreed to Maintain
Confidentiality of Arenas
As Noted Previously, Findings are Limited in Nature as the Consulting Team has Not Completed General Public/Corporate Surveys or Focus Groups
II. EXECUTIVE SUMMARY
Page 24
Financial Analysis – Comparable Arena Overview
The Consulting Team Identified 18 Arenas to be “Comparable” to BB&T Center Without a NHL Tenant
Comparable Arenas were Selected Based on Some or All of the Following Factors Physical Characteristics Age Size Amenities
Operating Characteristics Tenant Mix (No NHL or NBA Tenant) Competing Arena in Market
Other Characteristics Market Location
II. EXECUTIVE SUMMARY
Page 25
Financial Analysis – Comparable Arena Market Demographics
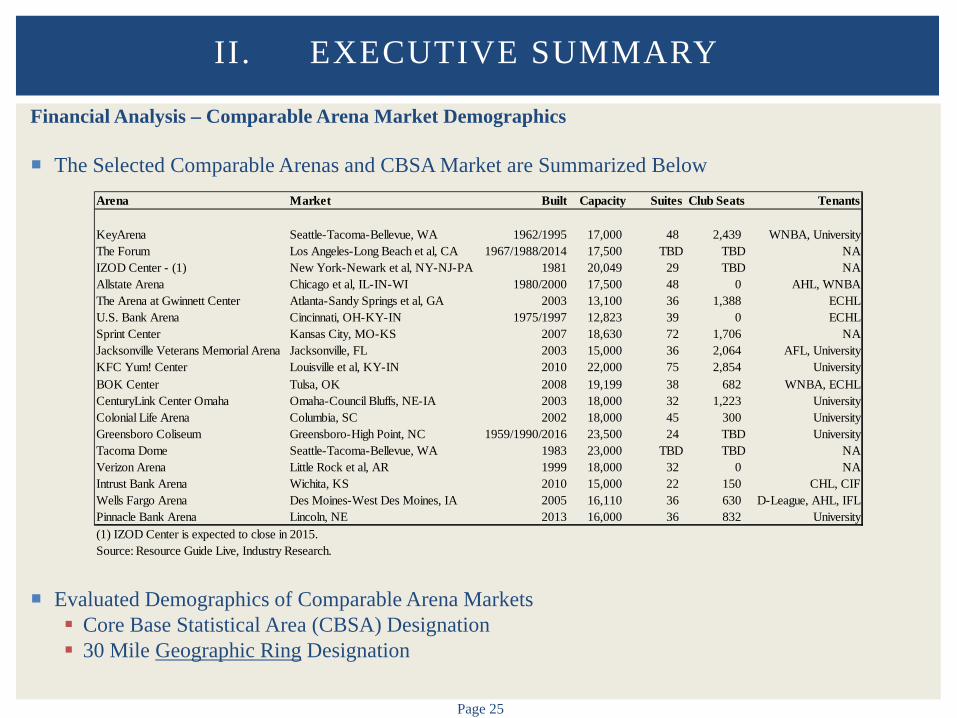
The Selected Comparable Arenas and CBSA Market are Summarized Below
Evaluated Demographics of Comparable Arena Markets Core Base Statistical Area (CBSA) Designation 30 Mile Geographic Ring Designation
II. EXECUTIVE SUMMARY
Arena Market Built Capacity Suites Club Seats Tenants
KeyArena Seattle-Tacoma-Bellevue, WA 1962/1995 17,000 48 2,439 WNBA, UniversityThe Forum Los Angeles-Long Beach et al, CA 1967/1988/2014 17,500 TBD TBD NAIZOD Center - (1) New York-Newark et al, NY-NJ-PA 1981 20,049 29 TBD NAAllstate Arena Chicago et al, IL-IN-WI 1980/2000 17,500 48 0 AHL, WNBAThe Arena at Gwinnett Center Atlanta-Sandy Springs et al, GA 2003 13,100 36 1,388 ECHLU.S. Bank Arena Cincinnati, OH-KY-IN 1975/1997 12,823 39 0 ECHLSprint Center Kansas City, MO-KS 2007 18,630 72 1,706 NAJacksonville Veterans Memorial Arena Jacksonville, FL 2003 15,000 36 2,064 AFL, UniversityKFC Yum! Center Louisville et al, KY-IN 2010 22,000 75 2,854 UniversityBOK Center Tulsa, OK 2008 19,199 38 682 WNBA, ECHLCenturyLink Center Omaha Omaha-Council Bluffs, NE-IA 2003 18,000 32 1,223 UniversityColonial Life Arena Columbia, SC 2002 18,000 45 300 UniversityGreensboro Coliseum Greensboro-High Point, NC 1959/1990/2016 23,500 24 TBD UniversityTacoma Dome Seattle-Tacoma-Bellevue, WA 1983 23,000 TBD TBD NAVerizon Arena Little Rock et al, AR 1999 18,000 32 0 NAIntrust Bank Arena Wichita, KS 2010 15,000 22 150 CHL, CIFWells Fargo Arena Des Moines-West Des Moines, IA 2005 16,110 36 630 D-League, AHL, IFLPinnacle Bank Arena Lincoln, NE 2013 16,000 36 832 University(1) IZOD Center is expected to close in 2015.Source: Resource Guide Live, Industry Research.

Page 26
Financial Analysis – Summary of Cash Flows
Base case assumes no major or
minor league tenant
Debt service – not included Arena Debt ($14.0 million) Completion Bonds
($620,000) FDOT ($675,000) CVB ($500,000)
Capital expenditures – not
included Annual amounts will
fluctuate
II. EXECUTIVE SUMMARY
ARENA SUMMARY($ in 000s)
Year 1 2 3 4 5
Number of Events 86 86 86 86 86Annual Paid Attendance (000s) 531 531 531 531 531
OPERATING REVENUES (Net)Total Rental Revenue $1,576 $1,639 $1,704 $1,772 $1,843Premium Seating Revenue $1,216 $1,257 $1,300 $1,345 $1,391Advertising 1,275 1,320 1,366 1,414 1,463Naming Rights 510 530 552 574 597Concessions 1,993 2,052 2,114 2,177 2,243Novelties 19 20 21 21 22Parking 1,597 1,645 1,694 1,745 1,797Other (Facility Fee/Rebate/Etc.) 1,768 1,768 1,768 1,768 1,768
TOTAL REVENUES $9,954 $10,231 $10,519 $10,816 $11,124
OPERATING EXPENSESArena Operating Expenses
Staffing $2,834 $2,919 $3,007 $3,097 $3,190General and Administrative 3,265 3,363 3,464 3,568 3,675Utilities 1,800 1,854 1,910 1,967 2,026Management Fee 200 206 212 219 225Non-Recoverable Event Related Expenses 500 515 530 546 562
TOTAL EXPENSES $8,599 $8,857 $9,122 $9,396 $9,677
NET CASH FLOW $1,355 $1,374 $1,396 $1,420 $1,446

Page 27
Financial Analysis – Sensitivity Matrix (Base Case) Sensitivities in the Following Table
Illustrate Potential Fluctuations in Net Cash Flow
Base case assumes no major or minor
league tenant
Debt service – not included Arena Debt ($14.0 million) Completion Bonds ($620,000) FDOT ($675,000) CVB ($500,000)
Capital expenditures – not included Annual amounts will fluctuate
II. EXECUTIVE SUMMARY
NET CASHFLOW
BASE CASE $1,355
ADJUSTEDASSUMPTION ADJUSTMENT NET IMPACT CASH FLOW
Number of Other Events Increase 10% $695 $2,050Decrease (10%) ($695) $659
Average Paid AttendanceIncrease 10% $587 $1,941Decrease (10%) ($612) $742
Premium Seating - Average PriceIncrease 10% $122 $1,476Decrease (10%) ($122) $1,233
Premium Seating - OccupancyIncrease 10% $122 $1,476Decrease (10%) ($122) $1,233
Advertising/Naming Rights RevenueIncrease 10% $179 $1,533Decrease (10%) ($179) $1,176
Concessions/Novelties Per CapitasIncrease 10% $201 $1,556Decrease (10%) ($201) $1,153
Operating ExpensesIncrease 10% ($860) $495Decrease (10%) $860 $2,214
SENSITIVITY ANALYSIS

Page 28
Financial Analysis Sensitivity #1 – Arena with ECHL Tenant Major Assumptions/Variances from
Base Case Cash Flow Include 36 ECHL Events Decrease Major Concerts by 1 Decrease Minor Concerts by 1 Decrease Family Shows by 1 Increase Naming Rights Revenue by
$75,000 (Gross) Increase Advertising Revenue by
$75,000 (Gross) Increase Utilities Expense by
$250,000 Increase Staffing and G&A
Expenses by 5.0%
II. EXECUTIVE SUMMARY
ARENA SUMMARY($ in 000s)
Year 1 2 3 4 5
Number of Events 119 119 119 119 119Annual Paid Attendance (000s) 651 651 651 651 651
OPERATING REVENUES (Net)Total Rental Revenue $1,494 $1,553 $1,615 $1,680 $1,747Premium Seating Revenue $1,216 $1,257 $1,300 $1,345 $1,391Advertising 1,339 1,386 1,434 1,484 1,536Naming Rights 574 597 621 645 671Concessions 1,981 2,040 2,102 2,165 2,229Novelties 19 20 21 21 22Parking 1,708 1,759 1,812 1,866 1,922Other (Facility Fee/Rebate/Etc.) 2,202 2,202 2,202 2,202 2,202
TOTAL REVENUES $10,532 $10,814 $11,106 $11,408 $11,720
OPERATING EXPENSESArena Operating Expenses
Staffing $2,976 $3,065 $3,157 $3,252 $3,349General and Administrative 3,428 3,531 3,637 3,746 3,859Utilities 2,050 2,112 2,175 2,240 2,307Management Fee 200 206 212 219 225Non-Recoverable Event Related Expenses 500 515 530 546 562
TOTAL EXPENSES $9,154 $9,429 $9,711 $10,002 $10,302
NET CASH FLOW $1,378 $1,385 $1,395 $1,406 $1,418
Page 29
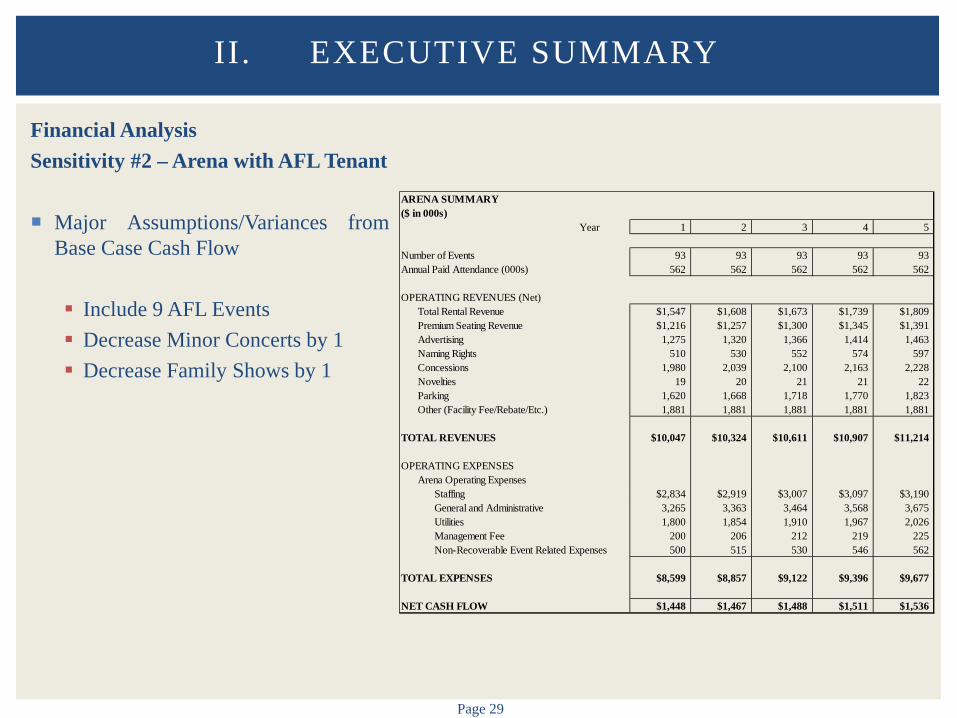
Financial Analysis Sensitivity #2 – Arena with AFL Tenant Major Assumptions/Variances from
Base Case Cash Flow Include 9 AFL Events Decrease Minor Concerts by 1 Decrease Family Shows by 1
II. EXECUTIVE SUMMARY
ARENA SUMMARY($ in 000s)
Year 1 2 3 4 5
Number of Events 93 93 93 93 93Annual Paid Attendance (000s) 562 562 562 562 562
OPERATING REVENUES (Net)Total Rental Revenue $1,547 $1,608 $1,673 $1,739 $1,809Premium Seating Revenue $1,216 $1,257 $1,300 $1,345 $1,391Advertising 1,275 1,320 1,366 1,414 1,463Naming Rights 510 530 552 574 597Concessions 1,980 2,039 2,100 2,163 2,228Novelties 19 20 21 21 22Parking 1,620 1,668 1,718 1,770 1,823Other (Facility Fee/Rebate/Etc.) 1,881 1,881 1,881 1,881 1,881
TOTAL REVENUES $10,047 $10,324 $10,611 $10,907 $11,214
OPERATING EXPENSESArena Operating Expenses
Staffing $2,834 $2,919 $3,007 $3,097 $3,190General and Administrative 3,265 3,363 3,464 3,568 3,675Utilities 1,800 1,854 1,910 1,967 2,026Management Fee 200 206 212 219 225Non-Recoverable Event Related Expenses 500 515 530 546 562
TOTAL EXPENSES $8,599 $8,857 $9,122 $9,396 $9,677
NET CASH FLOW $1,448 $1,467 $1,488 $1,511 $1,536
Page 30
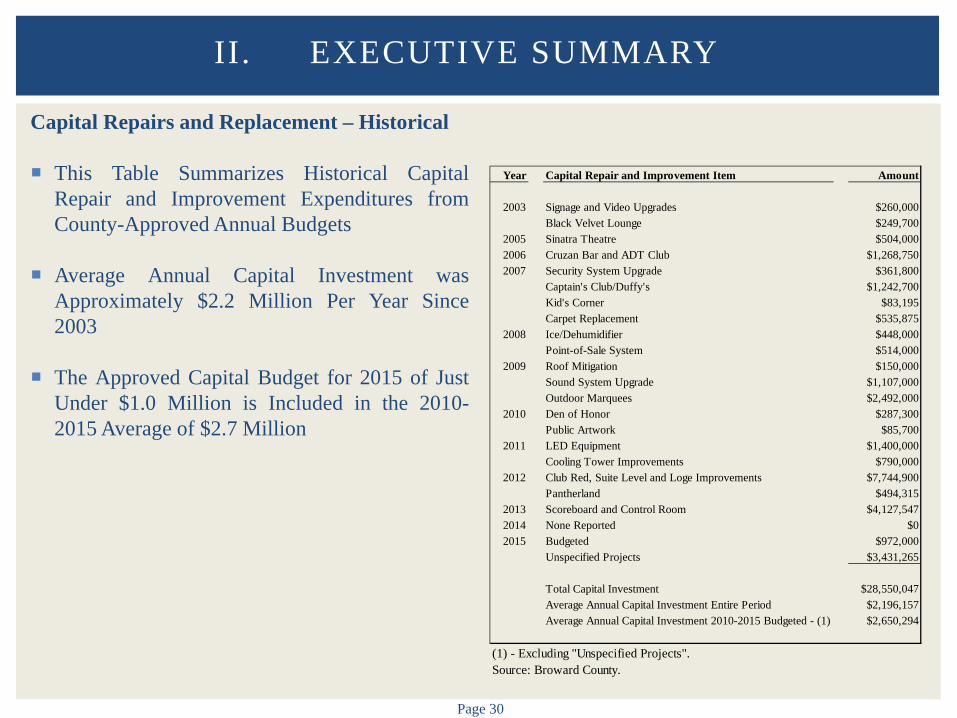
Capital Repairs and Replacement – Historical
This Table Summarizes Historical Capital Repair and Improvement Expenditures from County-Approved Annual Budgets
Average Annual Capital Investment was Approximately $2.2 Million Per Year Since 2003
The Approved Capital Budget for 2015 of Just Under $1.0 Million is Included in the 2010-2015 Average of $2.7 Million
II. EXECUTIVE SUMMARY
Year Capital Repair and Improvement Item Amount
2003 Signage and Video Upgrades $260,000Black Velvet Lounge $249,700
2005 Sinatra Theatre $504,0002006 Cruzan Bar and ADT Club $1,268,7502007 Security System Upgrade $361,800
Captain's Club/Duffy's $1,242,700Kid's Corner $83,195Carpet Replacement $535,875
2008 Ice/Dehumidifier $448,000Point-of-Sale System $514,000
2009 Roof Mitigation $150,000Sound System Upgrade $1,107,000Outdoor Marquees $2,492,000
2010 Den of Honor $287,300Public Artwork $85,700
2011 LED Equipment $1,400,000Cooling Tower Improvements $790,000
2012 Club Red, Suite Level and Loge Improvements $7,744,900Pantherland $494,315
2013 Scoreboard and Control Room $4,127,5472014 None Reported $02015 Budgeted $972,000
Unspecified Projects $3,431,265
Total Capital Investment $28,550,047Average Annual Capital Investment Entire Period $2,196,157Average Annual Capital Investment 2010-2015 Budgeted - (1) $2,650,294
(1) - Excluding "Unspecified Projects".Source: Broward County.
Page 31
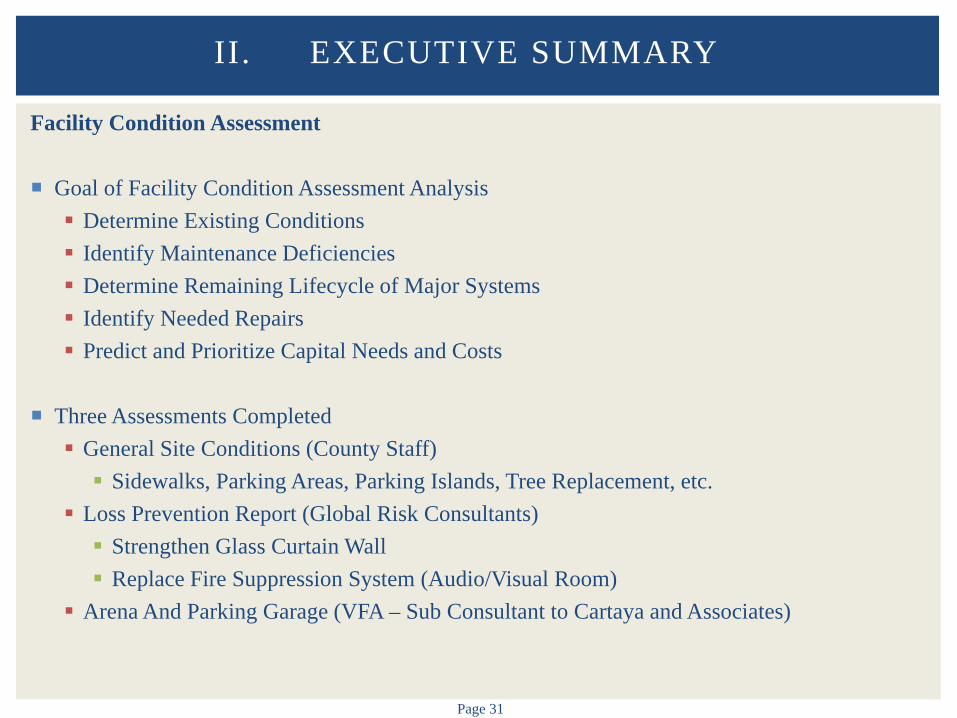
Facility Condition Assessment Goal of Facility Condition Assessment Analysis Determine Existing Conditions Identify Maintenance Deficiencies Determine Remaining Lifecycle of Major Systems Identify Needed Repairs Predict and Prioritize Capital Needs and Costs
Three Assessments Completed General Site Conditions (County Staff) Sidewalks, Parking Areas, Parking Islands, Tree Replacement, etc.
Loss Prevention Report (Global Risk Consultants) Strengthen Glass Curtain Wall Replace Fire Suppression System (Audio/Visual Room)
Arena And Parking Garage (VFA – Sub Consultant to Cartaya and Associates)
II. EXECUTIVE SUMMARY

Page 32
Facility Condition Assessment (Continued) Overall Current Condition Rated “Good To Fair”
Risk of Decline to “Poor” Within Next Five (5) Years Without Significant Capital Investment
Risk/Exposure Next Five (5) Years Estimated at a Total of $33.9 Million (NPV) / $6.8 Million
Annually Total Annual Replacements (Operationally Critical/Failures) $13.3 Million $2.7 Million Renovations, Renewal, and Requests $20.6 Million $4.1 Million
Risk/Exposure Through 2028 Estimated at a Total of $137.5 Million (NPV) / $10.6 Million Annually
Total Annual Replacements (Operationally Critical/Failures) $51.0 Million $3.9 Million Renovations, Renewal, and Requests $83.5 Million $6.4 Million Site Conditions $3.0 Million $0.2 Million
Peak Years for Risk/Exposure Occur in 2017, 2022, and 2027
Note: Findings/Conclusions Provided by County
II. EXECUTIVE SUMMARY
Page 33
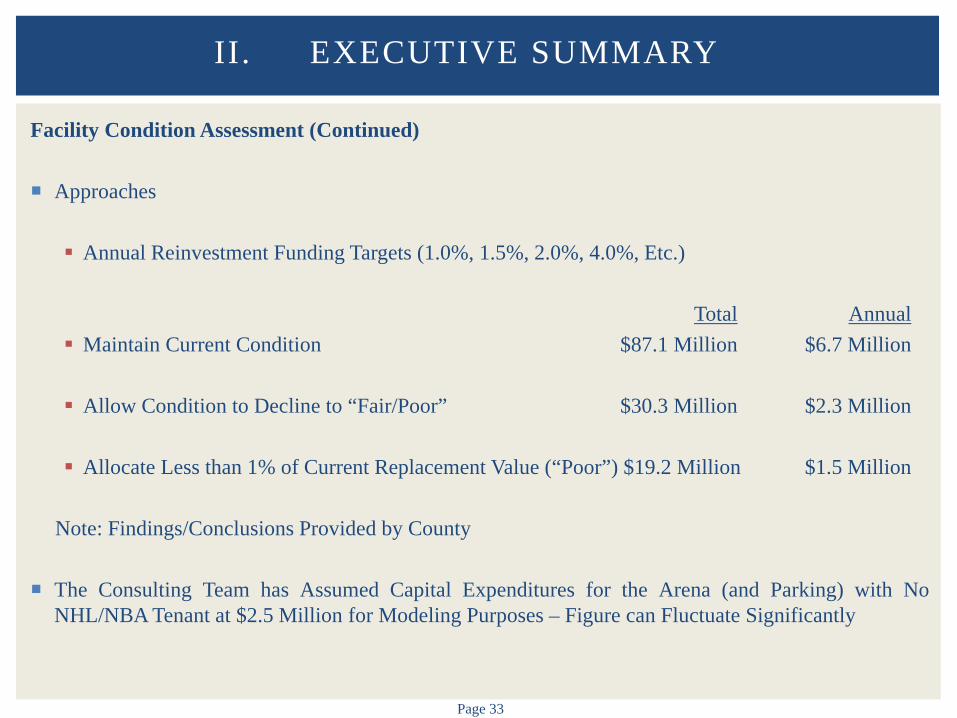
Facility Condition Assessment (Continued) Approaches
Annual Reinvestment Funding Targets (1.0%, 1.5%, 2.0%, 4.0%, Etc.)
Total Annual Maintain Current Condition $87.1 Million $6.7 Million Allow Condition to Decline to “Fair/Poor” $30.3 Million $2.3 Million
Allocate Less than 1% of Current Replacement Value (“Poor”) $19.2 Million $1.5 Million
Note: Findings/Conclusions Provided by County
The Consulting Team has Assumed Capital Expenditures for the Arena (and Parking) with No
NHL/NBA Tenant at $2.5 Million for Modeling Purposes – Figure can Fluctuate Significantly
II. EXECUTIVE SUMMARY

Page 34
Economic Impact Analysis – Overview
Operation of the BB&T Center Generates Economic and Fiscal Impacts in the County
Economic Impacts Typically Measured by
Direct Spending (Initial Spending) Indirect Spending (Dollars Spent through Interaction of Local Industries) Induced Spending (Dollars Spent through Household Spending Patterns) Tax Impacts Employment Impacts Labor Income Impacts
Findings Included Herein Reflect Evaluation of Gross Economic and Fiscal Impacts to be Generated
by BB&T Center Excluding the Operations and Resulting Impacts Generated by the Panthers
Although Assumptions Appear Reasonable Based on Current and Anticipated Market Conditions, Actual Results Depend on Actions of Arena, Management, Tenants, and Other Factors Both Internal and External to Project, which Frequently Vary
It is Important to Note that Because Events and Circumstances May Not Occur as Expected, there May be Significant Differences Between Actual Results and those Estimated in this Analysis, and those Differences May Be Material
II. EXECUTIVE SUMMARY
Page 35
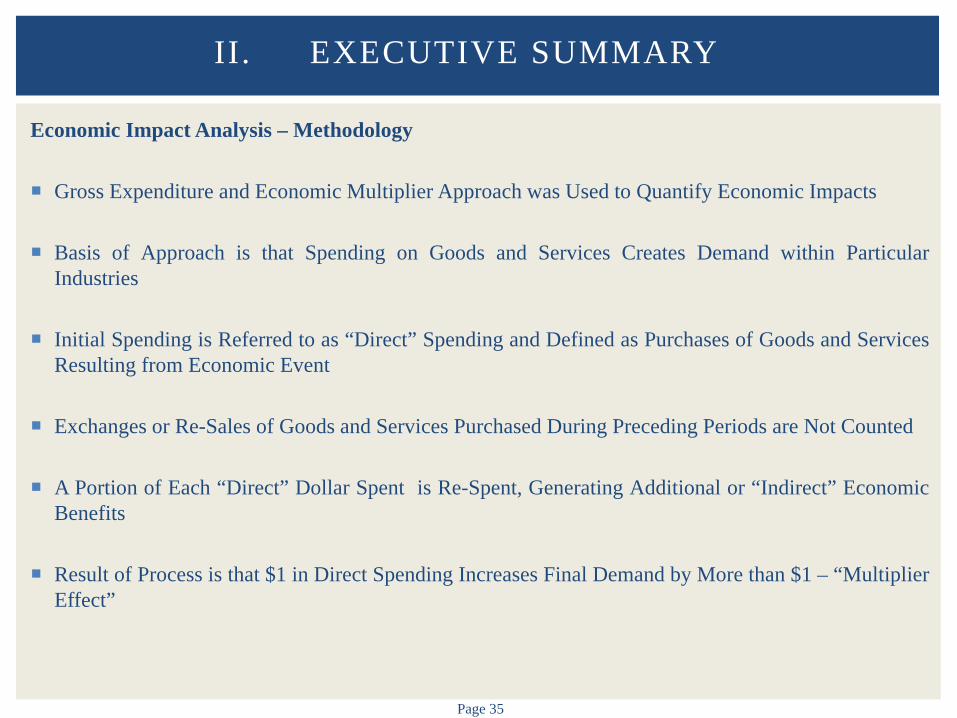
Economic Impact Analysis – Methodology
Gross Expenditure and Economic Multiplier Approach was Used to Quantify Economic Impacts
Basis of Approach is that Spending on Goods and Services Creates Demand within Particular Industries
Initial Spending is Referred to as “Direct” Spending and Defined as Purchases of Goods and Services Resulting from Economic Event
Exchanges or Re-Sales of Goods and Services Purchased During Preceding Periods are Not Counted
A Portion of Each “Direct” Dollar Spent is Re-Spent, Generating Additional or “Indirect” Economic Benefits
Result of Process is that $1 in Direct Spending Increases Final Demand by More than $1 – “Multiplier Effect”
II. EXECUTIVE SUMMARY
Page 36
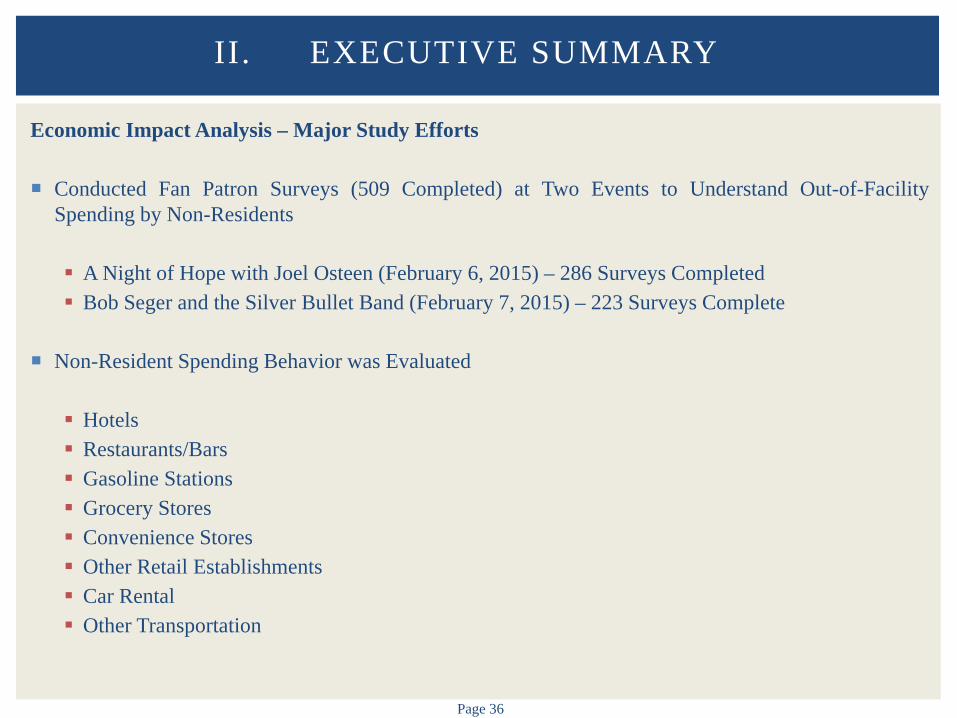
Economic Impact Analysis – Major Study Efforts
Conducted Fan Patron Surveys (509 Completed) at Two Events to Understand Out-of-Facility Spending by Non-Residents A Night of Hope with Joel Osteen (February 6, 2015) – 286 Surveys Completed Bob Seger and the Silver Bullet Band (February 7, 2015) – 223 Surveys Complete
Non-Resident Spending Behavior was Evaluated
Hotels Restaurants/Bars Gasoline Stations Grocery Stores Convenience Stores Other Retail Establishments Car Rental Other Transportation
II. EXECUTIVE SUMMARY
Page 37
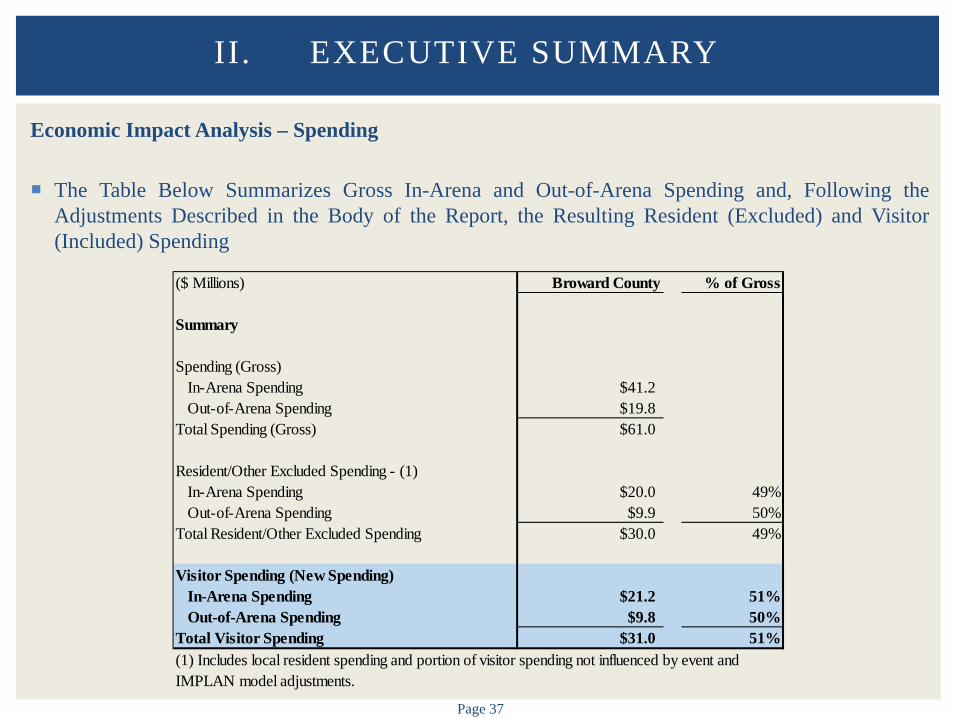
Economic Impact Analysis – Spending The Table Below Summarizes Gross In-Arena and Out-of-Arena Spending and, Following the
Adjustments Described in the Body of the Report, the Resulting Resident (Excluded) and Visitor (Included) Spending
II. EXECUTIVE SUMMARY
($ Millions) Broward County % of Gross
Summary
Spending (Gross)In-Arena Spending $41.2Out-of-Arena Spending $19.8
Total Spending (Gross) $61.0
Resident/Other Excluded Spending - (1)In-Arena Spending $20.0 49%Out-of-Arena Spending $9.9 50%
Total Resident/Other Excluded Spending $30.0 49%
Visitor Spending (New Spending)In-Arena Spending $21.2 51%Out-of-Arena Spending $9.8 50%
Total Visitor Spending $31.0 51%(1) Includes local resident spending and portion of visitor spending not influenced by event and IMPLAN model adjustments.
Page 38
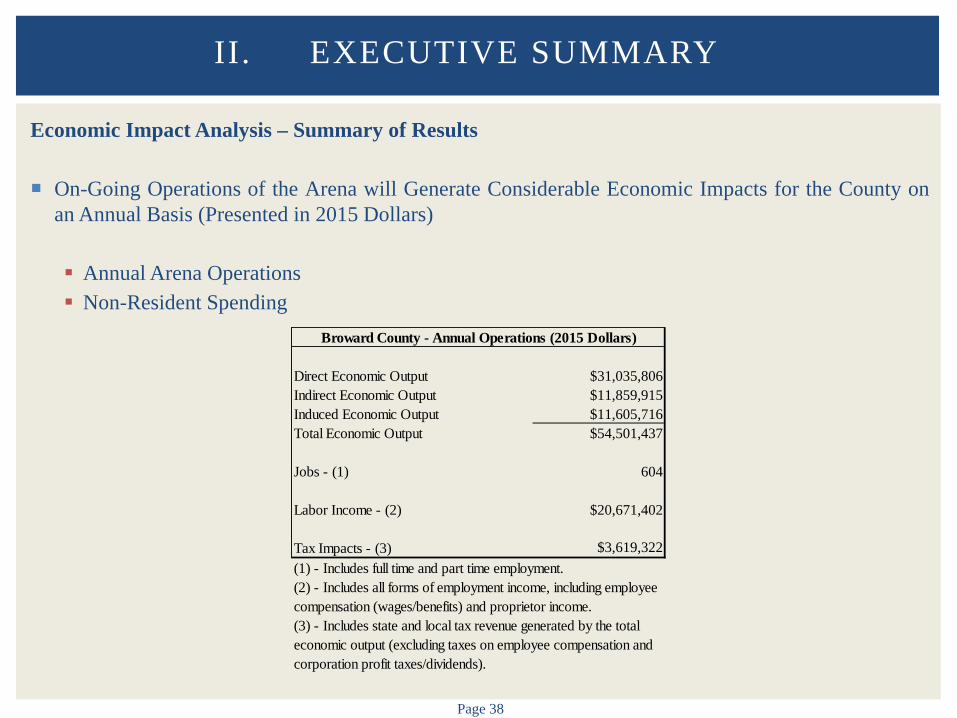
Economic Impact Analysis – Summary of Results
On-Going Operations of the Arena will Generate Considerable Economic Impacts for the County on an Annual Basis (Presented in 2015 Dollars)
Annual Arena Operations Non-Resident Spending
II. EXECUTIVE SUMMARY
Direct Economic Output $31,035,806Indirect Economic Output $11,859,915Induced Economic Output $11,605,716Total Economic Output $54,501,437
Jobs - (1) 604
Labor Income - (2) $20,671,402
Tax Impacts - (3) $3,619,322 (1) - Includes full time and part time employment.(2) - Includes all forms of employment income, including employee compensation (wages/benefits) and proprietor income.(3) - Includes state and local tax revenue generated by the total economic output (excluding taxes on employee compensation and corporation profit taxes/dividends).
Broward County - Annual Operations (2015 Dollars)
Page 39
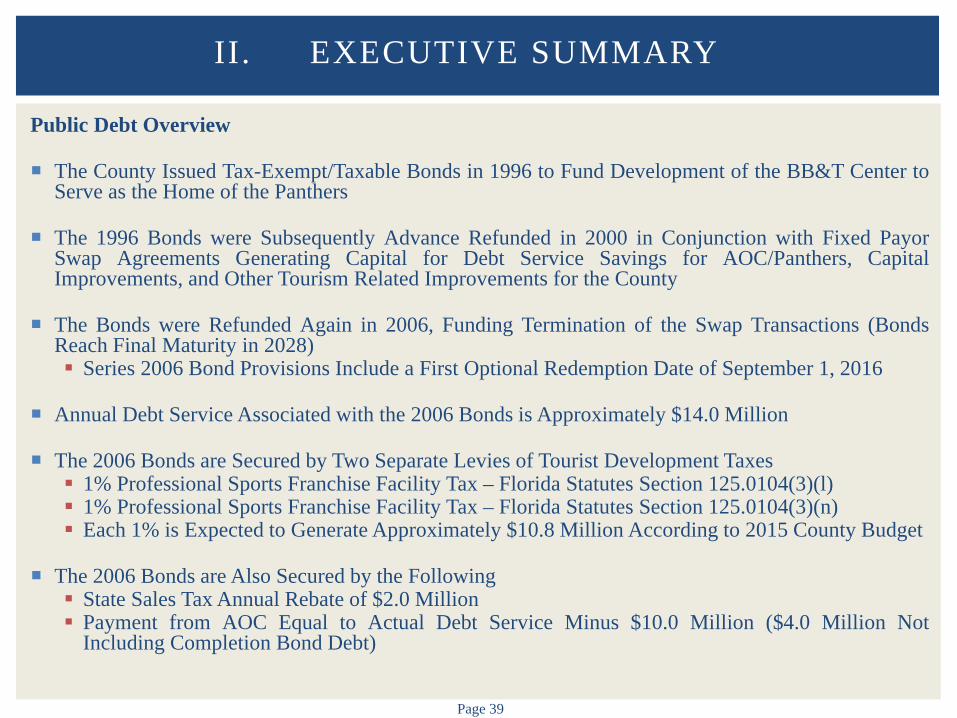
Public Debt Overview The County Issued Tax-Exempt/Taxable Bonds in 1996 to Fund Development of the BB&T Center to
Serve as the Home of the Panthers
The 1996 Bonds were Subsequently Advance Refunded in 2000 in Conjunction with Fixed Payor Swap Agreements Generating Capital for Debt Service Savings for AOC/Panthers, Capital Improvements, and Other Tourism Related Improvements for the County
The Bonds were Refunded Again in 2006, Funding Termination of the Swap Transactions (Bonds Reach Final Maturity in 2028) Series 2006 Bond Provisions Include a First Optional Redemption Date of September 1, 2016
Annual Debt Service Associated with the 2006 Bonds is Approximately $14.0 Million The 2006 Bonds are Secured by Two Separate Levies of Tourist Development Taxes 1% Professional Sports Franchise Facility Tax – Florida Statutes Section 125.0104(3)(l) 1% Professional Sports Franchise Facility Tax – Florida Statutes Section 125.0104(3)(n) Each 1% is Expected to Generate Approximately $10.8 Million According to 2015 County Budget
The 2006 Bonds are Also Secured by the Following State Sales Tax Annual Rebate of $2.0 Million Payment from AOC Equal to Actual Debt Service Minus $10.0 Million ($4.0 Million Not
Including Completion Bond Debt)
II . EXECUTIVE SUMMARY
Page 40
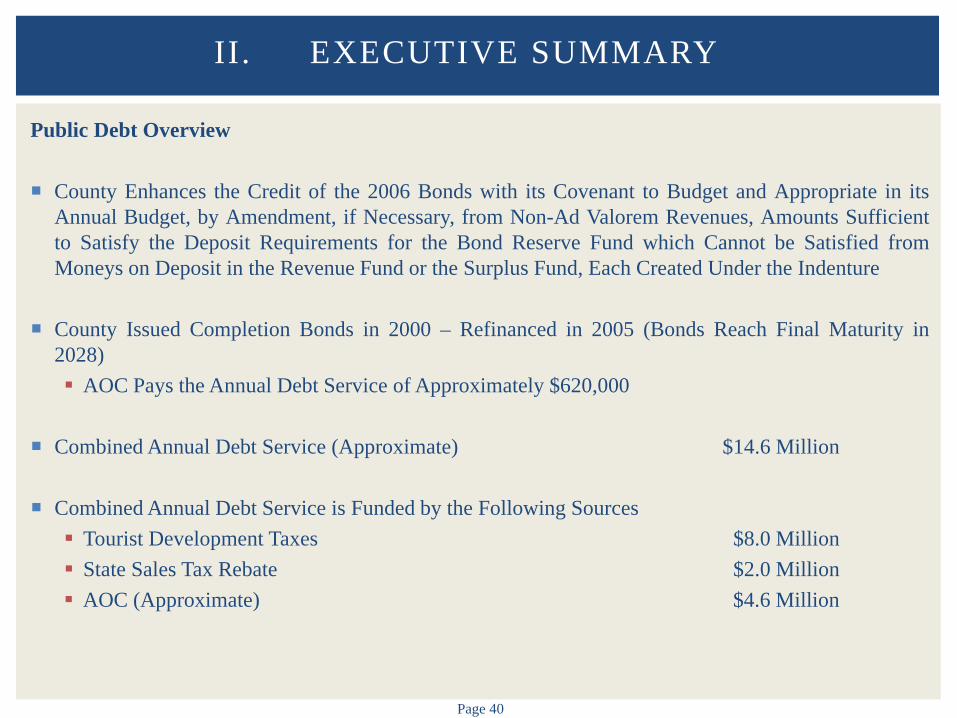
Public Debt Overview County Enhances the Credit of the 2006 Bonds with its Covenant to Budget and Appropriate in its
Annual Budget, by Amendment, if Necessary, from Non-Ad Valorem Revenues, Amounts Sufficient to Satisfy the Deposit Requirements for the Bond Reserve Fund which Cannot be Satisfied from Moneys on Deposit in the Revenue Fund or the Surplus Fund, Each Created Under the Indenture
County Issued Completion Bonds in 2000 – Refinanced in 2005 (Bonds Reach Final Maturity in
2028) AOC Pays the Annual Debt Service of Approximately $620,000
Combined Annual Debt Service (Approximate) $14.6 Million
Combined Annual Debt Service is Funded by the Following Sources Tourist Development Taxes $8.0 Million State Sales Tax Rebate $2.0 Million AOC (Approximate) $4.6 Million
II. EXECUTIVE SUMMARY
Page 41
Governmental Fund Impact – Summary
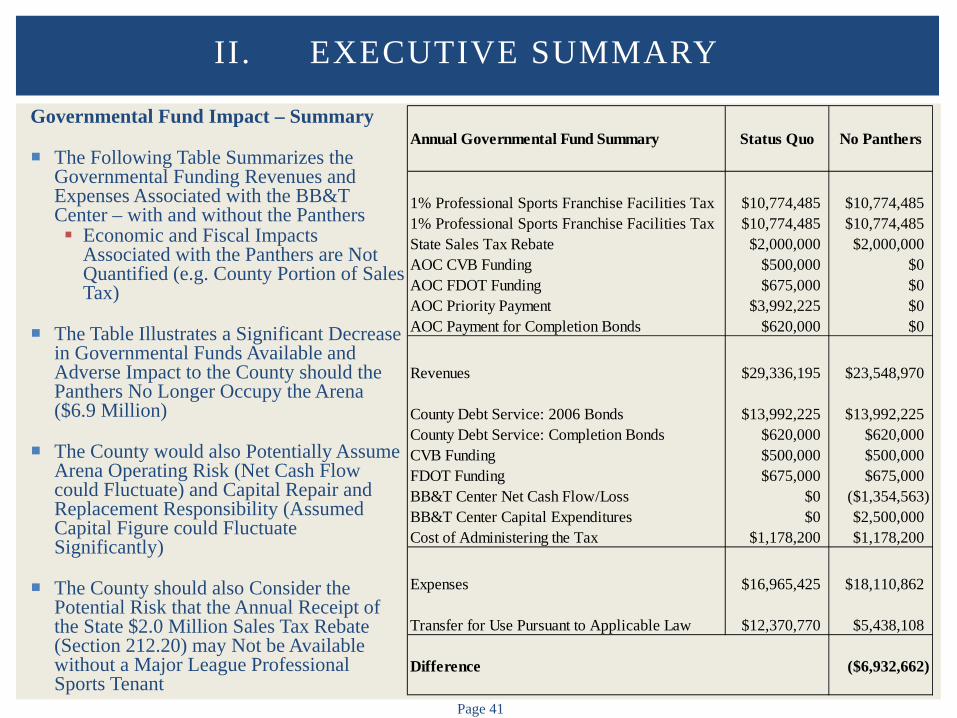
The Following Table Summarizes the Governmental Funding Revenues and Expenses Associated with the BB&T Center – with and without the Panthers Economic and Fiscal Impacts
Associated with the Panthers are Not Quantified (e.g. County Portion of Sales Tax)
The Table Illustrates a Significant Decrease in Governmental Funds Available and Adverse Impact to the County should the Panthers No Longer Occupy the Arena ($6.9 Million)
The County would also Potentially Assume Arena Operating Risk (Net Cash Flow could Fluctuate) and Capital Repair and Replacement Responsibility (Assumed Capital Figure could Fluctuate Significantly)
The County should also Consider the Potential Risk that the Annual Receipt of the State $2.0 Million Sales Tax Rebate (Section 212.20) may Not be Available without a Major League Professional Sports Tenant
II. EXECUTIVE SUMMARY
Annual Governmental Fund Summary Status Quo No Panthers
1% Professional Sports Franchise Facilities Tax $10,774,485 $10,774,4851% Professional Sports Franchise Facilities Tax $10,774,485 $10,774,485State Sales Tax Rebate $2,000,000 $2,000,000AOC CVB Funding $500,000 $0AOC FDOT Funding $675,000 $0AOC Priority Payment $3,992,225 $0AOC Payment for Completion Bonds $620,000 $0
Revenues $29,336,195 $23,548,970
County Debt Service: 2006 Bonds $13,992,225 $13,992,225County Debt Service: Completion Bonds $620,000 $620,000CVB Funding $500,000 $500,000FDOT Funding $675,000 $675,000BB&T Center Net Cash Flow/Loss $0 ($1,354,563)BB&T Center Capital Expenditures $0 $2,500,000Cost of Administering the Tax $1,178,200 $1,178,200
Expenses $16,965,425 $18,110,862
Transfer for Use Pursuant to Applicable Law $12,370,770 $5,438,108
Difference ($6,932,662)
Page 42
Potential Funding Sources
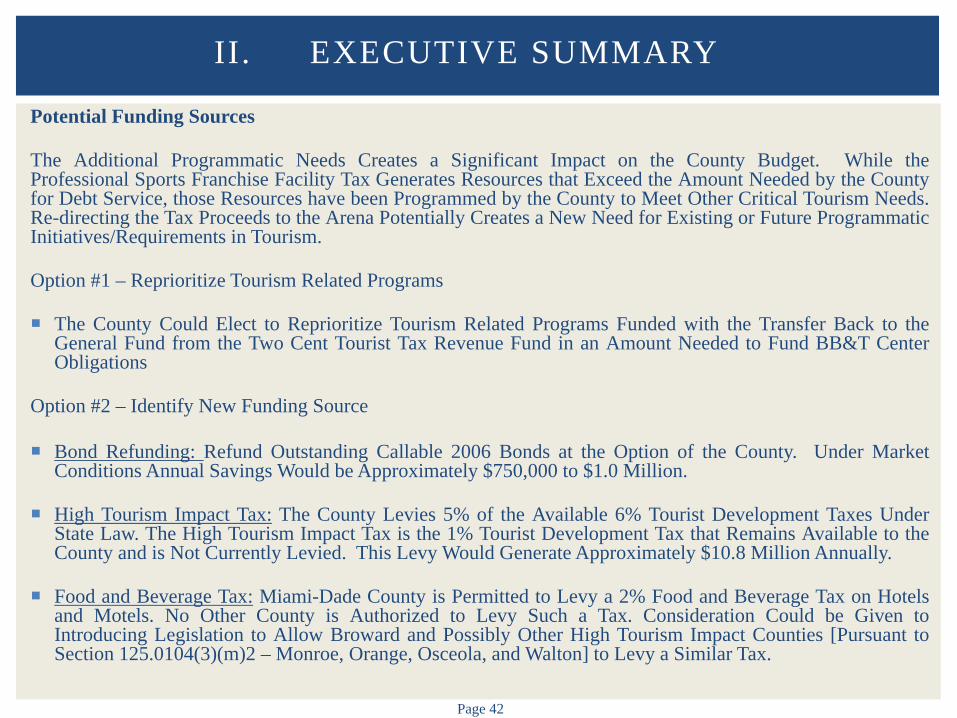
The Additional Programmatic Needs Creates a Significant Impact on the County Budget. While the Professional Sports Franchise Facility Tax Generates Resources that Exceed the Amount Needed by the County for Debt Service, those Resources have been Programmed by the County to Meet Other Critical Tourism Needs. Re-directing the Tax Proceeds to the Arena Potentially Creates a New Need for Existing or Future Programmatic Initiatives/Requirements in Tourism. Option #1 – Reprioritize Tourism Related Programs The County Could Elect to Reprioritize Tourism Related Programs Funded with the Transfer Back to the
General Fund from the Two Cent Tourist Tax Revenue Fund in an Amount Needed to Fund BB&T Center Obligations
Option #2 – Identify New Funding Source
Bond Refunding: Refund Outstanding Callable 2006 Bonds at the Option of the County. Under Market Conditions Annual Savings Would be Approximately $750,000 to $1.0 Million.
High Tourism Impact Tax: The County Levies 5% of the Available 6% Tourist Development Taxes Under
State Law. The High Tourism Impact Tax is the 1% Tourist Development Tax that Remains Available to the County and is Not Currently Levied. This Levy Would Generate Approximately $10.8 Million Annually.
Food and Beverage Tax: Miami-Dade County is Permitted to Levy a 2% Food and Beverage Tax on Hotels
and Motels. No Other County is Authorized to Levy Such a Tax. Consideration Could be Given to Introducing Legislation to Allow Broward and Possibly Other High Tourism Impact Counties [Pursuant to Section 125.0104(3)(m)2 – Monroe, Orange, Osceola, and Walton] to Levy a Similar Tax.
II. EXECUTIVE SUMMARY

Page 43
Potential Funding Sources
Other Options/Considerations Insurance Savings – The BB&T Center Insurance Expense is High Relative to the Comparable Arenas
We Evaluated. While We have Considered the Potential Benefit that the County, as an Owner/Operator, May Be Able to Realize by Including the Arena in its Broader Insurance Program, We Understand that the County has Previously Explored Such an Arrangement and has Indicated that the Insurance Expense Could Potentially be Higher Under Such an Arrangement.
Debt Relief – Bonds Associated with the BB&T Center Expire in 2028. As a Result, the County will be Relieved of Approximately $14.6 Million in Annual Debt Service. The County Should Explore the Viability of Utilizing the Savings to Fund Arena Capital Repairs and Maintenance and Consider a Deferred Maintenance Program (or Provide Internal Loans with the Savings as a Future Repayment Source). County Could Also Consider Issuing Debt at that Time to Fund a Major Renovation, as Necessary.
Site Redevelopment Opportunities – The County Could Consider Issuing an RFP for Redevelopment of a Portion (or the Entire Site Without Arena) Similar to Nassau County’s Approach – See Case Study Provided Herein. Project Would Generate Incremental Revenues to the County, Including: Property Tax (5.723 Mills) Hotel Tax (5.0%) Sales Tax (0.5%) Land Sale/Lease Revenue
II. EXECUTIVE SUMMARY

Page 44
Potential Funding Sources
Other Options/Considerations Close Arena/Demolish Arena – The County Could Consider Closing or Demolishing the Arena.
While the Outstanding Debt Would Still Need to be Retired, the County Would Not Incur Operating Expenses or Capital Repairs/Replacement Expenses on an Annual Basis.
We have Considered, But have Not Focused on, Funding Sources that have Been Utilized in Other Parts of the Country Because the Sources are Not Available Under Current Law or Do Not Generate Sufficient Funds as a Stand-Alone Source (e.g. Admissions Tax/Car Rental Tax/Parking Tax/Etc.)
II. EXECUTIVE SUMMARY

Page 45
Other Considerations: Management Options – Overview Most Arenas Operate Under One of Three Scenarios Tenant-Operator: Current BB&T Center Model Public Owner-Operator: Public Sector Owner Operates Facility Third Party Operator: Professional Operator Manages Facility on Behalf of Tenant and/or Owner
Private Management Advantages (vs. Public Sector) Experienced Staff Offer More Efficient Management/Operations/Oversight/On-Site Assistance Reduction on Impact on Other Public Sector Departments Event Booking Leverage Marketing and Group Sales Support Ability to More Efficiently Negotiate Labor Agreements and Other Material Contracts/Leases More Efficient Procurement Process for Goods and Services Access to and Relationships with Sports and Entertainment Industry Contacts Information Sharing and Access to Industry Database and Research within the Organization Private Management Companies Generally More Focused on Bottom Line Performance Based Compensation Opportunities Ability to Take Risks Ability to Invest in Facility Faster Reaction Time to Opportunities and Challenges
II. EXECUTIVE SUMMARY
Page 46
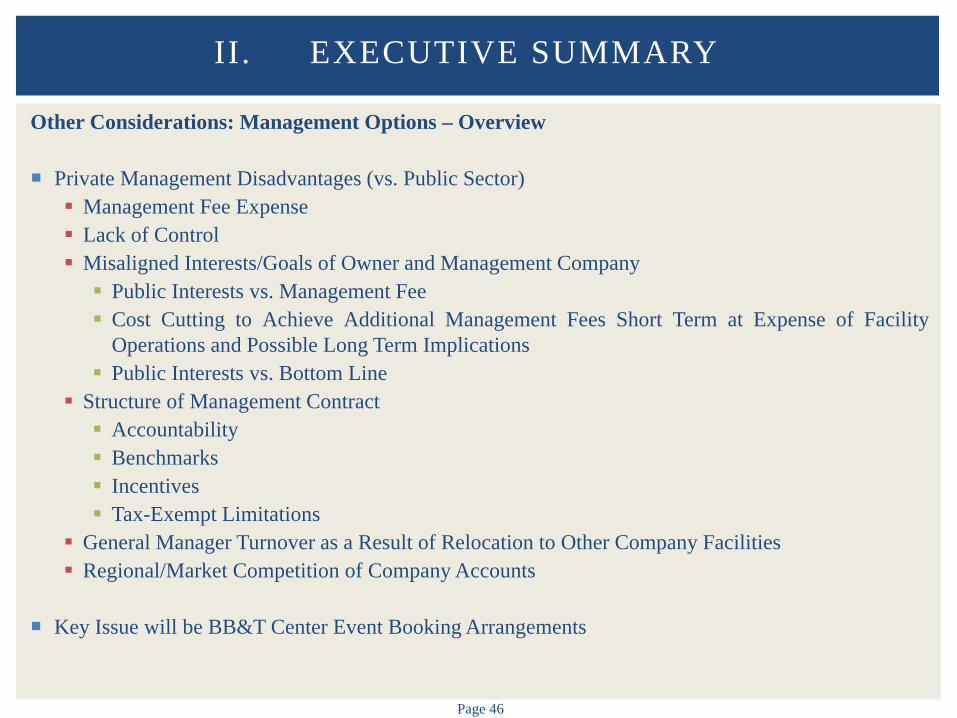
Other Considerations: Management Options – Overview Private Management Disadvantages (vs. Public Sector) Management Fee Expense Lack of Control Misaligned Interests/Goals of Owner and Management Company Public Interests vs. Management Fee Cost Cutting to Achieve Additional Management Fees Short Term at Expense of Facility
Operations and Possible Long Term Implications Public Interests vs. Bottom Line
Structure of Management Contract Accountability Benchmarks Incentives Tax-Exempt Limitations
General Manager Turnover as a Result of Relocation to Other Company Facilities Regional/Market Competition of Company Accounts
Key Issue will be BB&T Center Event Booking Arrangements
II. EXECUTIVE SUMMARY

Page 47
Other Considerations: Management Options – Interview Summary The Consulting Team Attempted to Contact the Three Major National Arena Management Firms AEG Global Spectrum (as of June 2015, Global Spectrum is now known as Spectra) SMG
The Consulting Team Spoke with Two Major National Operators of Arenas, Both with a Cursory Knowledge
of the BB&T Center, and a Strong Knowledge of the Regional Market
Both Operators Expressed an Interest in Operating the Arena Should the Opportunity Arise and Under the Right Circumstances – We Would Expect All Three Would Ultimately be Interested
Both Operators Acknowledged Miami Regional Market is Very Competitive BB&T Center Should be Able to Generate an Operating Profit Even Without the Panthers Managing and Keeping Fixed Costs Low will be Key Driver of Profitability
A Willingness to Explore Non-Traditional Operator/Owner Arrangements
One Operator Commented that Given the NHL Track Record in the Market and the Multitude of Live Sports Options in the Market, a Minor League Hockey Tenant May Face Significant Challenges
One Operator Suggested that it May Be Difficult to Improve Financial Results Materially if Third Party Management Firm were to Simply Replace AOC and Manage the Arena with the Panthers as a Tenant (Notwithstanding the Operator’s Desire to Operate the Arena Regardless)
II. EXECUTIVE SUMMARY
Page 48
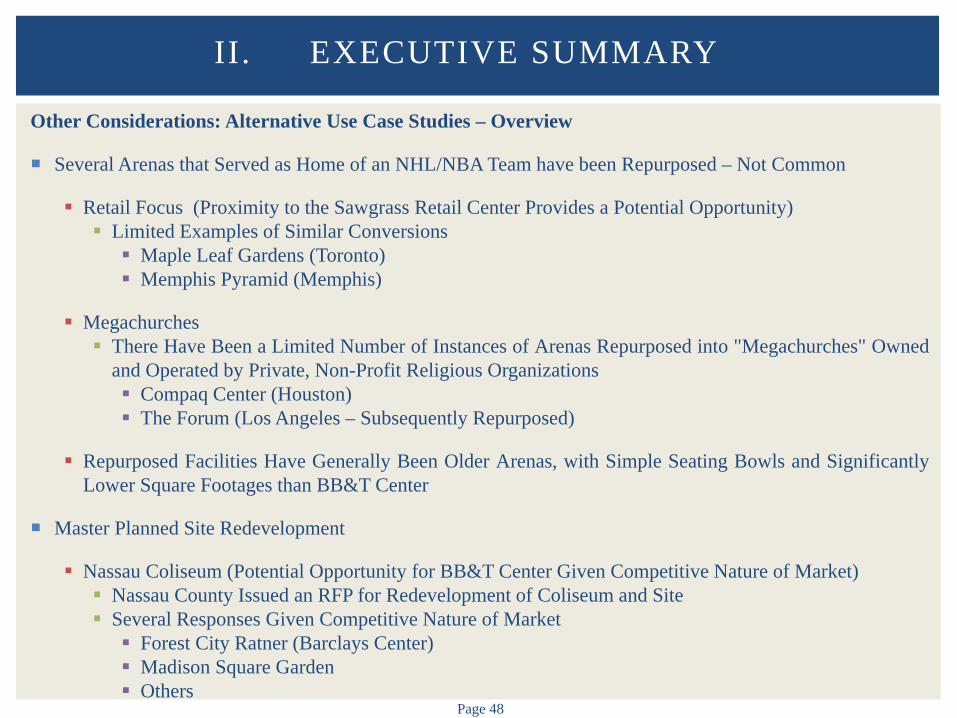
Other Considerations: Alternative Use Case Studies – Overview Several Arenas that Served as Home of an NHL/NBA Team have been Repurposed – Not Common
Retail Focus (Proximity to the Sawgrass Retail Center Provides a Potential Opportunity) Limited Examples of Similar Conversions Maple Leaf Gardens (Toronto) Memphis Pyramid (Memphis)
Megachurches There Have Been a Limited Number of Instances of Arenas Repurposed into "Megachurches" Owned
and Operated by Private, Non-Profit Religious Organizations Compaq Center (Houston) The Forum (Los Angeles – Subsequently Repurposed)
Repurposed Facilities Have Generally Been Older Arenas, with Simple Seating Bowls and Significantly
Lower Square Footages than BB&T Center
Master Planned Site Redevelopment Nassau Coliseum (Potential Opportunity for BB&T Center Given Competitive Nature of Market) Nassau County Issued an RFP for Redevelopment of Coliseum and Site Several Responses Given Competitive Nature of Market Forest City Ratner (Barclays Center) Madison Square Garden Others
II. EXECUTIVE SUMMARY
Page 49
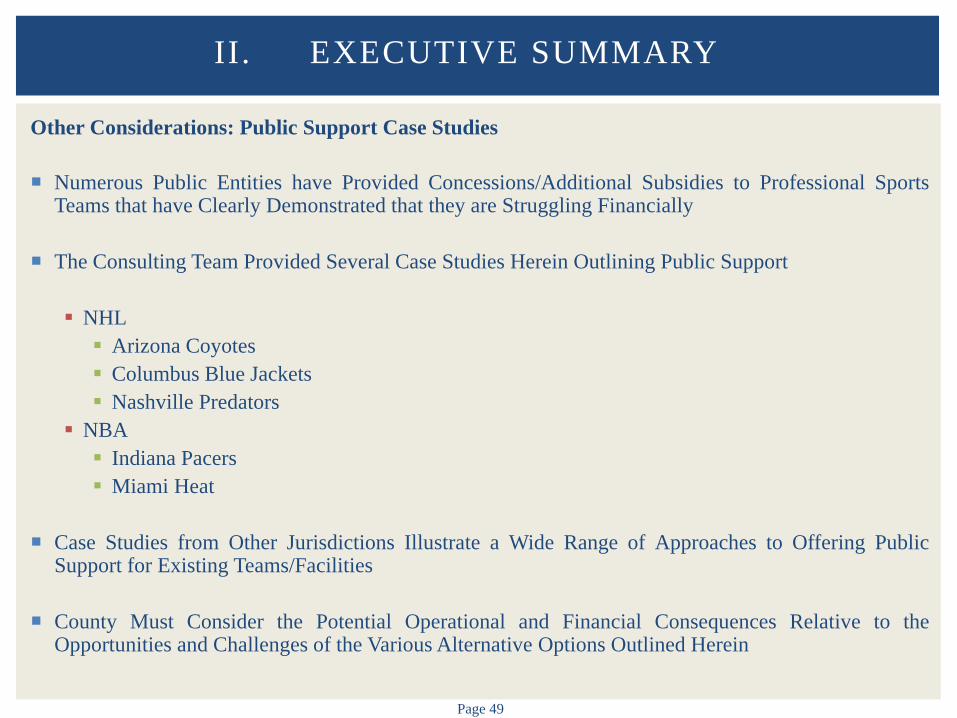
Other Considerations: Public Support Case Studies Numerous Public Entities have Provided Concessions/Additional Subsidies to Professional Sports
Teams that have Clearly Demonstrated that they are Struggling Financially
The Consulting Team Provided Several Case Studies Herein Outlining Public Support NHL Arizona Coyotes Columbus Blue Jackets Nashville Predators
NBA Indiana Pacers Miami Heat
Case Studies from Other Jurisdictions Illustrate a Wide Range of Approaches to Offering Public
Support for Existing Teams/Facilities
County Must Consider the Potential Operational and Financial Consequences Relative to the Opportunities and Challenges of the Various Alternative Options Outlined Herein
II. EXECUTIVE SUMMARY
III. BB&T CENTER OVERVIEW
Page 51
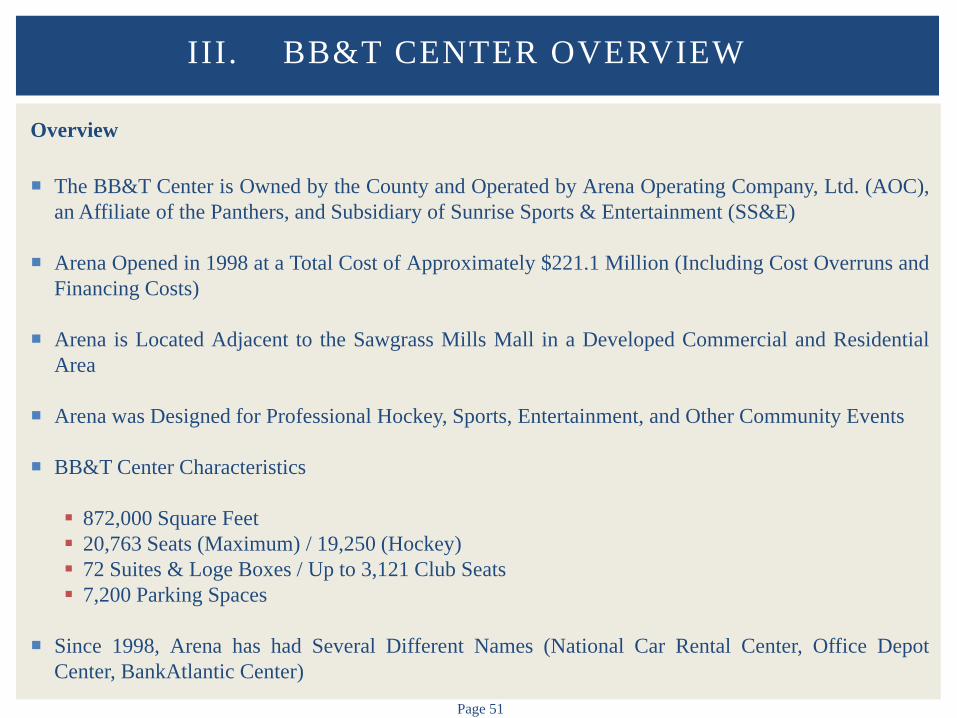
Overview
The BB&T Center is Owned by the County and Operated by Arena Operating Company, Ltd. (AOC), an Affiliate of the Panthers, and Subsidiary of Sunrise Sports & Entertainment (SS&E)
Arena Opened in 1998 at a Total Cost of Approximately $221.1 Million (Including Cost Overruns and Financing Costs)
Arena is Located Adjacent to the Sawgrass Mills Mall in a Developed Commercial and Residential Area
Arena was Designed for Professional Hockey, Sports, Entertainment, and Other Community Events
BB&T Center Characteristics
872,000 Square Feet 20,763 Seats (Maximum) / 19,250 (Hockey) 72 Suites & Loge Boxes / Up to 3,121 Club Seats 7,200 Parking Spaces
Since 1998, Arena has had Several Different Names (National Car Rental Center, Office Depot
Center, BankAtlantic Center)
III. BB&T CENTER OVERVIEW
Page 52
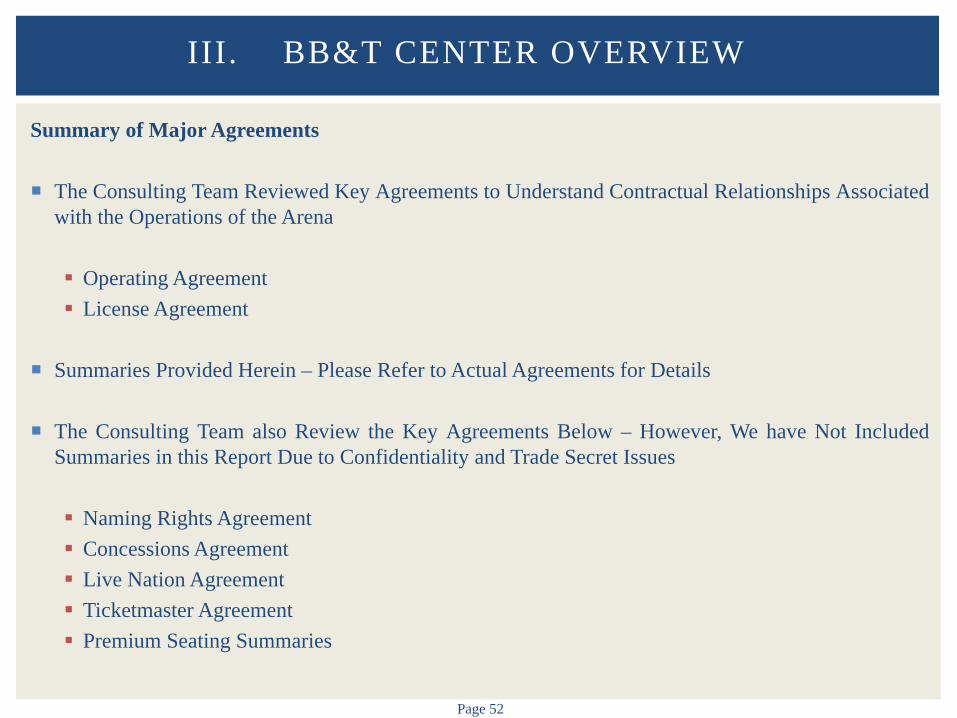
Summary of Major Agreements
The Consulting Team Reviewed Key Agreements to Understand Contractual Relationships Associated with the Operations of the Arena Operating Agreement License Agreement
Summaries Provided Herein – Please Refer to Actual Agreements for Details
The Consulting Team also Review the Key Agreements Below – However, We have Not Included
Summaries in this Report Due to Confidentiality and Trade Secret Issues
Naming Rights Agreement Concessions Agreement Live Nation Agreement Ticketmaster Agreement Premium Seating Summaries
III. BB&T CENTER OVERVIEW
Page 53
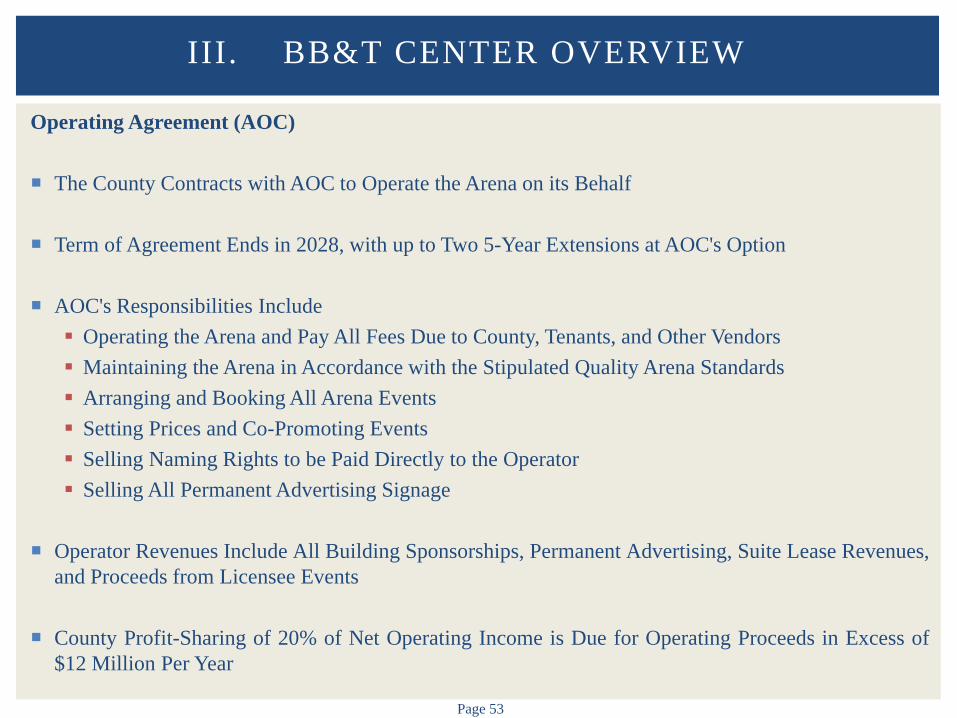
Operating Agreement (AOC)
The County Contracts with AOC to Operate the Arena on its Behalf
Term of Agreement Ends in 2028, with up to Two 5-Year Extensions at AOC's Option
AOC's Responsibilities Include Operating the Arena and Pay All Fees Due to County, Tenants, and Other Vendors Maintaining the Arena in Accordance with the Stipulated Quality Arena Standards Arranging and Booking All Arena Events Setting Prices and Co-Promoting Events Selling Naming Rights to be Paid Directly to the Operator Selling All Permanent Advertising Signage
Operator Revenues Include All Building Sponsorships, Permanent Advertising, Suite Lease Revenues,
and Proceeds from Licensee Events
County Profit-Sharing of 20% of Net Operating Income is Due for Operating Proceeds in Excess of $12 Million Per Year
III. BB&T CENTER OVERVIEW
Page 54
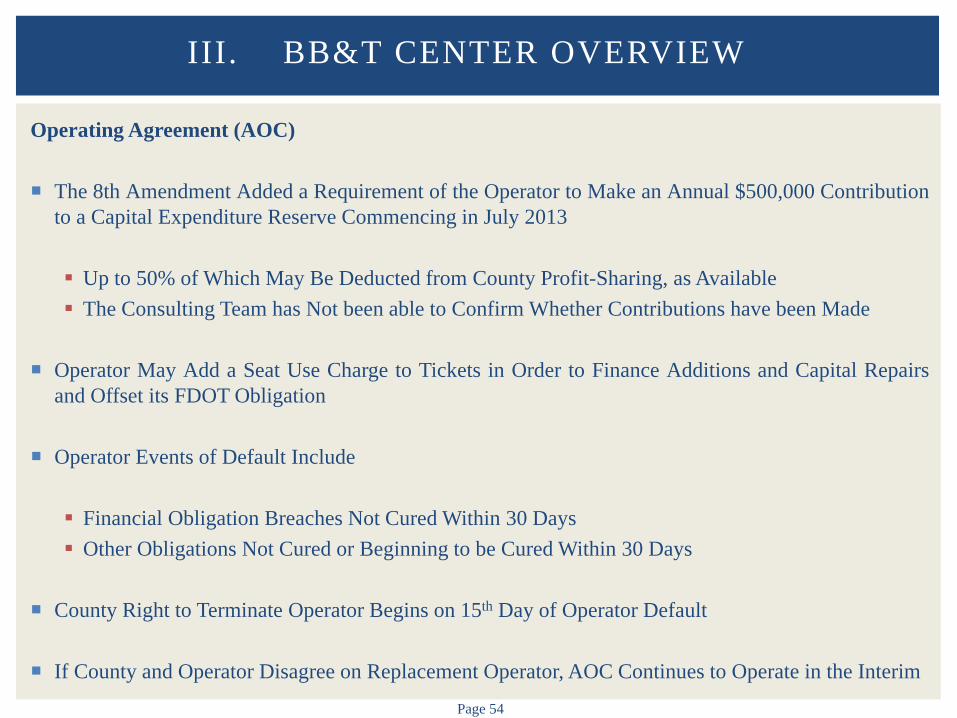
Operating Agreement (AOC) The 8th Amendment Added a Requirement of the Operator to Make an Annual $500,000 Contribution
to a Capital Expenditure Reserve Commencing in July 2013
Up to 50% of Which May Be Deducted from County Profit-Sharing, as Available The Consulting Team has Not been able to Confirm Whether Contributions have been Made
Operator May Add a Seat Use Charge to Tickets in Order to Finance Additions and Capital Repairs
and Offset its FDOT Obligation
Operator Events of Default Include
Financial Obligation Breaches Not Cured Within 30 Days Other Obligations Not Cured or Beginning to be Cured Within 30 Days
County Right to Terminate Operator Begins on 15th Day of Operator Default
If County and Operator Disagree on Replacement Operator, AOC Continues to Operate in the Interim
III. BB&T CENTER OVERVIEW
Page 55
License Agreement (Panthers)
Tri-Party Agreement Among AOC, County, and Florida Panthers Hockey Club
Term of Agreement is 30 Years from Opening (1998), with Up to Four 5-Year Extensions at the Team's Option – Initial Agreement Expires in 2028
Team Pays Base Rent to Operator of $7,500 per Game Incentive Rent, Supplemental Rent, and Inclusion of Pass-Through Expenses Can Increase Rent
Up to a Maximum of 5% of Hockey Ticket Receipts for a Year
Team Pays for Hockey Event Staffing
Through the Operator, Team Guarantees the County Preferred Revenue Allocation (CPRA) Equal to Annual Debt Service Minus $10 Million
Team Covenants to Continuously Play in Arena throughout the Term so Long as the Arena Remains in
Playable Condition Specific Performance Provisions are Included for this Covenant
III. BB&T CENTER OVERVIEW
Page 56
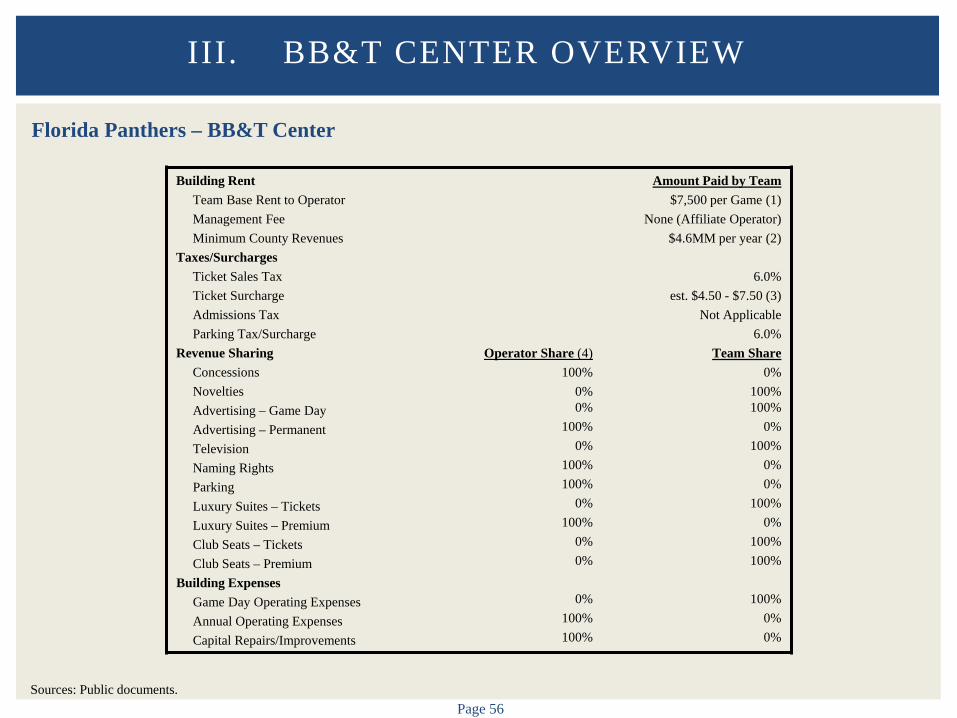
Florida Panthers – BB&T Center
III. BB&T CENTER OVERVIEW
Building Rent Team Base Rent to Operator Management Fee Minimum County Revenues Taxes/Surcharges Ticket Sales Tax Ticket Surcharge Admissions Tax Parking Tax/Surcharge Revenue Sharing Concessions Novelties Advertising – Game Day Advertising – Permanent Television Naming Rights Parking Luxury Suites – Tickets Luxury Suites – Premium Club Seats – Tickets Club Seats – Premium Building Expenses Game Day Operating Expenses Annual Operating Expenses Capital Repairs/Improvements
Operator Share (4) 100%
0% 0%
100% 0%
100% 100%
0% 100%
0% 0%
0%
100% 100%
Amount Paid by Team $7,500 per Game (1)
None (Affiliate Operator) $4.6MM per year (2)
6.0%
est. $4.50 - $7.50 (3) Not Applicable
6.0% Team Share
0% 100% 100%
0% 100%
0% 0%
100% 0%
100% 100%
100%
0% 0%
Sources: Public documents.
Page 57
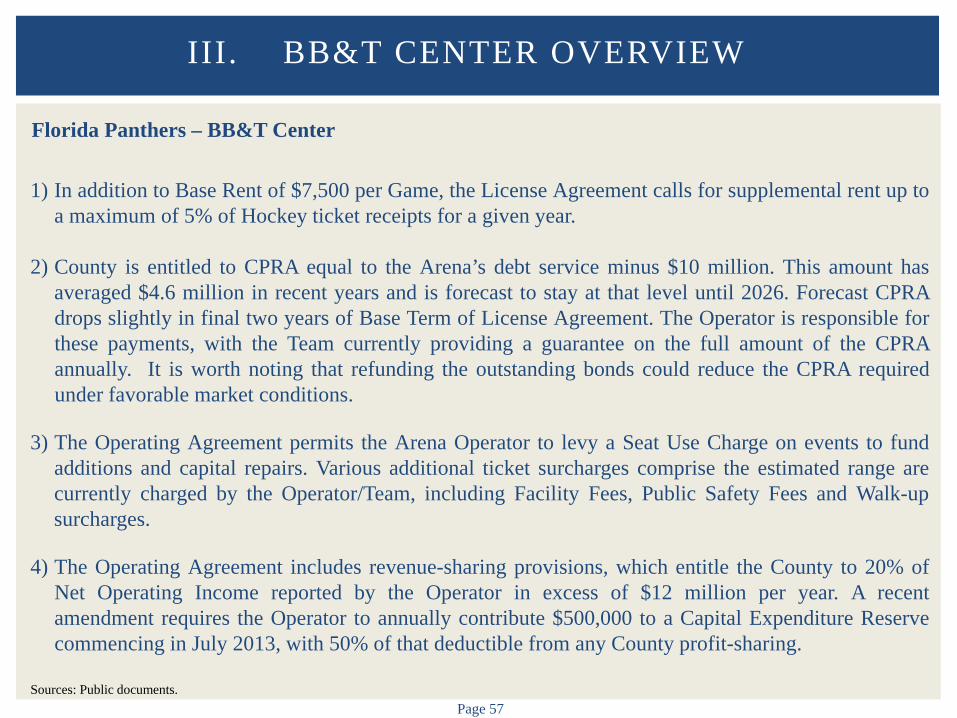
Florida Panthers – BB&T Center
1) In addition to Base Rent of $7,500 per Game, the License Agreement calls for supplemental rent up to a maximum of 5% of Hockey ticket receipts for a given year.
2) County is entitled to CPRA equal to the Arena’s debt service minus $10 million. This amount has averaged $4.6 million in recent years and is forecast to stay at that level until 2026. Forecast CPRA drops slightly in final two years of Base Term of License Agreement. The Operator is responsible for these payments, with the Team currently providing a guarantee on the full amount of the CPRA annually. It is worth noting that refunding the outstanding bonds could reduce the CPRA required under favorable market conditions.
3) The Operating Agreement permits the Arena Operator to levy a Seat Use Charge on events to fund additions and capital repairs. Various additional ticket surcharges comprise the estimated range are currently charged by the Operator/Team, including Facility Fees, Public Safety Fees and Walk-up surcharges.
4) The Operating Agreement includes revenue-sharing provisions, which entitle the County to 20% of Net Operating Income reported by the Operator in excess of $12 million per year. A recent amendment requires the Operator to annually contribute $500,000 to a Capital Expenditure Reserve commencing in July 2013, with 50% of that deductible from any County profit-sharing.
III. BB&T CENTER OVERVIEW
Sources: Public documents.
Page 58
Events / Attendance
The Consulting Team Reviewed Historical Operating Data (Events/Attendance) for the Arena as Provided by AOC and Supplemented by Pollstar Data
The Consulting Team Also Evaluated Historical Event Settlement Sheet Statements as Provided by AOC to Evaluate Additional Detail Settlement Data was Inconsistent and Incomplete – The Consulting Team has Made Adjustments
to Utilize Data
Event and Attendance Information is Provided for Illustrative Purposes Only – Information has Not been Audited by the Consulting Team or Further Verified
Reliability of Historical Event and Attendance Data is of Concern – Certain Discrepancies and Errors in Reporting/Calculations/Actual Results
Comprehensive Attendance Data Not Provided by AOC
III. BB&T CENTER OVERVIEW
Page 59
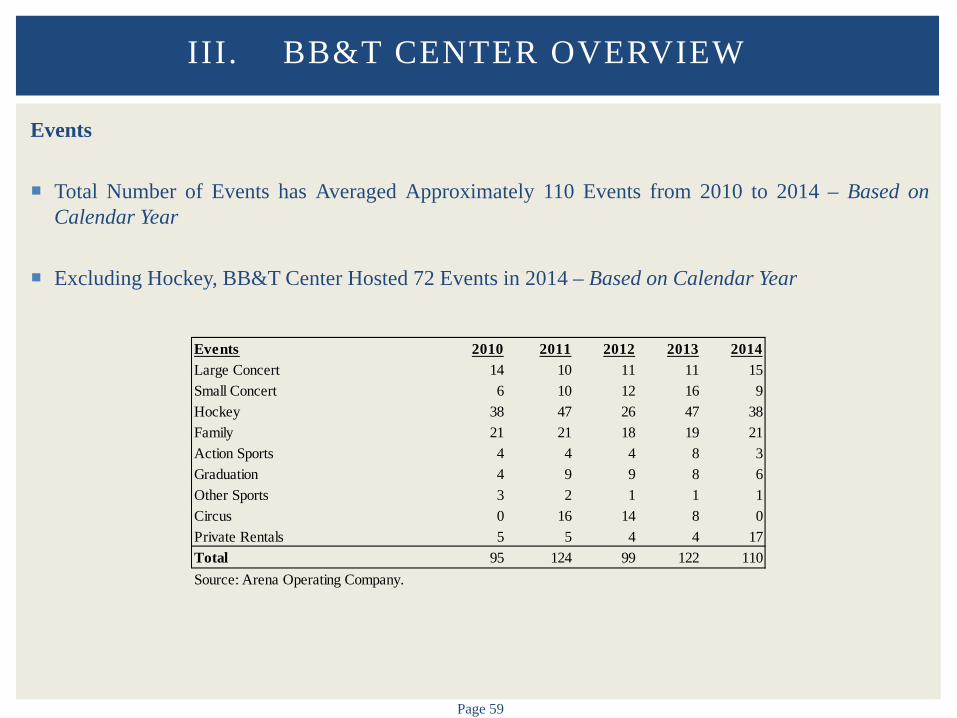
Events
Total Number of Events has Averaged Approximately 110 Events from 2010 to 2014 – Based on Calendar Year
Excluding Hockey, BB&T Center Hosted 72 Events in 2014 – Based on Calendar Year
III. BB&T CENTER OVERVIEW
Events 2010 2011 2012 2013 2014Large Concert 14 10 11 11 15Small Concert 6 10 12 16 9Hockey 38 47 26 47 38Family 21 21 18 19 21Action Sports 4 4 4 8 3Graduation 4 9 9 8 6Other Sports 3 2 1 1 1Circus 0 16 14 8 0Private Rentals 5 5 4 4 17Total 95 124 99 122 110Source: Arena Operating Company.
Page 60
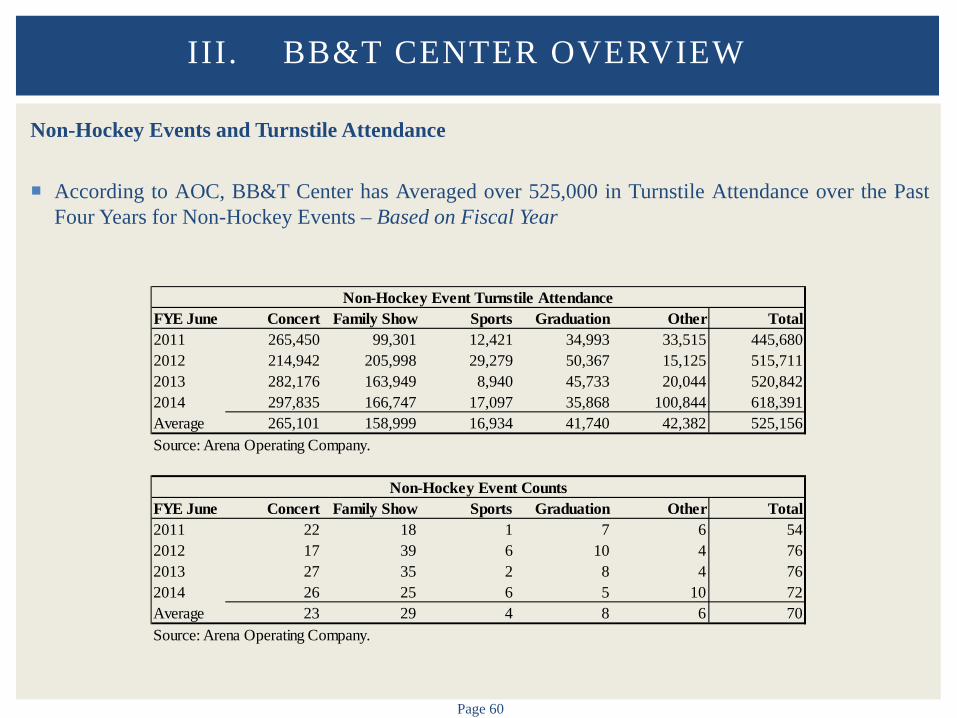
Non-Hockey Events and Turnstile Attendance According to AOC, BB&T Center has Averaged over 525,000 in Turnstile Attendance over the Past
Four Years for Non-Hockey Events – Based on Fiscal Year
III. BB&T CENTER OVERVIEW
FYE June Concert Family Show Sports Graduation Other Total2011 265,450 99,301 12,421 34,993 33,515 445,6802012 214,942 205,998 29,279 50,367 15,125 515,7112013 282,176 163,949 8,940 45,733 20,044 520,8422014 297,835 166,747 17,097 35,868 100,844 618,391Average 265,101 158,999 16,934 41,740 42,382 525,156Source: Arena Operating Company.
FYE June Concert Family Show Sports Graduation Other Total2011 22 18 1 7 6 542012 17 39 6 10 4 762013 27 35 2 8 4 762014 26 25 6 5 10 72Average 23 29 4 8 6 70Source: Arena Operating Company.
Non-Hockey Event Counts
Non-Hockey Event Turnstile Attendance
Page 61
Historical Performance
The Consulting Team has Reviewed Historical Audited Financial Statements for Arena Operating Company, Ltd. from FY 2010 to FY 2014 [FY 2013 Reflects NHL Lockout-Shortened Season]
The Consulting Team has Not Made Adjustments to Historical Revenue/Expense Recognition Due to Lack of Detail Provided
Other Hockey Event-Related Revenue and Other Non-Hockey Event Related Revenue Does Not
Include Breakdown or Description
Hockey Event-Related Expenses and Non-Hockey Event Related Expenses Does Not Include Breakdown or Description
Depreciation and Amortization is Included in Selling, General, and Administrative Expenses
Specifically as it Relates to BB&T Center Operations, AOC was Not Able to Provide Historical Financial Statements Excluding Hockey Operations
Budget and Projections Not Provided
III. BB&T CENTER OVERVIEW

Page 62
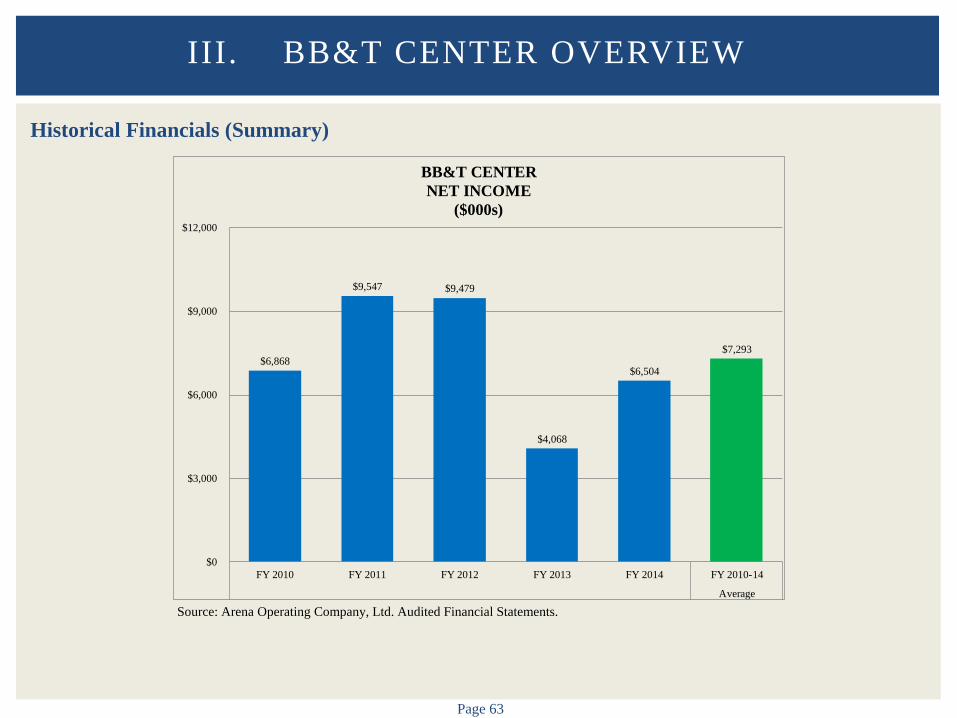
Historical Financials (Summary)
Net Income is Defined as Operating Income After Broward County and Other Obligations and Interest Expense
Net Income After Broward County and Other Obligations and Interest Expense was Approximately $4.1 Million in FY 2013, Significantly Lower than the FY 2010 to FY 2014 Average of $7.3 Million Likely as a Result of the NHL Lockout
III. BB&T CENTER OVERVIEW
Average CAGRFY 2010 FY 2011 FY 2012 FY 2013 FY 2014 FY 2010-14 FY 2010-14
Revenues - Total $36,712,336 $40,660,082 $39,670,028 $40,026,126 $46,826,074 $40,778,929 6.3%
Operating Expenses - Total $24,258,920 $25,575,490 $24,431,506 $30,281,824 $34,740,994 $27,857,747 9.4%
Operating Income Before Broward County and Other Obligations $12,453,416 $15,084,592 $15,238,522 $9,744,302 $12,085,080 $12,921,182 -0.7%
Broward County and Other ObligationsCounty Preferred Revenue Allocation $4,023,000 $3,999,067 $4,102,280 $4,068,512 $4,059,474 $4,050,467 0.2%Florida Department of Transportation $898,233 $767,288 $806,003 $652,597 $620,294 $748,883 -8.8%Tourist Development Corp. Obligation $500,000 $500,000 $500,000 $500,000 $500,000 $500,000 0.0%
Broward County and Other Obligations - Total $5,421,233 $5,266,355 $5,408,283 $5,221,109 $5,179,768 $5,299,350 -1.1%
Interest Expense $163,935 $271,306 $351,629 $454,903 $401,306 $328,616 25.1%
Net Income $6,868,248 $9,546,931 $9,478,610 $4,068,290 $6,504,006 $7,293,217 -1.4%Source: Arena Operating Company, Ltd. Audited Financial Statements.
Page 63
Historical Financials (Summary)
III. BB&T CENTER OVERVIEW
Source: Arena Operating Company, Ltd. Audited Financial Statements.
$6,868
$9,547 $9,479
$4,068
$6,504
$7,293
$0
$3,000
$6,000
$9,000
$12,000
FY 2010 FY 2011 FY 2012 FY 2013 FY 2014 FY 2010-14
Average
BB&T CENTERNET INCOME
($000s)
Page 64
Historical Financials (Detail)
AOC Reported Net Income Averaging Approximately $7.3 Million from 2010 to 2014 Net Income Ranged from a Low of Approximately $4.1 Million to a High of Approximately $9.5
Million
III. BB&T CENTER OVERVIEW
Average CAGRFY 2010 FY 2011 FY 2012 FY 2013 FY 2014 FY 2010-14 FY 2010-14
RevenuesHockey Event-Related Revenues
Club Seat Tickets $3,522,961 $4,244,134 $4,873,129 $5,046,735 $7,585,915 $5,054,575 21.1%Parking $971,094 $1,243,689 $1,360,184 $851,994 $964,335 $1,078,259 -0.2%Food and Beverage Concessions $1,860,915 $2,045,532 $2,276,573 $1,565,492 $2,218,375 $1,993,377 4.5%Other $1,855,866 $1,850,793 $2,055,396 $1,491,464 $1,622,888 $1,775,281 -3.3%
Hockey Event-Related Revenues - Total $8,210,836 $9,384,148 $10,565,282 $8,955,685 $12,391,513 $9,901,493 10.8%Non-Hockey Events $8,899,033 $9,447,915 $9,166,233 $11,624,402 $14,154,912 $10,658,499 12.3%Suite Rentals $7,273,041 $7,028,637 $6,525,656 $5,102,072 $4,617,262 $6,109,334 -10.7%Sponsorships $7,196,162 $8,531,999 $5,716,436 $6,268,709 $5,199,231 $6,582,507 -7.8%Other $5,133,264 $6,267,383 $7,696,421 $8,075,258 $10,463,156 $7,527,096 19.5%
Revenues - Total $36,712,336 $40,660,082 $39,670,028 $40,026,126 $46,826,074 $40,778,929 6.3%
Operating ExpensesHockey Events $2,211,913 $2,158,568 $2,263,283 $1,104,599 $3,003,107 $2,148,294 7.9%Non-Hockey Events $6,814,724 $7,667,576 $7,598,883 $10,396,003 $11,575,939 $8,810,625 14.2%Repairs and Maintenance $414,422 $473,213 $693,022 $687,266 $963,069 $646,198 23.5%Utilities $2,250,200 $2,503,815 $2,299,632 $2,292,955 $2,534,671 $2,376,255 3.0%Selling, General and Administrative $12,567,661 $12,772,318 $11,576,686 $15,801,001 $16,664,208 $13,876,375 7.3%
Operating Expenses - Total $24,258,920 $25,575,490 $24,431,506 $30,281,824 $34,740,994 $27,857,747 9.4%
Operating Income Before Broward County and Other Obligations $12,453,416 $15,084,592 $15,238,522 $9,744,302 $12,085,080 $12,921,182 -0.7%
Broward County and Other ObligationsCounty Preferred Revenue Allocation $4,023,000 $3,999,067 $4,102,280 $4,068,512 $4,059,474 $4,050,467 0.2%Florida Department of Transportation $898,233 $767,288 $806,003 $652,597 $620,294 $748,883 -8.8%Tourist Development Corp. Obligation $500,000 $500,000 $500,000 $500,000 $500,000 $500,000 0.0%
Broward County and Other Obligations - Total $5,421,233 $5,266,355 $5,408,283 $5,221,109 $5,179,768 $5,299,350 -1.1%
Interest Expense $163,935 $271,306 $351,629 $454,903 $401,306 $328,616 25.1%
Net Income $6,868,248 $9,546,931 $9,478,610 $4,068,290 $6,504,006 $7,293,217 -1.4%Source: Arena Operating Company, Ltd. Audited Financial Statements.
Page 65
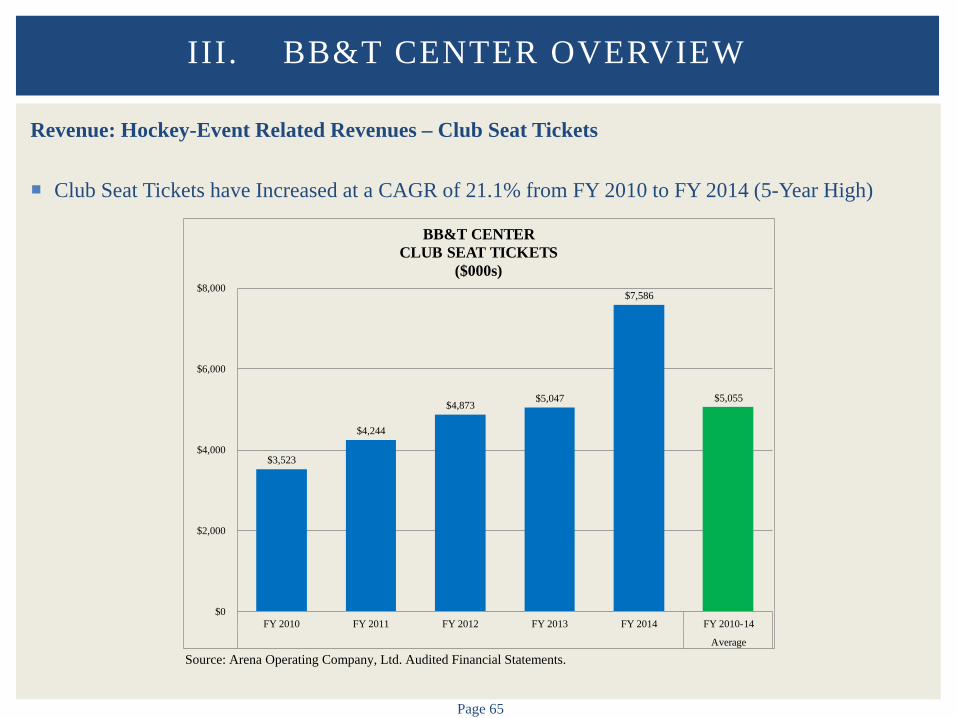
Revenue: Hockey-Event Related Revenues – Club Seat Tickets
Club Seat Tickets have Increased at a CAGR of 21.1% from FY 2010 to FY 2014 (5-Year High)
III. BB&T CENTER OVERVIEW
Source: Arena Operating Company, Ltd. Audited Financial Statements.
$3,523
$4,244
$4,873 $5,047
$7,586
$5,055
$0
$2,000
$4,000
$6,000
$8,000
FY 2010 FY 2011 FY 2012 FY 2013 FY 2014 FY 2010-14
Average
BB&T CENTERCLUB SEAT TICKETS
($000s)

Page 66
Revenue: Hockey-Event Related Revenues – Parking
Parking Revenues have Fluctuated Over the Past Five Years – Average of Approximately $1.1 Million
III. BB&T CENTER OVERVIEW
Source: Arena Operating Company, Ltd. Audited Financial Statements.
$971
$1,244
$1,360
$852
$964
$1,078
$0
$1,000
$2,000
FY 2010 FY 2011 FY 2012 FY 2013 FY 2014 FY 2010-14
Average
BB&T CENTERPARKING
($000s)

Page 67
Revenue: Hockey-Event Related Revenues – Food and Beverage Concessions
Food and Beverage Concessions Decreased Significantly in FY 2013 After Peaking in FY 2012 at $2.3 Million, Likely as a Result of the NHL Lockout
III. BB&T CENTER OVERVIEW
Source: Arena Operating Company, Ltd. Audited Financial Statements.
$1,861
$2,046
$2,277
$1,565
$2,218
$1,993
$0
$1,000
$2,000
$3,000
FY 2010 FY 2011 FY 2012 FY 2013 FY 2014 FY 2010-14
Average
BB&T CENTERFOOD AND BEVERAGE CONCESSIONS
($000s)
Page 68
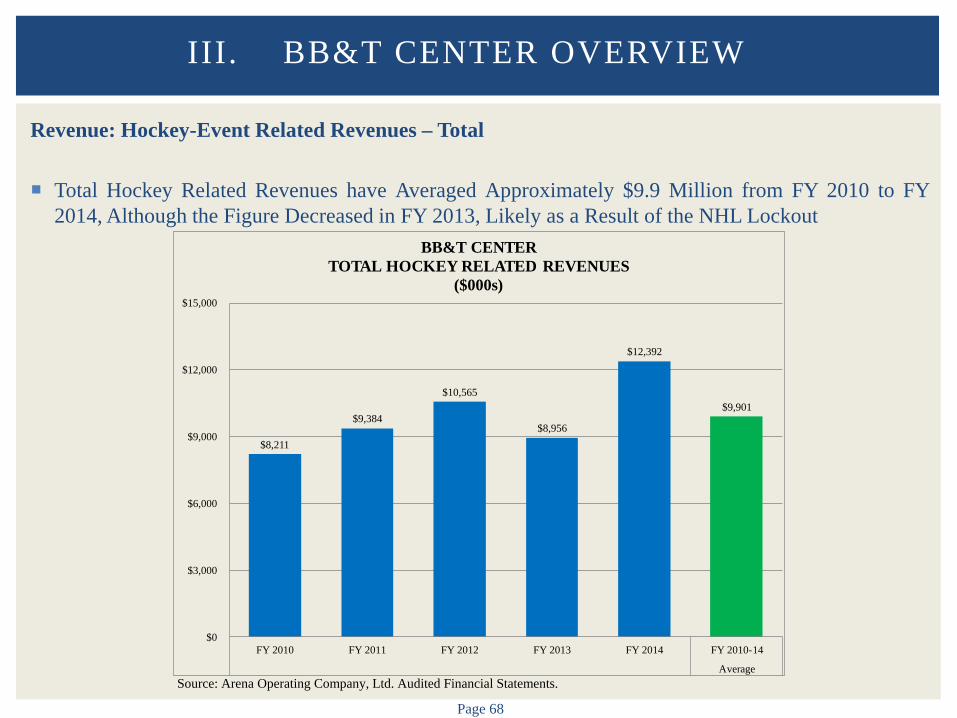
Revenue: Hockey-Event Related Revenues – Total
Total Hockey Related Revenues have Averaged Approximately $9.9 Million from FY 2010 to FY 2014, Although the Figure Decreased in FY 2013, Likely as a Result of the NHL Lockout
III. BB&T CENTER OVERVIEW
Source: Arena Operating Company, Ltd. Audited Financial Statements.
$8,211
$9,384
$10,565
$8,956
$12,392
$9,901
$0
$3,000
$6,000
$9,000
$12,000
$15,000
FY 2010 FY 2011 FY 2012 FY 2013 FY 2014 FY 2010-14
Average
BB&T CENTERTOTAL HOCKEY RELATED REVENUES
($000s)
Page 69
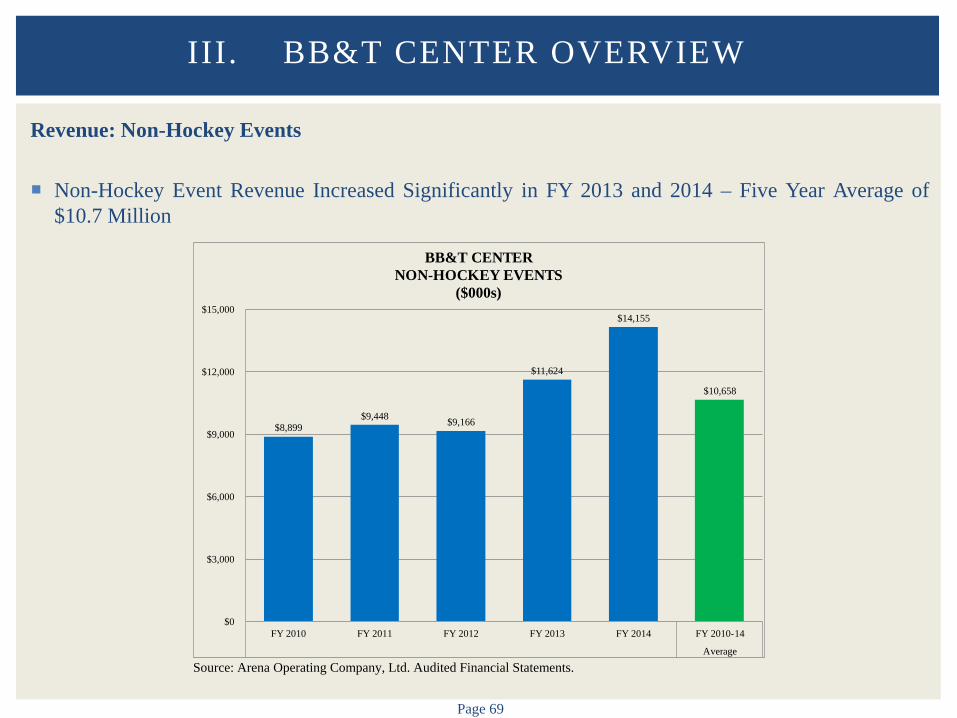
Revenue: Non-Hockey Events
Non-Hockey Event Revenue Increased Significantly in FY 2013 and 2014 – Five Year Average of $10.7 Million
III. BB&T CENTER OVERVIEW
Source: Arena Operating Company, Ltd. Audited Financial Statements.
$8,899 $9,448 $9,166
$11,624
$14,155
$10,658
$0
$3,000
$6,000
$9,000
$12,000
$15,000
FY 2010 FY 2011 FY 2012 FY 2013 FY 2014 FY 2010-14
Average
BB&T CENTERNON-HOCKEY EVENTS
($000s)
Page 70
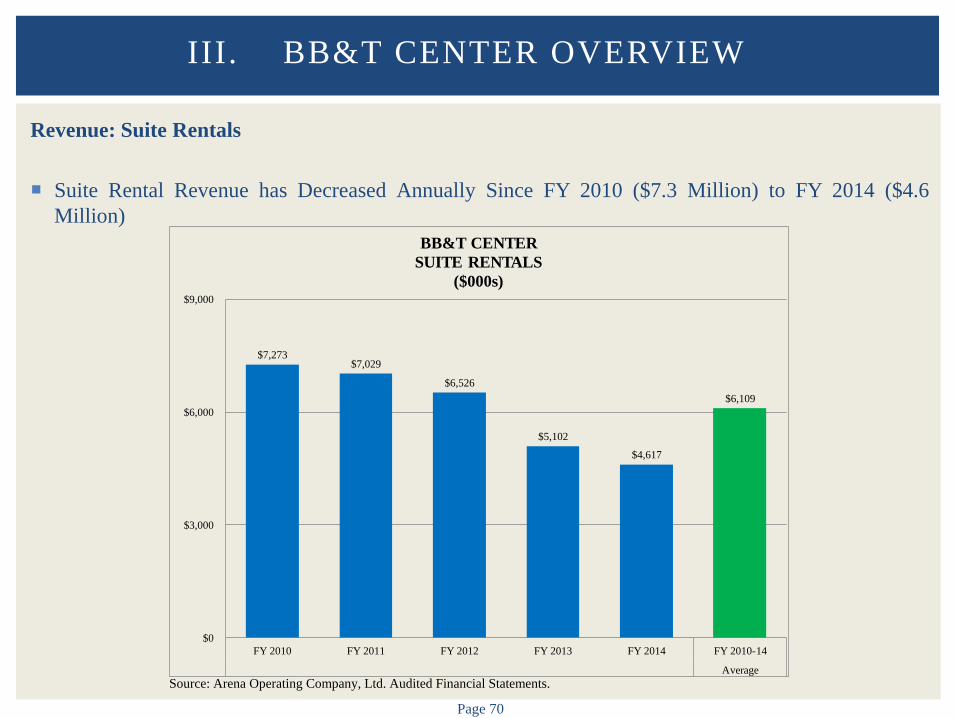
Revenue: Suite Rentals
Suite Rental Revenue has Decreased Annually Since FY 2010 ($7.3 Million) to FY 2014 ($4.6 Million)
III. BB&T CENTER OVERVIEW
Source: Arena Operating Company, Ltd. Audited Financial Statements.
$7,273 $7,029
$6,526
$5,102
$4,617
$6,109
$0
$3,000
$6,000
$9,000
FY 2010 FY 2011 FY 2012 FY 2013 FY 2014 FY 2010-14
Average
BB&T CENTERSUITE RENTALS
($000s)
Page 71
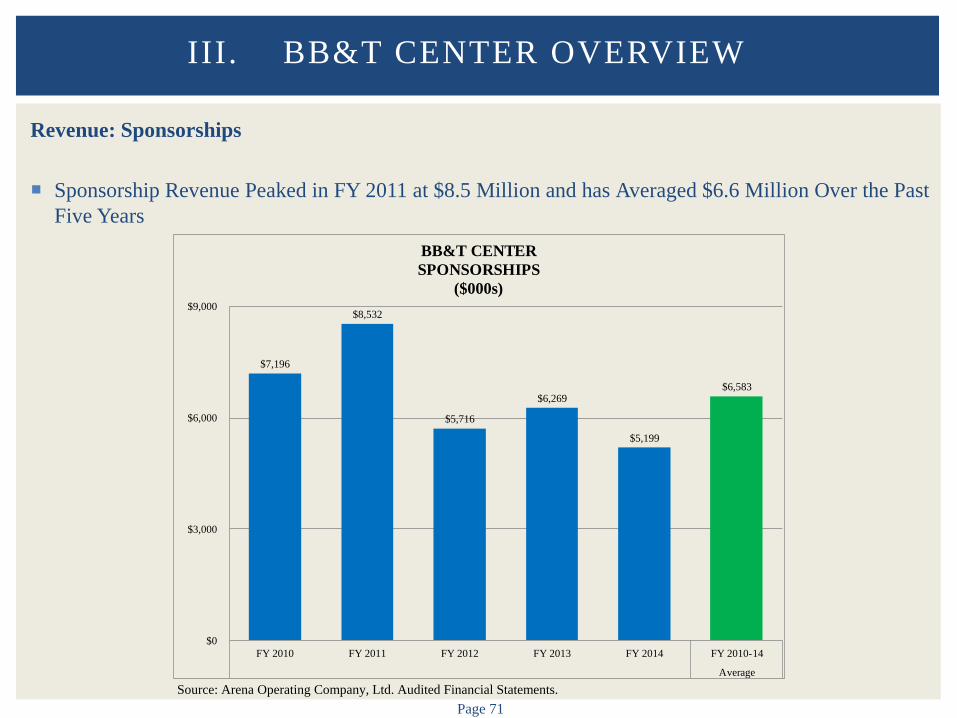
Revenue: Sponsorships
Sponsorship Revenue Peaked in FY 2011 at $8.5 Million and has Averaged $6.6 Million Over the Past Five Years
III. BB&T CENTER OVERVIEW
Source: Arena Operating Company, Ltd. Audited Financial Statements.
$7,196
$8,532
$5,716
$6,269
$5,199
$6,583
$0
$3,000
$6,000
$9,000
FY 2010 FY 2011 FY 2012 FY 2013 FY 2014 FY 2010-14
Average
BB&T CENTERSPONSORSHIPS
($000s)
Page 72
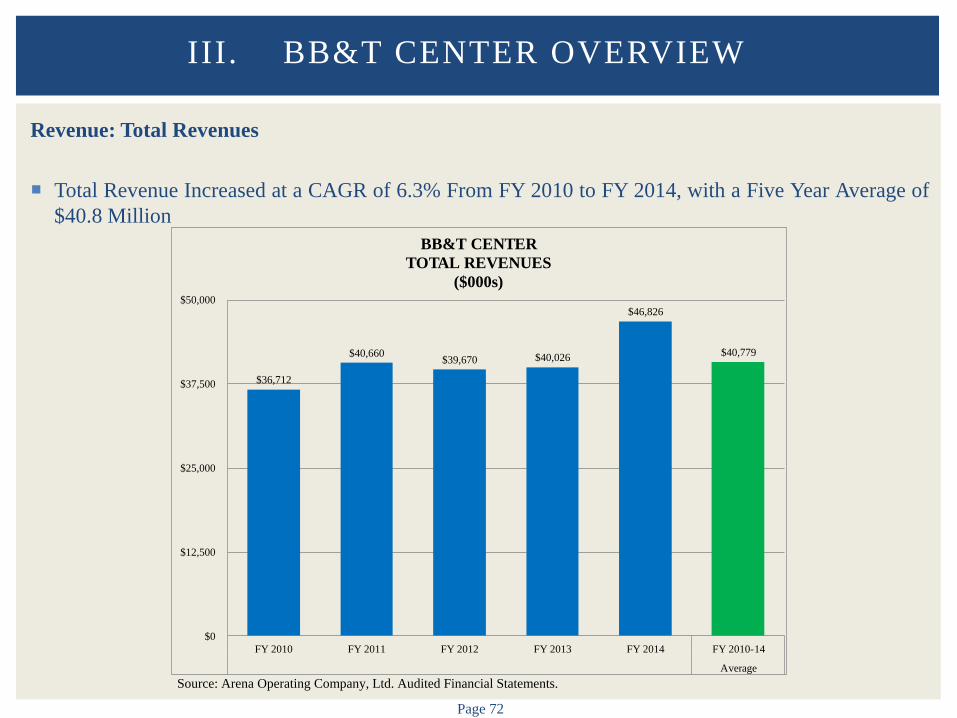
Revenue: Total Revenues
Total Revenue Increased at a CAGR of 6.3% From FY 2010 to FY 2014, with a Five Year Average of $40.8 Million
III. BB&T CENTER OVERVIEW
Source: Arena Operating Company, Ltd. Audited Financial Statements.
$36,712
$40,660 $39,670 $40,026
$46,826
$40,779
$0
$12,500
$25,000
$37,500
$50,000
FY 2010 FY 2011 FY 2012 FY 2013 FY 2014 FY 2010-14
Average
BB&T CENTERTOTAL REVENUES
($000s)
Page 73
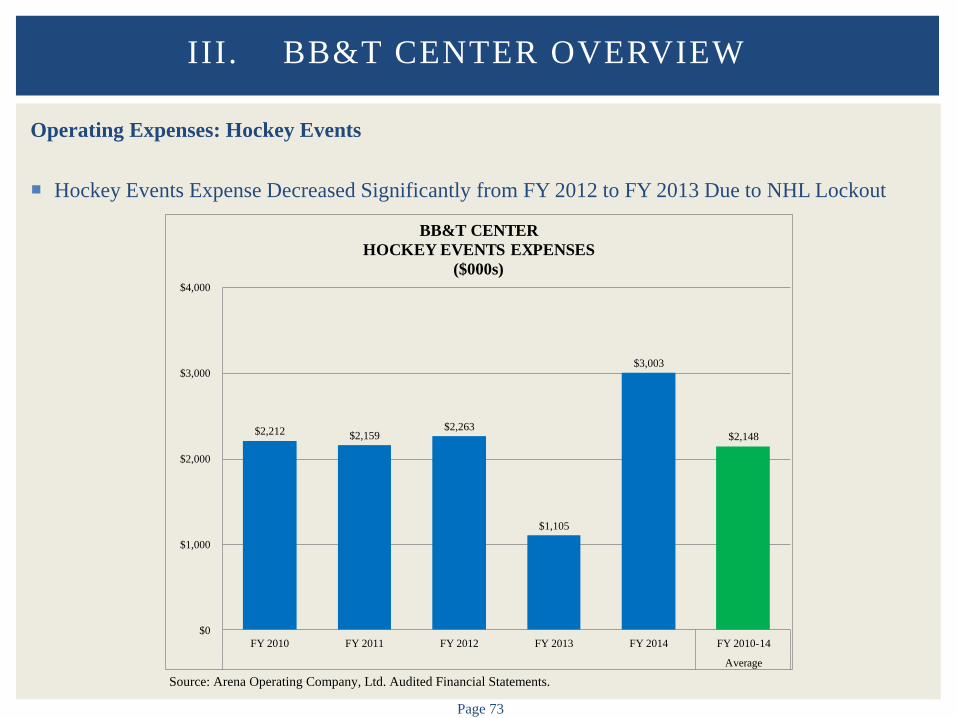
Operating Expenses: Hockey Events
Hockey Events Expense Decreased Significantly from FY 2012 to FY 2013 Due to NHL Lockout
III. BB&T CENTER OVERVIEW
Source: Arena Operating Company, Ltd. Audited Financial Statements.
$2,212 $2,159 $2,263
$1,105
$3,003
$2,148
$0
$1,000
$2,000
$3,000
$4,000
FY 2010 FY 2011 FY 2012 FY 2013 FY 2014 FY 2010-14
Average
BB&T CENTERHOCKEY EVENTS EXPENSES
($000s)

Page 74
Operating Expenses: Repairs and Maintenance
Repairs and Maintenance Expenses were $963,000 in FY 2014, Significantly Higher than the Five Year Average Since FY 2010 of $646,000
III. BB&T CENTER OVERVIEW
Source: Arena Operating Company, Ltd. Audited Financial Statements.
$414
$473
$693 $687
$963
$646
$0
$250
$500
$750
$1,000
FY 2010 FY 2011 FY 2012 FY 2013 FY 2014 FY 2010-14
Average
BB&T CENTERREPAIRS AND MAINTENANCE
($000s)
Page 75
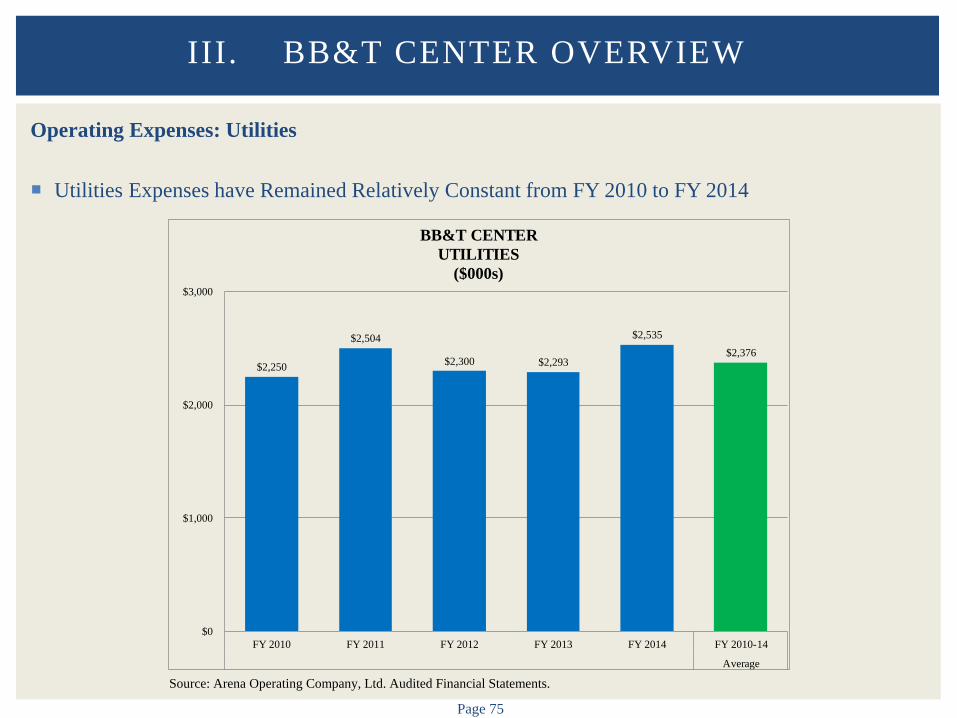
Operating Expenses: Utilities
Utilities Expenses have Remained Relatively Constant from FY 2010 to FY 2014
III. BB&T CENTER OVERVIEW
Source: Arena Operating Company, Ltd. Audited Financial Statements.
$2,250
$2,504
$2,300 $2,293
$2,535 $2,376
$0
$1,000
$2,000
$3,000
FY 2010 FY 2011 FY 2012 FY 2013 FY 2014 FY 2010-14
Average
BB&T CENTERUTILITIES
($000s)
Page 76
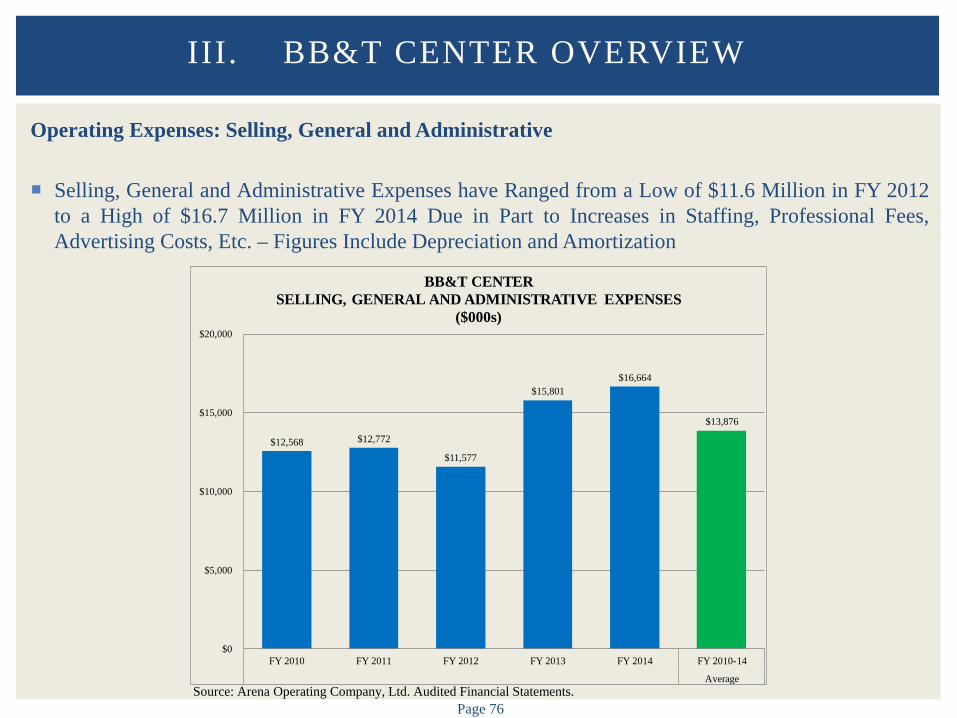
Operating Expenses: Selling, General and Administrative
Selling, General and Administrative Expenses have Ranged from a Low of $11.6 Million in FY 2012 to a High of $16.7 Million in FY 2014 Due in Part to Increases in Staffing, Professional Fees, Advertising Costs, Etc. – Figures Include Depreciation and Amortization
III. BB&T CENTER OVERVIEW
Source: Arena Operating Company, Ltd. Audited Financial Statements.
$12,568 $12,772
$11,577
$15,801 $16,664
$13,876
$0
$5,000
$10,000
$15,000
$20,000
FY 2010 FY 2011 FY 2012 FY 2013 FY 2014 FY 2010-14
Average
BB&T CENTERSELLING, GENERAL AND ADMINISTRATIVE EXPENSES
($000s)

Page 77
Operating Expenses: Total
Total Operating Expenses Peaked in FY 2014 at $34.7 Million – Figures Include Depreciation and Amortization
III. BB&T CENTER OVERVIEW
Source: Arena Operating Company, Ltd. Audited Financial Statements.
$24,259 $25,575
$24,432
$30,282
$34,741
$27,858
$0
$10,000
$20,000
$30,000
$40,000
FY 2010 FY 2011 FY 2012 FY 2013 FY 2014 FY 2010-14
Average
BB&T CENTERTOTAL OPERATING EXPENSES
($000s)

Page 78
Operating Income Before Broward County and Other Obligations
Operating Income Before Broward County and Other Obligations has Averaged $12.9 Million Since FY 2010
III. BB&T CENTER OVERVIEW
Source: Arena Operating Company, Ltd. Audited Financial Statements.
$12,453
$15,085 $15,239
$9,744
$12,085 $12,921
$0
$5,000
$10,000
$15,000
$20,000
FY 2010 FY 2011 FY 2012 FY 2013 FY 2014 FY 2010-14
Average
BB&T CENTEROPERATING INCOME BEFORE BROWARD COUNTY AND
OTHER OBLIGATIONS($000s)

IV. MARKET OVERVIEW
A. DEMOGRAPHIC COMPARISON
Page 81
Overview
Market Area Size and Characteristics Impact Market Support and Demand for Events, Tickets, Premium Seating, Sponsorship, Etc.
Limited Market Demographic Overview Completed Largest 20 U.S. Markets Core Base Statistical Area (CBSA) Designation
Consideration Should be Given to Comprehensive Market Analysis (Market Surveys/Focus
Groups/Etc.)
A. DEMOGRAPHIC COMPARISON
Page 82
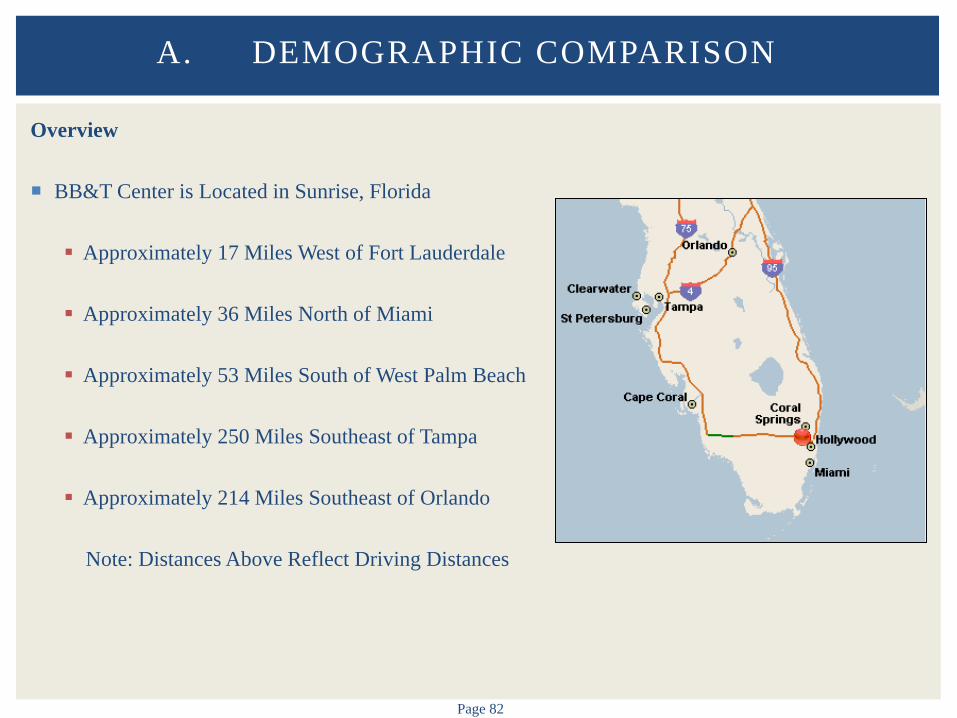
Overview
BB&T Center is Located in Sunrise, Florida Approximately 17 Miles West of Fort Lauderdale
Approximately 36 Miles North of Miami
Approximately 53 Miles South of West Palm Beach
Approximately 250 Miles Southeast of Tampa
Approximately 214 Miles Southeast of Orlando
Note: Distances Above Reflect Driving Distances
A. DEMOGRAPHIC COMPARISON
Page 83
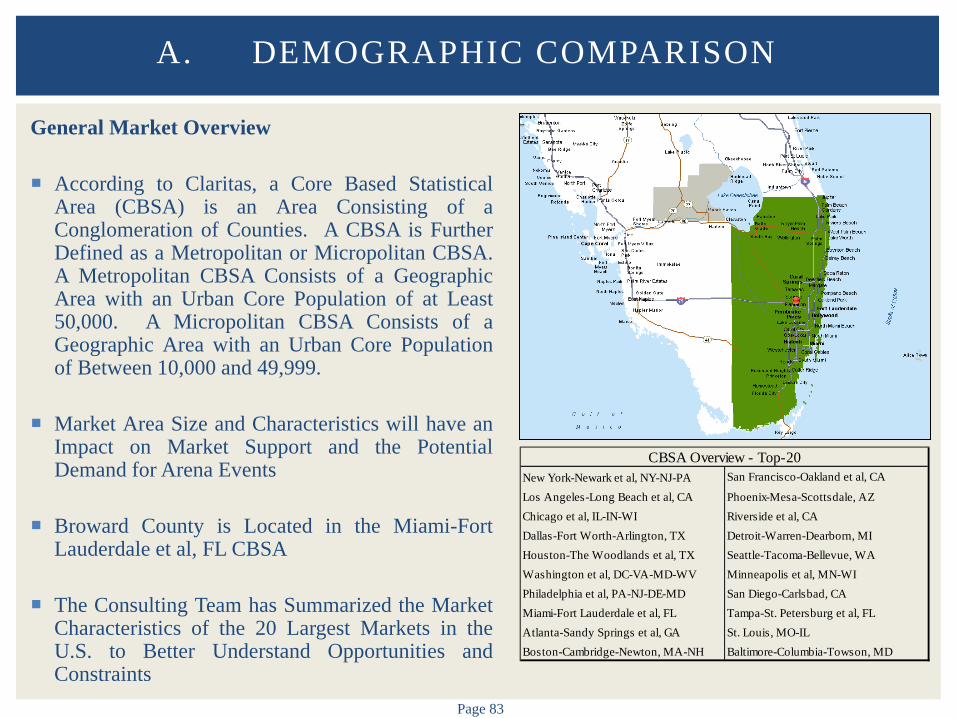
General Market Overview
According to Claritas, a Core Based Statistical Area (CBSA) is an Area Consisting of a Conglomeration of Counties. A CBSA is Further Defined as a Metropolitan or Micropolitan CBSA. A Metropolitan CBSA Consists of a Geographic Area with an Urban Core Population of at Least 50,000. A Micropolitan CBSA Consists of a Geographic Area with an Urban Core Population of Between 10,000 and 49,999.
Market Area Size and Characteristics will have an Impact on Market Support and the Potential Demand for Arena Events
Broward County is Located in the Miami-Fort Lauderdale et al, FL CBSA
The Consulting Team has Summarized the Market Characteristics of the 20 Largest Markets in the U.S. to Better Understand Opportunities and Constraints
A. DEMOGRAPHIC COMPARISON
New York-Newark et al, NY-NJ-PA San Francisco-Oakland et al, CA
Los Angeles-Long Beach et al, CA Phoenix-Mesa-Scottsdale, AZChicago et al, IL-IN-WI Riverside et al, CADallas-Fort Worth-Arlington, TX Detroit-Warren-Dearborn, MIHouston-The Woodlands et al, TX Seattle-Tacoma-Bellevue, WAWashington et al, DC-VA-MD-WV Minneapolis et al, MN-WIPhiladelphia et al, PA-NJ-DE-MD San Diego-Carlsbad, CAMiami-Fort Lauderdale et al, FL Tampa-St. Petersburg et al, FLAtlanta-Sandy Springs et al, GA St. Louis, MO-ILBoston-Cambridge-Newton, MA-NH Baltimore-Columbia-Towson, MD
CBSA Overview - Top-20
Page 84
A. DEMOGRAPHIC COMPARISON
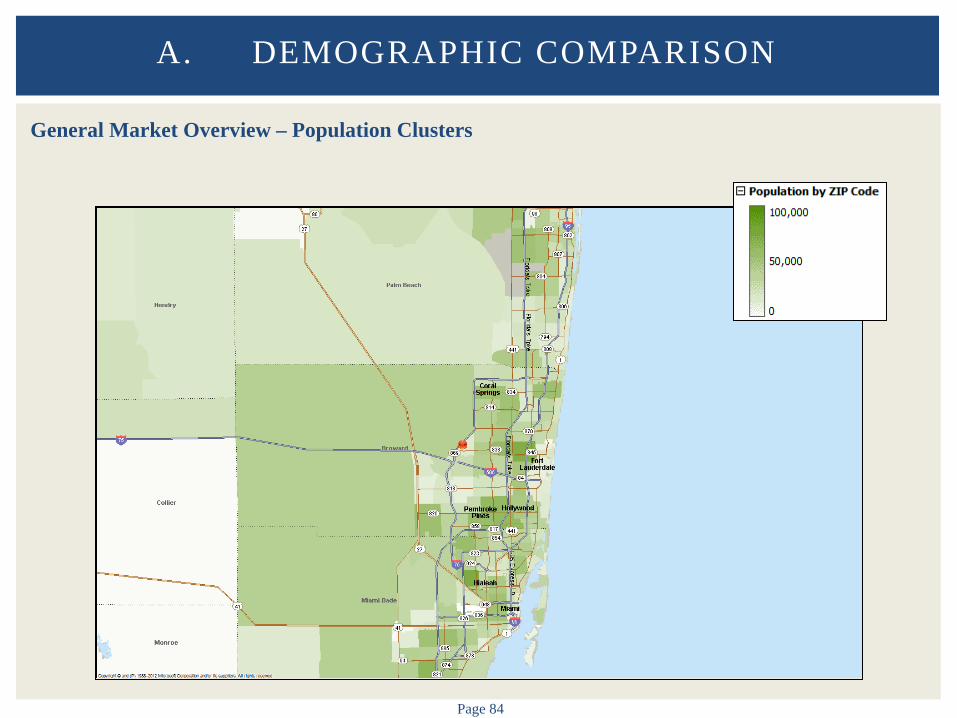
General Market Overview – Population Clusters
Page 85
A. DEMOGRAPHIC COMPARISON
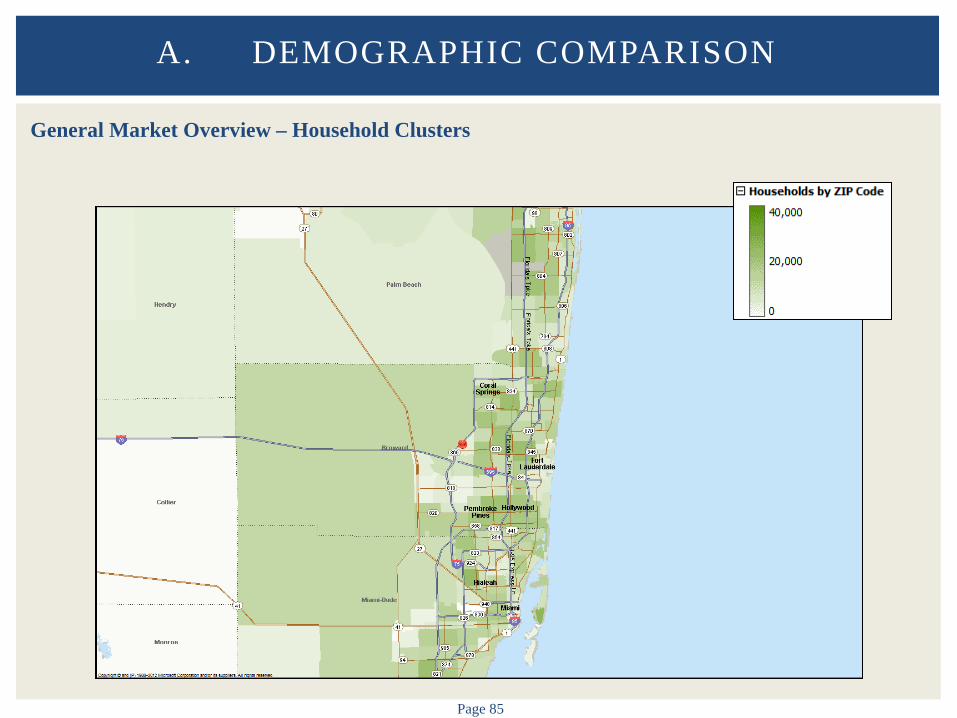
General Market Overview – Household Clusters

Page 86
A. DEMOGRAPHIC COMPARISON
General Market Overview – Income Clusters
Page 87
A. DEMOGRAPHIC COMPARISON
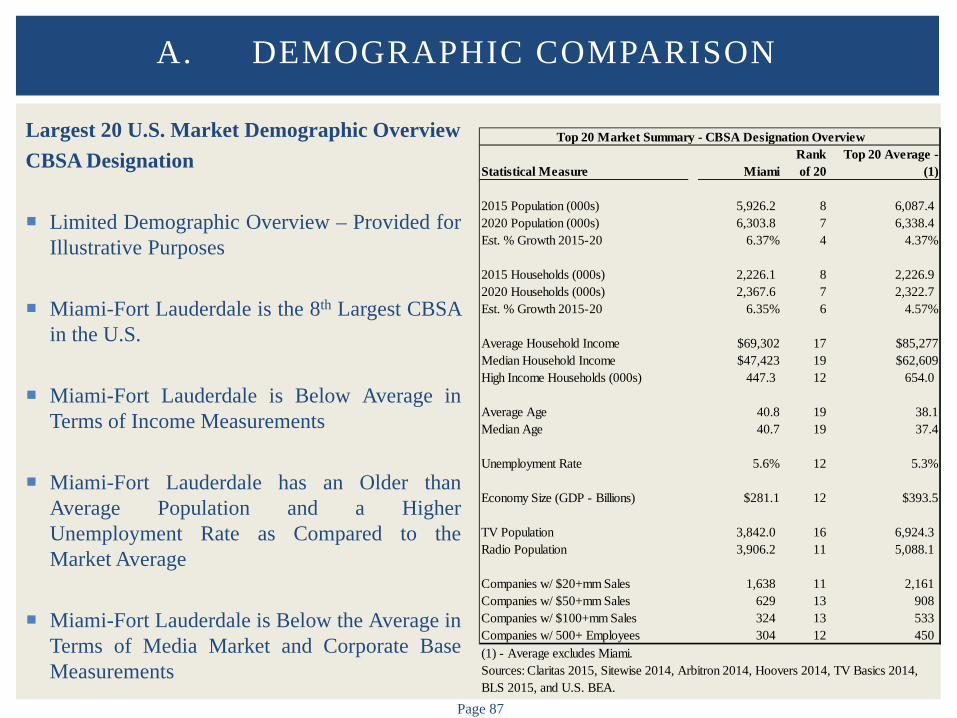
Largest 20 U.S. Market Demographic Overview CBSA Designation Limited Demographic Overview – Provided for
Illustrative Purposes
Miami-Fort Lauderdale is the 8th Largest CBSA in the U.S.
Miami-Fort Lauderdale is Below Average in Terms of Income Measurements
Miami-Fort Lauderdale has an Older than Average Population and a Higher Unemployment Rate as Compared to the Market Average
Miami-Fort Lauderdale is Below the Average in Terms of Media Market and Corporate Base Measurements
Statistical Measure MiamiRank of 20
Top 20 Average - (1)
2015 Population (000s) 5,926.2 8 6,087.4 2020 Population (000s) 6,303.8 7 6,338.4 Est. % Growth 2015-20 6.37% 4 4.37%
2015 Households (000s) 2,226.1 8 2,226.9 2020 Households (000s) 2,367.6 7 2,322.7 Est. % Growth 2015-20 6.35% 6 4.57%
Average Household Income $69,302 17 $85,277Median Household Income $47,423 19 $62,609High Income Households (000s) 447.3 12 654.0
Average Age 40.8 19 38.1Median Age 40.7 19 37.4
Unemployment Rate 5.6% 12 5.3%
Economy Size (GDP - Billions) $281.1 12 $393.5
TV Population 3,842.0 16 6,924.3 Radio Population 3,906.2 11 5,088.1
Companies w/ $20+mm Sales 1,638 11 2,161Companies w/ $50+mm Sales 629 13 908Companies w/ $100+mm Sales 324 13 533Companies w/ 500+ Employees 304 12 450
Top 20 Market Summary - CBSA Designation Overview
Sources: Claritas 2015, Sitewise 2014, Arbitron 2014, Hoovers 2014, TV Basics 2014, BLS 2015, and U.S. BEA.
(1) - Average excludes Miami.

Page 88
Largest 20 U.S. Market Primary Arenas
Summarized Below are the Primary Arenas in the Largest 20 U.S. Markets
A. DEMOGRAPHIC COMPARISON
Market
New York-Newark et al, NY-NJ-PA Madison Square Garden Barclays CenterLos Angeles-Long Beach et al, CA Staples Center Honda CenterChicago et al, IL-IN-WI United Center Allstate ArenaDallas-Fort Worth-Arlington, TX American Airlines CenterHouston-The Woodlands et al, TX Toyota CenterWashington et al, DC-VA-MD-WV Verizon Center Xfinity CenterPhiladelphia et al, PA-NJ-DE-MD Wells Fargo Center Liacouras CenterMiami-Fort Lauderdale et al, FL BB&T Center AmericanAirlines ArenaAtlanta-Sandy Springs et al, GA Philips Arena The Arena at Gwinnett CenterBoston-Cambridge-Newton, MA-NH TD GardenSan Francisco-Oakland et al, CA Oracle ArenaPhoenix-Mesa-Scottsdale, AZ Talking Stick Resort Arena Gila River ArenaRiverside et al, CA Citizens Bank ArenaDetroit-Warren-Dearborn, MI New Red Wings Arena The Palace of Auburn HillsSeattle-Tacoma-Bellevue, WA KeyArena Tacoma DomeMinneapolis et al, MN-WI Target Center Xcel CenterSan Diego-Carlsbad, CA Valley View Casino Center Viejas ArenaTampa-St. Petersburg et al, FL Amalie ArenaSt. Louis, MO-IL Scottrade Center Chaifetz ArenaBaltimore-Columbia-Towson, MD Royal Farms ArenaSource: Industry research.
Primary Arenas
Page 89
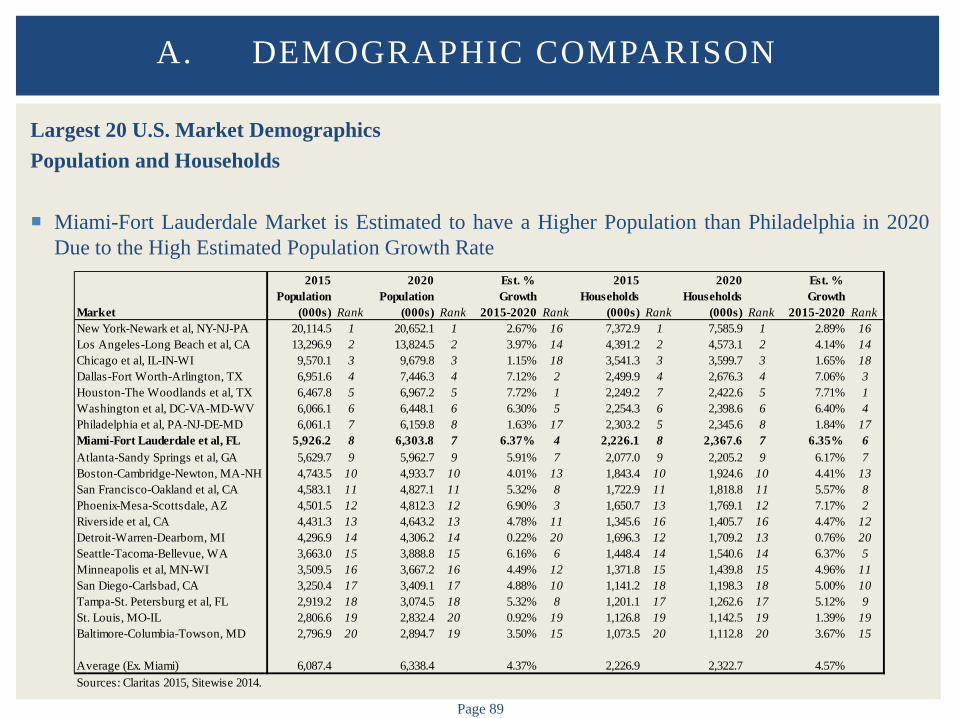
Largest 20 U.S. Market Demographics Population and Households
Miami-Fort Lauderdale Market is Estimated to have a Higher Population than Philadelphia in 2020
Due to the High Estimated Population Growth Rate
A. DEMOGRAPHIC COMPARISON
Market
2015 Population
(000s) Rank
2020 Population
(000s) Rank
Est. % Growth
2015-2020 Rank
2015 Households
(000s) Rank
2020 Households
(000s) Rank
Est. % Growth
2015-2020 RankNew York-Newark et al, NY-NJ-PA 20,114.5 1 20,652.1 1 2.67% 16 7,372.9 1 7,585.9 1 2.89% 16Los Angeles-Long Beach et al, CA 13,296.9 2 13,824.5 2 3.97% 14 4,391.2 2 4,573.1 2 4.14% 14Chicago et al, IL-IN-WI 9,570.1 3 9,679.8 3 1.15% 18 3,541.3 3 3,599.7 3 1.65% 18Dallas-Fort Worth-Arlington, TX 6,951.6 4 7,446.3 4 7.12% 2 2,499.9 4 2,676.3 4 7.06% 3Houston-The Woodlands et al, TX 6,467.8 5 6,967.2 5 7.72% 1 2,249.2 7 2,422.6 5 7.71% 1Washington et al, DC-VA-MD-WV 6,066.1 6 6,448.1 6 6.30% 5 2,254.3 6 2,398.6 6 6.40% 4Philadelphia et al, PA-NJ-DE-MD 6,061.1 7 6,159.8 8 1.63% 17 2,303.2 5 2,345.6 8 1.84% 17Miami-Fort Lauderdale et al, FL 5,926.2 8 6,303.8 7 6.37% 4 2,226.1 8 2,367.6 7 6.35% 6Atlanta-Sandy Springs et al, GA 5,629.7 9 5,962.7 9 5.91% 7 2,077.0 9 2,205.2 9 6.17% 7Boston-Cambridge-Newton, MA-NH 4,743.5 10 4,933.7 10 4.01% 13 1,843.4 10 1,924.6 10 4.41% 13San Francisco-Oakland et al, CA 4,583.1 11 4,827.1 11 5.32% 8 1,722.9 11 1,818.8 11 5.57% 8Phoenix-Mesa-Scottsdale, AZ 4,501.5 12 4,812.3 12 6.90% 3 1,650.7 13 1,769.1 12 7.17% 2Riverside et al, CA 4,431.3 13 4,643.2 13 4.78% 11 1,345.6 16 1,405.7 16 4.47% 12Detroit-Warren-Dearborn, MI 4,296.9 14 4,306.2 14 0.22% 20 1,696.3 12 1,709.2 13 0.76% 20Seattle-Tacoma-Bellevue, WA 3,663.0 15 3,888.8 15 6.16% 6 1,448.4 14 1,540.6 14 6.37% 5Minneapolis et al, MN-WI 3,509.5 16 3,667.2 16 4.49% 12 1,371.8 15 1,439.8 15 4.96% 11San Diego-Carlsbad, CA 3,250.4 17 3,409.1 17 4.88% 10 1,141.2 18 1,198.3 18 5.00% 10Tampa-St. Petersburg et al, FL 2,919.2 18 3,074.5 18 5.32% 8 1,201.1 17 1,262.6 17 5.12% 9St. Louis, MO-IL 2,806.6 19 2,832.4 20 0.92% 19 1,126.8 19 1,142.5 19 1.39% 19Baltimore-Columbia-Towson, MD 2,796.9 20 2,894.7 19 3.50% 15 1,073.5 20 1,112.8 20 3.67% 15
Average (Ex. Miami) 6,087.4 6,338.4 4.37% 2,226.9 2,322.7 4.57%Sources: Claritas 2015, Sitewise 2014.

Page 90
Largest 20 U.S. Market Demographics Income
Income Levels in Miami-Fort Lauderdale are Lower than Average in All Measurements
A. DEMOGRAPHIC COMPARISON
Market
Average Household
Income Rank
Median Household
Income Rank
HHs w/ Income
$100,000+ (000s) Rank
Washington et al, DC-VA-MD-WV $122,826 1 $92,441 1 1,038.0 3San Francisco-Oakland et al, CA $111,795 2 $77,822 2 686.0 5Boston-Cambridge-Newton, MA-NH $100,718 3 $73,624 3 674.8 6New York-Newark et al, NY-NJ-PA $95,428 4 $66,610 7 2,430.8 1Baltimore-Columbia-Towson, MD $94,941 5 $71,001 4 371.5 14Seattle-Tacoma-Bellevue, WA $89,931 6 $68,280 5 457.8 11Minneapolis et al, MN-WI $87,520 7 $67,650 6 416.4 13Philadelphia et al, PA-NJ-DE-MD $84,476 8 $62,072 8 665.4 7Los Angeles-Long Beach et al, CA $83,342 9 $58,860 13 1,199.2 2Houston-The Woodlands et al, TX $83,316 10 $59,128 11 614.1 9Chicago et al, IL-IN-WI $83,133 11 $61,244 10 976.7 4San Diego-Carlsbad, CA $82,986 12 $61,766 9 320.3 17Dallas-Fort Worth-Arlington, TX $79,759 13 $58,865 12 647.6 8Atlanta-Sandy Springs et al, GA $76,940 14 $55,755 14 496.1 10St. Louis, MO-IL $72,943 15 $54,888 15 255.4 19Detroit-Warren-Dearborn, MI $69,759 16 $50,886 18 363.3 15Miami-Fort Lauderdale et al, FL $69,302 17 $47,423 19 447.3 12Phoenix-Mesa-Scottsdale, AZ $68,607 18 $51,001 17 333.2 16Riverside et al, CA $67,872 19 $51,888 16 273.3 18Tampa-St. Petersburg et al, FL $63,974 20 $45,791 20 206.4 20
Average (Ex. Miami) $85,277 $62,609 654.0Sources: Claritas 2015, Sitewise 2014.
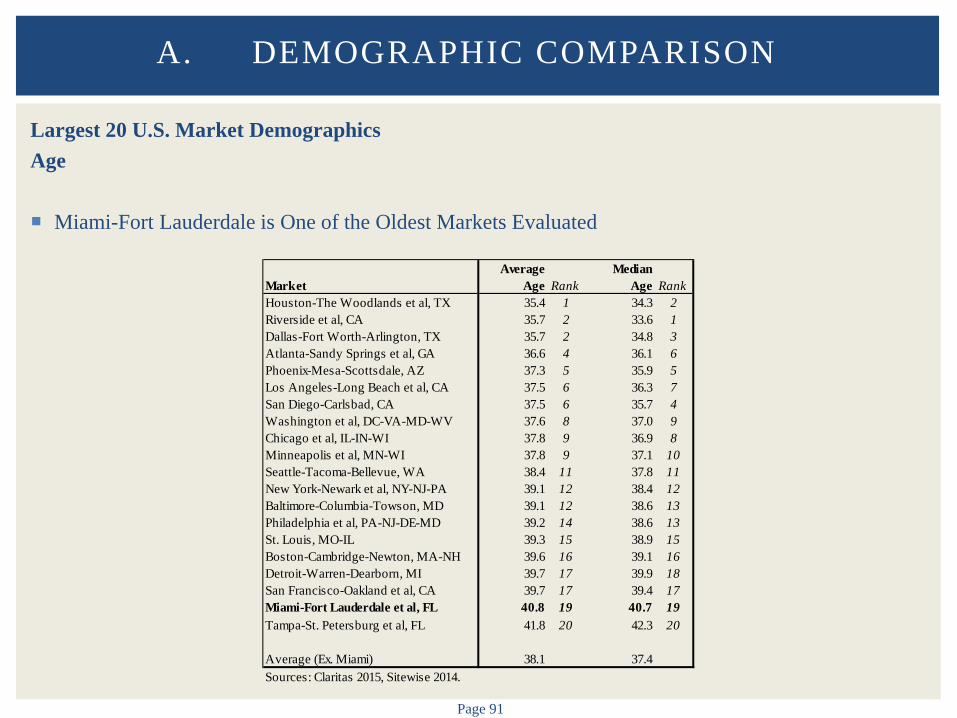
Page 91
Largest 20 U.S. Market Demographics Age
Miami-Fort Lauderdale is One of the Oldest Markets Evaluated
A. DEMOGRAPHIC COMPARISON
MarketAverage
Age RankMedian
Age RankHouston-The Woodlands et al, TX 35.4 1 34.3 2Riverside et al, CA 35.7 2 33.6 1Dallas-Fort Worth-Arlington, TX 35.7 2 34.8 3Atlanta-Sandy Springs et al, GA 36.6 4 36.1 6Phoenix-Mesa-Scottsdale, AZ 37.3 5 35.9 5Los Angeles-Long Beach et al, CA 37.5 6 36.3 7San Diego-Carlsbad, CA 37.5 6 35.7 4Washington et al, DC-VA-MD-WV 37.6 8 37.0 9Chicago et al, IL-IN-WI 37.8 9 36.9 8Minneapolis et al, MN-WI 37.8 9 37.1 10Seattle-Tacoma-Bellevue, WA 38.4 11 37.8 11New York-Newark et al, NY-NJ-PA 39.1 12 38.4 12Baltimore-Columbia-Towson, MD 39.1 12 38.6 13Philadelphia et al, PA-NJ-DE-MD 39.2 14 38.6 13St. Louis, MO-IL 39.3 15 38.9 15Boston-Cambridge-Newton, MA-NH 39.6 16 39.1 16Detroit-Warren-Dearborn, MI 39.7 17 39.9 18San Francisco-Oakland et al, CA 39.7 17 39.4 17Miami-Fort Lauderdale et al, FL 40.8 19 40.7 19Tampa-St. Petersburg et al, FL 41.8 20 42.3 20
Average (Ex. Miami) 38.1 37.4Sources: Claritas 2015, Sitewise 2014.
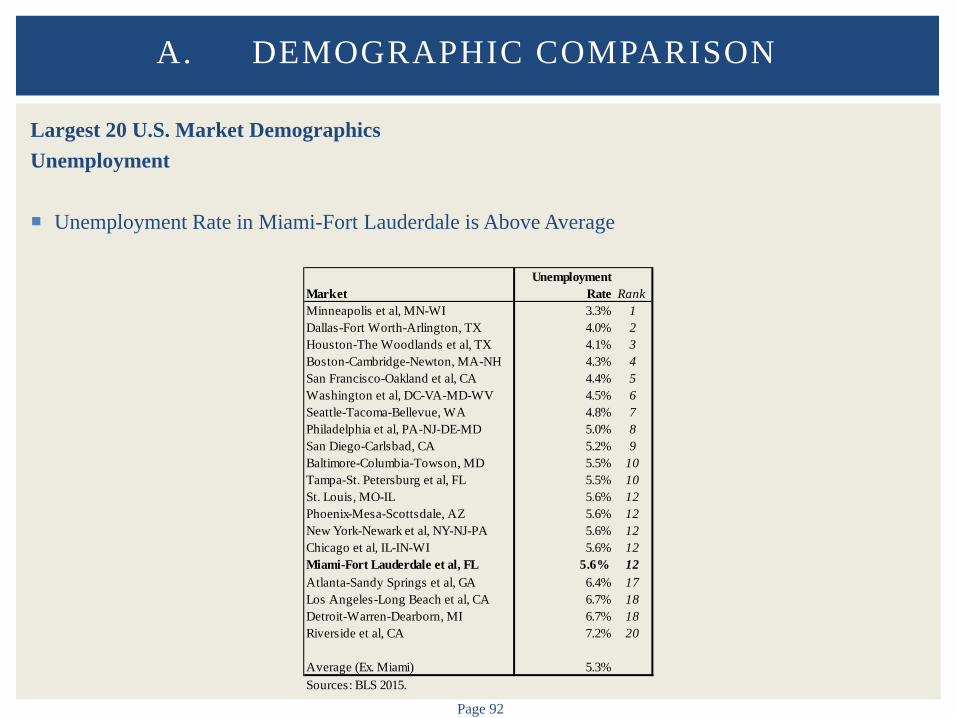
Page 92
Largest 20 U.S. Market Demographics Unemployment
Unemployment Rate in Miami-Fort Lauderdale is Above Average
A. DEMOGRAPHIC COMPARISON
MarketUnemployment
Rate RankMinneapolis et al, MN-WI 3.3% 1Dallas-Fort Worth-Arlington, TX 4.0% 2Houston-The Woodlands et al, TX 4.1% 3Boston-Cambridge-Newton, MA-NH 4.3% 4San Francisco-Oakland et al, CA 4.4% 5Washington et al, DC-VA-MD-WV 4.5% 6Seattle-Tacoma-Bellevue, WA 4.8% 7Philadelphia et al, PA-NJ-DE-MD 5.0% 8San Diego-Carlsbad, CA 5.2% 9Baltimore-Columbia-Towson, MD 5.5% 10Tampa-St. Petersburg et al, FL 5.5% 10St. Louis, MO-IL 5.6% 12Phoenix-Mesa-Scottsdale, AZ 5.6% 12New York-Newark et al, NY-NJ-PA 5.6% 12Chicago et al, IL-IN-WI 5.6% 12Miami-Fort Lauderdale et al, FL 5.6% 12Atlanta-Sandy Springs et al, GA 6.4% 17Los Angeles-Long Beach et al, CA 6.7% 18Detroit-Warren-Dearborn, MI 6.7% 18Riverside et al, CA 7.2% 20
Average (Ex. Miami) 5.3%Sources: BLS 2015.
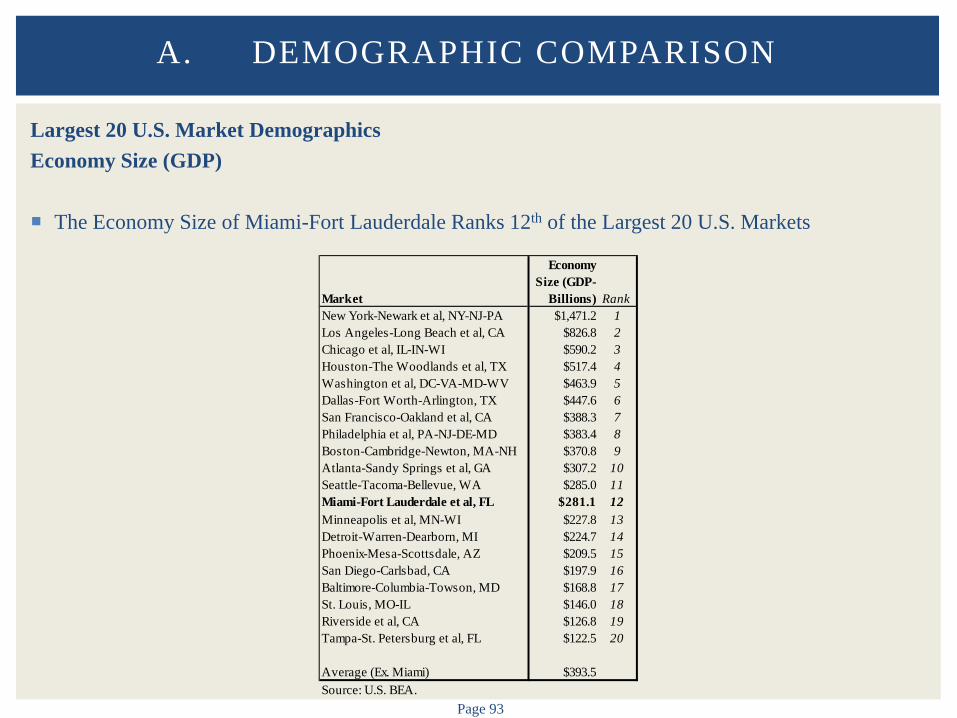
Page 93
Largest 20 U.S. Market Demographics Economy Size (GDP)
The Economy Size of Miami-Fort Lauderdale Ranks 12th of the Largest 20 U.S. Markets
A. DEMOGRAPHIC COMPARISON
Market
Economy Size (GDP-
Billions) RankNew York-Newark et al, NY-NJ-PA $1,471.2 1Los Angeles-Long Beach et al, CA $826.8 2Chicago et al, IL-IN-WI $590.2 3Houston-The Woodlands et al, TX $517.4 4Washington et al, DC-VA-MD-WV $463.9 5Dallas-Fort Worth-Arlington, TX $447.6 6San Francisco-Oakland et al, CA $388.3 7Philadelphia et al, PA-NJ-DE-MD $383.4 8Boston-Cambridge-Newton, MA-NH $370.8 9Atlanta-Sandy Springs et al, GA $307.2 10Seattle-Tacoma-Bellevue, WA $285.0 11Miami-Fort Lauderdale et al, FL $281.1 12Minneapolis et al, MN-WI $227.8 13Detroit-Warren-Dearborn, MI $224.7 14Phoenix-Mesa-Scottsdale, AZ $209.5 15San Diego-Carlsbad, CA $197.9 16Baltimore-Columbia-Towson, MD $168.8 17St. Louis, MO-IL $146.0 18Riverside et al, CA $126.8 19Tampa-St. Petersburg et al, FL $122.5 20
Average (Ex. Miami) $393.5Source: U.S. BEA.
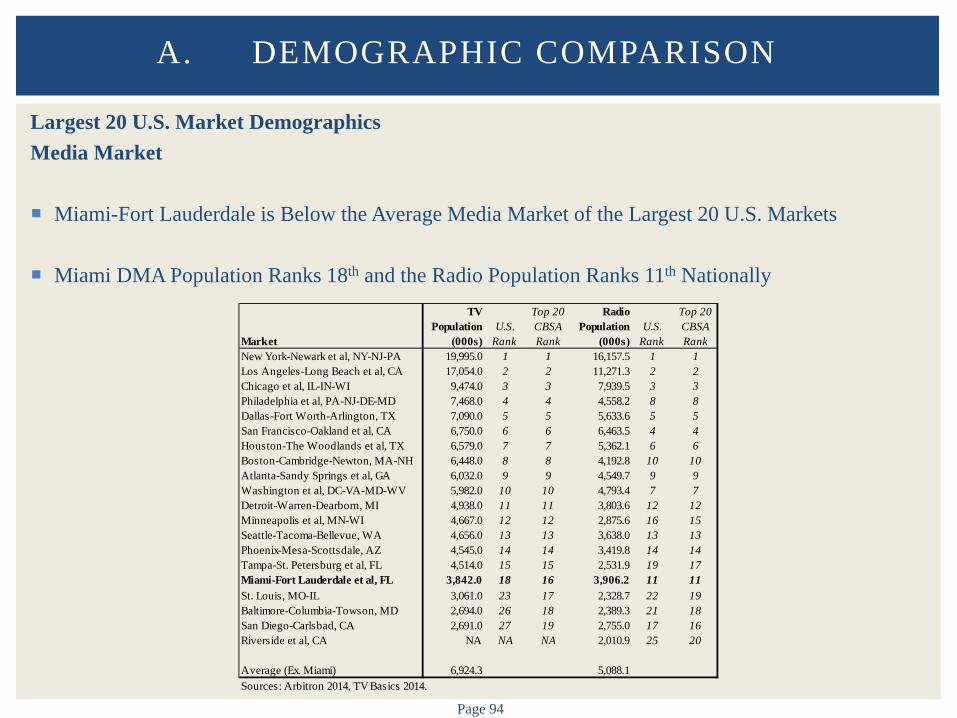
Page 94
Largest 20 U.S. Market Demographics Media Market
Miami-Fort Lauderdale is Below the Average Media Market of the Largest 20 U.S. Markets
Miami DMA Population Ranks 18th and the Radio Population Ranks 11th Nationally
A. DEMOGRAPHIC COMPARISON
Market
TV Population
(000s)U.S.
Rank
Top 20 CBSA Rank
Radio Population
(000s)U.S.
Rank
Top 20 CBSA Rank
New York-Newark et al, NY-NJ-PA 19,995.0 1 1 16,157.5 1 1Los Angeles-Long Beach et al, CA 17,054.0 2 2 11,271.3 2 2Chicago et al, IL-IN-WI 9,474.0 3 3 7,939.5 3 3Philadelphia et al, PA-NJ-DE-MD 7,468.0 4 4 4,558.2 8 8Dallas-Fort Worth-Arlington, TX 7,090.0 5 5 5,633.6 5 5San Francisco-Oakland et al, CA 6,750.0 6 6 6,463.5 4 4Houston-The Woodlands et al, TX 6,579.0 7 7 5,362.1 6 6Boston-Cambridge-Newton, MA-NH 6,448.0 8 8 4,192.8 10 10Atlanta-Sandy Springs et al, GA 6,032.0 9 9 4,549.7 9 9Washington et al, DC-VA-MD-WV 5,982.0 10 10 4,793.4 7 7Detroit-Warren-Dearborn, MI 4,938.0 11 11 3,803.6 12 12Minneapolis et al, MN-WI 4,667.0 12 12 2,875.6 16 15Seattle-Tacoma-Bellevue, WA 4,656.0 13 13 3,638.0 13 13Phoenix-Mesa-Scottsdale, AZ 4,545.0 14 14 3,419.8 14 14Tampa-St. Petersburg et al, FL 4,514.0 15 15 2,531.9 19 17Miami-Fort Lauderdale et al, FL 3,842.0 18 16 3,906.2 11 11St. Louis, MO-IL 3,061.0 23 17 2,328.7 22 19Baltimore-Columbia-Towson, MD 2,694.0 26 18 2,389.3 21 18San Diego-Carlsbad, CA 2,691.0 27 19 2,755.0 17 16Riverside et al, CA NA NA NA 2,010.9 25 20
Average (Ex. Miami) 6,924.3 5,088.1Sources: Arbitron 2014, TV Basics 2014.

Page 95
Largest 20 U.S. Market Demographics Corporate Base
The Corporate Base of Miami-Fort Lauderdale Generally Ranks Below the Average of the Largest 20
U.S. Markets
A. DEMOGRAPHIC COMPARISON
Market
Companies w/ $20mm
Sales Rank
Companies w/ $50mm
Sales Rank
Companies w/ $100mm
Sales Rank
Companies w/ 500+
Employees RankNew York-Newark et al, NY-NJ-PA 7,715 1 3,387 1 2,044 1 1,448 1Los Angeles-Long Beach et al, CA 4,505 2 1,712 2 926 3 860 2Chicago et al, IL-IN-WI 3,828 3 1,649 3 960 2 770 3Houston-The Woodlands et al, TX 2,556 4 1,184 4 767 4 428 8Dallas-Fort Worth-Arlington, TX 2,444 5 1,126 5 672 5 498 6Washington et al, DC-VA-MD-WV 2,441 6 992 7 587 7 664 4Philadelphia et al, PA-NJ-DE-MD 2,313 7 1,002 6 599 6 584 5Boston-Cambridge-Newton, MA-NH 2,213 8 944 8 546 8 469 7Atlanta-Sandy Springs et al, GA 1,798 9 814 9 523 9 378 9San Francisco-Oakland et al, CA 1,747 10 727 10 412 10 318 11Miami-Fort Lauderdale et al, FL 1,638 11 629 13 324 13 304 12Detroit-Warren-Dearborn, MI 1,599 12 643 11 364 11 337 10Minneapolis et al, MN-WI 1,550 13 639 12 357 12 296 13Seattle-Tacoma-Bellevue, WA 1,120 14 436 15 236 15 266 14St. Louis, MO-IL 1,078 15 458 14 271 14 227 17Phoenix-Mesa-Scottsdale, AZ 999 16 384 16 218 16 262 15San Diego-Carlsbad, CA 978 17 355 17 200 17 214 18Baltimore-Columbia-Towson, MD 820 18 326 18 183 18 230 16Tampa-St. Petersburg et al, FL 688 19 280 19 157 19 166 19Riverside et al, CA 662 20 199 20 99 20 131 20
Average (Ex. Miami) 2,161 908 533 450Source: Hoovers 2014, Sitewise 2014.
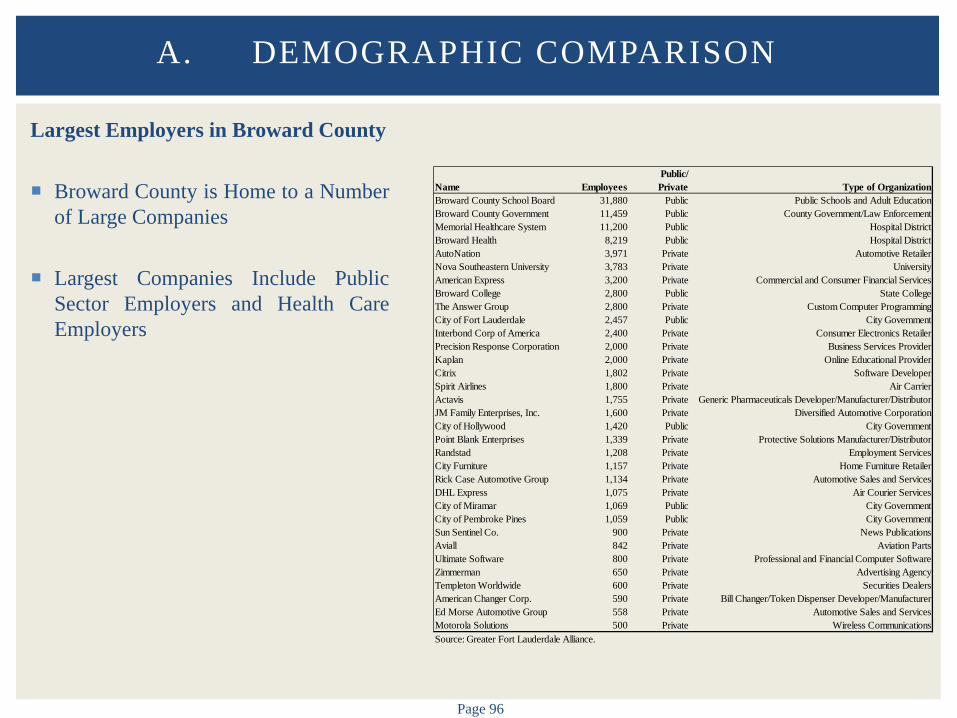
Page 96
Largest Employers in Broward County
Broward County is Home to a Number of Large Companies
Largest Companies Include Public Sector Employers and Health Care Employers
A. DEMOGRAPHIC COMPARISON
Name EmployeesPublic/
Private Type of OrganizationBroward County School Board 31,880 Public Public Schools and Adult EducationBroward County Government 11,459 Public County Government/Law EnforcementMemorial Healthcare System 11,200 Public Hospital DistrictBroward Health 8,219 Public Hospital DistrictAutoNation 3,971 Private Automotive RetailerNova Southeastern University 3,783 Private UniversityAmerican Express 3,200 Private Commercial and Consumer Financial ServicesBroward College 2,800 Public State CollegeThe Answer Group 2,800 Private Custom Computer ProgrammingCity of Fort Lauderdale 2,457 Public City GovernmentInterbond Corp of America 2,400 Private Consumer Electronics RetailerPrecision Response Corporation 2,000 Private Business Services ProviderKaplan 2,000 Private Online Educational ProviderCitrix 1,802 Private Software DeveloperSpirit Airlines 1,800 Private Air CarrierActavis 1,755 Private Generic Pharmaceuticals Developer/Manufacturer/DistributorJM Family Enterprises, Inc. 1,600 Private Diversified Automotive CorporationCity of Hollywood 1,420 Public City GovernmentPoint Blank Enterprises 1,339 Private Protective Solutions Manufacturer/DistributorRandstad 1,208 Private Employment ServicesCity Furniture 1,157 Private Home Furniture RetailerRick Case Automotive Group 1,134 Private Automotive Sales and ServicesDHL Express 1,075 Private Air Courier ServicesCity of Miramar 1,069 Public City GovernmentCity of Pembroke Pines 1,059 Public City GovernmentSun Sentinel Co. 900 Private News PublicationsAviall 842 Private Aviation PartsUltimate Software 800 Private Professional and Financial Computer SoftwareZimmerman 650 Private Advertising AgencyTempleton Worldwide 600 Private Securities DealersAmerican Changer Corp. 590 Private Bill Changer/Token Dispenser Developer/ManufacturerEd Morse Automotive Group 558 Private Automotive Sales and ServicesMotorola Solutions 500 Private Wireless CommunicationsSource: Greater Fort Lauderdale Alliance.
Page 97
Largest 20 U.S. Market Demographics
The Consulting Team has Analyzed the Inventory of Sports Facilities with Over 10,000 Seats Compared to the Market Characteristics of the Largest 20 U.S. Markets to Better Understand the Seat, Luxury Suite, and Club Seat Inventory in the Comparable Markets
Evaluated the Following Ratios
Population Per Seat Companies Per Suite High Income Households Per Club Seat
Miami-Fort Lauderdale Market Includes the Following Sports Facilities with Over 10,000 Seats
BB&T Center AmericanAirlines Arena Sun Life Stadium Marlins Park FIU Stadium
A. DEMOGRAPHIC COMPARISON
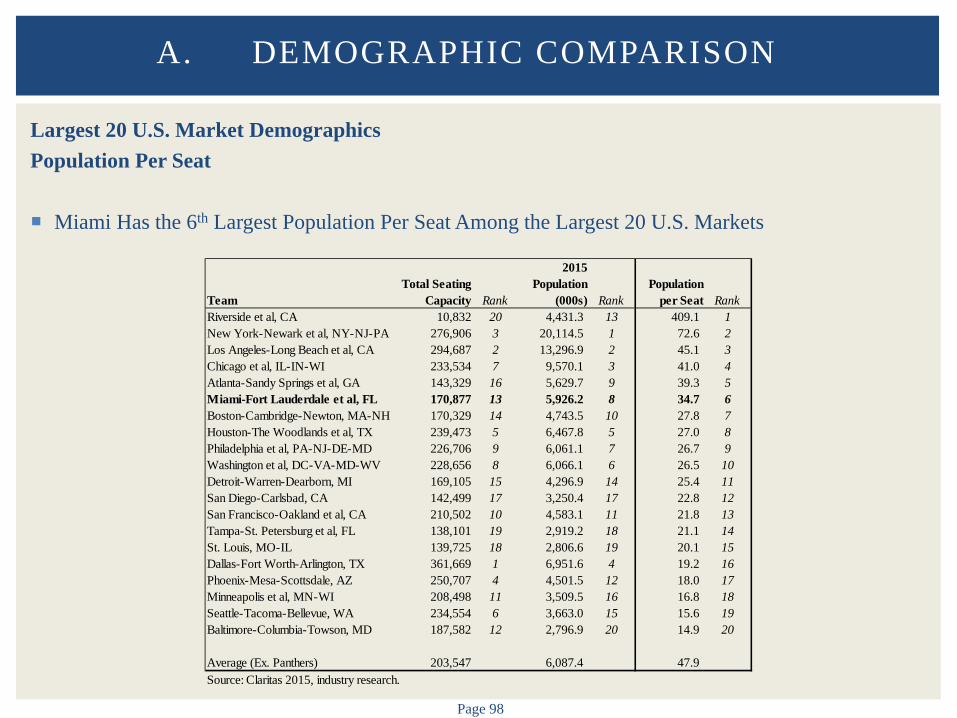
Page 98
Largest 20 U.S. Market Demographics Population Per Seat
Miami Has the 6th Largest Population Per Seat Among the Largest 20 U.S. Markets
A. DEMOGRAPHIC COMPARISON
TeamTotal Seating
Capacity Rank
2015 Population
(000s) RankPopulation
per Seat RankRiverside et al, CA 10,832 20 4,431.3 13 409.1 1New York-Newark et al, NY-NJ-PA 276,906 3 20,114.5 1 72.6 2Los Angeles-Long Beach et al, CA 294,687 2 13,296.9 2 45.1 3Chicago et al, IL-IN-WI 233,534 7 9,570.1 3 41.0 4Atlanta-Sandy Springs et al, GA 143,329 16 5,629.7 9 39.3 5Miami-Fort Lauderdale et al, FL 170,877 13 5,926.2 8 34.7 6Boston-Cambridge-Newton, MA-NH 170,329 14 4,743.5 10 27.8 7Houston-The Woodlands et al, TX 239,473 5 6,467.8 5 27.0 8Philadelphia et al, PA-NJ-DE-MD 226,706 9 6,061.1 7 26.7 9Washington et al, DC-VA-MD-WV 228,656 8 6,066.1 6 26.5 10Detroit-Warren-Dearborn, MI 169,105 15 4,296.9 14 25.4 11San Diego-Carlsbad, CA 142,499 17 3,250.4 17 22.8 12San Francisco-Oakland et al, CA 210,502 10 4,583.1 11 21.8 13Tampa-St. Petersburg et al, FL 138,101 19 2,919.2 18 21.1 14St. Louis, MO-IL 139,725 18 2,806.6 19 20.1 15Dallas-Fort Worth-Arlington, TX 361,669 1 6,951.6 4 19.2 16Phoenix-Mesa-Scottsdale, AZ 250,707 4 4,501.5 12 18.0 17Minneapolis et al, MN-WI 208,498 11 3,509.5 16 16.8 18Seattle-Tacoma-Bellevue, WA 234,554 6 3,663.0 15 15.6 19Baltimore-Columbia-Towson, MD 187,582 12 2,796.9 20 14.9 20
Average (Ex. Panthers) 203,547 6,087.4 47.9Source: Claritas 2015, industry research.
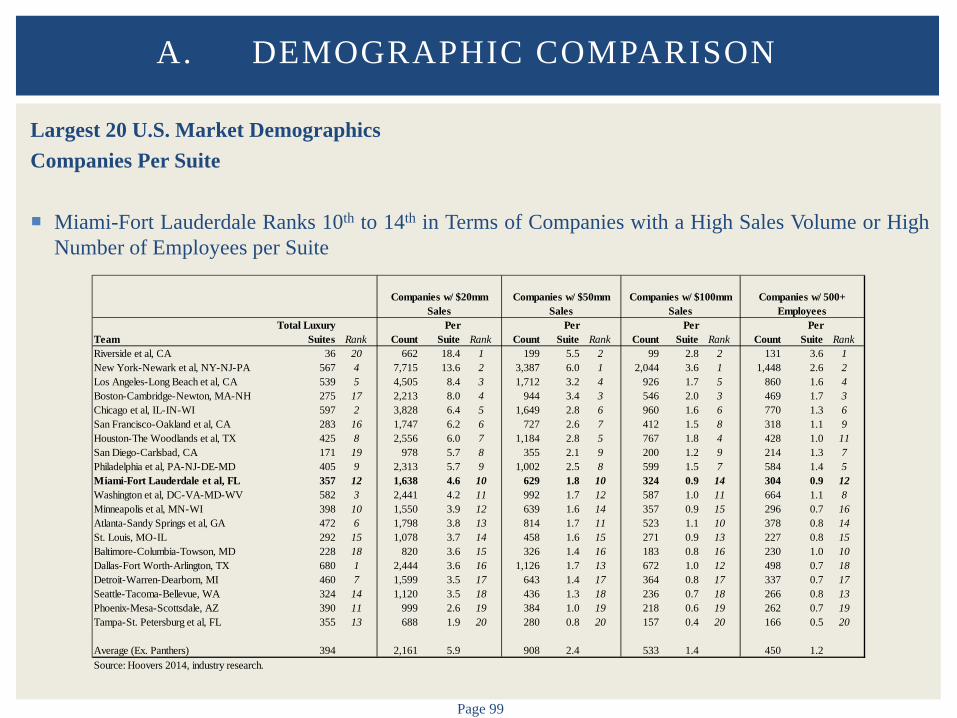
Page 99
Largest 20 U.S. Market Demographics Companies Per Suite
Miami-Fort Lauderdale Ranks 10th to 14th in Terms of Companies with a High Sales Volume or High
Number of Employees per Suite
A. DEMOGRAPHIC COMPARISON
TeamTotal Luxury
Suites Rank CountPer
Suite Rank CountPer
Suite Rank CountPer
Suite Rank CountPer
Suite RankRiverside et al, CA 36 20 662 18.4 1 199 5.5 2 99 2.8 2 131 3.6 1New York-Newark et al, NY-NJ-PA 567 4 7,715 13.6 2 3,387 6.0 1 2,044 3.6 1 1,448 2.6 2Los Angeles-Long Beach et al, CA 539 5 4,505 8.4 3 1,712 3.2 4 926 1.7 5 860 1.6 4Boston-Cambridge-Newton, MA-NH 275 17 2,213 8.0 4 944 3.4 3 546 2.0 3 469 1.7 3Chicago et al, IL-IN-WI 597 2 3,828 6.4 5 1,649 2.8 6 960 1.6 6 770 1.3 6San Francisco-Oakland et al, CA 283 16 1,747 6.2 6 727 2.6 7 412 1.5 8 318 1.1 9Houston-The Woodlands et al, TX 425 8 2,556 6.0 7 1,184 2.8 5 767 1.8 4 428 1.0 11San Diego-Carlsbad, CA 171 19 978 5.7 8 355 2.1 9 200 1.2 9 214 1.3 7Philadelphia et al, PA-NJ-DE-MD 405 9 2,313 5.7 9 1,002 2.5 8 599 1.5 7 584 1.4 5Miami-Fort Lauderdale et al, FL 357 12 1,638 4.6 10 629 1.8 10 324 0.9 14 304 0.9 12Washington et al, DC-VA-MD-WV 582 3 2,441 4.2 11 992 1.7 12 587 1.0 11 664 1.1 8Minneapolis et al, MN-WI 398 10 1,550 3.9 12 639 1.6 14 357 0.9 15 296 0.7 16Atlanta-Sandy Springs et al, GA 472 6 1,798 3.8 13 814 1.7 11 523 1.1 10 378 0.8 14St. Louis, MO-IL 292 15 1,078 3.7 14 458 1.6 15 271 0.9 13 227 0.8 15Baltimore-Columbia-Towson, MD 228 18 820 3.6 15 326 1.4 16 183 0.8 16 230 1.0 10Dallas-Fort Worth-Arlington, TX 680 1 2,444 3.6 16 1,126 1.7 13 672 1.0 12 498 0.7 18Detroit-Warren-Dearborn, MI 460 7 1,599 3.5 17 643 1.4 17 364 0.8 17 337 0.7 17Seattle-Tacoma-Bellevue, WA 324 14 1,120 3.5 18 436 1.3 18 236 0.7 18 266 0.8 13Phoenix-Mesa-Scottsdale, AZ 390 11 999 2.6 19 384 1.0 19 218 0.6 19 262 0.7 19Tampa-St. Petersburg et al, FL 355 13 688 1.9 20 280 0.8 20 157 0.4 20 166 0.5 20
Average (Ex. Panthers) 394 2,161 5.9 908 2.4 533 1.4 450 1.2Source: Hoovers 2014, industry research.
Companies w/ $20mm Sales
Companies w/ 500+ Employees
Companies w/ $50mm Sales
Companies w/ $100mm Sales
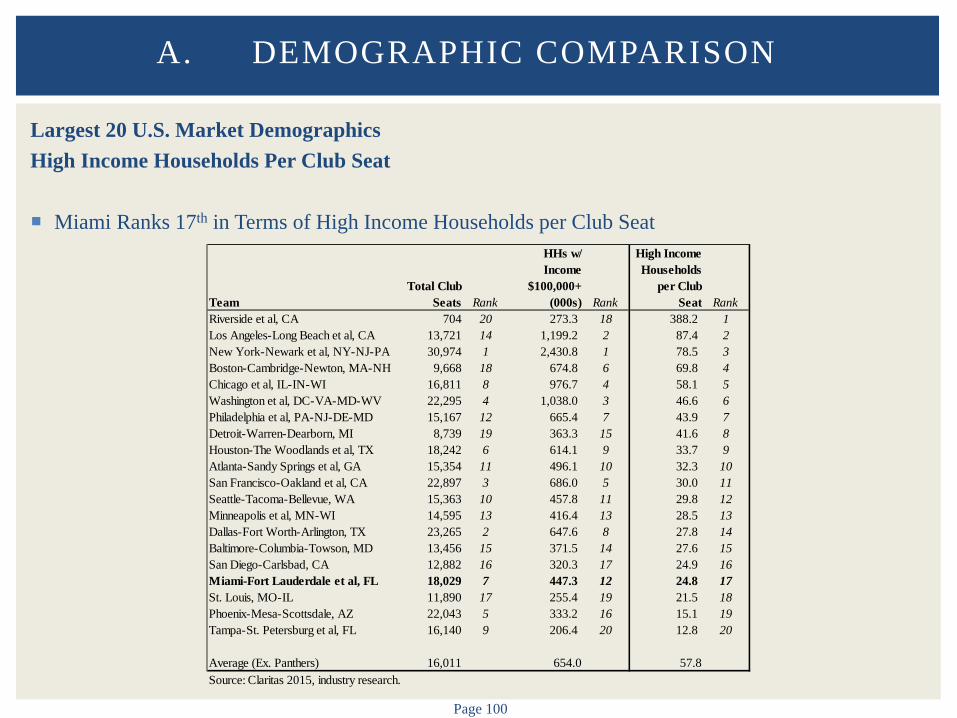
Page 100
Largest 20 U.S. Market Demographics High Income Households Per Club Seat
Miami Ranks 17th in Terms of High Income Households per Club Seat
A. DEMOGRAPHIC COMPARISON
TeamTotal Club
Seats Rank
HHs w/ Income
$100,000+ (000s) Rank
High Income Households
per Club Seat Rank
Riverside et al, CA 704 20 273.3 18 388.2 1Los Angeles-Long Beach et al, CA 13,721 14 1,199.2 2 87.4 2New York-Newark et al, NY-NJ-PA 30,974 1 2,430.8 1 78.5 3Boston-Cambridge-Newton, MA-NH 9,668 18 674.8 6 69.8 4Chicago et al, IL-IN-WI 16,811 8 976.7 4 58.1 5Washington et al, DC-VA-MD-WV 22,295 4 1,038.0 3 46.6 6Philadelphia et al, PA-NJ-DE-MD 15,167 12 665.4 7 43.9 7Detroit-Warren-Dearborn, MI 8,739 19 363.3 15 41.6 8Houston-The Woodlands et al, TX 18,242 6 614.1 9 33.7 9Atlanta-Sandy Springs et al, GA 15,354 11 496.1 10 32.3 10San Francisco-Oakland et al, CA 22,897 3 686.0 5 30.0 11Seattle-Tacoma-Bellevue, WA 15,363 10 457.8 11 29.8 12Minneapolis et al, MN-WI 14,595 13 416.4 13 28.5 13Dallas-Fort Worth-Arlington, TX 23,265 2 647.6 8 27.8 14Baltimore-Columbia-Towson, MD 13,456 15 371.5 14 27.6 15San Diego-Carlsbad, CA 12,882 16 320.3 17 24.9 16Miami-Fort Lauderdale et al, FL 18,029 7 447.3 12 24.8 17St. Louis, MO-IL 11,890 17 255.4 19 21.5 18Phoenix-Mesa-Scottsdale, AZ 22,043 5 333.2 16 15.1 19Tampa-St. Petersburg et al, FL 16,140 9 206.4 20 12.8 20
Average (Ex. Panthers) 16,011 654.0 57.8Source: Claritas 2015, industry research.
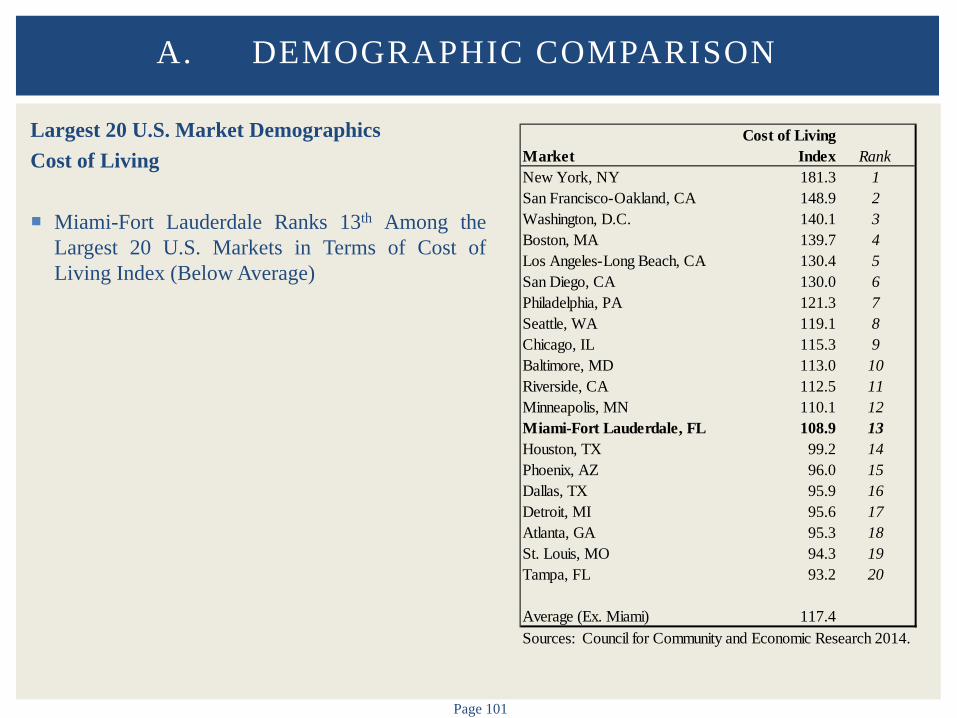
Page 101
Largest 20 U.S. Market Demographics Cost of Living
Miami-Fort Lauderdale Ranks 13th Among the
Largest 20 U.S. Markets in Terms of Cost of Living Index (Below Average)
A. DEMOGRAPHIC COMPARISON
MarketCost of Living
Index RankNew York, NY 181.3 1San Francisco-Oakland, CA 148.9 2Washington, D.C. 140.1 3Boston, MA 139.7 4Los Angeles-Long Beach, CA 130.4 5San Diego, CA 130.0 6Philadelphia, PA 121.3 7Seattle, WA 119.1 8Chicago, IL 115.3 9Baltimore, MD 113.0 10Riverside, CA 112.5 11Minneapolis, MN 110.1 12Miami-Fort Lauderdale, FL 108.9 13Houston, TX 99.2 14Phoenix, AZ 96.0 15Dallas, TX 95.9 16Detroit, MI 95.6 17Atlanta, GA 95.3 18St. Louis, MO 94.3 19Tampa, FL 93.2 20
Average (Ex. Miami) 117.4Sources: Council for Community and Economic Research 2014.
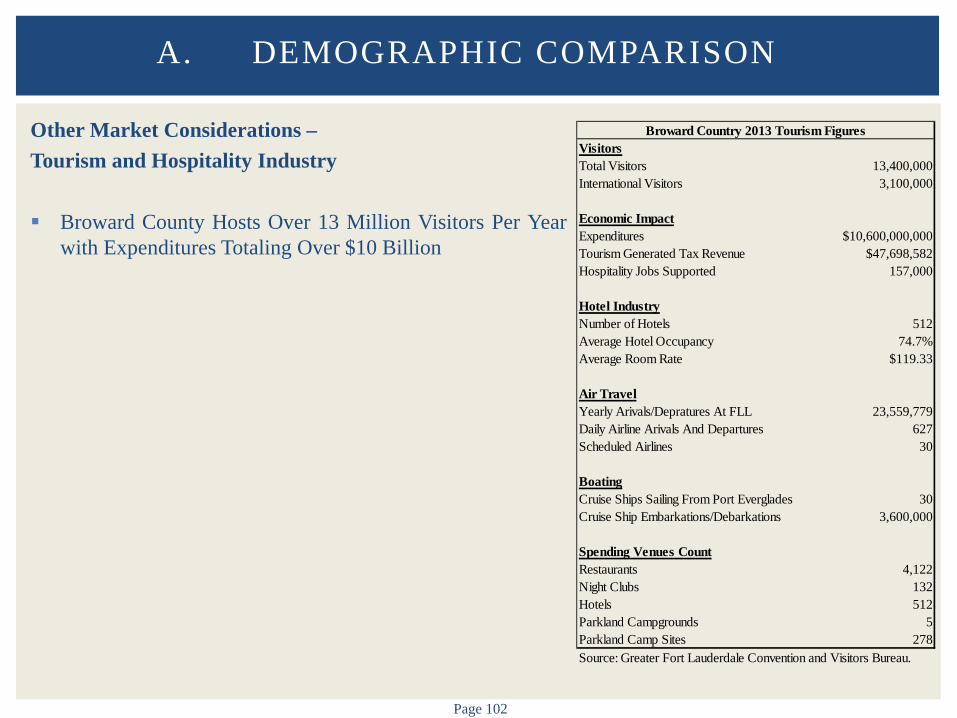
Page 102
Other Market Considerations – Tourism and Hospitality Industry Broward County Hosts Over 13 Million Visitors Per Year
with Expenditures Totaling Over $10 Billion
A. DEMOGRAPHIC COMPARISON
VisitorsTotal Visitors 13,400,000International Visitors 3,100,000
Economic ImpactExpenditures $10,600,000,000Tourism Generated Tax Revenue $47,698,582Hospitality Jobs Supported 157,000
Hotel IndustryNumber of Hotels 512Average Hotel Occupancy 74.7%Average Room Rate $119.33
Air TravelYearly Arivals/Depratures At FLL 23,559,779Daily Airline Arivals And Departures 627Scheduled Airlines 30
BoatingCruise Ships Sailing From Port Everglades 30Cruise Ship Embarkations/Debarkations 3,600,000
Spending Venues CountRestaurants 4,122Night Clubs 132Hotels 512Parkland Campgrounds 5Parkland Camp Sites 278Source: Greater Fort Lauderdale Convention and Visitors Bureau.
Broward Country 2013 Tourism Figures
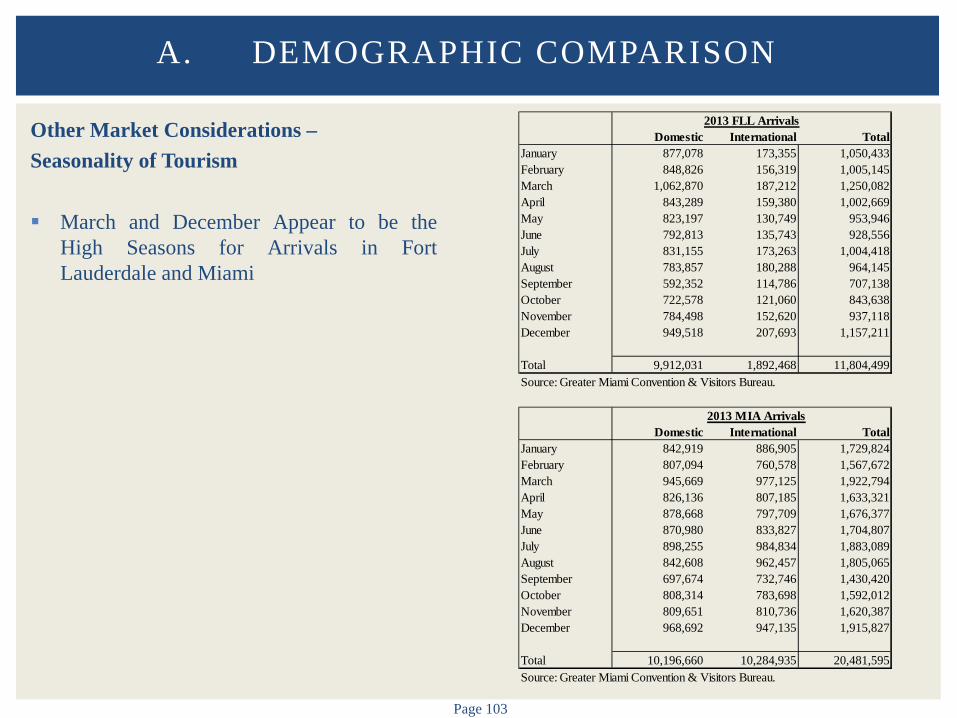
Page 103
Other Market Considerations – Seasonality of Tourism March and December Appear to be the
High Seasons for Arrivals in Fort Lauderdale and Miami
A. DEMOGRAPHIC COMPARISON
Domestic International TotalJanuary 877,078 173,355 1,050,433February 848,826 156,319 1,005,145March 1,062,870 187,212 1,250,082April 843,289 159,380 1,002,669May 823,197 130,749 953,946June 792,813 135,743 928,556July 831,155 173,263 1,004,418August 783,857 180,288 964,145September 592,352 114,786 707,138October 722,578 121,060 843,638November 784,498 152,620 937,118December 949,518 207,693 1,157,211
Total 9,912,031 1,892,468 11,804,499Source: Greater Miami Convention & Visitors Bureau.
2013 FLL Arrivals
2013 MIA ArrivalsDomestic International Total
January 842,919 886,905 1,729,824February 807,094 760,578 1,567,672March 945,669 977,125 1,922,794April 826,136 807,185 1,633,321May 878,668 797,709 1,676,377June 870,980 833,827 1,704,807July 898,255 984,834 1,883,089August 842,608 962,457 1,805,065September 697,674 732,746 1,430,420October 808,314 783,698 1,592,012November 809,651 810,736 1,620,387December 968,692 947,135 1,915,827
Total 10,196,660 10,284,935 20,481,595Source: Greater Miami Convention & Visitors Bureau.
Page 104
General Observations – Demographic Comparison Miami-Fort Lauderdale is Generally a Strong Market in Terms of Population and Households
Miami-Fort Lauderdale has Strong Expected Population Growth Over Next 10 Years
Relative Weakness in Median Household Income is Somewhat Offset by Relatively High
Percentage of High Income Households in Miami-Fort Lauderdale
Miami-Fort Lauderdale Generally has an Older Population than the Comparable Markets
In Terms of Population Per Seat and Luxury Suite Per Company, the Miami-Fort Lauderdale Market is Not Overly Saturated as Compared to the Largest 20 U.S. Markets – In Terms of High Income Households to Club Seats, the Market Does Not Rank Favorably
Miami-Fort Lauderdale Benefits from being a Strong Tourist Market – Could Impact Arena Demand for Certain Events (Over 13 Million Tourists to Broward County in 2013)
A. DEMOGRAPHIC COMPARISON
B. COMPETITIVE FACILITIES
Page 106
Competitive Facilities
Existing and Planned Inventory of Arenas/Stadiums in the Miami-Fort Lauderdale Market Provide Competition
Direct Competition from Comparable Arenas, as well as Indirect Competition from Stadiums, Amphitheaters, Performing Arts Centers (to a Lesser Degree), and Other Entertainment Alternatives Must be Considered
Patrons Events/Tenants Advertising/Sponsorships Premium Seating Other
B. COMPETITIVE FACILITIES
Page 107
Competitive Facilities
Numerous Competitive Facilities in the Market
AmericanAirlines Arena Hard Rock Live Arena Perfect Vodka Amphitheatre BankUnited Center Sun Life Stadium Marlins Stadium
Significant Inventory/Supply of Sponsorship Opportunities and Premium Seating (Luxury Suites/Club
Seats) in Market Area
AmericanAirlines Arena in Downtown Miami Provides the Most Significant Competition to BB&T Center
B. COMPETITIVE FACILITIES

Page 108
AmericanAirlines Arena – Miami, FL AmericanAirlines Arena (AAA) is home to the NBA Miami Heat. The arena opened in 1999 at a reported cost of $213 million, and is currently managed by AEG (reportedly a services agreement). The arena seats 19,600 with 80 luxury suites/loge boxes and 1,100 club seats. AmericanAirlines Arena replaced the Miami Arena and joined BB&T Center in the greater market area. Tenants Miami Heat (NBA)
B. COMPETITIVE FACILITIES
Arena: AmericanAirlines Arena
Year Open/Renovated: 1999
Total Cost: $213 Million
Contractor: Morse Diesel/Odebrecht Construction
Architect: Arquitectonica/Thornton/M&H
Management: AEG
Concessionaire: Levy Restaurants
Total Seating Capacity: 19,600
Luxury Suites: 80
Club Seats: 1,100
Market Population: 5,926,167
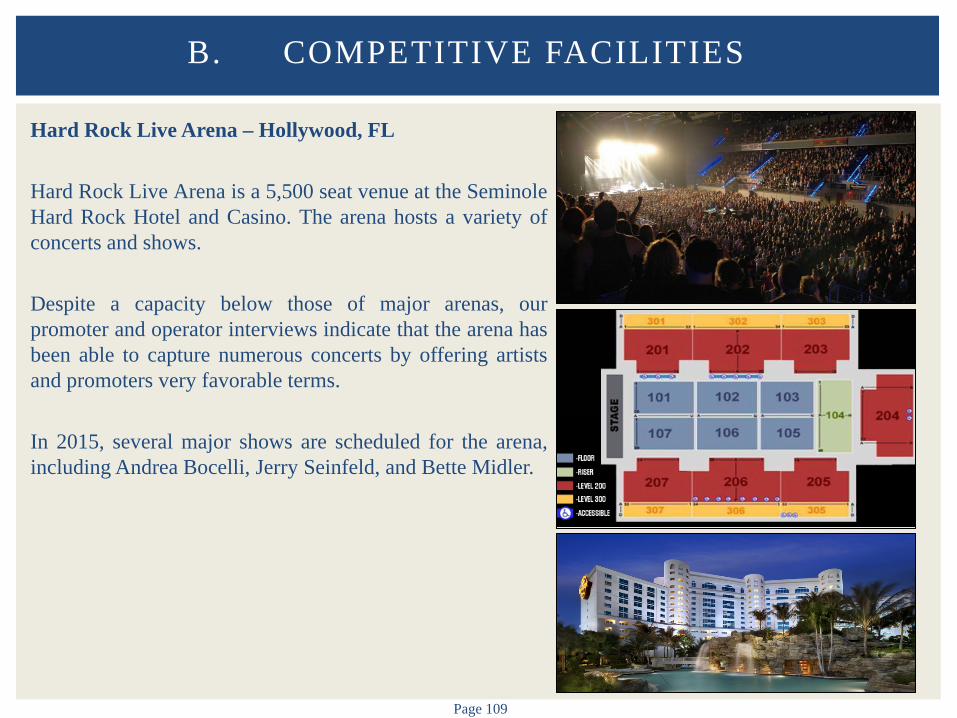
Page 109
Hard Rock Live Arena – Hollywood, FL Hard Rock Live Arena is a 5,500 seat venue at the Seminole Hard Rock Hotel and Casino. The arena hosts a variety of concerts and shows. Despite a capacity below those of major arenas, our promoter and operator interviews indicate that the arena has been able to capture numerous concerts by offering artists and promoters very favorable terms. In 2015, several major shows are scheduled for the arena, including Andrea Bocelli, Jerry Seinfeld, and Bette Midler.
B. COMPETITIVE FACILITIES

Page 110
Perfect Vodka Amphitheatre – West Palm Beach, FL Operated by Live Nation, the Perfect Vodka Amphitheatre opened in 1996. Located in Inland West Palm at the South Florida Fairgrounds, the amphitheater is an outdoor music and event venue holding up to 19,000 patrons. The venue’s naming rights sponsorship with Cruzan Rum recently ended and was temporarily renamed Coral Sky Amphitheatre until Live Nation found a new partner in June 2015.
B. COMPETITIVE FACILITIES
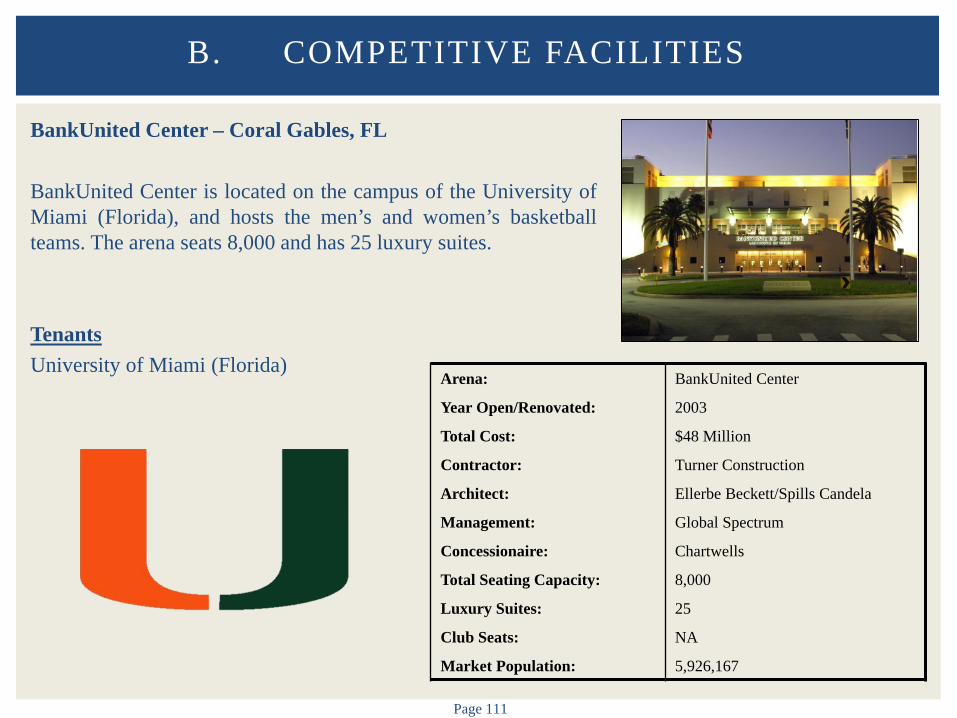
Page 111
BankUnited Center – Coral Gables, FL BankUnited Center is located on the campus of the University of Miami (Florida), and hosts the men’s and women’s basketball teams. The arena seats 8,000 and has 25 luxury suites. Tenants University of Miami (Florida)
B. COMPETITIVE FACILITIES
Arena: BankUnited Center
Year Open/Renovated: 2003
Total Cost: $48 Million
Contractor: Turner Construction
Architect: Ellerbe Beckett/Spills Candela
Management: Global Spectrum
Concessionaire: Chartwells
Total Seating Capacity: 8,000
Luxury Suites: 25
Club Seats: NA
Market Population: 5,926,167
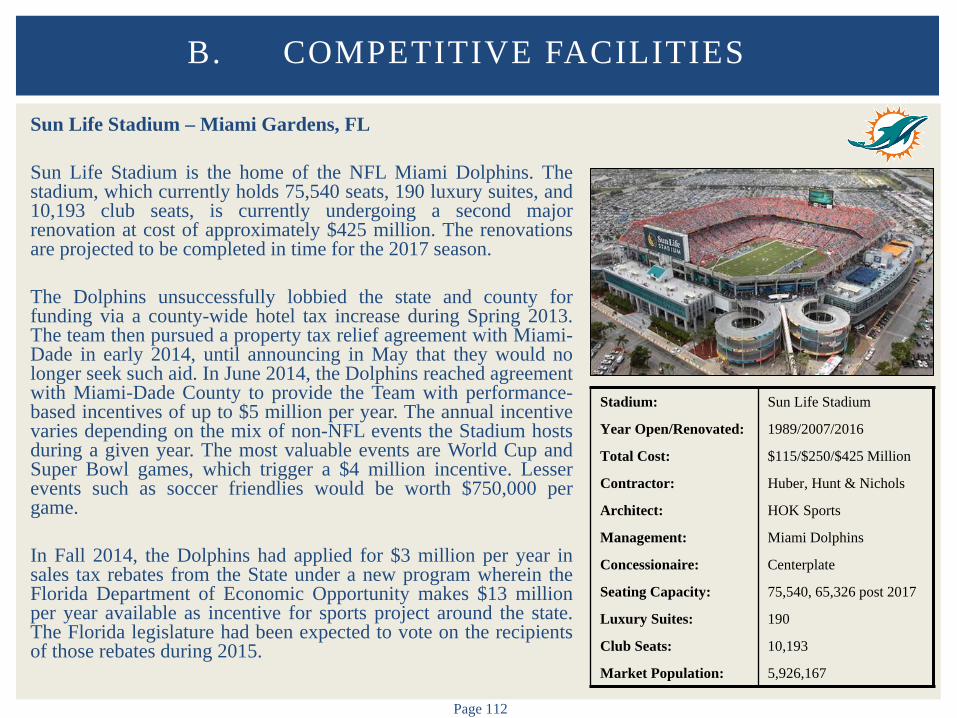
Page 112
Sun Life Stadium – Miami Gardens, FL Sun Life Stadium is the home of the NFL Miami Dolphins. The stadium, which currently holds 75,540 seats, 190 luxury suites, and 10,193 club seats, is currently undergoing a second major renovation at cost of approximately $425 million. The renovations are projected to be completed in time for the 2017 season. The Dolphins unsuccessfully lobbied the state and county for funding via a county-wide hotel tax increase during Spring 2013. The team then pursued a property tax relief agreement with Miami-Dade in early 2014, until announcing in May that they would no longer seek such aid. In June 2014, the Dolphins reached agreement with Miami-Dade County to provide the Team with performance-based incentives of up to $5 million per year. The annual incentive varies depending on the mix of non-NFL events the Stadium hosts during a given year. The most valuable events are World Cup and Super Bowl games, which trigger a $4 million incentive. Lesser events such as soccer friendlies would be worth $750,000 per game. In Fall 2014, the Dolphins had applied for $3 million per year in sales tax rebates from the State under a new program wherein the Florida Department of Economic Opportunity makes $13 million per year available as incentive for sports project around the state. The Florida legislature had been expected to vote on the recipients of those rebates during 2015.
B. COMPETITIVE FACILITIES
Stadium: Sun Life Stadium
Year Open/Renovated: 1989/2007/2016
Total Cost: $115/$250/$425 Million
Contractor: Huber, Hunt & Nichols
Architect: HOK Sports
Management: Miami Dolphins
Concessionaire: Centerplate
Seating Capacity: 75,540, 65,326 post 2017
Luxury Suites: 190
Club Seats: 10,193
Market Population: 5,926,167
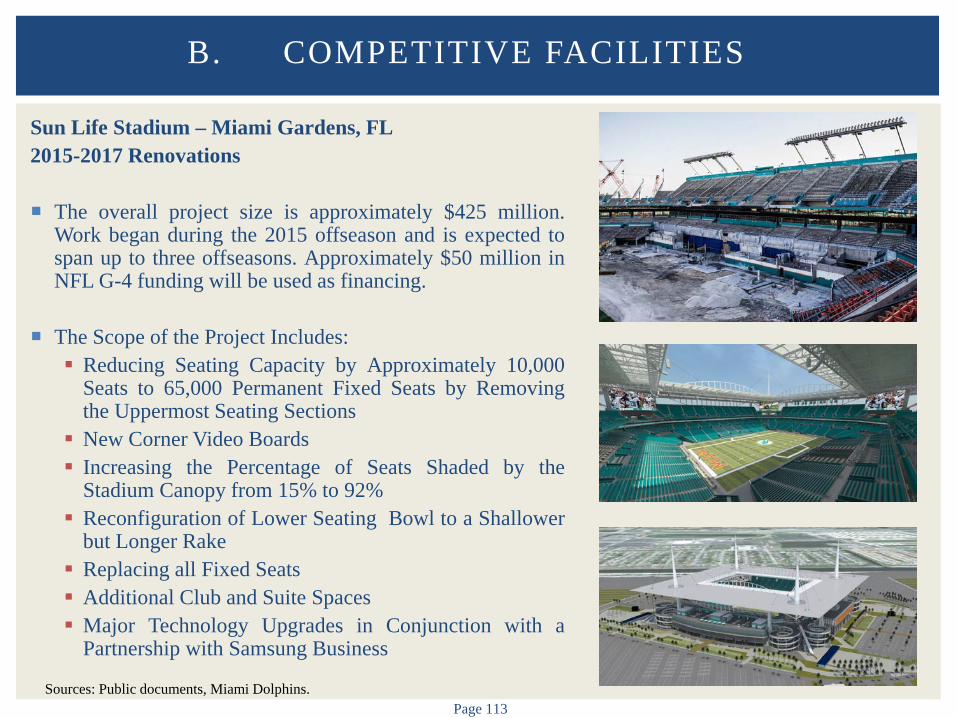
Page 113
Sun Life Stadium – Miami Gardens, FL 2015-2017 Renovations
The overall project size is approximately $425 million.
Work began during the 2015 offseason and is expected to span up to three offseasons. Approximately $50 million in NFL G-4 funding will be used as financing.
The Scope of the Project Includes: Reducing Seating Capacity by Approximately 10,000
Seats to 65,000 Permanent Fixed Seats by Removing the Uppermost Seating Sections
New Corner Video Boards Increasing the Percentage of Seats Shaded by the
Stadium Canopy from 15% to 92% Reconfiguration of Lower Seating Bowl to a Shallower
but Longer Rake Replacing all Fixed Seats Additional Club and Suite Spaces Major Technology Upgrades in Conjunction with a
Partnership with Samsung Business
B. COMPETITIVE FACILITIES
Sources: Public documents, Miami Dolphins.

Page 114
Marlins Park – Miami, FL Marlins Park is home to the MLB Miami Marlins, and was completed in 2012 at a cost of $634 million. The stadium holds 37,422 seats, 39 luxury suites, and 3,000 club seats. Tenants Miami Marlins (MLB)
B. COMPETITIVE FACILITIES
Stadium: Marlins Park
Year Open/Renovated: 2012
Total Cost: $634 Million
Contractor: Hunt/Moss
Architect: Populous
Management: Miami Marlins
Concessionaire: Levy Restaurants
Total Seating Capacity: 37,422
Luxury Suites: 39
Club Seats: 3,000
Market Population: 5,926,167

Page 115
Notable Arenas/Amphitheaters – Region
Klipsch Amphitheater at Bayfront Park: Capacity of 7,500 – Miami, FL
Bayfront Park Hosts Ultra Music Festival, Drawing Over 160,000 Attendees Each Year
Mizner Park Amphitheater: Capacity of 4,200 – Boca Raton, FL Pompano Beach Amphitheater: Capacity of 2,894 – Pompano Beach, FL
Sunset Cove Amphitheater: Capacity of 6,000 – Boca Raton, FL
FIU Arena: Capacity of 5,000 – Miami, FL
FAU Arena: Capacity of 3,500 – Boca Raton, FL
Don Taft University Center (Nova Southeastern University): Capacity of 4,500 – Davie, FL
Bergeron Rodeo Grounds: Capacity of 5,000 – Davie, FL
James L. Knight Center: Capacity of 4,569 – Miami, FL
B. COMPETITIVE FACILITIES

C. PROMOTER/USER INTERVIEWS
Page 117
Promoter/User Interviews Miami-Fort Lauderdale Considered a Very Strong Concert Market – Tourism and High Income
Households Drive Strong Ticket Prices
Market Anchors “Southeast Swing” of Many Touring Acts (Atlanta Also Anchors)
Market is One of the “Big Three” Markets for Latin-Themed Acts (New York/Los Angeles) Latin Show Promoters Prefer AmericanAirlines Arena Over BB&T Center Latin Show Promoters will Reroute Tour to Hold a Desired Date at AmericanAirlines Arena
High Level of Competition for Acts, Particularly During Outdoor Concert Season
Promoters Indicated Family/Circus/Cirque du Soleil Shows have Developed Separate Operating
History at BB&T Center and AmericanAirlines Arena Traditional Circus has Long Track Record at AmericanAirlines Arena Cirque du Soleil has Long Track Record at BB&T Center – Desire to Distinguish its Shows from
Downtown Big Top Shows is a Driver of Cirque du Soleil Booking Decisions Some Anticipation of Increased Competition Between Venues for Circus Shows
Alternative Concert Venues Such as the Hard Rock Live Arena and Perfect Vodka Amphitheatre
Impact Economics of Two Main Arenas
C. PROMOTER/USER INTERVIEWS
Page 118
Promoter/User Interviews
Promoters Report Very Strong Competition Between the BB&T Center and AmericanAirlines Arena, Resulting in Relatively High Performer Shares, Leaving Smaller Shares for the Arenas and Promoters
For Several Years BB&T Center had a Major Advantage in Market Share for Events – Promoters and Operators Report that the Reason was a Lack of Willingness by AmericanAirlines Arena to Aggressively Compete for Shows – AmericanAirlines Arena began Gaining Market Share in the Middle Part of the 2000s
Promoters Indicated that BB&T Center and AmericanAirlines Arena Perform Similarly as Music Venues – No Major Difference in Economics
Expense Profile and Seating Manifest Similar Between Arenas
Promoters Indicated They Generally have Little Trouble Booking Desirable Dates Year Round –
Promoters Generally Do Not have to Settle for Non-Preferred Dates
Promoters Indicated Significant Competition Between the Two Arenas and Other Facilities – Margins Definitely Affected by Competitive Environment
C. PROMOTER/USER INTERVIEWS
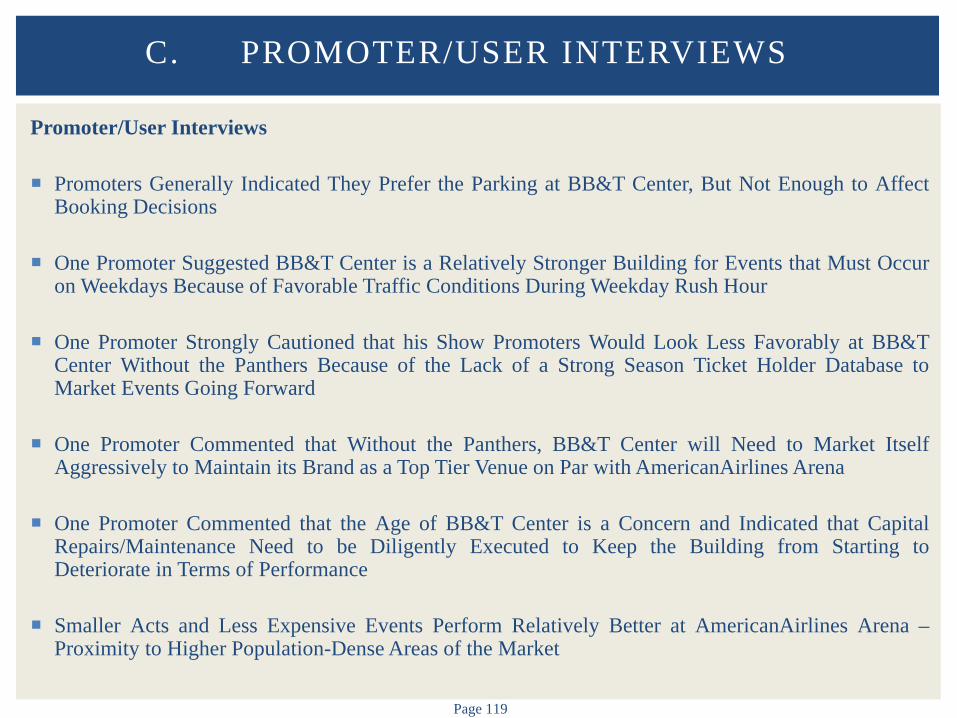
Page 119
Promoter/User Interviews
Promoters Generally Indicated They Prefer the Parking at BB&T Center, But Not Enough to Affect Booking Decisions
One Promoter Suggested BB&T Center is a Relatively Stronger Building for Events that Must Occur on Weekdays Because of Favorable Traffic Conditions During Weekday Rush Hour
One Promoter Strongly Cautioned that his Show Promoters Would Look Less Favorably at BB&T Center Without the Panthers Because of the Lack of a Strong Season Ticket Holder Database to Market Events Going Forward
One Promoter Commented that Without the Panthers, BB&T Center will Need to Market Itself Aggressively to Maintain its Brand as a Top Tier Venue on Par with AmericanAirlines Arena
One Promoter Commented that the Age of BB&T Center is a Concern and Indicated that Capital Repairs/Maintenance Need to be Diligently Executed to Keep the Building from Starting to Deteriorate in Terms of Performance
Smaller Acts and Less Expensive Events Perform Relatively Better at AmericanAirlines Arena –Proximity to Higher Population-Dense Areas of the Market
C. PROMOTER/USER INTERVIEWS

D. MARKET SHARE
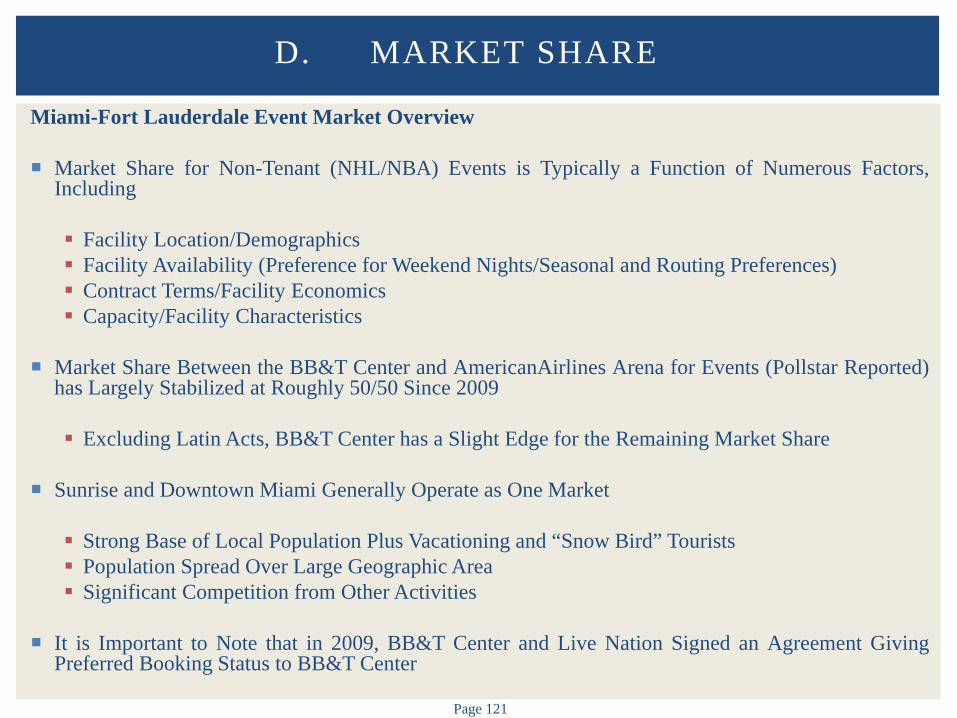
Page 121
Miami-Fort Lauderdale Event Market Overview Market Share for Non-Tenant (NHL/NBA) Events is Typically a Function of Numerous Factors,
Including
Facility Location/Demographics Facility Availability (Preference for Weekend Nights/Seasonal and Routing Preferences) Contract Terms/Facility Economics Capacity/Facility Characteristics
Market Share Between the BB&T Center and AmericanAirlines Arena for Events (Pollstar Reported)
has Largely Stabilized at Roughly 50/50 Since 2009
Excluding Latin Acts, BB&T Center has a Slight Edge for the Remaining Market Share
Sunrise and Downtown Miami Generally Operate as One Market
Strong Base of Local Population Plus Vacationing and “Snow Bird” Tourists Population Spread Over Large Geographic Area Significant Competition from Other Activities
It is Important to Note that in 2009, BB&T Center and Live Nation Signed an Agreement Giving
Preferred Booking Status to BB&T Center
D. MARKET SHARE
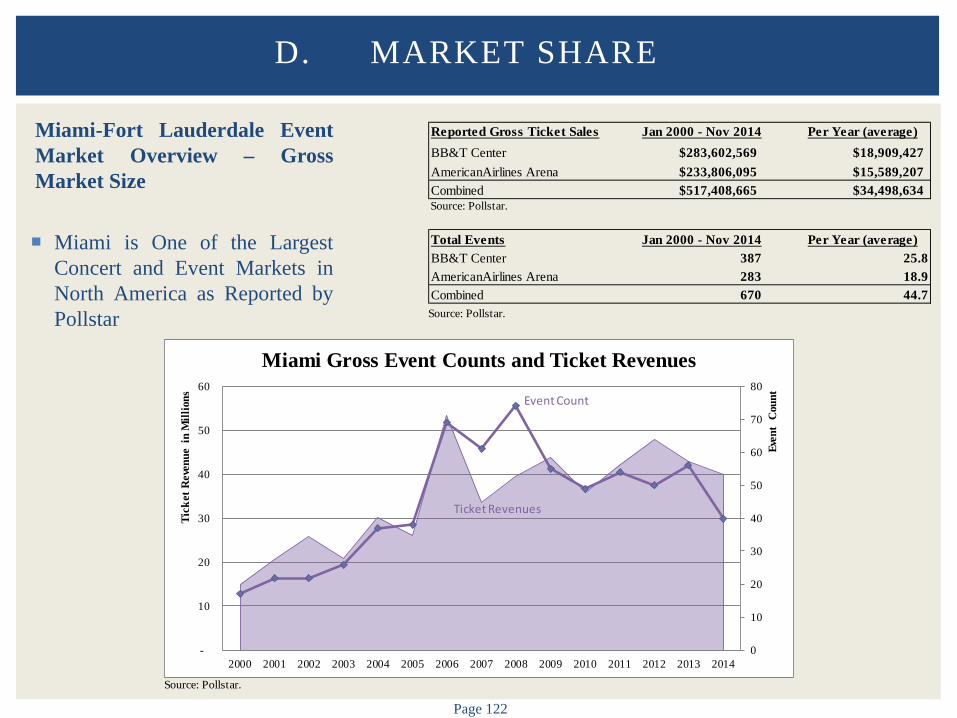
Page 122
Miami-Fort Lauderdale Event Market Overview – Gross Market Size
Miami is One of the Largest
Concert and Event Markets in North America as Reported by Pollstar
D. MARKET SHARE
Source: Pollstar.
Reported Gross Ticket Sales Jan 2000 - Nov 2014 Per Year (average)BB&T Center $283,602,569 $18,909,427AmericanAirlines Arena $233,806,095 $15,589,207Combined $517,408,665 $34,498,634
Total Events Jan 2000 - Nov 2014 Per Year (average)BB&T Center 387 25.8AmericanAirlines Arena 283 18.9Combined 670 44.7
Source: Pollstar.
Source: Pollstar.
0
10
20
30
40
50
60
70
80
-
10
20
30
40
50
60
2000 2001 2002 2003 2004 2005 2006 2007 2008 2009 2010 2011 2012 2013 2014
Even
t C
ount
Tick
et R
even
ue i
n M
illio
ns
Miami Gross Event Counts and Ticket Revenues
Ticket Revenues
Event Count

Page 123
Miami-Fort Lauderdale Event Market Overview
Historical Market Share Summarized Below– BB&T Center vs. AmericanAirlines Arena AmericanAirlines Arena has Secured an Increasing Market Share in Terms of Ticket Revenues,
Show Count, and Attendance
D. MARKET SHARE
0%
50%
100%
2000 2001 2002 2003 2004 2005 2006 2007 2008 2009 2010 2011 2012 2013 2014
BB&T vs AAA Market Share over Time
by Ticket Revenues by Show Count by Attendance
Greater BB&T Market Share
Greater AAA Market Share
Source: Pollstar.
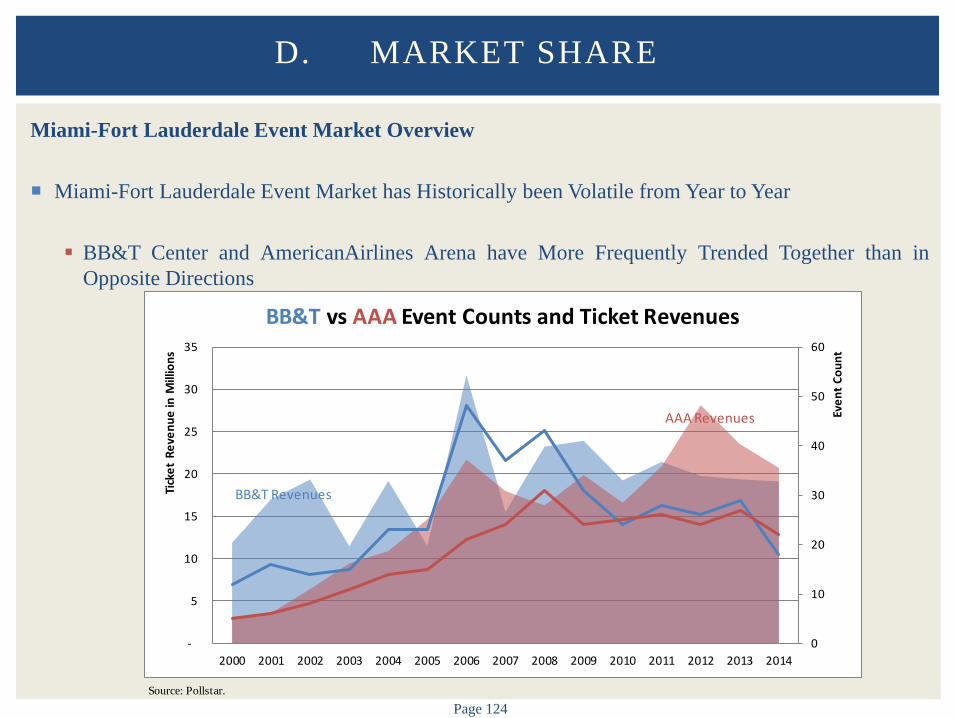
Page 124
D. MARKET SHARE
Miami-Fort Lauderdale Event Market Overview Miami-Fort Lauderdale Event Market has Historically been Volatile from Year to Year
BB&T Center and AmericanAirlines Arena have More Frequently Trended Together than in
Opposite Directions
0
10
20
30
40
50
60
-
5
10
15
20
25
30
35
2000 2001 2002 2003 2004 2005 2006 2007 2008 2009 2010 2011 2012 2013 2014
Even
t Cou
nt
Tick
et R
even
ue in
Mill
ions
BB&T vs AAA Event Counts and Ticket Revenues
AAA Revenues
BB&T Revenues
Source: Pollstar.
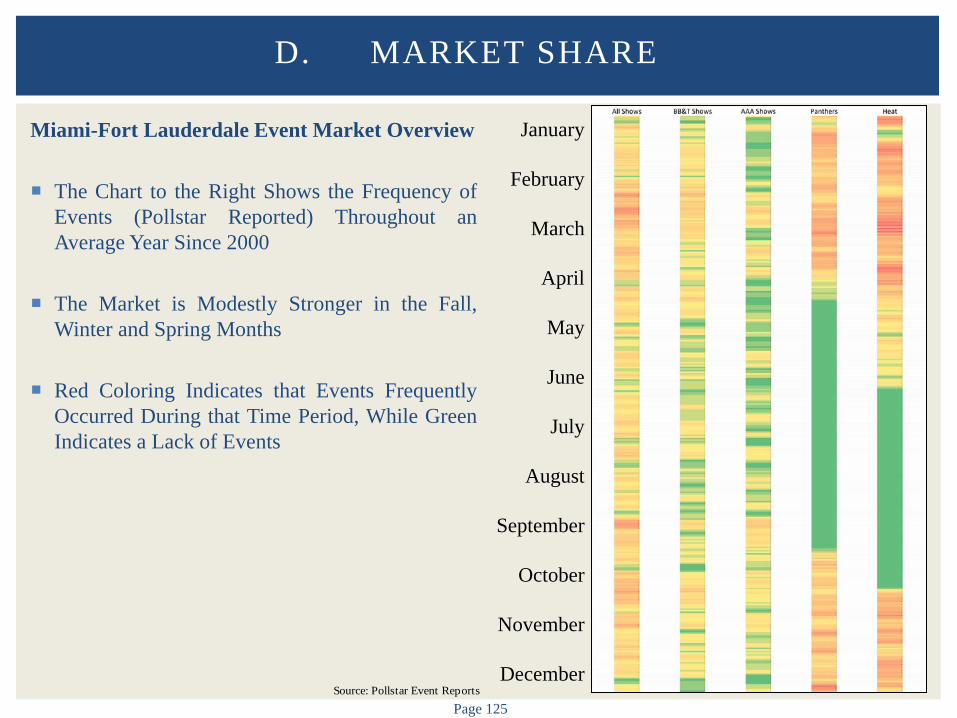
Page 125
Miami-Fort Lauderdale Event Market Overview
The Chart to the Right Shows the Frequency of Events (Pollstar Reported) Throughout an Average Year Since 2000
The Market is Modestly Stronger in the Fall, Winter and Spring Months
Red Coloring Indicates that Events Frequently Occurred During that Time Period, While Green Indicates a Lack of Events
D. MARKET SHARE
January
February
March
April
May
June
July
August
September
October
November
December
Source: Pollstar Event Reports
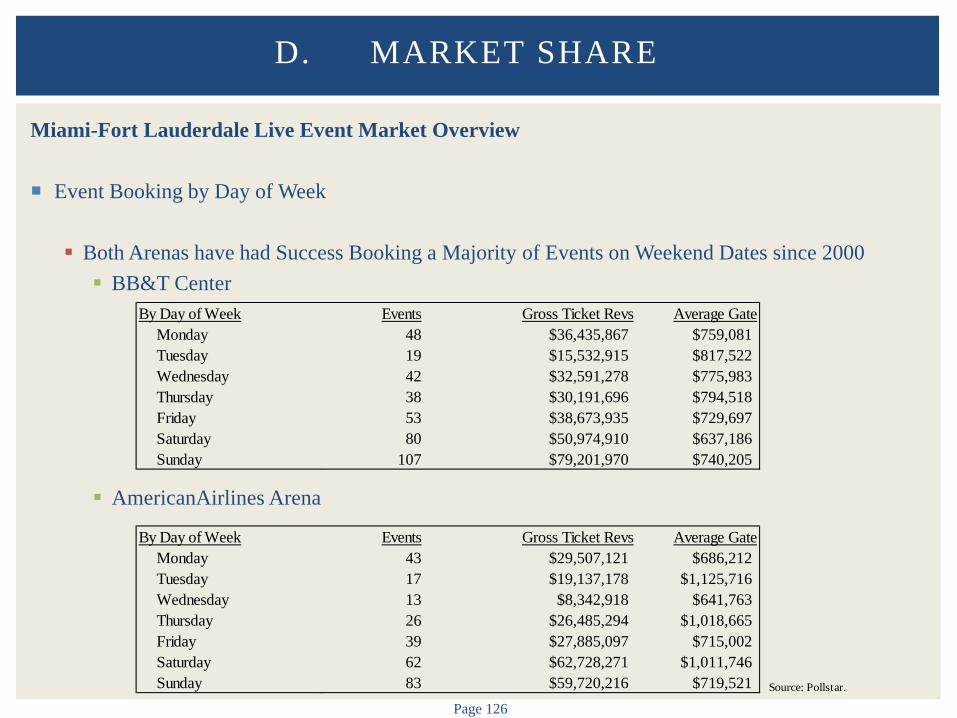
Page 126
Miami-Fort Lauderdale Live Event Market Overview Event Booking by Day of Week
Both Arenas have had Success Booking a Majority of Events on Weekend Dates since 2000 BB&T Center
AmericanAirlines Arena
D. MARKET SHARE
By Day of Week Events Gross Ticket Revs Average GateMonday 48 $36,435,867 $759,081Tuesday 19 $15,532,915 $817,522Wednesday 42 $32,591,278 $775,983Thursday 38 $30,191,696 $794,518Friday 53 $38,673,935 $729,697Saturday 80 $50,974,910 $637,186Sunday 107 $79,201,970 $740,205
By Day of Week Events Gross Ticket Revs Average GateMonday 43 $29,507,121 $686,212Tuesday 17 $19,137,178 $1,125,716Wednesday 13 $8,342,918 $641,763Thursday 26 $26,485,294 $1,018,665Friday 39 $27,885,097 $715,002Saturday 62 $62,728,271 $1,011,746Sunday 83 $59,720,216 $719,521 Source: Pollstar.
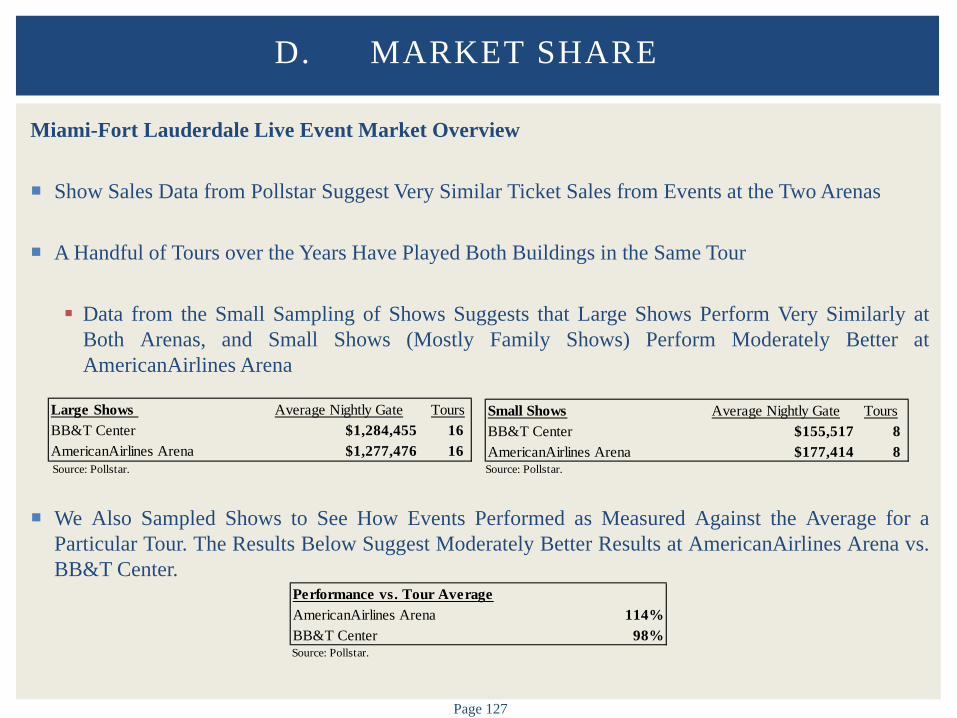
Page 127
Miami-Fort Lauderdale Live Event Market Overview Show Sales Data from Pollstar Suggest Very Similar Ticket Sales from Events at the Two Arenas
A Handful of Tours over the Years Have Played Both Buildings in the Same Tour
Data from the Small Sampling of Shows Suggests that Large Shows Perform Very Similarly at
Both Arenas, and Small Shows (Mostly Family Shows) Perform Moderately Better at AmericanAirlines Arena
We Also Sampled Shows to See How Events Performed as Measured Against the Average for a Particular Tour. The Results Below Suggest Moderately Better Results at AmericanAirlines Arena vs. BB&T Center.
D. MARKET SHARE
Large Shows Average Nightly Gate ToursBB&T Center $1,284,455 16AmericanAirlines Arena $1,277,476 16
Small Shows Average Nightly Gate ToursBB&T Center $155,517 8AmericanAirlines Arena $177,414 8
Performance vs. Tour AverageAmericanAirlines Arena 114%BB&T Center 98%
Source: Pollstar.
Source: Pollstar.
Source: Pollstar.
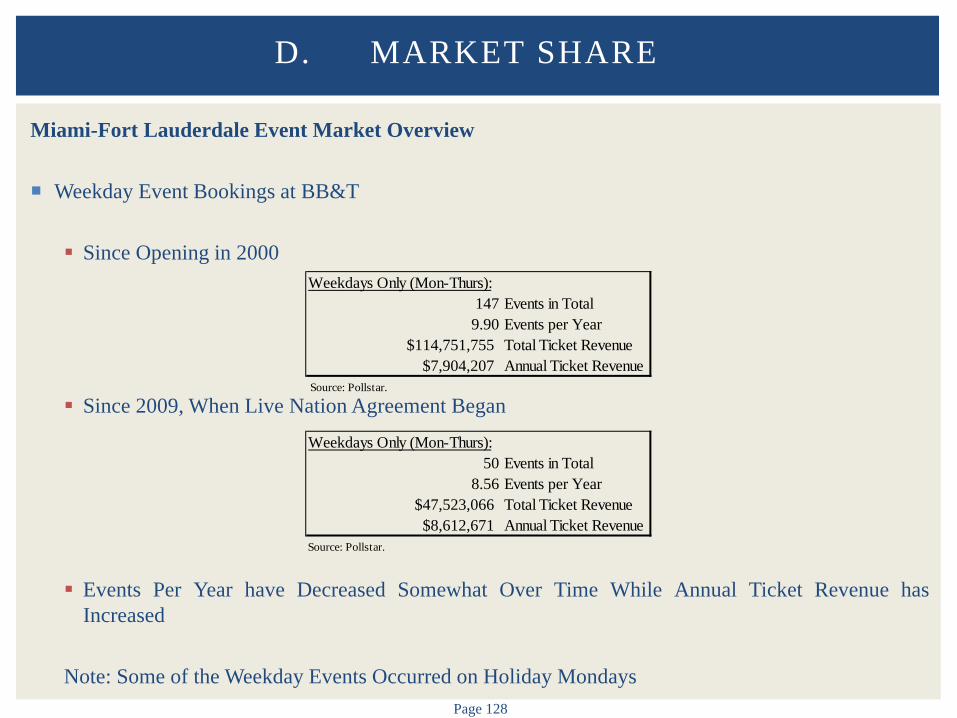
Page 128
Miami-Fort Lauderdale Event Market Overview Weekday Event Bookings at BB&T Since Opening in 2000
Since 2009, When Live Nation Agreement Began
Events Per Year have Decreased Somewhat Over Time While Annual Ticket Revenue has Increased
Note: Some of the Weekday Events Occurred on Holiday Mondays
D. MARKET SHARE
Weekdays Only (Mon-Thurs):147 Events in Total
9.90 Events per Year $114,751,755 Total Ticket Revenue
$7,904,207 Annual Ticket Revenue
Weekdays Only (Mon-Thurs):50 Events in Total
8.56 Events per Year $47,523,066 Total Ticket Revenue$8,612,671 Annual Ticket Revenue
Source: Pollstar.
Source: Pollstar.
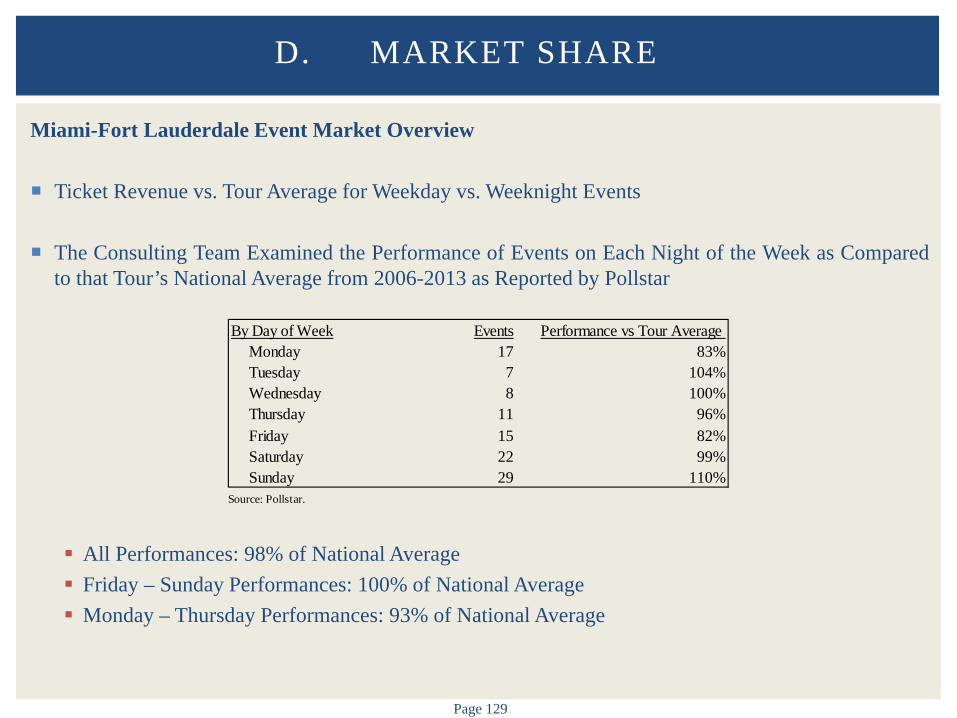
Page 129
Miami-Fort Lauderdale Event Market Overview Ticket Revenue vs. Tour Average for Weekday vs. Weeknight Events
The Consulting Team Examined the Performance of Events on Each Night of the Week as Compared
to that Tour’s National Average from 2006-2013 as Reported by Pollstar
All Performances: 98% of National Average Friday – Sunday Performances: 100% of National Average Monday – Thursday Performances: 93% of National Average
D. MARKET SHARE
By Day of Week Events Performance vs Tour Average Monday 17 83%Tuesday 7 104%Wednesday 8 100%Thursday 11 96%Friday 15 82%Saturday 22 99%Sunday 29 110%
Source: Pollstar.
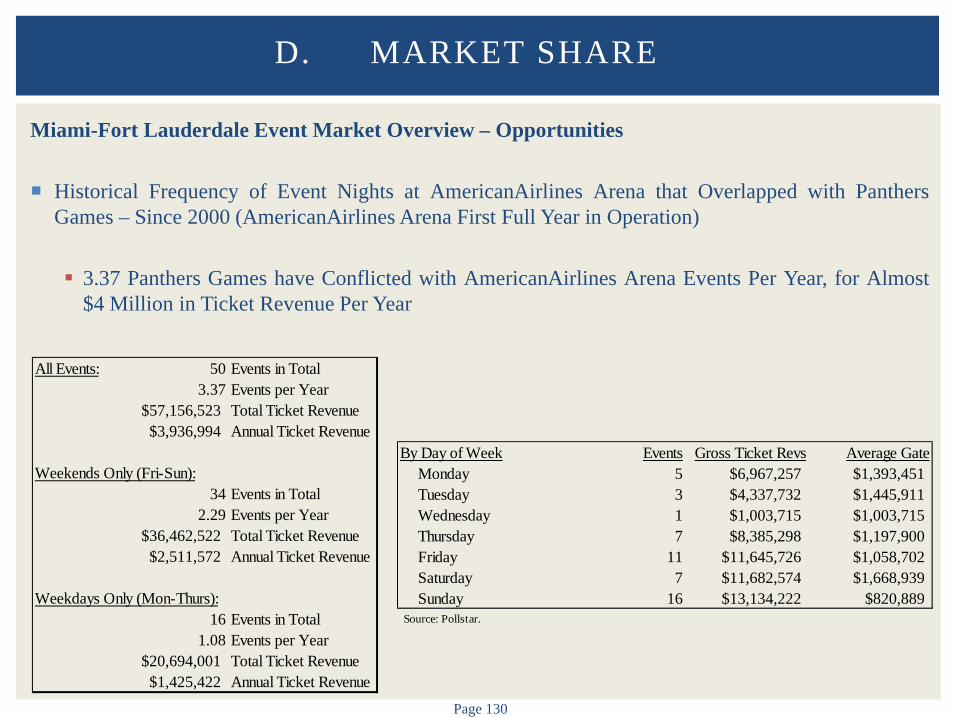
Page 130
Miami-Fort Lauderdale Event Market Overview – Opportunities
Historical Frequency of Event Nights at AmericanAirlines Arena that Overlapped with Panthers Games – Since 2000 (AmericanAirlines Arena First Full Year in Operation) 3.37 Panthers Games have Conflicted with AmericanAirlines Arena Events Per Year, for Almost
$4 Million in Ticket Revenue Per Year
D. MARKET SHARE
All Events: 50 Events in Total3.37 Events per Year
$57,156,523 Total Ticket Revenue$3,936,994 Annual Ticket Revenue
Weekends Only (Fri-Sun):34 Events in Total
2.29 Events per Year $36,462,522 Total Ticket Revenue$2,511,572 Annual Ticket Revenue
Weekdays Only (Mon-Thurs):16 Events in Total
1.08 Events per Year $20,694,001 Total Ticket Revenue$1,425,422 Annual Ticket Revenue
By Day of Week Events Gross Ticket Revs Average GateMonday 5 $6,967,257 $1,393,451Tuesday 3 $4,337,732 $1,445,911Wednesday 1 $1,003,715 $1,003,715Thursday 7 $8,385,298 $1,197,900Friday 11 $11,645,726 $1,058,702Saturday 7 $11,682,574 $1,668,939Sunday 16 $13,134,222 $820,889
Source: Pollstar.
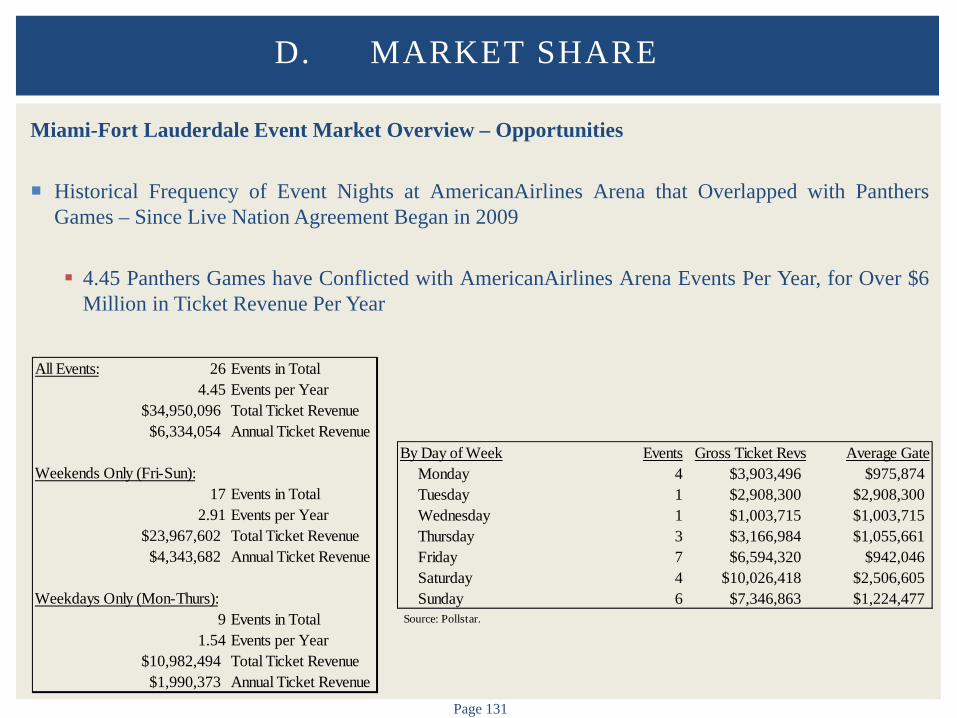
Page 131
Miami-Fort Lauderdale Event Market Overview – Opportunities Historical Frequency of Event Nights at AmericanAirlines Arena that Overlapped with Panthers
Games – Since Live Nation Agreement Began in 2009 4.45 Panthers Games have Conflicted with AmericanAirlines Arena Events Per Year, for Over $6
Million in Ticket Revenue Per Year
D. MARKET SHARE
All Events: 26 Events in Total4.45 Events per Year
$34,950,096 Total Ticket Revenue$6,334,054 Annual Ticket Revenue
Weekends Only (Fri-Sun):17 Events in Total
2.91 Events per Year $23,967,602 Total Ticket Revenue$4,343,682 Annual Ticket Revenue
Weekdays Only (Mon-Thurs):9 Events in Total
1.54 Events per Year $10,982,494 Total Ticket Revenue$1,990,373 Annual Ticket Revenue
By Day of Week Events Gross Ticket Revs Average GateMonday 4 $3,903,496 $975,874Tuesday 1 $2,908,300 $2,908,300Wednesday 1 $1,003,715 $1,003,715Thursday 3 $3,166,984 $1,055,661Friday 7 $6,594,320 $942,046Saturday 4 $10,026,418 $2,506,605Sunday 6 $7,346,863 $1,224,477
Source: Pollstar.
Page 132
Miami-Fort Lauderdale Event Market Overview – Opportunities
The Consulting Team Evaluated Overall Market Share if BB&T Center Did Not Host Panthers It is Estimated that Potential Economic Gains Due to Capture of AmericanAirlines Arena Events
Historically Occurring During Panthers Games Could Approach $300,000-$600,000 Per Year, If BB&T Center were able to Capture All Such Events
The Consulting Team Evaluated the Potential for Increased Revenues Due to Increased Weekend
Availability if BB&T Center Did Not Host Panthers
During the Period Studied, Gate Receipts for Events were Higher on Average When the Performance was Held on a Weekend Night
Some of these Events Reflect Multiday Shows Increase is Likely Understated Slightly Because of the Effect of Holiday Mondays
In Addition to Potential Market Share Capture, it is Estimated that Potential Economic Gains Due
to Increased Scheduling of Weekend Shows Without the Panthers Could Approach $50,000-$100,000, Depending on the Mix of Shows and Scheduling
D. MARKET SHARE
E. POTENTIAL USERS/TENANTS

Page 134
Overview
In Addition to Events Such as Concerts, Family Shows, and Community Events, Many Arenas Often Include One or More Anchor Tenants
BB&T Center could Consider the Potential of a Replacement Anchor Tenant – Minor League Team
Candidate League Would Likely have a Presence in the Southeast and Team Available to Relocate or a Desire to Expand
Advantages of an Anchor Tenant Could Include Stabilizing Revenue Streams During the Year and Across Years Increased Activity/Exposure of Arena Increases Sponsorship and Naming Rights Demand Ticket Buyer Database to Promote Concerts and Other Events
Certain Arena Operators Prefer to Operate Arenas with No Minor League Tenants to Provide More
Flexible Scheduling Opportunities for More Profitable Events
Note: Reported Attendance Figures Reflect Announced Attendance which are Typically Higher than Paid/Turnstile Attendance.
E. POTENTIAL USERS/TENANTS
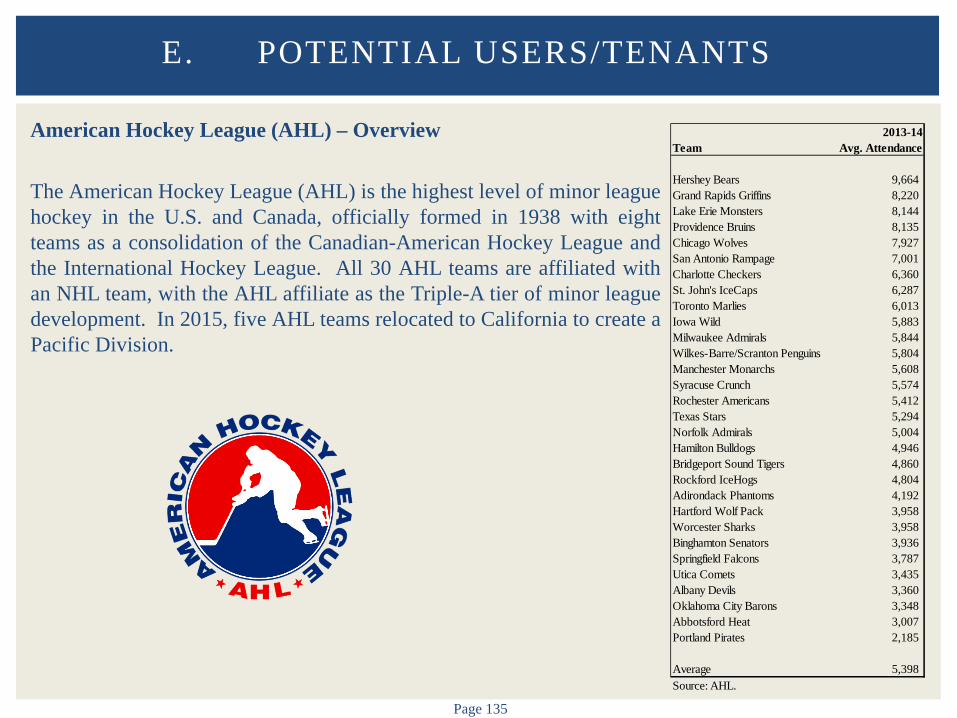
Page 135
American Hockey League (AHL) – Overview The American Hockey League (AHL) is the highest level of minor league hockey in the U.S. and Canada, officially formed in 1938 with eight teams as a consolidation of the Canadian-American Hockey League and the International Hockey League. All 30 AHL teams are affiliated with an NHL team, with the AHL affiliate as the Triple-A tier of minor league development. In 2015, five AHL teams relocated to California to create a Pacific Division.
E. POTENTIAL USERS/TENANTS
Team2013-14
Avg. Attendance
Hershey Bears 9,664Grand Rapids Griffins 8,220Lake Erie Monsters 8,144Providence Bruins 8,135Chicago Wolves 7,927San Antonio Rampage 7,001Charlotte Checkers 6,360St. John's IceCaps 6,287Toronto Marlies 6,013Iowa Wild 5,883Milwaukee Admirals 5,844Wilkes-Barre/Scranton Penguins 5,804Manchester Monarchs 5,608Syracuse Crunch 5,574Rochester Americans 5,412Texas Stars 5,294Norfolk Admirals 5,004Hamilton Bulldogs 4,946Bridgeport Sound Tigers 4,860Rockford IceHogs 4,804Adirondack Phantoms 4,192Hartford Wolf Pack 3,958Worcester Sharks 3,958Binghamton Senators 3,936Springfield Falcons 3,787Utica Comets 3,435Albany Devils 3,360Oklahoma City Barons 3,348Abbotsford Heat 3,007Portland Pirates 2,185
Average 5,398Source: AHL.
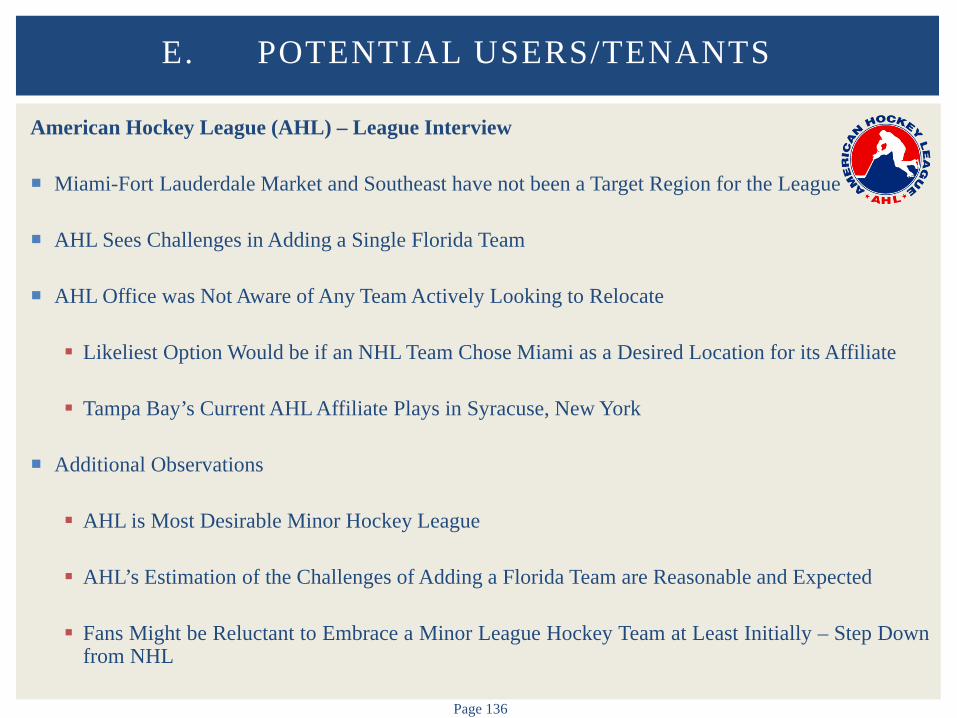
Page 136
American Hockey League (AHL) – League Interview
Miami-Fort Lauderdale Market and Southeast have not been a Target Region for the League
AHL Sees Challenges in Adding a Single Florida Team
AHL Office was Not Aware of Any Team Actively Looking to Relocate Likeliest Option Would be if an NHL Team Chose Miami as a Desired Location for its Affiliate
Tampa Bay’s Current AHL Affiliate Plays in Syracuse, New York
Additional Observations
AHL is Most Desirable Minor Hockey League
AHL’s Estimation of the Challenges of Adding a Florida Team are Reasonable and Expected
Fans Might be Reluctant to Embrace a Minor League Hockey Team at Least Initially – Step Down
from NHL
E. POTENTIAL USERS/TENANTS
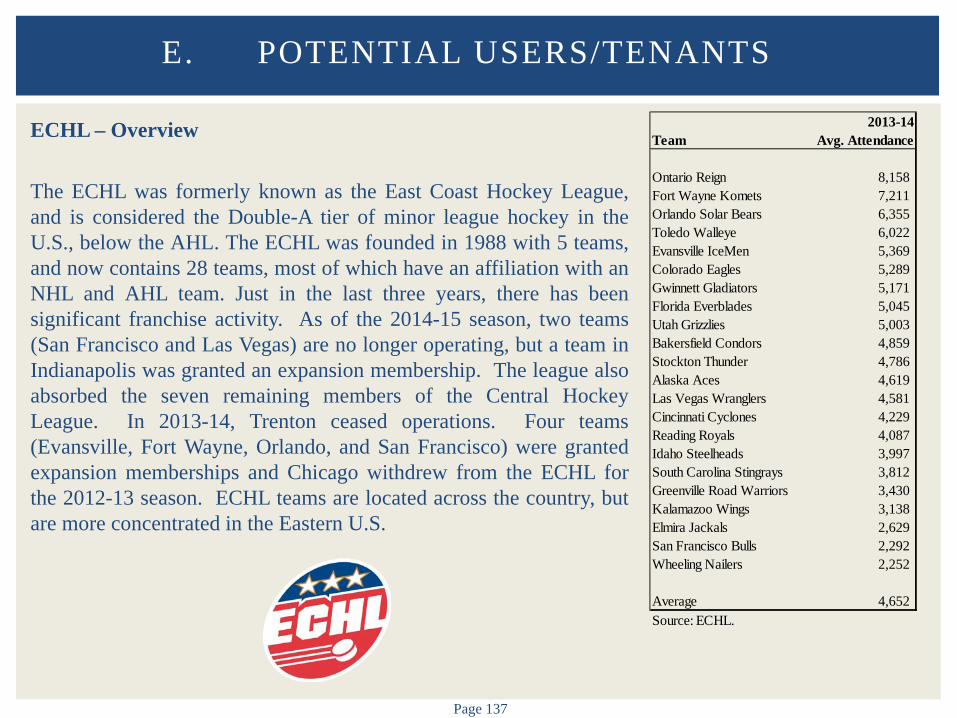
Page 137
ECHL – Overview The ECHL was formerly known as the East Coast Hockey League, and is considered the Double-A tier of minor league hockey in the U.S., below the AHL. The ECHL was founded in 1988 with 5 teams, and now contains 28 teams, most of which have an affiliation with an NHL and AHL team. Just in the last three years, there has been significant franchise activity. As of the 2014-15 season, two teams (San Francisco and Las Vegas) are no longer operating, but a team in Indianapolis was granted an expansion membership. The league also absorbed the seven remaining members of the Central Hockey League. In 2013-14, Trenton ceased operations. Four teams (Evansville, Fort Wayne, Orlando, and San Francisco) were granted expansion memberships and Chicago withdrew from the ECHL for the 2012-13 season. ECHL teams are located across the country, but are more concentrated in the Eastern U.S.
E. POTENTIAL USERS/TENANTS
Team2013-14
Avg. Attendance
Ontario Reign 8,158Fort Wayne Komets 7,211Orlando Solar Bears 6,355Toledo Walleye 6,022Evansville IceMen 5,369Colorado Eagles 5,289Gwinnett Gladiators 5,171Florida Everblades 5,045Utah Grizzlies 5,003Bakersfield Condors 4,859Stockton Thunder 4,786Alaska Aces 4,619Las Vegas Wranglers 4,581Cincinnati Cyclones 4,229Reading Royals 4,087Idaho Steelheads 3,997South Carolina Stingrays 3,812Greenville Road Warriors 3,430Kalamazoo Wings 3,138Elmira Jackals 2,629San Francisco Bulls 2,292Wheeling Nailers 2,252
Average 4,652Source: ECHL.

Page 138
ECHL – League Interview
ECHL Office Unsure Whether Miami Market is Proper Fit for the League
Mid-Size Markets with Strong Community Pride have been Most Successful in Past
League Desire for a Balanced, National Footprint is a Plus for Miami
ECHL Would Want to Better Understand Broward Demographics of Greater Miami
ECHL Requires Strong Owner with a Sound Business Plan
No Immediate Expansion Plans, but Some Franchises are Looking for Stronger Markets
Additional Observations
Fans Might be Reluctant to Embrace a Minor League Hockey Team at Least Initially – Step Down from NHL – As a “Double-A” League, Would be a Significant Drop-Off in Quality of Play
May Not be Feasible for ECHL Team to Play in an Arena as Large as BB&T Center
Cost Structure is Low, as are Team Values
E. POTENTIAL USERS/TENANTS
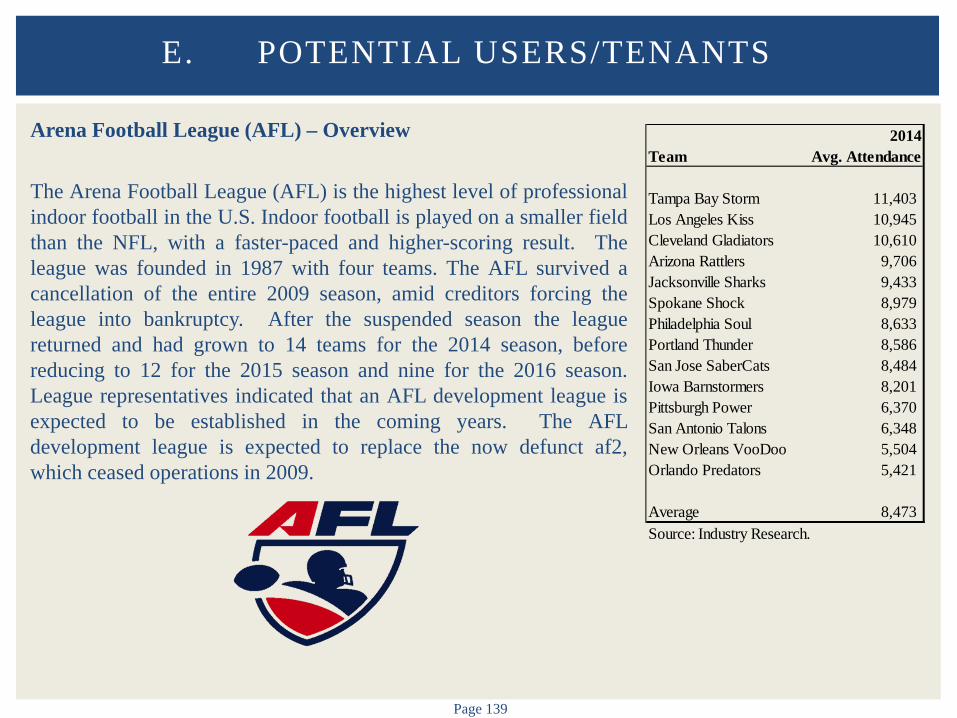
Page 139
Arena Football League (AFL) – Overview The Arena Football League (AFL) is the highest level of professional indoor football in the U.S. Indoor football is played on a smaller field than the NFL, with a faster-paced and higher-scoring result. The league was founded in 1987 with four teams. The AFL survived a cancellation of the entire 2009 season, amid creditors forcing the league into bankruptcy. After the suspended season the league returned and had grown to 14 teams for the 2014 season, before reducing to 12 for the 2015 season and nine for the 2016 season. League representatives indicated that an AFL development league is expected to be established in the coming years. The AFL development league is expected to replace the now defunct af2, which ceased operations in 2009.
E. POTENTIAL USERS/TENANTS
Team2014
Avg. Attendance
Tampa Bay Storm 11,403Los Angeles Kiss 10,945Cleveland Gladiators 10,610Arizona Rattlers 9,706Jacksonville Sharks 9,433Spokane Shock 8,979Philadelphia Soul 8,633Portland Thunder 8,586San Jose SaberCats 8,484Iowa Barnstormers 8,201Pittsburgh Power 6,370San Antonio Talons 6,348New Orleans VooDoo 5,504Orlando Predators 5,421
Average 8,473Source: Industry Research.
Page 140
Arena Football League – League Interview
AFL has a High Level of Interest in the Miami Market
League has a Desire to Expand in the Near Future
Miami-Fort Lauderdale Market Demographics are Suitable to a Top Tier AFL Franchise
Miami-Fort Lauderdale Brand Image is Consistent with League’s Desired Image
No Potential Owner has Expressed Interest in Miami-Fort Lauderdale
Key Terms for Acceptable Lease Include Modest Rent Shared Event Economics
Additional Observations Short Season Means Fewest Conflicts with Potential Concerts/Events Competes with Many Other Football Products in the Market AmericanAirlines Arena could Potentially Compete for a Franchise
E. POTENTIAL USERS/TENANTS

Page 141
NBA Development League (D-League) The NBA Development League (D-League) is the NBA’s official minor league basketball organization. The league began with eight teams in 2001, and has since grown to 18. Most teams are now single-affiliated or owned by an NBA team. The NBA is interested in ultimately expanding to 30 teams so each NBA team will have a direct, single affiliation. Coordination with the Miami Heat and NBA would be required.
E. POTENTIAL USERS/TENANTS
Team2013-2014
Avg. Attendance
Texas Legends 5,737Iowa Energy 4,807Rio Grande Valley Vipers 4,681Erie BayHawks 3,370Sioux Falls Skyforce 3,036Fort Wayne Mad Ants 2,910Idaho Stampede 2,852Canton Charge 2,609Maine Red Claws 2,493Santa Cruz Warriors 2,441Tulsa 66ers 2,384Austin Toros 2,339Springfield Armor 2,288Reno Bighorns 2,140Delaware 87ers 1,465Bakersfield Jam 550Los Angeles D-Fenders 389
Average 2,735Source: Industry Research.Note: As of 03-16-14. Full season data was not available.

Page 142
Women’s National Basketball Association The Women’s National Basketball Association (WNBA) began play in 1997 with 8 teams. The league now has 12 teams, split into a western and eastern conference. Most teams share an arena with an NBA counterpart. WNBA teams are located throughout the country. Coordination with the Miami Heat and NBA would be required.
E. POTENTIAL USERS/TENANTS
Team2014
Avg. Attendance
Phoenix Mercury 9,557Minnesota Lynx 9,333New York Liberty 8,949Washington Mystics 8,377Los Angeles Sparks 8,288Indiana Fever 7,900San Antonio Stars 7,719Seattle Storm 6,717Chicago Sky 6,685Connecticut Sun 5,980Atlanta Dream 5,864Tulsa Shock 5,566
Average 7,578Source: Sports Business Daily.
Page 143
Additional Potential Tenants Indoor Football League (IFL) – Began Play in 2009
Champions Indoor Football (CIF) – To Begin Play in 2015
Major Arena Soccer League (MASL) – Began Play in 2008
National Lacrosse League (NLL) – Began Play in 1987
E. POTENTIAL USERS/TENANTS
Page 144
Former Teams in Market (Arena-Based) (Year Team Folded or Relocated) Women’s National Basketball Association (WNBA)
Miami Sol (2002)
Indoor Football
Miami Inferno – UIFL (2014)
Florida Bobcats – AFL (2001)
Minor League Hockey
Miami Manatees – World Hockey Association 2 (2004)
Miami Matadors – ECHL (1999)
West Palm Beach Blaze/Barracudas – SuHL/SHL (1996)
Note: List May Not be All Inclusive.
E. POTENTIAL USERS/TENANTS

V. FINANCIAL ANALYSIS

A. OVERVIEW
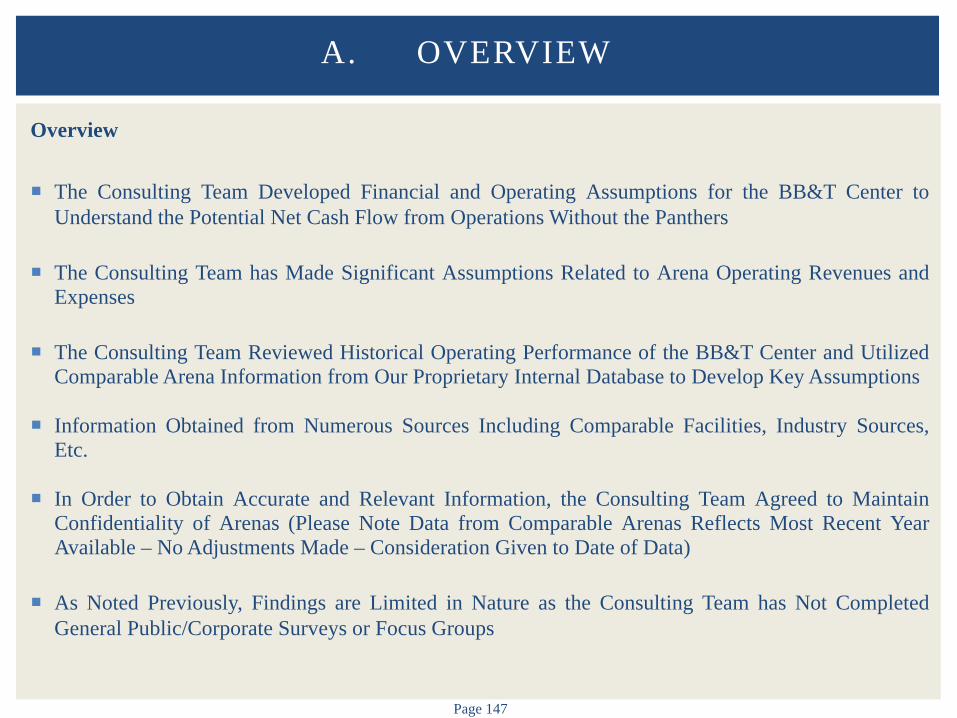
Page 147
Overview
The Consulting Team Developed Financial and Operating Assumptions for the BB&T Center to Understand the Potential Net Cash Flow from Operations Without the Panthers
The Consulting Team has Made Significant Assumptions Related to Arena Operating Revenues and Expenses
The Consulting Team Reviewed Historical Operating Performance of the BB&T Center and Utilized
Comparable Arena Information from Our Proprietary Internal Database to Develop Key Assumptions
Information Obtained from Numerous Sources Including Comparable Facilities, Industry Sources, Etc.
In Order to Obtain Accurate and Relevant Information, the Consulting Team Agreed to Maintain
Confidentiality of Arenas (Please Note Data from Comparable Arenas Reflects Most Recent Year Available – No Adjustments Made – Consideration Given to Date of Data)
As Noted Previously, Findings are Limited in Nature as the Consulting Team has Not Completed General Public/Corporate Surveys or Focus Groups
A. OVERVIEW
B. COMPARABLE ARENAS
Page 149
Comparable Arena Overview
The Consulting Team Identified 18 Arenas to be “Comparable” to BB&T Center Without a NHL Tenant (See Appendix A for Case Studies)
Comparable Arenas were Selected Based on Some or All of the Following Factors Physical Characteristics Age Size Amenities
Operating Characteristics Tenant Mix (No NHL or NBA Tenant) Competing Arena in Market
Other Characteristics Market Location
B. COMPARABLE ARENAS
Page 150
Comparable Arena Overview
Consideration was Given to Impact of Key Variables on Performance
Market Demographics Cost of Living Number of Professional and Collegiate Sports Teams Other Entertainment Alternatives Local Market Conditions Tenant/Event Mix Climate Other
B. COMPARABLE ARENAS
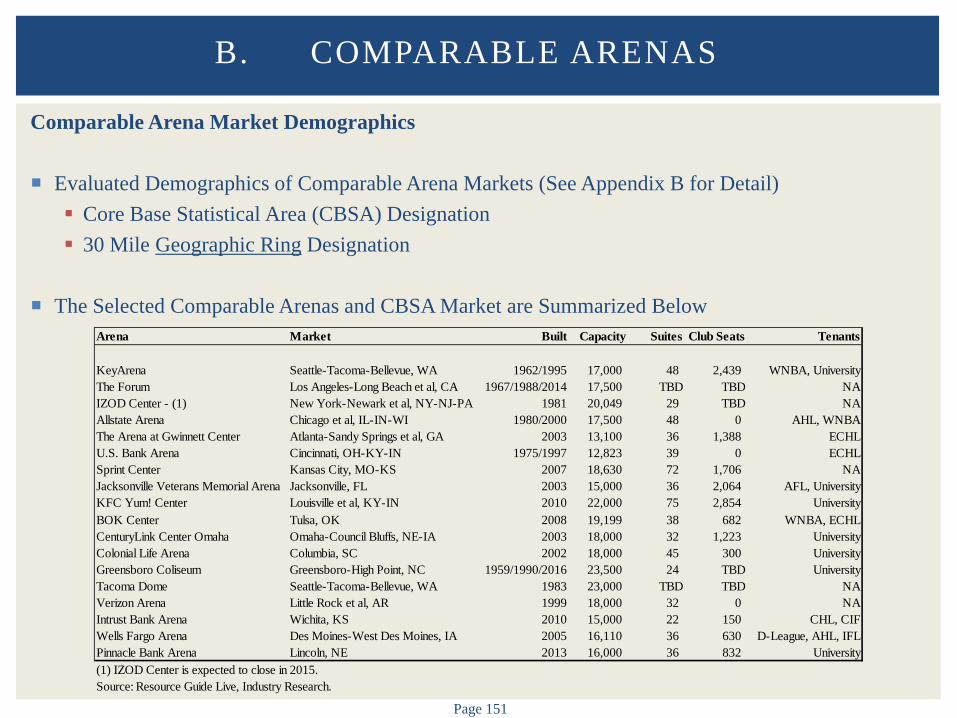
Page 151
Comparable Arena Market Demographics
Evaluated Demographics of Comparable Arena Markets (See Appendix B for Detail) Core Base Statistical Area (CBSA) Designation 30 Mile Geographic Ring Designation
The Selected Comparable Arenas and CBSA Market are Summarized Below
B. COMPARABLE ARENAS
Arena Market Built Capacity Suites Club Seats Tenants
KeyArena Seattle-Tacoma-Bellevue, WA 1962/1995 17,000 48 2,439 WNBA, UniversityThe Forum Los Angeles-Long Beach et al, CA 1967/1988/2014 17,500 TBD TBD NAIZOD Center - (1) New York-Newark et al, NY-NJ-PA 1981 20,049 29 TBD NAAllstate Arena Chicago et al, IL-IN-WI 1980/2000 17,500 48 0 AHL, WNBAThe Arena at Gwinnett Center Atlanta-Sandy Springs et al, GA 2003 13,100 36 1,388 ECHLU.S. Bank Arena Cincinnati, OH-KY-IN 1975/1997 12,823 39 0 ECHLSprint Center Kansas City, MO-KS 2007 18,630 72 1,706 NAJacksonville Veterans Memorial Arena Jacksonville, FL 2003 15,000 36 2,064 AFL, UniversityKFC Yum! Center Louisville et al, KY-IN 2010 22,000 75 2,854 UniversityBOK Center Tulsa, OK 2008 19,199 38 682 WNBA, ECHLCenturyLink Center Omaha Omaha-Council Bluffs, NE-IA 2003 18,000 32 1,223 UniversityColonial Life Arena Columbia, SC 2002 18,000 45 300 UniversityGreensboro Coliseum Greensboro-High Point, NC 1959/1990/2016 23,500 24 TBD UniversityTacoma Dome Seattle-Tacoma-Bellevue, WA 1983 23,000 TBD TBD NAVerizon Arena Little Rock et al, AR 1999 18,000 32 0 NAIntrust Bank Arena Wichita, KS 2010 15,000 22 150 CHL, CIFWells Fargo Arena Des Moines-West Des Moines, IA 2005 16,110 36 630 D-League, AHL, IFLPinnacle Bank Arena Lincoln, NE 2013 16,000 36 832 University(1) IZOD Center is expected to close in 2015.Source: Resource Guide Live, Industry Research.

Page 152
B. COMPARABLE ARENAS
Comparable Arena Demographic Overview CBSA Designation Limited Demographic Overview – Provided for
Illustrative Purposes
BB&T Center’s Market is the 4th Largest in Terms of Population and Households
BB&T Center’s Market has Low Income Levels and an Above Average Number of High Income Households
BB&T Center’s Market has the Oldest Population and a Higher Unemployment Rate as Compared to the Market Average
BB&T Center’s Market has a Corporate Base that is Above the Average
Behind Only New York, Los Angeles,
Chicago, and Atlanta Market Areas in Both Categories
Statistical Measure BB&T CenterRank of 19 Average - (1)
2014 Population (000s) 5,926.2 4 3,811.2 2019 Population (000s) 6,303.8 4 3,946.0 Est. % Growth 2014-19 6.37% 1 4.15%
2014 Households (000s) 2,226.1 4 1,403.3 2019 Households (000s) 2,367.6 4 1,456.6 Est. % Growth 2014-19 6.35% 3 4.36%
Average Household Income $69,302 12 $74,658Median Household Income $47,423 18 $55,875High Income Households (000s) 447.3 7 391.5
Average Age 40.8 19 37.9Median Age 40.7 19 37.0
Unemployment Rate 5.6% 14 4.8%
Economy Size (GDP - Billions) $281.1 7 $246.9
TV Population 3,842.0 7 4,374.6Radio Population 3,906.2 5 3,236.9
Companies w/ $20+mm Sales 1,638 5 1,369Companies w/ 500+ Employees 304 5 275
Comparable Arena Market Summary - CBSA Designation Overview
(1) - Average excludes BB&T Center.Sources: Claritas 2015,Arbitron 2014, Hoovers 2014, TV Basics 2014, BLS 2015, and U.S. BEA.

Page 153
B. COMPARABLE ARENAS
Comparable Arena Demographic Overview 30 Mile Ring Designation Limited Demographic Overview – Provided for
Illustrative Purposes
BB&T Center’s Market is the 4th Largest in Terms of Population and Households
BB&T Center’s Market has Low Income Levels and an Average Number of High Income Households
BB&T Center’s Market has the Oldest Population
BB&T Center’s Market has a Corporate Base that is Above the Average (In Terms of Rank, Near Average by Amount of Companies)
Behind Only New York, Los Angeles,
Chicago, and Atlanta Market Areas in Both Categories
Statistical Measure BB&T CenterRank of 19 Average - (1)
2014 Population (000s) 4,149.9 4 3,094.6 2019 Population (000s) 4,405.6 4 3,207.4 Est. % Growth 2014-19 6.16% 2 4.21%
2014 Households (000s) 1,594.7 4 1,149.7 2019 Households (000s) 1,694.0 4 1,195.0 Est. % Growth 2014-19 6.22% 3 4.43%
Average Household Income $66,905 15 $74,540Median Household Income $45,816 18 $55,406High Income Households (000s) 303.2 6 305.8
Average Age 41.4 19 37.8Median Age 41.4 19 36.8
Companies w/ $20+mm Sales 1,318 5 1,276Companies w/ 500+ Employees 248 6 264
Comparable Arena Market Summary - 30 Mile Ring Designation Overview
(1) - Average excludes BB&T Center.Sources: Claritas 2015, Arbitron 2014 and Hoovers 2015.

C. FINANCIAL ANALYSIS

Page 155
Event Mix
Potential Types of Arena Events Include Sporting Events (e.g., Minor League Hockey, Minor League Basketball, Arena Football, etc.) Family Shows (e.g., Circus, Barney, etc.) Tournaments (e.g., NCAA, etc.) Ice Shows Rodeo Thrill/Dirt Shows/WWE Concerts Meetings/Banquets/Conferences Other
Number of Events for Comparable Arenas Vary Significantly Due to a Variety of Factors Including:
Tenant Mix; Market Competition; Facility Age/Amenities; Lease Terms; Etc.
C. FINANCIAL ANALYSIS
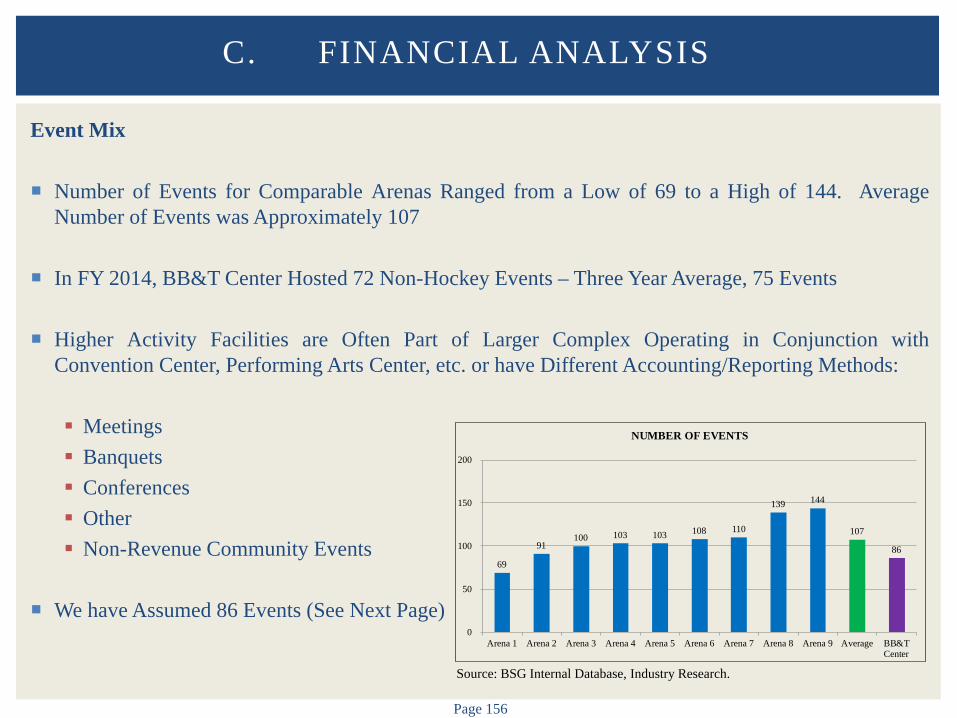
Page 156
Event Mix
Number of Events for Comparable Arenas Ranged from a Low of 69 to a High of 144. Average Number of Events was Approximately 107
In FY 2014, BB&T Center Hosted 72 Non-Hockey Events – Three Year Average, 75 Events
Higher Activity Facilities are Often Part of Larger Complex Operating in Conjunction with Convention Center, Performing Arts Center, etc. or have Different Accounting/Reporting Methods: Meetings Banquets Conferences Other Non-Revenue Community Events
We have Assumed 86 Events (See Next Page)
C. FINANCIAL ANALYSIS
69
91 100 103 103 108 110
139 144
107
86
0
50
100
150
200
Arena 1 Arena 2 Arena 3 Arena 4 Arena 5 Arena 6 Arena 7 Arena 8 Arena 9 Average BB&TCenter
NUMBER OF EVENTS
Source: BSG Internal Database, Industry Research.
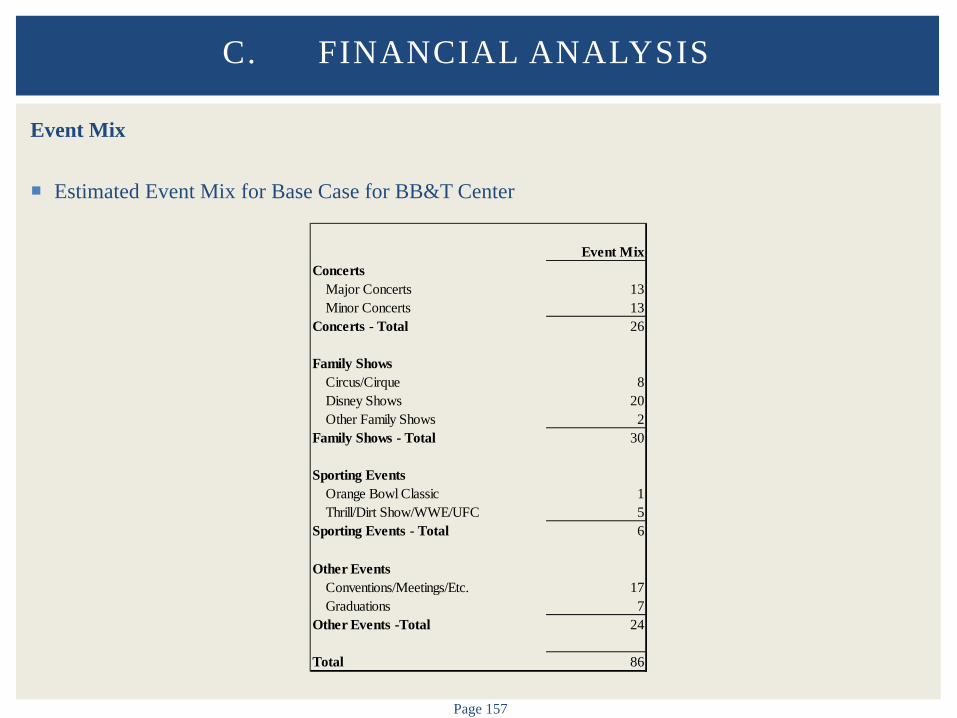
Page 157
Event Mix
Estimated Event Mix for Base Case for BB&T Center
C. FINANCIAL ANALYSIS
Event MixConcerts
Major Concerts 13 Minor Concerts 13
Concerts - Total 26
Family ShowsCircus/Cirque 8 Disney Shows 20 Other Family Shows 2
Family Shows - Total 30
Sporting EventsOrange Bowl Classic 1 Thrill/Dirt Show/WWE/UFC 5
Sporting Events - Total 6
Other EventsConventions/Meetings/Etc. 17 Graduations 7
Other Events -Total 24
Total 86

Page 158
Total Attendance
Attendance at the Comparables Vary Significantly Due to a Variety of Factors Including: Tenant Mix; Market Competition; Age; Amenities; Accounting/Reporting Policies etc.
Total Attendance Ranged from a Low of Approximately 411,000 to a High of Approximately 790,000. Average Annual Attendance was Approximately 568,000
We Have Assumed Total Paid Attendance of Approximately 531,000 for the BB&T Center (Turnstile Attendance of Approximately 529,000)
C. FINANCIAL ANALYSIS
Source: BSG Internal Database, Industry Research.
411,121 457,968 471,485 483,932 491,373
576,973
701,728 728,849 789,917
568,150 531,000
0
250,000
500,000
750,000
1,000,000
Arena 1 Arena 2 Arena 3 Arena 4 Arena 5 Arena 6 Arena 7 Arena 8 Arena 9 Average BB&TCenter
ATTENDANCE
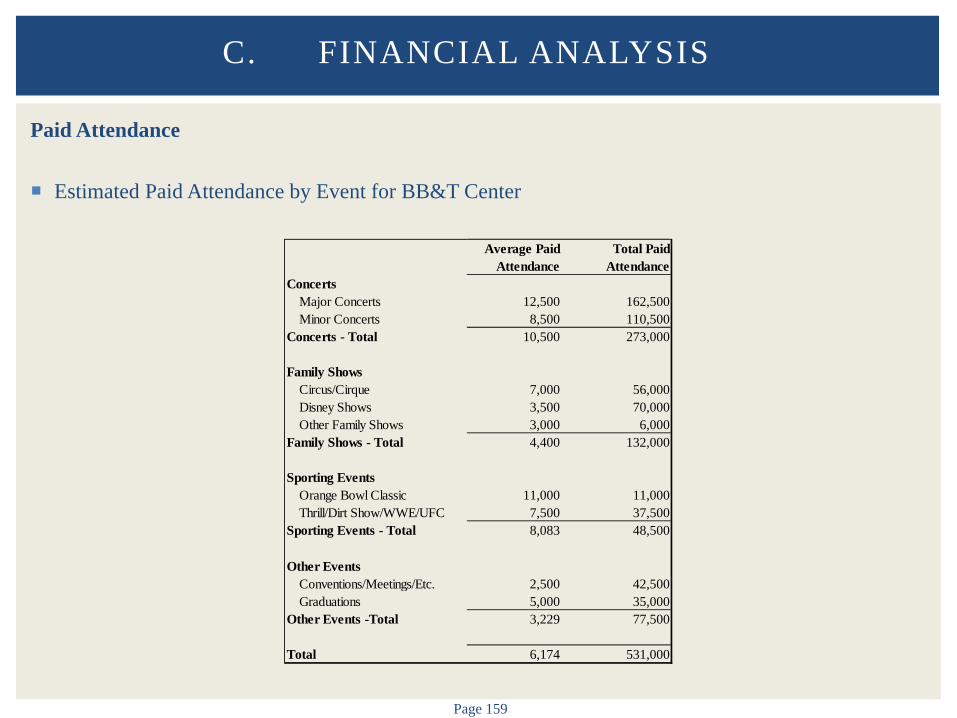
Page 159
Paid Attendance
Estimated Paid Attendance by Event for BB&T Center
C. FINANCIAL ANALYSIS
Average Paid Attendance
Total Paid Attendance
ConcertsMajor Concerts 12,500 162,500Minor Concerts 8,500 110,500
Concerts - Total 10,500 273,000
Family ShowsCircus/Cirque 7,000 56,000Disney Shows 3,500 70,000Other Family Shows 3,000 6,000
Family Shows - Total 4,400 132,000
Sporting EventsOrange Bowl Classic 11,000 11,000Thrill/Dirt Show/WWE/UFC 7,500 37,500
Sporting Events - Total 8,083 48,500
Other EventsConventions/Meetings/Etc. 2,500 42,500Graduations 5,000 35,000
Other Events -Total 3,229 77,500
Total 6,174 531,000
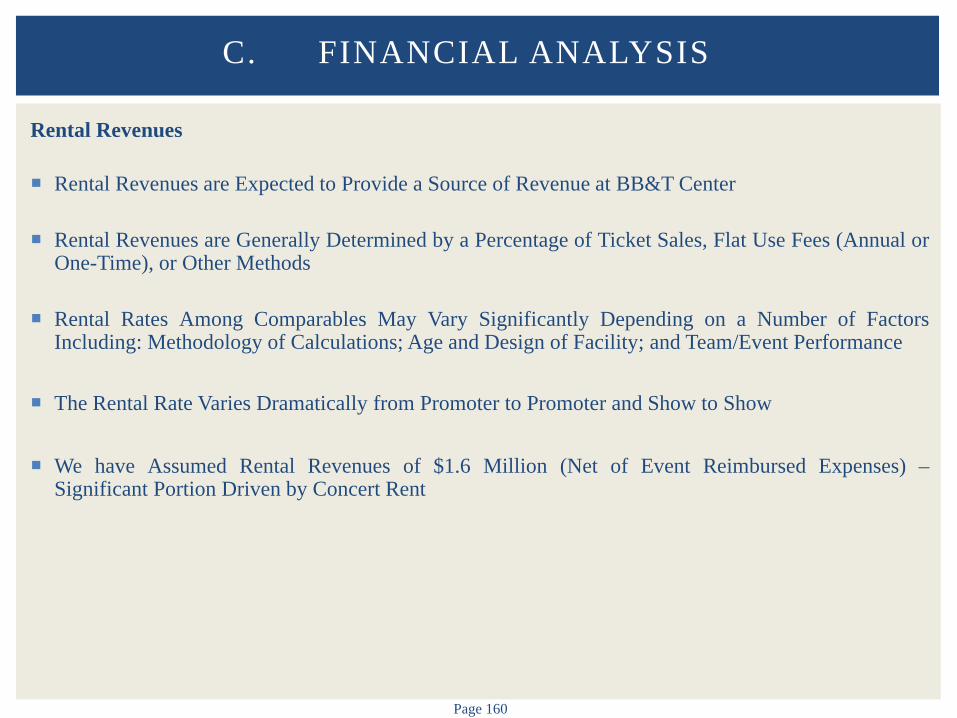
Page 160
Rental Revenues
Rental Revenues are Expected to Provide a Source of Revenue at BB&T Center
Rental Revenues are Generally Determined by a Percentage of Ticket Sales, Flat Use Fees (Annual or One-Time), or Other Methods
Rental Rates Among Comparables May Vary Significantly Depending on a Number of Factors Including: Methodology of Calculations; Age and Design of Facility; and Team/Event Performance
The Rental Rate Varies Dramatically from Promoter to Promoter and Show to Show
We have Assumed Rental Revenues of $1.6 Million (Net of Event Reimbursed Expenses) –
Significant Portion Driven by Concert Rent
C. FINANCIAL ANALYSIS

Page 161
Average Ticket Price
Ticket Prices Vary Considerably Among the Comparable Arenas
Factors that Impact Ticket Prices Include, Among Others: Market Demand, Entertainment Alternatives, Income Levels, (Team Performance), Etc.
C. FINANCIAL ANALYSIS
Average Ticket Price
ConcertsMajor Concerts $90.00Minor Concerts $60.00
Family ShowsCircus/Cirque $40.00Disney Shows $30.00Other Family Shows $15.00
Sporting EventsOrange Bowl Classic $20.00Thrill/Dirt Show/WWE/UFC $35.00
Other EventsConventions/Meetings/Etc. $0.00Graduations $0.00
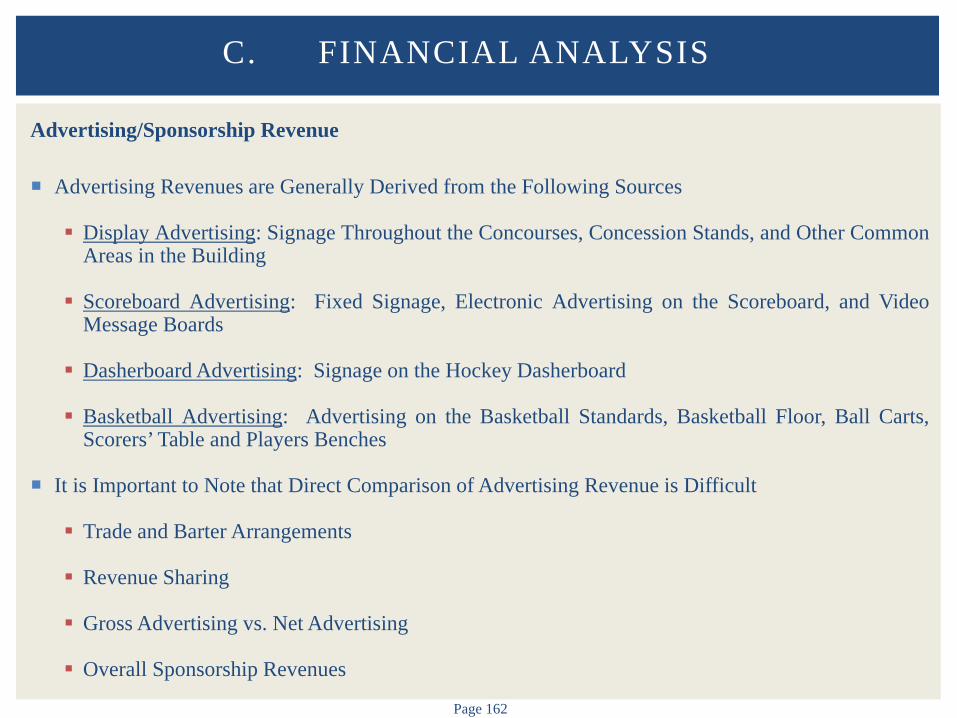
Page 162
Advertising/Sponsorship Revenue Advertising Revenues are Generally Derived from the Following Sources
Display Advertising: Signage Throughout the Concourses, Concession Stands, and Other Common
Areas in the Building
Scoreboard Advertising: Fixed Signage, Electronic Advertising on the Scoreboard, and Video Message Boards
Dasherboard Advertising: Signage on the Hockey Dasherboard
Basketball Advertising: Advertising on the Basketball Standards, Basketball Floor, Ball Carts, Scorers’ Table and Players Benches
It is Important to Note that Direct Comparison of Advertising Revenue is Difficult
Trade and Barter Arrangements
Revenue Sharing
Gross Advertising vs. Net Advertising
Overall Sponsorship Revenues
C. FINANCIAL ANALYSIS

Page 163
Advertising/Sponsorship Revenue Annual Advertising Revenues for Comparable Facilities Ranged from Approximately $94,000 to
Approximately $3.8 Million. Average Annual Advertising Revenue was Approximately $978,000
We have Assumed Annual Arena-Only Advertising Revenues of $1.3 Million (Net)
C. FINANCIAL ANALYSIS
$94 $95
$508 $606 $640 $753
$1,374
$3,752
$978 $1,275
$0
$1,000
$2,000
$3,000
$4,000
Arena 1 Arena 2 Arena 3 Arena 4 Arena 5 Arena 6 Arena 7 Arena 8 Average BB&TCenter
ADVERTISING/SPONSORSHIP REVENUE($000s)
Source: BSG Internal Database, Industry Research.
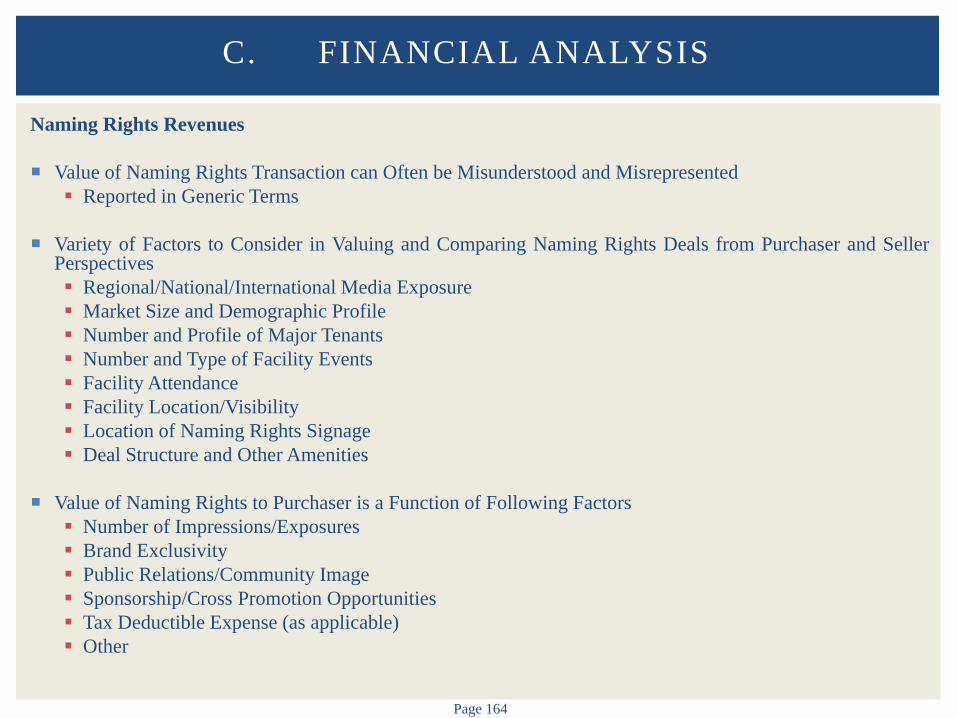
Page 164
Naming Rights Revenues
Value of Naming Rights Transaction can Often be Misunderstood and Misrepresented Reported in Generic Terms
Variety of Factors to Consider in Valuing and Comparing Naming Rights Deals from Purchaser and Seller
Perspectives Regional/National/International Media Exposure Market Size and Demographic Profile Number and Profile of Major Tenants Number and Type of Facility Events Facility Attendance Facility Location/Visibility Location of Naming Rights Signage Deal Structure and Other Amenities
Value of Naming Rights to Purchaser is a Function of Following Factors Number of Impressions/Exposures Brand Exclusivity Public Relations/Community Image Sponsorship/Cross Promotion Opportunities Tax Deductible Expense (as applicable) Other
C. FINANCIAL ANALYSIS
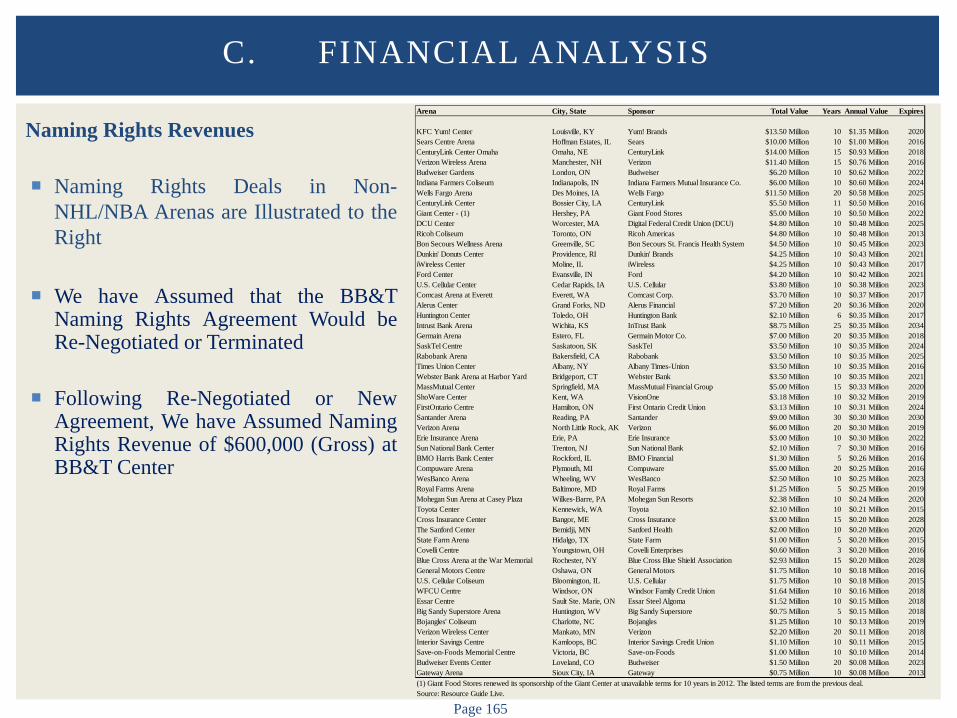
Page 165
Naming Rights Revenues
Naming Rights Deals in Non-NHL/NBA Arenas are Illustrated to the Right
We have Assumed that the BB&T Naming Rights Agreement Would be Re-Negotiated or Terminated
Following Re-Negotiated or New Agreement, We have Assumed Naming Rights Revenue of $600,000 (Gross) at BB&T Center
C. FINANCIAL ANALYSIS Arena City, State Sponsor Total Value Years Annual Value Expires
KFC Yum! Center Louisville, KY Yum! Brands $13.50 Million 10 $1.35 Million 2020Sears Centre Arena Hoffman Estates, IL Sears $10.00 Million 10 $1.00 Million 2016CenturyLink Center Omaha Omaha, NE CenturyLink $14.00 Million 15 $0.93 Million 2018Verizon Wireless Arena Manchester, NH Verizon $11.40 Million 15 $0.76 Million 2016Budweiser Gardens London, ON Budweiser $6.20 Million 10 $0.62 Million 2022Indiana Farmers Coliseum Indianapolis, IN Indiana Farmers Mutual Insurance Co. $6.00 Million 10 $0.60 Million 2024Wells Fargo Arena Des Moines, IA Wells Fargo $11.50 Million 20 $0.58 Million 2025CenturyLink Center Bossier City, LA CenturyLink $5.50 Million 11 $0.50 Million 2016Giant Center - (1) Hershey, PA Giant Food Stores $5.00 Million 10 $0.50 Million 2022DCU Center Worcester, MA Digital Federal Credit Union (DCU) $4.80 Million 10 $0.48 Million 2025Ricoh Coliseum Toronto, ON Ricoh Americas $4.80 Million 10 $0.48 Million 2013Bon Secours Wellness Arena Greenville, SC Bon Secours St. Francis Health System $4.50 Million 10 $0.45 Million 2023Dunkin' Donuts Center Providence, RI Dunkin' Brands $4.25 Million 10 $0.43 Million 2021iWireless Center Moline, IL iWireless $4.25 Million 10 $0.43 Million 2017Ford Center Evansville, IN Ford $4.20 Million 10 $0.42 Million 2021U.S. Cellular Center Cedar Rapids, IA U.S. Cellular $3.80 Million 10 $0.38 Million 2023Comcast Arena at Everett Everett, WA Comcast Corp. $3.70 Million 10 $0.37 Million 2017Alerus Center Grand Forks, ND Alerus Financial $7.20 Million 20 $0.36 Million 2020Huntington Center Toledo, OH Huntington Bank $2.10 Million 6 $0.35 Million 2017Intrust Bank Arena Wichita, KS InTrust Bank $8.75 Million 25 $0.35 Million 2034Germain Arena Estero, FL Germain Motor Co. $7.00 Million 20 $0.35 Million 2018SaskTel Centre Saskatoon, SK SaskTel $3.50 Million 10 $0.35 Million 2024Rabobank Arena Bakersfield, CA Rabobank $3.50 Million 10 $0.35 Million 2025Times Union Center Albany, NY Albany Times-Union $3.50 Million 10 $0.35 Million 2016Webster Bank Arena at Harbor Yard Bridgeport, CT Webster Bank $3.50 Million 10 $0.35 Million 2021MassMutual Center Springfield, MA MassMutual Financial Group $5.00 Million 15 $0.33 Million 2020ShoWare Center Kent, WA VisionOne $3.18 Million 10 $0.32 Million 2019FirstOntario Centre Hamilton, ON First Ontario Credit Union $3.13 Million 10 $0.31 Million 2024Santander Arena Reading, PA Santander $9.00 Million 30 $0.30 Million 2030Verizon Arena North Little Rock, AK Verizon $6.00 Million 20 $0.30 Million 2019Erie Insurance Arena Erie, PA Erie Insurance $3.00 Million 10 $0.30 Million 2022Sun National Bank Center Trenton, NJ Sun National Bank $2.10 Million 7 $0.30 Million 2016BMO Harris Bank Center Rockford, IL BMO Financial $1.30 Million 5 $0.26 Million 2016Compuware Arena Plymouth, MI Compuware $5.00 Million 20 $0.25 Million 2016WesBanco Arena Wheeling, WV WesBanco $2.50 Million 10 $0.25 Million 2023Royal Farms Arena Baltimore, MD Royal Farms $1.25 Million 5 $0.25 Million 2019Mohegan Sun Arena at Casey Plaza Wilkes-Barre, PA Mohegan Sun Resorts $2.38 Million 10 $0.24 Million 2020Toyota Center Kennewick, WA Toyota $2.10 Million 10 $0.21 Million 2015Cross Insurance Center Bangor, ME Cross Insurance $3.00 Million 15 $0.20 Million 2028The Sanford Center Bemidji, MN Sanford Health $2.00 Million 10 $0.20 Million 2020State Farm Arena Hidalgo, TX State Farm $1.00 Million 5 $0.20 Million 2015Covelli Centre Youngstown, OH Covelli Enterprises $0.60 Million 3 $0.20 Million 2016Blue Cross Arena at the War Memorial Rochester, NY Blue Cross Blue Shield Association $2.93 Million 15 $0.20 Million 2028General Motors Centre Oshawa, ON General Motors $1.75 Million 10 $0.18 Million 2016U.S. Cellular Coliseum Bloomington, IL U.S. Cellular $1.75 Million 10 $0.18 Million 2015WFCU Centre Windsor, ON Windsor Family Credit Union $1.64 Million 10 $0.16 Million 2018Essar Centre Sault Ste. Marie, ON Essar Steel Algoma $1.52 Million 10 $0.15 Million 2018Big Sandy Superstore Arena Huntington, WV Big Sandy Superstore $0.75 Million 5 $0.15 Million 2018Bojangles' Coliseum Charlotte, NC Bojangles $1.25 Million 10 $0.13 Million 2019Verizon Wireless Center Mankato, MN Verizon $2.20 Million 20 $0.11 Million 2018Interior Savings Centre Kamloops, BC Interior Savings Credit Union $1.10 Million 10 $0.11 Million 2015Save-on-Foods Memorial Centre Victoria, BC Save-on-Foods $1.00 Million 10 $0.10 Million 2014Budweiser Events Center Loveland, CO Budweiser $1.50 Million 20 $0.08 Million 2023Gateway Arena Sioux City, IA Gateway $0.75 Million 10 $0.08 Million 2013(1) Giant Food Stores renewed its sponsorship of the Giant Center at unavailable terms for 10 years in 2012. The listed terms are from the previous deal.Source: Resource Guide Live.
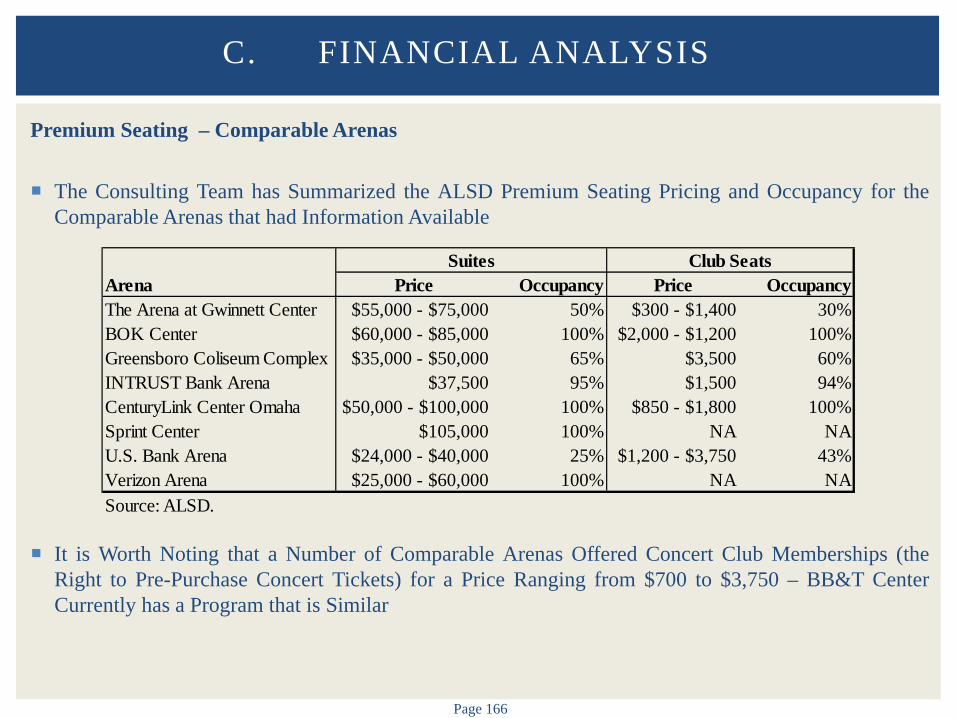
Page 166
Premium Seating – Comparable Arenas The Consulting Team has Summarized the ALSD Premium Seating Pricing and Occupancy for the
Comparable Arenas that had Information Available
It is Worth Noting that a Number of Comparable Arenas Offered Concert Club Memberships (the Right to Pre-Purchase Concert Tickets) for a Price Ranging from $700 to $3,750 – BB&T Center Currently has a Program that is Similar
C. FINANCIAL ANALYSIS
Arena Price Occupancy Price OccupancyThe Arena at Gwinnett Center $55,000 - $75,000 50% $300 - $1,400 30%BOK Center $60,000 - $85,000 100% $2,000 - $1,200 100%Greensboro Coliseum Complex $35,000 - $50,000 65% $3,500 60%INTRUST Bank Arena $37,500 95% $1,500 94%CenturyLink Center Omaha $50,000 - $100,000 100% $850 - $1,800 100%Sprint Center $105,000 100% NA NAU.S. Bank Arena $24,000 - $40,000 25% $1,200 - $3,750 43%Verizon Arena $25,000 - $60,000 100% NA NASource: ALSD.
Suites Club Seats

Page 167
Luxury Suite Revenue
Luxury Suite Prices Vary Considerably Based on Numerous Factors, Including: Age of Facility; Market; Corporate Base; Premium Seat Demand; Bundled Amenities; etc.
Annual Luxury Suite Revenue in Comparable Facilities Ranged from Approximately $177,000 to Approximately $5.9 Million. Average Annual Luxury Suite Revenue was Approximately $1.6 Million
We have Assumed Approximately $700,000 of Luxury Suite Lease Revenue (Excluding Tickets to Events and Any Bundled Food or Beverages) – Key Assumptions Included: 72 Luxury Suites of Varying Sizes; Net Lease Rate of Approximately $25,000 per Full Sized Suite with 40% Leased
C. FINANCIAL ANALYSIS
$177 $212 $424 $885
$1,279 $1,408 $1,621 $1,804 $1,965
$5,871
$1,565
$700
$0
$2,000
$4,000
$6,000
$8,000
Arena 1 Arena 2 Arena 3 Arena 4 Arena 5 Arena 6 Arena 7 Arena 8 Arena 9 Arena 10 Average BB&TCenter
LUXURY SUITE REVENUE($000s)
Source: BSG Internal Database, Industry Research.

Page 168
Club Seat Revenue
Club Seat Prices Vary Considerably Based on Numerous Factors, Including: Age of Facility; Market; Corporate Base; High Net-Worth Individuals; Premium Seat Demand; Amenities; etc.
Annual Club Seat Revenue in Comparable Facilities Ranged from Approximately $137,000 to Approximately $1.1 Million. Average Annual Club Seat Revenue was Approximately $648,000
We have Assumed Approximately $516,000 of Club Seat Lease Revenue (Excluding Tickets to Events and Any Bundled Food or Beverages) – Assumption Based on: 2,062 Marketed Club Seats with 25% Leased; Club Seat Premium Price of $1,000
C. FINANCIAL ANALYSIS
$137 $180
$913 $961 $1,050
$648 $516
$0
$500
$1,000
$1,500
$2,000
Arena 1 Arena 2 Arena 3 Arena 4 Arena 5 Average BB&T Center
CLUB SEAT REVENUE($000s)
Source: BSG Internal Database, Industry Research.
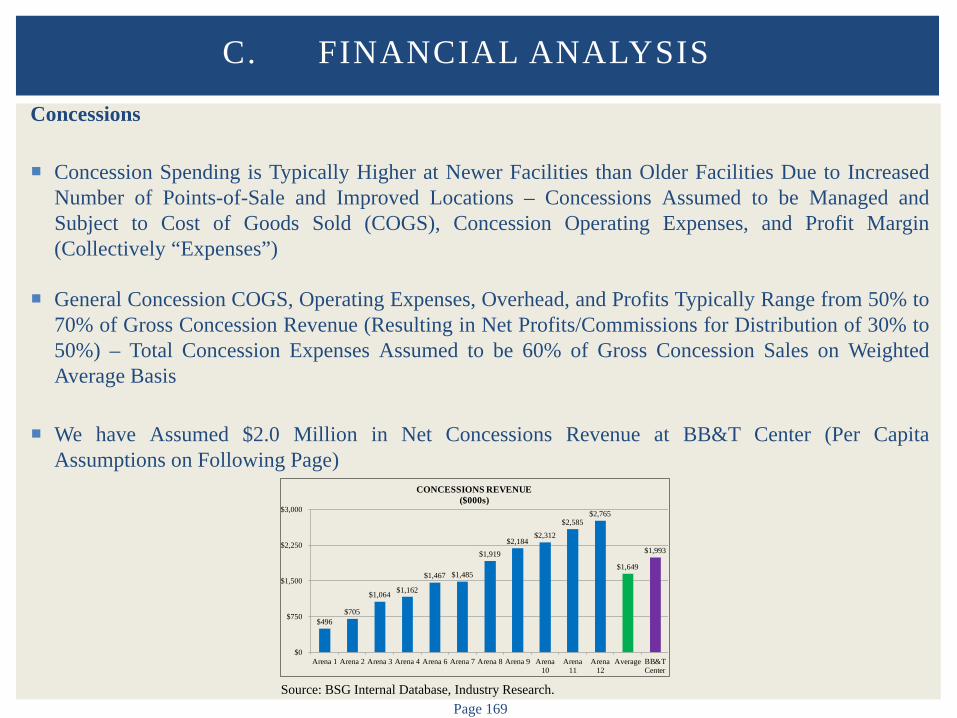
Page 169
Concessions
Concession Spending is Typically Higher at Newer Facilities than Older Facilities Due to Increased Number of Points-of-Sale and Improved Locations – Concessions Assumed to be Managed and Subject to Cost of Goods Sold (COGS), Concession Operating Expenses, and Profit Margin (Collectively “Expenses”)
General Concession COGS, Operating Expenses, Overhead, and Profits Typically Range from 50% to 70% of Gross Concession Revenue (Resulting in Net Profits/Commissions for Distribution of 30% to 50%) – Total Concession Expenses Assumed to be 60% of Gross Concession Sales on Weighted Average Basis
We have Assumed $2.0 Million in Net Concessions Revenue at BB&T Center (Per Capita Assumptions on Following Page)
C. FINANCIAL ANALYSIS
$496 $705
$1,064 $1,162
$1,467 $1,485
$1,919 $2,184
$2,312
$2,585 $2,765
$1,649
$1,993
$0
$750
$1,500
$2,250
$3,000
Arena 1 Arena 2 Arena 3 Arena 4 Arena 6 Arena 7 Arena 8 Arena 9 Arena10
Arena11
Arena12
Average BB&TCenter
CONCESSIONS REVENUE($000s)
Source: BSG Internal Database, Industry Research.
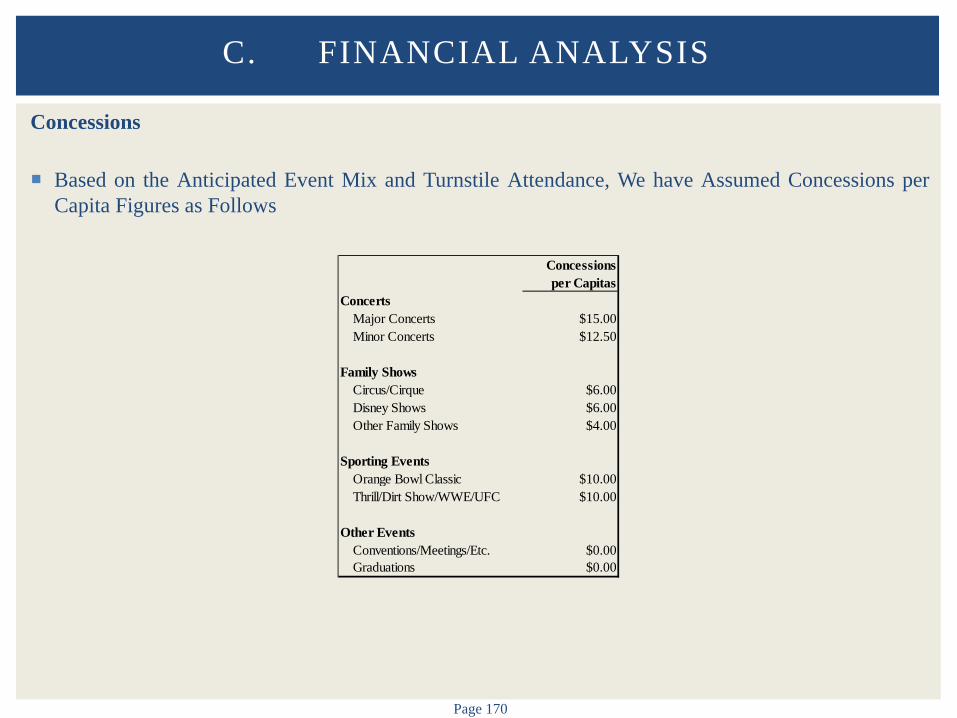
Page 170
Concessions
Based on the Anticipated Event Mix and Turnstile Attendance, We have Assumed Concessions per Capita Figures as Follows
C. FINANCIAL ANALYSIS
Concessions per Capitas
ConcertsMajor Concerts $15.00Minor Concerts $12.50
Family ShowsCircus/Cirque $6.00Disney Shows $6.00Other Family Shows $4.00
Sporting EventsOrange Bowl Classic $10.00Thrill/Dirt Show/WWE/UFC $10.00
Other EventsConventions/Meetings/Etc. $0.00Graduations $0.00
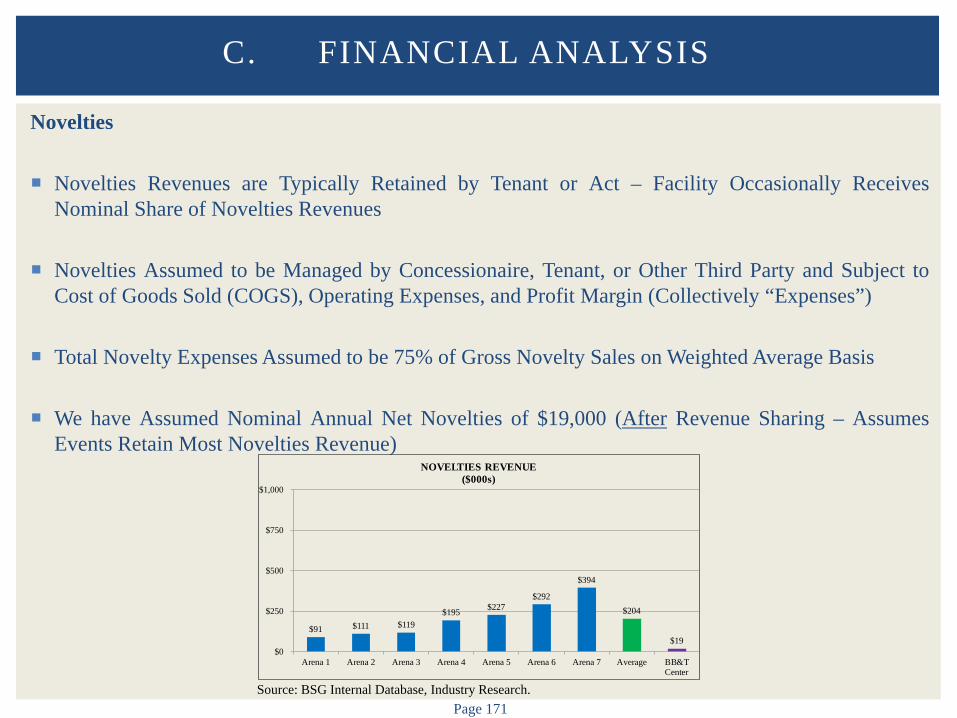
Page 171
Novelties
Novelties Revenues are Typically Retained by Tenant or Act – Facility Occasionally Receives Nominal Share of Novelties Revenues
Novelties Assumed to be Managed by Concessionaire, Tenant, or Other Third Party and Subject to Cost of Goods Sold (COGS), Operating Expenses, and Profit Margin (Collectively “Expenses”)
Total Novelty Expenses Assumed to be 75% of Gross Novelty Sales on Weighted Average Basis
We have Assumed Nominal Annual Net Novelties of $19,000 (After Revenue Sharing – Assumes Events Retain Most Novelties Revenue)
C. FINANCIAL ANALYSIS
$91 $111 $119 $195 $227
$292
$394
$204
$19 $0
$250
$500
$750
$1,000
Arena 1 Arena 2 Arena 3 Arena 4 Arena 5 Arena 6 Arena 7 Average BB&TCenter
NOVELTIES REVENUE($000s)
Source: BSG Internal Database, Industry Research.
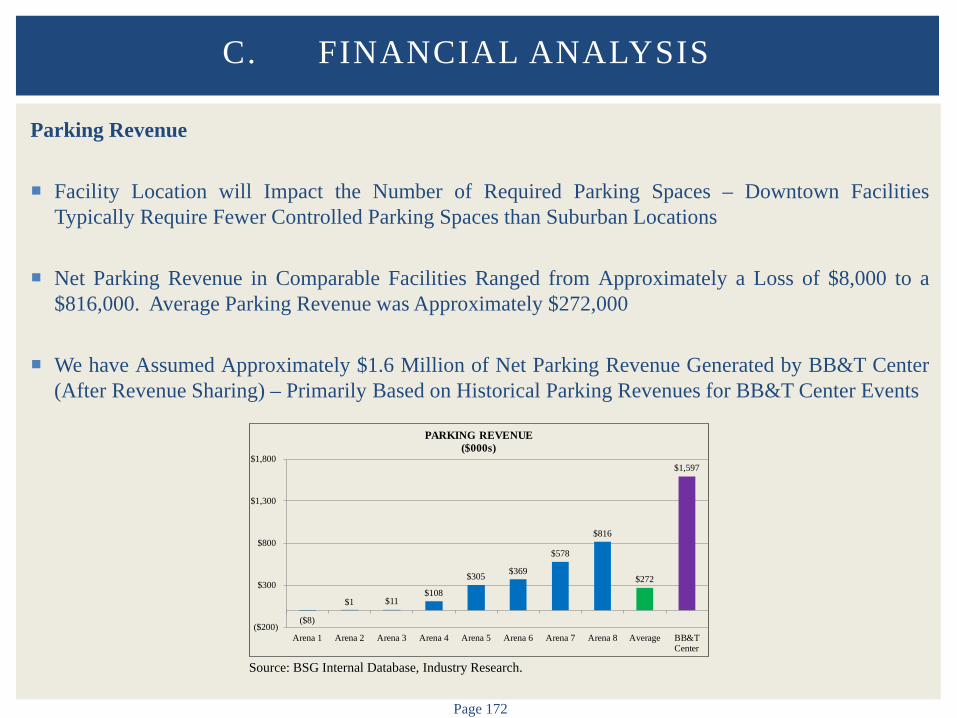
Page 172
Parking Revenue
Facility Location will Impact the Number of Required Parking Spaces – Downtown Facilities Typically Require Fewer Controlled Parking Spaces than Suburban Locations
Net Parking Revenue in Comparable Facilities Ranged from Approximately a Loss of $8,000 to a $816,000. Average Parking Revenue was Approximately $272,000
We have Assumed Approximately $1.6 Million of Net Parking Revenue Generated by BB&T Center (After Revenue Sharing) – Primarily Based on Historical Parking Revenues for BB&T Center Events
C. FINANCIAL ANALYSIS
($8)
$1 $11 $108
$305 $369
$578
$816
$272
$1,597
($200)
$300
$800
$1,300
$1,800
Arena 1 Arena 2 Arena 3 Arena 4 Arena 5 Arena 6 Arena 7 Arena 8 Average BB&TCenter
PARKING REVENUE($000s)
Source: BSG Internal Database, Industry Research.
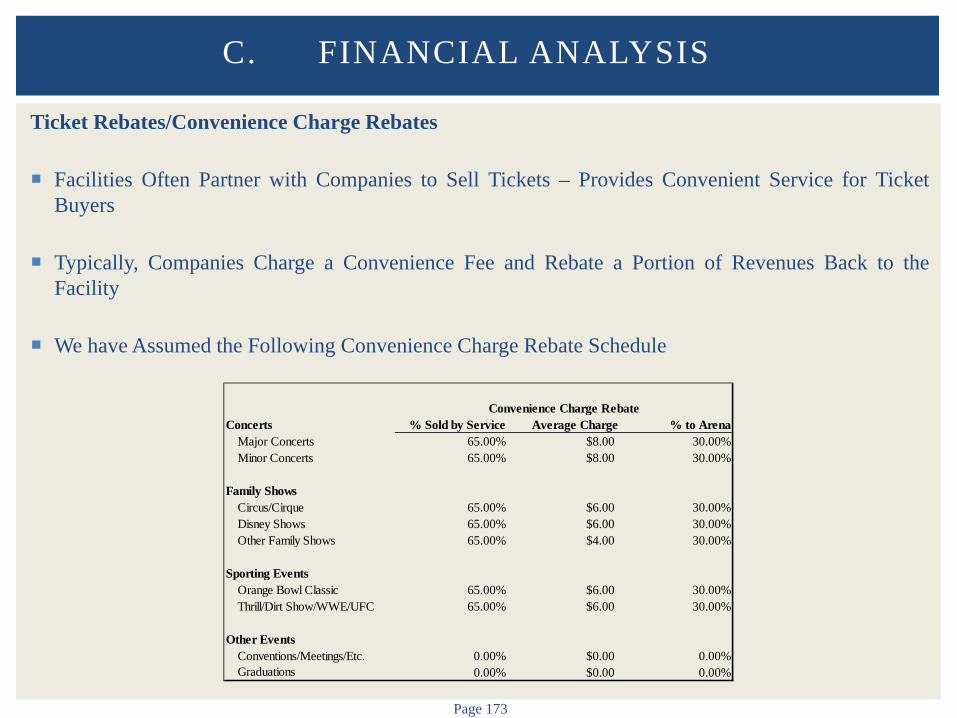
Page 173
Ticket Rebates/Convenience Charge Rebates
Facilities Often Partner with Companies to Sell Tickets – Provides Convenient Service for Ticket Buyers
Typically, Companies Charge a Convenience Fee and Rebate a Portion of Revenues Back to the Facility
We have Assumed the Following Convenience Charge Rebate Schedule
C. FINANCIAL ANALYSIS
Concerts % Sold by Service Average Charge % to ArenaMajor Concerts 65.00% $8.00 30.00%Minor Concerts 65.00% $8.00 30.00%
Family ShowsCircus/Cirque 65.00% $6.00 30.00%Disney Shows 65.00% $6.00 30.00%Other Family Shows 65.00% $4.00 30.00%
Sporting EventsOrange Bowl Classic 65.00% $6.00 30.00%Thrill/Dirt Show/WWE/UFC 65.00% $6.00 30.00%
Other EventsConventions/Meetings/Etc. 0.00% $0.00 0.00%Graduations 0.00% $0.00 0.00%
Convenience Charge Rebate
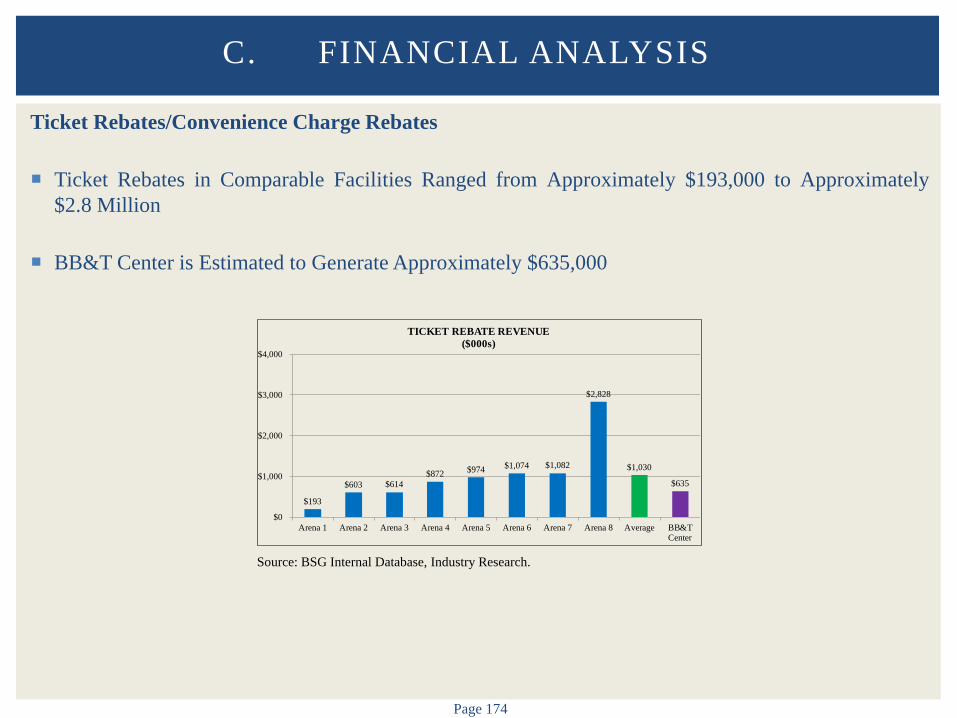
Page 174
Ticket Rebates/Convenience Charge Rebates
Ticket Rebates in Comparable Facilities Ranged from Approximately $193,000 to Approximately $2.8 Million
BB&T Center is Estimated to Generate Approximately $635,000
C. FINANCIAL ANALYSIS
$193
$603 $614 $872 $974 $1,074 $1,082
$2,828
$1,030
$635
$0
$1,000
$2,000
$3,000
$4,000
Arena 1 Arena 2 Arena 3 Arena 4 Arena 5 Arena 6 Arena 7 Arena 8 Average BB&TCenter
TICKET REBATE REVENUE($000s)
Source: BSG Internal Database, Industry Research.
Page 175
Other Revenues
BB&T Center May Generate Additional Miscellaneous Revenues, Including:
Facility Fee Credit Card Fees Other
We Assumed No Revenues from the Facility Fee which the Panthers had Previously been Charging on
Hockey Events
We Assumed a Continuation of a Seat Use Charge on All Tickets of $2.50 per Ticket
C. FINANCIAL ANALYSIS
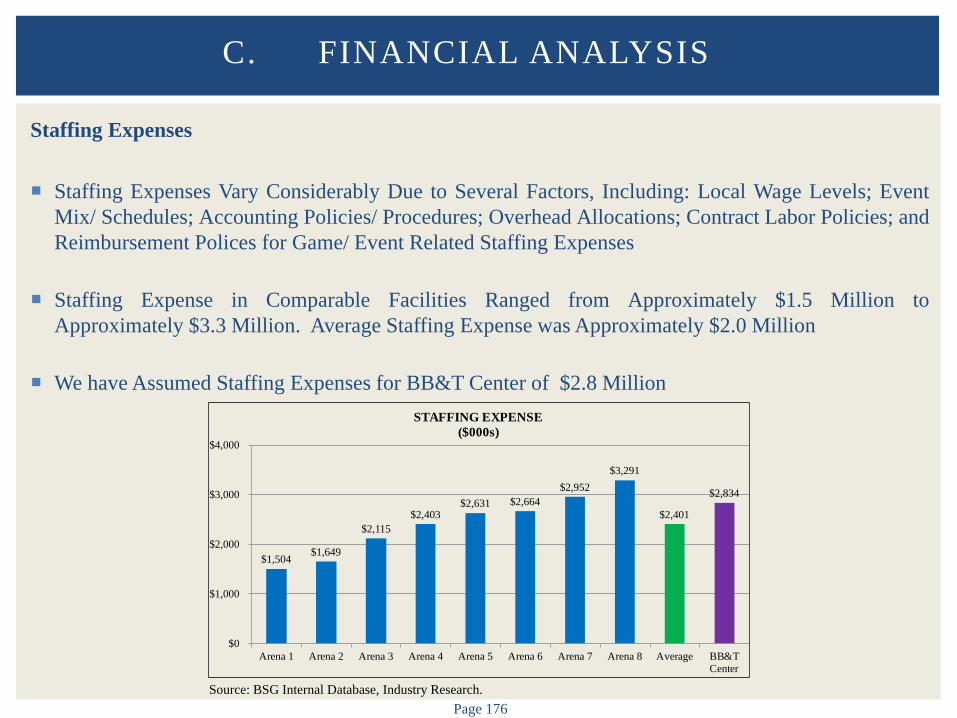
Page 176
Staffing Expenses
Staffing Expenses Vary Considerably Due to Several Factors, Including: Local Wage Levels; Event Mix/ Schedules; Accounting Policies/ Procedures; Overhead Allocations; Contract Labor Policies; and Reimbursement Polices for Game/ Event Related Staffing Expenses
Staffing Expense in Comparable Facilities Ranged from Approximately $1.5 Million to Approximately $3.3 Million. Average Staffing Expense was Approximately $2.0 Million
We have Assumed Staffing Expenses for BB&T Center of $2.8 Million
C. FINANCIAL ANALYSIS
$1,504 $1,649
$2,115 $2,403
$2,631 $2,664 $2,952
$3,291
$2,401
$2,834
$0
$1,000
$2,000
$3,000
$4,000
Arena 1 Arena 2 Arena 3 Arena 4 Arena 5 Arena 6 Arena 7 Arena 8 Average BB&TCenter
STAFFING EXPENSE($000s)
Source: BSG Internal Database, Industry Research.
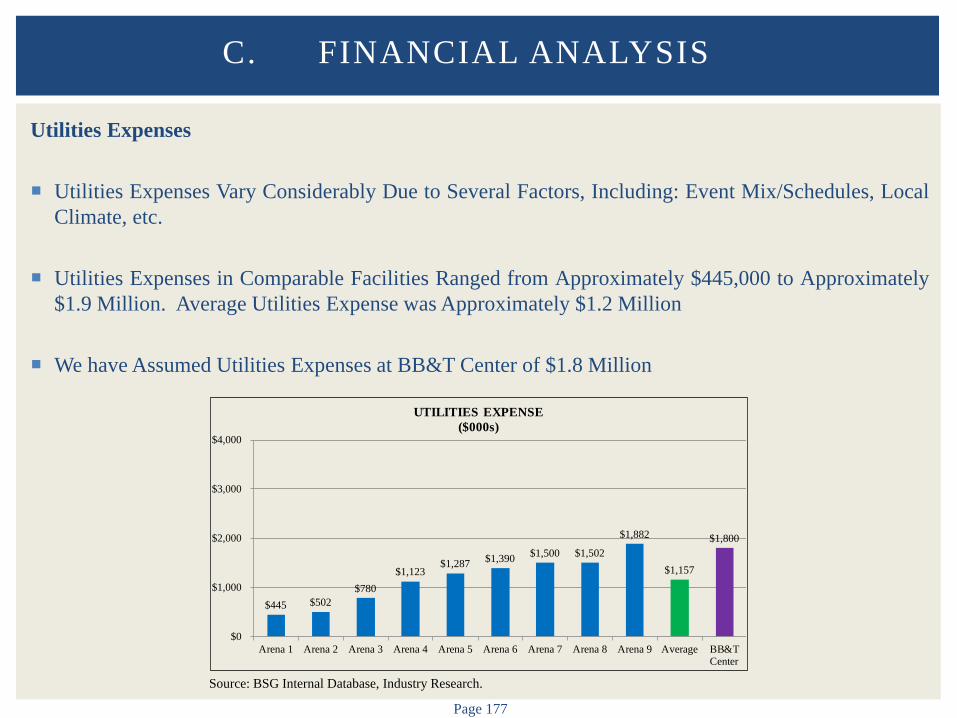
Page 177
Utilities Expenses
Utilities Expenses Vary Considerably Due to Several Factors, Including: Event Mix/Schedules, Local Climate, etc.
Utilities Expenses in Comparable Facilities Ranged from Approximately $445,000 to Approximately $1.9 Million. Average Utilities Expense was Approximately $1.2 Million
We have Assumed Utilities Expenses at BB&T Center of $1.8 Million
C. FINANCIAL ANALYSIS
$445 $502 $780
$1,123 $1,287 $1,390 $1,500 $1,502
$1,882
$1,157
$1,800
$0
$1,000
$2,000
$3,000
$4,000
Arena 1 Arena 2 Arena 3 Arena 4 Arena 5 Arena 6 Arena 7 Arena 8 Arena 9 Average BB&TCenter
UTILITIES EXPENSE($000s)
Source: BSG Internal Database, Industry Research.
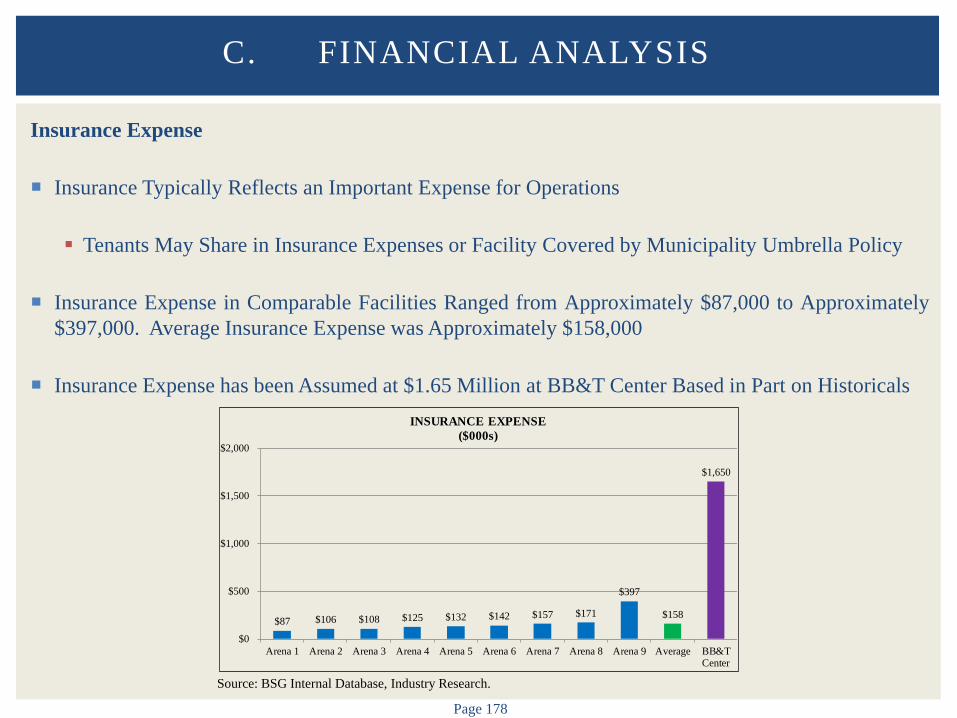
Page 178
Insurance Expense
Insurance Typically Reflects an Important Expense for Operations Tenants May Share in Insurance Expenses or Facility Covered by Municipality Umbrella Policy
Insurance Expense in Comparable Facilities Ranged from Approximately $87,000 to Approximately
$397,000. Average Insurance Expense was Approximately $158,000
Insurance Expense has been Assumed at $1.65 Million at BB&T Center Based in Part on Historicals
C. FINANCIAL ANALYSIS
$87 $106 $108 $125 $132 $142 $157 $171
$397
$158
$1,650
$0
$500
$1,000
$1,500
$2,000
Arena 1 Arena 2 Arena 3 Arena 4 Arena 5 Arena 6 Arena 7 Arena 8 Arena 9 Average BB&TCenter
INSURANCE EXPENSE($000s)
Source: BSG Internal Database, Industry Research.

Page 179
Repairs and Maintenance Expense
Repairs and Maintenance Expenses Vary Due to a Number of Factors, Including: Age and Condition of Facility; Accounting Policies/ Procedures; etc.
Repairs and Maintenance Expenses in Comparable Facilities Ranged from Approximately $26,000 to Approximately $366,000. Average Repairs and Maintenance Expense was Approximately $213,000
We have Assumed $300,000 Related to Repairs and Maintenance Expense at BB&T Center
C. FINANCIAL ANALYSIS
$26
$121 $166
$212 $213 $263
$339 $366
$213
$300
$0
$150
$300
$450
$600
Arena 1 Arena 2 Arena 3 Arena 4 Arena 5 Arena 6 Arena 7 Arena 8 Average BB&TCenter
REPAIRS AND MAINTENANCE EXPENSE($000s)
Source: BSG Internal Database, Industry Research.
Page 180
Management Fee Expense
Some Facilities Hire an Outside Manager or Team Affiliate for Management of Facility
Management Fee Typically Consists of Base Fee and Incentive Fee
We have Assumed a Management Fee of $200,000 for BB&T Center
C. FINANCIAL ANALYSIS
Page 181
Other Expenses
Supplies
Equipment Rental
Promotions/Marketing
General and Administrative Expenses Photocopying Printing Office Supplies Travel Entertainment Other General and Administrative Expenses
Security Expenses
Other Operating Expenses
C. FINANCIAL ANALYSIS

Page 182
Other Miscellaneous Expenses
Game Day Expenses Event Set-Up/Tear Down, Staffing, Ticket Takers, Security, Clean-Up, etc.
Significant Portion, or All, of Game Day Expense are Often Reimbursed by Event/Tenant
Property Taxes
No Property Taxes have been Assumed
C. FINANCIAL ANALYSIS

Page 183
Total Operating Expenses
Total Operating Expenses Vary Considerably Due to Several Factors, Including: Local Wage Levels; Event Mix/Schedules; Accounting Policies/Procedures; Overhead Allocations; Contract Labor Policies; and Reimbursement Polices for Game/Event Related Staffing Expenses
Total Operating Expenses in Comparable Facilities Ranged from Approximately $2.4 Million to Approximately $10.2 Million (Excluding Management Fee, as Applicable)
We have Assumed Approximately $8.4 Million of Total Operating Expenses at BB&T Center (Excluding Management Fee)
C. FINANCIAL ANALYSIS
$2,392
$3,895
$5,226 $5,571 $5,649 $5,675 $6,322 $6,574 $6,919 $7,299 $7,668
$10,178
$6,114
$8,399
$0
$3,000
$6,000
$9,000
$12,000
TOTAL OPERATING EXPENSES($000s)
Source: BSG Internal Database, Industry Research.
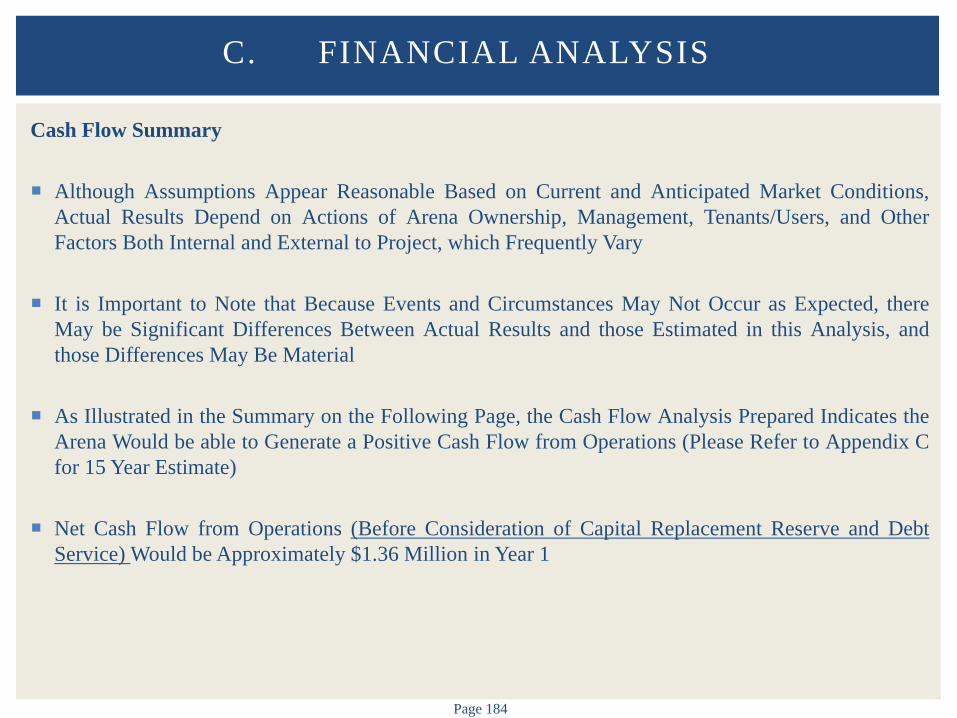
Page 184
Cash Flow Summary
Although Assumptions Appear Reasonable Based on Current and Anticipated Market Conditions, Actual Results Depend on Actions of Arena Ownership, Management, Tenants/Users, and Other Factors Both Internal and External to Project, which Frequently Vary
It is Important to Note that Because Events and Circumstances May Not Occur as Expected, there May be Significant Differences Between Actual Results and those Estimated in this Analysis, and those Differences May Be Material
As Illustrated in the Summary on the Following Page, the Cash Flow Analysis Prepared Indicates the Arena Would be able to Generate a Positive Cash Flow from Operations (Please Refer to Appendix C for 15 Year Estimate)
Net Cash Flow from Operations (Before Consideration of Capital Replacement Reserve and Debt Service) Would be Approximately $1.36 Million in Year 1
C. FINANCIAL ANALYSIS
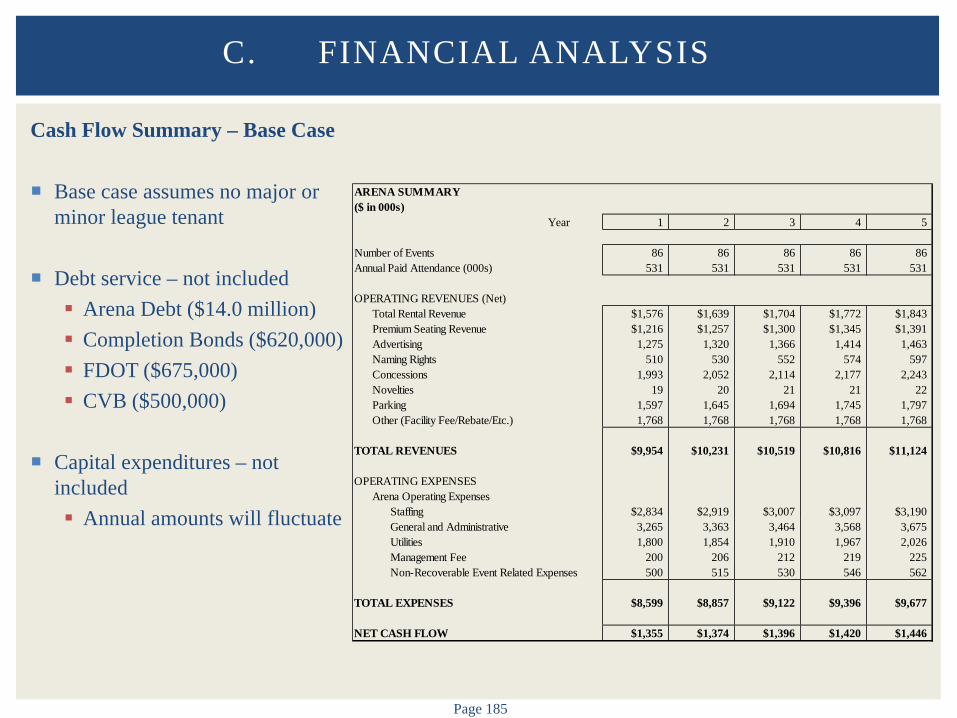
Page 185
Cash Flow Summary – Base Case Base case assumes no major or
minor league tenant
Debt service – not included Arena Debt ($14.0 million) Completion Bonds ($620,000) FDOT ($675,000) CVB ($500,000)
Capital expenditures – not
included Annual amounts will fluctuate
C. FINANCIAL ANALYSIS
ARENA SUMMARY($ in 000s)
Year 1 2 3 4 5
Number of Events 86 86 86 86 86Annual Paid Attendance (000s) 531 531 531 531 531
OPERATING REVENUES (Net)Total Rental Revenue $1,576 $1,639 $1,704 $1,772 $1,843Premium Seating Revenue $1,216 $1,257 $1,300 $1,345 $1,391Advertising 1,275 1,320 1,366 1,414 1,463Naming Rights 510 530 552 574 597Concessions 1,993 2,052 2,114 2,177 2,243Novelties 19 20 21 21 22Parking 1,597 1,645 1,694 1,745 1,797Other (Facility Fee/Rebate/Etc.) 1,768 1,768 1,768 1,768 1,768
TOTAL REVENUES $9,954 $10,231 $10,519 $10,816 $11,124
OPERATING EXPENSESArena Operating Expenses
Staffing $2,834 $2,919 $3,007 $3,097 $3,190General and Administrative 3,265 3,363 3,464 3,568 3,675Utilities 1,800 1,854 1,910 1,967 2,026Management Fee 200 206 212 219 225Non-Recoverable Event Related Expenses 500 515 530 546 562
TOTAL EXPENSES $8,599 $8,857 $9,122 $9,396 $9,677
NET CASH FLOW $1,355 $1,374 $1,396 $1,420 $1,446
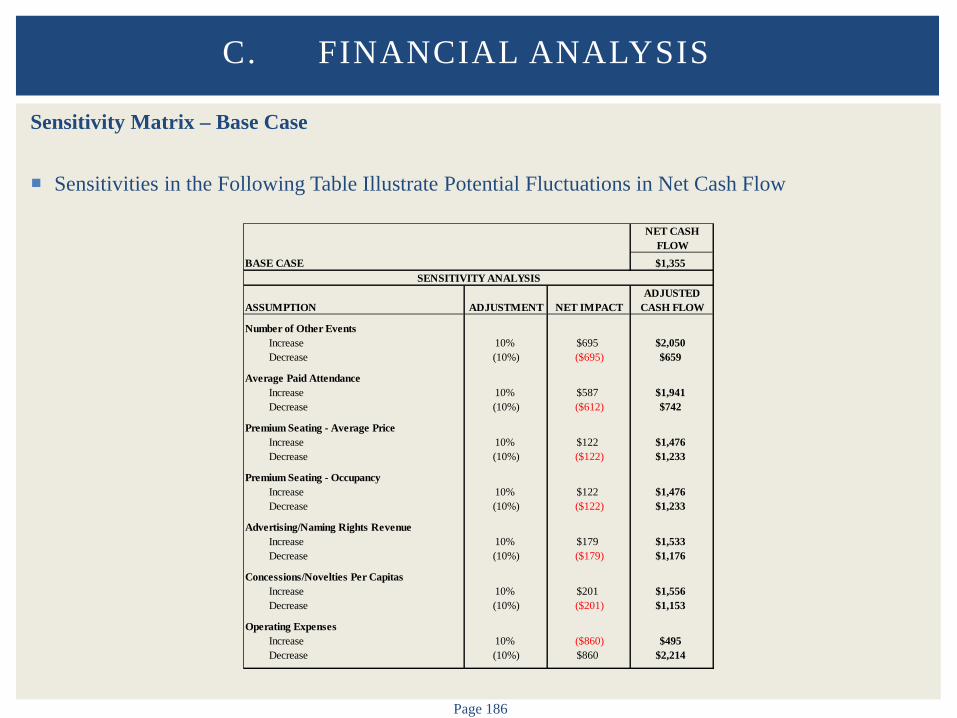
Page 186
Sensitivity Matrix – Base Case Sensitivities in the Following Table Illustrate Potential Fluctuations in Net Cash Flow
C. FINANCIAL ANALYSIS
NET CASHFLOW
BASE CASE $1,355
ADJUSTEDASSUMPTION ADJUSTMENT NET IMPACT CASH FLOW
Number of Other Events Increase 10% $695 $2,050Decrease (10%) ($695) $659
Average Paid AttendanceIncrease 10% $587 $1,941Decrease (10%) ($612) $742
Premium Seating - Average PriceIncrease 10% $122 $1,476Decrease (10%) ($122) $1,233
Premium Seating - OccupancyIncrease 10% $122 $1,476Decrease (10%) ($122) $1,233
Advertising/Naming Rights RevenueIncrease 10% $179 $1,533Decrease (10%) ($179) $1,176
Concessions/Novelties Per CapitasIncrease 10% $201 $1,556Decrease (10%) ($201) $1,153
Operating ExpensesIncrease 10% ($860) $495Decrease (10%) $860 $2,214
SENSITIVITY ANALYSIS
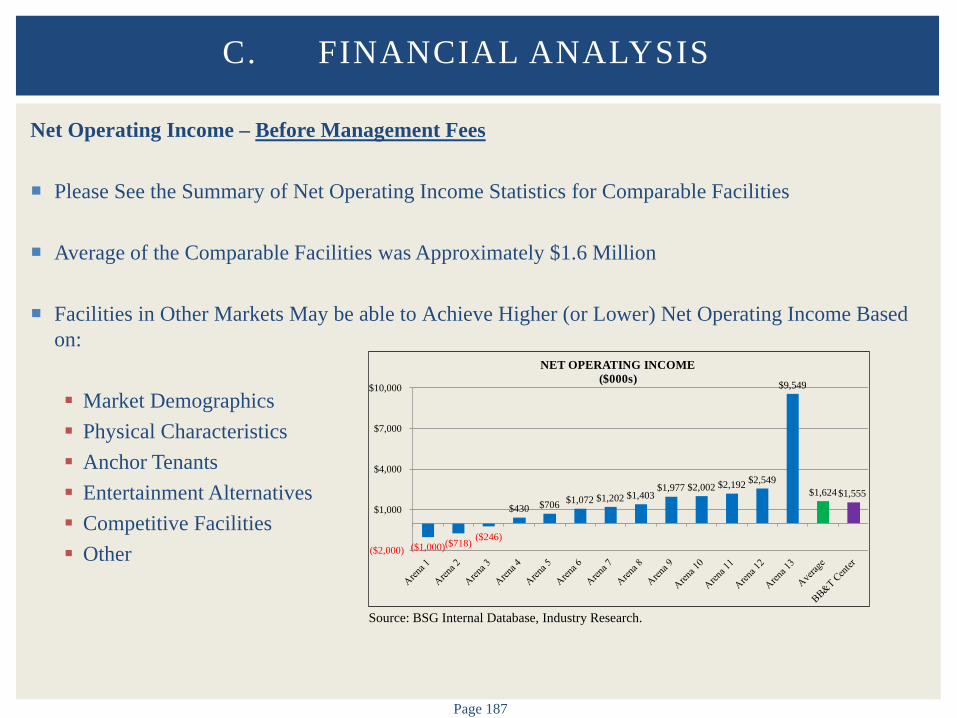
Page 187
Net Operating Income – Before Management Fees
Please See the Summary of Net Operating Income Statistics for Comparable Facilities
Average of the Comparable Facilities was Approximately $1.6 Million
Facilities in Other Markets May be able to Achieve Higher (or Lower) Net Operating Income Based on: Market Demographics Physical Characteristics Anchor Tenants Entertainment Alternatives Competitive Facilities Other
C. FINANCIAL ANALYSIS
Source: BSG Internal Database, Industry Research.
($1,000)($718) ($246)
$430 $706 $1,072 $1,202 $1,403 $1,977 $2,002 $2,192 $2,549
$9,549
$1,624 $1,555
($2,000)
$1,000
$4,000
$7,000
$10,000
NET OPERATING INCOME($000s)

Page 188
Potential Lease Terms for a Replacement Sports Tenant Any Franchise Negotiating to Play at BB&T Center After the Panthers Will Likely Ask for "Prime
Tenant" Terms, Allowing it to Retain Most Game-Day Economics and Pay Minimal Rent
The Cost to the County of Offering Favorable Terms is Unlikely to Be Prohibitive, So Long As the Arena Operator is Protected From Downside Risk by Having the Tenant Cover All Game-Day Expenses
For Modeling Purposes, We Assumed the Following General Lease/License Terms for a Potential Replacement Tenant – Actual Terms Subject to Negotiations Team Pays $5,000/Game Rent Team Receives 75% of Net Concessions Revenue Team Receives 100% of Novelties Revenue Team Receives 0% of Parking Revenue Team Receives 100% of Game Day Sponsorship Team Pays 100% Game Day Expenses
County Must Evaluate the Opportunity Cost of Potential Missed Bookings of Significant Revenue-
Generating Concert Events vs. Activity Generated by a Minor League Tenant (and the Economics Resulting from Key Lease/License Terms with Such Tenant)
C. FINANCIAL ANALYSIS

Page 189
Sensitivity #1 – Arena with ECHL Tenant Major Assumptions/Variances
from Base Case Cash Flow Include 36 ECHL Events Decrease Major Concerts by 1 Decrease Minor Concerts by 1 Decrease Family Shows by 1 Increase Naming Rights
Revenue by $75,000 (Gross) Increase Advertising Revenue
by $75,000 (Gross) Increase Utilities Expense by
$250,000 Increase Staffing and G&A
Expenses by 5.0%
C. FINANCIAL ANALYSIS
ARENA SUMMARY($ in 000s)
Year 1 2 3 4 5
Number of Events 119 119 119 119 119Annual Paid Attendance (000s) 651 651 651 651 651
OPERATING REVENUES (Net)Total Rental Revenue $1,494 $1,553 $1,615 $1,680 $1,747Premium Seating Revenue $1,216 $1,257 $1,300 $1,345 $1,391Advertising 1,339 1,386 1,434 1,484 1,536Naming Rights 574 597 621 645 671Concessions 1,981 2,040 2,102 2,165 2,229Novelties 19 20 21 21 22Parking 1,708 1,759 1,812 1,866 1,922Other (Facility Fee/Rebate/Etc.) 2,202 2,202 2,202 2,202 2,202
TOTAL REVENUES $10,532 $10,814 $11,106 $11,408 $11,720
OPERATING EXPENSESArena Operating Expenses
Staffing $2,976 $3,065 $3,157 $3,252 $3,349General and Administrative 3,428 3,531 3,637 3,746 3,859Utilities 2,050 2,112 2,175 2,240 2,307Management Fee 200 206 212 219 225Non-Recoverable Event Related Expenses 500 515 530 546 562
TOTAL EXPENSES $9,154 $9,429 $9,711 $10,002 $10,302
NET CASH FLOW $1,378 $1,385 $1,395 $1,406 $1,418
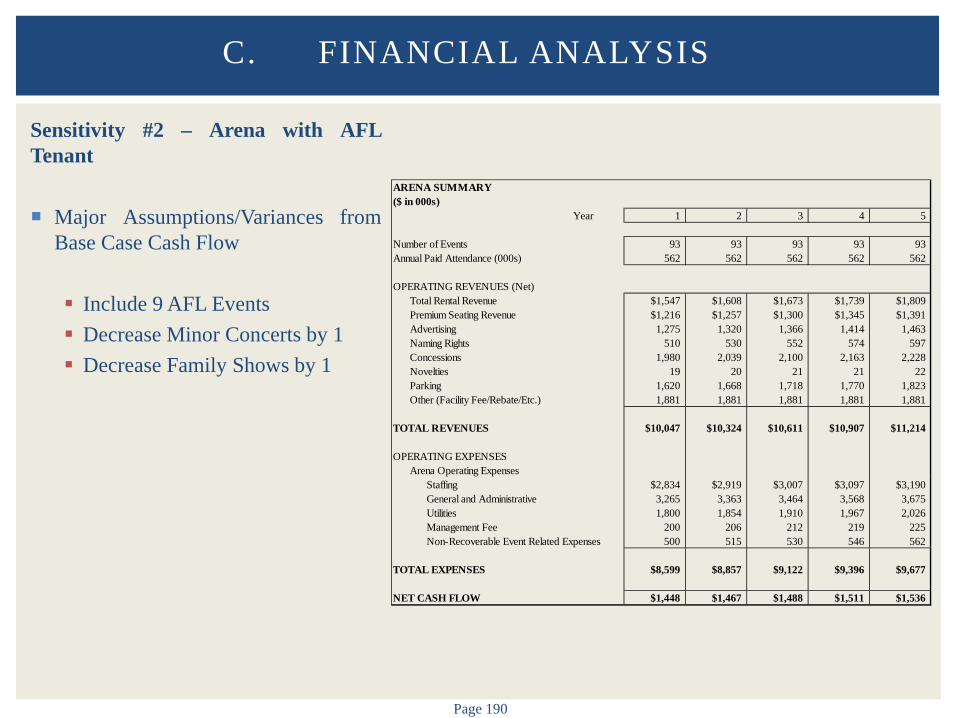
Page 190
Sensitivity #2 – Arena with AFL Tenant Major Assumptions/Variances from
Base Case Cash Flow Include 9 AFL Events Decrease Minor Concerts by 1 Decrease Family Shows by 1
C. FINANCIAL ANALYSIS
ARENA SUMMARY($ in 000s)
Year 1 2 3 4 5
Number of Events 93 93 93 93 93Annual Paid Attendance (000s) 562 562 562 562 562
OPERATING REVENUES (Net)Total Rental Revenue $1,547 $1,608 $1,673 $1,739 $1,809Premium Seating Revenue $1,216 $1,257 $1,300 $1,345 $1,391Advertising 1,275 1,320 1,366 1,414 1,463Naming Rights 510 530 552 574 597Concessions 1,980 2,039 2,100 2,163 2,228Novelties 19 20 21 21 22Parking 1,620 1,668 1,718 1,770 1,823Other (Facility Fee/Rebate/Etc.) 1,881 1,881 1,881 1,881 1,881
TOTAL REVENUES $10,047 $10,324 $10,611 $10,907 $11,214
OPERATING EXPENSESArena Operating Expenses
Staffing $2,834 $2,919 $3,007 $3,097 $3,190General and Administrative 3,265 3,363 3,464 3,568 3,675Utilities 1,800 1,854 1,910 1,967 2,026Management Fee 200 206 212 219 225Non-Recoverable Event Related Expenses 500 515 530 546 562
TOTAL EXPENSES $8,599 $8,857 $9,122 $9,396 $9,677
NET CASH FLOW $1,448 $1,467 $1,488 $1,511 $1,536
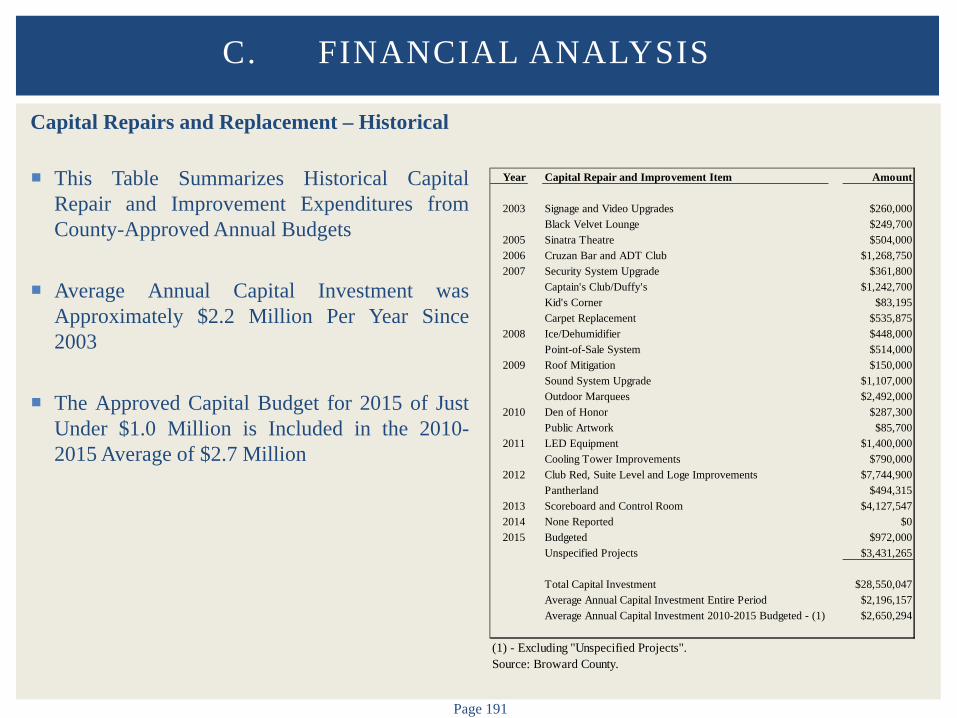
Page 191
Capital Repairs and Replacement – Historical
This Table Summarizes Historical Capital Repair and Improvement Expenditures from County-Approved Annual Budgets
Average Annual Capital Investment was Approximately $2.2 Million Per Year Since 2003
The Approved Capital Budget for 2015 of Just Under $1.0 Million is Included in the 2010-2015 Average of $2.7 Million
C. FINANCIAL ANALYSIS
Year Capital Repair and Improvement Item Amount
2003 Signage and Video Upgrades $260,000Black Velvet Lounge $249,700
2005 Sinatra Theatre $504,0002006 Cruzan Bar and ADT Club $1,268,7502007 Security System Upgrade $361,800
Captain's Club/Duffy's $1,242,700Kid's Corner $83,195Carpet Replacement $535,875
2008 Ice/Dehumidifier $448,000Point-of-Sale System $514,000
2009 Roof Mitigation $150,000Sound System Upgrade $1,107,000Outdoor Marquees $2,492,000
2010 Den of Honor $287,300Public Artwork $85,700
2011 LED Equipment $1,400,000Cooling Tower Improvements $790,000
2012 Club Red, Suite Level and Loge Improvements $7,744,900Pantherland $494,315
2013 Scoreboard and Control Room $4,127,5472014 None Reported $02015 Budgeted $972,000
Unspecified Projects $3,431,265
Total Capital Investment $28,550,047Average Annual Capital Investment Entire Period $2,196,157Average Annual Capital Investment 2010-2015 Budgeted - (1) $2,650,294
(1) - Excluding "Unspecified Projects".Source: Broward County.
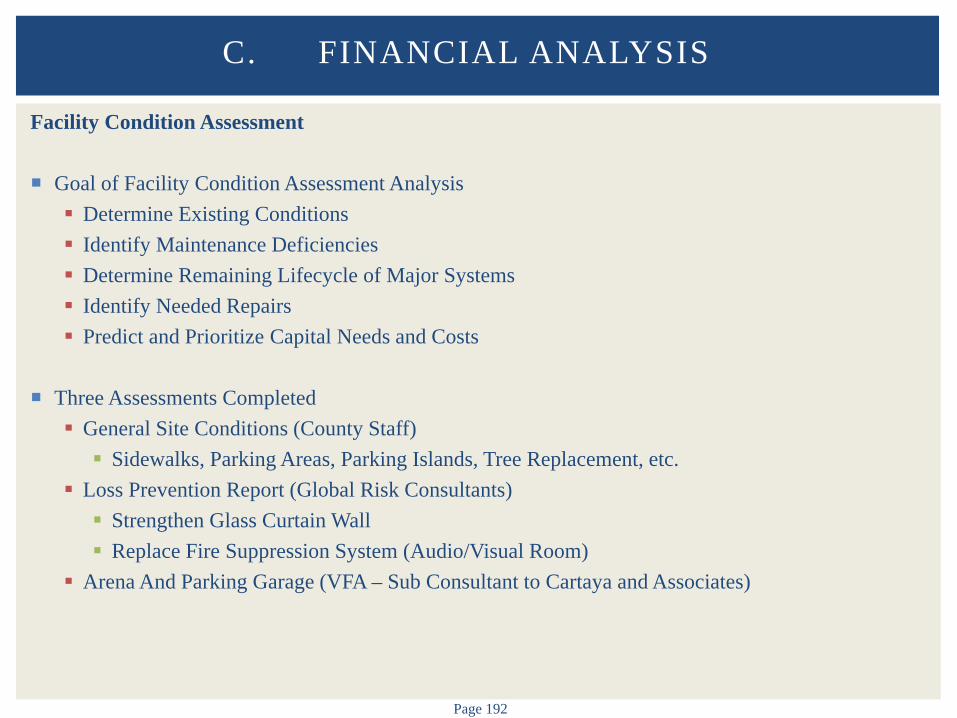
Page 192
Facility Condition Assessment Goal of Facility Condition Assessment Analysis Determine Existing Conditions Identify Maintenance Deficiencies Determine Remaining Lifecycle of Major Systems Identify Needed Repairs Predict and Prioritize Capital Needs and Costs
Three Assessments Completed General Site Conditions (County Staff) Sidewalks, Parking Areas, Parking Islands, Tree Replacement, etc.
Loss Prevention Report (Global Risk Consultants) Strengthen Glass Curtain Wall Replace Fire Suppression System (Audio/Visual Room)
Arena And Parking Garage (VFA – Sub Consultant to Cartaya and Associates)
C. FINANCIAL ANALYSIS
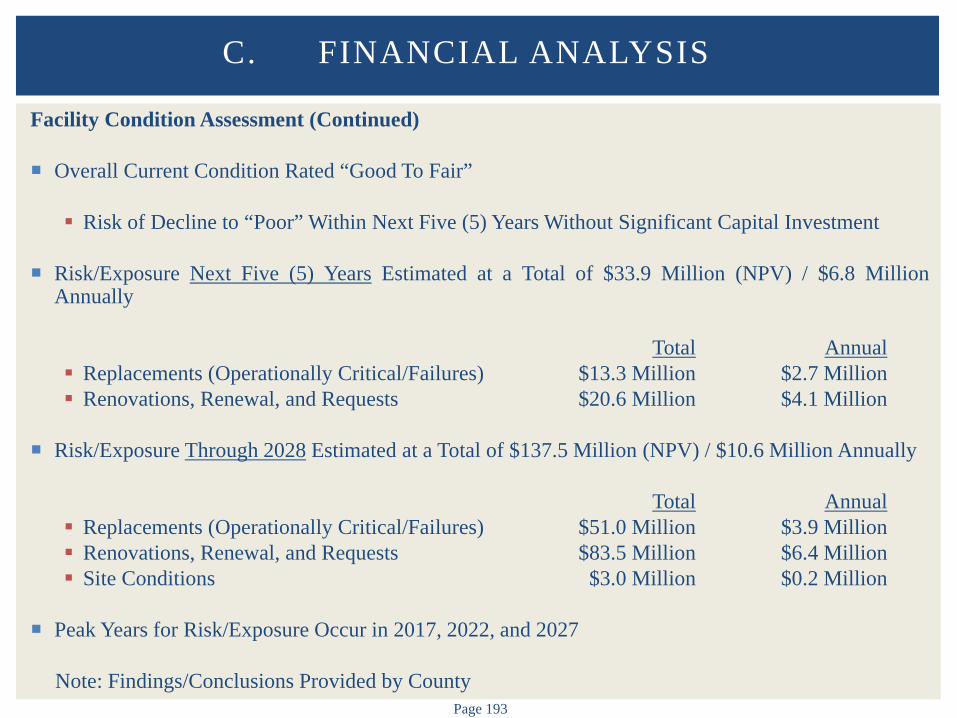
Page 193
Facility Condition Assessment (Continued) Overall Current Condition Rated “Good To Fair”
Risk of Decline to “Poor” Within Next Five (5) Years Without Significant Capital Investment
Risk/Exposure Next Five (5) Years Estimated at a Total of $33.9 Million (NPV) / $6.8 Million
Annually Total Annual Replacements (Operationally Critical/Failures) $13.3 Million $2.7 Million Renovations, Renewal, and Requests $20.6 Million $4.1 Million
Risk/Exposure Through 2028 Estimated at a Total of $137.5 Million (NPV) / $10.6 Million Annually
Total Annual Replacements (Operationally Critical/Failures) $51.0 Million $3.9 Million Renovations, Renewal, and Requests $83.5 Million $6.4 Million Site Conditions $3.0 Million $0.2 Million
Peak Years for Risk/Exposure Occur in 2017, 2022, and 2027
Note: Findings/Conclusions Provided by County
C. FINANCIAL ANALYSIS

Page 194
Facility Condition Assessment (Continued) Approaches
Annual Reinvestment Funding Targets (1.0%, 1.5%, 2.0%, 4.0%, Etc.)
Total Annual Maintain Current Condition $87.1 Million $6.7 Million Allow Condition to Decline to “Fair/Poor” $30.3 Million $2.3 Million
Allocate Less than 1% of Current Replacement Value (“Poor”) $19.2 Million $1.5 Million
Note: Findings/Conclusions Provided by County
The Consulting Team has Assumed Capital Expenditures for the Arena (and Parking) with No
NHL/NBA Tenant at $2.5 Million for Modeling Purposes – Figure can Fluctuate Significantly
C. FINANCIAL ANALYSIS

VI. ECONOMIC IMPACT ANALYSIS
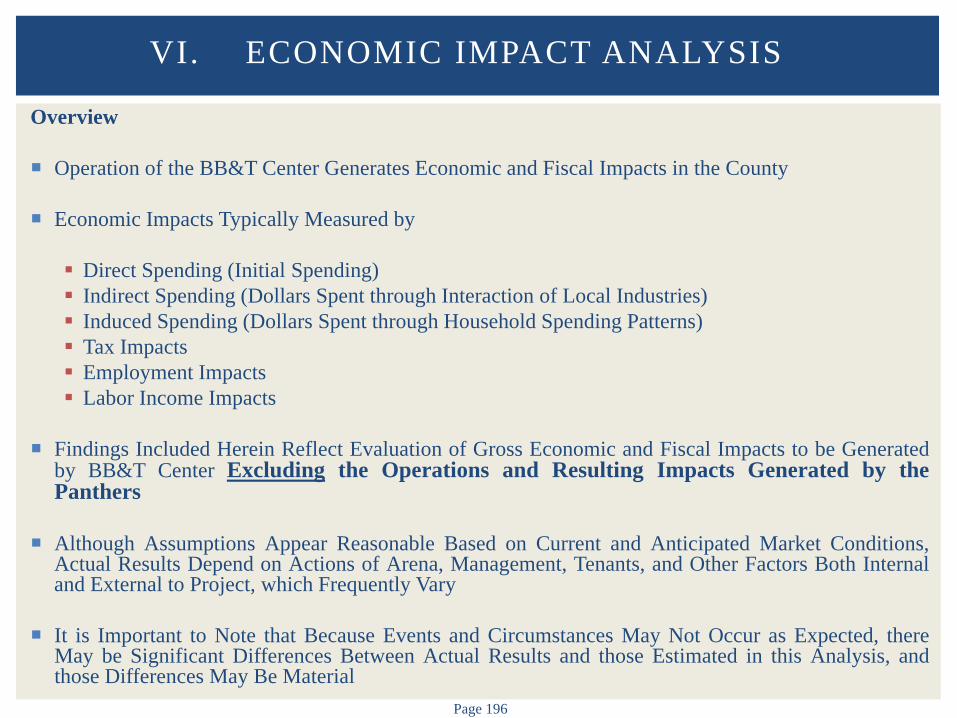
Page 196
Overview
Operation of the BB&T Center Generates Economic and Fiscal Impacts in the County
Economic Impacts Typically Measured by Direct Spending (Initial Spending) Indirect Spending (Dollars Spent through Interaction of Local Industries) Induced Spending (Dollars Spent through Household Spending Patterns) Tax Impacts Employment Impacts Labor Income Impacts
Findings Included Herein Reflect Evaluation of Gross Economic and Fiscal Impacts to be Generated
by BB&T Center Excluding the Operations and Resulting Impacts Generated by the Panthers
Although Assumptions Appear Reasonable Based on Current and Anticipated Market Conditions, Actual Results Depend on Actions of Arena, Management, Tenants, and Other Factors Both Internal and External to Project, which Frequently Vary
It is Important to Note that Because Events and Circumstances May Not Occur as Expected, there May be Significant Differences Between Actual Results and those Estimated in this Analysis, and those Differences May Be Material
VI. ECONOMIC IMPACT ANALYSIS
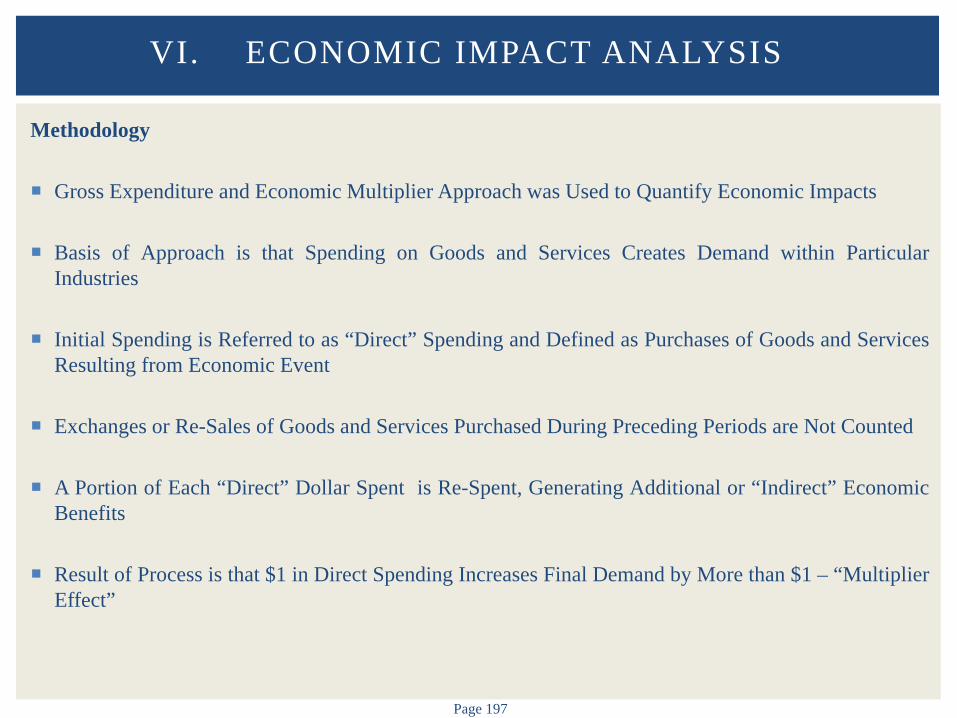
Page 197
Methodology
Gross Expenditure and Economic Multiplier Approach was Used to Quantify Economic Impacts
Basis of Approach is that Spending on Goods and Services Creates Demand within Particular Industries
Initial Spending is Referred to as “Direct” Spending and Defined as Purchases of Goods and Services Resulting from Economic Event
Exchanges or Re-Sales of Goods and Services Purchased During Preceding Periods are Not Counted
A Portion of Each “Direct” Dollar Spent is Re-Spent, Generating Additional or “Indirect” Economic Benefits
Result of Process is that $1 in Direct Spending Increases Final Demand by More than $1 – “Multiplier Effect”
VI. ECONOMIC IMPACT ANALYSIS
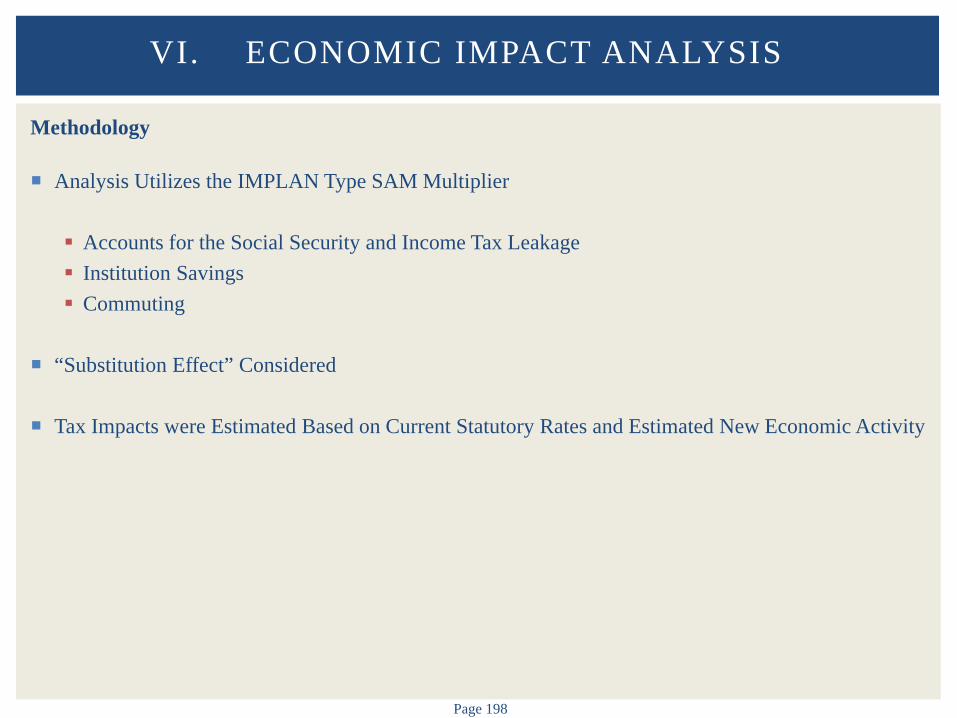
Page 198
Methodology
Analysis Utilizes the IMPLAN Type SAM Multiplier Accounts for the Social Security and Income Tax Leakage Institution Savings Commuting
“Substitution Effect” Considered
Tax Impacts were Estimated Based on Current Statutory Rates and Estimated New Economic Activity
VI. ECONOMIC IMPACT ANALYSIS
Page 199
Multiplier Effect
Introduction of New Money Into Economy Begins Cycle in Which Money is Re-Spent Several Times by Different Parties
Turnover of Each $1 is Projected through Use of Economic Multiplier Applied to Initial Expenditure
Multiplier Conveys that Additional Spending into a Finite Economy will Lead to Secondary Spending
Cycle Continues Until Initial $1 has Experienced Leakage Sufficient to End Its Economic Cycle Purchases Outside Region Taxes Paid Outside Region Individual Savings
Multiplier Illustrates a More Realistic Image of Economic System where Direct Consumption Leads
to Various Levels of Indirect Consumption
Employment Multipliers are Similar to Output Multipliers
Employment Multipliers Estimate Number of Jobs Created/Supported within Economic Region Based on Every $1.0 Million in Direct Spending
VI. ECONOMIC IMPACT ANALYSIS
Page 200
Estimated Multipliers
Regional Economic Impact Model Developed by the Minnesota IMPLAN Group (IMPLAN)
Economic Multipliers Estimate Impacts Associated with Gross Expenditures
Use of Multipliers Requires Identification of Each Industry or Economic Event
IMPLAN Combines National Averages for Industries and Production Functions with Data from the Federal Government, Including: U.S. Bureau of Labor Statistics U.S. Bureau of Economic Analysis U.S. Census Bureau U.S. Department of Agriculture Census
IMPLAN has Identified Approximately 536 Economic Sectors
IMPLAN Provides Two Different Types of Multipliers: Type I and Type SAM
Type SAM Multiplier is Utilized in Our Analysis Type SAM Multiplier = (Direct Effect + Indirect Effect + Induced Effect) / (Direct Effect)
VI. ECONOMIC IMPACT ANALYSIS

Page 201
Estimated Multipliers
Type SAM Multipliers Utilizes Social Accounting Matrix Information to Capture Inter-Institutional Transfers – Type SAM Multiplies Include the Impact of Household Spending
Type SAM Accounts for the Following Social Security Leakage Income Tax Leakage Institution Savings Commuting
Multipliers Utilized
VI. ECONOMIC IMPACT ANALYSIS
Output Multipliers
Employment Multipliers
Arena Operations 1.8298 1.4972Hotel Spending 1.6078 1.5762Restaurant and Bar Spending
Full-Service 1.6499 1.2787Limited Service 1.5361 1.2366Other Food and Drinking 1.5837 1.3998
Food and Beverage Store Spending 1.7072 1.3906Gasoline Station Spending 1.7511 1.5400Miscellaneous Retail Store Spending 1.8171 1.2918Car Rental Spending 1.5101 1.8187Other Transportation Spending 1.7475 1.4792Source: IMPLAN.

Page 202
Substitution Effect
Direct Spending Leads to Reduced Spending Within Other Sectors of Economy
Economic Event which Generates $1 of Economic Output Actually Generates Less than $1 in New Net Spending
Magnitude Varies Significantly Depending Upon Circumstances Demand Alternatives Expenditure Size Disposable Income Savings
Magnified when Demand is Relatively Fixed, Many Alternatives Available, and Expenditure is Large
VI. ECONOMIC IMPACT ANALYSIS
Page 203
Government Revenue Impacts
Tax Impacts are Based on the Existing Relationships of the Data Found in the IMPLAN Database
The Input/Output Model Developed Specifically for the County was Used to Estimate Tax Impacts – Model Incorporates Data from National Income and Product Accounts (Developed by U.S. Bureau of Economic Analysis), Consumer Expenditure Surveys, Annual Survey of State and Local Government Finances, and Regional Economic Accounts
It is Important to Note that Any Tax Collected at the Point of Sales (Sales, Hotel, Etc.) is Included in this Analysis, but are Not Separated by Individual Type of Tax
Taxes Include Sales Tax Tourist Development Tax Property Tax Motor Vehicle License Tax Other Miscellaneous Taxes and Non-Taxes (Fees/Fines)
We have Not Included Employment Taxes Such as Social Security Contributions and Personal Income Taxes
(Not Applicable in Florida), Nor have We Included Certain Taxes on Corporations Such as Corporate Profit Tax, Among Others
VI. ECONOMIC IMPACT ANALYSIS
Page 204
Major Study Efforts
Customized Input/Output Economic Model to Estimate Economic Output and Employment Multipliers
Estimated Direct Spending to be Generated in the Arena within the County. Key Operating Variables Include Attendance/Event Mix Average Ticket Price Parking Rates Premium Seat Pricing Advertising Revenue Per Capita Spending on Concessions Per Capita Spending on Novelties
VI. ECONOMIC IMPACT ANALYSIS

Page 205
Major Study Efforts
Conducted Fan Patron Surveys (509 Completed) at Two Events to Understand Out-of-Facility Spending by Non-Residents A Night of Hope with Joel Osteen (February 6, 2015) – 286 Surveys Completed Bob Seger and the Silver Bullet Band (February 7, 2015) – 223 Surveys Complete
Non-Resident Spending Behavior was Evaluated
Hotels Restaurants/Bars Gasoline Stations Grocery Stores Convenience Stores Other Retail Establishments Car Rental Other Transportation
VI. ECONOMIC IMPACT ANALYSIS

Page 206
Annual Economic Impact
Ongoing Operations of the BB&T Center General Annual, Recurring Economic and Fiscal Impacts as Events are Held in the Market In-Arena Spending Out-of-Arena Visitor Spending
In Order to Arrive at New Spending in the County, We First Started with an Evaluation of the Estimated
Gross Revenues from In-Arena and Out-of-Arena Spending
The Consulting Team Evaluated Paid Attendance Figures Provided by the SS&E as a Proxy for Resident/Non-Resident Spending Within the County – Point-of-Origin of Ticket Purchases as a Proxy for Total Visitor Percentages Used in the Visitor Spending Estimates
Based on 2014 Data, Approximately 39% of All Ticket Purchases were Made by Residents of Broward County, Resulting in 61% of All Ticket Purchases being Made by Visitors to the County – It Should be Noted that the Analysis Excludes Ticket Purchases Made by Cash Buyers or Other Buyers who Did Not Provide a Zip Code (However, Nearly 98% of All Tickets were Allocated to a Zip Code)
Percentages are Important as We Made Adjustments to In-Arena Spending Based On the Number of Visitors to the County – Residents were Not Included to Estimate In-Arena Spending
VI. ECONOMIC IMPACT ANALYSIS
Page 207
Annual Economic Impact
Visitor Expenditures Made Outside of the Arena were Further Adjusted Based on the Significance of the Attended Event on Their Purchasing Behavior – “Significant” Impacts had the Highest Value, and in Contrast, Impacts of “Little” or “None” had the Lowest Impact
For Example, if a Visitor Indicated that the Bob Seger Concert “Significantly” Influenced Their Decision to Eat at a Restaurant Prior to the Show, Such Spending was Included in the Economic Impact Model – However, if that Same Visitor had Indicated that Their Decision to Eat a Restaurant Prior to the Show was Not Influenced by Show, Such Spending was Not Included in the Economic Impact Model
VI. ECONOMIC IMPACT ANALYSIS
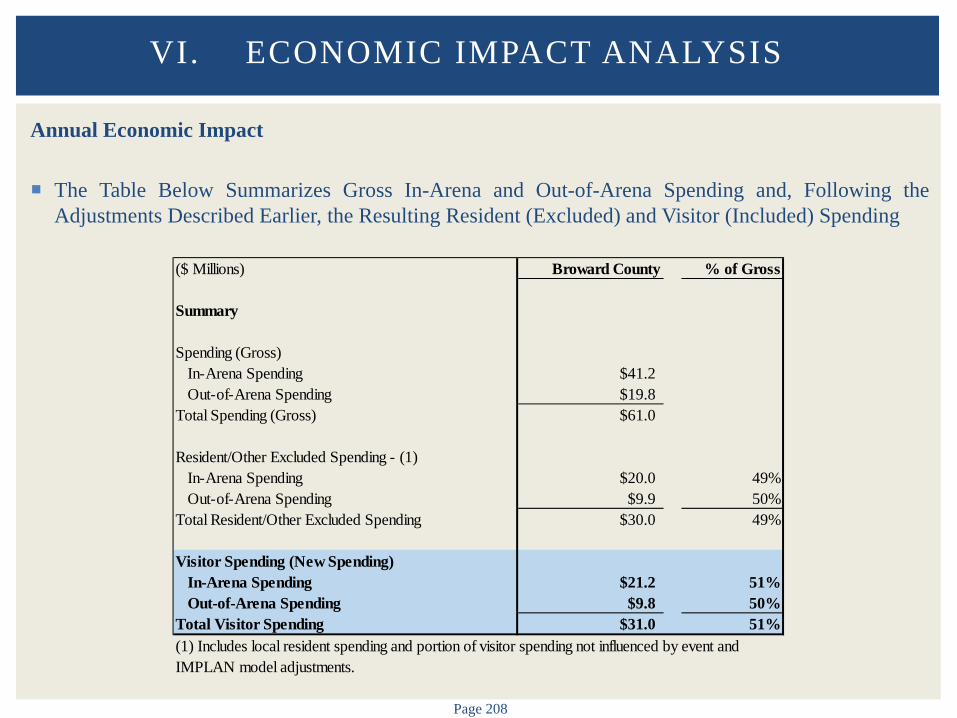
Page 208
Annual Economic Impact
The Table Below Summarizes Gross In-Arena and Out-of-Arena Spending and, Following the Adjustments Described Earlier, the Resulting Resident (Excluded) and Visitor (Included) Spending
VI. ECONOMIC IMPACT ANALYSIS
($ Millions) Broward County % of Gross
Summary
Spending (Gross)In-Arena Spending $41.2Out-of-Arena Spending $19.8
Total Spending (Gross) $61.0
Resident/Other Excluded Spending - (1)In-Arena Spending $20.0 49%Out-of-Arena Spending $9.9 50%
Total Resident/Other Excluded Spending $30.0 49%
Visitor Spending (New Spending)In-Arena Spending $21.2 51%Out-of-Arena Spending $9.8 50%
Total Visitor Spending $31.0 51%(1) Includes local resident spending and portion of visitor spending not influenced by event and IMPLAN model adjustments.

Page 209
Annual Economic Impact
Please See Below for a Graphical Representation of the How Gross Spending is Adjusted in the Analysis
Approximately 49% of Gross Spending has been Excluded from the Analysis
VI. ECONOMIC IMPACT ANALYSIS
Gross Spending
• 100% In-Arena and Out-of-Arena Spending
Local Spending
• 49% Broward County Resident/Other Excluded Spending
New Spending
• 51% New Broward County Spending by Visitor

Page 210
Flow Chart
The Following Figure Presents a More General Flow Chart of the Economic Impacts Resulting from the Operations of the BB&T Center
VI. ECONOMIC IMPACT ANALYSIS
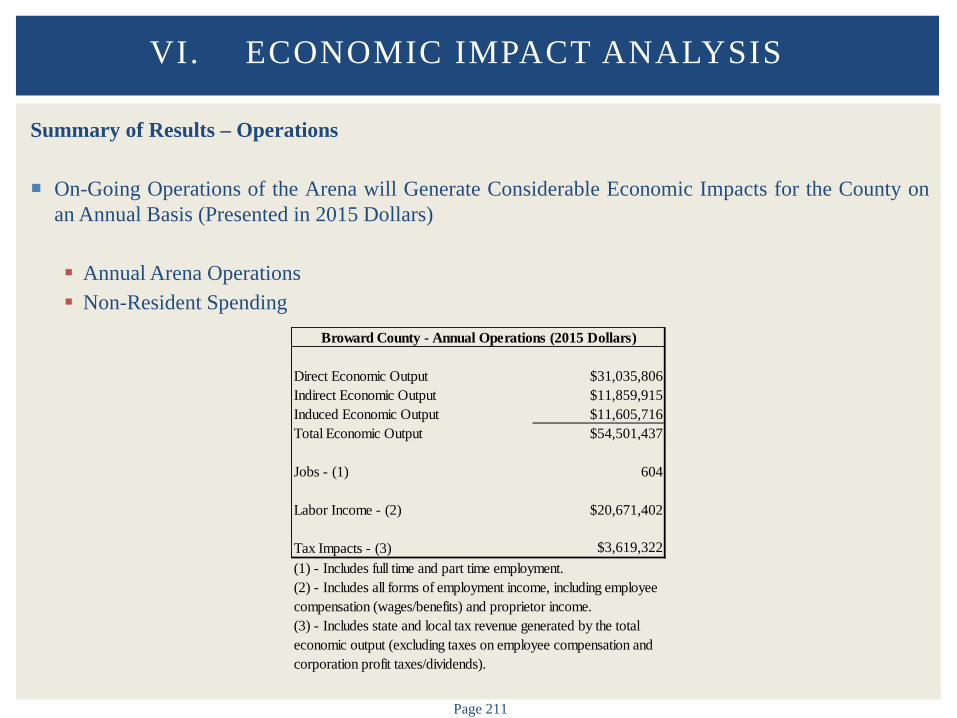
Page 211
Summary of Results – Operations
On-Going Operations of the Arena will Generate Considerable Economic Impacts for the County on an Annual Basis (Presented in 2015 Dollars)
Annual Arena Operations Non-Resident Spending
VI. ECONOMIC IMPACT ANALYSIS
Direct Economic Output $31,035,806Indirect Economic Output $11,859,915Induced Economic Output $11,605,716Total Economic Output $54,501,437
Jobs - (1) 604
Labor Income - (2) $20,671,402
Tax Impacts - (3) $3,619,322 (1) - Includes full time and part time employment.(2) - Includes all forms of employment income, including employee compensation (wages/benefits) and proprietor income.(3) - Includes state and local tax revenue generated by the total economic output (excluding taxes on employee compensation and corporation profit taxes/dividends).
Broward County - Annual Operations (2015 Dollars)
Page 212
Intangible Benefits
BB&T Center Generates Other Significant Impacts for the County that are Less Explicit and More Difficult to Quantify Catalyst for Economic Development (Attract/Retain Businesses) Ancillary Redevelopment Opportunities National (and Potentially International) Exposure Civic/Community Pride and Identity Prestige Associated with Facility/Teams/Events Improved Quality of Life/Additional Entertainment Alternatives Contributions and Donations to Local Charities/Causes Marketing/Advertising Opportunities for Local (and National) Businesses Other
Intangible Benefits Described Above are Materially Reduced Without a “Major” League Professional
Sports Team
VI. ECONOMIC IMPACT ANALYSIS

VII. POTENTIAL FUNDING OPTIONS
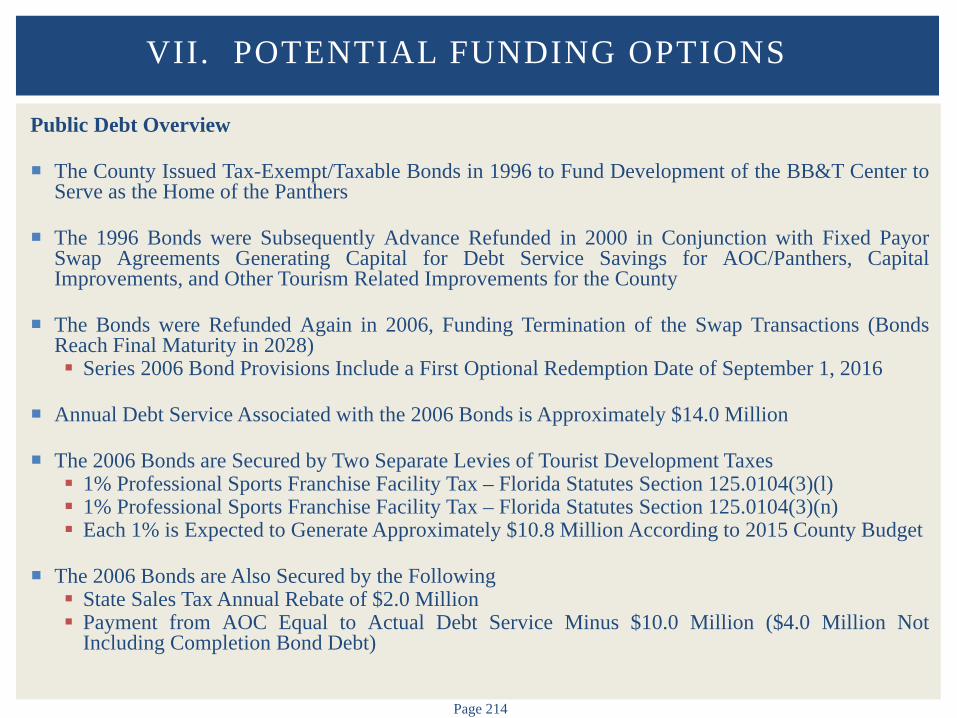
Page 214
Public Debt Overview The County Issued Tax-Exempt/Taxable Bonds in 1996 to Fund Development of the BB&T Center to
Serve as the Home of the Panthers
The 1996 Bonds were Subsequently Advance Refunded in 2000 in Conjunction with Fixed Payor Swap Agreements Generating Capital for Debt Service Savings for AOC/Panthers, Capital Improvements, and Other Tourism Related Improvements for the County
The Bonds were Refunded Again in 2006, Funding Termination of the Swap Transactions (Bonds Reach Final Maturity in 2028) Series 2006 Bond Provisions Include a First Optional Redemption Date of September 1, 2016
Annual Debt Service Associated with the 2006 Bonds is Approximately $14.0 Million The 2006 Bonds are Secured by Two Separate Levies of Tourist Development Taxes 1% Professional Sports Franchise Facility Tax – Florida Statutes Section 125.0104(3)(l) 1% Professional Sports Franchise Facility Tax – Florida Statutes Section 125.0104(3)(n) Each 1% is Expected to Generate Approximately $10.8 Million According to 2015 County Budget
The 2006 Bonds are Also Secured by the Following State Sales Tax Annual Rebate of $2.0 Million Payment from AOC Equal to Actual Debt Service Minus $10.0 Million ($4.0 Million Not
Including Completion Bond Debt)
VII. POTENTIAL FUNDING OPTIONS

Page 215
Public Debt Overview County Enhances the Credit of the 2006 Bonds with its Covenant to Budget and Appropriate in its
Annual Budget, by Amendment, if Necessary, from Non-Ad Valorem Revenues, Amounts Sufficient to Satisfy the Deposit Requirements for the Bond Reserve Fund which Cannot be Satisfied from Moneys on Deposit in the Revenue Fund or the Surplus Fund, Each Created Under the Indenture
County Issued Completion Bonds in 2000 – Refinanced in 2005 (Bonds Reach Final Maturity in
2028) AOC Pays the Annual Debt Service of Approximately $620,000
Combined Annual Debt Service (Approximately) $14.6 Million
Combined Annual Debt Service is Funded by the Following Sources Tourist Development Taxes $8.0 Million State Sales Tax Rebate $2.0 Million AOC (Approximately) $4.6 Million
VII. POTENTIAL FUNDING OPTIONS
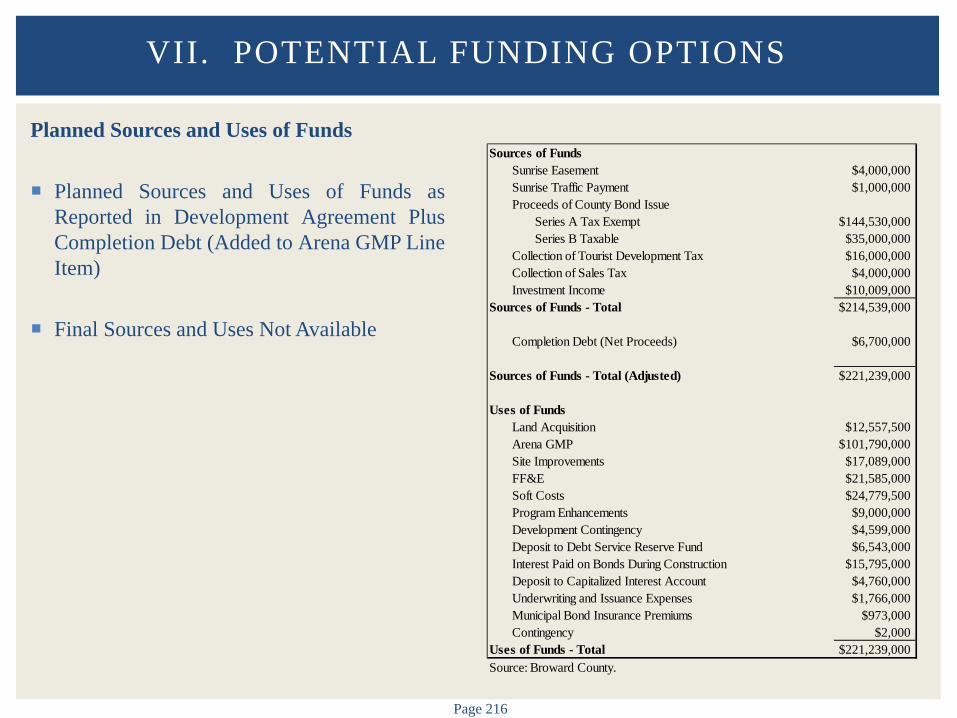
Page 216
Planned Sources and Uses of Funds
Planned Sources and Uses of Funds as Reported in Development Agreement Plus Completion Debt (Added to Arena GMP Line Item)
Final Sources and Uses Not Available
VII. POTENTIAL FUNDING OPTIONS
Sources of FundsSunrise Easement $4,000,000Sunrise Traffic Payment $1,000,000Proceeds of County Bond Issue
Series A Tax Exempt $144,530,000Series B Taxable $35,000,000
Collection of Tourist Development Tax $16,000,000Collection of Sales Tax $4,000,000Investment Income $10,009,000
Sources of Funds - Total $214,539,000
Completion Debt (Net Proceeds) $6,700,000
Sources of Funds - Total (Adjusted) $221,239,000
Uses of FundsLand Acquisition $12,557,500Arena GMP $101,790,000Site Improvements $17,089,000FF&E $21,585,000Soft Costs $24,779,500Program Enhancements $9,000,000Development Contingency $4,599,000Deposit to Debt Service Reserve Fund $6,543,000Interest Paid on Bonds During Construction $15,795,000Deposit to Capitalized Interest Account $4,760,000Underwriting and Issuance Expenses $1,766,000Municipal Bond Insurance Premiums $973,000Contingency $2,000
Uses of Funds - Total $221,239,000Source: Broward County.
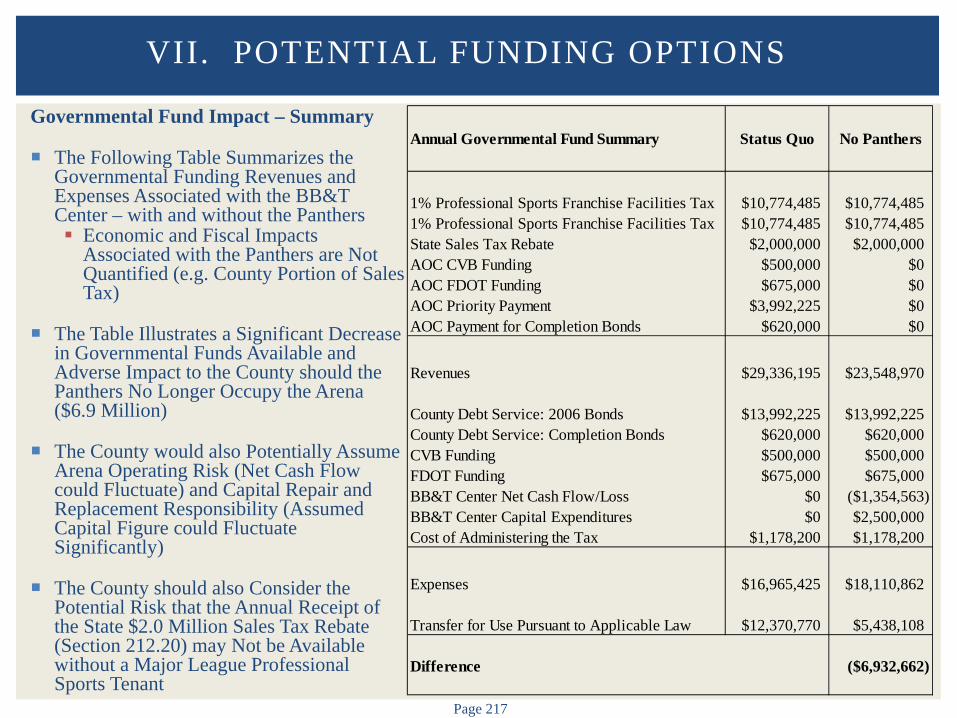
Page 217
Governmental Fund Impact – Summary
The Following Table Summarizes the Governmental Funding Revenues and Expenses Associated with the BB&T Center – with and without the Panthers Economic and Fiscal Impacts
Associated with the Panthers are Not Quantified (e.g. County Portion of Sales Tax)
The Table Illustrates a Significant Decrease in Governmental Funds Available and Adverse Impact to the County should the Panthers No Longer Occupy the Arena ($6.9 Million)
The County would also Potentially Assume Arena Operating Risk (Net Cash Flow could Fluctuate) and Capital Repair and Replacement Responsibility (Assumed Capital Figure could Fluctuate Significantly)
The County should also Consider the Potential Risk that the Annual Receipt of the State $2.0 Million Sales Tax Rebate (Section 212.20) may Not be Available without a Major League Professional Sports Tenant
VII. POTENTIAL FUNDING OPTIONS
Annual Governmental Fund Summary Status Quo No Panthers
1% Professional Sports Franchise Facilities Tax $10,774,485 $10,774,4851% Professional Sports Franchise Facilities Tax $10,774,485 $10,774,485State Sales Tax Rebate $2,000,000 $2,000,000AOC CVB Funding $500,000 $0AOC FDOT Funding $675,000 $0AOC Priority Payment $3,992,225 $0AOC Payment for Completion Bonds $620,000 $0
Revenues $29,336,195 $23,548,970
County Debt Service: 2006 Bonds $13,992,225 $13,992,225County Debt Service: Completion Bonds $620,000 $620,000CVB Funding $500,000 $500,000FDOT Funding $675,000 $675,000BB&T Center Net Cash Flow/Loss $0 ($1,354,563)BB&T Center Capital Expenditures $0 $2,500,000Cost of Administering the Tax $1,178,200 $1,178,200
Expenses $16,965,425 $18,110,862
Transfer for Use Pursuant to Applicable Law $12,370,770 $5,438,108
Difference ($6,932,662)
Page 218
Governmental Fund Impact – Additional Considerations
The County Collects the Above Revenues in the General Fund, Appropriates Amounts Sufficient to Pay Debt Service on the 2006 Bonds and the Completion Bonds, and Transfers Back to the General Fund Amounts Not Needed for Debt Service to Fund Tourism Related Activities as Set Forth in the Florida Statutes Related to the Professional Sports Franchise Facilities Tax and the Additional Tax
If the Panthers were to No Longer Occupy the Arena, the County Preferred Revenue Allocation Payment (CPRA) from AOC Would No Longer be Available (Approximately $4.0 Million Dedicated to 2006 Bonds and $0.6 Million Dedicated to the Completion Bonds). In Addition, AOC’s Payment to the TDC Would No Longer Be Available ($0.5 Million).
The County Would Also Potentially Assume Arena Operating Risk (Net Cash Flow Could Fluctuate)
and Capital Repair and Replacement Responsibility (Assumed Capital Expenditure Figure Could Fluctuate Significantly)
The County Should Consider the Potential Risk that the Annual Receipt of the State $2.0 Million Sales Tax Rebate (Section 212.20), May Not be Available in the Future Without a Major League Professional Sports Tenant
VII. POTENTIAL FUNDING OPTIONS
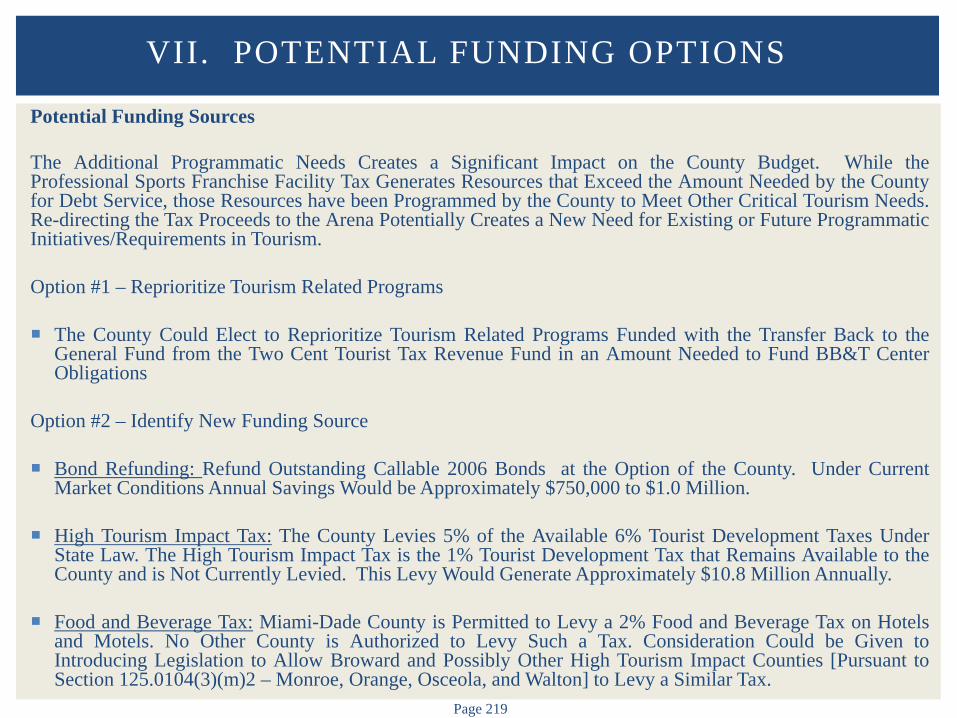
Page 219
Potential Funding Sources
The Additional Programmatic Needs Creates a Significant Impact on the County Budget. While the Professional Sports Franchise Facility Tax Generates Resources that Exceed the Amount Needed by the County for Debt Service, those Resources have been Programmed by the County to Meet Other Critical Tourism Needs. Re-directing the Tax Proceeds to the Arena Potentially Creates a New Need for Existing or Future Programmatic Initiatives/Requirements in Tourism. Option #1 – Reprioritize Tourism Related Programs The County Could Elect to Reprioritize Tourism Related Programs Funded with the Transfer Back to the
General Fund from the Two Cent Tourist Tax Revenue Fund in an Amount Needed to Fund BB&T Center Obligations
Option #2 – Identify New Funding Source
Bond Refunding: Refund Outstanding Callable 2006 Bonds at the Option of the County. Under Current Market Conditions Annual Savings Would be Approximately $750,000 to $1.0 Million.
High Tourism Impact Tax: The County Levies 5% of the Available 6% Tourist Development Taxes Under
State Law. The High Tourism Impact Tax is the 1% Tourist Development Tax that Remains Available to the County and is Not Currently Levied. This Levy Would Generate Approximately $10.8 Million Annually.
Food and Beverage Tax: Miami-Dade County is Permitted to Levy a 2% Food and Beverage Tax on Hotels
and Motels. No Other County is Authorized to Levy Such a Tax. Consideration Could be Given to Introducing Legislation to Allow Broward and Possibly Other High Tourism Impact Counties [Pursuant to Section 125.0104(3)(m)2 – Monroe, Orange, Osceola, and Walton] to Levy a Similar Tax.
VII. POTENTIAL FUNDING OPTIONS
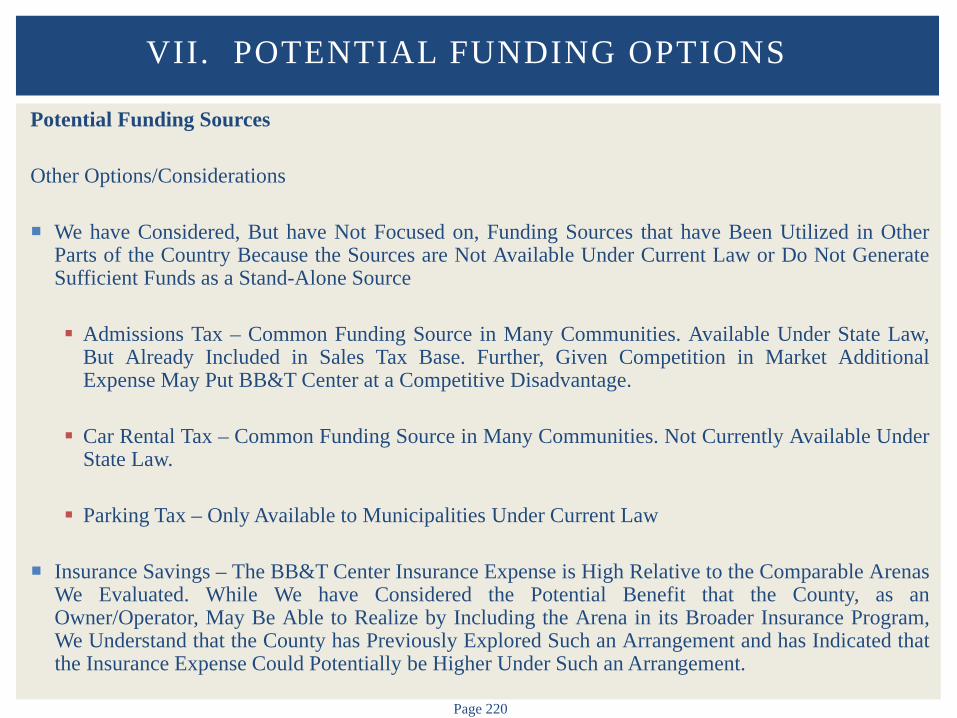
Page 220
Potential Funding Sources
Other Options/Considerations We have Considered, But have Not Focused on, Funding Sources that have Been Utilized in Other
Parts of the Country Because the Sources are Not Available Under Current Law or Do Not Generate Sufficient Funds as a Stand-Alone Source Admissions Tax – Common Funding Source in Many Communities. Available Under State Law,
But Already Included in Sales Tax Base. Further, Given Competition in Market Additional Expense May Put BB&T Center at a Competitive Disadvantage.
Car Rental Tax – Common Funding Source in Many Communities. Not Currently Available Under State Law.
Parking Tax – Only Available to Municipalities Under Current Law
Insurance Savings – The BB&T Center Insurance Expense is High Relative to the Comparable Arenas We Evaluated. While We have Considered the Potential Benefit that the County, as an Owner/Operator, May Be Able to Realize by Including the Arena in its Broader Insurance Program, We Understand that the County has Previously Explored Such an Arrangement and has Indicated that the Insurance Expense Could Potentially be Higher Under Such an Arrangement.
VII. POTENTIAL FUNDING OPTIONS
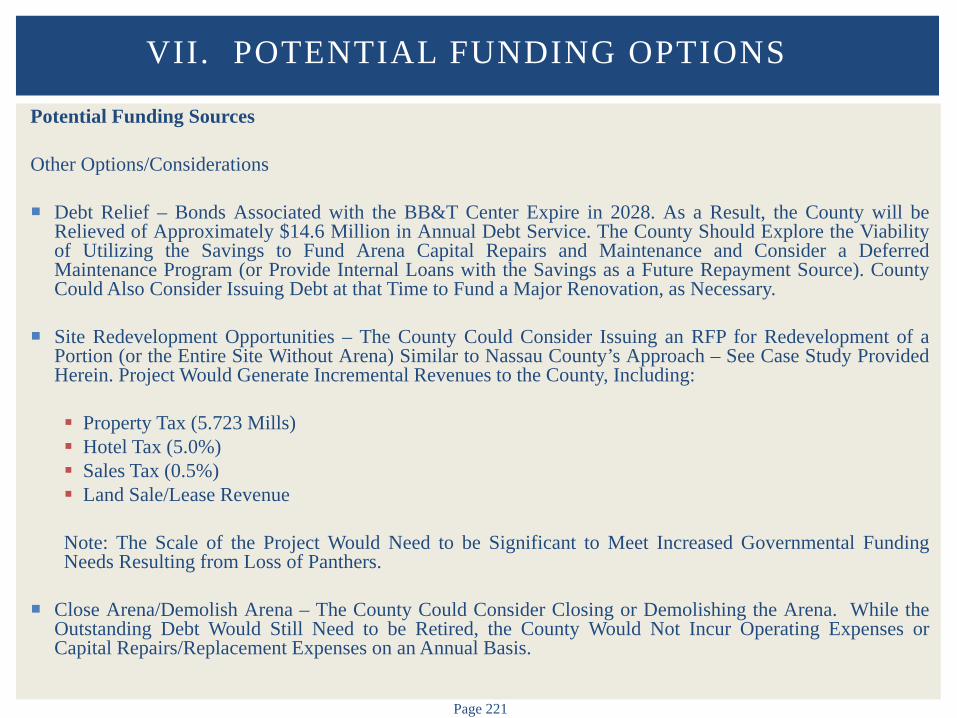
Page 221
Potential Funding Sources
Other Options/Considerations Debt Relief – Bonds Associated with the BB&T Center Expire in 2028. As a Result, the County will be
Relieved of Approximately $14.6 Million in Annual Debt Service. The County Should Explore the Viability of Utilizing the Savings to Fund Arena Capital Repairs and Maintenance and Consider a Deferred Maintenance Program (or Provide Internal Loans with the Savings as a Future Repayment Source). County Could Also Consider Issuing Debt at that Time to Fund a Major Renovation, as Necessary.
Site Redevelopment Opportunities – The County Could Consider Issuing an RFP for Redevelopment of a Portion (or the Entire Site Without Arena) Similar to Nassau County’s Approach – See Case Study Provided Herein. Project Would Generate Incremental Revenues to the County, Including:
Property Tax (5.723 Mills) Hotel Tax (5.0%) Sales Tax (0.5%) Land Sale/Lease Revenue
Note: The Scale of the Project Would Need to be Significant to Meet Increased Governmental Funding Needs Resulting from Loss of Panthers.
Close Arena/Demolish Arena – The County Could Consider Closing or Demolishing the Arena. While the
Outstanding Debt Would Still Need to be Retired, the County Would Not Incur Operating Expenses or Capital Repairs/Replacement Expenses on an Annual Basis.
VII. POTENTIAL FUNDING OPTIONS

VIII. OTHER CONSIDERATIONS

A. MANAGEMENT OPTIONS
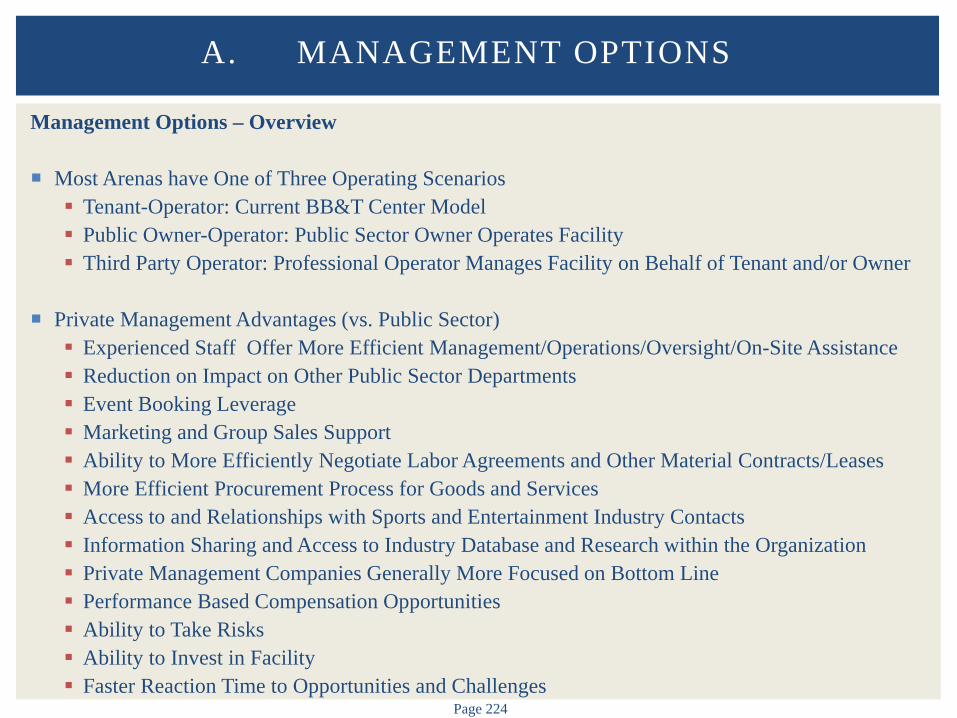
Page 224
Management Options – Overview Most Arenas have One of Three Operating Scenarios Tenant-Operator: Current BB&T Center Model Public Owner-Operator: Public Sector Owner Operates Facility Third Party Operator: Professional Operator Manages Facility on Behalf of Tenant and/or Owner
Private Management Advantages (vs. Public Sector) Experienced Staff Offer More Efficient Management/Operations/Oversight/On-Site Assistance Reduction on Impact on Other Public Sector Departments Event Booking Leverage Marketing and Group Sales Support Ability to More Efficiently Negotiate Labor Agreements and Other Material Contracts/Leases More Efficient Procurement Process for Goods and Services Access to and Relationships with Sports and Entertainment Industry Contacts Information Sharing and Access to Industry Database and Research within the Organization Private Management Companies Generally More Focused on Bottom Line Performance Based Compensation Opportunities Ability to Take Risks Ability to Invest in Facility Faster Reaction Time to Opportunities and Challenges
A. MANAGEMENT OPTIONS
Page 225
Management Options – Overview Private Management Disadvantages (vs. Public Sector) Management Fee Expense Lack of Control Misaligned Interests/Goals of Owner and Management Company Public Interests vs Management Fee Public Interests vs Bottom Line Cost Cutting to Achieve Additional Management Fees Short Term at Expense of Facility
Operations and Possible Long Term Implications Structure of Management Contract Accountability Benchmarks Incentives Tax-Exempt Limitations
General Manager Turnover as a Result of Relocation to Other Company Facilities Regional/Market Competition of Company Accounts
Key Issue will be BB&T Center Event Booking Arrangements
A. MANAGEMENT OPTIONS
Page 226
Management Interview Summary The Consulting Team Attempted to Contact the Three Major National Arena Management Firms AEG Global Spectrum (as of June 2015, Global Spectrum is now known as Spectra) SMG
The Consulting Team Spoke with Two Major National Operators of Arenas, Both with a Cursory Knowledge
of the BB&T Center, and a Strong Knowledge of the Regional Market
Both Operators Expressed an Interest in Operating the Arena Should the Opportunity Arise and Under the Right Circumstances – We Would Expect All Three Would Ultimately be Interested
Both Operators Acknowledged Miami Regional Market is Very Competitive BB&T Center Should be Able to Generate an Operating Profit Even Without the Panthers Managing and Keeping Fixed Costs Low will be Key Driver of Profitability
A Willingness to Explore Non-Traditional Operator/Owner Arrangements
One Operator Commented that Given the NHL Track Record in the Market and the Multitude of Live Sports Options in the Market, a Minor League Hockey Tenant May Face Significant Challenges
One Operator Suggested that it May Be Difficult to Improve Financial Results Materially if Third Party Management Firm were to Simply Replace AOC (Notwithstanding the Operator’s Desire to Operate the Arena Regardless) and Manage the Arena with the Panthers as a Tenant
A. MANAGEMENT OPTIONS

Page 227
Management Firm Overviews AEG One of the Leading Sports and Entertainment Operators/Presenters in the World Manages Facilities and Promotes Events
AEG Owns or Operates Over 100 Facilities Worldwide Including Staples Center/L.A. LIVE The O2
Owns Several Sports Franchises/Events Los Angeles Kings (NHL) Los Angeles Galaxy and Houston Dynamo (MLS) Los Angeles Lakers (NBA) (Partial Ownership) Amgen Tour of California
AEG Owns AEG Live World’s Second Largest Presenter of Music and Entertainment Events
AEG Provides Certain Management Services to AmericanAirlines Center
A. MANAGEMENT OPTIONS

Page 228
Management Firm Overviews Global Spectrum (Spectra) Subsidiary of Comcast-Spectacor, Global Spectrum is One of the Leaders in Venue Management Nationwide
(Expanding International Presence)
Global Spectrum Manages 123 Facilities – Various Types of Facilities Stadiums/Ballparks Arenas Convention/Exhibition Centers Theatres/Performing Arts Ice Facilities Fairgrounds Amphitheaters Entertainment and Retail Districts
Services Include Administrative & Financial Event Booking & Management Scheduling Sales, Marketing, & Public Relations Operations Engineering Ticketing
A. MANAGEMENT OPTIONS

Page 229
Management Firm Overviews SMG One of the Leaders in Venue Management, SMG Manages Over 220 Facilities Worldwide 67 Arenas 11 Stadiums 70 Convention Centers 61 Performing Arts Centers/Amphitheaters Many Other Types of Facilities
Services Include Accounting & Finance Purchasing & Event Booking Customer Service Training Programs Event Marketing & Management Media & Public Relations Suites & Premium Seating Food & Beverage Programs Risk Management
SMG Manages the Broward Convention Center
A. MANAGEMENT OPTIONS

B. ALTERNATIVE USE CASE STUDIES

Page 231
Alternative Use Case Studies – Overview Several Arenas that Served as Home of an NHL/NBA Team have been Repurposed – Not Common
Retail Focus (Proximity to the Sawgrass Retail Center Provides a Potential Opportunity) Limited Examples of Similar Conversions Maple Leaf Gardens (Toronto) Memphis Pyramid (Memphis)
Megachurches There Have Been a Few Instances of Arenas Repurposed into "Megachurches" Owned and
Operated by Private, Non-Profit Religious Organizations Compaq Center (Houston) The Forum (Los Angeles – Subsequently Repurposed)
Repurposed Facilities Have Generally Been Older Arenas, with Simple Seating Bowls and
Significantly Lower Square Footages than BB&T Center
Master Planned Site Redevelopment Nassau Coliseum (Potential Opportunity for BB&T Center Given Competitive Nature of Market) Nassau County Issued an RFP for Redevelopment of Coliseum and Site Several Responses Given Competitive Nature of Market (See Following Page)
B. ALTERNATIVE USE CASE STUDIES
Page 232
Alternative Use Case Studies – Overview
Forest City Ratner (Barclays Center) Onexim Sports and Entertainment Holding USA, Inc. Live Nation Roc Nation Legends Guggenheim Partners SHoP Architects Gensler Hunt Construction Goldman Sachs
Madison Square Garden RXR Cordish BBB Architects Jones Lang LaSalle
Blumenfeld SMG Mark Rosentraub
Shereck Global Spectrum Jack Gordon Architects
B. ALTERNATIVE USE CASE STUDIES
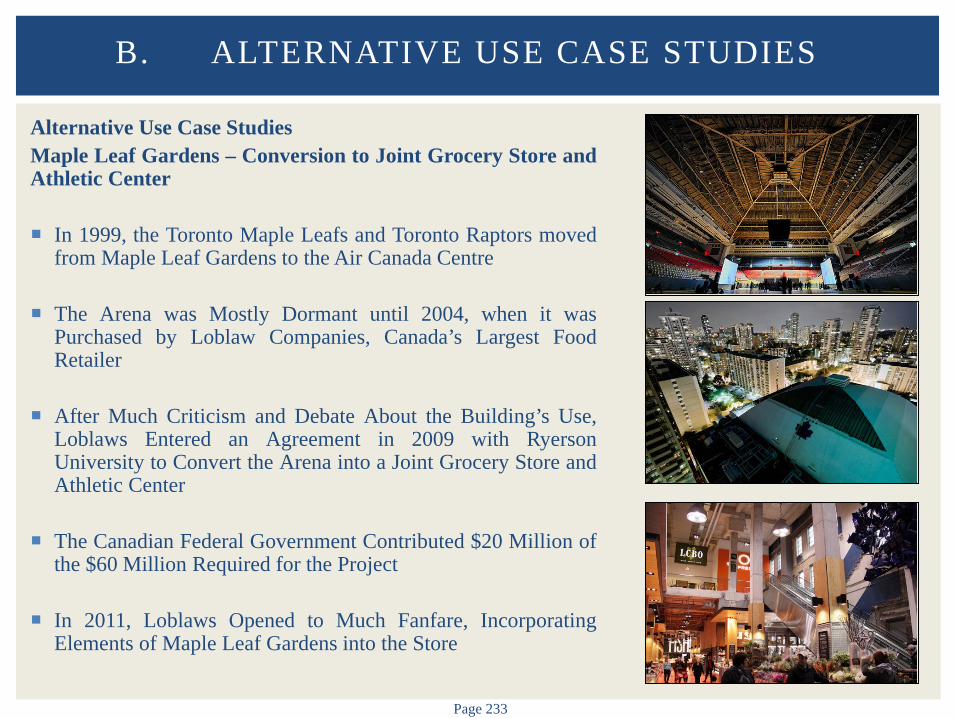
Page 233
Alternative Use Case Studies Maple Leaf Gardens – Conversion to Joint Grocery Store and Athletic Center In 1999, the Toronto Maple Leafs and Toronto Raptors moved
from Maple Leaf Gardens to the Air Canada Centre
The Arena was Mostly Dormant until 2004, when it was Purchased by Loblaw Companies, Canada’s Largest Food Retailer
After Much Criticism and Debate About the Building’s Use, Loblaws Entered an Agreement in 2009 with Ryerson University to Convert the Arena into a Joint Grocery Store and Athletic Center
The Canadian Federal Government Contributed $20 Million of the $60 Million Required for the Project
In 2011, Loblaws Opened to Much Fanfare, Incorporating Elements of Maple Leaf Gardens into the Store
B. ALTERNATIVE USE CASE STUDIES
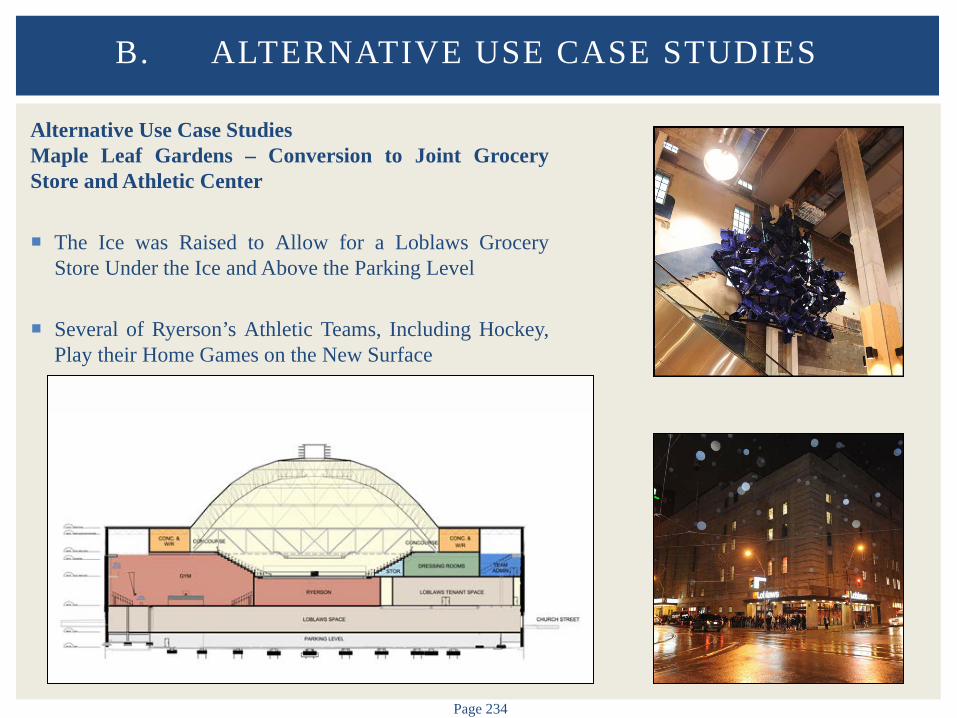
Page 234
Alternative Use Case Studies Maple Leaf Gardens – Conversion to Joint Grocery Store and Athletic Center The Ice was Raised to Allow for a Loblaws Grocery
Store Under the Ice and Above the Parking Level
Several of Ryerson’s Athletic Teams, Including Hockey, Play their Home Games on the New Surface
B. ALTERNATIVE USE CASE STUDIES
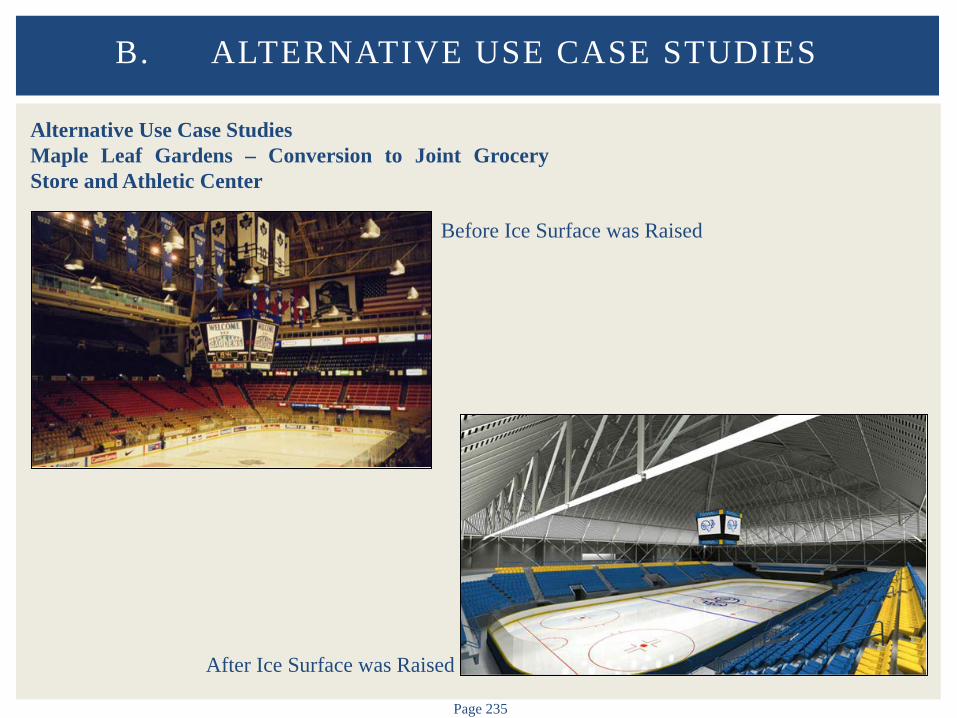
Page 235
Alternative Use Case Studies Maple Leaf Gardens – Conversion to Joint Grocery Store and Athletic Center
B. ALTERNATIVE USE CASE STUDIES
After Ice Surface was Raised
Before Ice Surface was Raised
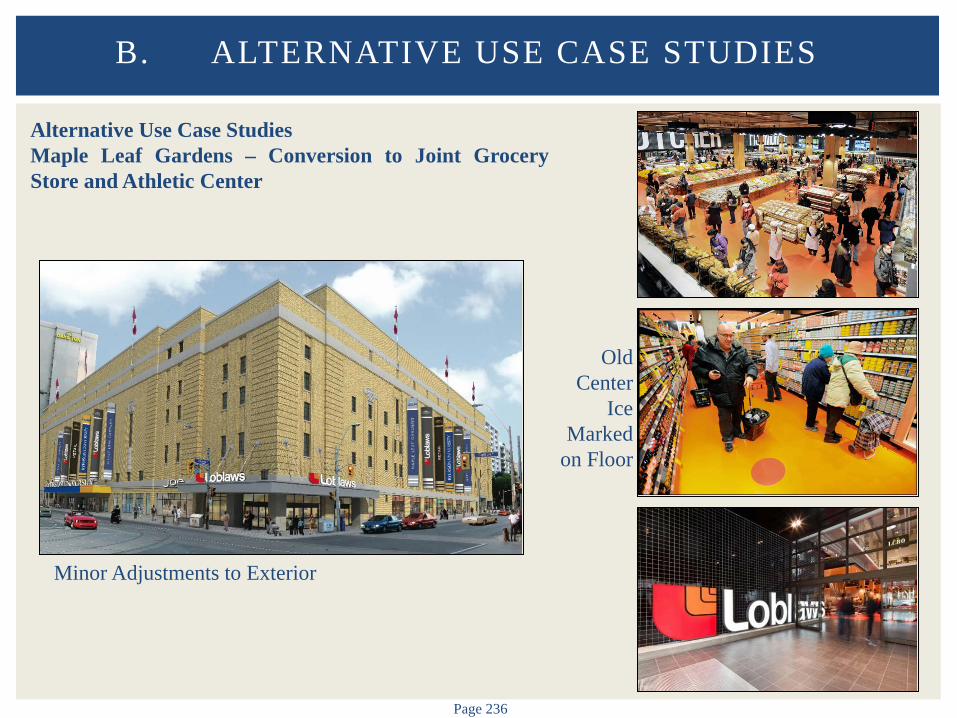
Page 236
Alternative Use Case Studies Maple Leaf Gardens – Conversion to Joint Grocery Store and Athletic Center
B. ALTERNATIVE USE CASE STUDIES
Minor Adjustments to Exterior
Old Center
Ice Marked
on Floor

Page 237
Alternative Use Case Studies Memphis Pyramid – Conversion to Bass Pro Shops In 2004, the NBA Memphis Grizzlies and NCAA Memphis
Tigers Moved from the Memphis Pyramid to FedEx Forum
The Pyramid was Underutilized Until 2010, when Bass Pro Signed a Lease to Reinvent the Building as a Bass Pro Shops Outdoor World
Features of the Building will Include an Underwater Themed Bowling Alley, an Aquarium, a Restaurant, Zip Lines, a Shooting Range, an Arena for Demonstrations and Workshops, Cabins to Serve as Hotel Rooms, and an Indoor Swamp
In 2011, the City Council Approved a Plan to Issue $215 Million in Bonds to Help Fund the Project, which will be Paid Back through the Projected Increased Sales Tax Revenue
B. ALTERNATIVE USE CASE STUDIES
Page 238
Alternative Use Case Studies Memphis Pyramid – Conversion to Bass Pro Shops Interior Work, Estimated to Cost $191 Million, Began in June 2012
Estimated Square Feet: 220,000
Term: 20 Years Plus Seven Five-Year Options that Could Take the Term to 55 Years
Bass Pro was Forced to Rethink Various Elements of the Plan Several Times Due to Structural or
City-Imposed Constraints The Original Plan to Attach a Hotel Could Not be Done Safely Due to Structural Constraints Instead, Bass Pro will Offer Cabins Inside the Pyramid
A Controversial Topic was the Large Scale Signage on the Exterior of the Building, which Initially Encountered Resistance from City Officials The Signage was Eventually Approved
Bass Pro Hoped to Open before the Holiday Season in 2013, but after Delays Opened April 29, 2015
B. ALTERNATIVE USE CASE STUDIES
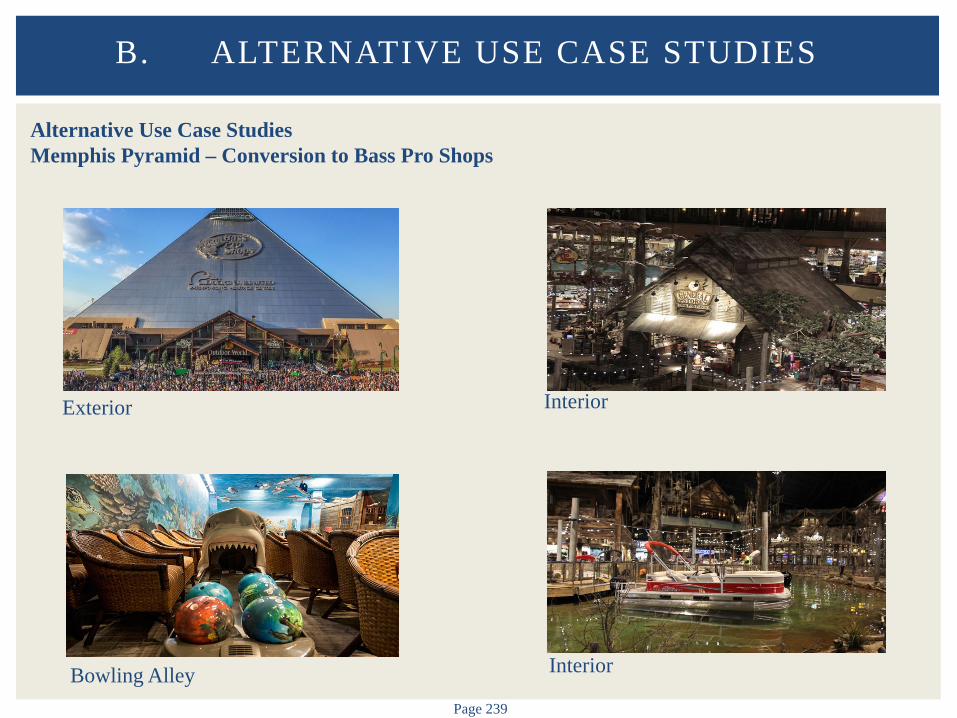
Page 239
Alternative Use Case Studies Memphis Pyramid – Conversion to Bass Pro Shops
B. ALTERNATIVE USE CASE STUDIES
Exterior
Interior
Bowling Alley
Interior
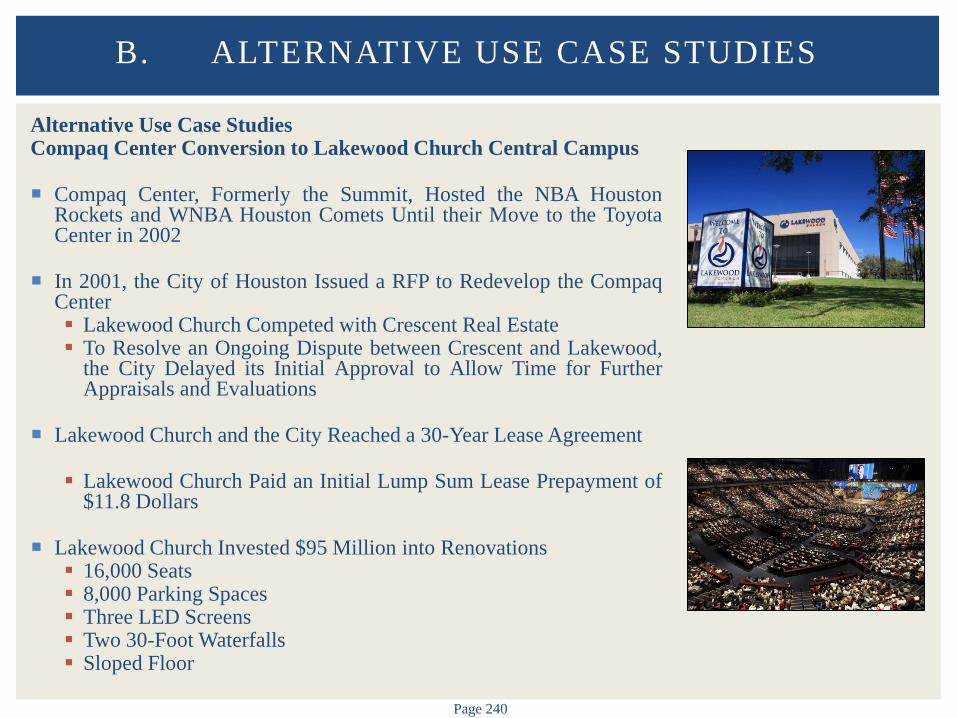
Page 240
Alternative Use Case Studies Compaq Center Conversion to Lakewood Church Central Campus
Compaq Center, Formerly the Summit, Hosted the NBA Houston
Rockets and WNBA Houston Comets Until their Move to the Toyota Center in 2002
In 2001, the City of Houston Issued a RFP to Redevelop the Compaq
Center Lakewood Church Competed with Crescent Real Estate To Resolve an Ongoing Dispute between Crescent and Lakewood,
the City Delayed its Initial Approval to Allow Time for Further Appraisals and Evaluations
Lakewood Church and the City Reached a 30-Year Lease Agreement
Lakewood Church Paid an Initial Lump Sum Lease Prepayment of
$11.8 Dollars
Lakewood Church Invested $95 Million into Renovations 16,000 Seats 8,000 Parking Spaces Three LED Screens Two 30-Foot Waterfalls Sloped Floor
B. ALTERNATIVE USE CASE STUDIES
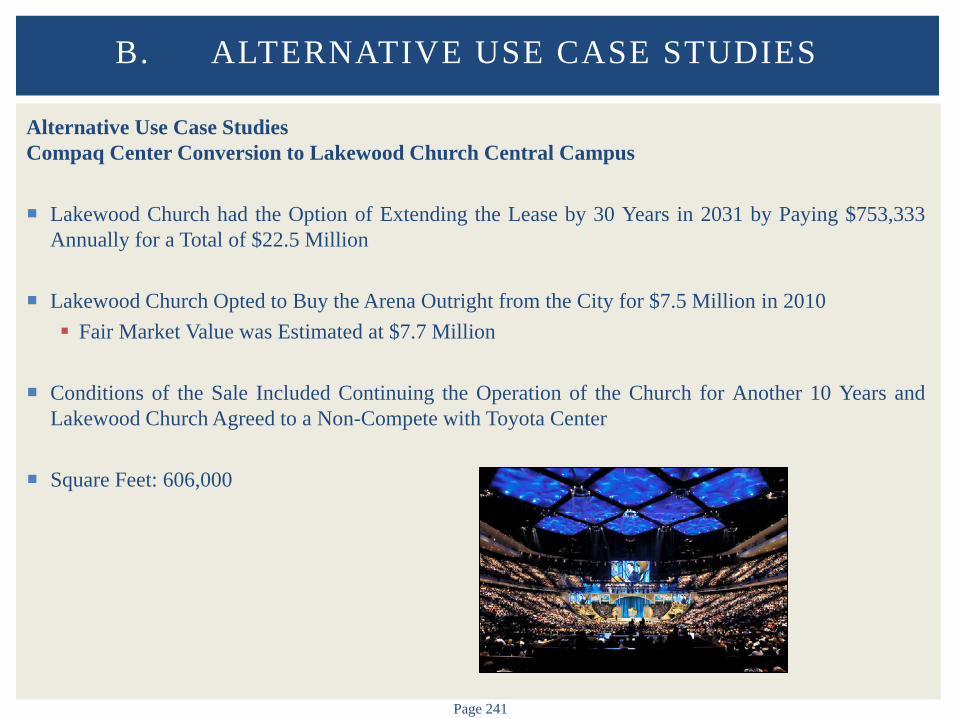
Page 241
Alternative Use Case Studies Compaq Center Conversion to Lakewood Church Central Campus Lakewood Church had the Option of Extending the Lease by 30 Years in 2031 by Paying $753,333
Annually for a Total of $22.5 Million
Lakewood Church Opted to Buy the Arena Outright from the City for $7.5 Million in 2010 Fair Market Value was Estimated at $7.7 Million
Conditions of the Sale Included Continuing the Operation of the Church for Another 10 Years and
Lakewood Church Agreed to a Non-Compete with Toyota Center Square Feet: 606,000
B. ALTERNATIVE USE CASE STUDIES
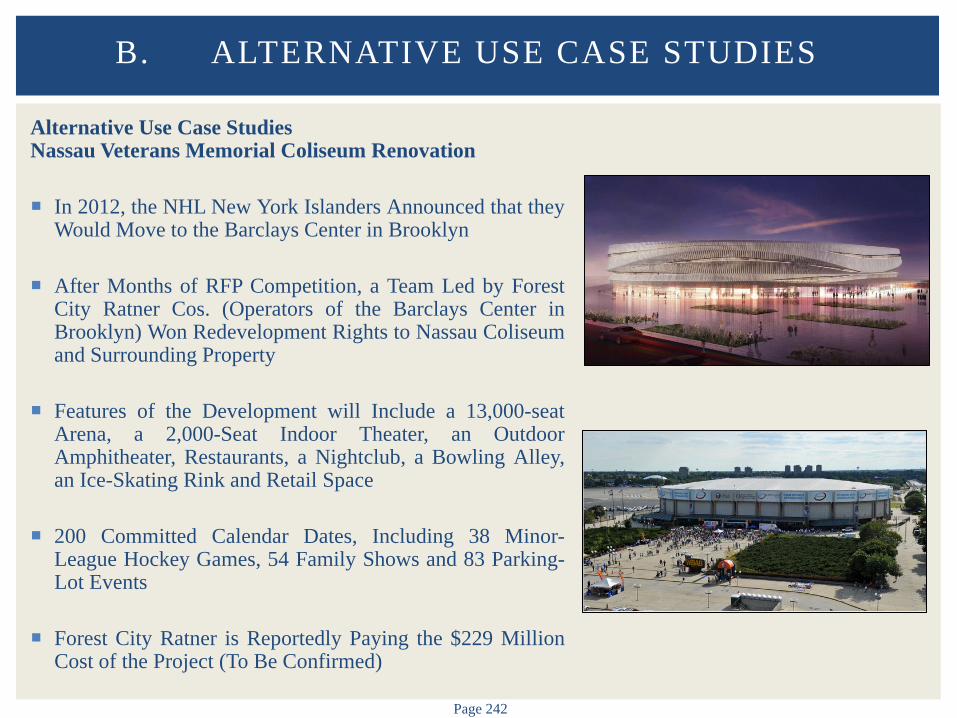
Page 242
Alternative Use Case Studies Nassau Veterans Memorial Coliseum Renovation
In 2012, the NHL New York Islanders Announced that they
Would Move to the Barclays Center in Brooklyn After Months of RFP Competition, a Team Led by Forest
City Ratner Cos. (Operators of the Barclays Center in Brooklyn) Won Redevelopment Rights to Nassau Coliseum and Surrounding Property
Features of the Development will Include a 13,000-seat
Arena, a 2,000-Seat Indoor Theater, an Outdoor Amphitheater, Restaurants, a Nightclub, a Bowling Alley, an Ice-Skating Rink and Retail Space
200 Committed Calendar Dates, Including 38 Minor-League Hockey Games, 54 Family Shows and 83 Parking-Lot Events
Forest City Ratner is Reportedly Paying the $229 Million
Cost of the Project (To Be Confirmed)
B. ALTERNATIVE USE CASE STUDIES

Page 243
Alternative Use Case Studies Nassau Veterans Memorial Coliseum Renovation Term: 34-Year Lease on the Property, with a 15-year Option to Renew, Totaling 49 Years County to Receive 8% of Gross Revenue and 12.75% of Parking Revenue, with a Minimum
Guaranteed Payment of $4 Million Per Year Rental Amount will Rise 10% Every Five Years During 34 Year Lease
Complex Size: 77 Acres
Forest City Ratner will Reduce Coliseum Capacity From 18,000 to 13,000 13,000 Seat Arena Will Host Minor League Hockey, Professional Lacrosse, Boxing, College
Basketball and Arena Football League Games In Process of Finalizing Amphitheatre Size and Restaurant Mix
Work on the Project Began in 2015, After Islanders Move to Barclays Center Project is Expected to Take 15-18 Months to Complete (December 2016)
B. ALTERNATIVE USE CASE STUDIES

Page 244
Alternative Use Case Studies Nassau Veterans Memorial Coliseum Renovation
B. ALTERNATIVE USE CASE STUDIES
Ice Rink
Renderings of Potential Outside Appearance
Interior Design

C. PUBLIC SUPPORT CASE STUDIES
Page 246
Overview Numerous Public Entities have Provided Concessions/Additional Subsidies to Professional Sports
Teams that have Clearly Demonstrated that they are Struggling Financially
The Consulting Team Provided Several Case Studies Herein Outlining Public Support NHL Arizona Coyotes Columbus Blue Jackets Nashville Predators
NBA Indiana Pacers Miami Heat
Case Studies from Other Jurisdictions Illustrate a Wide Range of Approaches to Offering Public
Support for Existing Teams/Facilities
County Must Consider the Potential Operational and Financial Consequences Relative to the Opportunities and Challenges of the Various Alternative Options Outlined Herein
C. PUBLIC SUPPORT CASE STUDIES
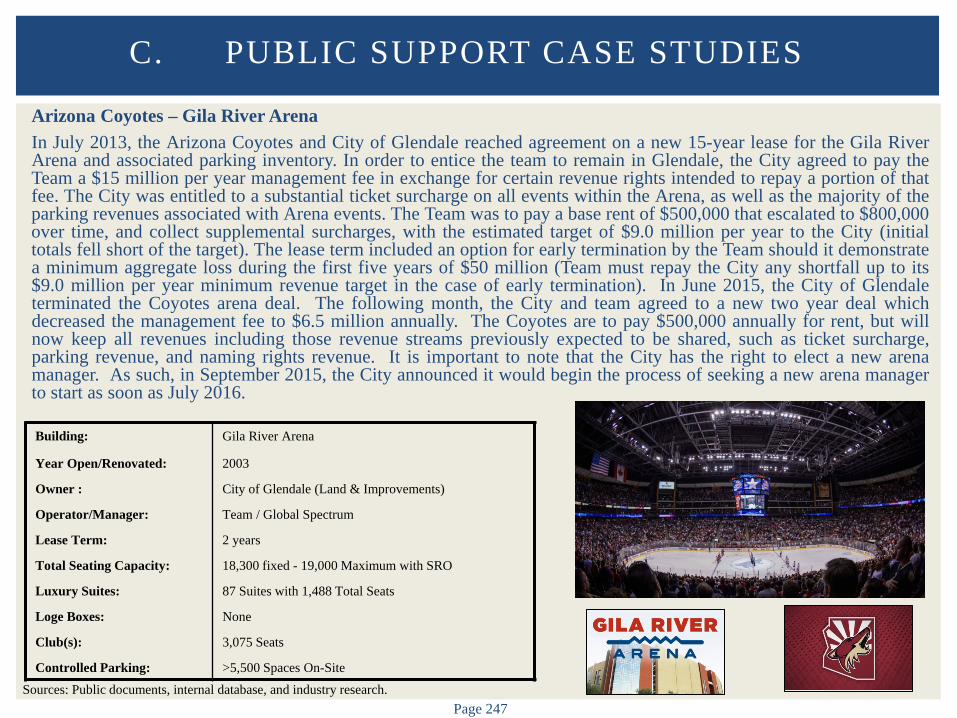
Page 247
Arizona Coyotes – Gila River Arena In July 2013, the Arizona Coyotes and City of Glendale reached agreement on a new 15-year lease for the Gila River Arena and associated parking inventory. In order to entice the team to remain in Glendale, the City agreed to pay the Team a $15 million per year management fee in exchange for certain revenue rights intended to repay a portion of that fee. The City was entitled to a substantial ticket surcharge on all events within the Arena, as well as the majority of the parking revenues associated with Arena events. The Team was to pay a base rent of $500,000 that escalated to $800,000 over time, and collect supplemental surcharges, with the estimated target of $9.0 million per year to the City (initial totals fell short of the target). The lease term included an option for early termination by the Team should it demonstrate a minimum aggregate loss during the first five years of $50 million (Team must repay the City any shortfall up to its $9.0 million per year minimum revenue target in the case of early termination). In June 2015, the City of Glendale terminated the Coyotes arena deal. The following month, the City and team agreed to a new two year deal which decreased the management fee to $6.5 million annually. The Coyotes are to pay $500,000 annually for rent, but will now keep all revenues including those revenue streams previously expected to be shared, such as ticket surcharge, parking revenue, and naming rights revenue. It is important to note that the City has the right to elect a new arena manager. As such, in September 2015, the City announced it would begin the process of seeking a new arena manager to start as soon as July 2016.
C. PUBLIC SUPPORT CASE STUDIES
Building: Gila River Arena
Year Open/Renovated: 2003
Owner : City of Glendale (Land & Improvements)
Operator/Manager: Team / Global Spectrum
Lease Term: 2 years
Total Seating Capacity: 18,300 fixed - 19,000 Maximum with SRO
Luxury Suites: 87 Suites with 1,488 Total Seats
Loge Boxes: None
Club(s): 3,075 Seats
Controlled Parking: >5,500 Spaces On-Site
Sources: Public documents, internal database, and industry research.
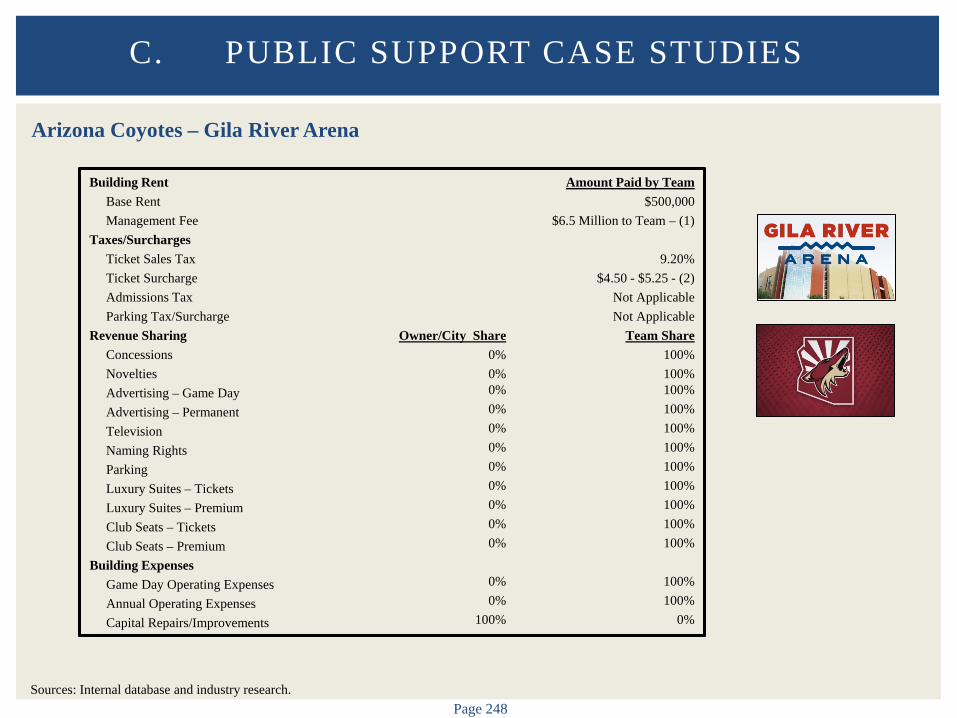
Page 248
Arizona Coyotes – Gila River Arena
C. PUBLIC SUPPORT CASE STUDIES
Building Rent Base Rent Management Fee Taxes/Surcharges Ticket Sales Tax Ticket Surcharge Admissions Tax Parking Tax/Surcharge Revenue Sharing Concessions Novelties Advertising – Game Day Advertising – Permanent Television Naming Rights Parking Luxury Suites – Tickets Luxury Suites – Premium Club Seats – Tickets Club Seats – Premium Building Expenses Game Day Operating Expenses Annual Operating Expenses Capital Repairs/Improvements
Owner/City Share 0% 0% 0% 0% 0% 0% 0% 0% 0% 0% 0%
0% 0%
100%
Amount Paid by Team $500,000
$6.5 Million to Team – (1)
9.20% $4.50 - $5.25 - (2)
Not Applicable Not Applicable
Team Share 100% 100% 100% 100% 100% 100% 100% 100% 100% 100% 100%
100% 100%
0%
Sources: Internal database and industry research.
Page 249
Arizona Coyotes – Gila River Arena
1) City announced it would begin process of seeking a new arena manager.
2) Team keeps ticket surcharge revenue.
C. PUBLIC SUPPORT CASE STUDIES
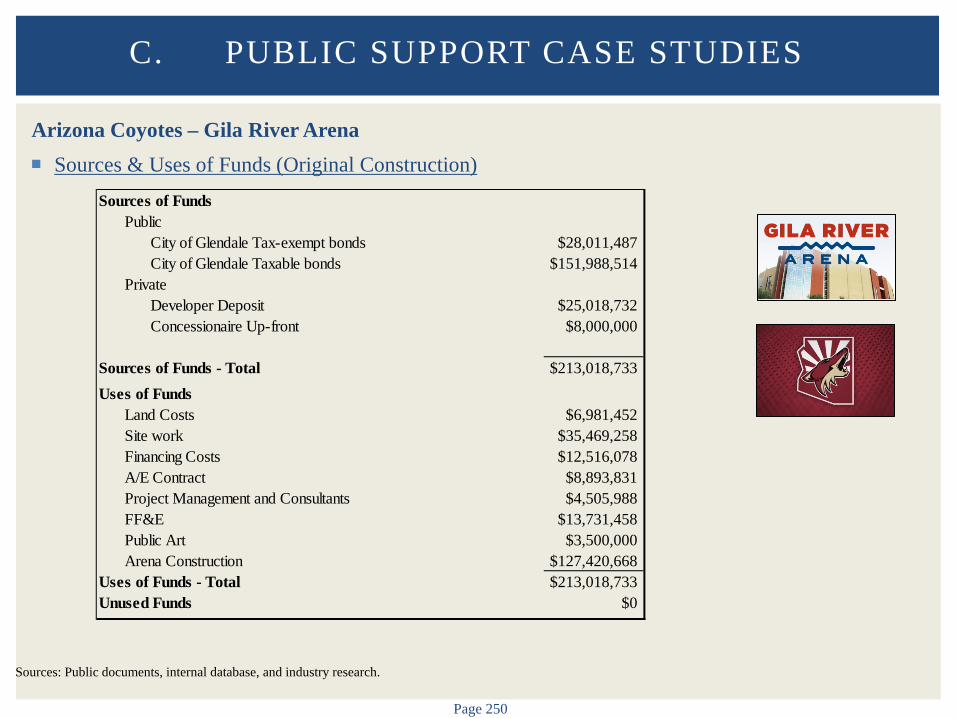
Page 250
Arizona Coyotes – Gila River Arena Sources & Uses of Funds (Original Construction)
C. PUBLIC SUPPORT CASE STUDIES
Sources: Public documents, internal database, and industry research.
Sources of FundsPublic
City of Glendale Tax-exempt bonds $28,011,487City of Glendale Taxable bonds $151,988,514
PrivateDeveloper Deposit $25,018,732Concessionaire Up-front $8,000,000
Sources of Funds - Total $213,018,733Uses of Funds
Land Costs $6,981,452Site work $35,469,258Financing Costs $12,516,078A/E Contract $8,893,831Project Management and Consultants $4,505,988FF&E $13,731,458Public Art $3,500,000Arena Construction $127,420,668
Uses of Funds - Total $213,018,733Unused Funds $0

Page 251
Columbus Blue Jackets – Nationwide Arena Nationwide Arena opened in 2000 in Columbus, Ohio, in the middle of a mixed-use Arena District in downtown Columbus. The arena was initially funded privately, prior to the 2012 purchase/sale of the arena to the County’s Convention Facilities Authority (CFA) for $42.5 million. As part of that transaction, the County contracted with a new entity called Columbus Arena Management, which is comprised of Ohio State University, Blue Jackets and Nationwide Realty Investors. CAM is managed as a joint venture of the three partners and operates the arena on behalf of the CFA. The Blue Jackets play under a simplified license agreement with CAM. The CFA and CAM are funded via a stipulated share of County and City-collected Casino Taxes, with CAM and its Partners jointly funding any shortfalls in the arena net revenues plus stipulated funding sources.
C. PUBLIC SUPPORT CASE STUDIES
Building: Nationwide Arena
Year Open/Renovated: 2000
Owner : Franklin County Convention Facilities Authority
Operator/Manager: Columbus Arena Management (CAM)
Lease Term: Thru 2029
Total Seating Capacity: 19,500 Fixed - 21,000 Max with SRO
Luxury Suites: 52 Suites with Two 48-Seat Party Towers
Loge Boxes: 26 Loge Boxes (6pp), 29 Terrace Tables (4pp)
Club(s): 5 Discrete Lounge Spaces
Controlled Parking: 560 Garage - >15,000 Spaces in Arena District
Sources: Public documents, internal database, and industry research.
BldgLogo
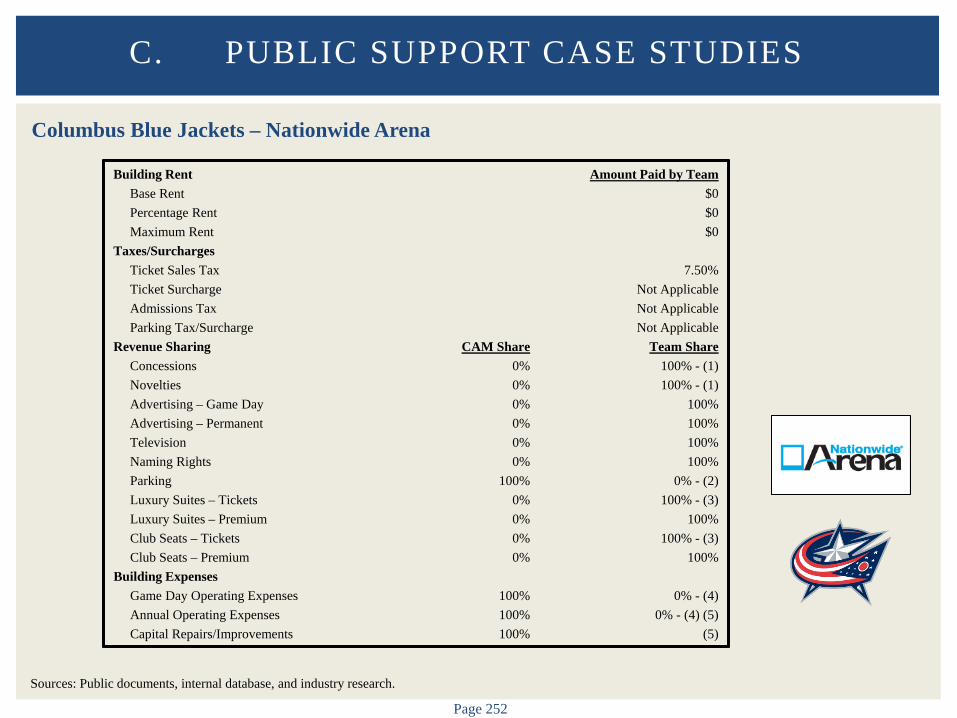
Page 252
Columbus Blue Jackets – Nationwide Arena
C. PUBLIC SUPPORT CASE STUDIES
Building Rent Base Rent Percentage Rent Maximum Rent Taxes/Surcharges Ticket Sales Tax Ticket Surcharge Admissions Tax Parking Tax/Surcharge Revenue Sharing Concessions Novelties Advertising – Game Day Advertising – Permanent Television Naming Rights Parking Luxury Suites – Tickets Luxury Suites – Premium Club Seats – Tickets Club Seats – Premium Building Expenses Game Day Operating Expenses Annual Operating Expenses Capital Repairs/Improvements
CAM Share 0% 0% 0% 0% 0% 0%
100% 0% 0% 0% 0%
100% 100% 100%
Amount Paid by Team $0 $0 $0
7.50%
Not Applicable Not Applicable Not Applicable
Team Share 100% - (1) 100% - (1)
100% 100% 100% 100%
0% - (2) 100% - (3)
100% 100% - (3)
100%
0% - (4) 0% - (4) (5)
(5)
Sources: Public documents, internal database, and industry research.
Page 253
Columbus Blue Jackets – Nationwide Arena 1) The Team is entitled to the Owner’s share of concessions revenue per the Concessionaire Agreement.
As Team has no stake in the non-hockey operations of the Arena, they collect no additional revenues from the Concessionaire. Team retains sole right to negotiate third party agreements such as the Concessionaire Agreement, provided its terms treat hockey and non-hockey events on equal terms.
2) CAM is obligated to provide an inventory of parking to the Team to accommodate team staff and invitees and suiteholders for all events. For hockey events, the Team receives parking for club seat holders as well. CAM retains all other parking economics.
3) The Team has the exclusive right to sell Suite, Terrace Table and Loge Box seating within the Arena. This includes all the revenues associated with non-hockey events for that inventory.
4) Annual and Game-Day expenses are borne by CAM, subject to certain limitations. For playoff games, the Team is obligated to reimburse CAM for event expenses. Additionally, CAM’s responsibility for Game-Day expenses cannot exceed the revenues CAM collects from operation of non-hockey facilities within the Arena such as the parking garage, arena restaurant and practice rink.
5) In the event that the Casino and other revenues available to pay operating expenses or capital expenses are insufficient in a given year, the partners in CAM are responsible for funding the shortfalls in equal proportion, with Ohio State’s shortfall funding capped at $7 million dollars in aggregate.
C. PUBLIC SUPPORT CASE STUDIES
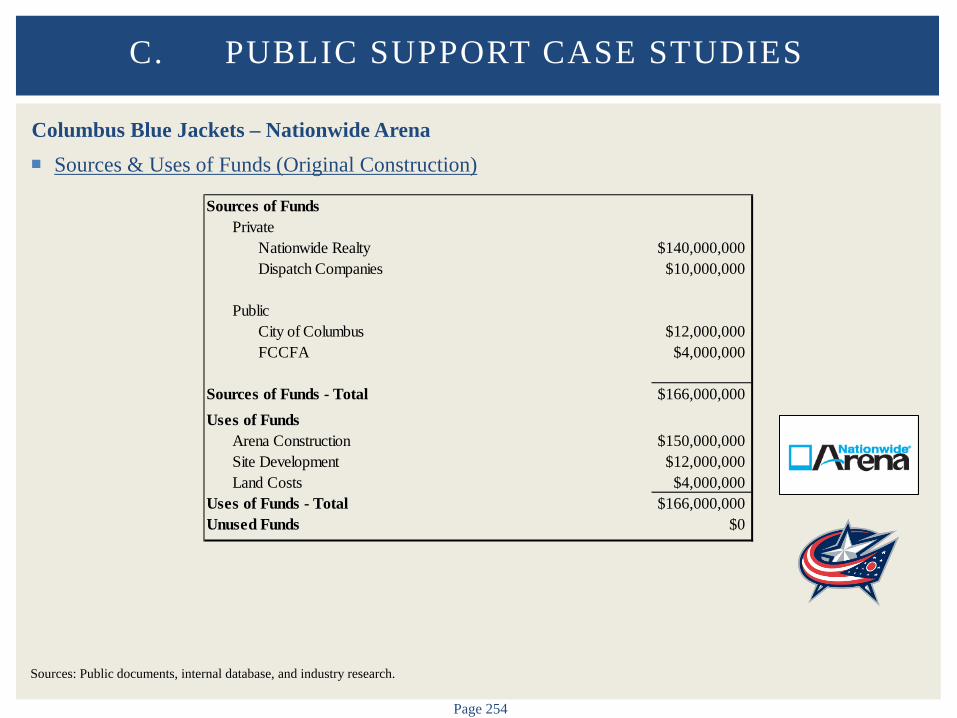
Page 254
Columbus Blue Jackets – Nationwide Arena Sources & Uses of Funds (Original Construction)
C. PUBLIC SUPPORT CASE STUDIES
Sources of FundsPrivate
Nationwide Realty $140,000,000Dispatch Companies $10,000,000
PublicCity of Columbus $12,000,000FCCFA $4,000,000
Sources of Funds - Total $166,000,000Uses of Funds
Arena Construction $150,000,000Site Development $12,000,000Land Costs $4,000,000
Uses of Funds - Total $166,000,000Unused Funds $0
Sources: Public documents, internal database, and industry research.
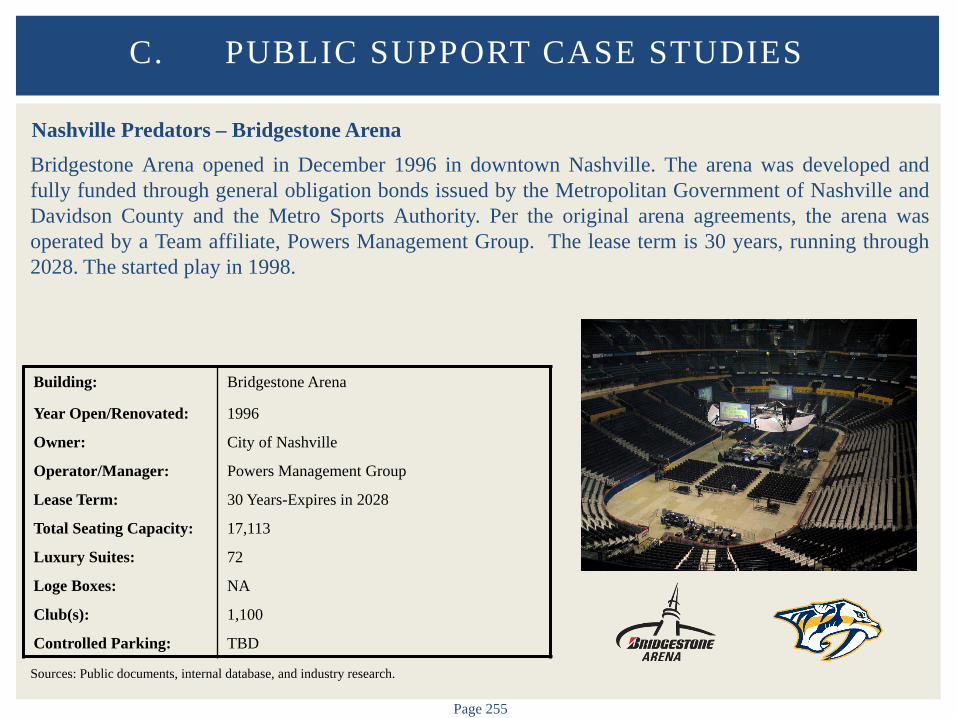
Page 255
Nashville Predators – Bridgestone Arena Bridgestone Arena opened in December 1996 in downtown Nashville. The arena was developed and fully funded through general obligation bonds issued by the Metropolitan Government of Nashville and Davidson County and the Metro Sports Authority. Per the original arena agreements, the arena was operated by a Team affiliate, Powers Management Group. The lease term is 30 years, running through 2028. The started play in 1998.
C. PUBLIC SUPPORT CASE STUDIES
Building: Bridgestone Arena
Year Open/Renovated: 1996
Owner: City of Nashville
Operator/Manager: Powers Management Group
Lease Term: 30 Years-Expires in 2028
Total Seating Capacity: 17,113
Luxury Suites: 72
Loge Boxes: NA
Club(s): 1,100
Controlled Parking: TBD
Sources: Public documents, internal database, and industry research.
Page 256
Nashville Predators – Bridgestone Arena
2008 Lease Renegotiation Shortly after its Sale to David Freeman, the Predators Negotiated a New Lease which Gave the
Authority a Cap on its Exposure to Operating Risk The Agreement Called for a $2 Million Management Fee to be Kept by the Operator Out of Arena
Operating Revenue, and Established Performance Incentives Allowing up to Nearly $2 Million in Additional Fees
Total Public Support Annually Amounted to $7 to $8 Million Per Year. The Authority Received a Seat Use Charge of $2.00 per Ticket, Used to Fund its Debt Service Related to Arena Construction
2012 Lease Renegotiation The Authority’s Cap on its Share of Operating Losses was Set a $4.2 Million Per Year with
Inflation Adjustments Going Forward. In Practice, the Team Pays Operating Expenses Less a Contribution from the Authority of Approximately $5.0 Million.
The Incentive Package to the Operator was Modified by Decreasing its Base Management Fee to $1 Million and Increasing the Maximum Incentive Fees to $2.7 Million Per Year
An Additional $2.00 Per Ticket in Fees were Authorized to Fund Future Capital Repairs at the Arena
The Revised Lease Allows the Team to Terminate its Lease Early in the Event that During a Three-Year Period the Operator Loses a Total of $10 Million Dollars Beyond the Authority’s Share of Losses
C. PUBLIC SUPPORT CASE STUDIES
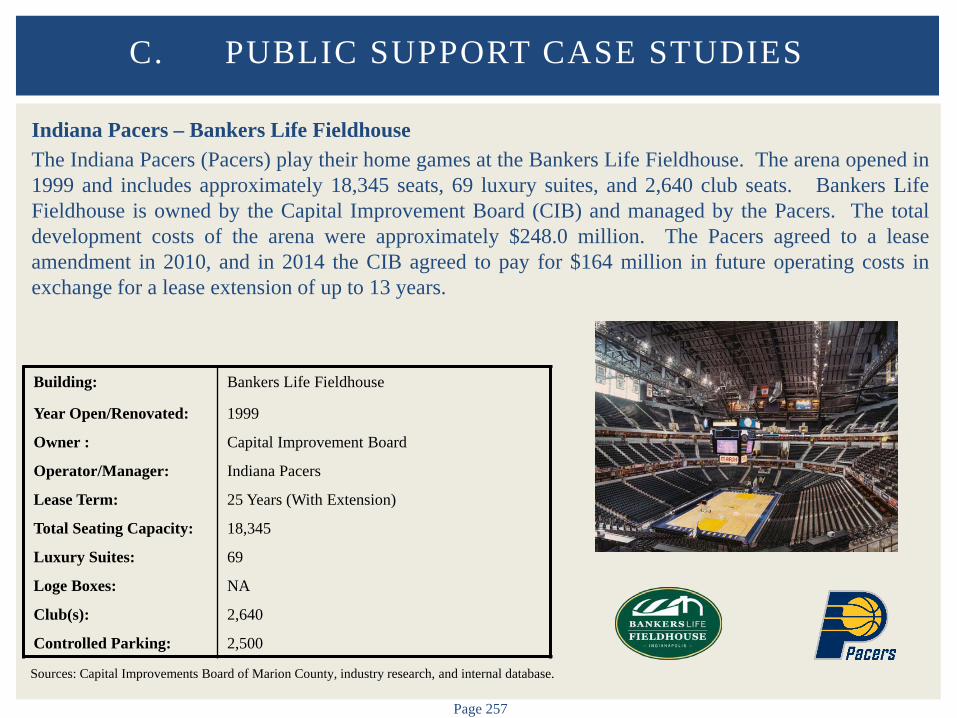
Page 257
Indiana Pacers – Bankers Life Fieldhouse The Indiana Pacers (Pacers) play their home games at the Bankers Life Fieldhouse. The arena opened in 1999 and includes approximately 18,345 seats, 69 luxury suites, and 2,640 club seats. Bankers Life Fieldhouse is owned by the Capital Improvement Board (CIB) and managed by the Pacers. The total development costs of the arena were approximately $248.0 million. The Pacers agreed to a lease amendment in 2010, and in 2014 the CIB agreed to pay for $164 million in future operating costs in exchange for a lease extension of up to 13 years.
C. PUBLIC SUPPORT CASE STUDIES
Building: Bankers Life Fieldhouse
Year Open/Renovated: 1999
Owner : Capital Improvement Board
Operator/Manager: Indiana Pacers
Lease Term: 25 Years (With Extension)
Total Seating Capacity: 18,345
Luxury Suites: 69
Loge Boxes: NA
Club(s): 2,640
Controlled Parking: 2,500
Sources: Capital Improvements Board of Marion County, industry research, and internal database.
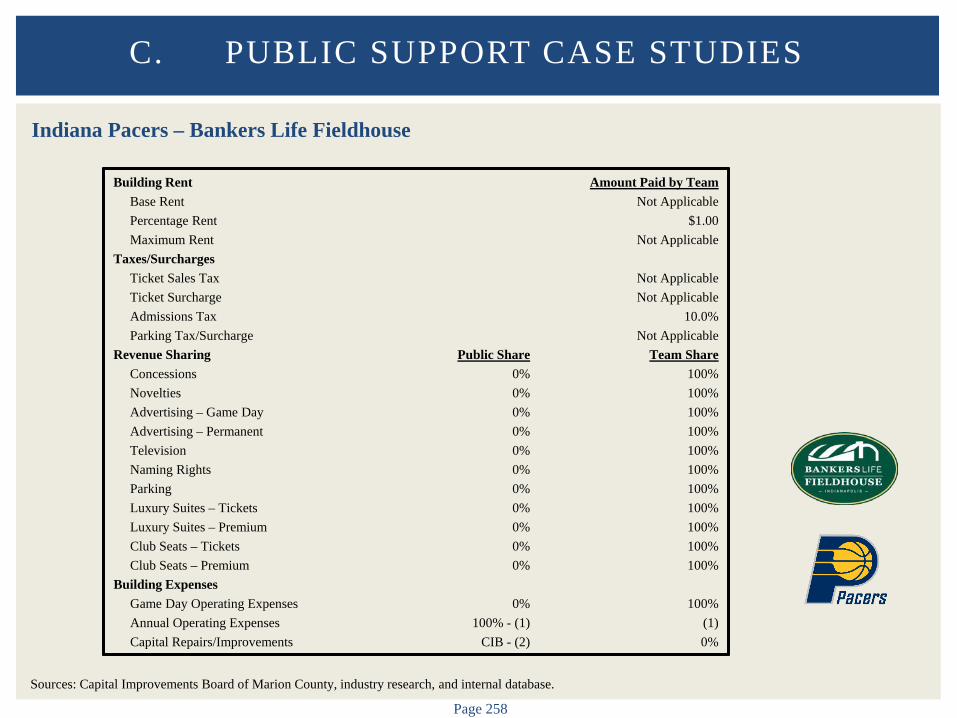
Page 258
Indiana Pacers – Bankers Life Fieldhouse
C. PUBLIC SUPPORT CASE STUDIES
Building Rent Base Rent Percentage Rent Maximum Rent Taxes/Surcharges Ticket Sales Tax Ticket Surcharge Admissions Tax Parking Tax/Surcharge Revenue Sharing Concessions Novelties Advertising – Game Day Advertising – Permanent Television Naming Rights Parking Luxury Suites – Tickets Luxury Suites – Premium Club Seats – Tickets Club Seats – Premium Building Expenses Game Day Operating Expenses Annual Operating Expenses Capital Repairs/Improvements
Public Share 0% 0% 0% 0% 0% 0% 0% 0% 0% 0% 0%
0%
100% - (1) CIB - (2)
Amount Paid by Team Not Applicable
$1.00 Not Applicable
Not Applicable Not Applicable
10.0% Not Applicable
Team Share 100% 100% 100% 100% 100% 100% 100% 100% 100% 100% 100%
100%
(1) 0%
Sources: Capital Improvements Board of Marion County, industry research, and internal database.
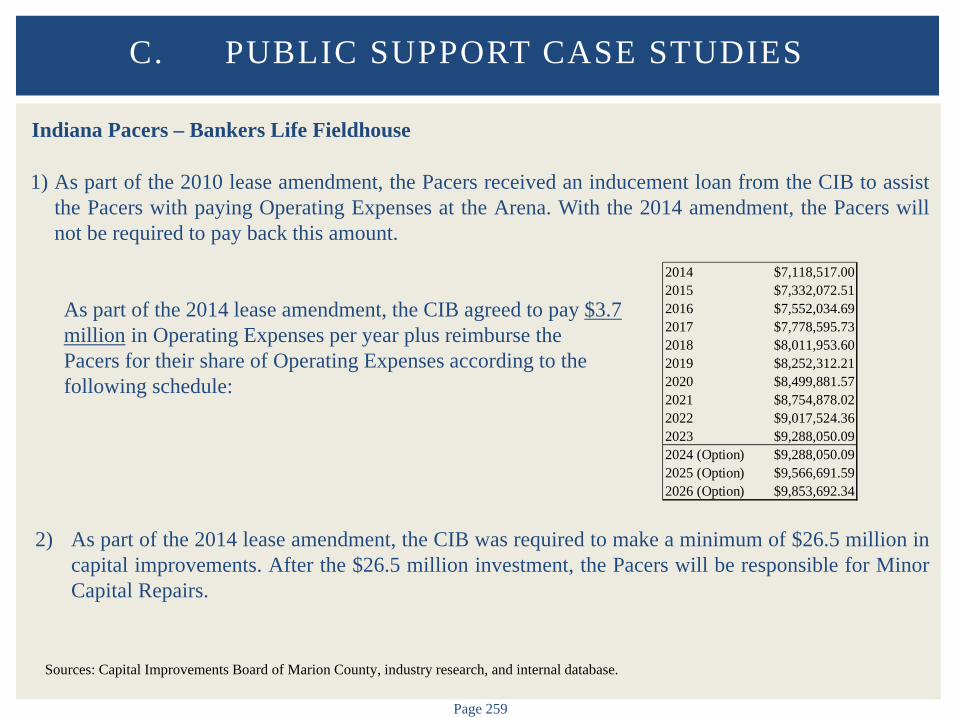
Page 259
Indiana Pacers – Bankers Life Fieldhouse 1) As part of the 2010 lease amendment, the Pacers received an inducement loan from the CIB to assist
the Pacers with paying Operating Expenses at the Arena. With the 2014 amendment, the Pacers will not be required to pay back this amount. As part of the 2014 lease amendment, the CIB agreed to pay $3.7 million in Operating Expenses per year plus reimburse the Pacers for their share of Operating Expenses according to the following schedule:
2) As part of the 2014 lease amendment, the CIB was required to make a minimum of $26.5 million in capital improvements. After the $26.5 million investment, the Pacers will be responsible for Minor Capital Repairs.
C. PUBLIC SUPPORT CASE STUDIES
2014 $7,118,517.002015 $7,332,072.512016 $7,552,034.692017 $7,778,595.732018 $8,011,953.602019 $8,252,312.212020 $8,499,881.572021 $8,754,878.022022 $9,017,524.362023 $9,288,050.092024 (Option) $9,288,050.092025 (Option) $9,566,691.592026 (Option) $9,853,692.34
Sources: Capital Improvements Board of Marion County, industry research, and internal database.

Page 260
Indiana Pacers – Bankers Life Fieldhouse Sources & Uses of Funds (Original Construction)
C. PUBLIC SUPPORT CASE STUDIES
Sources: Capital Improvements Board of Marion County, industry research, and internal database.
Sources of FundsCurrent Interest Bonds 1997A $195,165,000Current Interest Bonds 1997B $21,540,000Capital Appreciation Bonds 1997A $5,783,455Professional Sports Development Area Revenues $10,800,000City of Indianapolis Contribution $4,700,000Private Contribution $10,000,000Rounding $11,545
Total Sources of Funds $248,000,000
Uses of FundsLand $23,400,000Arena Construction $175,500,000Parking/Streetscape $21,100,000Transactional Costs $28,000,000
Total Uses of Funds $248,000,000
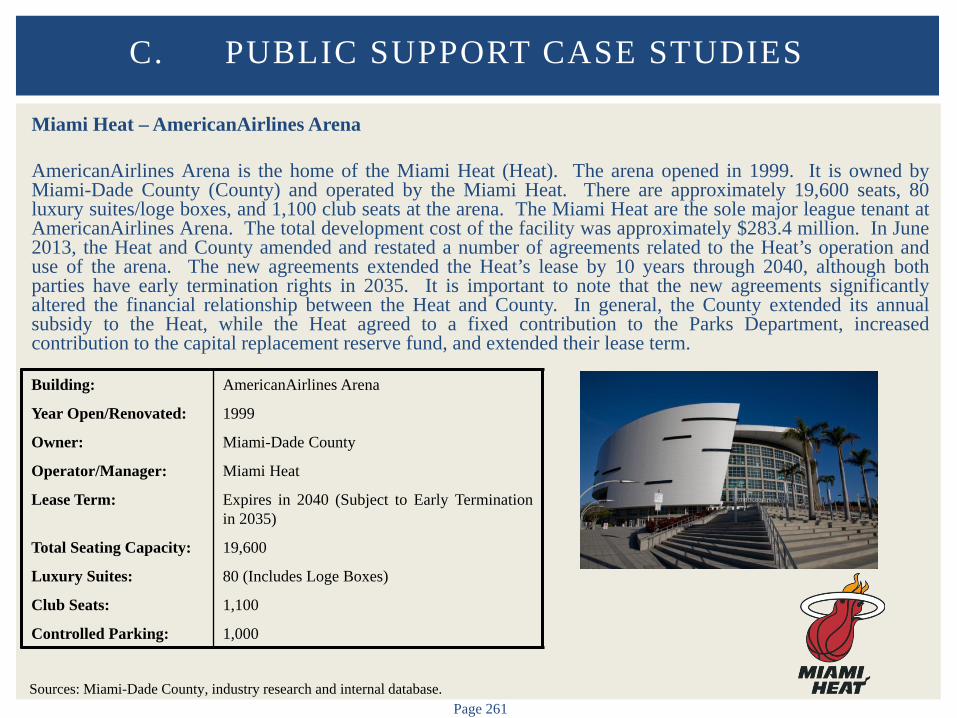
Page 261
Miami Heat – AmericanAirlines Arena AmericanAirlines Arena is the home of the Miami Heat (Heat). The arena opened in 1999. It is owned by Miami-Dade County (County) and operated by the Miami Heat. There are approximately 19,600 seats, 80 luxury suites/loge boxes, and 1,100 club seats at the arena. The Miami Heat are the sole major league tenant at AmericanAirlines Arena. The total development cost of the facility was approximately $283.4 million. In June 2013, the Heat and County amended and restated a number of agreements related to the Heat’s operation and use of the arena. The new agreements extended the Heat’s lease by 10 years through 2040, although both parties have early termination rights in 2035. It is important to note that the new agreements significantly altered the financial relationship between the Heat and County. In general, the County extended its annual subsidy to the Heat, while the Heat agreed to a fixed contribution to the Parks Department, increased contribution to the capital replacement reserve fund, and extended their lease term.
C. PUBLIC SUPPORT CASE STUDIES
Building: AmericanAirlines Arena
Year Open/Renovated: 1999
Owner: Miami-Dade County
Operator/Manager: Miami Heat
Lease Term: Expires in 2040 (Subject to Early Termination in 2035)
Total Seating Capacity: 19,600
Luxury Suites: 80 (Includes Loge Boxes)
Club Seats: 1,100
Controlled Parking: 1,000
Sources: Miami-Dade County, industry research and internal database.
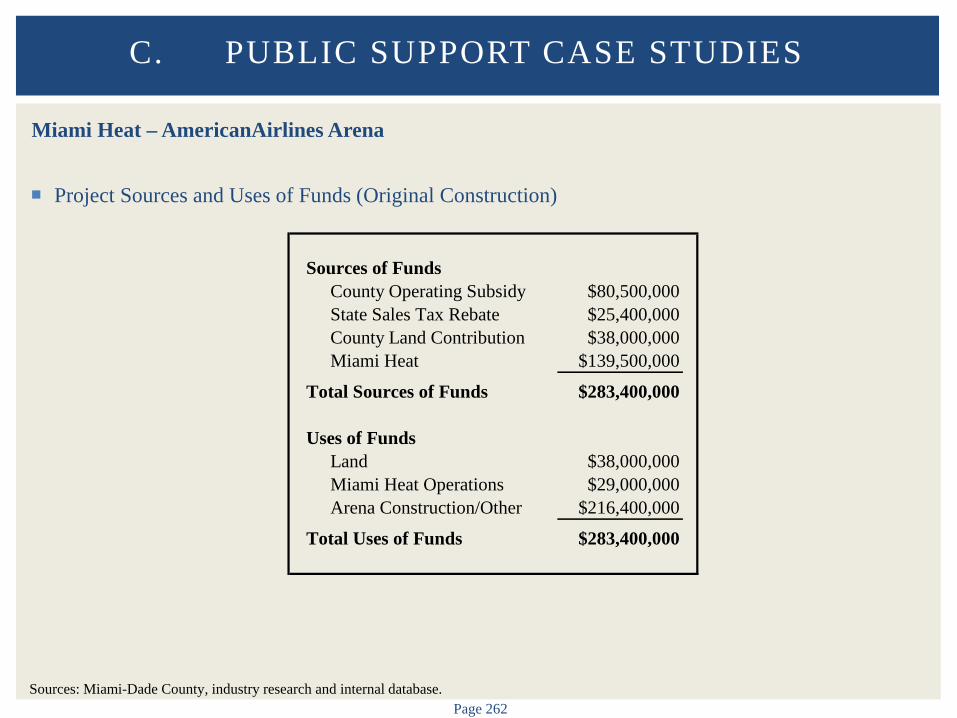
Page 262
Miami Heat – AmericanAirlines Arena Project Sources and Uses of Funds (Original Construction)
C. PUBLIC SUPPORT CASE STUDIES
Sources of FundsCounty Operating Subsidy $80,500,000State Sales Tax Rebate $25,400,000County Land Contribution $38,000,000Miami Heat $139,500,000
Total Sources of Funds $283,400,000
Uses of FundsLand $38,000,000Miami Heat Operations $29,000,000Arena Construction/Other $216,400,000
Total Uses of Funds $283,400,000
Sources: Miami-Dade County, industry research and internal database.
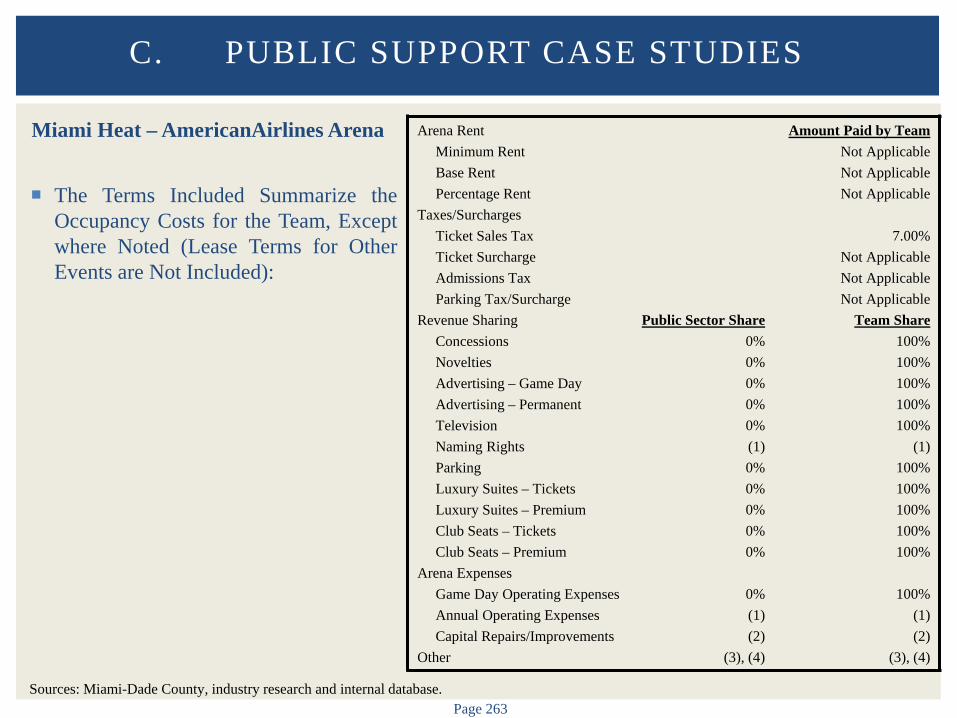
Page 263
Miami Heat – AmericanAirlines Arena The Terms Included Summarize the
Occupancy Costs for the Team, Except where Noted (Lease Terms for Other Events are Not Included):
C. PUBLIC SUPPORT CASE STUDIES
Sources: Miami-Dade County, industry research and internal database.
Arena Rent Minimum Rent Base Rent Percentage Rent Taxes/Surcharges Ticket Sales Tax Ticket Surcharge Admissions Tax Parking Tax/Surcharge Revenue Sharing Concessions Novelties Advertising – Game Day Advertising – Permanent Television Naming Rights Parking Luxury Suites – Tickets Luxury Suites – Premium Club Seats – Tickets Club Seats – Premium Arena Expenses Game Day Operating Expenses Annual Operating Expenses Capital Repairs/Improvements Other
Public Sector Share 0% 0% 0% 0% 0% (1) 0% 0% 0% 0% 0%
0% (1) (2)
(3), (4)
Amount Paid by Team Not Applicable Not Applicable Not Applicable
7.00%
Not Applicable Not Applicable Not Applicable
Team Share 100% 100% 100% 100% 100%
(1) 100% 100% 100% 100% 100%
100%
(1) (2)
(3), (4)
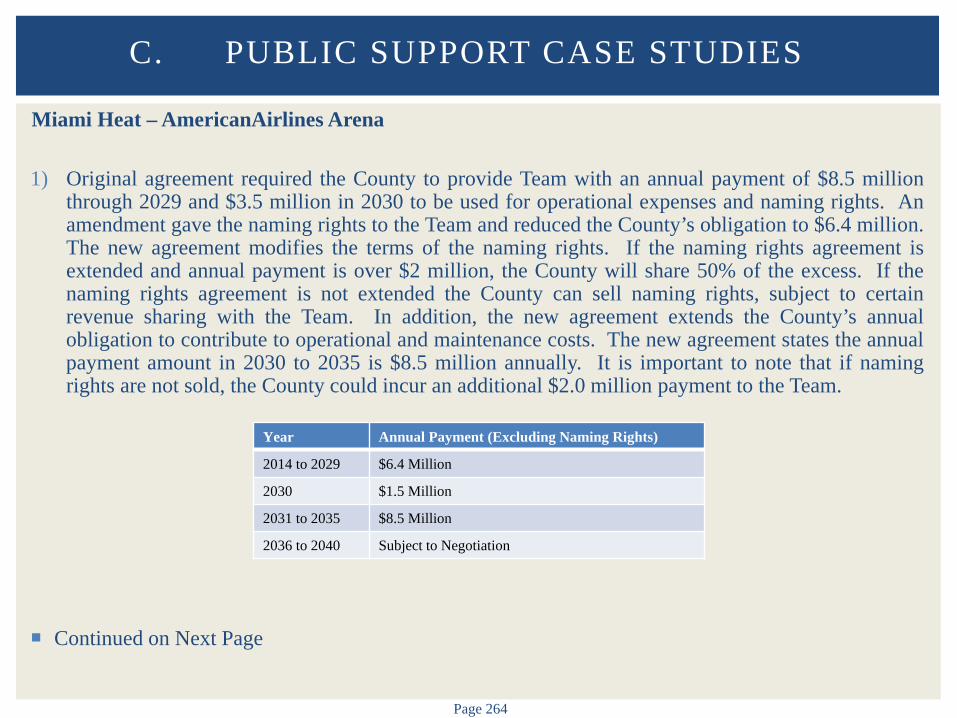
Page 264
Miami Heat – AmericanAirlines Arena 1) Original agreement required the County to provide Team with an annual payment of $8.5 million
through 2029 and $3.5 million in 2030 to be used for operational expenses and naming rights. An amendment gave the naming rights to the Team and reduced the County’s obligation to $6.4 million. The new agreement modifies the terms of the naming rights. If the naming rights agreement is extended and annual payment is over $2 million, the County will share 50% of the excess. If the naming rights agreement is not extended the County can sell naming rights, subject to certain revenue sharing with the Team. In addition, the new agreement extends the County’s annual obligation to contribute to operational and maintenance costs. The new agreement states the annual payment amount in 2030 to 2035 is $8.5 million annually. It is important to note that if naming rights are not sold, the County could incur an additional $2.0 million payment to the Team.
Continued on Next Page
C. PUBLIC SUPPORT CASE STUDIES
Year Annual Payment (Excluding Naming Rights)
2014 to 2029 $6.4 Million
2030 $1.5 Million
2031 to 2035 $8.5 Million
2036 to 2040 Subject to Negotiation

Page 265
Miami Heat – AmericanAirlines Arena 2) The new agreement increases the annual payment amount that the Team is required to make to the capital
replacement reserve account. The original agreement required the Team to make a $1.1 million payment in 2014, $1.1 million in 2015, and increasing by CPI thereafter. The new agreement increases the annual amount. It is important to point out that the Team is required to spend a minimum of $81.1 million on capital repairs during the term of the new agreement (an amount equal to the annual deposits). In addition, the team is ultimately responsible for maintaining the arena in a first class manner and may spend more than that amount.
3) Original agreement required the Team to pay the County 40% of arena excess profits. Over the first 13 years of the agreement, the County received a payment in only one year (2013). The new agreement eliminated the provision and replaced it with a fixed annual payment from the Team to the Parks and Recreation Department.
4) The new agreement also amended the Team’s rent to the County for retail areas located outside the arena. Per the calculation from the original agreement, the annual rent was $85,670. Estimates from the new agreement calculate the annual rent at $125,000. If the Team increases the retail space outside the arena, the rent would also increase on per square foot basis.
C. PUBLIC SUPPORT CASE STUDIES
Year Annual Payment
2014 to 2030 $1.0 Million
2031 to 2035 $1.25 Million
2036 to 2040 $0
Year Annual Payment
2014 $10,247,544
2015 $1,600,000
2016 to 2040 Preceding Year Escalated by 4.0% (2040 at $4,265,338)

APPENDIX A: COMPARABLE ARENAS –
CASE STUDIES
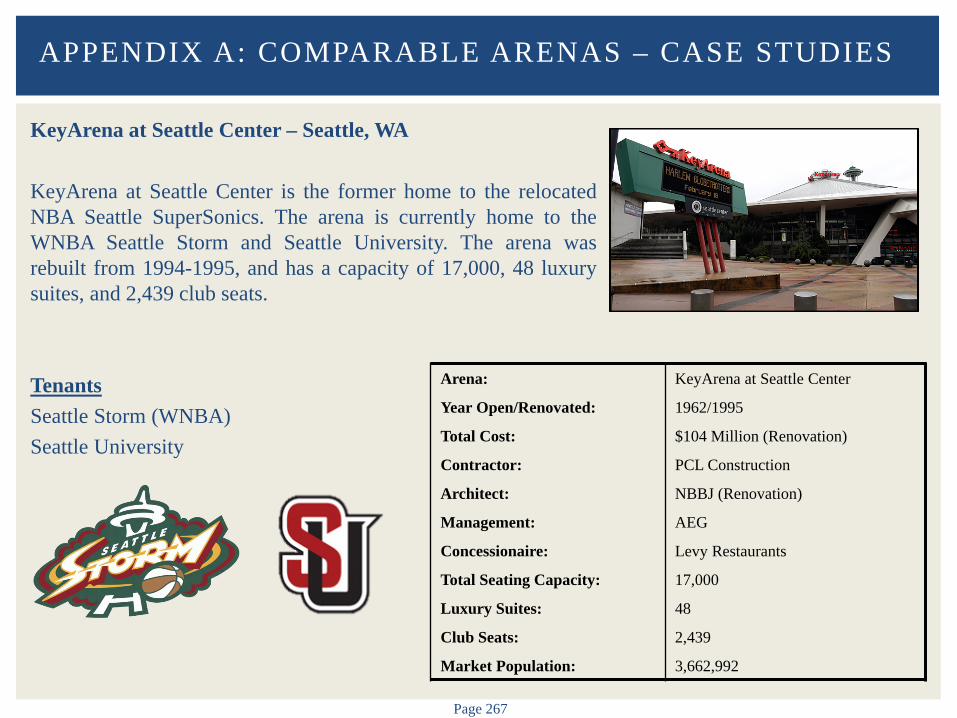
Page 267
KeyArena at Seattle Center – Seattle, WA KeyArena at Seattle Center is the former home to the relocated NBA Seattle SuperSonics. The arena is currently home to the WNBA Seattle Storm and Seattle University. The arena was rebuilt from 1994-1995, and has a capacity of 17,000, 48 luxury suites, and 2,439 club seats. Tenants Seattle Storm (WNBA) Seattle University
APPENDIX A: COMPARABLE ARENAS – CASE STUDIES
Arena: KeyArena at Seattle Center
Year Open/Renovated: 1962/1995
Total Cost: $104 Million (Renovation)
Contractor: PCL Construction
Architect: NBBJ (Renovation)
Management: AEG
Concessionaire: Levy Restaurants
Total Seating Capacity: 17,000
Luxury Suites: 48
Club Seats: 2,439
Market Population: 3,662,992
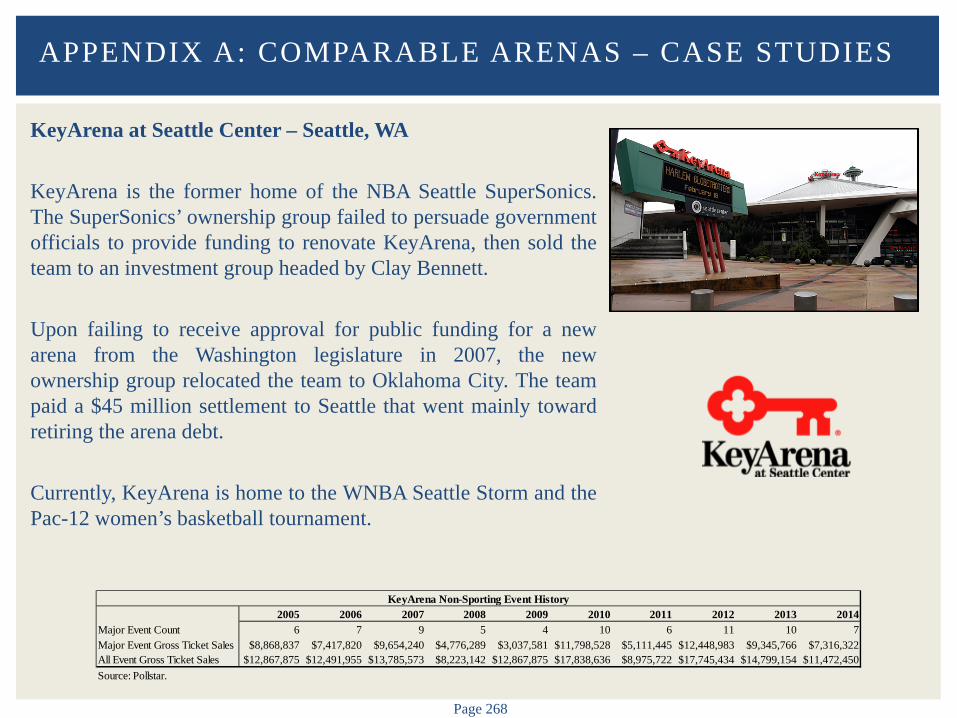
Page 268
KeyArena at Seattle Center – Seattle, WA KeyArena is the former home of the NBA Seattle SuperSonics. The SuperSonics’ ownership group failed to persuade government officials to provide funding to renovate KeyArena, then sold the team to an investment group headed by Clay Bennett. Upon failing to receive approval for public funding for a new arena from the Washington legislature in 2007, the new ownership group relocated the team to Oklahoma City. The team paid a $45 million settlement to Seattle that went mainly toward retiring the arena debt. Currently, KeyArena is home to the WNBA Seattle Storm and the Pac-12 women’s basketball tournament.
APPENDIX A: COMPARABLE ARENAS – CASE STUDIES
2005 2006 2007 2008 2009 2010 2011 2012 2013 2014Major Event Count 6 7 9 5 4 10 6 11 10 7Major Event Gross Ticket Sales $8,868,837 $7,417,820 $9,654,240 $4,776,289 $3,037,581 $11,798,528 $5,111,445 $12,448,983 $9,345,766 $7,316,322All Event Gross Ticket Sales $12,867,875 $12,491,955 $13,785,573 $8,223,142 $12,867,875 $17,838,636 $8,975,722 $17,745,434 $14,799,154 $11,472,450Source: Pollstar.
KeyArena Non-Sporting Event History
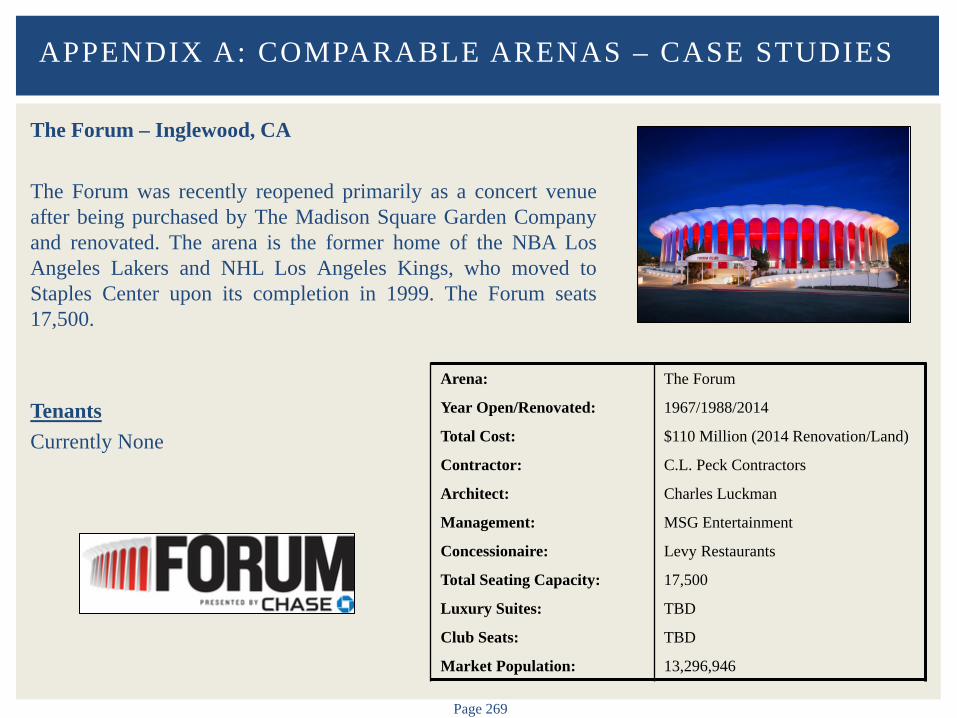
Page 269
The Forum – Inglewood, CA The Forum was recently reopened primarily as a concert venue after being purchased by The Madison Square Garden Company and renovated. The arena is the former home of the NBA Los Angeles Lakers and NHL Los Angeles Kings, who moved to Staples Center upon its completion in 1999. The Forum seats 17,500. Tenants Currently None
APPENDIX A: COMPARABLE ARENAS – CASE STUDIES
Arena: The Forum
Year Open/Renovated: 1967/1988/2014
Total Cost: $110 Million (2014 Renovation/Land)
Contractor: C.L. Peck Contractors
Architect: Charles Luckman
Management: MSG Entertainment
Concessionaire: Levy Restaurants
Total Seating Capacity: 17,500
Luxury Suites: TBD
Club Seats: TBD
Market Population: 13,296,946
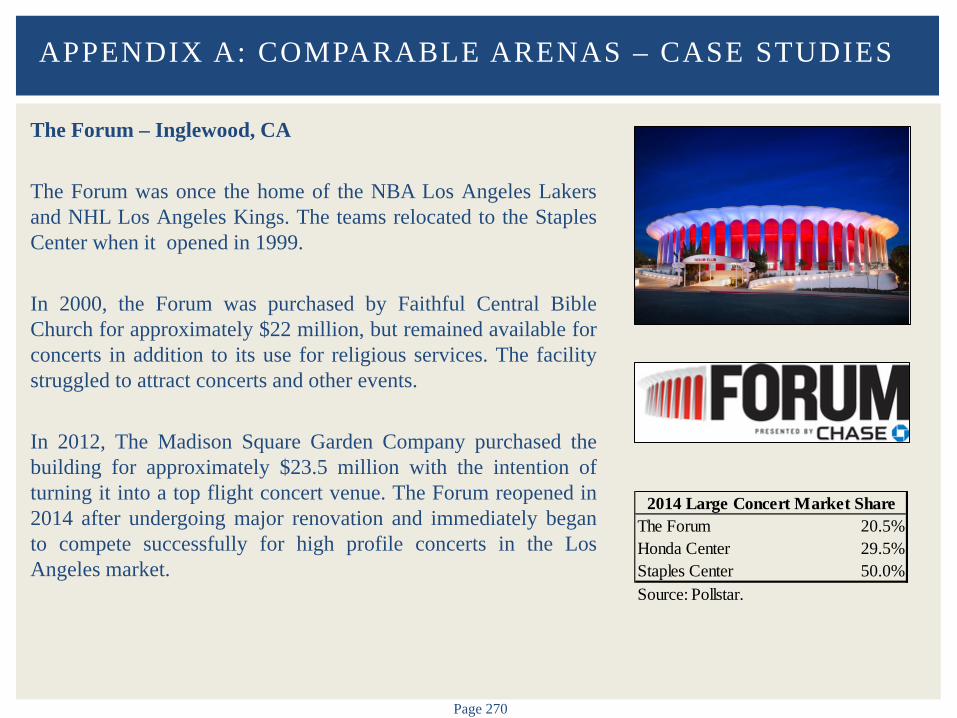
Page 270
The Forum – Inglewood, CA The Forum was once the home of the NBA Los Angeles Lakers and NHL Los Angeles Kings. The teams relocated to the Staples Center when it opened in 1999. In 2000, the Forum was purchased by Faithful Central Bible Church for approximately $22 million, but remained available for concerts in addition to its use for religious services. The facility struggled to attract concerts and other events. In 2012, The Madison Square Garden Company purchased the building for approximately $23.5 million with the intention of turning it into a top flight concert venue. The Forum reopened in 2014 after undergoing major renovation and immediately began to compete successfully for high profile concerts in the Los Angeles market.
APPENDIX A: COMPARABLE ARENAS – CASE STUDIES
The Forum 20.5%Honda Center 29.5%Staples Center 50.0%Source: Pollstar.
2014 Large Concert Market Share

Page 271
IZOD Center – East Rutherford, NJ IZOD Center was built in 1981, and is the former home of the NBA New Jersey Nets and NHL New Jersey Devils. The arena seats 20,049 and has 29 luxury suites. The arena is set to close in 2015, plans for the site have not been finalized. Tenants Currently None
APPENDIX A: COMPARABLE ARENAS – CASE STUDIES
Arena: IZOD Center
Year Open/Renovated: 1981
Total Cost: $85 Million
Contractor: Terminal Construction
Architect: Grad Partnership/Dillulo, Clauss, Ostroki & Partners
Management: New Jersey Sports and Exposition Authority
Concessionaire: Aramark
Total Seating Capacity: 20,049
Luxury Suites: 29
Club Seats: TBD
Market Population: 20,114,525

Page 272
IZOD Center – East Rutherford, NJ
IZOD Center is located in the Meadowlands Sports Complex and is the former home of the NBA New Jersey Nets, NHL New Jersey Devils, and the men’s basketball teams at Seton Hall University and Fordham University.
In 2007, the Devils and Seton Hall University moved to the newly constructed Prudential Center, where the Nets followed in 2010 before moving to Brooklyn. Fordham University played a portion their home games at IZOD Center in 2010-11.
The New Jersey government considered several options for the arena, including integration into the American Dream Meadowlands complex, but they were unable to come to terms. With the arena losing money, in January 2015 the New Jersey Sports and Exposition Authority voted to close the arena in 2015. Plans for the site have not been finalized, but may include a hotel.
APPENDIX A: COMPARABLE ARENAS – CASE STUDIES
2005 2006 2007 2008 2009 2010 2011 2012 2013 2014Major Event Count 19 12 17 16 14 5 13 13 8 8Major Event Gross Ticket Sales $24,738,758 $10,895,543 $18,830,514 $19,421,859 $16,636,879 $6,891,520 $15,948,877 $15,571,381 $9,517,898 $8,195,330All Event Gross Ticket Sales $31,292,148 $22,614,222 $33,386,959 $33,234,681 $23,248,138 $13,439,144 $22,843,564 $19,851,991 $14,995,310 $18,652,855Source: Pollstar.
IZOD Center Non-Sporting Event History
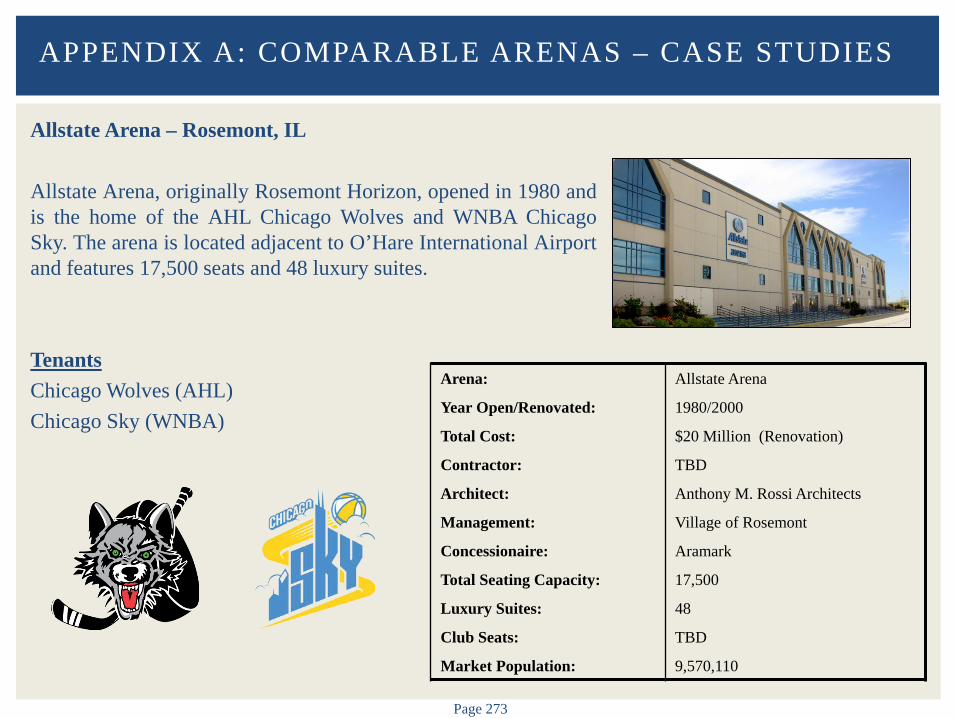
Page 273
Allstate Arena – Rosemont, IL Allstate Arena, originally Rosemont Horizon, opened in 1980 and is the home of the AHL Chicago Wolves and WNBA Chicago Sky. The arena is located adjacent to O’Hare International Airport and features 17,500 seats and 48 luxury suites. Tenants Chicago Wolves (AHL) Chicago Sky (WNBA)
APPENDIX A: COMPARABLE ARENAS – CASE STUDIES
Arena: Allstate Arena
Year Open/Renovated: 1980/2000
Total Cost: $20 Million (Renovation)
Contractor: TBD
Architect: Anthony M. Rossi Architects
Management: Village of Rosemont
Concessionaire: Aramark
Total Seating Capacity: 17,500
Luxury Suites: 48
Club Seats: TBD
Market Population: 9,570,110
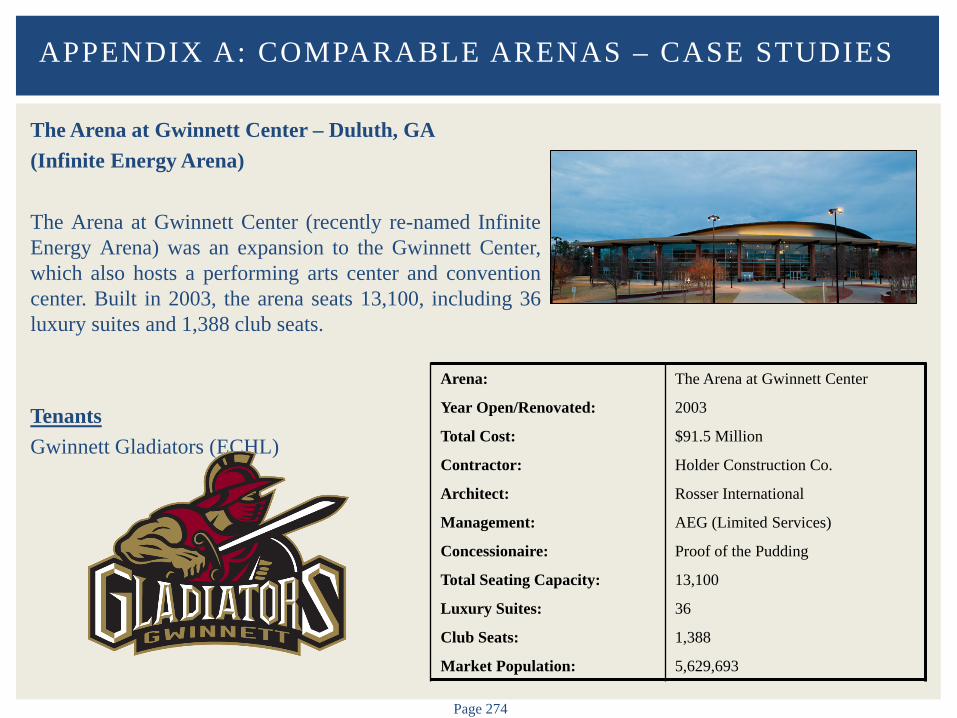
Page 274
The Arena at Gwinnett Center – Duluth, GA (Infinite Energy Arena) The Arena at Gwinnett Center (recently re-named Infinite Energy Arena) was an expansion to the Gwinnett Center, which also hosts a performing arts center and convention center. Built in 2003, the arena seats 13,100, including 36 luxury suites and 1,388 club seats. Tenants Gwinnett Gladiators (ECHL)
APPENDIX A: COMPARABLE ARENAS – CASE STUDIES
Arena: The Arena at Gwinnett Center
Year Open/Renovated: 2003
Total Cost: $91.5 Million
Contractor: Holder Construction Co.
Architect: Rosser International
Management: AEG (Limited Services)
Concessionaire: Proof of the Pudding
Total Seating Capacity: 13,100
Luxury Suites: 36
Club Seats: 1,388
Market Population: 5,629,693

Page 275
U.S. Bank Arena – Cincinnati, OH U.S. Bank Arena, built in 1975 and renovated in 1997, is the home of the ECHL Cincinnati Cyclones. The arena has a capacity of 12,823 along with 39 luxury suites. Tenants Cincinnati Cyclones (ECHL)
APPENDIX A: COMPARABLE ARENAS – CASE STUDIES
Arena: U.S. Bank Arena
Year Open/Renovated: 1975/1997
Total Cost: $14 Million (Renovation)
Contractor: Universal Contracting Corp.
Architect: Pattee Architects Inc.
Management: AEG
Concessionaire: Aramark
Total Seating Capacity: 12,823
Luxury Suites: 39
Club Seats: 0
Market Population: 2,148,094
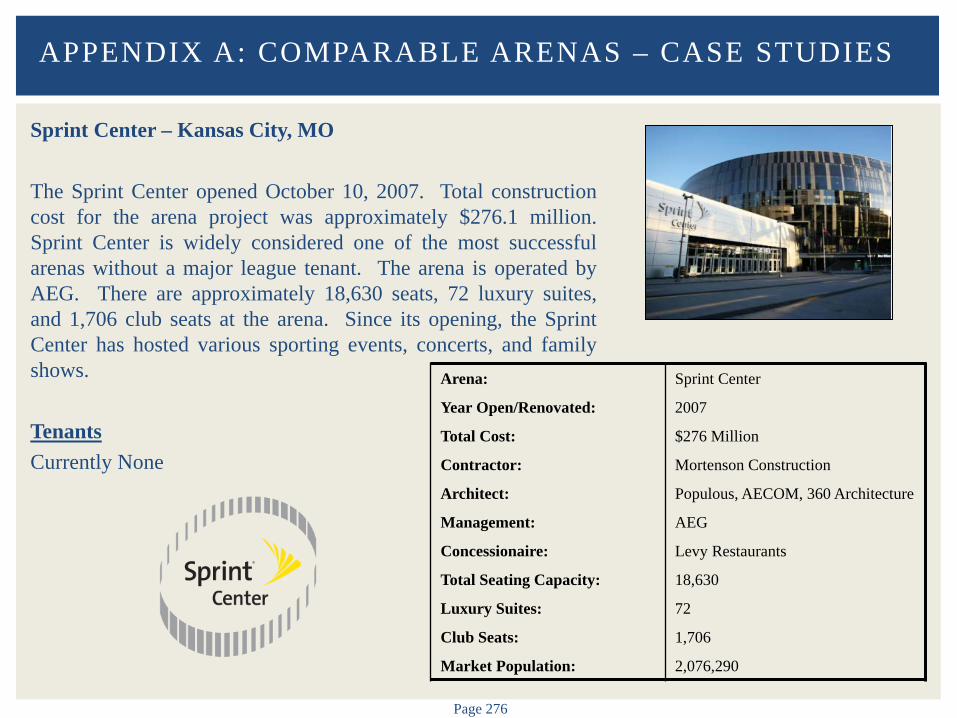
Page 276
Sprint Center – Kansas City, MO The Sprint Center opened October 10, 2007. Total construction cost for the arena project was approximately $276.1 million. Sprint Center is widely considered one of the most successful arenas without a major league tenant. The arena is operated by AEG. There are approximately 18,630 seats, 72 luxury suites, and 1,706 club seats at the arena. Since its opening, the Sprint Center has hosted various sporting events, concerts, and family shows. Tenants Currently None
APPENDIX A: COMPARABLE ARENAS – CASE STUDIES
Arena: Sprint Center
Year Open/Renovated: 2007
Total Cost: $276 Million
Contractor: Mortenson Construction
Architect: Populous, AECOM, 360 Architecture
Management: AEG
Concessionaire: Levy Restaurants
Total Seating Capacity: 18,630
Luxury Suites: 72
Club Seats: 1,706
Market Population: 2,076,290
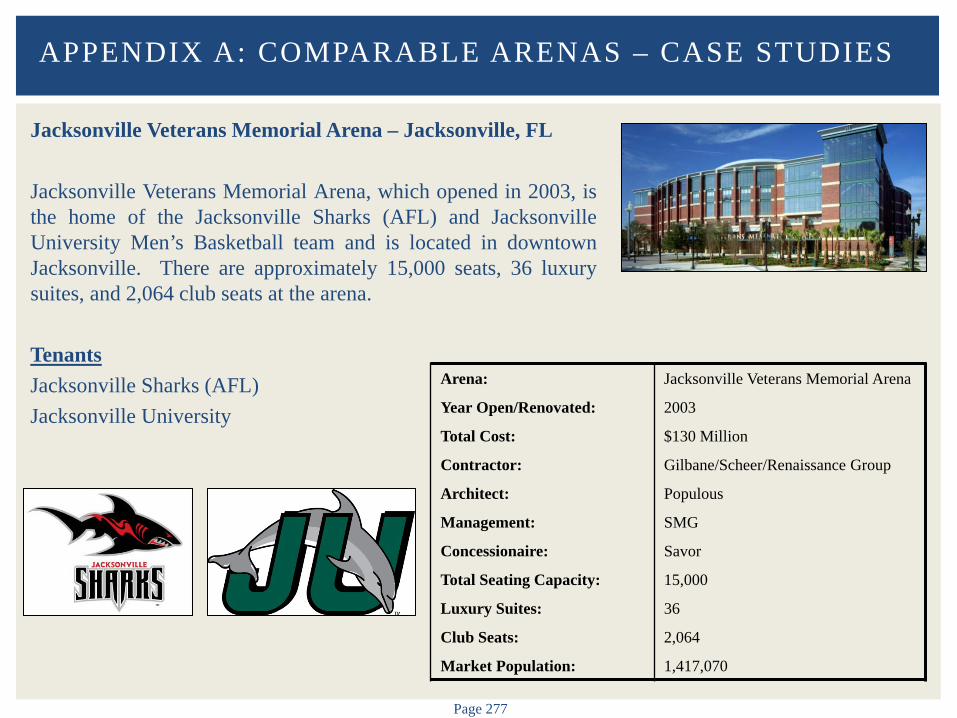
Page 277
Jacksonville Veterans Memorial Arena – Jacksonville, FL Jacksonville Veterans Memorial Arena, which opened in 2003, is the home of the Jacksonville Sharks (AFL) and Jacksonville University Men’s Basketball team and is located in downtown Jacksonville. There are approximately 15,000 seats, 36 luxury suites, and 2,064 club seats at the arena. Tenants Jacksonville Sharks (AFL) Jacksonville University
APPENDIX A: COMPARABLE ARENAS – CASE STUDIES
Arena: Jacksonville Veterans Memorial Arena
Year Open/Renovated: 2003
Total Cost: $130 Million
Contractor: Gilbane/Scheer/Renaissance Group
Architect: Populous
Management: SMG
Concessionaire: Savor
Total Seating Capacity: 15,000
Luxury Suites: 36
Club Seats: 2,064
Market Population: 1,417,070
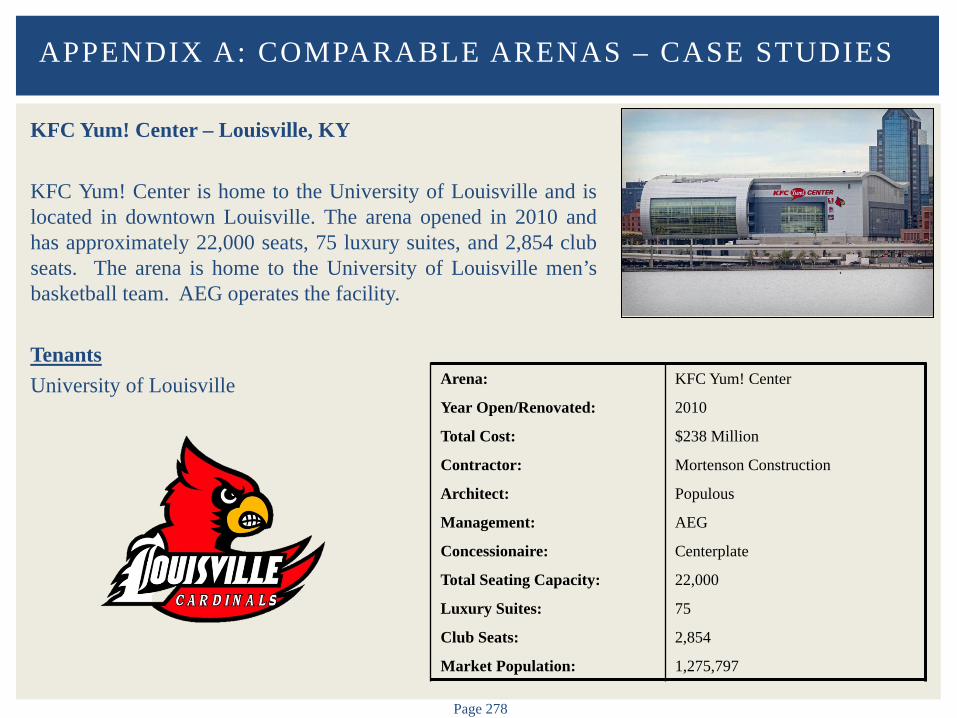
Page 278
KFC Yum! Center – Louisville, KY KFC Yum! Center is home to the University of Louisville and is located in downtown Louisville. The arena opened in 2010 and has approximately 22,000 seats, 75 luxury suites, and 2,854 club seats. The arena is home to the University of Louisville men’s basketball team. AEG operates the facility. Tenants University of Louisville
APPENDIX A: COMPARABLE ARENAS – CASE STUDIES
Arena: KFC Yum! Center
Year Open/Renovated: 2010
Total Cost: $238 Million
Contractor: Mortenson Construction
Architect: Populous
Management: AEG
Concessionaire: Centerplate
Total Seating Capacity: 22,000
Luxury Suites: 75
Club Seats: 2,854
Market Population: 1,275,797
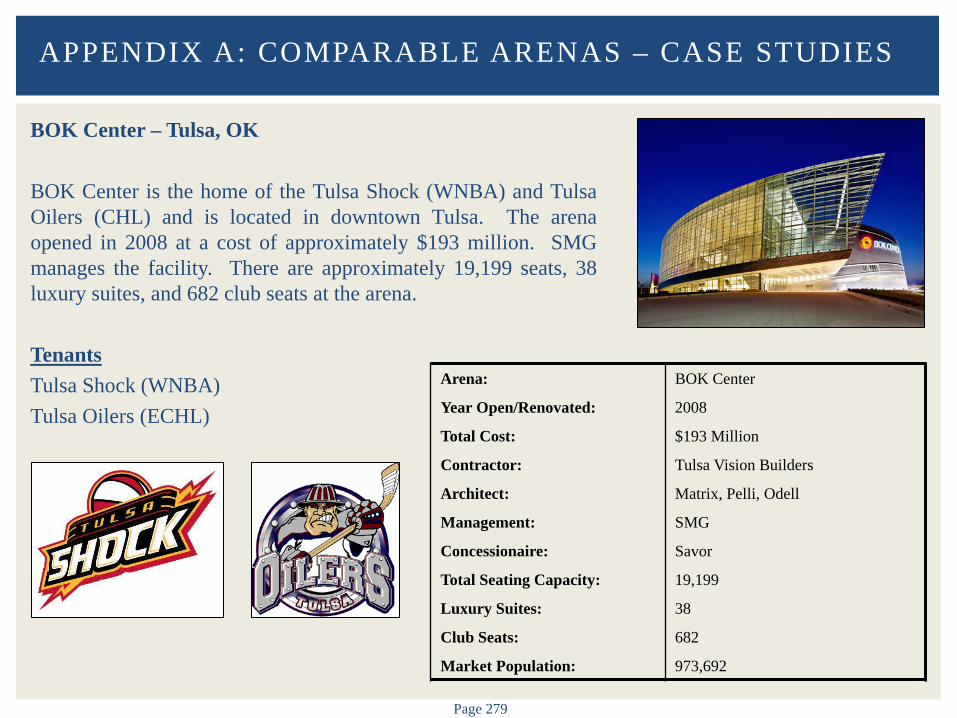
Page 279
BOK Center – Tulsa, OK BOK Center is the home of the Tulsa Shock (WNBA) and Tulsa Oilers (CHL) and is located in downtown Tulsa. The arena opened in 2008 at a cost of approximately $193 million. SMG manages the facility. There are approximately 19,199 seats, 38 luxury suites, and 682 club seats at the arena. Tenants Tulsa Shock (WNBA) Tulsa Oilers (ECHL)
APPENDIX A: COMPARABLE ARENAS – CASE STUDIES
Arena: BOK Center
Year Open/Renovated: 2008
Total Cost: $193 Million
Contractor: Tulsa Vision Builders
Architect: Matrix, Pelli, Odell
Management: SMG
Concessionaire: Savor
Total Seating Capacity: 19,199
Luxury Suites: 38
Club Seats: 682
Market Population: 973,692
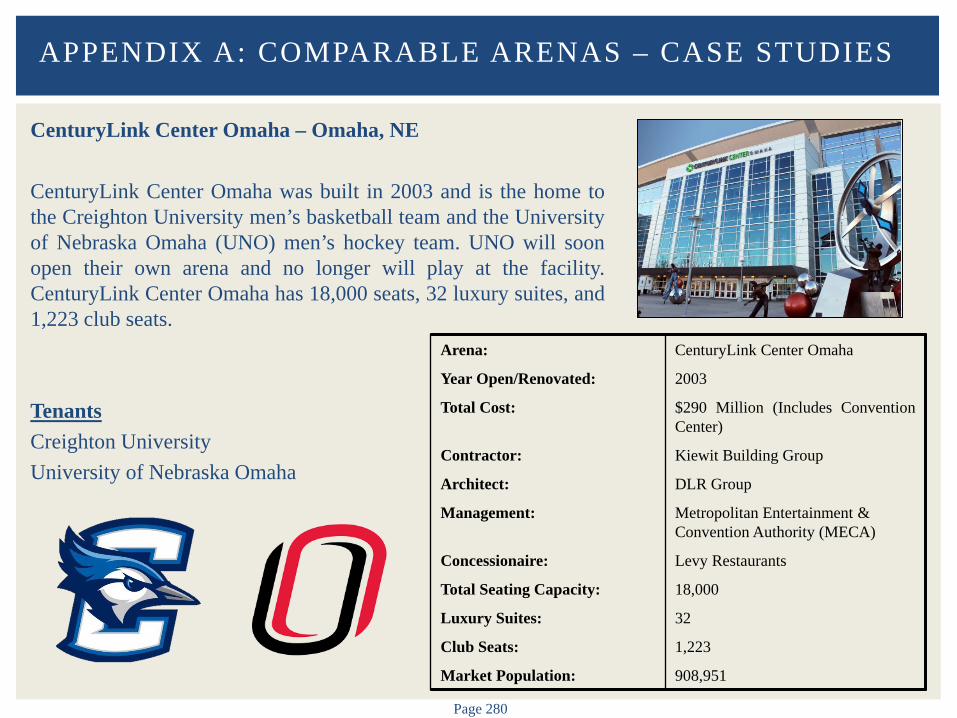
Page 280
CenturyLink Center Omaha – Omaha, NE CenturyLink Center Omaha was built in 2003 and is the home to the Creighton University men’s basketball team and the University of Nebraska Omaha (UNO) men’s hockey team. UNO will soon open their own arena and no longer will play at the facility. CenturyLink Center Omaha has 18,000 seats, 32 luxury suites, and 1,223 club seats. Tenants Creighton University University of Nebraska Omaha
APPENDIX A: COMPARABLE ARENAS – CASE STUDIES
Arena: CenturyLink Center Omaha
Year Open/Renovated: 2003
Total Cost: $290 Million (Includes Convention Center)
Contractor: Kiewit Building Group
Architect: DLR Group
Management: Metropolitan Entertainment & Convention Authority (MECA)
Concessionaire: Levy Restaurants
Total Seating Capacity: 18,000
Luxury Suites: 32
Club Seats: 1,223
Market Population: 908,951

Page 281
Colonial Life Arena – Columbia, SC Colonial Life Arena is home to the University of South Carolina and is located on campus in downtown Columbia. The arena opened in 2002. Colonial Life Arena seats approximately 18,000 with 45 luxury suites and 300 club seats. Tenants University of South Carolina
APPENDIX A: COMPARABLE ARENAS – CASE STUDIES
Arena: Colonial Life Arena
Year Open/Renovated: 2002
Total Cost: $65 Million
Contractor: Beers Construction
Architect: Rosser International
Management: Global Spectrum
Concessionaire: Centerplate
Total Seating Capacity: 18,000
Luxury Suites: 45
Club Seats: 300
Market Population: 806,579
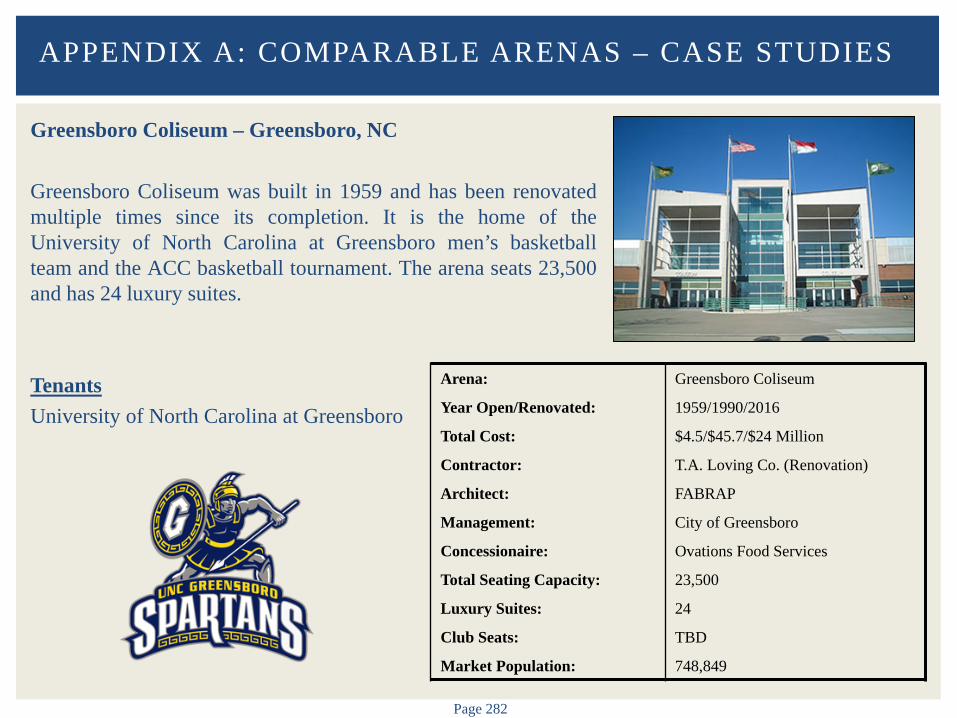
Page 282
Greensboro Coliseum – Greensboro, NC Greensboro Coliseum was built in 1959 and has been renovated multiple times since its completion. It is the home of the University of North Carolina at Greensboro men’s basketball team and the ACC basketball tournament. The arena seats 23,500 and has 24 luxury suites. Tenants University of North Carolina at Greensboro
APPENDIX A: COMPARABLE ARENAS – CASE STUDIES
Arena: Greensboro Coliseum
Year Open/Renovated: 1959/1990/2016
Total Cost: $4.5/$45.7/$24 Million
Contractor: T.A. Loving Co. (Renovation)
Architect: FABRAP
Management: City of Greensboro
Concessionaire: Ovations Food Services
Total Seating Capacity: 23,500
Luxury Suites: 24
Club Seats: TBD
Market Population: 748,849
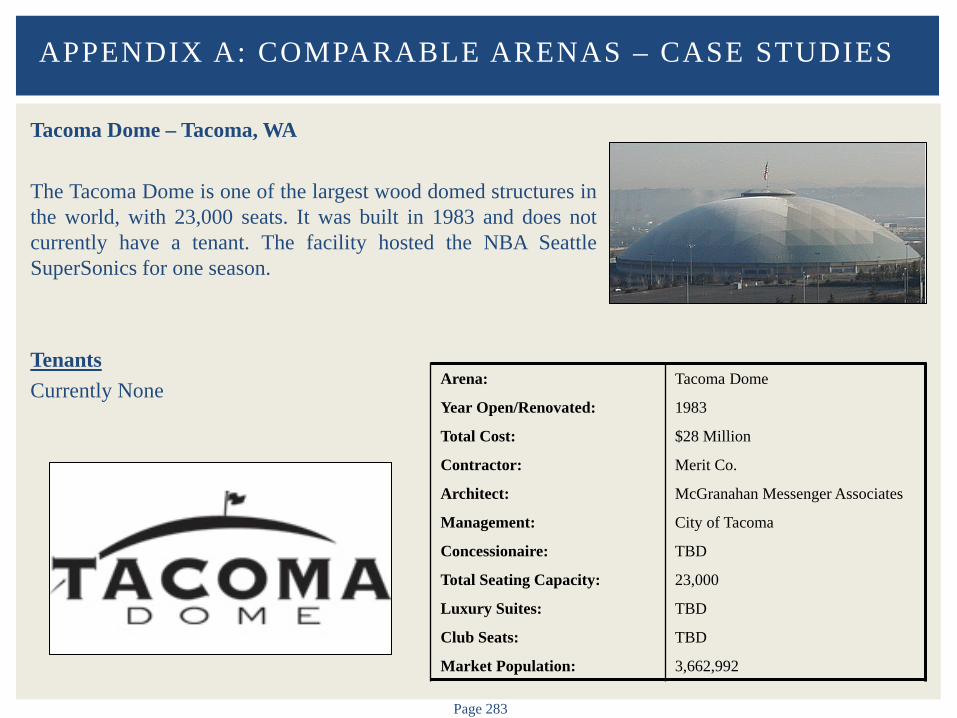
Page 283
Tacoma Dome – Tacoma, WA The Tacoma Dome is one of the largest wood domed structures in the world, with 23,000 seats. It was built in 1983 and does not currently have a tenant. The facility hosted the NBA Seattle SuperSonics for one season. Tenants Currently None
APPENDIX A: COMPARABLE ARENAS – CASE STUDIES
Arena: Tacoma Dome
Year Open/Renovated: 1983
Total Cost: $28 Million
Contractor: Merit Co.
Architect: McGranahan Messenger Associates
Management: City of Tacoma
Concessionaire: TBD
Total Seating Capacity: 23,000
Luxury Suites: TBD
Club Seats: TBD
Market Population: 3,662,992
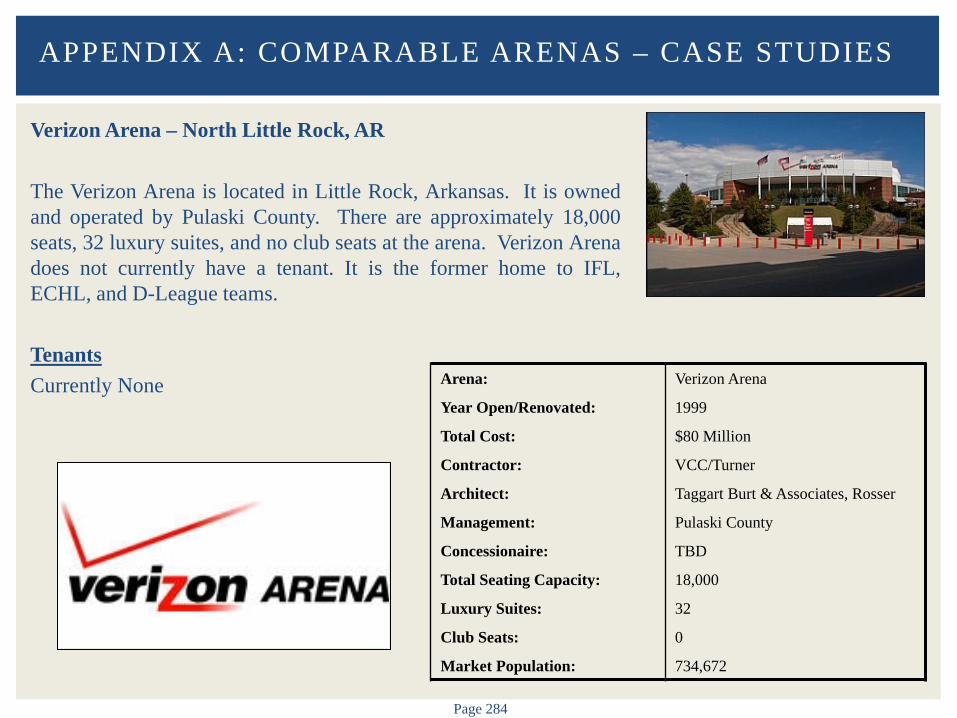
Page 284
Verizon Arena – North Little Rock, AR The Verizon Arena is located in Little Rock, Arkansas. It is owned and operated by Pulaski County. There are approximately 18,000 seats, 32 luxury suites, and no club seats at the arena. Verizon Arena does not currently have a tenant. It is the former home to IFL, ECHL, and D-League teams. Tenants Currently None
APPENDIX A: COMPARABLE ARENAS – CASE STUDIES
Arena: Verizon Arena
Year Open/Renovated: 1999
Total Cost: $80 Million
Contractor: VCC/Turner
Architect: Taggart Burt & Associates, Rosser
Management: Pulaski County
Concessionaire: TBD
Total Seating Capacity: 18,000
Luxury Suites: 32
Club Seats: 0
Market Population: 734,672

Page 285
Intrust Bank Arena – Wichita, KS Intrust Bank Arena is located in downtown Wichita and is home to the CHL Wichita Thunder and CIF Force. The arena, which opened in 2010, has approximately 15,000 seats, 22 luxury suites, and 150 club seats and is managed by SMG. Tenants Wichita Thunder (CHL) Wichita Force (CIF)
APPENDIX A: COMPARABLE ARENAS – CASE STUDIES
Arena: Intrust Bank Arena
Year Open/Renovated: 2010
Total Cost: $205.5 Million
Contractor: Hunt/Dodlinger
Architect: Populous
Management: SMG
Concessionaire: Savor
Total Seating Capacity: 15,000
Luxury Suites: 22
Club Seats: 150
Market Population: 640,274

Page 286
Wells Fargo Arena – Des Moines, IA Wells Fargo arena is the home of the Iowa Barnstormers (AFL), Iowa Wild (AHL), and Iowa Energy (D-League) and is located in downtown Des Moines. The arena opened in 2005 and is operated by Global Spectrum. The arena hosts a number of minor league tenants, including the D-League Iowa Energy, AHL Iowa Wild, and IFL Iowa Barnstormers. Tenants Iowa Energy (D-League) Iowa Wild (AHL) Iowa Barnstormers (IFL)
APPENDIX A: COMPARABLE ARENAS – CASE STUDIES
Arena: Wells Fargo Arena
Year Open/Renovated: 2005
Total Cost: $117 Million
Contractor: Not Confirmed
Architect: Populous
Management: Global Spectrum
Concessionaire: Ovations Food Services
Total Seating Capacity: 16,110
Luxury Suites: 36
Club Seats: 630
Market Population: 614,231

Page 287
Pinnacle Bank Arena – Lincoln, NE Pinnacle Bank Arena is the home of the University of Nebraska – Lincoln and is located in downtown Lincoln. The arena opened in 2013. There are approximately 16,000 seats, 36 luxury suites, and 832 club seats in the arena. The arena is managed by SMG. Tenants University of Nebraska – Lincoln
APPENDIX A: COMPARABLE ARENAS – CASE STUDIES
Arena: Pinnacle Bank Arena
Year Open/Renovated: 2013
Total Cost: $181 Million (Arena Only)
Contractor: Mortenson Construction/Hampton
Architect: DLR Group
Management: SMG
Concessionaire: Savor
Total Seating Capacity: 16,000
Luxury Suites: 36
Club Seats: 832
Market Population: 319,691
APPENDIX B: COMPARABLE ARENAS –
DEMOGRAPHICS

Page 289
Comparable Arena Market Demographics
Evaluated Demographics of Comparable Arena Markets Core Base Statistical Area (CBSA) Designation 30 Mile Geographic Ring Designation
The Selected Comparable Arenas and CBSA Market are Summarized Below
APPENDIX B: COMPARABLE ARENAS – DEMOGRAPHICS
Arena Market Built Capacity Suites Club Seats Tenants
KeyArena Seattle-Tacoma-Bellevue, WA 1962/1995 17,000 48 2,439 WNBA, UniversityThe Forum Los Angeles-Long Beach et al, CA 1967/1988/2014 17,500 TBD TBD NAIZOD Center - (1) New York-Newark et al, NY-NJ-PA 1981 20,049 29 TBD NAAllstate Arena Chicago et al, IL-IN-WI 1980/2000 17,500 48 0 AHL, WNBAThe Arena at Gwinnett Center Atlanta-Sandy Springs et al, GA 2003 13,100 36 1,388 ECHLU.S. Bank Arena Cincinnati, OH-KY-IN 1975/1997 12,823 39 0 ECHLSprint Center Kansas City, MO-KS 2007 18,630 72 1,706 NAJacksonville Veterans Memorial Arena Jacksonville, FL 2003 15,000 36 2,064 AFL, UniversityKFC Yum! Center Louisville et al, KY-IN 2010 22,000 75 2,854 UniversityBOK Center Tulsa, OK 2008 19,199 38 682 WNBA, ECHLCenturyLink Center Omaha Omaha-Council Bluffs, NE-IA 2003 18,000 32 1,223 UniversityColonial Life Arena Columbia, SC 2002 18,000 45 300 UniversityGreensboro Coliseum Greensboro-High Point, NC 1959/1990/2016 23,500 24 TBD UniversityTacoma Dome Seattle-Tacoma-Bellevue, WA 1983 23,000 TBD TBD NAVerizon Arena Little Rock et al, AR 1999 18,000 32 0 NAIntrust Bank Arena Wichita, KS 2010 15,000 22 150 CHL, CIFWells Fargo Arena Des Moines-West Des Moines, IA 2005 16,110 36 630 D-League, AHL, IFLPinnacle Bank Arena Lincoln, NE 2013 16,000 36 832 University(1) IZOD Center is expected to close in 2015.Source: Resource Guide Live, Industry Research.

Page 290
Comparable Arena Market Demographics – CBSA Population and Households
BB&T Center’s Market is the 4th Largest in Terms of Population and Households and is Expected to
Grow Faster than the Comparable Market Average
APPENDIX B: COMPARABLE ARENAS – DEMOGRAPHICS
Arena
2015 Population
(000s) Rank
2020 Population
(000s) Rank
Est. % Growth
2015-2020 Rank
2015 Households
(000s) Rank
2020 Households
(000s) Rank
Est. % Growth
2015-2020 RankIZOD Center 20,114.5 1 20,652.1 1 2.67% 16 7,372.9 1 7,585.9 1 2.89% 16The Forum 13,296.9 2 13,824.5 2 3.97% 13 4,391.2 2 4,573.1 2 4.14% 13Allstate Arena 9,570.1 3 9,679.8 3 1.15% 19 3,541.3 3 3,599.7 3 1.65% 19BB&T Center 5,926.2 4 6,303.8 4 6.37% 1 2,226.1 4 2,367.6 4 6.35% 3Gwinnett Center 5,629.7 5 5,962.7 5 5.91% 5 2,077.0 5 2,205.2 5 6.17% 4KeyArena 3,663.0 6 3,888.8 6 6.16% 2 1,448.4 6 1,540.6 6 6.37% 1Tacoma Dome 3,663.0 6 3,888.8 6 6.16% 2 1,448.4 6 1,540.6 6 6.37% 1U.S. Bank Arena 2,148.1 8 2,181.2 8 1.54% 18 840.4 8 854.8 8 1.72% 18Sprint Center 2,076.3 9 2,139.5 9 3.04% 15 817.1 9 843.4 9 3.21% 15Jacksonville Veterans Memorial Arena 1,417.1 10 1,495.5 10 5.53% 6 554.5 10 586.7 10 5.80% 6KFC Yum! Center 1,275.8 11 1,315.7 11 3.13% 14 514.1 11 531.4 11 3.36% 14BOK Center 973.7 12 1,014.6 12 4.20% 10 381.3 12 397.5 12 4.26% 11CenturyLink Center Omaha 909.0 13 950.9 13 4.62% 9 352.1 13 369.1 13 4.83% 9Colonial Life Arena 806.6 14 849.4 14 5.31% 7 311.6 14 329.4 14 5.73% 7Greensboro Coliseum 748.8 15 779.6 15 4.11% 12 301.6 15 314.6 15 4.32% 10Verizon Arena 734.7 16 765.4 16 4.18% 11 293.7 16 306.2 16 4.24% 12Intrust Bank Arena 640.3 17 651.9 17 1.81% 17 247.3 17 252.0 18 1.89% 17Wells Fargo Arena 614.2 18 651.2 18 6.02% 4 240.4 18 255.0 17 6.05% 5Pinnacle Bank Arena 319.7 19 336.5 19 5.25% 8 126.9 19 133.9 19 5.52% 8
Average (Ex. BB&T Center) 3,811.2 3,946.0 4.15% 1,403.3 1,456.6 4.36%Sources: Claritas 2015.

Page 291
Comparable Arena Market Demographics – CBSA Income
BB&T Center’s Market has Low Income Levels and an Above Average Number of High Income
Households
APPENDIX B: COMPARABLE ARENAS – DEMOGRAPHICS
Arena
Average Household
Income Rank
Median Household
Income Rank
HHs w/ Income
$100,000+ (000s) Rank
IZOD Center $95,428 1 $66,610 3 2,430.8 1KeyArena $89,931 2 $68,280 1 457.8 5Tacoma Dome $89,931 2 $68,280 1 457.8 5The Forum $83,342 4 $58,860 6 1,199.2 2Allstate Arena $83,133 5 $61,244 5 976.7 3Wells Fargo Arena $77,800 6 $61,901 4 60.9 14Gwinnett Center $76,940 7 $55,755 9 496.1 4CenturyLink Center Omaha $74,728 8 $58,352 7 83.1 12Sprint Center $73,853 9 $56,762 8 188.4 9U.S. Bank Arena $73,277 10 $55,192 10 192.8 8Pinnacle Bank Arena $71,803 11 $54,256 11 27.2 19BB&T Center $69,302 12 $47,423 18 447.3 7KFC Yum! Center $68,075 13 $50,632 12 101.5 11Jacksonville Veterans Memorial Arena $67,330 14 $49,738 14 106.3 10BOK Center $65,854 15 $48,778 17 68.9 13Verizon Arena $65,701 16 $49,863 13 55.7 16Colonial Life Arena $65,093 17 $49,380 15 58.1 15Intrust Bank Arena $63,821 18 $49,124 16 42.6 17Greensboro Coliseum $57,803 19 $42,745 19 42.2 18
Average (Ex. BB&T Center) $74,658 $55,875 391.5Sources: Claritas 2015.

Page 292
Comparable Arena Market Demographics – CBSA Age
BB&T Center’s Market has the Oldest Population of the Comparable Markets
APPENDIX B: COMPARABLE ARENAS – DEMOGRAPHICS
ArenaAverage
Age RankMedian
Age RankPinnacle Bank Arena 36.6 1 33.8 1Gwinnett Center 36.6 1 36.1 5CenturyLink Center Omaha 36.8 3 35.4 2Wells Fargo Arena 37.1 4 36.0 4Intrust Bank Arena 37.2 5 35.6 3The Forum 37.5 6 36.3 6Allstate Arena 37.8 7 36.9 9Verizon Arena 37.9 8 36.7 7Colonial Life Arena 37.9 8 36.7 7Sprint Center 38.0 10 37.4 11BOK Center 38.1 11 37.1 10Tacoma Dome 38.4 12 37.8 12KeyArena 38.4 12 37.8 12U.S. Bank Arena 38.4 12 37.9 14Jacksonville Veterans Memorial Arena 38.8 15 38.4 15IZOD Center 39.1 16 38.4 15Greensboro Coliseum 39.1 16 38.6 17KFC Yum! Center 39.2 18 39.0 18BB&T Center 40.8 19 40.7 19
Average (Ex. BB&T Center) 37.9 37.0Sources: Claritas 2015.
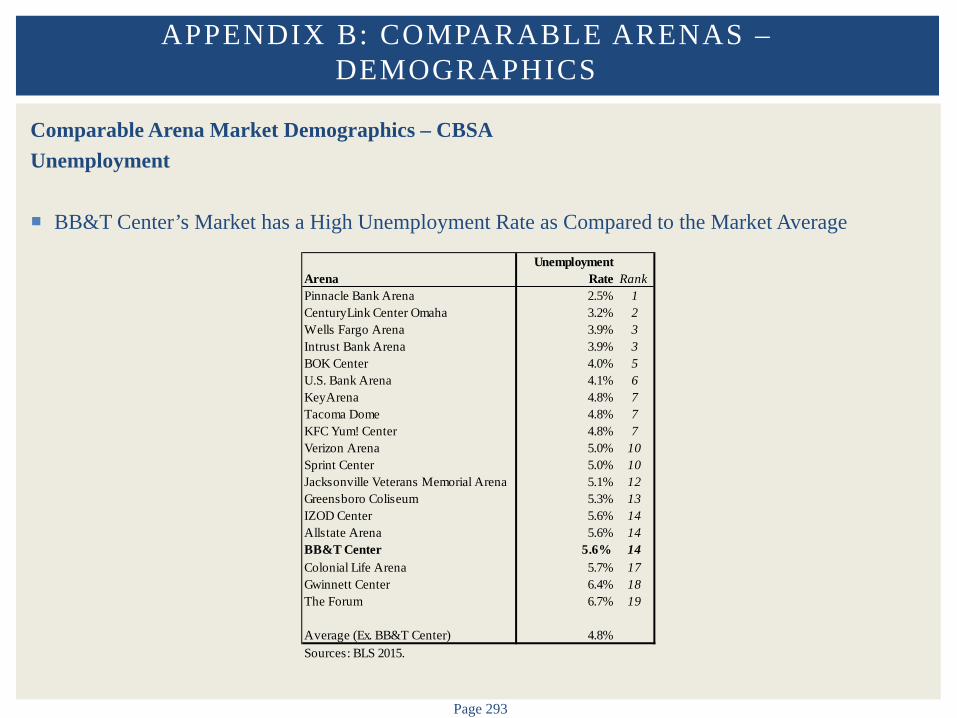
Page 293
Comparable Arena Market Demographics – CBSA Unemployment
BB&T Center’s Market has a High Unemployment Rate as Compared to the Market Average
APPENDIX B: COMPARABLE ARENAS – DEMOGRAPHICS
ArenaUnemployment
Rate RankPinnacle Bank Arena 2.5% 1CenturyLink Center Omaha 3.2% 2Wells Fargo Arena 3.9% 3Intrust Bank Arena 3.9% 3BOK Center 4.0% 5U.S. Bank Arena 4.1% 6KeyArena 4.8% 7Tacoma Dome 4.8% 7KFC Yum! Center 4.8% 7Verizon Arena 5.0% 10Sprint Center 5.0% 10Jacksonville Veterans Memorial Arena 5.1% 12Greensboro Coliseum 5.3% 13IZOD Center 5.6% 14Allstate Arena 5.6% 14BB&T Center 5.6% 14Colonial Life Arena 5.7% 17Gwinnett Center 6.4% 18The Forum 6.7% 19
Average (Ex. BB&T Center) 4.8%Sources: BLS 2015.

Page 294
Comparable Arena Market Demographics – CBSA Economy Size (GDP)
BB&T Center’s Market is Above Average in Terms of GDP
APPENDIX B: COMPARABLE ARENAS – DEMOGRAPHICS
Arena
Economy Size (GDP-
Billions) RankIZOD Center $1,471.2 1The Forum $826.8 2Allstate Arena $590.2 3Gwinnett Center $307.2 4KeyArena $285.0 5Tacoma Dome $285.0 5BB&T Center $281.1 7U.S. Bank Arena $119.1 8Sprint Center $117.3 9KFC Yum! Center $64.6 10Jacksonville Veterans Memorial Arena $62.1 11BOK Center $55.0 12CenturyLink Center Omaha $54.8 13Wells Fargo Arena $42.7 14Verizon Arena $40.9 15Greensboro Coliseum $38.0 16Colonial Life Arena $35.4 17Intrust Bank Arena $31.5 18Pinnacle Bank Arena $16.6 19
Average (Ex. BB&T Center) $246.9Source: U.S. BEA.
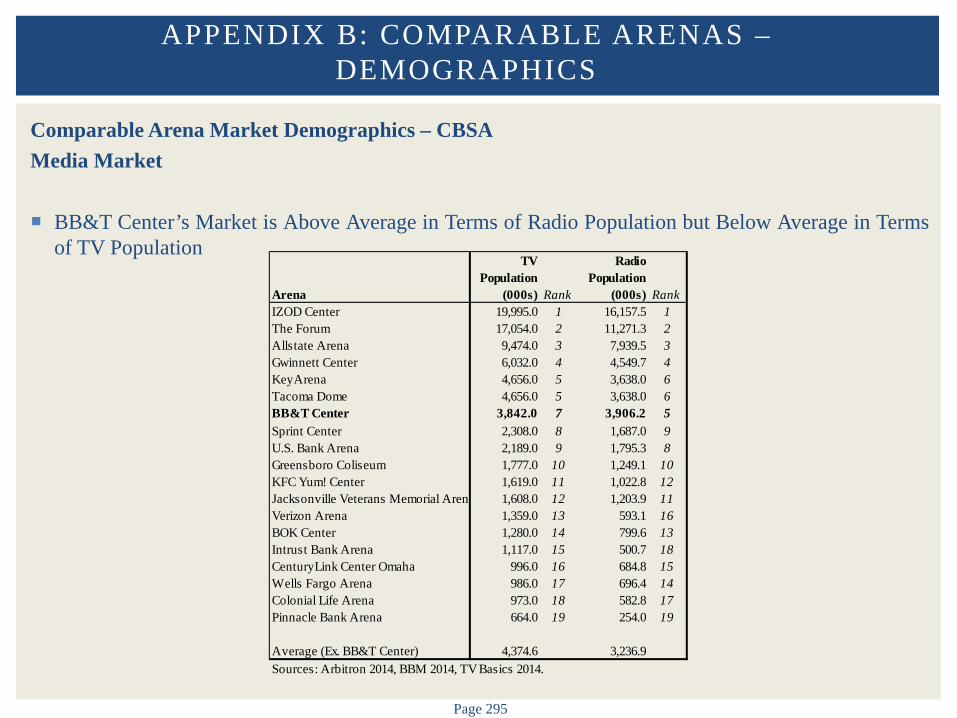
Page 295
Comparable Arena Market Demographics – CBSA Media Market
BB&T Center’s Market is Above Average in Terms of Radio Population but Below Average in Terms
of TV Population
APPENDIX B: COMPARABLE ARENAS – DEMOGRAPHICS
Arena
TV Population
(000s) Rank
Radio Population
(000s) RankIZOD Center 19,995.0 1 16,157.5 1The Forum 17,054.0 2 11,271.3 2Allstate Arena 9,474.0 3 7,939.5 3Gwinnett Center 6,032.0 4 4,549.7 4KeyArena 4,656.0 5 3,638.0 6Tacoma Dome 4,656.0 5 3,638.0 6BB&T Center 3,842.0 7 3,906.2 5Sprint Center 2,308.0 8 1,687.0 9U.S. Bank Arena 2,189.0 9 1,795.3 8Greensboro Coliseum 1,777.0 10 1,249.1 10KFC Yum! Center 1,619.0 11 1,022.8 12Jacksonville Veterans Memorial Arena 1,608.0 12 1,203.9 11Verizon Arena 1,359.0 13 593.1 16BOK Center 1,280.0 14 799.6 13Intrust Bank Arena 1,117.0 15 500.7 18CenturyLink Center Omaha 996.0 16 684.8 15Wells Fargo Arena 986.0 17 696.4 14Colonial Life Arena 973.0 18 582.8 17Pinnacle Bank Arena 664.0 19 254.0 19
Average (Ex. BB&T Center) 4,374.6 3,236.9Sources: Arbitron 2014, BBM 2014, TV Basics 2014.
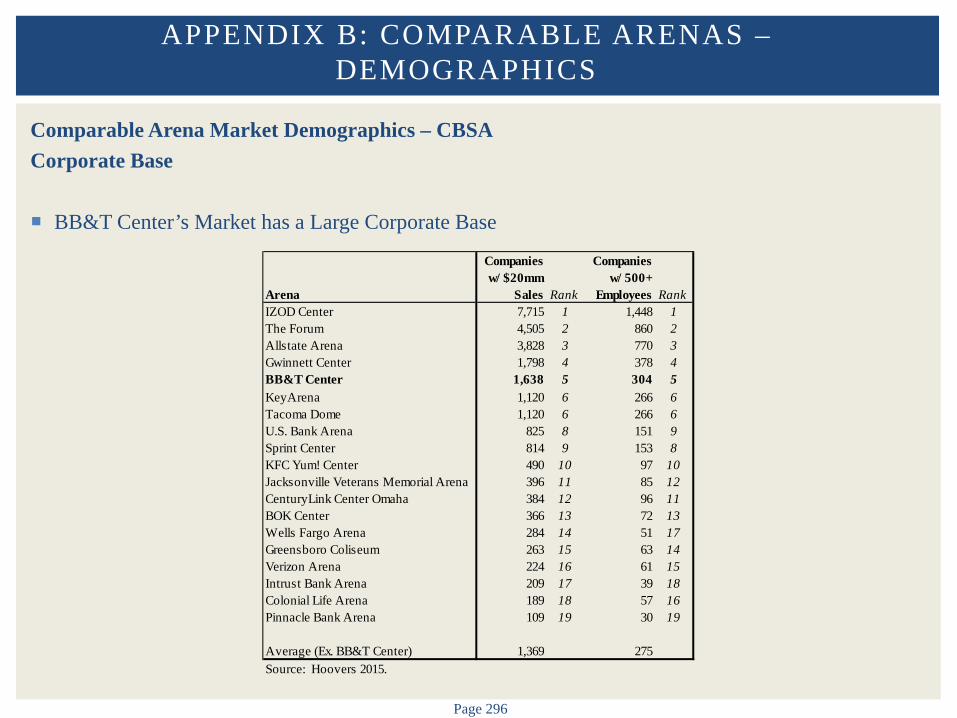
Page 296
Comparable Arena Market Demographics – CBSA Corporate Base
BB&T Center’s Market has a Large Corporate Base
APPENDIX B: COMPARABLE ARENAS – DEMOGRAPHICS
Arena
Companies w/ $20mm
Sales Rank
Companies w/ 500+
Employees RankIZOD Center 7,715 1 1,448 1The Forum 4,505 2 860 2Allstate Arena 3,828 3 770 3Gwinnett Center 1,798 4 378 4BB&T Center 1,638 5 304 5KeyArena 1,120 6 266 6Tacoma Dome 1,120 6 266 6U.S. Bank Arena 825 8 151 9Sprint Center 814 9 153 8KFC Yum! Center 490 10 97 10Jacksonville Veterans Memorial Arena 396 11 85 12CenturyLink Center Omaha 384 12 96 11BOK Center 366 13 72 13Wells Fargo Arena 284 14 51 17Greensboro Coliseum 263 15 63 14Verizon Arena 224 16 61 15Intrust Bank Arena 209 17 39 18Colonial Life Arena 189 18 57 16Pinnacle Bank Arena 109 19 30 19
Average (Ex. BB&T Center) 1,369 275Source: Hoovers 2015.
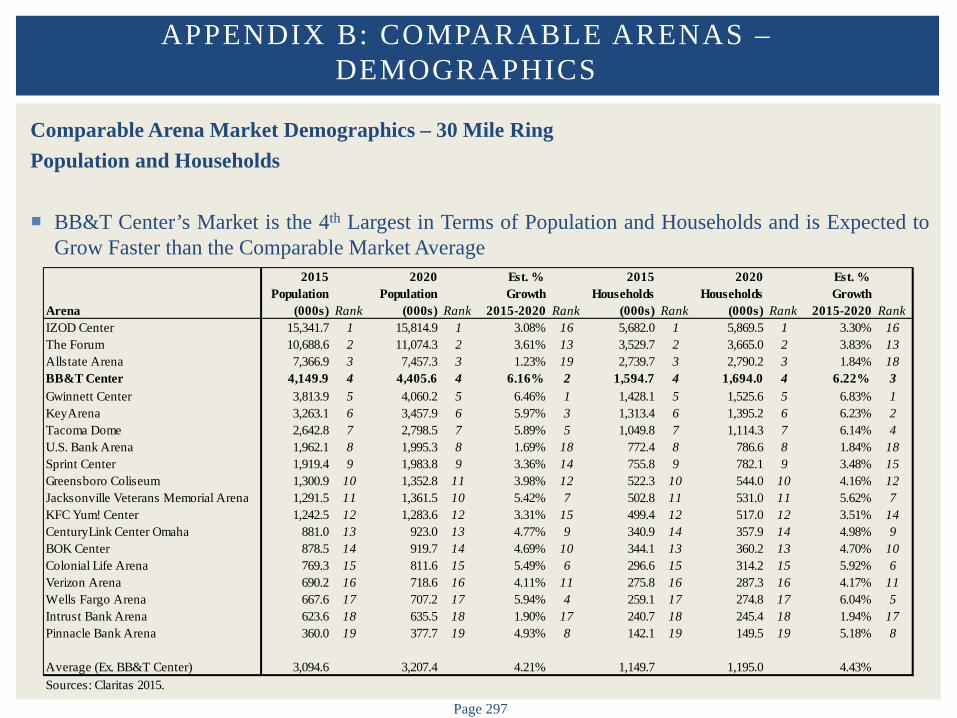
Page 297
Comparable Arena Market Demographics – 30 Mile Ring Population and Households
BB&T Center’s Market is the 4th Largest in Terms of Population and Households and is Expected to
Grow Faster than the Comparable Market Average
APPENDIX B: COMPARABLE ARENAS – DEMOGRAPHICS
Arena
2015 Population
(000s) Rank
2020 Population
(000s) Rank
Est. % Growth
2015-2020 Rank
2015 Households
(000s) Rank
2020 Households
(000s) Rank
Est. % Growth
2015-2020 RankIZOD Center 15,341.7 1 15,814.9 1 3.08% 16 5,682.0 1 5,869.5 1 3.30% 16The Forum 10,688.6 2 11,074.3 2 3.61% 13 3,529.7 2 3,665.0 2 3.83% 13Allstate Arena 7,366.9 3 7,457.3 3 1.23% 19 2,739.7 3 2,790.2 3 1.84% 18BB&T Center 4,149.9 4 4,405.6 4 6.16% 2 1,594.7 4 1,694.0 4 6.22% 3Gwinnett Center 3,813.9 5 4,060.2 5 6.46% 1 1,428.1 5 1,525.6 5 6.83% 1KeyArena 3,263.1 6 3,457.9 6 5.97% 3 1,313.4 6 1,395.2 6 6.23% 2Tacoma Dome 2,642.8 7 2,798.5 7 5.89% 5 1,049.8 7 1,114.3 7 6.14% 4U.S. Bank Arena 1,962.1 8 1,995.3 8 1.69% 18 772.4 8 786.6 8 1.84% 18Sprint Center 1,919.4 9 1,983.8 9 3.36% 14 755.8 9 782.1 9 3.48% 15Greensboro Coliseum 1,300.9 10 1,352.8 11 3.98% 12 522.3 10 544.0 10 4.16% 12Jacksonville Veterans Memorial Arena 1,291.5 11 1,361.5 10 5.42% 7 502.8 11 531.0 11 5.62% 7KFC Yum! Center 1,242.5 12 1,283.6 12 3.31% 15 499.4 12 517.0 12 3.51% 14CenturyLink Center Omaha 881.0 13 923.0 13 4.77% 9 340.9 14 357.9 14 4.98% 9BOK Center 878.5 14 919.7 14 4.69% 10 344.1 13 360.2 13 4.70% 10Colonial Life Arena 769.3 15 811.6 15 5.49% 6 296.6 15 314.2 15 5.92% 6Verizon Arena 690.2 16 718.6 16 4.11% 11 275.8 16 287.3 16 4.17% 11Wells Fargo Arena 667.6 17 707.2 17 5.94% 4 259.1 17 274.8 17 6.04% 5Intrust Bank Arena 623.6 18 635.5 18 1.90% 17 240.7 18 245.4 18 1.94% 17Pinnacle Bank Arena 360.0 19 377.7 19 4.93% 8 142.1 19 149.5 19 5.18% 8
Average (Ex. BB&T Center) 3,094.6 3,207.4 4.21% 1,149.7 1,195.0 4.43%Sources: Claritas 2015.

Page 298
Comparable Arena Market Demographics – 30 Mile Ring Income
BB&T Center’s Market has Low Income Levels and an Average Number of High Income Households
APPENDIX B: COMPARABLE ARENAS – DEMOGRAPHICS
Arena
Average Household
Income Rank
Median Household
Income Rank
HHs w/ Income
$100,000+ (000s) Rank
IZOD Center $91,694 1 $61,954 3 1,738.3 1KeyArena $91,626 2 $68,848 1 425.7 4Allstate Arena $85,856 3 $61,569 4 781.3 3Tacoma Dome $82,913 4 $63,370 2 290.1 7Gwinnett Center $81,729 5 $57,643 7 373.4 5The Forum $78,438 6 $54,943 10 876.5 2Wells Fargo Arena $76,618 7 $60,896 5 64.2 15CenturyLink Center Omaha $74,832 8 $58,321 6 80.6 12Sprint Center $74,690 9 $57,205 8 177.8 8U.S. Bank Arena $73,339 10 $55,159 9 177.6 9Pinnacle Bank Arena $71,892 11 $54,863 11 30.6 19KFC Yum! Center $68,348 12 $50,811 12 99.4 10Jacksonville Veterans Memorial Arena $68,042 13 $50,327 13 99.1 11BOK Center $67,575 14 $49,941 15 65.1 14BB&T Center $66,905 15 $45,816 18 303.2 6Verizon Arena $66,020 16 $49,719 16 53.0 17Colonial Life Arena $65,783 17 $50,061 14 56.3 16Intrust Bank Arena $63,773 18 $48,974 17 41.5 18Greensboro Coliseum $58,542 19 $42,699 19 74.6 13
Average (Ex. BB&T Center) $74,540 $55,406 305.8Sources: Claritas 2015.
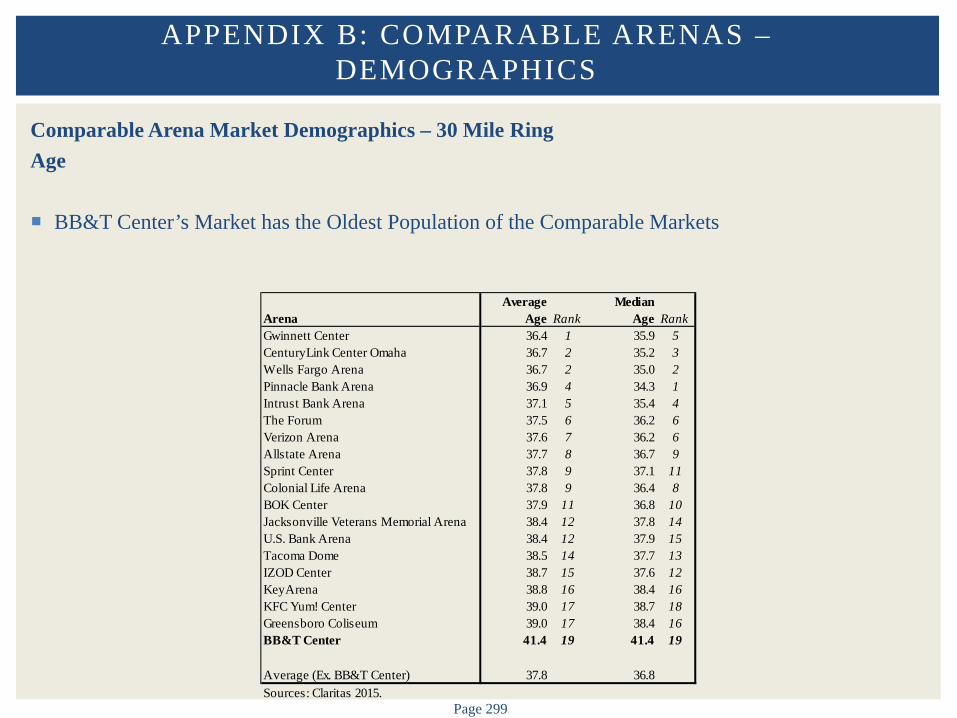
Page 299
Comparable Arena Market Demographics – 30 Mile Ring Age
BB&T Center’s Market has the Oldest Population of the Comparable Markets
APPENDIX B: COMPARABLE ARENAS – DEMOGRAPHICS
ArenaAverage
Age RankMedian
Age RankGwinnett Center 36.4 1 35.9 5CenturyLink Center Omaha 36.7 2 35.2 3Wells Fargo Arena 36.7 2 35.0 2Pinnacle Bank Arena 36.9 4 34.3 1Intrust Bank Arena 37.1 5 35.4 4The Forum 37.5 6 36.2 6Verizon Arena 37.6 7 36.2 6Allstate Arena 37.7 8 36.7 9Sprint Center 37.8 9 37.1 11Colonial Life Arena 37.8 9 36.4 8BOK Center 37.9 11 36.8 10Jacksonville Veterans Memorial Arena 38.4 12 37.8 14U.S. Bank Arena 38.4 12 37.9 15Tacoma Dome 38.5 14 37.7 13IZOD Center 38.7 15 37.6 12KeyArena 38.8 16 38.4 16KFC Yum! Center 39.0 17 38.7 18Greensboro Coliseum 39.0 17 38.4 16BB&T Center 41.4 19 41.4 19
Average (Ex. BB&T Center) 37.8 36.8Sources: Claritas 2015.

Page 300
Comparable Arena Market Demographics – 30 Mile Ring Corporate Base
BB&T Center’s Market has a Large Corporate Base
APPENDIX B: COMPARABLE ARENAS – DEMOGRAPHICS
Arena
Companies w/ $20mm
Sales Rank
Companies w/ 500+
Employees RankIZOD Center 6,732 1 1,268 1The Forum 4,032 2 764 2Allstate Arena 3,529 3 696 3Gwinnett Center 1,701 4 343 4BB&T Center 1,318 5 248 6KeyArena 1,083 6 252 5Tacoma Dome 968 7 243 7U.S. Bank Arena 808 8 150 10Sprint Center 797 9 151 9KFC Yum! Center 493 10 98 13Greensboro Coliseum 434 11 104 11CenturyLink Center Omaha 382 12 99 12Jacksonville Veterans Memorial Arena 379 13 85 14BOK Center 363 14 70 15Pinnacle Bank Arena 360 15 207 8Wells Fargo Arena 301 16 56 17Verizon Arena 220 17 61 16Intrust Bank Arena 206 18 40 19Colonial Life Arena 186 19 56 17
Average (Ex. BB&T Center) 1,276 264Source: Hoovers 2015.
APPENDIX C: FINANCIAL ANALYSIS – 15
YEAR ESTIMATE
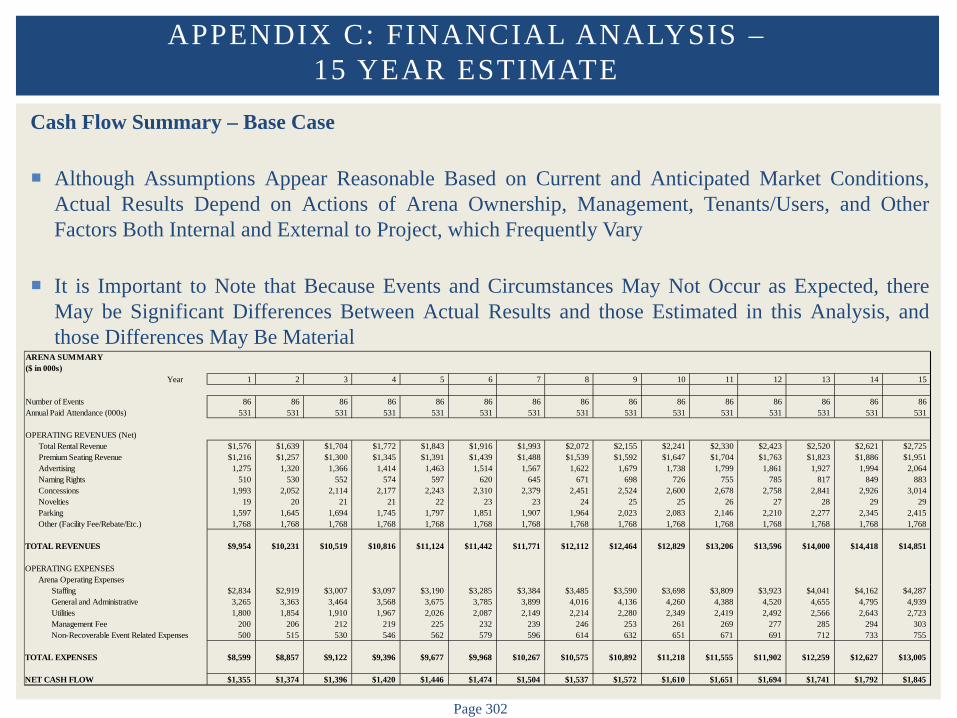
Page 302
Cash Flow Summary – Base Case
Although Assumptions Appear Reasonable Based on Current and Anticipated Market Conditions, Actual Results Depend on Actions of Arena Ownership, Management, Tenants/Users, and Other Factors Both Internal and External to Project, which Frequently Vary
It is Important to Note that Because Events and Circumstances May Not Occur as Expected, there May be Significant Differences Between Actual Results and those Estimated in this Analysis, and those Differences May Be Material
APPENDIX C: FINANCIAL ANALYSIS – 15 YEAR ESTIMATE
ARENA SUMMARY($ in 000s)
Year 1 2 3 4 5 6 7 8 9 10 11 12 13 14 15
Number of Events 86 86 86 86 86 86 86 86 86 86 86 86 86 86 86Annual Paid Attendance (000s) 531 531 531 531 531 531 531 531 531 531 531 531 531 531 531
OPERATING REVENUES (Net)Total Rental Revenue $1,576 $1,639 $1,704 $1,772 $1,843 $1,916 $1,993 $2,072 $2,155 $2,241 $2,330 $2,423 $2,520 $2,621 $2,725Premium Seating Revenue $1,216 $1,257 $1,300 $1,345 $1,391 $1,439 $1,488 $1,539 $1,592 $1,647 $1,704 $1,763 $1,823 $1,886 $1,951Advertising 1,275 1,320 1,366 1,414 1,463 1,514 1,567 1,622 1,679 1,738 1,799 1,861 1,927 1,994 2,064Naming Rights 510 530 552 574 597 620 645 671 698 726 755 785 817 849 883Concessions 1,993 2,052 2,114 2,177 2,243 2,310 2,379 2,451 2,524 2,600 2,678 2,758 2,841 2,926 3,014Novelties 19 20 21 21 22 23 23 24 25 25 26 27 28 29 29Parking 1,597 1,645 1,694 1,745 1,797 1,851 1,907 1,964 2,023 2,083 2,146 2,210 2,277 2,345 2,415Other (Facility Fee/Rebate/Etc.) 1,768 1,768 1,768 1,768 1,768 1,768 1,768 1,768 1,768 1,768 1,768 1,768 1,768 1,768 1,768
TOTAL REVENUES $9,954 $10,231 $10,519 $10,816 $11,124 $11,442 $11,771 $12,112 $12,464 $12,829 $13,206 $13,596 $14,000 $14,418 $14,851
OPERATING EXPENSESArena Operating Expenses
Staffing $2,834 $2,919 $3,007 $3,097 $3,190 $3,285 $3,384 $3,485 $3,590 $3,698 $3,809 $3,923 $4,041 $4,162 $4,287General and Administrative 3,265 3,363 3,464 3,568 3,675 3,785 3,899 4,016 4,136 4,260 4,388 4,520 4,655 4,795 4,939Utilities 1,800 1,854 1,910 1,967 2,026 2,087 2,149 2,214 2,280 2,349 2,419 2,492 2,566 2,643 2,723Management Fee 200 206 212 219 225 232 239 246 253 261 269 277 285 294 303Non-Recoverable Event Related Expenses 500 515 530 546 562 579 596 614 632 651 671 691 712 733 755
TOTAL EXPENSES $8,599 $8,857 $9,122 $9,396 $9,677 $9,968 $10,267 $10,575 $10,892 $11,218 $11,555 $11,902 $12,259 $12,627 $13,005
NET CASH FLOW $1,355 $1,374 $1,396 $1,420 $1,446 $1,474 $1,504 $1,537 $1,572 $1,610 $1,651 $1,694 $1,741 $1,792 $1,845

LIMITING CONDITIONS AND
ASSUMPTIONS
Page 304
This analysis is subject to our contractual terms, as well as the following limiting conditions and assumptions: The analysis has been prepared for internal decision making purposes of the Client only and shall not be used for any other purposes
without the prior written permission of Barrett Sports Group, LLC. The analysis includes findings and recommendations; however, all decisions in connection with the implementation of such findings
and recommendations shall be Client’s responsibility. Ownership and management of the stadium are assumed to be in competent and responsible hands. Ownership and management can
materially impact the findings of this analysis. Any estimates of historical or future prices, revenues, rents, expenses, occupancy, net operating income, mortgage debt service, capital
outlays, cash flows, inflation, capitalization rates, yield rates or interest rates are intended solely for analytical purposes and are not to be construed as predictions of the analysts. They represent only the judgment of the authors based on information provided by operators and owners active in the market place, and their accuracy is in no way guaranteed.
Our work has been based in part on review and analysis of information provided by unrelated sources which are believed accurate, but cannot be assured to be accurate. No audit or other verification has been completed.
Current and anticipated market conditions are influenced by a large number of external factors. We have not knowingly withheld any pertinent facts, but we do not guarantee that we have knowledge of all factors which might influence the operating potential of the facility. Due to rapid changes in the external factors, the actual results may vary significantly from estimates presented in this report.
The analysts reserve the right to make such adjustments to the analyses, opinions, and conclusions set forth in this report as may be required by consideration of additional data or more reliable data which may become available.
The analysis is intended to be read and used as a whole and not in parts. Separation of any section or page from the main body of the report is expressly forbidden and invalidates the analysis.
Possession of the analysis does not carry with it the right of publication. It shall be used for its intended purpose only and by the parties to whom it is addressed. Other parties should not rely on the findings of this report for any purpose and should perform their own due diligence.
Our performance of the tasks completed does not constitute an opinion of value or appraisal, or a projection of financial performance or audit of the facility in accordance with generally accepted audit standards. Estimates of value (ranges) have been prepared to illustrate current and possible future market conditions.
The analysis shall not be used in any matters pertaining to any financing, or real estate or other securities offering, registration, or exemption with any state or with the federal Securities and Exchange Commission.
No liability is assumed for matters which are legal or environmental in nature.
LIMITING CONDITIONS AND ASSUMPTIONS