broward county 2014 taz and municipal forecasts update wednesday, march 19, 2014
TRANSCRIPT

Broward County 2014 TAZ and Municipal Forecasts
Update
Wednesday, March 19, 2014

Broward County 2014 TAZ and Municipal Forecasts Update
I. Introduction to the 2014 Population Projection Allocation Update Overview
II. Bureau of Economic and Business Research Population Forecast (BEBR)
III. BEBR Forecast by Age for Broward County
IV. Broward County Households by Age of Householder
V. Broward County Households by Household Size
VI. Assignment of Dwelling Units, Households, and Household Population to Traffic Analysis Zones (TAZs)
VII. Municipal Forecast of Dwelling Units, Households, and Population

I. Introduction to the Broward County 2014 TAZ and Municipal Forecasts Update
An update of forecast model developed in 2012 that was professionally acceptable and replicable.
A continuation and update of the County’s 2012 TAZ and Municipal Forecasts.
The update includes modifications and comments obtained from the 2012 Population Roundtable process approved methodology.
Replaced internally-developed countywide forecasts with population forecasts prepared by University of Florida’s BEBR.
I. Introduction to the Broward County 2014 TAZ and Municipal Forecasts Update
Key Input University of Florida’s BEBR, “Detailed Population Projections by Age, Sex,
Race, and Hispanic Origin, for Florida and Its Counties, 2015-2040, With Estimates for 2012 All Races”
Key Action Convert and assign the BEBR forecasted estimates (2015-2040) to Broward
County’s 2010 TAZ and municipalities using a household based model.
Key Output Forecasts of households, household size, group quarters’ population,
seasonally-occupied housing units, and all-other vacant units for years 2015 through 2040 in 5-year increments and supporting documentation.
TAZ and municipal level forecasts of housing and population data for years 2015 through 2040 in 5-year increments.
** Base year of 2010 provided for reference purposes.
I. Introduction to the Broward County 2014 TAZ and Municipal Forecasts Update
Household-Based Model Assumptions BEBR’s forecasts by population age are converted to
countywide household forecasts. Assigned to TAZ based on interaction between
1. The change in the countywide household-size distribution through forecast periods;
2. The established TAZ-level distribution of households; and
3. The capacity of each TAZ to absorb additional housing units. Generally based on the Land Use Plan and vacant land capacity.
II. BEBR Population Forecast
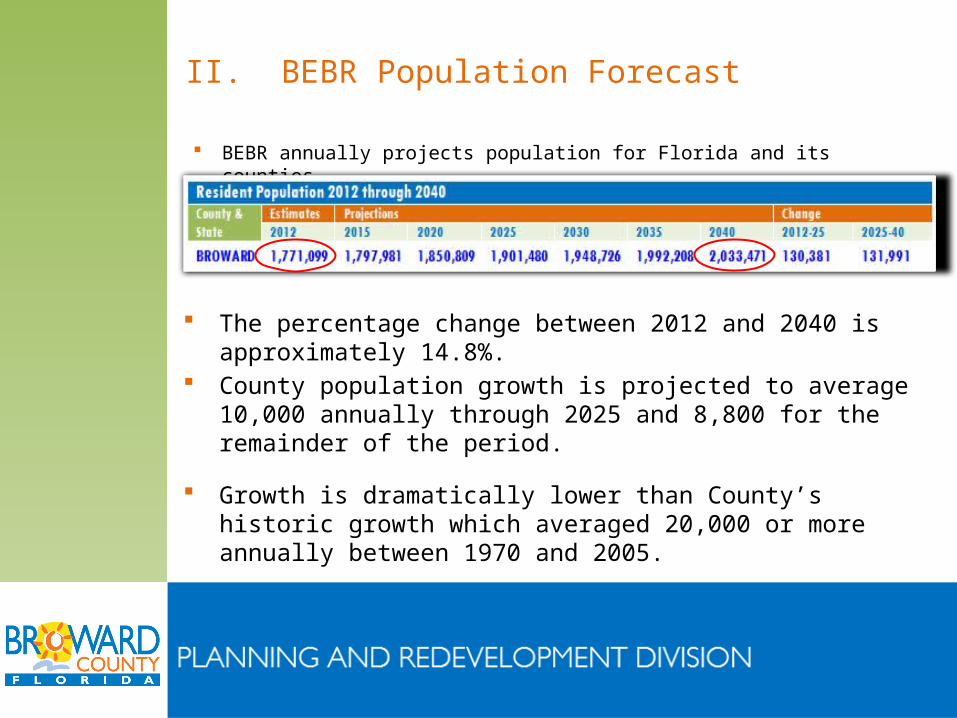
BEBR annually projects population for Florida and its counties.
The percentage change between 2012 and 2040 is approximately 14.8%.
County population growth is projected to average 10,000 annually through 2025 and 8,800 for the remainder of the period.
Growth is dramatically lower than County’s historic growth which averaged 20,000 or more annually between 1970 and 2005.

II. BEBR Population Forecast
Broward Amongst Other Counties
Most of the future growth will continue to occur primarily in the most populous counties.
Through 2040, Miami-Dade and Broward Counties remain 1st and 2nd.
Rank and Population of Florida's 10 Most Populous Counties 2012 2025 2040 County Population County Population County Population
MIAMI-DADE 2,551,290 MIAMI-DADE 2,892,389 MIAMI-DADE 3,204,915
BROWARD 1,771,099 BROWARD 1,901,480 BROWARD 2,033,471
PALM BEACH 1,335,415 PALM BEACH 1,545,998 HILLSBOROUGH 1,823,183
HILLSBOROUGH 1,256,118 HILLSBOROUGH 1,543,143 ORANGE 1,798,433
ORANGE 1,175,941 ORANGE 1,494,880 PALM BEACH 1,733,331
PINELLAS 920,381 DUVAL 969,678 LEE 1,070,250
DUVAL 869,729 PINELLAS 923,619 DUVAL 1,063,669
LEE 638,029 LEE 858,524 PINELLAS 926,376
POLK 606,888 POLK 750,467 POLK 888,348
BREVARD 545,625 BREVARD 616,941 PASCO 727,324 Source: compiled by Broward County Planning and Redevelopment Division from Table 1 (BEBR Population Forecasts by County
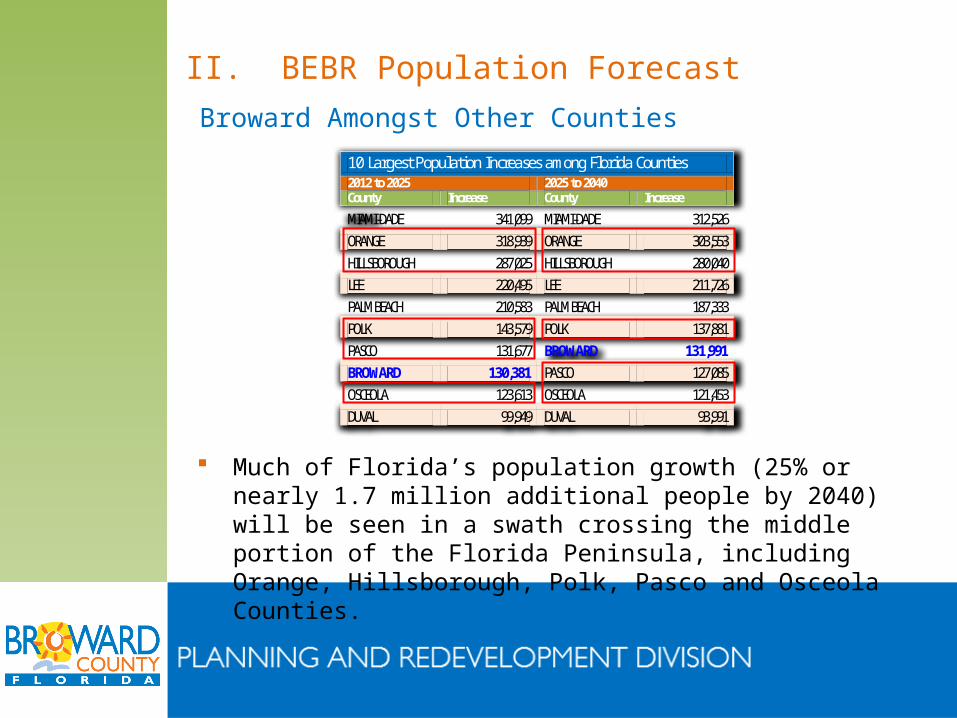
10 Largest Population Increases among Florida Counties 2012 to 2025 2025 to 2040 County Increase County Increase
MIAMI-DADE 341,099 MIAMI-DADE 312,526
ORANGE 318,939 ORANGE 303,553
HILLSBOROUGH 287,025 HILLSBOROUGH 280,040
LEE 220,495 LEE 211,726
PALM BEACH 210,583 PALM BEACH 187,333
POLK 143,579 POLK 137,881
PASCO 131,677 BROWARD 131,991
BROWARD 130,381 PASCO 127,085
OSCEOLA 123,613 OSCEOLA 121,453
DUVAL 99,949 DUVAL 93,991 Source: compiled by Broward County Planning and Redevelopment Division from Table 1 (BEBR Population Forecasts by County
II. BEBR Population Forecast
Broward Amongst Other Counties
Much of Florida’s population growth (25% or nearly 1.7 million additional people by 2040) will be seen in a swath crossing the middle portion of the Florida Peninsula, including Orange, Hillsborough, Polk, Pasco and Osceola Counties.

II. BEBR Population Forecast
Reflections on Recent History
Past growth was accommodated by the County’s supply of ample vacant developable land.
By 2005, nearly all the vacant developable land in the County was built out.
Future growth now is primarily dependent on redevelopment.
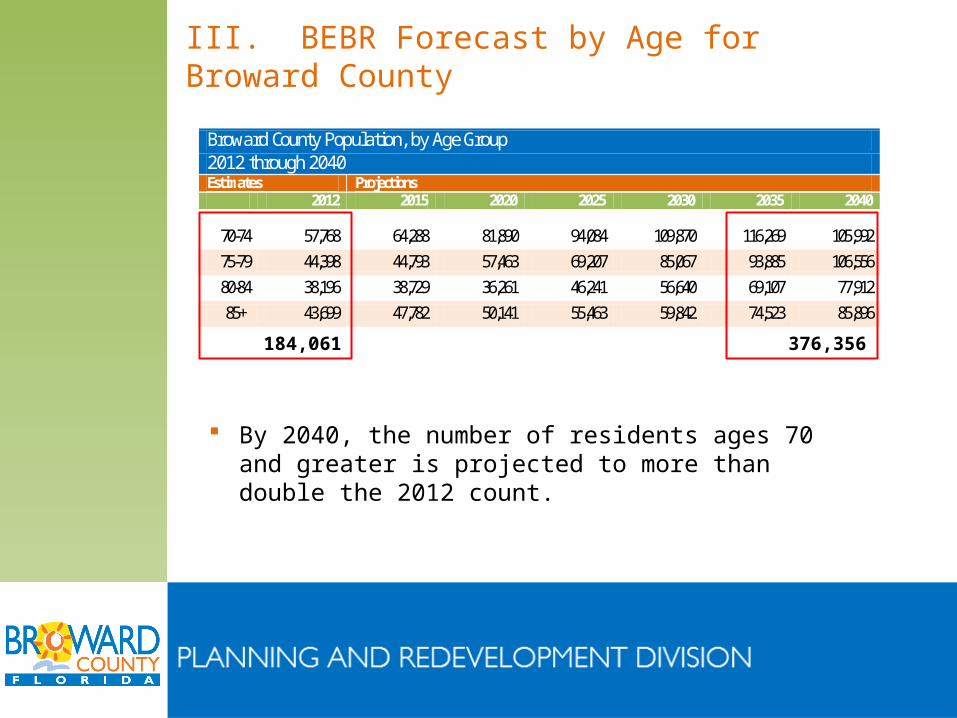
Broward County Population, by Age Group 2012 through 2040 Estimates Projections
2012 2015 2020 2025 2030 2035 2040 Total 1,771,099 1,797,981 1,850,809 1,901,480 1,948,726 1,992,208 2,033,471
70-74 57,768 64,288 81,890 94,084 109,870 116,269 105,992
75-79 44,398 44,793 57,463 69,207 85,067 93,885 106,556
80-84 38,196 38,729 36,261 46,241 56,640 69,107 77,912
85+ 43,699 47,782 50,141 55,463 59,842 74,523 85,896
Source: University of Florida, Bureau of Economic and Business Research, “Detailed Population Projections by Age, Sex, Race, and Hispanic Origin for Florida and Its Counties 2015-2040, With Estimates for 2012” June 2013
III. BEBR Forecast by Age for Broward County
By 2040, the number of residents ages 70 and greater is projected to more than double the 2012 count.
184,061 376,356
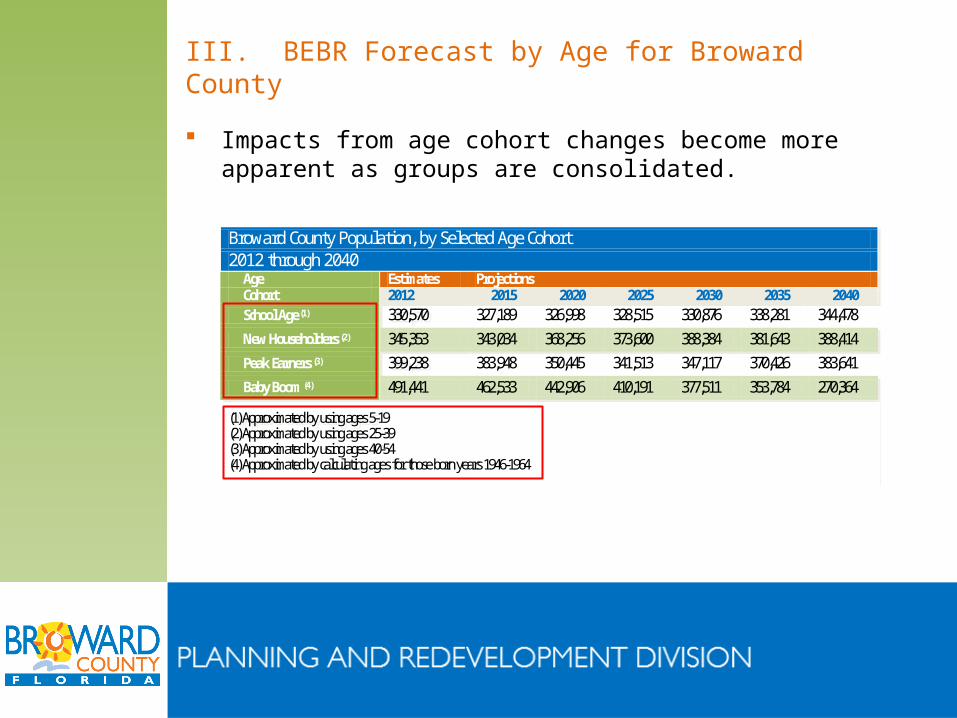
Broward County Population, by Selected Age Cohort 2012 through 2040
Age Estimates Projections Cohort 2012 2015 2020 2025 2030 2035 2040 School Age (1) 330,570 327,189 326,998 328,515 330,876 338,281 344,478
New Householders (2) 345,353 343,034 368,256 373,600 388,384 381,643 388,414
Peak Earners (3) 399,238 383,948 350,445 341,513 347,117 370,426 383,641
Baby Boom (4) 491,441 462,533 442,906 410,191 377,511 353,784 270,364
(1) Approximated by using ages 5-19 (2) Approximated by using ages 25-39 (3) Approximated by using ages 40-54 (4) Approximated by calculating ages for those born years 1946-1964
III. BEBR Forecast by Age for Broward County
Impacts from age cohort changes become more apparent as groups are consolidated.
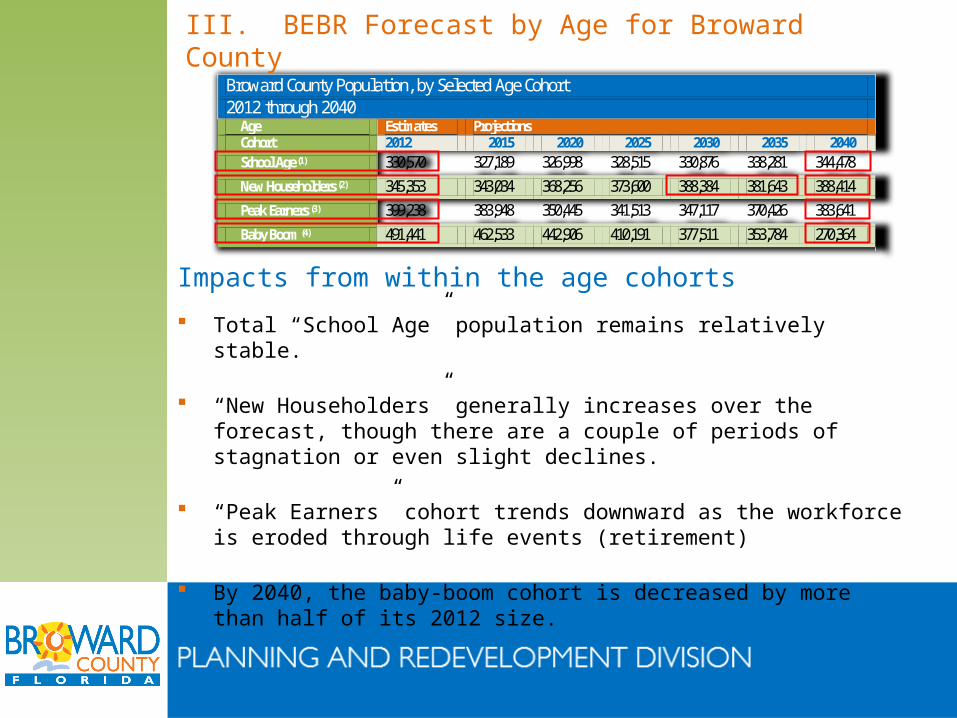
Broward County Population, by Selected Age Cohort 2012 through 2040
Age Estimates Projections Cohort 2012 2015 2020 2025 2030 2035 2040 School Age (1) 330,570 327,189 326,998 328,515 330,876 338,281 344,478
New Householders (2) 345,353 343,034 368,256 373,600 388,384 381,643 388,414
Peak Earners (3) 399,238 383,948 350,445 341,513 347,117 370,426 383,641
Baby Boom (4) 491,441 462,533 442,906 410,191 377,511 353,784 270,364
(1) Approximated by using ages 5-19 (2) Approximated by using ages 25-39 (3) Approximated by using ages 40-54 (4) Approximated by calculating ages for those born years 1946-1964
III. BEBR Forecast by Age for Broward County
Impacts from within the age cohorts
Total “School Age” population remains relatively stable.
“New Householders” generally increases over the forecast, though there are a couple of periods of stagnation or even slight declines.
“Peak Earners” cohort trends downward as the workforce is eroded through life events (retirement)
By 2040, the baby-boom cohort is decreased by more than half of its 2012 size.

III. BEBR Forecast by Age for Broward County
Impacts from within the age cohorts Baby-Boomer households
downsizing will compete against new household creation and have impacts on the need for health care services, placing increasing demands on Medicare and Medicaid while reducing the number of wage-earners and associated tax revenues.
While the population gradually increases, the number of people generally considered as potential participants in the labor force remains constant through 2025 and declines thereafter.
Relatively fewer dollars circulating in the economy.

QUESTIONS
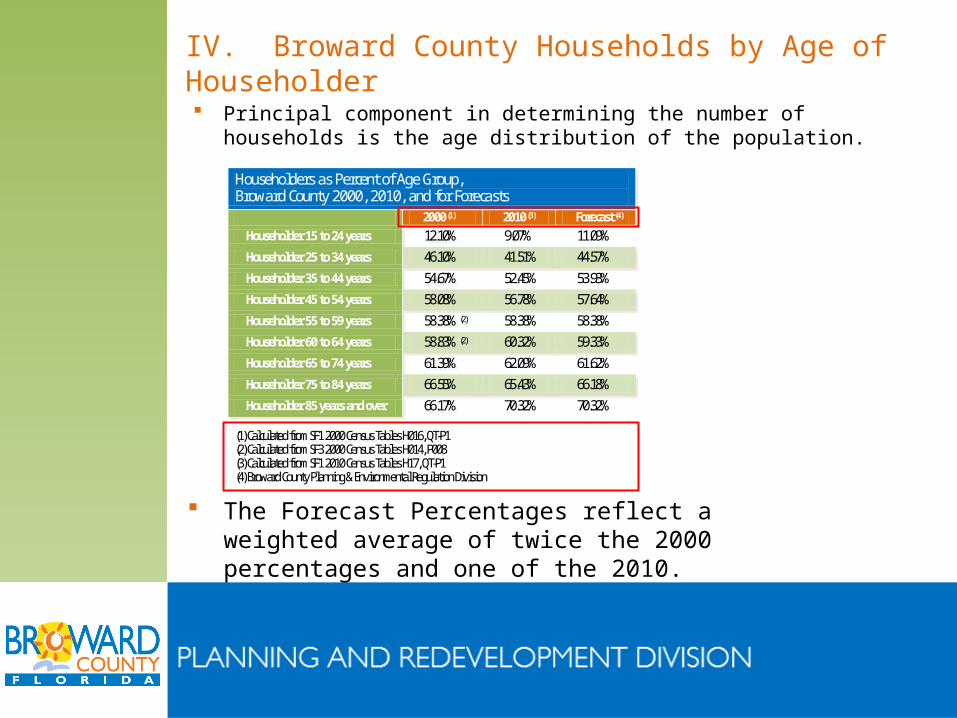
IV. Broward County Households by Age of Householder Principal component in determining the number of
households is the age distribution of the population.
The Forecast Percentages reflect a weighted average of twice the 2000 percentages and one of the 2010.
Householders as Percent of Age Group, Broward County 2000, 2010, and for Forecasts 2000 (1) 2010 (3) Forecast (4)
Householder 15 to 24 years 12.10% 9.07% 11.09%
Householder 25 to 34 years 46.10% 41.51% 44.57%
Householder 35 to 44 years 54.67% 52.45% 53.93%
Householder 45 to 54 years 58.08% 56.78% 57.64%
Householder 55 to 59 years 58.38% (2) 58.38% 58.38%
Householder 60 to 64 years 58.83% (2) 60.32% 59.33%
Householder 65 to 74 years 61.39% 62.09% 61.62%
Householder 75 to 84 years 66.55% 65.43% 66.18%
Householder 85 years and over 66.17% 70.32% 70.32%
(1) Calculated from SF1 2000 Census Tables H016, QT-P1 (2) Calculated from SF3 2000 Census Tables H014, P008 (3) Calculated from SF1 2010 Census Tables H17, QT-P1 (4) Broward County Planning & Environmental Regulation Division

IV. Broward County Households by Age of Householder
Broward County Householders by Age Group calculated by applying the forecasted percentage of householders as percent of age group applied to population by age groups.
Broward County Householders by Age Group, 2010 - 2040 Census Forecast Households Householder Age 2010 2015 2020 2025 2030 2035 2040 15 to 24 years 19,872 25,734 24,700 25,349 24,514 25,412 25,415 25 to 34 years 93,176 103,037 109,391 112,207 112,140 111,569 112,644 35 to 44 years 131,862 123,613 126,837 130,673 139,983 143,525 145,029 45 to 54 years 157,306 153,668 137,230 127,420 129,308 135,812 144,334 55 to 59 years 65,794 74,755 78,547 70,150 63,022 60,722 65,566 60 to 64 years 56,997 63,847 73,152 77,305 69,005 62,467 59,994 65 to 74 years 77,826 93,746 114,040 129,829 145,312 140,181 128,458 75 to 84 years 54,012 55,276 62,028 76,405 93,783 107,870 122,083 85 years and over 29,202 33,601 35,260 39,003 42,082 52,406 60,404
Total 686,047 727,277 761,185 788,341 819,149 839,964 863,927
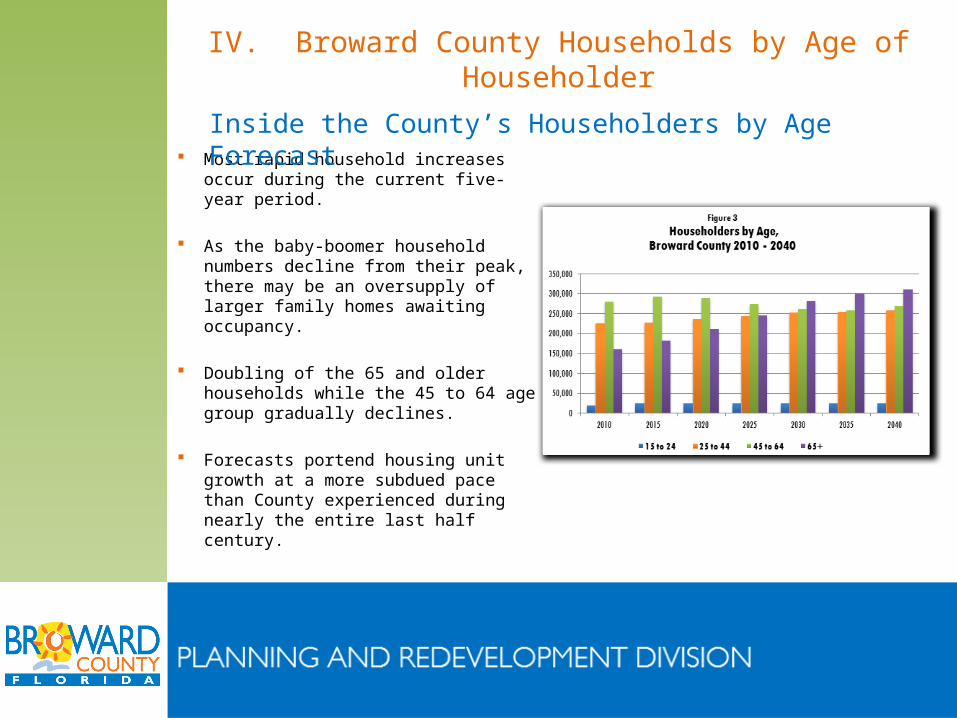
IV. Broward County Households by Age of Householder
Most rapid household increases occur during the current five-year period.
As the baby-boomer household numbers decline from their peak, there may be an oversupply of larger family homes awaiting occupancy.
Doubling of the 65 and older households while the 45 to 64 age group gradually declines.
Forecasts portend housing unit growth at a more subdued pace than County experienced during nearly the entire last half century.
Inside the County’s Householders by Age Forecast

V. Broward County Households by Household Size
Represents the average household size distribution for the County according to the identified age groups and household size for the years 2015-2040.
Percentages calculated using the Census 2000 from Summary File 1 for the County.
2010 percentages were estimated from the 2000 distribution rates and calibrated to the 2010 actual distribution.
Both rates were combined using a weighted average of twice the 2000 percentages and one of the 2010.
Household Size Distribution for Householders, by Age Broward County, 2015 through 2040
Age of Householder/PPH 1 2 3 4 5 6 7+ Total
15 to 24 years 20.70% 33.08% 21.25% 12.52% 7.10% 2.96% 2.40% 100.00% 25 to 34 years 22.67% 34.61% 19.37% 13.40% 6.06% 2.46% 1.43% 100.00% 35 to 44 years 20.84% 21.89% 18.45% 21.48% 10.91% 3.92% 2.51% 100.00% 45 to 54 years 25.93% 23.66% 18.22% 18.51% 8.55% 3.18% 1.95% 100.00%
55 to 64 years 31.13% 34.54% 16.41% 10.84% 4.28% 1.74% 1.06% 100.00% 65 to 74 years 37.65% 46.88% 9.05% 3.59% 1.50% 0.76% 0.56% 100.00% 75 to 84 years 46.01% 44.07% 6.99% 1.99% 0.56% 0.26% 0.11% 100.00% 85 years and over 48.92% 44.02% 5.53% 1.22% 0.24% 0.06% 0.01% 100.00%
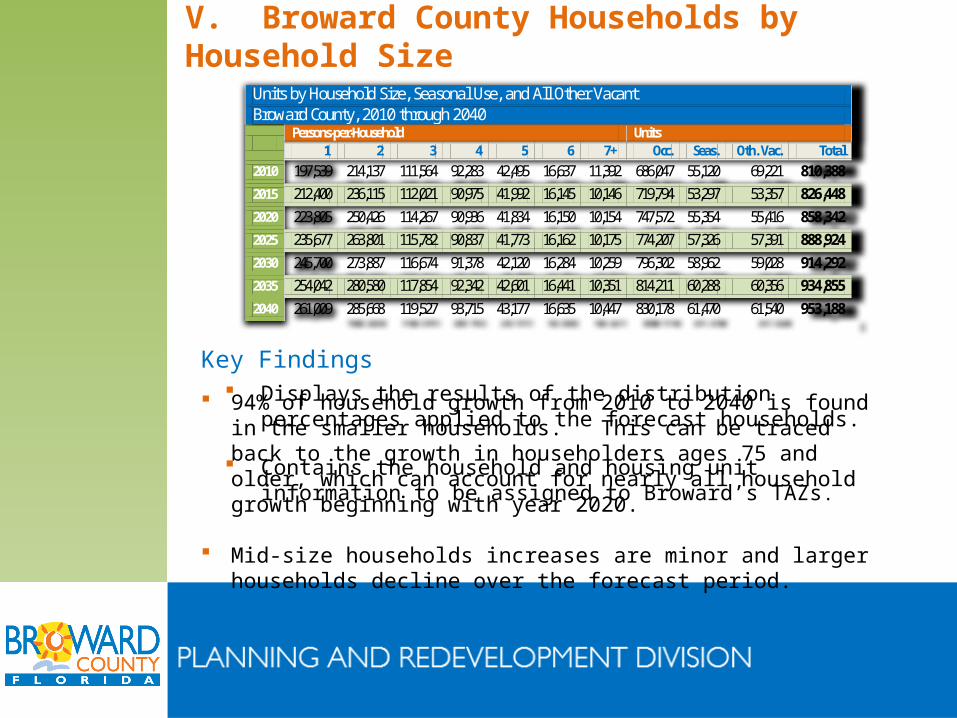
V. Broward County Households by Household Size
Displays the results of the distribution percentages applied to the forecast households.
Contains the household and housing unit information to be assigned to Broward’s TAZs.
Key Findings
94% of household growth from 2010 to 2040 is found in the smaller households. This can be traced back to the growth in householders ages 75 and older, which can account for nearly all household growth beginning with year 2020.
Mid-size households increases are minor and larger households decline over the forecast period.
Units by Household Size, Seasonal Use, and All Other Vacant Broward County, 2010 through 2040
Persons-per-Household Units
1 2 3 4 5 6 7+ Occ. Seas. Oth. Vac. Total
2010 197,539 214,137 111,564 92,283 42,495 16,637 11,392 686,047 55,120 69,221 810,388
2015 212,400 236,115 112,021 90,975 41,992 16,145 10,146 719,794 53,297 53,357 826,448
2020 223,805 250,426 114,267 90,936 41,834 16,150 10,154 747,572 55,354 55,416 858,342
2025 235,677 263,801 115,782 90,837 41,773 16,162 10,175 774,207 57,326 57,391 888,924
2030 245,700 273,887 116,674 91,378 42,120 16,284 10,259 796,302 58,962 59,028 914,292
2035 254,042 280,580 117,854 92,342 42,601 16,441 10,351 814,211 60,288 60,356 934,855
2040 261,009 285,668 119,527 93,715 43,177 16,635 10,447 830,178 61,470 61,540 953,188
Source: Broward County Planning and Redevelopment Division. Note: Household distribution was altered to accommodate the total population forecasts prepared by BEBR. The difference between the Occupied Units of Table 11 and Household Totals from Table 8 is less than 1%. See explanation in discussion of Table 12.
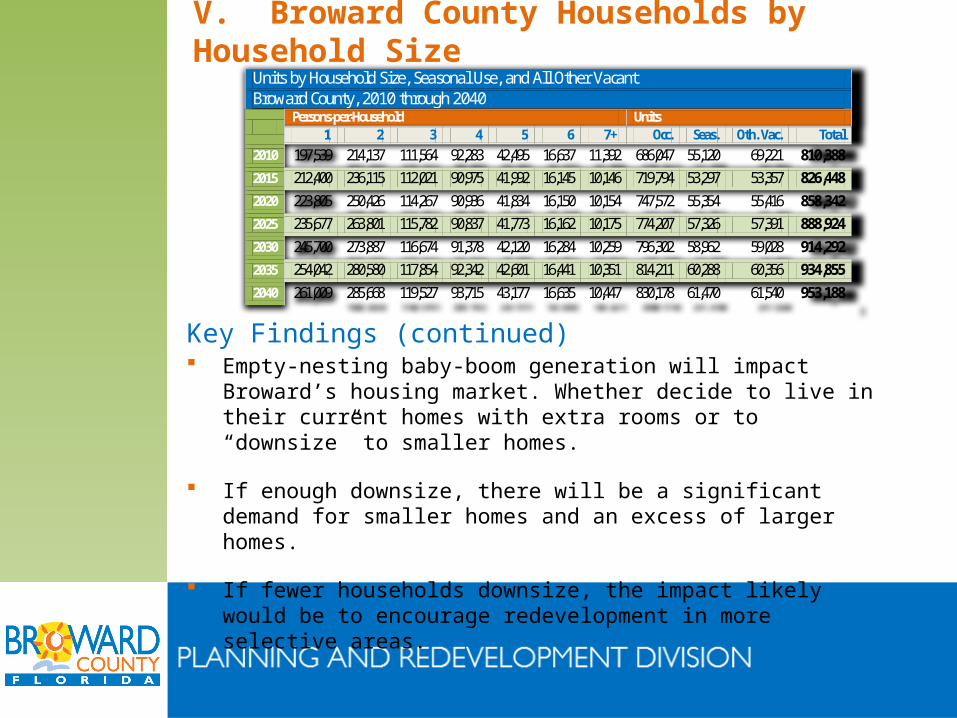
V. Broward County Households by Household Size
Key Findings (continued) Empty-nesting baby-boom generation will impact Broward’s
housing market. Whether decide to live in their current homes with extra rooms or to “downsize” to smaller homes.
If enough downsize, there will be a significant demand for smaller homes and an excess of larger homes.
If fewer households downsize, the impact likely would be to encourage redevelopment in more selective areas.
Units by Household Size, Seasonal Use, and All Other Vacant Broward County, 2010 through 2040
Persons-per-Household Units
1 2 3 4 5 6 7+ Occ. Seas. Oth. Vac. Total
2010 197,539 214,137 111,564 92,283 42,495 16,637 11,392 686,047 55,120 69,221 810,388
2015 212,400 236,115 112,021 90,975 41,992 16,145 10,146 719,794 53,297 53,357 826,448
2020 223,805 250,426 114,267 90,936 41,834 16,150 10,154 747,572 55,354 55,416 858,342
2025 235,677 263,801 115,782 90,837 41,773 16,162 10,175 774,207 57,326 57,391 888,924
2030 245,700 273,887 116,674 91,378 42,120 16,284 10,259 796,302 58,962 59,028 914,292
2035 254,042 280,580 117,854 92,342 42,601 16,441 10,351 814,211 60,288 60,356 934,855
2040 261,009 285,668 119,527 93,715 43,177 16,635 10,447 830,178 61,470 61,540 953,188
Source: Broward County Planning and Redevelopment Division. Note: Household distribution was altered to accommodate the total population forecasts prepared by BEBR. The difference between the Occupied Units of Table 11 and Household Totals from Table 8 is less than 1%. See explanation in discussion of Table 12.
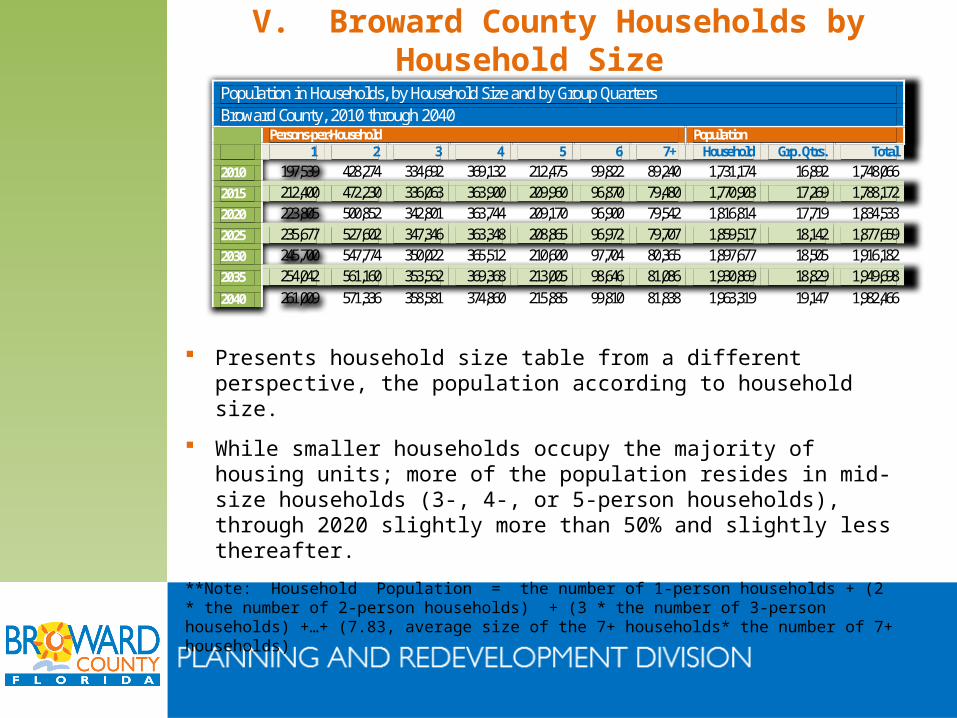
V. Broward County Households by Household Size
Presents household size table from a different perspective, the population according to household size.
While smaller households occupy the majority of housing units; more of the population resides in mid-size households (3-, 4-, or 5-person households), through 2020 slightly more than 50% and slightly less thereafter.
**Note: Household Population = the number of 1-person households + (2 * the number of 2-person households) + (3 * the number of 3-person households) +…+ (7.83, average size of the 7+ households* the number of 7+ households)
Population in Households, by Household Size and by Group Quarters Broward County, 2010 through 2040
Persons-per-Household Population
1 2 3 4 5 6 7+ Household Grp. Qtrs. Total
2010 197,539 428,274 334,692 369,132 212,475 99,822 89,240 1,731,174 16,892 1,748,066 2015 212,400 472,230 336,063 363,900 209,960 96,870 79,480 1,770,903 17,269 1,788,172 2020 223,805 500,852 342,801 363,744 209,170 96,900 79,542 1,816,814 17,719 1,834,533 2025 235,677 527,602 347,346 363,348 208,865 96,972 79,707 1,859,517 18,142 1,877,659 2030 245,700 547,774 350,022 365,512 210,600 97,704 80,365 1,897,677 18,505 1,916,182 2035 254,042 561,160 353,562 369,368 213,005 98,646 81,086 1,930,869 18,829 1,949,698
2040 261,009 571,336 358,581 374,860 215,885 99,810 81,838 1,963,319 19,147 1,982,466

VI. Assignment of Dwelling Units, Households and Household Population to TAZs
This stage of allocation occurs into the Broward County’s 2010 TAZ boundaries (953 unique geographic areas).
Distributed to TAZs by a methodology that respects the individual TAZ’s unique set of selected characteristics and its capacity to accept growth.
Allocation requires that each TAZ be assigned a maximum number of dwelling units. This maximum reflects the influence of the Broward County Land Use Plan (amendments and current designations) and vacant land capacity.
Served as the stage in the 2012 forecasts for the input from the 2012 Population Roundtable process. Input included:
1. Estimated maximums for TAZs that contain Regional Activity Centers, Local Activity Centers, Transportation Oriented Corridors or other irregular Land Use Plan designations; and
2. Identification of TAZs for “redevelopment” since vacant residential lands are exhausted by 2025.

VI. Assignment of Dwelling Units, Households and Household Population to TAZs
Assignment methodology for TAZs
Step 1. Determine #of households by size & vacant units required by next forecast year: Convert existing household size distribution for each TAZ to reflect anticipated countywide change distribution for coming forecast year.
Step 2. Determine attractiveness of each TAZ to accept growth: Vacant land capacity, land use plan and its existing housing inventory.
Step 3. Determine household size distribution of the additional units for each TAZ: Based on unique distribution of household characteristics, businesses in area, and nearby public services.
Step 4. Determine preliminary total of households by size assigned to each TAZ: Matrix of percentages of future growth by household size for each TAZ.
Step 5. Enforce TAZ unit maximums: TAZs exceeding maximum have excess units apportioned by household size; subtracted from the TAZ; and
added into pool of households to be re-distributed.
VII. Municipal Forecast of Dwelling Units, Households, and Population
Arranging the TAZ forecast data into its proper jurisdiction and compiling the numbers creates the municipal forecast.
Methodology for assigning TAZs to jurisdictions
Step 1. Assign TAZs to local jurisdictions: 2012 municipal boundary map superimposed onto a TAZ boundary map creates a TAZ-to-
jurisdiction cross reference
Step 2. Apportion TAZs among multiple jurisdictions: 2010 Census Block data combined with aerial photography were used to establish the
portions of the TAZ forecasts assigned to each jurisdiction
Step 3. Benchmark the TAZ assignments to the 2010 Census: Review compiled forecast data to see if differences greater than 1%
existed.
Step 4. Assign Group Quarters Population: Census 2010 rate of 0.97% applied to total population yields group quarters
Final Products of the Broward County 2014 TAZ and Municipal Forecasts Update
Two Principal products of the forecasts
A shapefile and series of Excel Worksheets:
BasicTAZdata2014-DRAFT: Table organizing TAZ-level forecasts by Dwelling Units, Population ,and Households for 2010-2040 in 5-year increments.
Muni_TAZ_2014-DRAFT: Set of tables displaying the final distribution of housing and population to Broward County's local jurisdictions by TAZ.
HouseholdTAZdata2014-DRAFT: Set of tables representing TAZ -level forecasts organized by housing data.
TAZ_FinalForecast2014-DRAFT: Shapefile of the file, BasicTAZdata2014-DRAFT.
2014 TAZ and Municipal Forecasts Update Report Contains all tables referenced in presentation

Environmental Protection and Growth Management Department
Planning and Redevelopment Division115 South Andrews Avenue, Room 329K
Fort Lauderdale, FL 33301
Broward.org/EnvironmentAndGrowth/954.357.6634