brooks automation
TRANSCRIPT

Brooks Automation Needham Healthcare Conference March 27, 2018
1

Safe Harbor Statement
“Safe Harbor” Statement under the U.S. Private Securities Litigation Reform Act of 1995; certain matters in this presentation, including forecasts of future demand and future Company performance, are forward-looking statements that are subject to risks and uncertainties that could cause actual results to materially differ, either better or worse, from those projected. Further discussions of risk factors are available in the Company’s most recent SEC filings, including the annual report on Form 10-K for the fiscal year ended September 30, 2017 and any subsequent quarterly reports on Form 10-Q. The Company assumes no obligation to update the information in this presentation.
Regulation G This presentation contains certain non-GAAP measures which are provided to assist in an understanding of the Brooks business and its operational performance. These measures should always be considered in conjunction with the appropriate GAAP measure. Reconciliations of all non-GAAP amounts to the relevant GAAP amount are provided as an attachment to this presentation.
© 2018 Brooks Automation, Inc. • Proprietary Information 2

Life Sciences Sample Management
Semiconductor Capital Equipment
Brooks Automation at a Glance
79% of Revenue
• Fab Automation Solutions • Contamination Control Solutions • Cryogenic Vacuum Products • Global Service Support
21% of Revenue
• End-to-End Cold Chain Management • Automated Ultra Cold Storage Products • Sample Storage Consumables • Sample Management Outsourced Services
3
FY17 Revenue of $693M, +24% YoY • Based in Chelmsford, MA • ~2,000 employees • $0.40/share annual dividend
• Sales in 50 countries • Operations in 11 countries • > 500 base patents
© 2018 Brooks Automation, Inc. • Proprietary Information * Summary data shown as of Fiscal Year ending September 30, 2017.

B R O O K S A U T O M A T I O N
Driving Performance. Delivering Profitable Growth.
• Driving performance
• Building on two strong platforms
• Inflection point for profitable growth
4 © 2018 Brooks Automation, Inc. • Proprietary Information

E X E C U T I O N
A Company on the Move to Higher Value and Higher Growth
• RTS for $3M • Nexus for $85M
• Divested of Contract Manufacturing for $78M
• Crossing Automation for $59M
• Matrical for $9M • 22% of BioCision
for $4M
5
• Contact for $7M
• FluidX for $16M • BioStorage
Technologies for $125M
• Divested of Granville-Phillips instrumentation for $87M
• DMS for $32M
2018 – In Semi and
Life Sciences
markets with leadership offerings
2011 – In Semi market with a range of offerings
2011 / 12
2013 / 14
2015 / 16 • BioCision add’l $11M • PBMMI for $34M • FreezerPro software
for $5M • 4titude Ltd. for $66M
2017 / 18 Acquisitions Life Sciences ~$355M
Semi ~$100M
Dividends Paid ~$153M
© 2018 Brooks Automation, Inc. • Proprietary Information

$422
$483
$553 $560
$693
FY13 FY14 FY15 FY16 FY17
Track Record of Growth and Improving Profitability
6
$0.12
$0.25
$0.45 $0.47
$1.23
FY13 FY14 FY15 FY16 FY17
And positioned for continued profitable growth
© 2018 Brooks Automation, Inc. • Proprietary Information * Non-GAAP financial measures – see reconciliation tables in the attached appendix.
Revenue Earnings Per Share*
$M except EPS

B R O O K S A U T O M A T I O N
Driving Performance. Delivering Profitable Growth.
• Driving performance
• Building on two strong platforms
• Inflection point for profitable growth
7 © 2018 Brooks Automation, Inc. • Proprietary Information
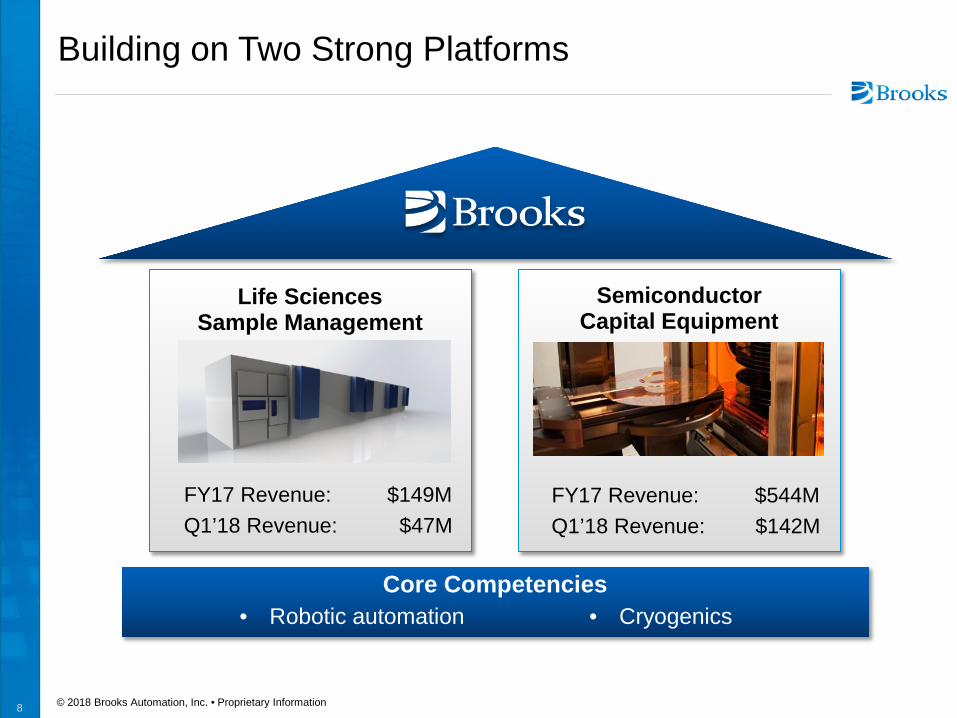
Building on Two Strong Platforms
Semiconductor Capital Equipment
FY17 Revenue: $544M Q1’18 Revenue: $142M
Life Sciences Sample Management
FY17 Revenue: $149M Q1’18 Revenue: $47M
• Cryogenics • Robotic automation Core Competencies
8 © 2018 Brooks Automation, Inc. • Proprietary Information

Building on Two Strong Platforms
Life Sciences Sample Management
FY17 Revenue: $149M Q1’18 Revenue: $47M
• Cryogenics • Robotic automation Core Competencies
9 © 2018 Brooks Automation, Inc. • Proprietary Information
Today’s Samples
Highly Strategic Assets
Critical to Speed of Research
Information Rich

Science Demands Continuous Care of the Sample
10 © 2018 Brooks Automation, Inc. • Proprietary Information
Collect
Identify
Process/ Freeze
Track and Store
Transport
Research and
Analyze
Cold Chain of Custody

Life Sciences Offerings Proven Success and Market Leadership
11 © 2018 Brooks Automation, Inc. • Proprietary Information
$108
$149
FY16 FY17
+38%
Organic growth = 27%
Storage Services
Automation Infrastructure
Infrastructure Services
$M
Informatics Consumables & Instruments
The Leader in Comprehensive Sample Management

Momentum of Growth
12
$21 $27 $29 $32 $33 $35 $37
$48-50
Q1'16 Q2'16 Q3'16 Q4'16 Q1'17 Q2'17 Q3'17 Q4'17 Q1'18 Q2'18 Forecast
$M Revenue
Operating Profit*
$(4) $(2) $0 $1 $1 $2 $2 $2
$1
Q1'16 Q2'16 Q3'16 Q4'16 Q1'17 Q2'17 Q3'17 Q4'17 Q1'18
© 2018 Brooks Automation, Inc. • Proprietary Information * Non-GAAP financial measures – see reconciliation tables in the attached appendix.
2017 Growth and Momentum
• Revenue +38% Organic +27%
• Bookings +30%
• Op Profit Increase of $11M
2018 – Progress Continues
• >30% Growth Expected
• Q4 10% Operating Profit Target
$44 $47

2013 2014 2015 2016 2017 2018 2019
Systems / Instruments / Genomics
Services / Consumables
$63 $68
$108
© 2018 Brooks Automation, Inc. • Proprietary Information
$43
13
$240
Target
$M
$149
42%
53%
Life Sciences Growth Business Model with Strong Foundation of Recurring Revenue
>30%
Guidance
Acquisitions will be Additional to the Target
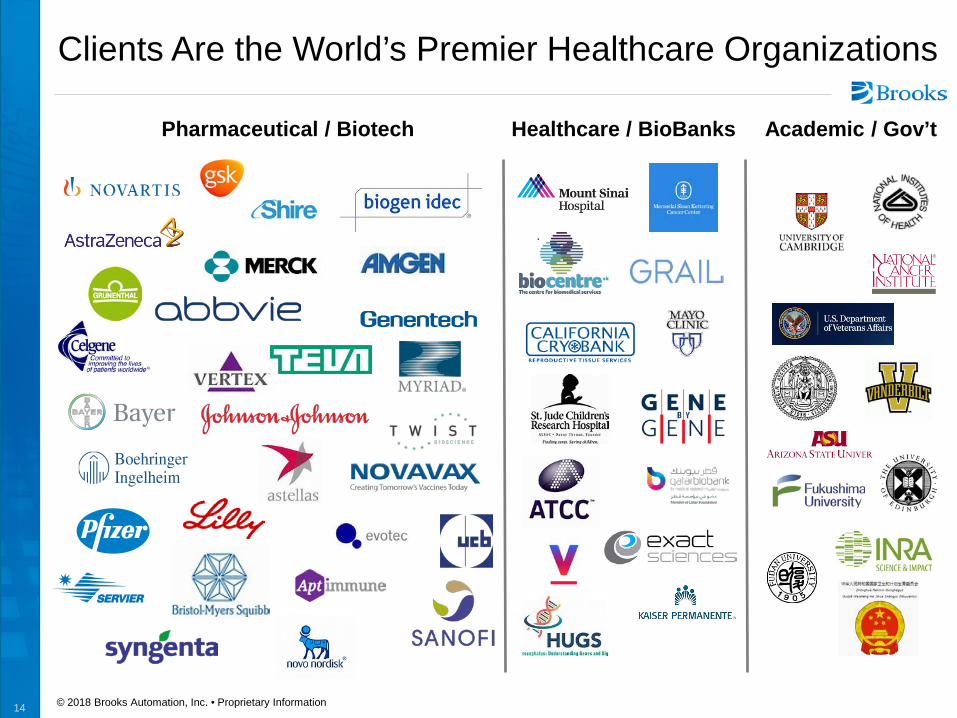
Clients Are the World’s Premier Healthcare Organizations
14 © 2018 Brooks Automation, Inc. • Proprietary Information
Pharmaceutical / Biotech Healthcare / BioBanks Academic / Gov’t

Building on Two Strong Platforms
Semiconductor Capital Equipment
FY17 Revenue: $544M Q1’18 Revenue: $142M
• Cryogenics • Robotic automation Core Competencies
15 © 2018 Brooks Automation, Inc. • Proprietary Information
Today’s Semiconductor Manufacturing
Vacuum Environments
Engineering for Precision & Throughput Efficiencies
Contaminant Free Yields

16
Enabling a Process Advantage
Trusted Global Service Platform
Cryogenic Pumping and Cooling #1
Vacuum Automation #1
Contamination Control #1
© 2018 Brooks Automation, Inc. • Proprietary Information
+20%
B R O O K S S E M I C O N D U C T O R S O L U T I O N S O F F E R I N G S
Proven Success and Market Leadership
$M
Organic growth = 20%
FY16 FY17
$452
$544

FY13 FY16 FY17 FY19
Atmos Dstn / IP Cryopumps Service / Other Auto Column2 Column1 Wafer-Level Packaging Contamination Control Deposition & Etch
+39%
+16%
Semi Growth Portfolio Transformed and Biased for Growth
© 2017 Brooks Automation, Inc. • Proprietary Information 17
+2-8% CAGR
$379
$452
$M
$560-$630
$544
+6% CAGR
+20%
Stable Leadership
Tech Drivers
FY19 Modeled for a Modest Semi Cycle
0-5%
+4-12%

Semi Revenue Growth Extending Leadership Positions in Current Technology Trends
18 © 2018 Brooks Automation, Inc. • Proprietary Information
Q1'16 Q2'16 Q3'16 Q4'16 Q1'17 Q2'17 Q3'17 Q4'17 Q1'18
Atmos Dstn / IP Cryopumps Service / Other Auto Other?? Column1 Contamination Control Wafer-Level Packaging Deposition & Etch
Semi Revenue Overall Growth
CY17 +17% Growth (+23% Excl ATM / IP)
$99
$M
$109
$118 $126 $127
$135
$145 $138
Stable Leadership CY17 +15% Growth (+21% Excl ATM / IP)
Tech Drivers CY17 +18% Growth
Stable Leadership
Tech Drivers
$142
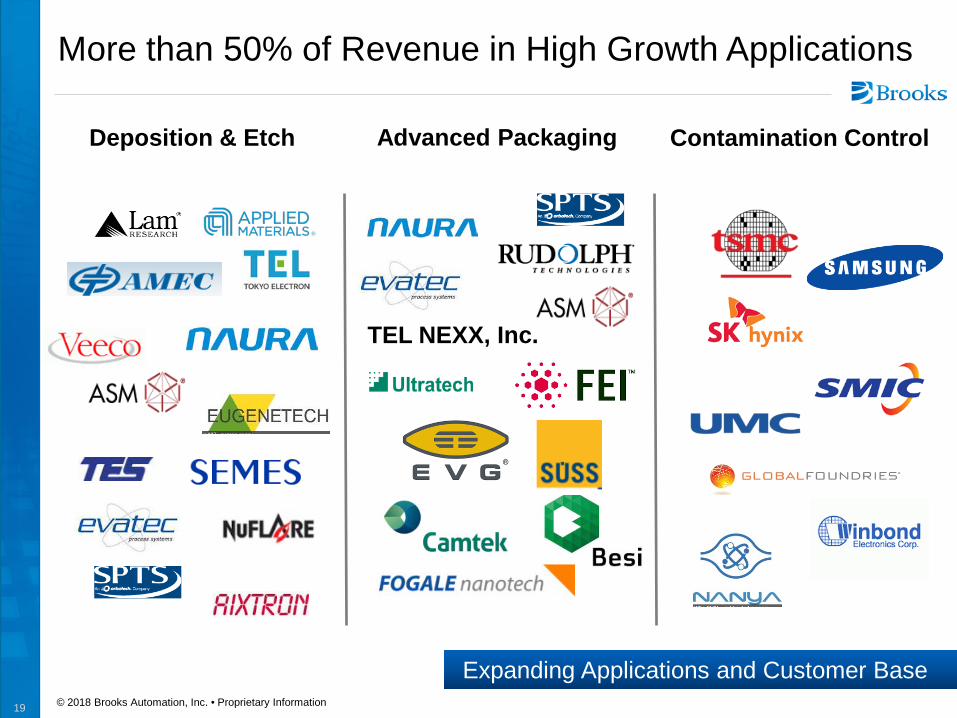
More than 50% of Revenue in High Growth Applications
19 © 2018 Brooks Automation, Inc. • Proprietary Information
Deposition & Etch Advanced Packaging Contamination Control
TEL NEXX, Inc.
Expanding Applications and Customer Base

B R O O K S A U T O M A T I O N
Driving Performance. Delivering Profitable Growth.
• Driving performance
• Building on two strong platforms
• Inflection point for profitable growth
20 © 2018 Brooks Automation, Inc. • Proprietary Information

Strategy Going Forward
Extend leadership in core markets 1 Advance the rapid growth of Life Sciences with organic and acquisition investments 2 Drive margin expansion 3 Utilize balanced and disciplined capital deployment 4
21 © 2018 Brooks Automation, Inc. • Proprietary Information

• Product revenue growth 2-4 percentage points faster than WFE rate
• Gross margin expansion to 41%
• Operating expense productivity
Life Sciences Drivers Semiconductor Drivers
>15% Operating Margins
~30% of Brooks revenue
16-19% Operating Margins
~70% of Brooks revenue
Operating Margins in high teens ROIC >13%
• Revenue growth to $240M
• Gross margin of 42-44%
• Operating expense productivity
2019 Target Model
22 © 2018 Brooks Automation, Inc. • Proprietary Information

$M FY 2013 FY 2015 FY 2017 FY 2019
Total Revenue Semi Life Sciences
% of total
$422M $379M $43M 10%
$553M $485M $68M 12%
$693M $544M $149M 21%
$800-$870M $560-$630M
$240M ~30%
Gross Margin* 33.5% 35.4% 39.2% ~41%
Operating Expenses* % of Revenue
$136M 32.2%
$159M 28.8%
$179M 25.8%
$190-$200M ~24%
Operating Income* % of Revenue
$5M 1.2%
$37M 6.7%
$93M 13.5%
$135-165M ~18%
EBITDA* EPS*
$29M $0.12
$64M $0.45
$131M $1.23
$170-$200M $1.50-$1.80
** Excludes the impact of future acquisitions.
2019 Target Model
23 © 2018 Brooks Automation, Inc. • Proprietary Information * Non-GAAP financial measures – see reconciliation tables in the attached appendix.

Disciplined Capital Deployment
Organic Growth
• Invest in R&D, ~$50M annually
• ~$10M+ CAPEX annually
Shareholder Return
• Quarterly dividend of $0.10 per share
Acquisitions
• Semiconductor and Life Sciences
• Divestitures of $85M
• ROIC focus
$300M 42%
$288M 40%
$127M 18%
Over last five fiscal years, >$700M of capital deployed to enhance
shareholder returns
Balanced and Disciplined Capital Deployment
© 2018 Brooks Automation, Inc. • Proprietary Information
Note: Figures referenced represent the period from FY13 through FY17.
24

Acquisition Priorities
25
Life Science Expansion
Storage Services, Informatics
Expanding Cold Chain Capability
Semi will be Opportunistic
ROIC hurdles
Focus:
Criteria:
© 2018 Brooks Automation, Inc. • Proprietary Information

Guidance Q2’18
26
$M except EPS
Q2’17
Q3’17
Q4’17
Q1’18
Guidance Mar
Q2’18
Brooks Revenue Adj. Gross Margin*
$169 39.0%
$182 40.0%
$182 41.3%
$189 40.8%
$195-205 ~41%
Adjusted EBITDA* Op Cash Flow
$31 $25
$37 $18
$37 $35
$36 $3
$39-$46
Non-GAAP EPS* $0.28 $0.36 $0.35 $0.32 $0.33-$0.41
Dividends Per Share Returned to Shareholders
$0.10 $0.10 $0.10 $0.10 $0.10**
** The Board of Directors has approved a dividend of $0.10 per share payable on March 23, 2018 to stockholders of record on March 2, 2018.
© 2018 Brooks Automation, Inc. • Proprietary Information * Non-GAAP financial measures – see reconciliation tables in the attached appendix.

I N S U M M A R Y
Driving Performance. Delivering Profitable Growth.
Improving Financial
Performance
Attractive Long Term
Financial Model
Track Record of Effective Capital
Deployment
Revenue growth
Margin expansion
EPS acceleration
Semi margin leverage and productivity
Life Sciences high growth
Internal investment
Successful acquisitions
Capital to shareholders
27
Semiconductors
Life Sciences
© 2018 Brooks Automation, Inc. • Proprietary Information

GAAP to Non-GAAP Reconciliations
28

Non-GAAP Operating Performance Consolidated Results
29 © 2018 Brooks Automation, Inc. • Proprietary Information * Non-GAAP financial measures – see reconciliation tables within this appendix. 2013 and 2014 results shown on continuing operations basis.
$ millions FY13 FY14 FY15 FY16 FY17
Revenue 422 483 553 560 693
Gross profit* 141 175 196 203 272 Gross profit margin* 33.5 % 36.2 % 35.4 % 36.2 % 39.2 %R&D expenses 46 53 52 52 47 SG&A expenses* 90 102 107 115 132
Operating income * 5 20 37 36 93 Operating margin* 1.2 % 4.2 % 6.6 % 6.4 % 13.5 %
Other income (expense) 2 1 3 (0) (1) Tax benefit (provision)* (2) (5) (10) (5) (15) JV earnings (losses)* 2 1 1 2 10
Net income* 8 17 31 33 87 Net income margin* 1.8 % 3.6 % 5.5 % 5.8 % 12.6 %
Diluted Non-GAAP EPS - Continuing Ops* 0.12 0.25 0.45 0.47 1.23 Diluted GAAP EPS - Continuing Ops (0.11) 0.02 0.21 (1.01) 0.89 Adjusted EBITDA* 29 45 64 63 131

Non-GAAP Segment Operating Performance
30 © 2018 Brooks Automation, Inc. • Proprietary Information * Non-GAAP financial measures – see reconciliation tables within this appendix. 2013 and 2014 results shown on continuing operations basis.
$ millions FY13 FY14 FY15 FY16 FY17
Revenue 379 420 485 452 544
Gross profit* 123 149 176 162 215 Gross profit margin* 32.5 % 35.5 % 36.2 % 35.9 % 39.6 %Operating expenses 107 121 122 121 126
Operating income * 16 28 54 41 89 Operating margin* 4.1 % 6.7 % 11.1 % 9.1 % 16.4 %
$ millions FY13 FY14 FY15 FY16 FY17
Revenue 43 63 68 108 149
Gross profit* 18 26 20 41 57 Gross profit margin* 42.2 % 41.1 % 29.8 % 37.5 % 38.0 %Operating expenses 27 32 37 46 50
Operating income * (8) (6) (17) (5) 7 Operating margin* (19.1)% (9.4)% (25.0)% (4.6)% 4.4 %
Semiconductor SolutionsBrooks
BrooksLife Science Systems

FY13 GAAP to Non-GAAP Reconciliation Consolidated Results
31
$ millions, except EPS GAAP
Results Acquisition-
Related Costs Amortization
Expense
Restructuring
Charges
Impairment
Charges
Gain from Asset
Disposal Non-GAAP
Results
Revenue 422.4 - - - - - 422.4
Gross profit 132.3 3.0 4.1 - 1.9 - 141.3
Gross profit margin 31.3% 33.5%
Research and development (46.2) - - - - - (46.2) Selling, general and administrative (96.5) 0.9 5.7 - 0.1 - (89.8) Restructuring charges (6.4) - - 6.4 - - 0.0
Operating profit (16.8) 4.0 9.8 6.4 2.0 - 5.3
Operating profit margin (4.0%) 1.3%
Interest income, net 1.0 - - - - - 1.0 Other income, net 1.2 - - - - (1.0) 0.2 Income tax benefit (provision) 5.0 (1.1) (3.0) (1.8) (0.7) 0.4 (1.2) JV and noncontrolling interests 2.4 - - - - - 2.4
Net Income (7.2) 2.8 6.8 4.6 1.3 (0.7) 7.7
Diluted earnings per share (0.11) 0.04 0.10 0.07 0.02 (0.01) 0.12
© 2018 Brooks Automation, Inc. • Proprietary Information Results shown on continuing operations basis.
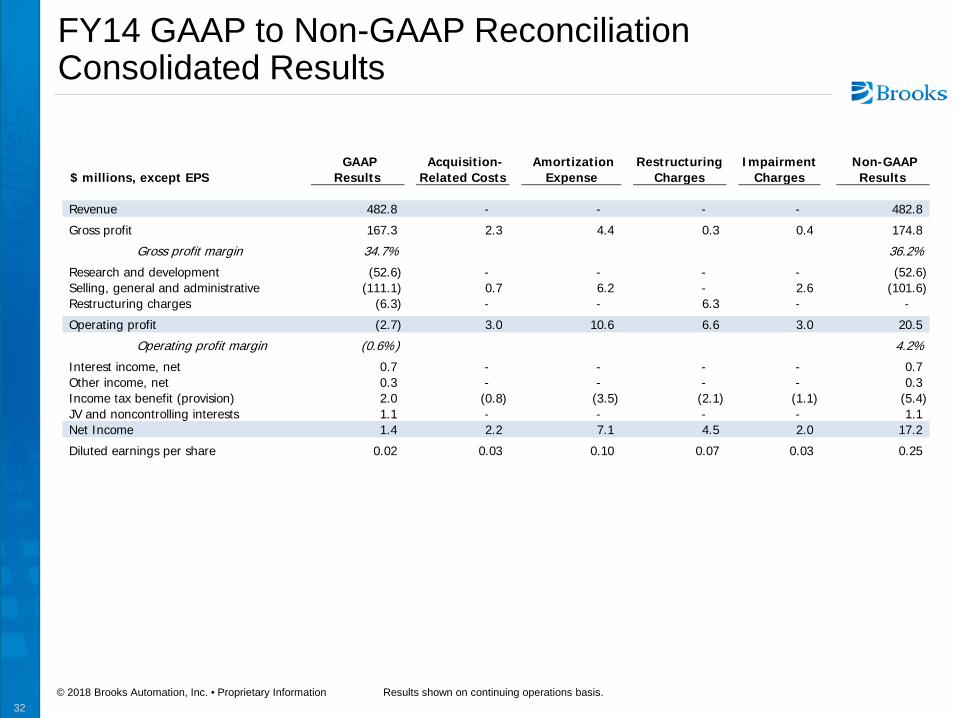
FY14 GAAP to Non-GAAP Reconciliation Consolidated Results
32
$ millions, except EPS GAAP
Results Acquisition-
Related Costs Amortization
Expense
Restructuring
Charges
Impairment
Charges Non-GAAP
Results
Revenue 482.8 - - - - 482.8
Gross profit 167.3 2.3 4.4 0.3 0.4 174.8
Gross profit margin 34.7% 36.2%
Research and development (52.6) - - - - (52.6) Selling, general and administrative (111.1) 0.7 6.2 - 2.6 (101.6) Restructuring charges (6.3) - - 6.3 - -
Operating profit (2.7) 3.0 10.6 6.6 3.0 20.5
Operating profit margin (0.6%) 4.2%
Interest income, net 0.7 - - - - 0.7 Other income, net 0.3 - - - - 0.3 Income tax benefit (provision) 2.0 (0.8) (3.5) (2.1) (1.1) (5.4) JV and noncontrolling interests 1.1 - - - - 1.1 Net Income 1.4 2.2 7.1 4.5 2.0 17.2
Diluted earnings per share 0.02 0.03 0.10 0.07 0.03 0.25
© 2018 Brooks Automation, Inc. • Proprietary Information Results shown on continuing operations basis.

FY15 GAAP to Non-GAAP Reconciliation Consolidated Results
33
$ millions, except EPS GAAP
Results
Acquisition-Related Costs
Amortization Expense
Restructuring Charges
JV Liquidation
Asset Held for Sale
Non-GAAP Results
Revenue 552.7 - - - - - 552.7
Gross profit 189.1 1.5 5.2 - - - 195.8
Gross profit margin 34.2% 35.4%
Research and development (52.2) - - - - - (52.2) Selling, general and administrative (115.3) 0.7 7.7 - - - (106.9) Restructuring charges (4.7) - - 4.7 - - -
Operating profit 16.9 2.2 12.9 4.7 - - 36.7
Operating profit margin 3.1% 6.6%
Interest income, net 0.5 - - - - - 0.5 Other income, net 0.4 - - - - 1.9 2.4 Income tax benefit (provision) (3.4) (0.4) (4.0) (1.5) - (0.5) (9.7) JV and noncontrolling interests (0.2) - - - 0.9 - 0.7
Net Income 14.2 1.9 8.9 3.2 0.9 1.5 30.5
Diluted earnings per share 0.21 0.03 0.13 0.05 0.01 0.02 0.45
© 2018 Brooks Automation, Inc. • Proprietary Information

FY16 GAAP to Non-GAAP Reconciliation Consolidated Results
34 © 2018 Brooks Automation, Inc. • Proprietary Information
$ millions, except EPS GAAP
Results Acquisition-
Related Costs Amortization
Expense Restructuring
Charges
Tax Valuation Reversal
Other Special Charges
Non-GAAP Results
Revenue 560.3 - - - - 560.3
Gross profit 198.1 0.6 4.2 - - 202.9
Gross profit margin 35.4% 36.2%
Research and development (51.5) - - - - (51.5) Selling, general and administrative (130.3) 3.4 10.8 - 0.8 (115.3) Restructuring charges (12.0) - - 12.0 - -
Operating profit 4.2 4.0 15.0 12.0 0.8 36.1
Operating profit margin 0.8% 6.4%
Interest income, net 0.3 - - - - - 0.3 Other income, net (0.6) - - - - - (0.6) Income tax benefit (provision) (75.8) (0.8) (4.9) (3.0) 79.3 (0.3) (5.5) JV and noncontrolling interests 2.4 - - 2.4
Net Income (69.5) 3.2 10.1 9.0 79.3 0.5 32.6
Diluted earnings per share (1.01) 0.05 0.14 0.13 1.15 0.01 0.47
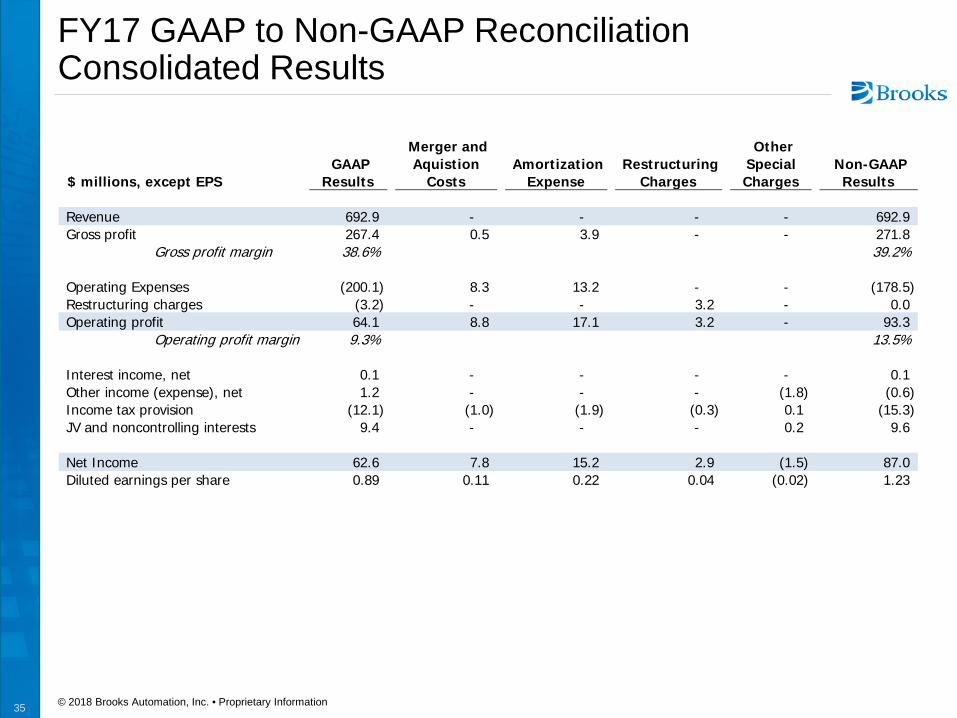
35
$ millions, except EPS GAAP
Results
Merger and Aquistion
Costs Amortization
Expense Restructuring
Charges
Other Special Charges
Non-GAAP Results
Revenue 692.9 - - - - 692.9 Gross profit 267.4 0.5 3.9 - - 271.8
Gross profit margin 38.6% 39.2%
Operating Expenses (200.1) 8.3 13.2 - - (178.5) Restructuring charges (3.2) - - 3.2 - 0.0 Operating profit 64.1 8.8 17.1 3.2 - 93.3
Operating profit margin 9.3% 13.5%
Interest income, net 0.1 - - - - 0.1 Other income (expense), net 1.2 - - - (1.8) (0.6) Income tax provision (12.1) (1.0) (1.9) (0.3) 0.1 (15.3) JV and noncontrolling interests 9.4 - - - 0.2 9.6
Net Income 62.6 7.8 15.2 2.9 (1.5) 87.0 Diluted earnings per share 0.89 0.11 0.22 0.04 (0.02) 1.23
FY17 GAAP to Non-GAAP Reconciliation Consolidated Results
© 2018 Brooks Automation, Inc. • Proprietary Information
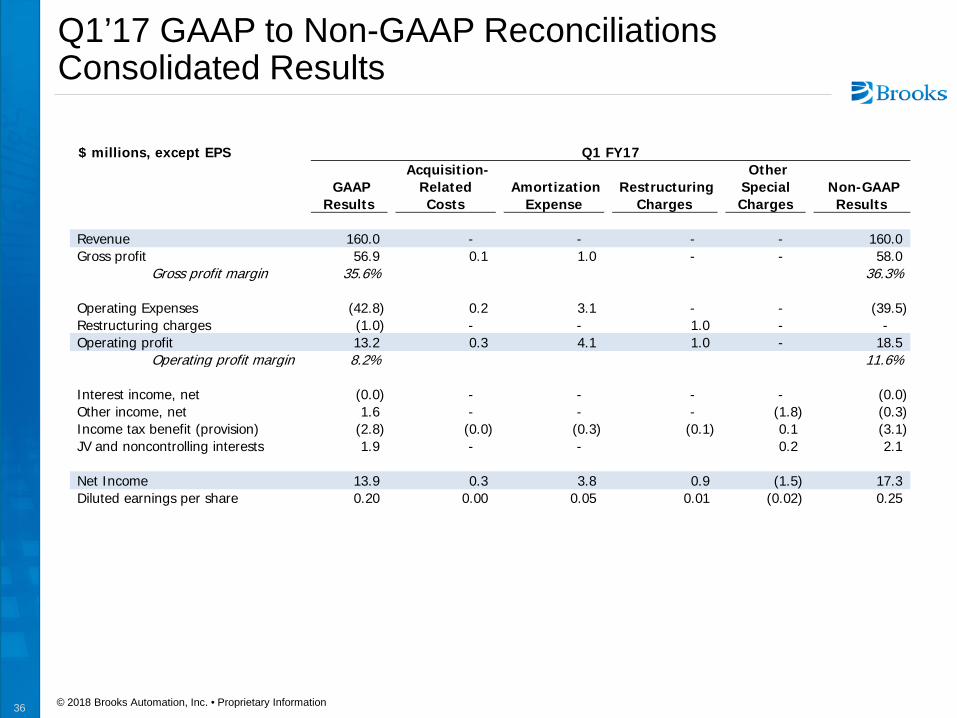
Q1’17 GAAP to Non-GAAP Reconciliations Consolidated Results
$ millions, except EPS
GAAP Results
Acquisition-Related Costs
Amortization Expense
Restructuring Charges
Other Special Charges
Non-GAAP Results
Revenue 160.0 - - - - 160.0 Gross profit 56.9 0.1 1.0 - - 58.0
Gross profit margin 35.6% 36.3%
Operating Expenses (42.8) 0.2 3.1 - - (39.5) Restructuring charges (1.0) - - 1.0 - - Operating profit 13.2 0.3 4.1 1.0 - 18.5
Operating profit margin 8.2% 11.6%
Interest income, net (0.0) - - - - (0.0) Other income, net 1.6 - - - (1.8) (0.3) Income tax benefit (provision) (2.8) (0.0) (0.3) (0.1) 0.1 (3.1) JV and noncontrolling interests 1.9 - - 0.2 2.1
Net Income 13.9 0.3 3.8 0.9 (1.5) 17.3 Diluted earnings per share 0.20 0.00 0.05 0.01 (0.02) 0.25
Q1 FY17
36 © 2018 Brooks Automation, Inc. • Proprietary Information

Q2’17 GAAP to Non-GAAP Reconciliations Consolidated Results
37
$ millions, except EPS
GAAP Results
Merger and Aquistion
Costs Amortization
Expense Restructuring
Charges
Other Special (Gains) Charges
Non-GAAP Results
Revenue 169.3 - - - - 169.3 Gross profit 64.5 0.4 1.1 - - 66.0
Gross profit margin 38.1% 39.0%
Operating Expenses (48.9) 0.9 3.3 - - (44.6) Restructuring charges (0.9) - - 0.9 - - Operating profit 14.8 1.3 4.4 0.9 - 21.3
Operating profit margin 8.7% 12.6%
Interest income, net 0.1 - - - - 0.1 Other income, net (0.3) - - - (0.3) Income tax benefit (provision) (3.4) (0.1) (0.5) (0.1) - (4.1) JV and noncontrolling interests 2.8 - - 2.8
Net Income 14.0 1.2 3.9 0.8 - 19.8 Diluted earnings per share 0.20 0.02 0.06 0.01 - 0.28
Q2 FY17
© 2018 Brooks Automation, Inc. • Proprietary Information

38
$ millions, except EPS
GAAP Results
Q3 FY17
Merger and Aquistion
Costs Amortization
Expense Restructuring
Charges
Non-GAAP Results
Q3 FY17
GAAP Results
Q4 FY17
Merger and Aquistion
Costs Amortization
Expense Restructuring
Charges
Non-GAAP Results
Q4 FY17
Revenue 181.7 - - - 181.7 181.9 - - - 181.9 Gross profit 71.6 0.1 1.1 - 72.7 74.4 - 0.8 - 75.2
Gross profit margin 39.4% 40.0% 40.9% 41.3%
Operating Expenses (52.0) 3.7 3.3 - (45.0) (56.4) 3.5 3.6 - (49.4) Restructuring charges (0.8) - - 0.8 - (0.6) - - 0.6 - Operating profit 18.8 3.7 4.3 0.8 27.7 17.4 3.5 4.4 0.6 25.8
Operating profit margin 10.3% 15.2% 9.6% 14.2%
Interest income, net 0.0 - - - 0.0 (0.1) - - - (0.1) Other income (expense), net (0.3) - - - (0.3) 0.2 - - - 0.2 Income tax provision (3.7) (0.4) (0.4) (0.1) (4.6) (2.2) (0.5) (0.7) (0.1) (3.5) JV and noncontrolling interests 2.5 - - - 2.5 2.1 - - - 2.1
Net Income 17.4 3.4 3.9 0.7 25.4 17.4 3.4 3.9 0.7 24.5 Diluted earnings per share 0.25 0.05 0.06 0.01 0.36 0.25 0.04 0.05 0.01 0.35
Q3'17 Q4'17
Q3’17 and Q4’17 GAAP to Non-GAAP Reconciliations Consolidated Results
© 2018 Brooks Automation, Inc. • Proprietary Information

GAAP to Non-GAAP Reconciliation Quarterly EBITDA and Adjusted EBITDA
39 © 2018 Brooks Automation, Inc. • Proprietary Information
Q1'17 Q2'17 Q3'17 Q4'17 Q1'18
Net income attributable to Brooks 13.9 14.0 17.4 17.4 16.5
Non-GAAP adjustments: Interest income (0.1) (0.2) (0.1) (0.0) (0.1) Interest expense 0.1 0.1 0.1 0.1 2.2 Income tax provision 2.8 3.4 3.7 2.2 2.8 Depreciation 2.7 2.6 2.6 3.1 3.0 Amortization of intangible assets 4.1 4.4 4.3 4.4 5.5
EBITDA 23.5 24.3 27.9 27.2 29.9
Purchase accounting impact on inventory and contracts acquired 0.1 0.4 0.1 - 1.2
Stock-based compensation 2.5 4.4 4.2 6.2 4.8 Restructuring charges 1.0 0.9 0.8 0.6 - Merger and acquisition costs/ Other (1.4) 0.9 3.7 3.5 0.6
Adjusted EBITDA 25.6 30.8 36.7 37.4 36.5
$ millions

GAAP to Non-GAAP Reconciliation Annual EBITDA and Adjusted EBITDA
40 © 2018 Brooks Automation, Inc. • Proprietary Information
$ millions FY13 FY14 FY15 FY16 FY17
Net income (loss) attributable to Brooks (2.2) 31.4 14.2 (69.5) 62.6
Non-GAAP adjustments: Interest income (1.0) (1.0) (0.9) (0.5) (0.5) Interest expense 0.0 0.2 0.4 0.2 0.4 Income tax provision (5.0) (2.0) 3.4 75.8 12.1 Depreciation 13.7 12.7 12.3 13.1 11.0 Amortization of intangible assets 9.8 10.6 12.9 15.0 17.1
EBITDA 15.2 51.9 42.3 34.1 102.8
Purchase accounting impact on inventory and contracts acquired 3.0 2.3 1.5 0.6 0.5
Stock-based compensation 7.6 10.9 12.2 11.7 17.3 Restructuring charges 6.4 6.3 4.7 12.0 3.2 Merger and acquisition costs / Other 1.9 4.0 3.6 4.1 6.7
Adjusted EBITDA 29.1 45.4 64.2 62.6 130.5

41
FY13 – FY17 GAAP to Non-GAAP Reconciliation Semiconductor Solutions
© 2018 Brooks Automation, Inc. • Proprietary Information
$ millions FY13 FY14 FY15 FY16 FY17
GAAP gross profit 118.2 143.9 171.4 159.0 212.7
Non-GAAP adjustments: Amortization of intangible assets 2.2 2.9 3.6 2.7 2.5 Impairment of completed technology
intangible assets - - - - - Inventory write-downs related to
restructuring programs - 0.1 - - - Purchase accounting impact on
inventory and contracts acquired 2.7 1.9 0.6 0.6 0.1
Non-GAAP gross profit 123.1 148.8 175.5 162.4 215.3
Operating expenses 107.5 120.6 121.7 121.1 125.9
Non-GAAP operating profit 15.6 28.2 53.9 41.3 89.3
BrooksSemiconductor Solutions

42 © 2018 Brooks Automation, Inc. • Proprietary Information
FY13 – FY17 GAAP to Non-GAAP Reconciliation Life Science Systems
$ millions FY13 FY14 FY15 FY16 FY17
GAAP gross profit 14.1 23.4 17.7 39.1 54.8
Non-GAAP adjustments: Amortization of intangible assets 1.8 1.6 1.6 1.5 1.4 Impairment of completed technology
intangible assets 1.9 0.4 - - - Inventory write-downs related to
restructuring programs - 0.2 - - - Purchase accounting impact on
inventory and contracts acquired 0.4 0.4 1.0 - 0.4
Non-GAAP gross profit 18.2 25.9 20.3 40.5 56.6
Operating expenses 26.5 31.9 37.3 45.5 50.1
Non-GAAP operating profit (8.3) (5.9) (17.0) (5.0) 6.5
Life Science SystemsBrooks

43
FY16 – FY17 GAAP to Non-GAAP Reconciliation Quarterly BLSS Results
© 2018 Brooks Automation, Inc. • Proprietary Information
$ millions Q1'16 Q2'16 Q3'16 Q4'16 Q1'17 Q2'17 Q3'17 Q4'17
GAAP gross profit 5.9 9.9 11.3 12.1 11.5 13.2 13.5 16.6
Non-GAAP adjustments: Amortization of intangible assets 0.4 0.3 0.4 0.4 0.4 0.4 0.4 0.2 Purchase accounting impact on
inventory and contracts acquired - - - - 0.1 0.3 0.1 -
Non-GAAP gross profit 6.3 10.2 11.6 12.4 11.9 13.9 14.0 16.8
Operating expenses 10.5 12.1 12.0 10.9 11.4 11.9 12.4 14.4
Non-GAAP operating profit (4.2) (1.9) (0.4) 1.5 0.5 2.0 1.6 2.3
Life Science SystemsBrooks

GAAP to Non-GAAP Reconciliation Quarterly Operating Performance
44
$ millions, except EPS
GAAP Results
Q4 FY17
Merger and Acquisition
Costs
Amortization
Expense Restructuring
Charges
Non-GAAP Results
Q4 FY17
GAAP Results
Q1 FY18
Merger and
Acquisition Costs
Amortization
Expense Tax
Reform
Non-GAAP Results
Q1 FY18
Revenue 181.9 - - - 181.9 189.3 - - - 189.3 Gross profit 74.4 - 0.8 - 75.2 75.2 1.2 0.9 - 77.3
Gross profit margin 40.9% 41.3% 39.7% 40.8%
Operating Expenses (56.4) 3.5 3.6 - (49.4) (54.4) 0.6 4.6 - (49.2) Restructuring charges (0.6) - - 0.6 - - - - - - Operating profit 17.4 3.5 4.4 0.6 25.8 20.8 1.8 5.5 - 28.1
Operating profit margin 9.6% 14.2% 11.0% 14.8%
Interest expense, net (0.1) - - - (0.1) (2.0) - - - (2.0) Other income (expense), net 0.2 - - - 0.2 (1.7) - - - (1.7) Income tax expense (2.2) (0.5) (0.7) (0.1) (3.5) (2.8) (0.3) (0.3) (0.7) (4.1) JV and noncontrolling interests 2.1 - - - 2.1 2.2 - - - 2.2
Net Income 17.4 3.0 3.7 0.5 24.5 16.5 1.5 5.2 (0.7) 22.5 Diluted earnings per share 0.25 0.04 0.05 0.01 0.35 0.23 0.02 0.07 (0.01) 0.32
Q1 FY18Q4 FY17
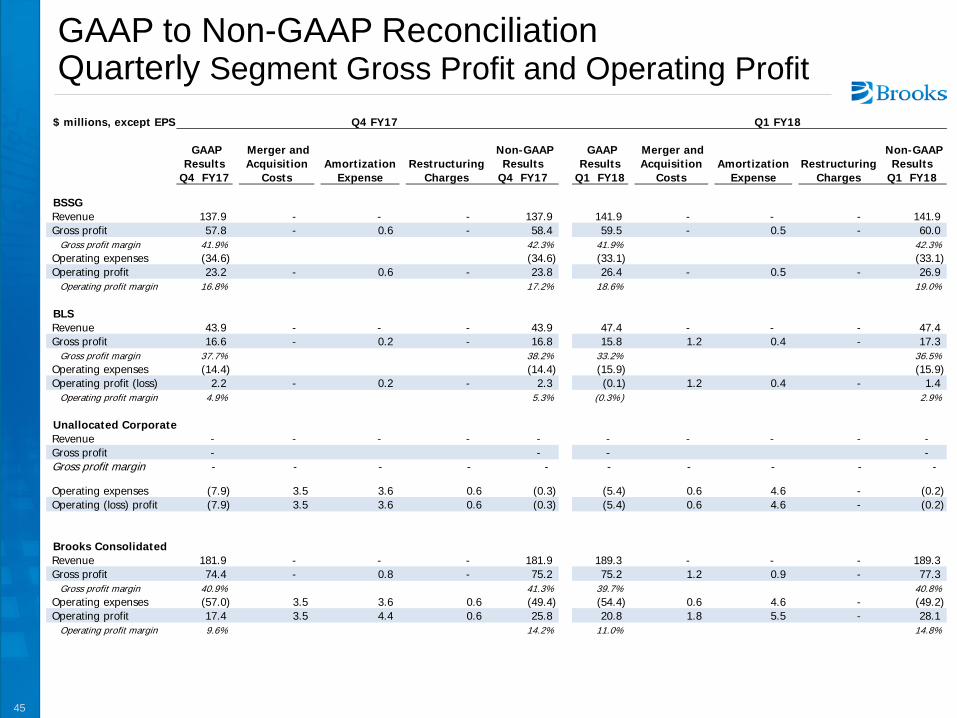
GAAP to Non-GAAP Reconciliation Quarterly Segment Gross Profit and Operating Profit
45
$ millions, except EPS
GAAP Results
Q4 FY17
Merger and Acquisition
Costs
Amortization
Expense
Restructuring
Charges
Non-GAAP Results
Q4 FY17
GAAP Results
Q1 FY18
Merger and Acquisition
Costs
Amortization
Expense
Restructuring
Charges
Non-GAAP Results
Q1 FY18
BSSGRevenue 137.9 - - - 137.9 141.9 - - - 141.9 Gross profit 57.8 - 0.6 - 58.4 59.5 - 0.5 - 60.0 Gross profit margin 41.9% 42.3% 41.9% 42.3%Operating expenses (34.6) (34.6) (33.1) (33.1) Operating profit 23.2 - 0.6 - 23.8 26.4 - 0.5 - 26.9 Operating profit margin 16.8% 17.2% 18.6% 19.0%
BLSRevenue 43.9 - - - 43.9 47.4 - - - 47.4 Gross profit 16.6 - 0.2 - 16.8 15.8 1.2 0.4 - 17.3 Gross profit margin 37.7% 38.2% 33.2% 36.5%Operating expenses (14.4) (14.4) (15.9) (15.9) Operating profit (loss) 2.2 - 0.2 - 2.3 (0.1) 1.2 0.4 - 1.4 Operating profit margin 4.9% 5.3% (0.3%) 2.9%
Unallocated CorporateRevenue - - - - - - - - - - Gross profit - - - - Gross profit margin - - - - - - - - - -
Operating expenses (7.9) 3.5 3.6 0.6 (0.3) (5.4) 0.6 4.6 - (0.2) Operating (loss) profit (7.9) 3.5 3.6 0.6 (0.3) (5.4) 0.6 4.6 - (0.2)
Brooks ConsolidatedRevenue 181.9 - - - 181.9 189.3 - - - 189.3 Gross profit 74.4 - 0.8 - 75.2 75.2 1.2 0.9 - 77.3 Gross profit margin 40.9% 41.3% 39.7% 40.8%Operating expenses (57.0) 3.5 3.6 0.6 (49.4) (54.4) 0.6 4.6 - (49.2) Operating profit 17.4 3.5 4.4 0.6 25.8 20.8 1.8 5.5 - 28.1 Operating profit margin 9.6% 14.2% 11.0% 14.8%
Q4 FY17 Q1 FY18
46 © 2018 Brooks Automation, Inc. • Proprietary Information
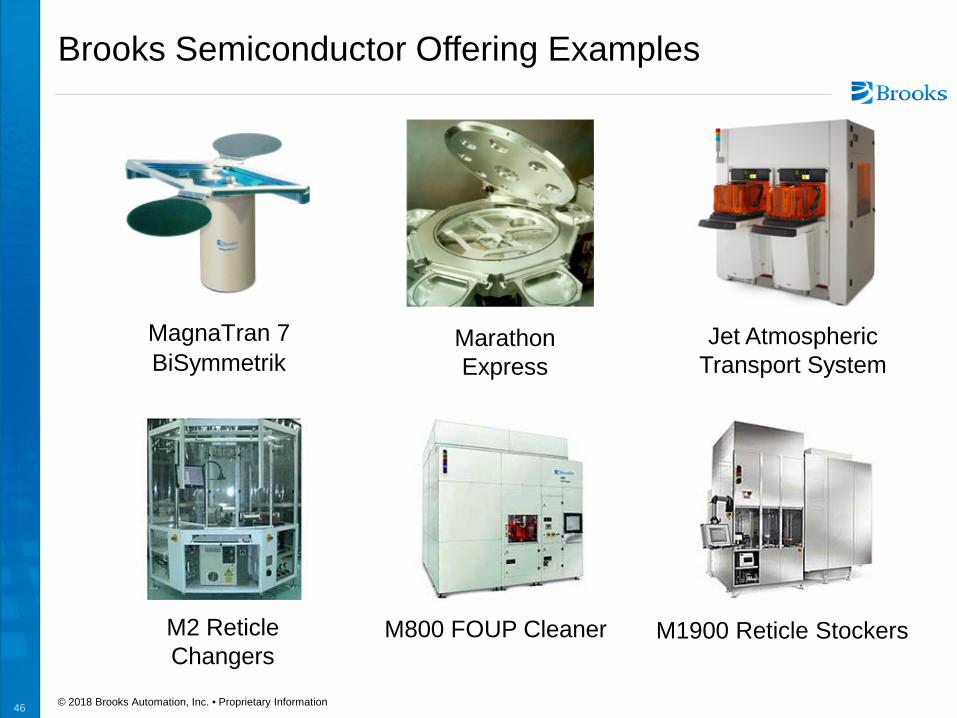
Brooks Semiconductor Offering Examples
Marathon Express
MagnaTran 7 BiSymmetrik
Jet Atmospheric Transport System
M800 FOUP Cleaner M2 Reticle Changers
M1900 Reticle Stockers

47 © 2018 Brooks Automation, Inc. • Proprietary Information
Brooks Life Sciences Offerings
BioStore™ III Cryo BioStore II BioStorage Services
FluidX Consumables Cool Lab Workflow Products 4titude Consumables