brookfield renewable partners (bep)/media/files/b/brookfield...bep (nyse) 25% 11% 9% primary font...
TRANSCRIPT
Brookfield Renewable Partners (BEP)
CORPORATE PROFILE
FEBRUARY 2018
2
Primary Font Colour
Title Slide Font
Light Background
R17 G17 B17
Dark Backdrop
R255 G255 B255
Business Group Colours
Real Estate
R71 G151 B181
Infrastructure
R83 G55 B82
Renewable
R92 G153 B121
Private Equity
R230 G203 B140
R244 G124 B16
R77 G77 B77
R200 G200 B200
R17 G17 B17
Logo & Divider Slide Font
R15 G53 B87
PRIMARY PALETTE
SECONDARY PALETTE
Sub-headers & Emphasis Text
R64 G126 B182
Cautionary Statement Regarding Forward-Looking Statements
This presentation contains forward-looking statements and information, within the meaning of Canadian securities laws and “forward-looking statements” within the meaning of Section 27A of the U.S. Securities
Act of 1933, as amended, Section 21E of the U.S. Securities Exchange Act of 1934, as amended, “safe harbor” provisions of the United States Private Securities Litigation Reform Act of 1995 and in any
applicable Canadian securities regulations, concerning the business and operations of Brookfield Renewable. Forward-looking statements may include estimates, plans, expectations, opinions, forecasts,
projections, guidance or other statements that are not statements of fact. Forward-looking statements in this presentation include statements regarding the quality of Brookfield Renewable’s assets and the
resiliency of the cash flow they will generate, Brookfield Renewable’s anticipated financial performance and payout ratio, future commissioning of assets, the contracted nature of our portfolio, technology
diversification, acquisition opportunities, financing and refinancing opportunities, future energy prices and demand for electricity, achieving long-term average generation, project development and capital
expenditure costs, energy policies, economic growth, growth potential of the renewable asset class, the future growth prospects and distribution profile of Brookfield Renewable and Brookfield Renewable’s
access to capital. In some cases, forward-looking statements can be identified by the use of words such as “plans”, “expects”, “scheduled”, “estimates”, “intends”, “anticipates”, “believes”, “potentially”, “tends”,
“continue”, “attempts”, “likely”, “primarily”, “approximately”, “endeavours”, “pursues”, “strives”, “seeks”, “targets”, “believes”, or variations of such words and phrases, or statements that certain actions, events or
results “may”, “could”, “would”, “should”, “might” or “will” be taken, occur or be achieved. Although we believe that our anticipated future results, performance or achievements expressed or implied by the
forward-looking statements and information in this presentation are based upon reasonable assumptions and expectations, we cannot assure you that such expectations will prove to have been correct. You
should not place undue reliance on forward-looking statements and information as such statements and information involve known and unknown risks, uncertainties and other factors which may cause our
actual results, performance or achievements to differ materially from anticipated future results, performance or achievement expressed or implied by such forward-looking statements and information.
Factors that could cause actual results to differ materially from those contemplated or implied by forward-looking statements include, but are not limited to, the following: we are not subject to the same
disclosure requirements as a U.S. domestic issuer; the separation of economic interest from control or the incurrence of debt at multiple levels within our organizational structure; being deemed an “investment
company” under the U.S. Investment Company Act of 1940; the effectiveness of our internal controls over financial reporting; changes to hydrology at our hydroelectric stations, to wind conditions at our wind
energy facilities or to crop supply or weather generally at any biomass cogeneration facility; counterparties to our contracts not fulfilling their obligations; increases in water rental costs (or similar fees) or
changes to the regulation of water supply; volatility in supply and demand in the energy market; the increasing amount of uncontracted generation in our portfolio; industry risks relating to the power markets in
which we operate; increased regulation of our operations; contracts, concessions and licenses expiring and not being renewed or replaced on similar terms; increases in the cost of operating our plants; our
failure to comply with conditions in, or our inability to maintain, governmental permits; equipment failures; dam failures and the costs of repairing such failures; force majeure events; uninsurable losses; adverse
changes in currency exchange rates; availability and access to interconnection facilities and transmission systems; health, safety, security and environmental risks; disputes, governmental and regulatory
investigations and litigation; our operations being affected by local communities; fraud, bribery, corruption, other illegal acts or inadequate or failed internal processes or systems; our reliance on computerized
business systems; advances in technology that impair or eliminate the competitive advantage of our projects; newly developed technologies in which we invest not performing as anticipated; labour disruptions
and economically unfavourable collective bargaining agreements; our inability to finance our operations due to the status of the capital markets; our inability to effectively manage our foreign currency exposure;
operating and financial restrictions imposed on us by our loan, debt and security agreements; changes in our credit ratings; changes to government regulations that provide incentives for renewable energy; our
inability to identify sufficient investment opportunities and complete transactions; the growth of our portfolio and our inability to realize the expected benefits of our transactions; our inability to develop existing
sites or find new sites suitable for the development of greenfield projects; delays, cost overruns and other problems associated with the construction, development and operation of our generating facilities; the
arrangements we enter into with communities and joint venture partners; Brookfield Asset Management’s election not to source acquisition opportunities for us and our lack of access to all renewable power
acquisitions that Brookfield Asset Management identifies; our lack of control over all our operations; our ability to issue equity or debt for future acquisitions and developments is dependent on capital markets;
foreign laws or regulation to which we become subject as a result of future acquisitions in new markets; the departure of some or all of Brookfield Asset Management’s key professionals; our relationship with,
and our dependence on, Brookfield Asset Management and Brookfield Asset Management’s significant influence over us; and risks related to changes in how Brookfield Asset Management elects to hold its
ownership interests in the Partnership.
We caution that the foregoing list of important factors that may affect future results is not exhaustive. The forward-looking statements represent our views as of the date of this presentation and should not be
relied upon as representing our views as of any subsequent date. While we anticipate that subsequent events and developments may cause our views to change, we disclaim any obligation to update the
forward-looking statements, other than as required by applicable law. For further information on these known and unknown risks, please see “Risk Factors” included in our Form 20-F.
Cautionary Statement Regarding Use Of Non-IFRS Measures
This presentation contains references to Adjusted Earnings Before Interest, Taxes, Depreciation and Amortization (“Adjusted EBITDA”), Funds From Operations (“FFO”) and Funds From Operations per Unit
(“FFO per Unit”), which are not generally accepted accounting measures under IFRS and therefore may differ from definitions of Adjusted EBITDA, Funds From Operations and Funds From Operations per Unit
used by other entities. We believe that Adjusted EBITDA, Funds From Operations and Funds From Operations per Unit are useful supplemental measures that may assist investors in assessing the financial
performance and the cash anticipated to be generated by our operating portfolio. Neither Adjusted EBITDA, Funds From Operations nor Funds From Operations per Unit should be considered as the sole
measure of our performance and should not be considered in isolation from, or as a substitute for, analysis of our financial statements prepared in accordance with IFRS.
References to Brookfield Renewable are to Brookfield Renewable Partners L.P. together with its subsidiary and operating entities unless the context reflects otherwise.
All amounts are in U.S. dollars and presented on a consolidated basis unless otherwise specified.
Primary Font Colour
Title Slide Font
Light Background
R17 G17 B17
Dark Backdrop
R255 G255 B255
Business Group Colours
Real Estate
R71 G151 B181
Infrastructure
R83 G55 B82
Renewable
R92 G153 B121
Private Equity
R230 G203 B140
R244 G124 B16
R77 G77 B77
R200 G200 B200
R17 G17 B17
Logo & Divider Slide Font
R15 G53 B87
PRIMARY PALETTE
SECONDARY PALETTE
Sub-headers & Emphasis Text
R64 G126 B182
Table of Contents
Who We Are
Page 4
Portfolio Overview
Page 10
Growth
Page 15
Financial Profile
Page 24
Appendix
Page 29
4
Who We Are

Primary Font Colour
Title Slide Font
Light Background
R17 G17 B17
Dark Backdrop
R255 G255 B255
Business Group Colours
Real Estate
R71 G151 B181
Infrastructure
R83 G55 B82
Renewable
R92 G153 B121
Private Equity
R230 G203 B140
R244 G124 B16
R77 G77 B77
R200 G200 B200
R17 G17 B17
Logo & Divider Slide Font
R15 G53 B87
PRIMARY PALETTE
SECONDARY PALETTE
Sub-headers & Emphasis Text
R64 G126 B182
5
We are a multi-technology, globally
diversified, owner and operator of
renewable power assets

6
Primary Font Colour
Title Slide Font
Light Background
R17 G17 B17
Dark Backdrop
R255 G255 B255
Business Group Colours
Real Estate
R71 G151 B181
Infrastructure
R83 G55 B82
Renewable
R92 G153 B121
Private Equity
R230 G203 B140
R244 G124 B16
R77 G77 B77
R200 G200 B200
R17 G17 B17
Logo & Divider Slide Font
R15 G53 B87
PRIMARY PALETTE
SECONDARY PALETTE
Sub-headers & Emphasis Text
R64 G126 B182
Leader in Renewable Generation
841 power generating facilities
$40 billion TOTAL POWER ASSETS
24 markets in 14 countries
16,400 MEGAWATTS OF CAPACITY
Situated on 81 river systems
82% HYDROELECTRIC GENERATION
One of the largest public pure-play renewable businesses globally
100 years of experience in power generation
Full operating, development and power marketing capabilities
Over 2,000 operating employees

7
Primary Font Colour
Title Slide Font
Light Background
R17 G17 B17
Dark Backdrop
R255 G255 B255
Business Group Colours
Real Estate
R71 G151 B181
Infrastructure
R83 G55 B82
Renewable
R92 G153 B121
Private Equity
R230 G203 B140
R244 G124 B16
R77 G77 B77
R200 G200 B200
R17 G17 B17
Logo & Divider Slide Font
R15 G53 B87
PRIMARY PALETTE
SECONDARY PALETTE
Sub-headers & Emphasis Text
R64 G126 B182
Simple Strategy
Simple strategy with a proven track record of success through all cycles
Acquire and develop high-quality
renewable power assets and businesses
below intrinsic value
Optimize cash flows by applying our
operating expertise to enhance value
Finance our businesses on an
investment grade basis
8
Primary Font Colour
Title Slide Font
Light Background
R17 G17 B17
Dark Backdrop
R255 G255 B255
Business Group Colours
Real Estate
R71 G151 B181
Infrastructure
R83 G55 B82
Renewable
R92 G153 B121
Private Equity
R230 G203 B140
R244 G124 B16
R77 G77 B77
R200 G200 B200
R17 G17 B17
Logo & Divider Slide Font
R15 G53 B87
PRIMARY PALETTE
SECONDARY PALETTE
Sub-headers & Emphasis Text
R64 G126 B182
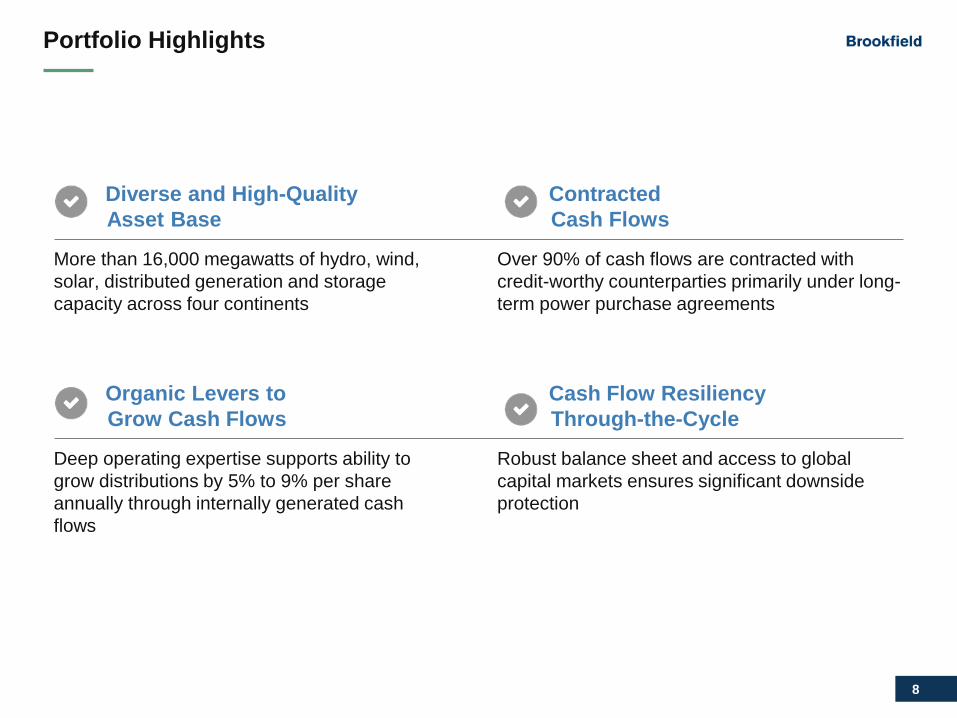
Portfolio Highlights
Diverse and High-Quality
Asset Base
More than 16,000 megawatts of hydro, wind,
solar, distributed generation and storage
capacity across four continents
Organic Levers to
Grow Cash Flows
Deep operating expertise supports ability to
grow distributions by 5% to 9% per share
annually through internally generated cash
flows
Contracted
Cash Flows
Over 90% of cash flows are contracted with
credit-worthy counterparties primarily under long-
term power purchase agreements
Cash Flow Resiliency
Through-the-Cycle
Robust balance sheet and access to global
capital markets ensures significant downside
protection
9
Primary Font Colour
Title Slide Font
Light Background
R17 G17 B17
Dark Backdrop
R255 G255 B255
Business Group Colours
Real Estate
R71 G151 B181
Infrastructure
R83 G55 B82
Renewable
R92 G153 B121
Private Equity
R230 G203 B140
R244 G124 B16
R77 G77 B77
R200 G200 B200
R17 G17 B17
Logo & Divider Slide Font
R15 G53 B87
PRIMARY PALETTE
SECONDARY PALETTE
Sub-headers & Emphasis Text
R64 G126 B182
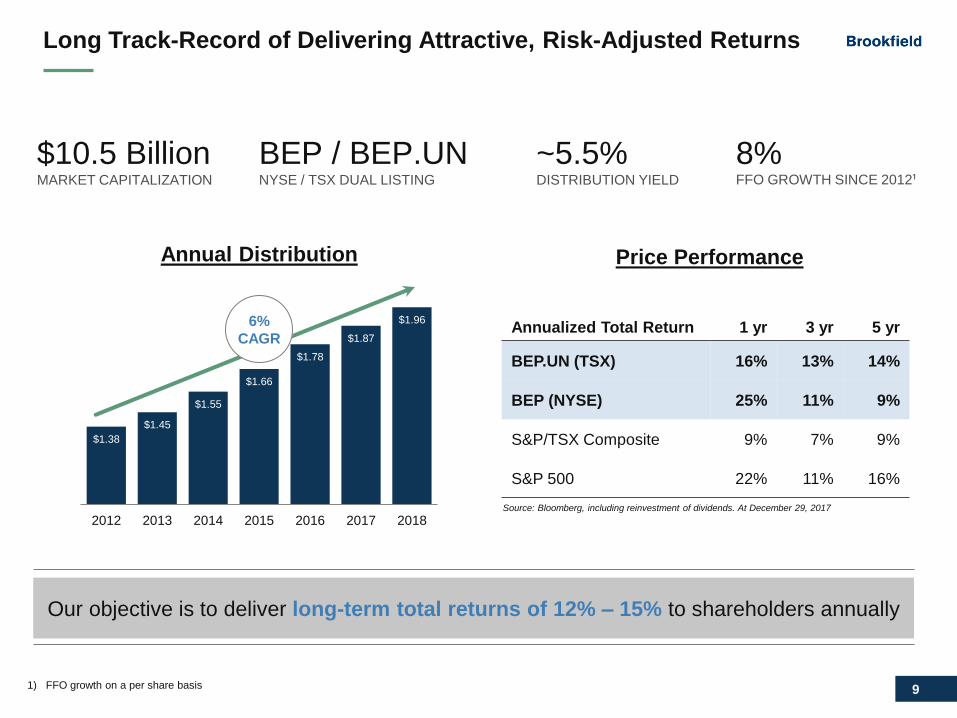
Long Track-Record of Delivering Attractive, Risk-Adjusted Returns
Our objective is to deliver long-term total returns of 12% ‒ 15% to shareholders annually
$10.5 Billion MARKET CAPITALIZATION
8% FFO GROWTH SINCE 2012¹
BEP / BEP.UN NYSE / TSX DUAL LISTING
~5.5% DISTRIBUTION YIELD
Annualized Total Return 1 yr 3 yr 5 yr
BEP.UN (TSX) 16% 13% 14%
BEP (NYSE) 25% 11% 9%
S&P/TSX Composite 9% 7% 9%
S&P 500 22% 11% 16%
Source: Bloomberg, including reinvestment of dividends. At December 29, 2017
$1.38
$1.45
$1.55
$1.66
$1.78
$1.87
$1.96
2012 2013 2014 2015 2016 2017 2018
Annual Distribution Price Performance
6%
CAGR
1) FFO growth on a per share basis

10
Portfolio Overview
11
Primary Font Colour
Title Slide Font
Light Background
R17 G17 B17
Dark Backdrop
R255 G255 B255
Business Group Colours
Real Estate
R71 G151 B181
Infrastructure
R83 G55 B82
Renewable
R92 G153 B121
Private Equity
R230 G203 B140
R244 G124 B16
R77 G77 B77
R200 G200 B200
R17 G17 B17
Logo & Divider Slide Font
R15 G53 B87
PRIMARY PALETTE
SECONDARY PALETTE
Sub-headers & Emphasis Text
R64 G126 B182
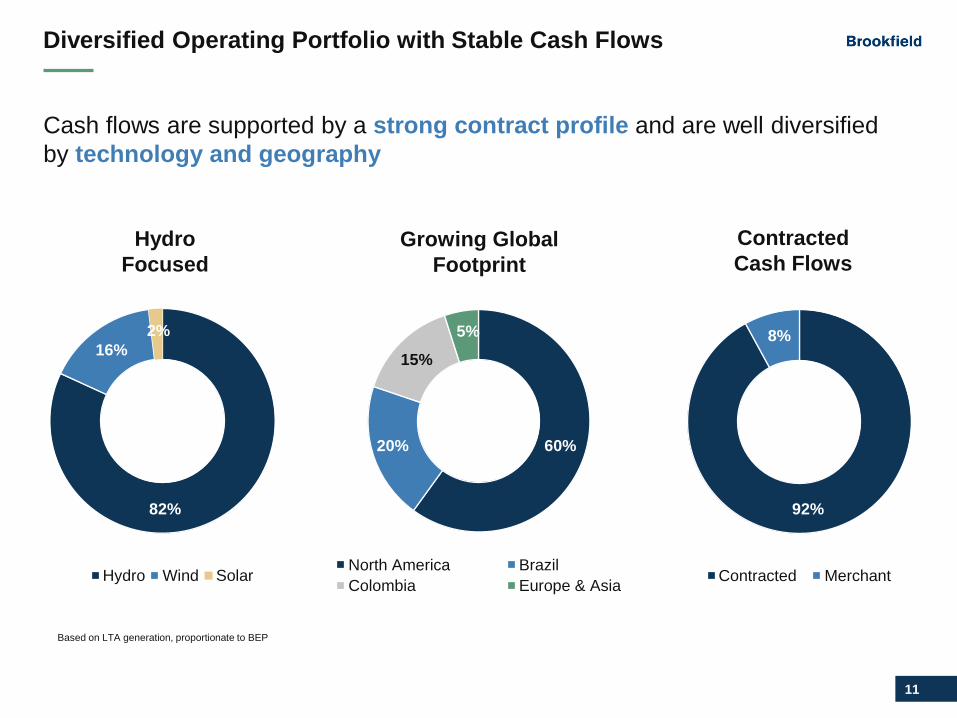
Diversified Operating Portfolio with Stable Cash Flows
Cash flows are supported by a strong contract profile and are well diversified
by technology and geography
Hydro Wind Solar
16%
North America Brazil
Colombia Europe & Asia
60%
5%
15%
20%
Contracted Merchant
92%
8%
82%
Hydro
Focused Growing Global
Footprint Contracted
Cash Flows
2%
Based on LTA generation, proportionate to BEP

12
Primary Font Colour
Title Slide Font
Light Background
R17 G17 B17
Dark Backdrop
R255 G255 B255
Business Group Colours
Real Estate
R71 G151 B181
Infrastructure
R83 G55 B82
Renewable
R92 G153 B121
Private Equity
R230 G203 B140
R244 G124 B16
R77 G77 B77
R200 G200 B200
R17 G17 B17
Logo & Divider Slide Font
R15 G53 B87
PRIMARY PALETTE
SECONDARY PALETTE
Sub-headers & Emphasis Text
R64 G126 B182
Global Operations with Local Presence
We have integrated operating platforms on four continents with local operating and
power marketing expertise
NORTH AMERICA 8,700 megawatts
$26 Billion in total power assets
SOUTH AMERICA 4,400 megawatts
$10.5 Billion in total power assets
ASIA 600 megawatts
$0.5 Billion in total power assets
EUROPE 2,700 megawatts
$3 Billion in total power assets
13
Primary Font Colour
Title Slide Font
Light Background
R17 G17 B17
Dark Backdrop
R255 G255 B255
Business Group Colours
Real Estate
R71 G151 B181
Infrastructure
R83 G55 B82
Renewable
R92 G153 B121
Private Equity
R230 G203 B140
R244 G124 B16
R77 G77 B77
R200 G200 B200
R17 G17 B17
Logo & Divider Slide Font
R15 G53 B87
PRIMARY PALETTE
SECONDARY PALETTE
Sub-headers & Emphasis Text
R64 G126 B182
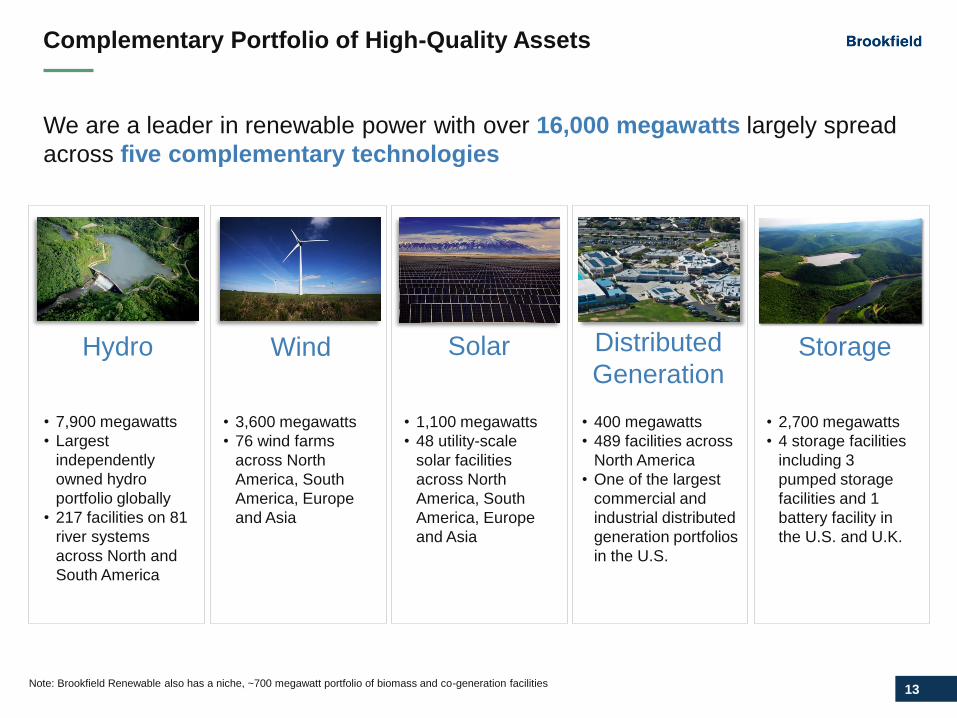
Complementary Portfolio of High-Quality Assets
We are a leader in renewable power with over 16,000 megawatts largely spread
across five complementary technologies
Wind Solar
Distributed
Generation Storage Hydro
• 7,900 megawatts
• Largest
independently
owned hydro
portfolio globally
• 217 facilities on 81
river systems
across North and
South America
• 3,600 megawatts
• 76 wind farms
across North
America, South
America, Europe
and Asia
• 1,100 megawatts
• 48 utility-scale
solar facilities
across North
America, South
America, Europe
and Asia
• 400 megawatts
• 489 facilities across
North America
• One of the largest
commercial and
industrial distributed
generation portfolios
in the U.S.
• 2,700 megawatts
• 4 storage facilities
including 3
pumped storage
facilities and 1
battery facility in
the U.S. and U.K.
Note: Brookfield Renewable also has a niche, ~700 megawatt portfolio of biomass and co-generation facilities
14
Primary Font Colour
Title Slide Font
Light Background
R17 G17 B17
Dark Backdrop
R255 G255 B255
Business Group Colours
Real Estate
R71 G151 B181
Infrastructure
R83 G55 B82
Renewable
R92 G153 B121
Private Equity
R230 G203 B140
R244 G124 B16
R77 G77 B77
R200 G200 B200
R17 G17 B17
Logo & Divider Slide Font
R15 G53 B87
PRIMARY PALETTE
SECONDARY PALETTE
Sub-headers & Emphasis Text
R64 G126 B182
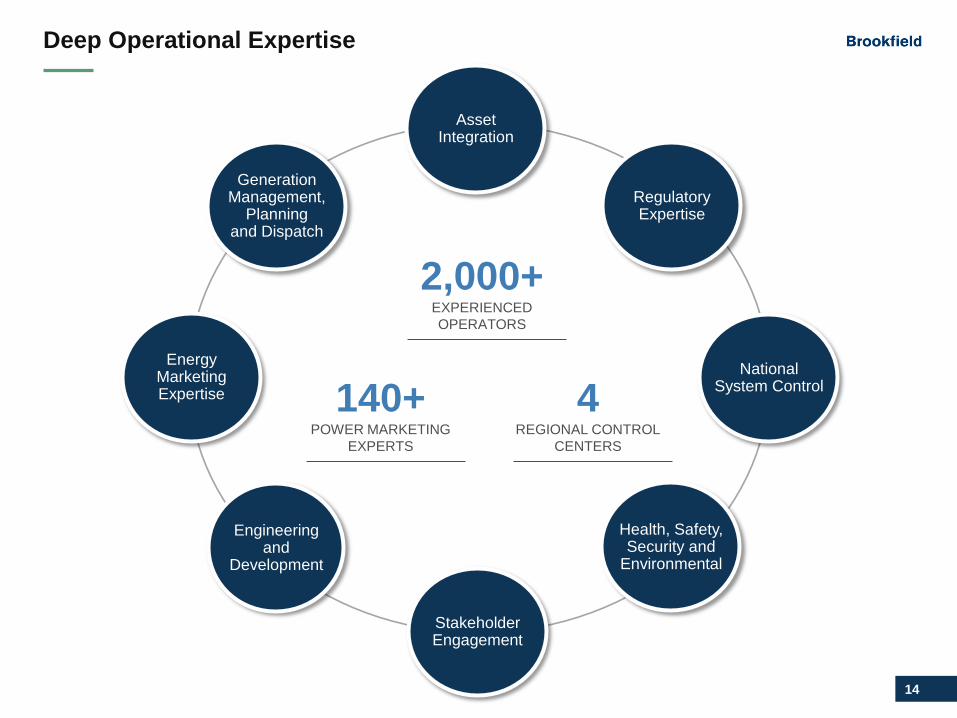
Deep Operational Expertise
2,000+ EXPERIENCED
OPERATORS
140+ POWER MARKETING
EXPERTS
4 REGIONAL CONTROL
CENTERS
Generation Management,
Planning and Dispatch
Asset Integration
Asset Integration
Asset Integration Regulatory Expertise
Asset Integration National
System Control
Energy Marketing Expertise
Engineering and
Development
Asset Integration
Stakeholder Engagement
Asset Integration
Health, Safety, Security and
Environmental

15
Growth

16
Primary Font Colour
Title Slide Font
Light Background
R17 G17 B17
Dark Backdrop
R255 G255 B255
Business Group Colours
Real Estate
R71 G151 B181
Infrastructure
R83 G55 B82
Renewable
R92 G153 B121
Private Equity
R230 G203 B140
R244 G124 B16
R77 G77 B77
R200 G200 B200
R17 G17 B17
Logo & Divider Slide Font
R15 G53 B87
PRIMARY PALETTE
SECONDARY PALETTE
Sub-headers & Emphasis Text
R64 G126 B182
Organic Cash Flow Growth
BEP is focused on delivering 5% to 9% distribution growth annually on a per
unit basis through cash flows generated from our existing business
• Growth target can be achieved from organic initiatives and fully funded by internally
generated cash flow
‒ We do not rely on M&A to achieve cash flow growth targets
‒ This does not account for the embedded optionality of our 2.5 TWh merchant hydro
portfolio in the United States where each $10/MWh increase in revenue translates
to $25 million in incremental FFO
Embedded
Inflation
Escalation
(1% to 2%)
Expected
Margin
Expansion
(2% to 4%)
FFO per Unit
Growth
Potential
(6% to 11%)
Advanced
Development
Pipeline
(3% to 5%)

17
Primary Font Colour
Title Slide Font
Light Background
R17 G17 B17
Dark Backdrop
R255 G255 B255
Business Group Colours
Real Estate
R71 G151 B181
Infrastructure
R83 G55 B82
Renewable
R92 G153 B121
Private Equity
R230 G203 B140
R244 G124 B16
R77 G77 B77
R200 G200 B200
R17 G17 B17
Logo & Divider Slide Font
R15 G53 B87
PRIMARY PALETTE
SECONDARY PALETTE
Sub-headers & Emphasis Text
R64 G126 B182
Inflation: $50 million FFO Contribution Over Five Years
Our revenues are indexed to inflation providing for 1% – 2% annual FFO growth
Proportional Basis Brazil
North
America Colombia
Annual
Total
Revenues1 ($ million) $200 $1,000 $190 $1,390
% Indexed to inflation 100% 30% 100%
Estimated long-term inflation 4.5% 2.0% 3.5%
Expected annual revenue uplift ($ million) $9 $6 $6 $21
Expected FFO margin 60% 50% 35% 48%
Expected annual FFO uplift ($ million) $5 $3 $2 $10
1) Normalized 2016 revenues
18
Primary Font Colour
Title Slide Font
Light Background
R17 G17 B17
Dark Backdrop
R255 G255 B255
Business Group Colours
Real Estate
R71 G151 B181
Infrastructure
R83 G55 B82
Renewable
R92 G153 B121
Private Equity
R230 G203 B140
R244 G124 B16
R77 G77 B77
R200 G200 B200
R17 G17 B17
Logo & Divider Slide Font
R15 G53 B87
PRIMARY PALETTE
SECONDARY PALETTE
Sub-headers & Emphasis Text
R64 G126 B182
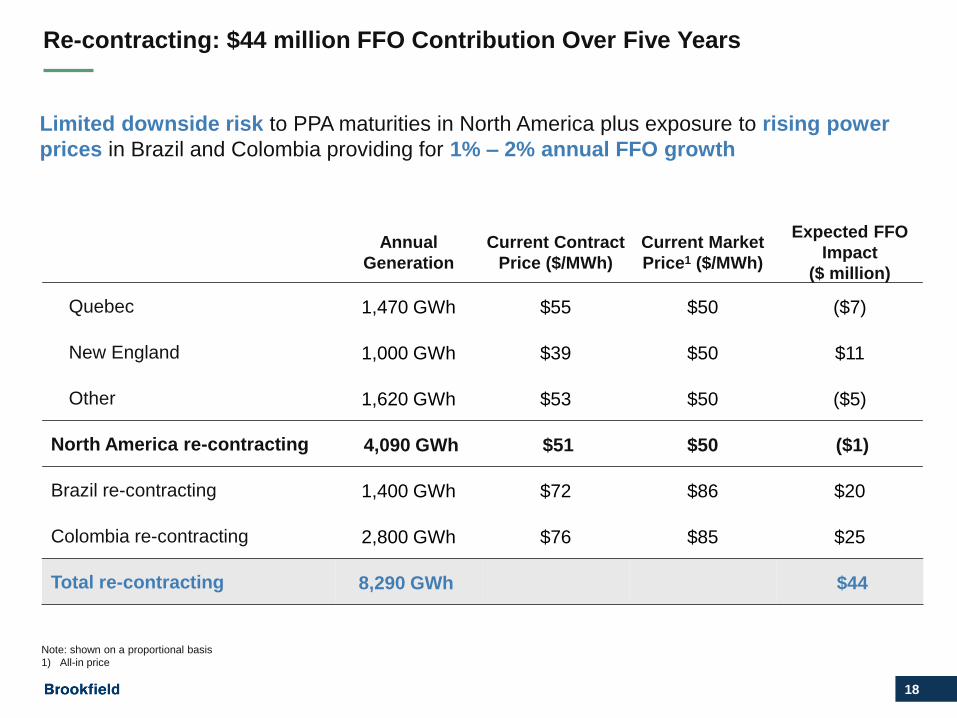
Re-contracting: $44 million FFO Contribution Over Five Years
Limited downside risk to PPA maturities in North America plus exposure to rising power
prices in Brazil and Colombia providing for 1% – 2% annual FFO growth
Annual
Generation
Current Contract
Price ($/MWh)
Current Market
Price1 ($/MWh)
Expected FFO
Impact
($ million)
Quebec 1,470 GWh $55 $50 ($7)
New England 1,000 GWh $39 $50 $11
Other 1,620 GWh $53 $50 ($5)
North America re-contracting 4,090 GWh $51 $50 ($1)
Brazil re-contracting 1,400 GWh $72 $86 $20
Colombia re-contracting 2,800 GWh $76 $85 $25
Total re-contracting 8,290 GWh $44
Note: shown on a proportional basis
1) All-in price

19
Primary Font Colour
Title Slide Font
Light Background
R17 G17 B17
Dark Backdrop
R255 G255 B255
Business Group Colours
Real Estate
R71 G151 B181
Infrastructure
R83 G55 B82
Renewable
R92 G153 B121
Private Equity
R230 G203 B140
R244 G124 B16
R77 G77 B77
R200 G200 B200
R17 G17 B17
Logo & Divider Slide Font
R15 G53 B87
PRIMARY PALETTE
SECONDARY PALETTE
Sub-headers & Emphasis Text
R64 G126 B182
Cost Reduction: $50 Million FFO Contribution Over Five Years
Targeted cost reduction of $2 per MWh would add $50 million to FFO over the next five
years or 1% – 2% annual FFO growth
Savings:
$2.00 / MWh
$30 million
North America
Savings:
$2.00 / MWh
$10 million
Brazil
Savings:
$2.00 / MWh
$10 million
Colombia
Savings:
$2.00 / MWh
$1 million
Europe
Streamlining
Processes
Operational
Efficiencies
Optimize
Structuring
Economies
of Scale
Note: shown on a proportional basis
20
Primary Font Colour
Title Slide Font
Light Background
R17 G17 B17
Dark Backdrop
R255 G255 B255
Business Group Colours
Real Estate
R71 G151 B181
Infrastructure
R83 G55 B82
Renewable
R92 G153 B121
Private Equity
R230 G203 B140
R244 G124 B16
R77 G77 B77
R200 G200 B200
R17 G17 B17
Logo & Divider Slide Font
R15 G53 B87
PRIMARY PALETTE
SECONDARY PALETTE
Sub-headers & Emphasis Text
R64 G126 B182
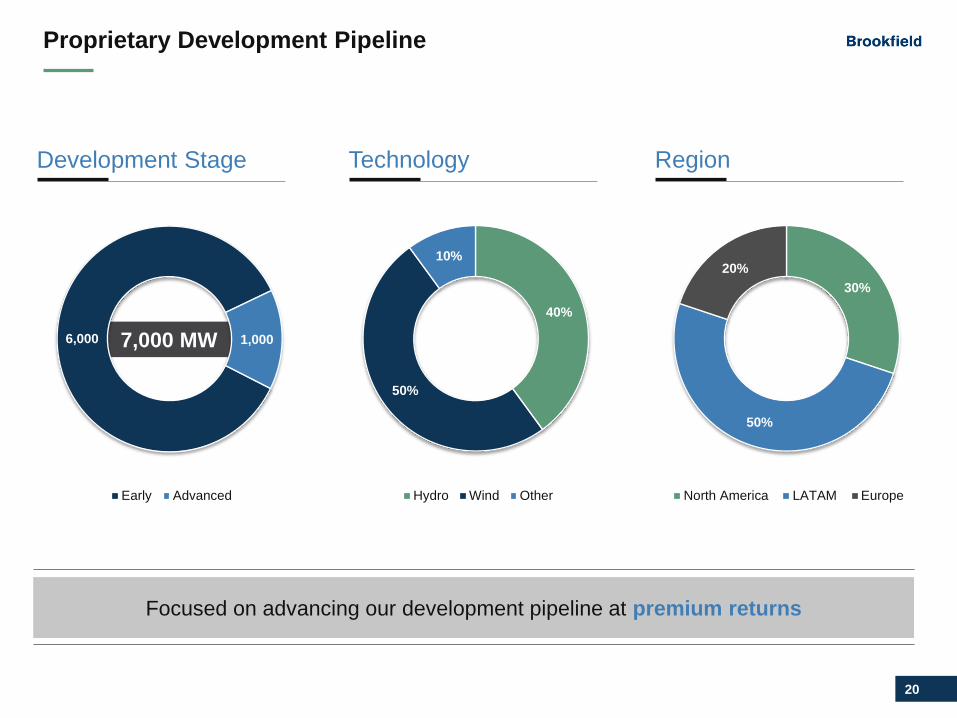
7,000 MW
Proprietary Development Pipeline
Focused on advancing our development pipeline at premium returns
Development Stage Technology Region
6,000 1,000
Early Advanced
40%
50%
10%
Hydro Wind Other
30%
50%
20%
North America LATAM Europe
21
Primary Font Colour
Title Slide Font
Light Background
R17 G17 B17
Dark Backdrop
R255 G255 B255
Business Group Colours
Real Estate
R71 G151 B181
Infrastructure
R83 G55 B82
Renewable
R92 G153 B121
Private Equity
R230 G203 B140
R244 G124 B16
R77 G77 B77
R200 G200 B200
R17 G17 B17
Logo & Divider Slide Font
R15 G53 B87
PRIMARY PALETTE
SECONDARY PALETTE
Sub-headers & Emphasis Text
R64 G126 B182
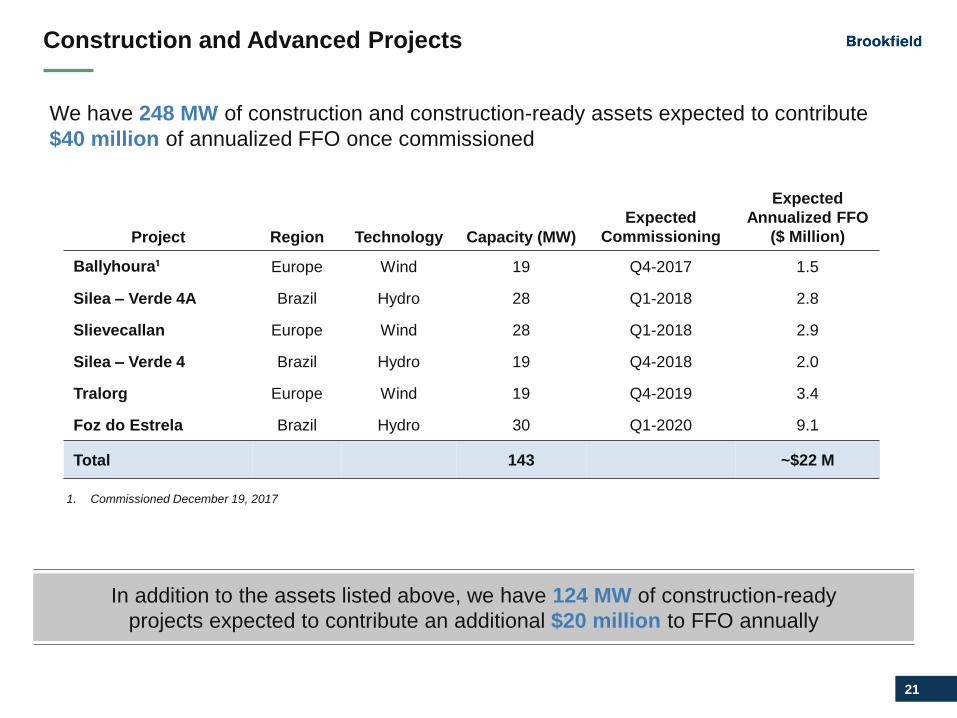
Construction and Advanced Projects
In addition to the assets listed above, we have 124 MW of construction-ready
projects expected to contribute an additional $20 million to FFO annually
We have 248 MW of construction and construction-ready assets expected to contribute
$40 million of annualized FFO once commissioned
Project Region Technology Capacity (MW)
Expected
Commissioning
Expected
Annualized FFO
($ Million)
Ballyhoura¹ Europe Wind 19 Q4-2017 1.5
Silea – Verde 4A Brazil Hydro 28 Q1-2018 2.8
Slievecallan Europe Wind 28 Q1-2018 2.9
Silea – Verde 4 Brazil Hydro 19 Q4-2018 2.0
Tralorg Europe Wind 19 Q4-2019 3.4
Foz do Estrela Brazil Hydro 30 Q1-2020 9.1
Total 143 ~$22 M
1. Commissioned December 19, 2017
22
Primary Font Colour
Title Slide Font
Light Background
R17 G17 B17
Dark Backdrop
R255 G255 B255
Business Group Colours
Real Estate
R71 G151 B181
Infrastructure
R83 G55 B82
Renewable
R92 G153 B121
Private Equity
R230 G203 B140
R244 G124 B16
R77 G77 B77
R200 G200 B200
R17 G17 B17
Logo & Divider Slide Font
R15 G53 B87
PRIMARY PALETTE
SECONDARY PALETTE
Sub-headers & Emphasis Text
R64 G126 B182
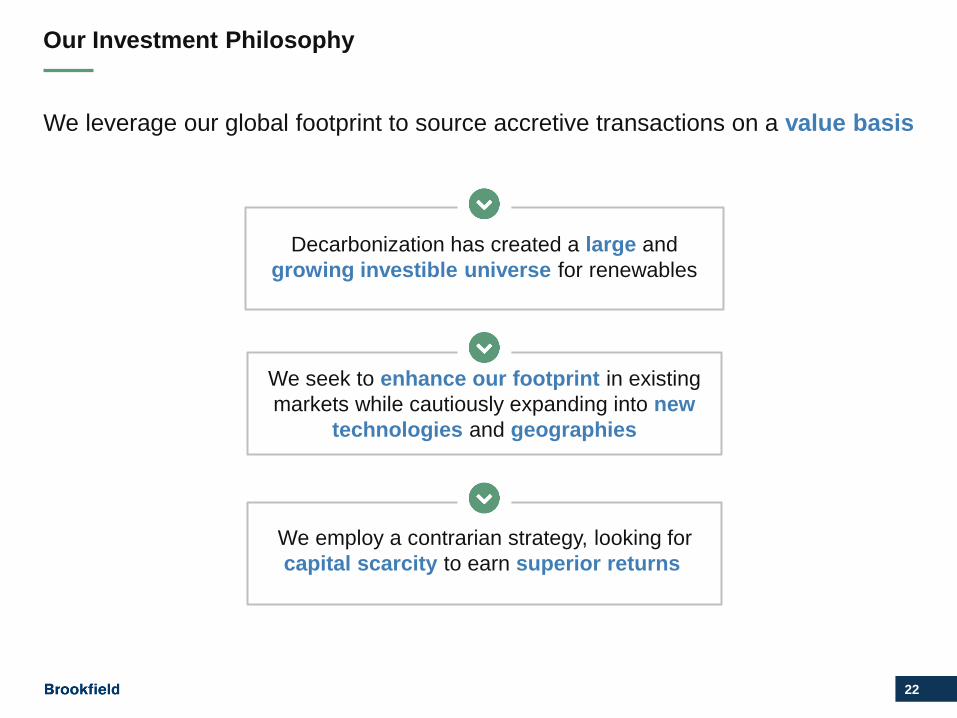
Our Investment Philosophy
We leverage our global footprint to source accretive transactions on a value basis
Decarbonization has created a large and
growing investible universe for renewables
We employ a contrarian strategy, looking for
capital scarcity to earn superior returns
We seek to enhance our footprint in existing
markets while cautiously expanding into new
technologies and geographies
23
Primary Font Colour
Title Slide Font
Light Background
R17 G17 B17
Dark Backdrop
R255 G255 B255
Business Group Colours
Real Estate
R71 G151 B181
Infrastructure
R83 G55 B82
Renewable
R92 G153 B121
Private Equity
R230 G203 B140
R244 G124 B16
R77 G77 B77
R200 G200 B200
R17 G17 B17
Logo & Divider Slide Font
R15 G53 B87
PRIMARY PALETTE
SECONDARY PALETTE
Sub-headers & Emphasis Text
R64 G126 B182
Strong Track Record of Growth
Since 2012, we have developed and acquired over 12,000 MW, deploying
more than $3 billion of BEP equity at accretive returns
We target annual equity deployment of $600 - $700 million in high quality assets
to deliver 12% to 15% annual returns
• Global network of investment professionals have a proactive outreach program to
originate acquisition opportunities
• Expertise in executing large, multi-faceted transactions
• Leverage our deep operating expertise to diligence and underwrite assets
• Disciplined approach to allocating capital with focus on downside protection and
preservation of capital

24
Financial Profile

25
Primary Font Colour
Title Slide Font
Light Background
R17 G17 B17
Dark Backdrop
R255 G255 B255
Business Group Colours
Real Estate
R71 G151 B181
Infrastructure
R83 G55 B82
Renewable
R92 G153 B121
Private Equity
R230 G203 B140
R244 G124 B16
R77 G77 B77
R200 G200 B200
R17 G17 B17
Logo & Divider Slide Font
R15 G53 B87
PRIMARY PALETTE
SECONDARY PALETTE
Sub-headers & Emphasis Text
R64 G126 B182
Robust Balance Sheet
Debt Maturity Ladder $billions, as at December 31, 2017
Staggered Debt Maturities
• Non-recourse financing approach provides
significant protection to corporate lenders
• No material near-term maturities
• Project debt has an average remaining term of 10
years on a proportionate basis
• ~85% proportionate, fixed rate with minimal floating
rate exposure funded in local currency
Significant Liquidity
• $1.7 billion committed corporate credit facility
through 2022
• 70% long-term target FFO payout ratio, significant
free cash flows
• Diverse funding sources with access to public and
private markets
$-
$0.5
$1.0
$1.5
$2.0
$2.5
$3.0
$3.5
2018 2019 2020 2021 2022 After
Non-Recourse Maturities Recourse Maturities

26
Primary Font Colour
Title Slide Font
Light Background
R17 G17 B17
Dark Backdrop
R255 G255 B255
Business Group Colours
Real Estate
R71 G151 B181
Infrastructure
R83 G55 B82
Renewable
R92 G153 B121
Private Equity
R230 G203 B140
R244 G124 B16
R77 G77 B77
R200 G200 B200
R17 G17 B17
Logo & Divider Slide Font
R15 G53 B87
PRIMARY PALETTE
SECONDARY PALETTE
Sub-headers & Emphasis Text
R64 G126 B182
Conservative Capitalization
39% DEBT TO TOTAL
CAPITALIZATION
~3.0X CONSOLIDATED EBITDA /
INTEREST COVERAGE
~7.0X REMITTED CASH FLOW /
INTEREST COVERAGE
4.5% AVERAGE INTEREST RATE ON
CORPORATE BORROWINGS
70% NON-RECOURSE
DEBT
$1.5bn AVAILABLE
LIQUIDITY
Consistently maintained conservative
debt to capitalization ratio
Investment grade credit ratings with
S&P (BBB+) and DBRS (BBB high)
High quality cash flows and strong
remittance characteristics underscore
investment grade ratings
Use of primarily non-recourse, fixed
rate financings provides strong
protection and credit stability

27
Primary Font Colour
Title Slide Font
Light Background
R17 G17 B17
Dark Backdrop
R255 G255 B255
Business Group Colours
Real Estate
R71 G151 B181
Infrastructure
R83 G55 B82
Renewable
R92 G153 B121
Private Equity
R230 G203 B140
R244 G124 B16
R77 G77 B77
R200 G200 B200
R17 G17 B17
Logo & Divider Slide Font
R15 G53 B87
PRIMARY PALETTE
SECONDARY PALETTE
Sub-headers & Emphasis Text
R64 G126 B182
Investment Recap
Diverse and high-quality asset base
underpinned by contracted cash flows • 16,400 MW across five technologies and four continents
• Over 90% contracted cash flows
Strong core business with embedded
organic growth • Deep operational expertise supports ability to grow distributions
by 5% to 9% annually though organic levers alone
Significant upside from acquisitions on
a value basis • Contrarian and disciplined approach to allocating capital
• Target 12% to 15% returns on investments
Downside protection to ensure cash
flow resiliency through-the-cycle
• Investment grade balance sheet since inception
• Primarily fixed rate, asset level debt with minimal floating rate
exposure funded in local currency that is non-recourse to BEP
• Maintain significant liquidity and access to global capital markets
Proven track record • 8% FFO per unit growth over the last five years
• 17% annualized returns to shareholders since inception

28
Primary Font Colour
Title Slide Font
Light Background
R17 G17 B17
Dark Backdrop
R255 G255 B255
Business Group Colours
Real Estate
R71 G151 B181
Infrastructure
R83 G55 B82
Renewable
R92 G153 B121
Private Equity
R230 G203 B140
R244 G124 B16
R77 G77 B77
R200 G200 B200
R17 G17 B17
Logo & Divider Slide Font
R15 G53 B87
PRIMARY PALETTE
SECONDARY PALETTE
Sub-headers & Emphasis Text
R64 G126 B182
Contacts
Contact Title Email
Sachin Shah Chief Executive Officer [email protected]
Wyatt Hartley Chief Financial Officer [email protected]
Divya Biyani Investor Relations [email protected]
29
Appendix

30
Primary Font Colour
Title Slide Font
Light Background
R17 G17 B17
Dark Backdrop
R255 G255 B255
Business Group Colours
Real Estate
R71 G151 B181
Infrastructure
R83 G55 B82
Renewable
R92 G153 B121
Private Equity
R230 G203 B140
R244 G124 B16
R77 G77 B77
R200 G200 B200
R17 G17 B17
Logo & Divider Slide Font
R15 G53 B87
PRIMARY PALETTE
SECONDARY PALETTE
Sub-headers & Emphasis Text
R64 G126 B182
Highly Contracted Cash Flows
• Power is largely sold to investment grade counterparties under long-term, fixed price, inflation-linked
contracts with an average proportionate term of 15 years
• We expect to re-contract expiring PPAs at levels equal to or higher than roll off prices
‒ Current all-in power prices exceed our underwriting targets, supporting embedded upside in our
cash flows
‒ In Latin America and Asia, power prices will continue to be supported by the need to build new
supply to serve growing demand
Generation
(GWh) 2018 2019 2020 2021 2022
Contracted
Hydroelectric 12,177 12,062 9,890 9,190 7,836
Wind 3,098 3,048 2,989 2,947 2,929
Solar 456 456 456 456 456
15,731 15,602 13,335 12,593 11,221
Uncontracted 1,438 1,567 3,834 4,576 5,948
LTA 17,169 17,169 16,864 16,864 16,864
% of generation 92% 91% 78% 73% 65%
Amounts proportionate to BEP
Note: The table above excludes Brazil and Colombia and other countries where we would expect the energy
associated with maturing contracts to be re-contracted in the normal course given the construct of the respective
power markets, and to maintain a contracted profile of approximately 90%, 70%, and 100% respectively.
31
Primary Font Colour
Title Slide Font
Light Background
R17 G17 B17
Dark Backdrop
R255 G255 B255
Business Group Colours
Real Estate
R71 G151 B181
Infrastructure
R83 G55 B82
Renewable
R92 G153 B121
Private Equity
R230 G203 B140
R244 G124 B16
R77 G77 B77
R200 G200 B200
R17 G17 B17
Logo & Divider Slide Font
R15 G53 B87
PRIMARY PALETTE
SECONDARY PALETTE
Sub-headers & Emphasis Text
R64 G126 B182
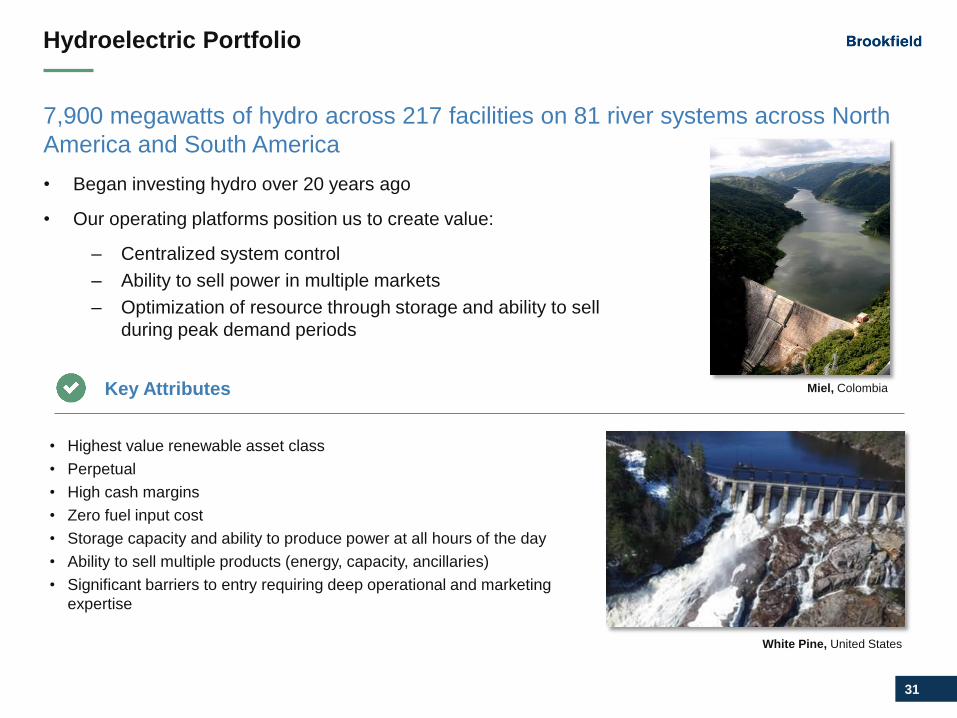
Hydroelectric Portfolio
7,900 megawatts of hydro across 217 facilities on 81 river systems across North
America and South America
• Began investing hydro over 20 years ago
• Our operating platforms position us to create value:
‒ Centralized system control
‒ Ability to sell power in multiple markets
‒ Optimization of resource through storage and ability to sell
during peak demand periods
• Highest value renewable asset class
• Perpetual
• High cash margins
• Zero fuel input cost
• Storage capacity and ability to produce power at all hours of the day
• Ability to sell multiple products (energy, capacity, ancillaries)
• Significant barriers to entry requiring deep operational and marketing
expertise
White Pine, United States
Key Attributes Miel, Colombia

32
Primary Font Colour
Title Slide Font
Light Background
R17 G17 B17
Dark Backdrop
R255 G255 B255
Business Group Colours
Real Estate
R71 G151 B181
Infrastructure
R83 G55 B82
Renewable
R92 G153 B121
Private Equity
R230 G203 B140
R244 G124 B16
R77 G77 B77
R200 G200 B200
R17 G17 B17
Logo & Divider Slide Font
R15 G53 B87
PRIMARY PALETTE
SECONDARY PALETTE
Sub-headers & Emphasis Text
R64 G126 B182
Wind Portfolio
3,600 megawatts of wind capacity across 76 facilities in North America, South
America, Europe and Asia
• Developed our first wind farm in 2006, and have since built a
high-quality, globally diversified wind business:
‒ Focused on areas with scarcity value
‒ Assets are located in high-value power markets
‒ Portfolio benefits from long-term, utility grade PPAs
‒ Tier 1 turbine equipment (GE, Siemens, Vestas,
Energcon
• High cash margins
• Zero fuel input cost
• Relatively low build cost and improving turbine efficiency
• Minimal ongoing capex requirements
• Simple to operate
• Outsourced O&M providers are available to financial buyers, supporting
our capital recycling program
Bahia, Brazil
Key Attributes Ballymartin, Ireland
33
Primary Font Colour
Title Slide Font
Light Background
R17 G17 B17
Dark Backdrop
R255 G255 B255
Business Group Colours
Real Estate
R71 G151 B181
Infrastructure
R83 G55 B82
Renewable
R92 G153 B121
Private Equity
R230 G203 B140
R244 G124 B16
R77 G77 B77
R200 G200 B200
R17 G17 B17
Logo & Divider Slide Font
R15 G53 B87
PRIMARY PALETTE
SECONDARY PALETTE
Sub-headers & Emphasis Text
R64 G126 B182
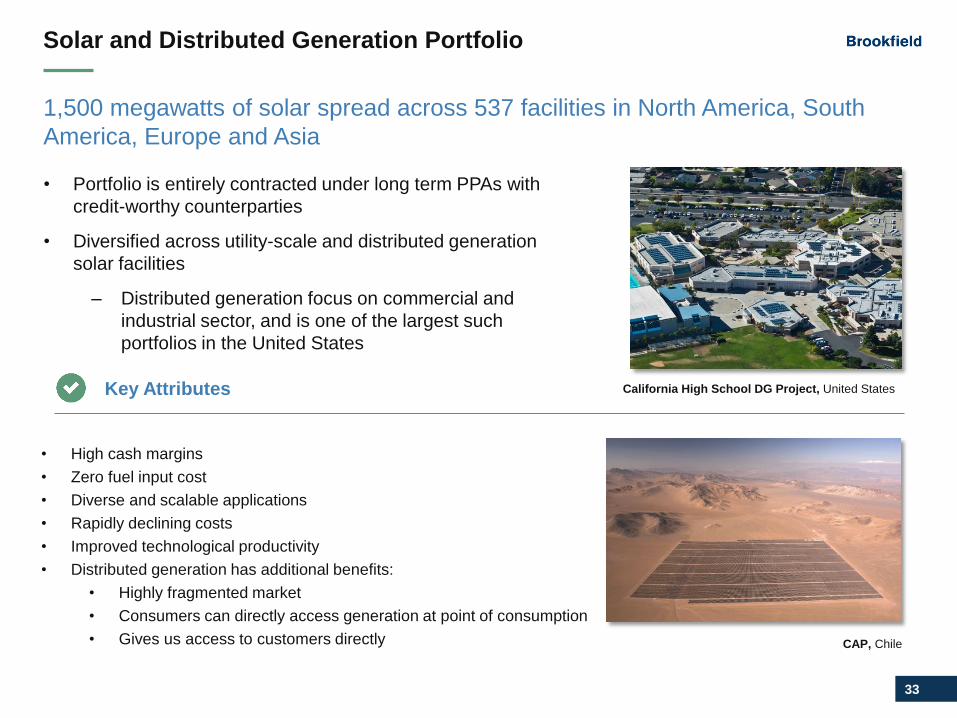
Solar and Distributed Generation Portfolio
1,500 megawatts of solar spread across 537 facilities in North America, South
America, Europe and Asia
• Portfolio is entirely contracted under long term PPAs with
credit-worthy counterparties
• Diversified across utility-scale and distributed generation
solar facilities
‒ Distributed generation focus on commercial and
industrial sector, and is one of the largest such
portfolios in the United States
CAP, Chile
Key Attributes California High School DG Project, United States
• High cash margins
• Zero fuel input cost
• Diverse and scalable applications
• Rapidly declining costs
• Improved technological productivity
• Distributed generation has additional benefits:
• Highly fragmented market
• Consumers can directly access generation at point of consumption
• Gives us access to customers directly
34
Primary Font Colour
Title Slide Font
Light Background
R17 G17 B17
Dark Backdrop
R255 G255 B255
Business Group Colours
Real Estate
R71 G151 B181
Infrastructure
R83 G55 B82
Renewable
R92 G153 B121
Private Equity
R230 G203 B140
R244 G124 B16
R77 G77 B77
R200 G200 B200
R17 G17 B17
Logo & Divider Slide Font
R15 G53 B87
PRIMARY PALETTE
SECONDARY PALETTE
Sub-headers & Emphasis Text
R64 G126 B182
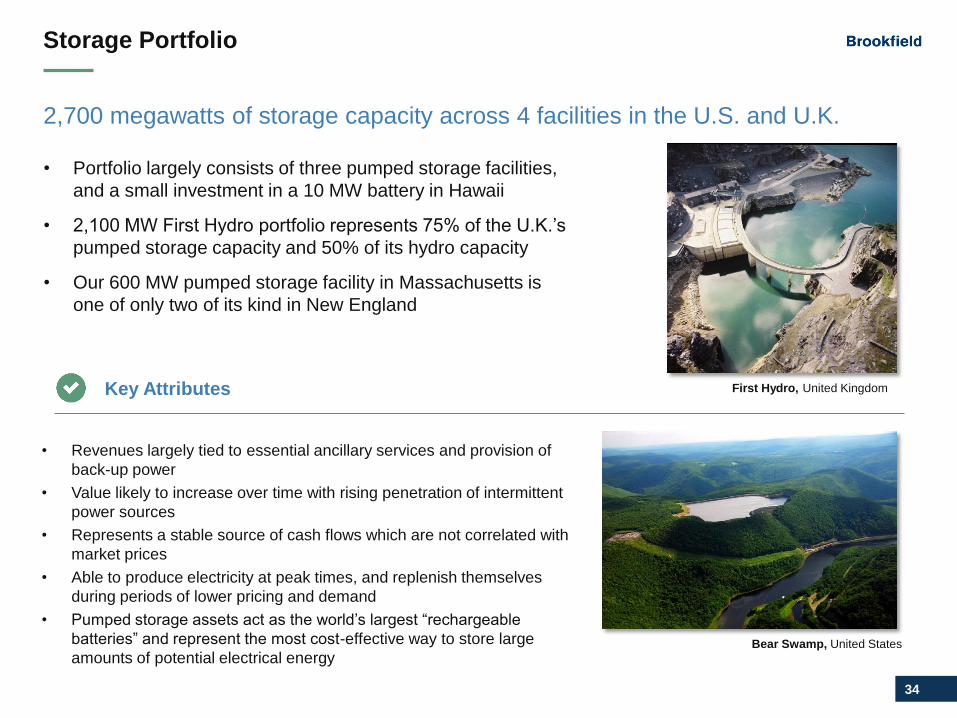
Storage Portfolio
2,700 megawatts of storage capacity across 4 facilities in the U.S. and U.K.
• Portfolio largely consists of three pumped storage facilities,
and a small investment in a 10 MW battery in Hawaii
• 2,100 MW First Hydro portfolio represents 75% of the U.K.’s
pumped storage capacity and 50% of its hydro capacity
• Our 600 MW pumped storage facility in Massachusetts is
one of only two of its kind in New England
Bear Swamp, United States
Key Attributes First Hydro, United Kingdom
• Revenues largely tied to essential ancillary services and provision of
back-up power
• Value likely to increase over time with rising penetration of intermittent
power sources
• Represents a stable source of cash flows which are not correlated with
market prices
• Able to produce electricity at peak times, and replenish themselves
during periods of lower pricing and demand
• Pumped storage assets act as the world’s largest “rechargeable
batteries” and represent the most cost-effective way to store large
amounts of potential electrical energy

35
Primary Font Colour
Title Slide Font
Light Background
R17 G17 B17
Dark Backdrop
R255 G255 B255
Business Group Colours
Real Estate
R71 G151 B181
Infrastructure
R83 G55 B82
Renewable
R92 G153 B121
Private Equity
R230 G203 B140
R244 G124 B16
R77 G77 B77
R200 G200 B200
R17 G17 B17
Logo & Divider Slide Font
R15 G53 B87
PRIMARY PALETTE
SECONDARY PALETTE
Sub-headers & Emphasis Text
R64 G126 B182
Corporate Structure
68%
Brookfield
Business
Partners (BBU)
Brookfield Asset Management (BAM)
~$43b Market Cap¹ (TSX, NYSE)
Management 20%
69%
Brookfield
Property
Partners (BPY)
30%
Brookfield
Infrastructure
Partners (BIP)
60%
Brookfield
Renewable
Partners (BEP)2
Private Fund LPs⁴
Company
A
Company
B
Company
C
Company
D
30%³
70%³
1) Based on closing price on the NYSE on December 29, 2017
2) BEP generally funds Brookfield’s commitment to renewables transactions in Private Funds
3) Indicative figure only, and subject to transaction size, co-investment, and other considerations
4) Indicative third-party commitments
36
Primary Font Colour
Title Slide Font
Light Background
R17 G17 B17
Dark Backdrop
R255 G255 B255
Business Group Colours
Real Estate
R71 G151 B181
Infrastructure
R83 G55 B82
Renewable
R92 G153 B121
Private Equity
R230 G203 B140
R244 G124 B16
R77 G77 B77
R200 G200 B200
R17 G17 B17
Logo & Divider Slide Font
R15 G53 B87
PRIMARY PALETTE
SECONDARY PALETTE
Sub-headers & Emphasis Text
R64 G126 B182
Governance
SENIOR MANAGEMENT TEAM
Sachin Shah Chief Executive Officer
Wyatt Hartley Chief Financial Officer
Brookfield Renewable has entered into a Master Services Agreement with Brookfield Asset Management
• Provides comprehensive suite of services to Brookfield Renewable Partners
• Base management fee of $20 million adjusted annually for inflation
• Equity enhancement fee equal to 1.25% of the increase in BEP’s capitalization
Incentive distributions based upon increases in distributions paid to shareholders over pre-defined thresholds
(Master Limited Partnerships (MLP) structure)
• 15% participation by Brookfield in distributions over $0.375/unit per quarter
• 25% participation by Brookfield in distributions over $0.4225/unit per quarter
Brookfield Renewable’s general partner has a majority of independent directors
Brookfield Renewable’s governance is structured to provide significant alignment of interests between Brookfield
Asset Management and unitholders

37
Primary Font Colour
Title Slide Font
Light Background
R17 G17 B17
Dark Backdrop
R255 G255 B255
Business Group Colours
Real Estate
R71 G151 B181
Infrastructure
R83 G55 B82
Renewable
R92 G153 B121
Private Equity
R230 G203 B140
R244 G124 B16
R77 G77 B77
R200 G200 B200
R17 G17 B17
Logo & Divider Slide Font
R15 G53 B87
PRIMARY PALETTE
SECONDARY PALETTE
Sub-headers & Emphasis Text
R64 G126 B182
Favourable Structure Relative to MLPs
Brookfield Renewable has not and is not expected to generate UBTI and ECI
• Brookfield Renewable is a Bermuda-based publicly traded partnership that indirectly
owns holding corporations in the U.S., Canada and other jurisdictions. Brookfield
Renewable is not a U.S. MLP1
• Chart below shows a comparison of Brookfield Renewable versus an MLP¹
1) MLP is Master Limited Partnership
2) Not all MLP’s are the same. This represents Brookfield’s understanding of common features with these types of vehicles
3) UBTI is unrelated business taxable income
4) ECI is effectively connected income
5) Source: Management estimates based on Barclays Capital Master Limited Partnerships MLP Trader Weekly
Brookfield Renewable MLP2
Type of entity Publicly traded partnership Publicly traded partnership
UBTI3 No Yes
ECI4 No Yes
U.S. tax slip issued K1 K1
Tax profile of distributions Benefits from return of capital Benefits from depreciation
Payout ratio ~70% of FFO 80%-90% of distributable cash flow5
Incentive distributions 25% maximum 50% maximum

38
Primary Font Colour
Title Slide Font
Light Background
R17 G17 B17
Dark Backdrop
R255 G255 B255
Business Group Colours
Real Estate
R71 G151 B181
Infrastructure
R83 G55 B82
Renewable
R92 G153 B121
Private Equity
R230 G203 B140
R244 G124 B16
R77 G77 B77
R200 G200 B200
R17 G17 B17
Logo & Divider Slide Font
R15 G53 B87
PRIMARY PALETTE
SECONDARY PALETTE
Sub-headers & Emphasis Text
R64 G126 B182
Leader in Green Energy & Sustainability
BEP is the largest member by market capitalization of the S&P/TSX Renewable Energy and Clean
Technology Index.
Since 2017, BEP has issued two green bonds through project-level financings for an aggregate
value of US$780 million. Citing BEP's environmental stewardship, commitment to renewable
power, and use of proceeds towards renewable power generation, the green bonds received E-1
Green Evaluation scores from S&P - the highest on its scale.
BEP is committed to sustainable development principles that reduce the impact of our operations
and help to manage the underlying water resources efficiently. Low Impact Hydropower Institute
(LIHI) certification is a voluntary certification program designed to help identify and provide market
incentives for hydropower operations that are minimizing their environmental impacts. BEP has
received LIHI certification for 52 hydro facilities across the US, more than any other operator,
making it the U.S. leader in low impact hydropower generation.
The Environmental Choice Program is a comprehensive national program sponsored by
Environment Canada. It certifies manufacturers and suppliers that produce products and services
that are less harmful to the environment. These bear the EcoLogo registered trademark. 22 of our
hydroelectric facilities in Ontario, Quebec, and British Columbia meet the strict standards of the
Environmental Choice Program.
The Brookfield Environmental Education Center was established in Guarani, Minas Gerais, Brazil,
from a partnership between Brookfield Energia Renovável and the local community. The project
aims to provide the entire population of the Pomba River Valley a place to develop environmental
education projects. To make the project sustainable, the local community was trained to manage
the Environmental Education Center and created a non-governmental organization to do it.