broadband solutions for wireless & wireline communications
TRANSCRIPT

Broadband solutions for wireless & wireline communications
2006 ANNUAL REPORT

ANADIGICS is uniquely positioned to
capitalize on the rapidly growing voice,
data and video segments of the broad-
band, 3G, wireless and wireline com-
munication markets benefiting from
the Triple and Quad Play in the indus-
try. ANADIGICS has positioned itself in
the sweet spot of these growth areas
and our strong product portfolio is
being recognized for 3G, 3.5G, HSDPA
and HSUPA, 4G, WiMax and WiBro,
WiFi 802.11 a/b/g and 802.11n
standards, and CATV set-top boxes,
CATV infrastructure and FIOS.
AnadigicsTriple Play
Quad Play
WirelessComm
WirelineComm
Triple Play
Voice
Data
Video
3G
WiFi
FiOS
CATV
IPTV
WiMAX
0
10
20
30
40
50
0.0
4.5
9.0
13.5
18.0
0
5
10
15
20
-0.12
-0.10
-0.08
-0.06
-0.04
-0.02
0.00
$36$40
$49
Q2’06 Q3’06 Q4’06Q1’06
Revenuein millions
$45
$9.4
$11.3
$16.2
Q2’06 Q3’06 Q4’06Q1’06
Gross Profitin millions
$13.8
$-70
$-20
$20
2005 20062004
$0.00
Q2’06 Q3’06 Q4’06Q1’06
EPS
($0.06)
($0.03)
($0.12)

2006 was a dynamic growth year for ANADIGICS! Our continued pursuit of
our strategic objective to be a leading supplier of semiconductor solutions
has placed ANADIGICS at the front of our industry peer group in terms of
revenue growth, and customer base expansion with technology that is, in
some cases, several generations ahead of the competition.
We continue to strengthen our position with tier-one manufacturers and expand our relationships with leading chipset suppliers in the wireless and wireline communica-tion markets. Our focus on developing a leading edge portfolio of products, coupled with industry trends leading to increased integration, has resulted in a significant increase in the number of RF (radio frequency) components being incorporated into end-user products such as mobile hand-held devices, WLAN notebooks, and multifunction DVR and PVR set-top boxes.
Our 2006 revenue climbed by 57% over 2005, an amount well ahead of average market growth including that of our industry peer group. We continue to move towards profitability, breaking even on a per share basis for the fourth quarter of 2006 and our gross margin showed continued improvement throughout 2006.
SUCCESS DRIVERS
ANADIGICS’ success is driven by the following three key factors: • We are well-positioned to capitalize on market megatrends in the 3G, WiFi and CATV markets. • We have increased our product content in markets where multiple PAs and multiple tuner ICs are required. • Our business model has resulted in greater financial leverage as we have increased utilization of our production,
capacity, as well as our higher margin product mix.
The growth in these target markets is driven by consumer demand for multimedia and greater bandwidth.
MEGATRENDS
Mobile handheld devices have evolved from pure voice to multimedia devices such as 3G, requiring multiple bands and multiple power amplifiers for operation. In the 3G market, Qualcomm is leading the industry in migration from 3G to 3.5G to HSDPA MSM6280 and HSUPA MSM7200 designs. ANADIGICS has established a solid relationship with Qualcomm as a
Dear Shareholders,
12006 Annual Report ANADIGICS
ANADIGICS IS A LEADING PROVIDER OF SEMICONDUCTOR SOLUTIONS IN THE RAPIDLY GROWING
BROADBAND WIRELESS AND WIRELINE COMMUNICATIONS MARKETS. OUR INGAP-PLUS PROCESS AND
DESIGN TECHNOLOGIES SUCH AS HELP™ PROVIDE A COMPETITIVE ADVANTAGE BY ENABLING US TO
PROVIDE PAs (“POWER AMPLIFIERS”) THAT CONSUME LESS BATTERY POWER AND EXTEND TALK TIME
FOR PRODUCTS IN 3G, 3.5G AND 4G MARKETS.
ANADIGICS is at the crossroads of the triple and quad play
focused on developing front-end solutions and partnering with
industry-leading wireless chipset providers to incorporate our solu-
tions into their reference designs.

reference design partner, which has enabled us to develop design technologies such as high efficiency at low power (HELP™). HELP™ reduces power by 50% and increases battery life by roughly 25% enabling people to talk or transmit data 25% longer.
In WiFi, also known as wireless LAN, the transition from b/g to a/b/g and now to N, also referred to as MIMO, continues to be a very strong catalyst for increased power amplifier content in end-user devices for ANADIGICS. ANADIGICS’ N + 2 product generation relationships with market leaders, such as Intel, has allowed us to set the standard in product perfor-mance and integration, raising the bar for the competition in the RF front-end.
The third megatrend growth engine is the CATV market which encompasses both set-top boxes and infrastructure. The CATV set-top box market is increasingly moving to high-end set-top boxes with DVRs that require multiple semiconductor tuners and an active splitter, thereby increasing the demand for the components we manufacture. Set-top boxes are incorpo-rating advanced functionalities, such as DVR, HDTV, wireless Internet access, interactive services, home networking and gaming. These new features are driving demand for both new and replacement set-top boxes, and with continued growth in DVRs, demand for our components increase even more rapidly.
The CATV infrastructure market is also experiencing growth, in both the US and International markets. Through our col-laboration with Cisco, ANADIGICS is participating in the infrastructure bandwidth upgrade to 1GHz. This is another area of our participation in the N + 2 technology generation. Additionally, we are benefiting from the rollout of digital cable in China and parts of Europe.
LOOKING FORWARD
In addition to these current megatrends, ANADIGICS is also targeting the megatrends of tomorrow. These trends include 4G such as WiMax. ANADIGICS has already established itself in the WiMax market for the Samsung 4G terminal and is sup-plying products to infrastructure builders for point to point access. WiMax is the 2008 mobility standard proposition for mobile broadband. Another trend is based on transition to the DOCSIS 3.0 standard for cable modems. DOCSIS 3.0 multi-media content increases the number of channels significantly requiring digital tuners with higher linearity. We believe the standard change from DOCSIS 2.0 to 3.0 will occur in 2008. Also joining the line up of our megatrends, is FiOS. ANADIGICS is well plugged into the telco “triple play” by Verizon’s FiOS rollout, by supplying amplifiers for infrastructure and ONT boxes to such industry leaders at Tellabs, AFC, and Pacific Broadband.
ANADIGICS is positioned in 2007 as a highly recognized innovator and industry leader in 3G, 4G, WiMax, WiFi, CATV set-top boxes and infrastructure. We believe we will continue to see our target markets grow substantially, be able to increase our market share and dollar content, and improve profitability.
I would like to thank all of our shareholders, employees, customers, partners, and suppliers for their contributions to ANADIGICS’ accomplishments in 2006. I am very optimistic about our Company’s growth in 2007 and beyond and I am looking forward to working together to continue our success.
Sincerely,
Dr. Bami BastaniPresident and Chief Executive Officer
ANADIGICS’ business model generates greater financial leverage derived from increased
utilization of our production capacity as well as our higher margin product mix.
ANADIGICS 2006 Annual Report2

32006 Annual Report ANADIGICS
The selected financial data set forth below should be read in conjunction with “Management’s Discussion and Analysis of Financial Condition
and Results of Operations,” and our financial statements, related notes and other financial information included herein. The selected consolidated
financial data set forth below as of December 31, 2006 and 2005 and for the years ended December 31, 2006, 2005, and 2004 have been derived
from our audited financial statements included herein. The selected consolidated financial data set forth below as of December 31, 2004, 2003
and 2002 and for the years ended December 31, 2003 and 2002 have been derived from our audited financial statements that are not included
herein or incorporated by reference herein. Our historical results are not necessarily indicative of the results that may be expected for any
future period.
2002 2003 2004 2005 2006
Results of Operations:Net sales $ 82,564 $ 75,212 $ 91,350 $ 108,281 $ 169,885
Gross profit 7,262 3,285 13,995 22,352 50,710
Operating loss (65,565) (50,998) (41,822) (28,727) (9,480)
Loss before income taxes (52,183) (51,139) (43,082) (31,233) (8,850)
Net loss (55,886) (50,757) (43,082) (31,233) (8,850)
Loss per share:
Basic and diluted $ (1.83) $ (1.65) $ (1.33) $ (0.92) $ (0.20)
Balance Sheet Data:Total cash and marketable securities $ 155,518 $ 121,630 $ 104,051 $ 86,357 $ 83,482
Working capital 110,151 81,100 89,517 52,007 100,895
Total assets 255,671 207,898 185,895 168,273 182,602
Total capital lease obligations — 90 18 2,032 1,775
Long-term debt, including current portion 66,700 66,700 84,700 84,700 38,000
Total stockholders’ equity 171,088 121,046 84,615 58,135 115,760
SELECTED FINANCIAL DATA

4 ANADIGICS 2006 Annual Report
Overview We are a leading provider of semiconductor solutions in the
rapidly growing broadband wireless and wireline communications
markets. Our products include PAs, tuner integrated circuits, active
splitters, line amplifiers and other components, which can be sold
individually or packaged as integrated RF and front end modules. We
believe that we are uniquely positioned to capitalize on the rapidly-
growing voice, data and video segments of the broadband wireless and
wireline communications markets. We offer 3G products that use the
W-CDMA and EDGE standards, 3.5G products that use the HSDPA
and HSUPA standards, 4G products for WiMAX and WiBRO systems,
WiFi products that use the 802.11 a/b/g and 802.11 n (draft-n, MIMO)
standards, CATV set-top box products, CATV infrastructure products
and FTTP products.
Our business strategy focuses on developing RF front end solu-
tions and partnering with industry-leading wireless chipset providers
to incorporate our solutions into their reference designs. Our inte-
grated solutions enable our customers to improve RF performance,
power efficiency, reliability, time-to-market and the integration of chip
components into single packages, while reducing the size, weight and
cost of their products. We have established longstanding relationships
with several of the industry-leading chipset suppliers and tier-one
customers. For example, our relationships with Cisco, Intel, Motorola
and Qualcomm have enabled us to develop RF products used in 3G,
3.5G, 4G WiMAX, WiFi and CATV products and to be the primary
supplier with respect to such partners and customers. Other leading
chipset suppliers and tier-one customers with whom we have long-
standing relationships include Atheros, HTC, Huawei, Kyocera, Lenovo,
LG Electronics, Marvell, MediaTek, Murata, Novatel, Palm, RIM,
Samsung, Sierra Wireless, TCL, TDK, Texas Instruments and ZTE.
We continue to focus on leveraging our technological and manu-
facturing advantages to remain a leading supplier of semiconductor
solutions for broadband wireless and wireline communications. We
believe our patented InGaP-plus technology, which combines the
bipolar technology of a PA (HBT “PA”) with the surface device technol-
ogy of an RF active switch (pHEMT) on the same die, provides us with
a competitive advantage in the marketplace. Additionally, we believe
our InGaP-plus process and design technologies such as HELP provide
a competitive advantage by enabling us to provide PAs that consume
less battery power and extend talk time for products in the 3G, 3.5G
and 4G markets.
Our primary fab, a state-of-the-art six-inch diameter GaAs fab
located at our corporate headquarters in Warren, New Jersey, has
been operational since 1999. The increased utilization of our fab’s
manufacturing capacity has increased our gross margins, which has
provided us with greater financial leverage. We anticipate that with
incremental capital expenditures our Warren, New Jersey fab will
fulfill our manufacturing needs into 2009. We are actively exploring
future sources of additional manufacturing capacity through the
construction or acquisition of manufacturing facilities in low-cost
manufacturing countries such as China, as well as pursuing relation-
ships with foundries in Taiwan. Unlike traditional CMOS silicon fabs
that have short technology lifecycles and require frequent capital
investments, GaAs fabs are more similar to analog fabs that have long
lifecycles and do not become quickly outdated. Our six-inch wafer fab
allows us to produce more than twice the RF die per wafer compared
with the four-inch wafer fabs still used by some of our competitors.
We believe our strong fabrication capability and available capacity,
combined with integrated product design and logistics expertise,
allow us to quickly develop and manufacture products for which
demand has grown.
We have fixed expenses particularly relating to capital equipment
and manufacturing overhead. Accordingly, as unit volume throughput
increased in recent years, our fixed production costs decreased as a
percentage of revenue and our gross margin and profitability improved.
Decreases in volume would have the inverse effect. We will continue
to invest in selected strategic research and development programs to
maintain our competitive position.
We experienced net sales growth approximating 20% during 2004
and 2005 as our broadband and wireless businesses benefited from
unit growth in addition to accelerated demand, a better pricing envi-
ronment and acceptance of new product developments. These trends
were felt across our end markets and continued in 2006.
In 2006, our businesses grew over 50%, as new product offerings
were well timed to market demand and benefited from increased RF
content and functionality. This trend was observed throughout the
year and we ended 2006 by recording our seventh consecutive quarter
of sales growth. The sales growth and leverage of our fixed manufac-
turing expense base, led to gross margin increases and substantially
lessened our operating and net losses during the period.
MANAGEMENT’S DISCUSSION AND ANALYSIS OF FINANCIAL CONDITION AND RESULTS OF OPERATIONS

52006 Annual Report ANADIGICS
We believe our markets are, and will continue to remain, com-
petitive, which could result in continued quarterly volatility in our net
sales. This competition has resulted in, and is expected to continue
to result in, declining average selling prices for our products and
increased challenges in maintaining or increasing market share.
We have only one reportable segment. For financial information
related to such segment and certain geographic areas, see Note 4 to
the accompanying consolidated financial statements.
Critical Accounting Policies
GENERAL
We believe the following accounting policies are critical to our
business operations and the understanding of our results of opera-
tions. Such accounting policies may require management to exercise a
higher degree of judgment and make estimates used in the preparation
of our consolidated financial statements.
REVENUE RECOGNITION
Revenue from product sales is recognized when the title, risk and
rewards of product ownership are transferred to the customer, price
and terms are fixed, no significant vendor obligation exists and col-
lection of the resulting receivable is reasonably assured. We sell to
certain distributors who are granted rights of return and exchange
and certain price protection. Revenue is not recognized for the por-
tion of shipments subject to return, exchange or price protection
until such rights expire. We charge customers for the costs of certain
contractually-committed inventories that remain at the end of a prod-
uct’s life. Cancellation revenue is recognized when cash is received.
The value of the inventory related to cancellation revenue may, in
some instances, have been reserved during prior periods in accor-
dance with our inventory obsolescence policy.
WARRANTY COSTS
We provide for potential warranty claims by recording a current
charge to income. We estimate potential claims by examining histori-
cal returns and other information deemed critical and provide for an
amount which we believe will cover future warranty obligations for
products sold during the year. The accrued liability for warranty costs
is included in accrued liabilities in the consolidated balance sheets.
LONG-LIVED ASSETS
Long-lived assets include fixed assets, goodwill and other intangi-
ble assets. We regularly review these assets for indicators of impair-
ment and assess the carrying value of the assets against market values.
When an impairment exists, we record an expense to the extent that
the carrying value exceeds fair market value.
Goodwill and intangibles impairment
We have intangible assets related to goodwill and other acquired
intangibles. Significant judgments are involved in the determination of
the estimated useful lives for our other intangibles and whether
the goodwill or other intangible assets are impaired. In assessing the
recoverability of goodwill and other intangibles, we must make
assumptions regarding estimated future cash flows and other factors
to determine the fair value of the respective assets.
Impairment of long-lived assets
We record impairment losses on long-lived assets used in opera-
tions or expected to be disposed of when events and circumstances
indicate that the undiscounted cash flows estimated to be generated
by these assets is less than the carrying amounts of those assets.
Management considers sensitivities to capacity, utilization and techno-
logical developments in making its assumptions.
DEFERRED TAXES
We record a valuation allowance to reduce deferred tax assets
when it is more likely than not that some portion of the amount may
not be realized. During 2001, we determined that it was no longer
more likely than not that we would be able to realize all or part of our
net deferred tax asset in the future, and an adjustment to provide a
valuation allowance against the deferred tax asset was charged to
income. We continue to maintain a full valuation allowance on our
deferred tax assets.
While we have considered future taxable income and ongoing
prudent and feasible tax planning strategies in assessing the need for
the valuation allowance, in the event we were to determine that we
would be able to realize our deferred tax assets in the future, an adjust-
ment to the deferred tax asset would increase income in the period
such determination was made.

6 ANADIGICS 2006 Annual Report
INVENTORY
Inventories are valued at the lower of cost or market (“LCM”),
using the first-in, first-out method. In addition to LCM limitations, we
reserve against inventory items for estimated obsolescence or unmar-
ketable inventory. Our reserve for excess and obsolete inventory is
primarily based upon forecasted short-term demand for the product
and any change to the reserve arising from forecast revisions is
reflected in cost of sales in the period the revision is made.
ALLOWANCE FOR DOUBTFUL ACCOUNTS
We maintain an allowance for doubtful accounts for estimated
losses resulting from our customers’ failure to make payments. If the
financial condition of our customers were to erode, making them
unable to make payments, additional allowances may be required.
STOCK-BASED COMPENSATION
Effective January 1, 2006, we account for stock-based compensa-
tion costs in accordance with Financial Accounting Standards Board
Statement No. 123R Share-Based Payment (“FAS 123R”), which requires
the measurement and recognition of compensation expense for all
stock-based payment awards made to our employees and directors.
Under the fair value recognition provisions of FAS 123R, stock-based
compensation cost is measured at the grant date based on the fair
value of the award and is recognized as expense over the requisite
service period which in most cases is the vesting period. Determining
the fair value of stock-based awards at the grant date requires consid-
erable judgment, including estimating expected volatility, expected
term and risk-free rate. Our expected volatility is a combination of
both Company and peer company historical volatility. The expected
term of the stock options is based on several factors including histor-
ical observations of employee exercise patterns and expectations of
employee exercise behavior in the future giving consideration to the
contractual terms of the stock-based awards. The risk-free interest rate
assumption is based on the yield at the time of grant of a U.S. Treasury
security with an equivalent remaining term. If factors change and we
employ different assumptions, stock-based compensation expense may
differ significantly from what we have recorded in the past.
Results of Operations The following table sets forth statements of operations data as a
percentage of net sales for the periods indicated:
2004 2005 2006
Net sales 100.0% 100.0% 100.0%Cost of sales 84.7 79.4 70.1
Gross profit 15.3 20.6 29.9Research and development expense 36.5 27.6 21.0Selling and administrative expenses 24.6 19.6 14.5Restructuring and other charges — (0.1) —
Operating loss (45.8) (26.5) (5.6)Interest income 2.4 2.3 3.2Interest expense (4.5) (4.6) (2.8)Gain on repurchase of convertible notes 0.4 — —Other income 0.3 — —
Net loss (47.2%) (28.8%) (5.2%)
2006 Compared to 2005 NET SALES. Net sales during 2006 increased 56.9% to $169.9 mil-
lion, compared to $108.3 million for 2005. The net sales improvement
was primarily due to new demand from the market’s evolution to third
generation (EDGE, WEDGE and W-CDMA) PAs, an increase in demand
for our traditional CDMA and GSM technologies used in wireless
handsets and hand-held devices, and increased demand for broadband
products such as WLAN PAs, used in wireless personal computer
access and RFICs, used in infrastructure applications.
Sales during 2006 of RFICs used for cellular and personal commu-
nication system applications increased 71.8% during 2006 to $91.3
million from $53.2 million in 2005. This increase in sales of integrated
circuits for wireless applications for the year ended December 31,
2006 compared with 2005 was primarily due to increased demand for
our 3G, CDMA and GSM PAs amounting to $23.3 million, $9.7 million
and $5.8 million, respectively.
Specifically, net sales of RFICs used for broadband applications
increased 42.6% to $78.6 million in 2006 from $55.1 million in 2005.
This increase in sales was primarily due to an increase in demand for
infrastructure products and increased average selling prices for WLAN
products accounting for increases in sales of $5.6 million and $17.4
million, respectively. Sales of WLAN PAs benefited from the market
transition from 802.11 b/g PAs to 802.11 a/b/g PAs that have a higher
selling price for the increased functionality.

72006 Annual Report ANADIGICS
GROSS MARGIN. Gross margin for 2006 improved to 29.9% of net
sales, compared with 20.6% of net sales in the prior year. The increase
in gross margin from the prior year is the result of the increase in
net sales and production volumes with the consequent absorption of
fixed costs.
RESEARCH & DEVELOPMENT. Company sponsored research and
development expenses increased 19.1% during 2006 to $35.6 million
from $29.9 million during 2005 primarily due to accelerated cus-
tomer demand for new product development, which led to increased
staffing and costs in addition to increased stock-based compensation
of $2.1 million.
SELLING AND ADMINISTRATIVE. Selling and administrative expenses
increased 15.4% during 2006 to $24.6 million from $21.3 million in
2005. The increase was primarily due to increased stock-based com-
pensation of $2.4 million.
RESTRUCTURING AND OTHER CHARGES. During 2005, we settled
an exit obligation for certain redundant leasehold premises resulting
in a savings of $0.1 million against a previously recorded restructur-
ing charge.
INTEREST INCOME. Interest income increased 120.4% to $5.4 mil-
lion during 2006 from $2.5 million in 2005. The increase was primar-
ily due to higher average funds invested as a result of our underwritten
public offering of 10.4 million shares of common stock in March of
2006 (the “March 2006 Offering”) and higher interest rates.
INTEREST EXPENSE. Interest expense decreased to $4.8 million
in 2006 from $5.0 million in 2005. Interest expense arose from obli-
gations under our 5% Convertible Senior Notes due in 2006 (“2006
Notes”) and our 5% Convertible Senior Notes due in 2009 (“2009
Notes”). In November 2006, we repaid the remaining $46.7 million
aggregate principal amount outstanding of our 2006 Notes.
2005 Compared to 2004 NET SALES. Net sales in 2005 increased 18.5% to $108.3 million,
compared to $91.3 million for 2004. The increase in net sales of $17.0
million was primarily due to i) an increase of $16.4 million in our
sales of GSM PA products used in wireless handsets, ii) an increase of
$8.2 million in our sales of WLAN PAs used in the network computer
market and iii) an increase of $2.4 million in our sales of tuner and
active splitter products used in the cable set-top box market. Partially
offsetting these increases were i) a decrease of $5.9 million in our
sales of CDMA PAs and ii) a decrease of $2.3 million in our sales of
switch products used in wireless handsets. The decline in net sales
of CDMA PAs was primarily due to a transition in 2005 to lower-priced
next generation PA modules and declines in average selling prices.
The decline in net sales of switch products was primarily due to
our decision to reduce our research and development expenditures in
this product line.
Specifically, net sales in 2005 of our wireless products increased
17.1% to $53.2 million compared to $45.4 million for 2004. Net sales in
2005 of our broadband products increased 19.9% to $55.1 million com-
pared to $46.0 million in 2004.
GROSS MARGIN. Gross margin for 2005 improved to 20.6% of net
sales, compared with 15.3% of net sales in the prior year. The increase
in gross margin from the prior year is the result of increased sales and
production volumes with consequent absorption of fixed costs. The
decrease in our depreciation expense of $4.1 million offset declines
in average selling prices.
RESEARCH & DEVELOPMENT. Company sponsored research and
development expenses decreased 10.2% during 2005 to $29.9 million
from $33.3 million during 2004 primarily due to decreased headcount
and related compensation expense.
SELLING AND ADMINISTRATIVE. Selling and administrative expenses
decreased 5.4% during 2005 to $21.3 million from $22.5 million in
2004. The decrease was primarily due to decreased headcount, com-
pensation expense and related costs within sales and marketing.
RESTRUCTURING AND OTHER CHARGES. During 2005, we settled
an exit obligation for certain redundant leasehold premises resulting
in a savings of $0.1 million against a previously recorded restructur-
ing charge.
Activity and liability balances related to the restructuring and
other charges for the years ended December 31, 2004 and 2005 are as
follows (in millions):Lease
Related
Year ended December 31, 2004:Beginning balance $ 2.0Deductions (1.3)
December 31, 2004 restructuring balance 0.7Year ended December 31, 2005:Deductions (0.6)Savings on settlement of obligation (0.1)
December 31, 2005 restructuring balance —
8 ANADIGICS 2006 Annual Report
INTEREST INCOME. Interest income increased 12% to $2.5 million
during 2005 from $2.2 million in 2004. The increase was due to higher
average interest rates.
INTEREST EXPENSE. Interest expense increased to $5.0 million in
2005 from $4.1 million in 2004. Interest expense arises from obliga-
tions under our 2006 Notes and our 2009 Notes. In September 2004,
we repurchased $20.0 million aggregate principal amount of our
2006 Notes and consequently reduced the outstanding principal bal-
ance to $46.7 million, and concurrently issued $38.0 million aggre-
gate principal amount of our 2009 Notes.
GAIN ON REPURCHASE OF CONVERTIBLE NOTES. During 2004, we
recognized a gain of $0.3 million, on the repurchase of $20.0 million
aggregate principal amount of our 2006 Notes, after adjusting for
accrued interest and the write-off of a proportionate share of unamor-
tized offering costs.
Liquidity and Sources of Capital At December 31, 2006 we had $13.7 million of cash and cash
equivalents on hand and $69.8 million in marketable securities. We
had $38.0 million aggregate principal amount of our 2009 Notes
outstanding as of December 31, 2006.
Operations required the use of $0.5 million in cash during 2006.
Investing activities used $8.6 million of cash during 2006, consisting
principally of purchases of equipment of $13.4 million, partially offset
by net proceeds on sales of marketable securities of $4.7 million.
Financing activities provided $10.9 million of cash in 2006, primarily
consisting of proceeds received from the issuance of stock, principally
from the March 2006 Offering, and was partially offset by the $46.7
million repayment of our 2006 Convertible Notes.
We believe that our existing sources of capital, including our
existing cash and marketable securities, will be adequate to satisfy
operational needs and anticipated capital needs for at least the next
twelve months. Our anticipated capital needs may include acquisitions
of complementary businesses or technologies, investments in other
companies or repurchases of our outstanding debt or equity. We may
elect to finance all or part of our future capital requirements through
additional equity or debt financing. There can be no assurance that
such additional financing would be available on satisfactory terms.
Our ability to pay principal and interest on our $38.0 million in out-
standing convertible senior unsecured notes, which are due in October
of 2009, and our other debt and to fund our planned capital expen-
ditures depends on our future operating performance.
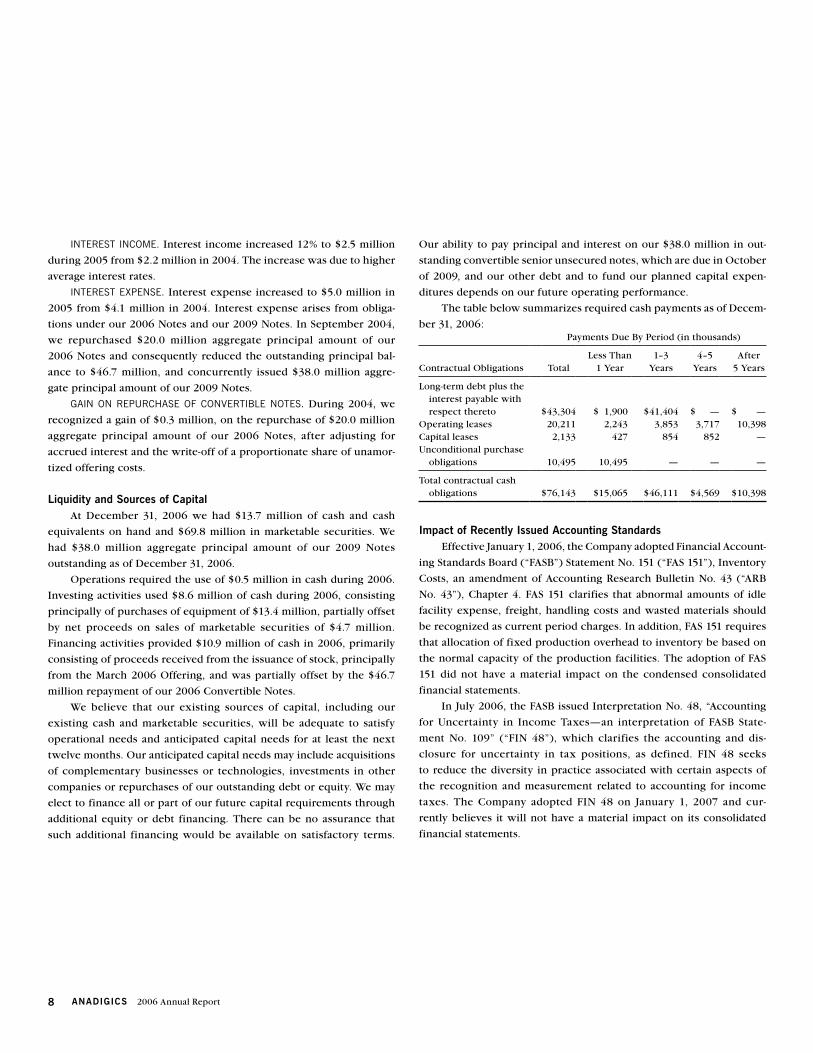
The table below summarizes required cash payments as of Decem-
ber 31, 2006:Payments Due By Period (in thousands)
Contractual Obligations TotalLess Than
1 Year1–3
Years4–5
YearsAfter
5 Years
Long-term debt plus the interest payable with respect thereto $ 43,304 $ 1,900 $ 41,404 $ — $ —
Operating leases 20,211 2,243 3,853 3,717 10,398Capital leases 2,133 427 854 852 —Unconditional purchase
obligations 10,495 10,495 — — —
Total contractual cash obligations $ 76,143 $15,065 $ 46,111 $ 4,569 $ 10,398
Impact of Recently Issued Accounting Standards Effective January 1, 2006, the Company adopted Financial Account-
ing Standards Board (“FASB”) Statement No. 151 (“FAS 151”), Inventory
Costs, an amendment of Accounting Research Bulletin No. 43 (“ARB
No. 43”), Chapter 4. FAS 151 clarifies that abnormal amounts of idle
facility expense, freight, handling costs and wasted materials should
be recognized as current period charges. In addition, FAS 151 requires
that allocation of fixed production overhead to inventory be based on
the normal capacity of the production facilities. The adoption of FAS
151 did not have a material impact on the condensed consolidated
financial statements.
In July 2006, the FASB issued Interpretation No. 48, “Accounting
for Uncertainty in Income Taxes—an interpretation of FASB State-
ment No. 109” (“FIN 48”), which clarifies the accounting and dis-
closure for uncertainty in tax positions, as defined. FIN 48 seeks
to reduce the diversity in practice associated with certain aspects of
the recognition and measurement related to accounting for income
taxes. The Company adopted FIN 48 on January 1, 2007 and cur-
rently believes it will not have a material impact on its consolidated
financial statements.

92006 Annual Report ANADIGICS
In September 2006, the FASB issued FASB Statement No. 157, “Fair
Value Measurements” (“FAS 157”) which defines fair value, establishes
a framework for measuring fair value in generally accepted accounting
principles and expands disclosures about fair value measurements.
FAS 157 is effective for financial statements issued for fiscal years
beginning after November 15, 2007 and interim periods within those
fiscal years. The Company has not yet determined the impact FAS 157
may have on our results from operations or financial position.
In February 2007, the FASB issued FASB Statement No. 159 “The
Fair Value Option for Financial Assets and Financial Liabilities (“FAS
159”), which permits entities to choose to measure many financial
assets and financial liabilities at fair value. Unrealized gains and losses
on items for which the fair value option has been elected are reported
in earnings. FAS 159 is effective for fiscal years beginning after
November 15, 2007. The Company has not yet determined the impact
FAS 159 may have on our results of operations or financial position.
Quantitative and Qualitative Disclosures About Market Risk We are exposed to changes in interest rates primarily from our
investments in certain available-for-sale securities. Our available-for-
sale securities consist primarily of fixed income investments, includ-
ing corporate bonds, commercial paper and Federal, state, municipal,
and agency securities. We continually monitor our exposure to changes
in interest rates and the credit ratings of issuers with respect to our
available-for-sale securities. Accordingly, we believe that the effects of
changes in interest rates and the credit ratings of these issuers are
limited and would not have a material impact on our financial condi-
tion or results of operations. However, it is possible that we would be
at risk if interest rates or the credit ratings of these issuers were to
change in an unfavorable direction. The magnitude of any gain or loss
would be a function of the difference between the fixed rate of the
financial instrument and the market rate and our financial condition
and results of operations could be materially affected.
At December 31, 2006, we held marketable securities with an esti-
mated fair value of $69.8 million. Our primary interest rate exposure
results from changes in short-term interest rates. We do not purchase
financial instruments for trading or speculative purposes. All of our
marketable securities are classified as available-for-sale securities. The
following table provides information about our marketable securities
at December 31, 2006:
Estimated Principal Amount and Weighted Average Stated Rate by
Expected Maturity ValueFair
Value
($’s 000) 2007 2008 2009 Total ($’s 000)
Principal $60,885 $9,000 $— $69,885 $69,776Weighted Average
Stated Rates 5.40% 4.26% — 5.26% —
The stated rates of interest expressed in the above table may not
approximate the actual yield of the securities which we currently hold
since we have purchased some of our marketable securities at other
than face value. Additionally, some of the securities represented in the
above table may be called or redeemed, at the option of the issuer,
prior to their expected due dates. If such early redemptions occur, we
may reinvest the proceeds realized on such calls or redemptions in
marketable securities with stated rates of interest or yields that are
lower than those of our current holdings, which would affect both
future cash interest streams and future earnings. In addition to invest-
ments in marketable securities, we invest some of our cash in money
market funds in order to keep cash available to fund operations and to
hold cash pending investments in marketable securities. Fluctuations
in short-term interest rates will affect the yield on monies invested in
such money market funds. Such fluctuations can have an impact on
our future cash interest streams and future earnings, but the impact of
such fluctuations are not expected to be material.
Our 2009 Notes are convertible and bear a fixed rate of interest of
5%. A change in interest rates on long-term debt is assumed to impact
fair value but not earnings or cash flow because the interest rate is
fixed. At December 31, 2006, the fair value of our outstanding convert-
ible notes, estimated based upon dealer quotes, was approximately
$71.5 million.

10 ANADIGICS 2006 Annual Report
December 31,
(Amounts in thousands, except per share amounts) 2005 2006
AssetsCurrent assets: Cash and cash equivalents $ 11,891 $ 13,706 Marketable securities 70,364 60,892 Accounts receivable, net of allowance for doubtful accounts of $1,060 and $1,115 in 2005 and 2006, respectively 18,755 27,311 Inventories 16,009 20,355 Prepaid expenses and other current assets 2,188 2,662
Total current assets 119,207 124,926Marketable securities 4,102 8,884Plant and equipment Equipment and furniture 133,262 143,195 Leasehold improvements 38,748 38,748 Projects in process 1,617 4,975
173,627 186,918 Less accumulated depreciation and amortization 137,320 145,550
36,307 41,368Goodwill and other intangibles, less accumulated amortization of $499 and $439 in 2005 and 2006, respectively 6,044 5,929Other assets 2,613 1,495
$ 168,273 $ 182,602
Liabilities and Stockholders’ EquityCurrent liabilities: Accounts payable $ 15,519 $ 18,031 Accrued liabilities 4,672 5,688 Accrued restructuring costs 40 — Current maturities of long-term debt 46,700 — Current maturities of capital lease obligations 269 312
Total current liabilities 67,200 24,031Other long-term liabilities 3,175 3,348Long-term debt 38,000 38,000Capital lease obligations, less current portion 1,763 1,463Commitments and contingenciesStockholders’ equity Preferred stock, $0.01 par value, 5,000 shares authorized, none issued or outstanding Common stock, convertible, non-voting, $0.01 par value, 1,000 shares authorized, none issued or outstanding Common stock, $0.01 par value, 144,000 shares authorized at December 31, 2005 and 2006, and 35,007 and
49,200 issued at December 31, 2005 and 2006, respectively 350 492 Additional paid-in capital 347,555 413,672 Accumulated deficit (289,196) (298,046) Accumulated other comprehensive loss (316) (100) Treasury stock at cost: 114 shares (258) (258)
Total stockholders’ equity 58,135 115,760
$ 168,273 $ 182,602
See accompanying notes.
CONSOLIDATED BALANCE SHEETS

112006 Annual Report ANADIGICS
Year Ended December 31,
(Amounts in thousands, except per share amounts) 2004 2005 2006
Net sales $ 91,350 $ 108,281 $ 169,885
Cost of sales 77,355 85,929 119,175
Gross profit 13,995 22,352 50,710
Research and development expenses 33,306 29,906 35,628
Selling and administrative expenses 22,511 21,293 24,562
Restructuring and other charges — (120) —
55,817 51,079 60,190
Operating loss (41,822) (28,727) (9,480)
Interest income 2,203 2,473 5,450
Interest expense (4,085) (4,997) (4,816)
Gain on repurchase of convertible notes 327 — —
Other income (expense) 295 18 (4)
Net loss $ (43,082) $ (31,233) $ (8,850)
Basic and diluted loss per share $ (1.33) $ (0.92) $ (0.20)
Weighted average basic and diluted common shares outstanding 32,413 34,012 43,814
CONSOLIDATED STATEMENTS OF OPERATIONS
Year Ended December 31,
(Amounts in thousands) 2004 2005 2006
Net loss $ (43,082) $ (31,233) $ (8,850)
Other comprehensive income (loss)
Unrealized (loss) gain on marketable securities (617) 242 207
Foreign currency translation adjustment 12 (72) 9
Reclassification adjustment:
Net realized gain previously included in other comprehensive income (19) — —
Comprehensive loss $ (43,706) $ (31,063) $ (8,634)
See accompanying notes.
CONSOLIDATED STATEMENTS OF COMPREHENSIVE LOSS
12 ANADIGICS 2006 Annual Report
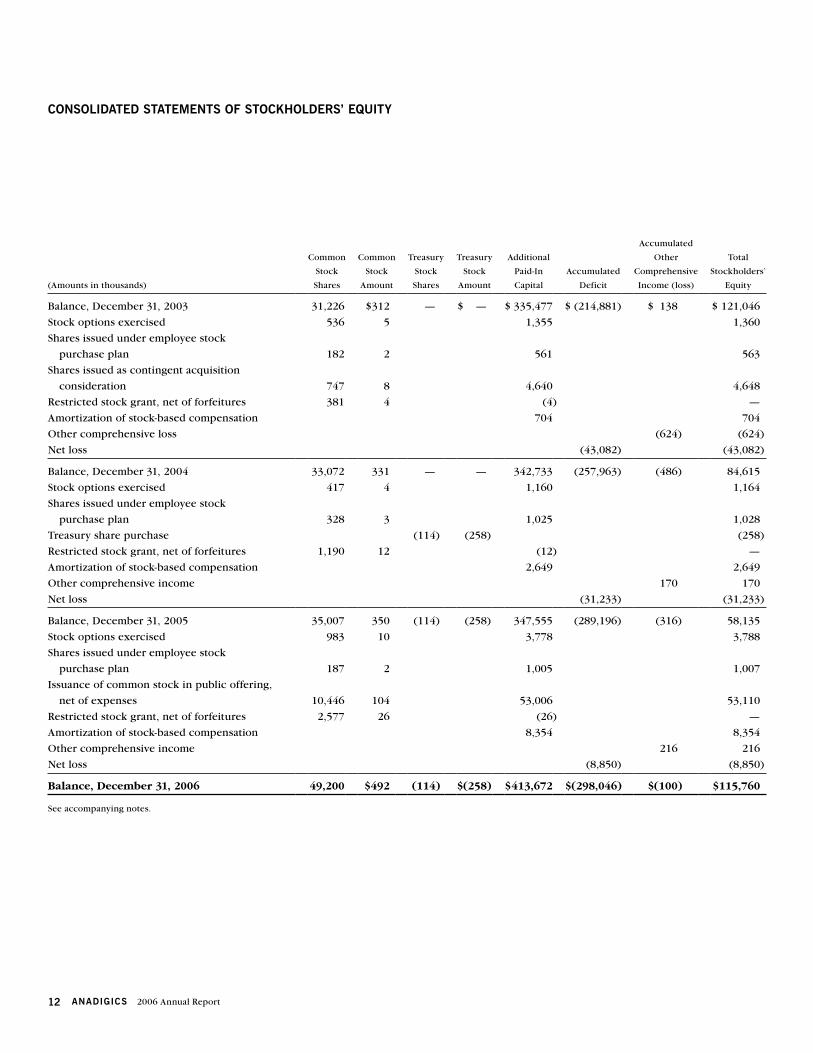
CONSOLIDATED STATEMENTS OF STOCKHOLDERS’ EQUITY
(Amounts in thousands)
Common
Stock
Shares
Common
Stock
Amount
Treasury
Stock
Shares
Treasury
Stock
Amount
Additional
Paid-In
Capital
Accumulated
Deficit
Accumulated
Other
Comprehensive
Income (loss)
Total
Stockholders’
Equity
Balance, December 31, 2003 31,226 $312 — $ — $ 335,477 $ (214,881) $ 138 $ 121,046
Stock options exercised 536 5 1,355 1,360
Shares issued under employee stock
purchase plan 182 2 561 563
Shares issued as contingent acquisition
consideration 747 8 4,640 4,648
Restricted stock grant, net of forfeitures 381 4 (4) —
Amortization of stock-based compensation 704 704
Other comprehensive loss (624) (624)
Net loss (43,082) (43,082)
Balance, December 31, 2004 33,072 331 — — 342,733 (257,963) (486) 84,615
Stock options exercised 417 4 1,160 1,164
Shares issued under employee stock
purchase plan 328 3 1,025 1,028
Treasury share purchase (114) (258) (258)
Restricted stock grant, net of forfeitures 1,190 12 (12) —
Amortization of stock-based compensation 2,649 2,649
Other comprehensive income 170 170
Net loss (31,233) (31,233)
Balance, December 31, 2005 35,007 350 (114) (258) 347,555 (289,196) (316) 58,135
Stock options exercised 983 10 3,778 3,788
Shares issued under employee stock
purchase plan 187 2 1,005 1,007
Issuance of common stock in public offering,
net of expenses 10,446 104 53,006 53,110
Restricted stock grant, net of forfeitures 2,577 26 (26) —
Amortization of stock-based compensation 8,354 8,354
Other comprehensive income 216 216
Net loss (8,850) (8,850)
Balance, December 31, 2006 49,200 $492 (114) $(258) $ 413,672 $(298,046) $(100) $115,760
See accompanying notes.

132006 Annual Report ANADIGICS
Year Ended December 31,
(Amounts in thousands) 2004 2005 2006
Cash Flows from Operating ActivitiesNet loss $ (43,082) $ (31,233) $ (8,850)
Adjustments to reconcile net loss to net cash used in operating activities:
Gain on repurchase of convertible notes (327) — —
Depreciation 15,282 10,921 7,931
Amortization 1,483 1,703 1,809
Stock-based compensation 704 2,649 8,354
Amortization of premium on marketable securities 2,090 1,189 163
Loss (gain) on sale of equipment 15 (1) 7
Changes in operating assets and liabilities:
Accounts receivable 1,304 (7,985) (8,556)
Inventory (4,115) (1,573) (4,346)
Prepaid expenses and other assets 361 1,101 (703)
Accounts payable (1,476) 7,498 2,512
Accrued and other liabilities (1,892) (701) 1,158
Net cash used in operating activities (29,653) (16,432) (521)
Cash Flows from Investing ActivitiesPurchases of plant and equipment (3,427) (2,262) (13,374)
Purchases of marketable securities (51,128) (64,098) (227,150)
Proceeds from sales of marketable securities 58,627 81,565 231,884
Business acquisitions (55) — —
Proceeds from sale of equipment 130 53 28
Net cash provided (used) by investing activities 4,147 15,258 (8,612)
Cash Flows from Financing ActivitiesPayment of obligations under capital leases (66) (40) (257)
Proceeds from issuance of long-term debt net of offering costs 35,695 — —
Repurchase of convertible notes (19,400) — —
Repayment of convertible notes — — (46,700)
Issuances of common stock, net of related expenses 1,923 2,192 57,905
Repurchase of common stock into treasury — (258) —
Net cash provided by financing activities 18,152 1,894 10,948
Net (decrease) increase in cash and cash equivalents (7,354) 720 1,815
Cash and cash equivalents at beginning of period 18,525 11,171 11,891
Cash and cash equivalents at end of period $ 11,171 $ 11,891 $ 13,706
Supplemental disclosures of cash flow information:
Interest paid $ 3,193 $ 4,346 $ 4,370
Taxes paid 117 82 37
Acquisition of equipment under capital leases — 2,055 —
See accompanying notes.
CONSOLIDATED STATEMENTS OF CASH FLOWS

14 ANADIGICS 2006 Annual Report
1. Summary of Significant Accounting Policies
NATURE OF OPERATIONS AND BASIS OF PRESENTATION
We are a leading provider of semiconductor solutions in the
rapidly growing broadband wireless and wireline communications
markets. Our products include power amplifiers (“PAs”), tuner inte-
grated circuits, active splitters, line amplifiers and other components,
which can be sold individually or packaged as integrated radio
frequency (“RF”) and front end modules. We offer third generation
(“3G”) products that use the Wideband Code-Division Multiple Access
(“W-CDMA”) and Enhanced Data Rates for Global System for Mobile
Communication (“GSM”) Evolution (“EDGE”) standards, beyond third
generation (“3.5G”) products that use the High Speed Down Line
Packet Access (“HSDPA”) and High Speed Uplink Line Packet Access
(“HSUPA”) standards, fourth generation (“4G”) products for World-
wide Interoperability for Microwave Access (“WiMAX”) and Wireless
Broadband (“WiBRO”) systems, Wireless Fidelity (“WiFi”) products
that use the 802.11 a/b/g and 802.11 n (draft-n, Multiple Input Multiple
Output (“MIMO”)) standards, cable television (“CATV”) set-top box
products, CATV infrastructure products and Fiber-To-The-Premises
(“FTTP”) products. Our integrated solutions enable our customers to
improve RF performance, power efficiency, reliability, time-to-market
and the integration of chip components into single packages, while
reducing the size, weight and cost of their products.
We design, develop and manufacture RFICs primarily using GaAs
compound semiconductor substrates with various process tech-
nologies, Metal Semiconductor Field Effect Transistors (“MESFET”),
Pseudomorphic High Electron Mobility Transistors (“pHEMT”), and
Heterojunction Bipolar Transistors (“HBT”). Our proprietary technol-
ogy, which utilizes InGaP-plus™, combines InGaP HBT and pHEMT
processes on a single substrate, enabling us to integrate the PA func-
tion and the RF active switch function on the same die. We fabricate
substantially all of our ICs in our six-inch diameter GaAs wafer fabrica-
tion facility. We believe our strong fabrication capability combined
with integrated product design and logistics expertise, allow quick
development and manufacture of products to meet market and cus-
tomer requirements.
The consolidated financial statements include the accounts of
ANADIGICS, Inc. and its wholly owned subsidiaries. All significant
inter-company accounts and transactions have been eliminated in
consolidation.
USE OF ESTIMATES
The preparation of financial statements in conformity with
accounting principles generally accepted in the United States of
America requires management to make estimates and assumptions
that affect the reported amounts in the consolidated financial state-
ments and the accompanying notes. Actual results could differ
from those estimates. Significant estimates that affect the financial
statements include, but are not limited to: recoverability of inven-
tories, useful lives and amortization periods and recoverability of long-
lived assets.
CONCENTRATION OF CREDIT RISK
The Company grants trade credit to its customers, who are pri-
marily foreign manufacturers of wireless communication devices,
cable and broadcast television receivers and fiber optic commu-
nication devices. The Company performs periodic credit evaluations
of its customers and generally does not require collateral. Sales and
accounts receivable from customers are denominated in U.S. dollars.
The Company has not experienced significant losses related to receiv-
ables from these individual customers.
Net sales to individual customers who accounted for 10% or more
of the Company’s total net sales and corresponding end application
information are as follows:Year Ended December 31,
2004 2005 2006
Customer (application)
Intel (Broadband) <10% <10% $ 15,678 14% $ 29,827 18%World Peace Group
(Wireless & Broadband) <10% <10% $ 17,275 16% $ 28,175 17%LG Electronics (Wireless) $ 13,628 15% $ 12,321 11% <10% <10%Kyocera (Wireless) $ 9,751 11% <10% <10% <10% <10%Motorola (Broadband) $ 9,184 10% <10% <10% <10% <10%Cisco (Broadband) $ 9,218 10% <10% <10% <10% <10%
Accounts receivable at December 31, 2005 and 2006 from the
greater than 10% customers accounted for 29% and 34% of total
accounts receivable, respectively.
REVENUE RECOGNITION
Revenue from product sales is recognized when the title, risk and
rewards of product ownership are transferred to the customer, price
and terms are fixed, no significant vendor obligation exists and collec-
tion of the resulting receivable is reasonably assured. The Company
sells to certain distributors who are granted rights of return and
exchange and certain price protection. Revenue is not recognized for
the portion of shipments subject to return, exchange or price protec-
tion until such rights expire. The Company charges customers for the
costs of certain contractually-committed inventories that remain at the
end of a product’s life. Cancellation revenue is recognized when cash
is received. The value of the inventory related to cancellation revenue
may, in some instances, have been reserved during prior periods in
accordance with the Company’s inventory obsolescence policy. The
NOTES TO CONSOLIDATED FINANCIAL STATEMENTS(Amounts in thousands, except per share amounts)

152006 Annual Report ANADIGICS
Company maintains an allowance for doubtful accounts for estimated
losses resulting from customers’ failure to make payments.
WARRANTY COSTS
The Company provides, by a current charge to income, an amount
it estimates, by examining historical returns and other information it
deems critical, will be needed to cover future warranty obligations for
products sold during the year. The accrued liability for warranty costs
is included in accrued liabilities in the consolidated balance sheets.
PLANT AND EQUIPMENT
Plant and equipment are stated at cost. Depreciation of plant, fur-
niture and equipment has been provided on the straight-line method
over 3–5 years. Leasehold improvements are amortized and included
in depreciation over the useful life of the leasehold or the life of the
lease, whichever is shorter.
The cost of equipment acquired under capital leases was $9,781
and $9,806 at December 31, 2005 and 2006, respectively, and accumu-
lated amortization was $7,726 and $8,072 at December 31, 2005 and
2006, respectively. Equipment acquired under a capital lease is amor-
tized and included in depreciation over the useful life of the leased
equipment or the life of the lease, whichever is shorter.
GOODWILL AND OTHER INTANGIBLES
Goodwill, process technology, customer list and a covenant-not-
to-compete were recorded as part of the Company’s acquisitions.
Goodwill is not subject to amortization but is reviewed for potential
impairment annually or upon the occurrence of an impairment indica-
tor using a two-phase process. The first phase screens for impairment;
while the second phase measures the impairment. Process technol-
ogy, the customer list and the covenant continued to be amortized
using the straight-line method over three to four year lives. The carry-
ing amount of the Company’s intangibles are reviewed on a regular
basis for any signs of an impairment. The Company determines if the
carrying amount is impaired based on anticipated cash flows. In the
event of impairment, a loss is recognized based on the amount by
which the carrying amount exceeds the fair value of the asset. For
each of the reporting units, fair value is determined primarily using
the anticipated cash flows, discounted at a rate commensurate with
the associated risk.
IMPAIRMENT OF LONG-LIVED ASSETS
Long-lived assets used in operations are reviewed for impairment
whenever events or changes in circumstances indicate that the carry-
ing amount of the assets might not be recoverable. For long-lived assets
to be held and used, the Company recognizes an impairment loss only
if its carrying amount is not recoverable through its undiscounted cash
flows and measures the impairment loss based on the difference
between the carrying amount and fair value. Long-lived assets held for
sale are reported at the lower of cost or fair value less costs to sell.
INCOME TAXES
Deferred income taxes reflect the net effects of temporary dif-
ferences between the carrying amount of assets and liabilities for
financial reporting purposes and the income tax basis of such assets
and liabilities. The Company maintains a full valuation allowance on
its deferred tax assets.
RESEARCH AND DEVELOPMENT COSTS
The Company charges all research and development costs associ-
ated with the development of new products to expense when incurred.
CASH EQUIVALENTS
The Company considers all highly liquid marketable securities
with a maturity of three months or less when purchased as cash
equivalents.
MARKETABLE SECURITIES
Available-for-sale securities are stated at fair value, as determined
by quoted market prices, with unrealized gains and losses reported in
other accumulated comprehensive income or loss. The cost of securi-
ties sold is based upon the specific identification method. The amor-
tized cost of debt securities is adjusted for amortization of premium
and accretion of discounts to maturity. Such amortization, realized
gains and losses, interest and dividends are included in interest income.
See Note 7 for a summary of available-for-sale securities.
INVENTORY
Inventories are valued at the lower of cost or market (“LCM”),
using the first-in, first-out method. In addition to LCM limitations, the
Company reserves against inventory items for estimated obsolescence
or unmarketable inventory. The reserve for excess and obsolete inven-
tory is primarily based upon forecasted short-term demand for the
product and any change to the reserve arising from forecast revisions
is reflected in cost of sales in the period the revision is made.
DEFERRED RENT
Aggregate rental expense is recognized on a straight-line basis
over the lease terms of operating leases that contain predetermined
increases in rentals payable during the lease term.
FOREIGN CURRENCY TRANSLATION
The financial statements of subsidiaries outside of the United
States are measured using the local currency as the functional cur-
rency. Assets and liabilities of these subsidiaries are translated at the
rates of exchange at the balance sheet date. The resultant translation
16 ANADIGICS 2006 Annual Report
adjustments are included in other accumulated comprehensive income
or loss. Income and expense items are translated at the average
monthly rates of exchange. Gains and losses from foreign currency
transactions of these subsidiaries are included in the determination of
net income or loss.
EARNINGS PER SHARE
Basic and diluted earnings per share are calculated in accordance
with FASB Statement No. 128, Earnings Per Share. Basic earnings per
share is computed by dividing net income by the weighted average
number of common shares outstanding during the period. Diluted
earnings per share reflects the potential dilution that could occur if
stock options and other commitments to issue common stock were
exercised resulting in the issuance of common stock of the Company.
Any dilution arising from the Company’s outstanding stock options or
shares potentially issuable upon conversion of the convertible notes
are not included as their effect is anti-dilutive.
FAIR VALUE OF FINANCIAL INSTRUMENTS
The fair value of a financial instrument is the amount at which the
instrument could be exchanged in a current transaction between will-
ing parties. The fair value of each of the following instruments approx-
imates their carrying value because of the short maturity of these
instruments: cash and cash equivalents, accounts receivable, accounts
payable and accrued liabilities. At December 31, 2005 and 2006, the
fair value of the Company’s outstanding convertible senior notes, esti-
mated based upon dealer quotes, were approximately $93,694 and
$71,516, respectively, compared to their carrying values of $84,700
and $38,000, respectively.
STOCK-BASED COMPENSATION
The Company has various stock-based compensation plans for
employees and directors, which are described more fully in Note 12
“Employee Benefits Plans.” Effective January 1, 2006, the Company
accounts for these plans under Financial Accounting Standards Board
(“FASB”) Statement No. 123R Share-Based Payment (“FAS 123R”).
IMPACT OF RECENTLY ISSUED ACCOUNTING STANDARDS
Effective January 1, 2006, the Company adopted FASB Statement
No. 151 (“FAS 151”), Inventory Costs, an amendment of Accounting
Research Bulletin No. 43 (“ARB No. 43”), Chapter 4. FAS 151 clarifies
that abnormal amounts of idle facility expense, freight, handling costs
and wasted materials should be recognized as current period charges.
In addition, FAS 151 requires that allocation of fixed production over-
head to inventory be based on the normal capacity of the production
facilities. The adoption of FAS 151 did not have a material impact on
the condensed consolidated financial statements.
In July 2006, the FASB issued Interpretation No. 48, “Accounting
for Uncertainty in Income Taxes—an interpretation of FASB State-
ment No. 109” (“FIN 48”), which clarifies the accounting and dis-
closure for uncertainty in tax positions, as defined. FIN 48 seeks to
reduce the diversity in practice associated with certain aspects of the
recognition and measurement related to accounting for income taxes.
The Company adopted FIN 48 on January 1, 2007 and currently
believes it will not have a material impact on its consolidated finan-
cial statements.
In September 2006, the FASB issued FASB Statement No. 157, “Fair
Value Measurements” (“FAS 157”), which defines fair value, establishes
a framework for measuring fair value in generally accepted accounting
principles and expands disclosures about fair value measurements.
FAS 157 is effective for financial statements issued for fiscal years
beginning after November 15, 2007 and interim periods within those
fiscal years. The Company has not yet determined the impact FAS 157
may have on our results from operations or financial position.
In February 2007, the FASB issued FASB Statement No. 159 “The
Fair Value Option for Financial Assets and Financial Liabilities” (“FAS
159”), which permits entities to choose to measure many financial
assets and financial liabilities at fair value. Unrealized gains and losses
on items for which the fair value option has been elected are reported
in earnings. FAS 159 is effective for fiscal years beginning after
November 15, 2007. The Company has not yet determined the impact
FAS 159 may have on our results of operations or financial position.
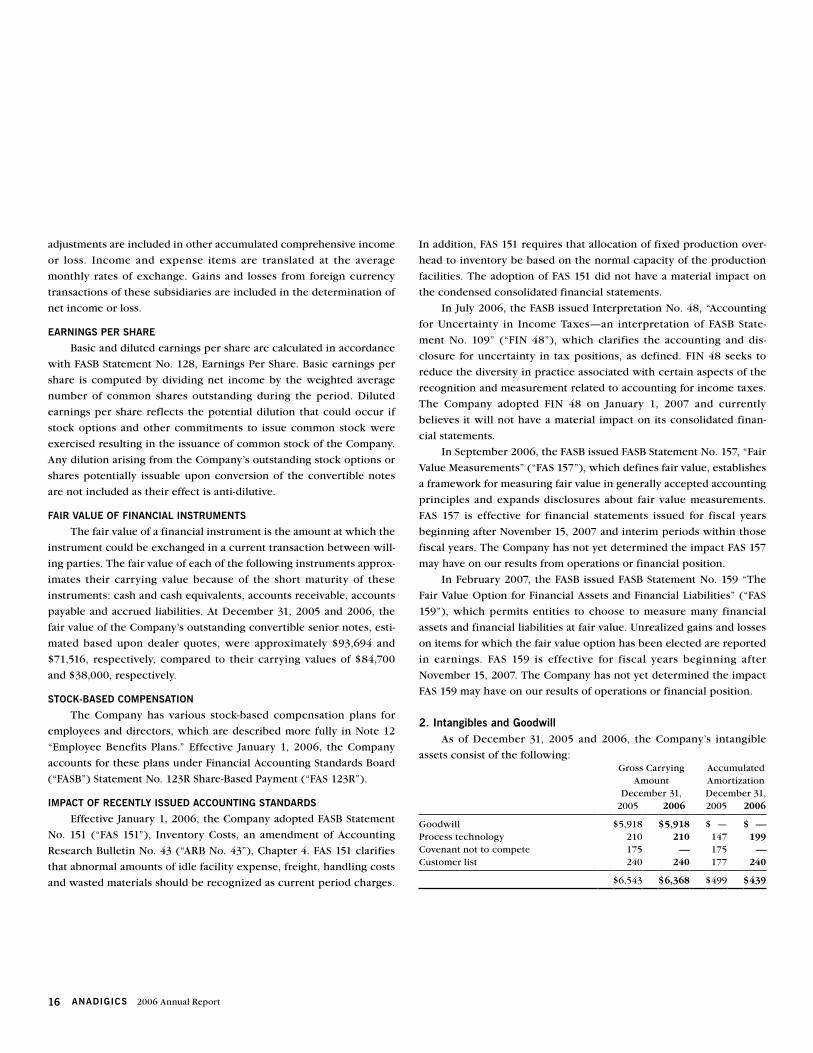
2. Intangibles and Goodwill As of December 31, 2005 and 2006, the Company’s intangible
assets consist of the following:Gross Carrying
AmountAccumulated Amortization
December 31, December 31,2005 2006 2005 2006
Goodwill $ 5,918 $ 5,918 $ — $ —Process technology 210 210 147 199Covenant not to compete 175 — 175 —Customer list 240 240 177 240
$ 6,543 $ 6,368 $ 499 $ 439

172006 Annual Report ANADIGICS
Annual amortization expense related to intangible assets is calcu-
lated over their estimated useful lives of three to four years and was
$194, $240 and $115 in the years ended December 31, 2004, 2005 and
2006, respectively. The $11 unamortized balance at December 31,
2006 relating to process technology will be fully amortized in 2007.
3. Restructuring and Other Charges The January 1, 2005 restructuring balance related to lease-related
costs. Certain lease-related obligations were settled during 2005 and
resulted in a savings to the Company of $120.
Activity and liability balances related to the restructuring and
other charges for the years ended December 31, 2004, 2005 and 2006
are as follows:Balance
January 1, 2004 restructuring balance $ 1,994Deductions (1,268)
December 31, 2004 restructuring balance 726Deductions (566)
Savings on settlement of obligation (120)December 31, 2005 restructuring balance 40Deductions (40)
December 31, 2006 restructuring balance $ —
4. Segments The Company operates in one segment. Its integrated circuits
are primarily manufactured using common manufacturing facilities
located in the same domestic geographic area. All operating expenses
and assets of the Company are combined and reviewed by the chief
operating decision maker on an enterprise-wide basis, resulting in
no additional discrete financial information or reportable segment
information.
The Company classifies its revenues based upon the end appli-
cation of the product in which its integrated circuits are used. Net
sales by end application are regularly reviewed by the chief operating
decision maker and are as follows:Year Ended December 31,
2004 2005 2006
Wireless $ 45,379 $ 53,143 $ 91,275Broadband 45,971 55,138 78,610
Total $ 91,350 $ 108,281 $ 169,885
The Company primarily sells to three geographic regions: Asia,
USA and Canada, and Other. The geographic region is determined
based on shipping addresses, not on the locations of the ultimate
users. Net sales to each of the three geographic regions are as follows:
Year Ended December 31,
2004 2005 2006
Asia $ 48,939 $ 57,188 $ 92,462USA and Canada 35,982 41,729 64,634Other 6,429 9,364 12,789
Total $ 91,350 $ 108,281 $ 169,885
5. Long-Term Debt On September 24, 2004, the Company issued $38,000 aggregate
principal amount of 5% Convertible Senior Notes (“2009 Notes”) due
October 15, 2009. The 2009 Notes are convertible into shares of the
Company’s common stock at any time prior to their maturity, at an
initial conversion rate, subject to adjustment, of 200 shares for each
$1,000 principal amount, which is equivalent to a conversion price of
$5.00 per share (7,600 shares contingently issuable). Pursuant to the
indenture, dated as of September 24, 2004, between the Company and
U.S. Bank Trust Association, as trustee, in the event of a “fundamental
change” on or prior to July 15, 2009, the Company will pay a make
whole premium upon the repurchase or conversion of the 2009 Notes.
Subject to certain exceptions, the make whole premium will be 1% of
the principal amount of the 2009 Notes, plus an additional premium
based on the date such “fundamental change” becomes effective and
the price paid per share of the Company’s common stock in the trans-
action constituting the “fundamental change.” Interest on the 2009
Notes is payable semi-annually in arrears on April 15 and October 15
of each year.
On November 27, 2001, the Company issued $100,000 aggregate
principal amount of 5% Convertible Senior Notes (“2006 Notes”) due
November 15, 2006. The 2006 Notes were convertible into shares of
common stock at a rate of 47.619 shares for each $1,000 principal
amount (convertible at a price of $21.00 per share), subject to adjust-
ment. During 2002, the Company repurchased and retired $33,300
aggregate principal amount of the 2006 Notes. In addition, in the third
quarter of 2004 and concurrent with the issuance of the 2009 Notes,
the Company repurchased and retired $20,000 aggregate principal
amount of the 2006 Notes for $19,758 in cash, inclusive of accrued
interest of $358. The Company recognized a gain of $327 on the repur-
chase, after adjusting for the write-off of a proportionate share of
unamortized offering costs. On November 15, 2006, the Company
repaid the remaining $46,700 balance of the 2006 Notes obligation.

18 ANADIGICS 2006 Annual Report
Unamortized debt issuance costs of $1,999 and $1,273 at December
31, 2005 and 2006, respectively, consisting principally of underwrit-
ers’ fees, were included in other assets and are being amortized over
the life of the notes.
6. Commitments and Contingencies The Company leases manufacturing, warehousing and office space
and manufacturing equipment under noncancelable operating leases
that expire through 2016. The Company also leases certain equipment
under capital lease that expires in 2011. Rent expense, net of sublease
income was $3,063, $2,447 and $2,101 in 2004, 2005 and 2006, respec-
tively. Sublease income was $780, $270 and $24 in 2004, 2005 and
2006, respectively. The future minimum lease payments under the
noncancelable operating leases and the present value of the minimum
capital lease payments are as follows:
YearCapital Leases
Operating Leases
2007 $ 427 $ 2,2432008 427 1,9612009 427 1,8922010 427 1,8592011 425 1,858Thereafter — 10,398
Total minimum lease payments 2,133 20,211Less: amount representing interest (369) —
$1,764 $20,211
In addition to the above, at December 31, 2006, the Company had
unconditional purchase obligations of approximately $10,495.
7. Marketable SecuritiesThe following is a summary of available-for-sale securities:
Available-for-Sale Securities
Cost
Gross Unrealized
Gains (Losses)Estimated Fair Value
Government-Sponsored Enterprises $ 8,500 $ (53) $ 8,447State & Municipal Debt Securities 10,725 — 10,725Corporate Debt Securities 55,510 (216) 55,294
Total at December 31, 2005 $ 74,735 $(269) $74,466
Government-Sponsored Enterprises $ 6,395 $ (12) $ 6,383State & Municipal Debt Securities 10,045 — 10,045Corporate Debt Securities 53,398 (50) 53,348
Total at December 31, 2006 $ 69,838 $ (62) $69,776
Management has the ability and intent, if necessary, to liquidate
any of its marketable securities in order to meet the Company’s liquid-
ity needs in the next 12 months. Accordingly, certain securities with
contractual maturities greater than one year from year-end have been
classified as short-term on the accompanying consolidated balance
sheet. Expected maturities may differ from contractual maturities
because the issuers of the securities may have the right to prepay obli-
gations. The amortized cost and estimated fair value of marketable
securities at December 31, 2006, are shown below:
Available-for-Sale Securities
CostEstimated Fair Value
Due in one year or less $60,925 $60,892Due after one year through two years 8,913 8,884
Total $69,838 $69,776
8. Inventories Inventories consist of the following:
December 31,
2005 2006
Raw materials $ 2,870 $ 5,700Work in progress 10,973 12,097Finished goods 5,068 6,341
18,911 24,138Reserves (2,902) (3,783)
Total $ 16,009 $ 20,355
9. Accrued Liabilities Accrued liabilities consist of the following:
December 31,
2005 2006
Accrued compensation $ 2,123 $ 2,421Warranty reserve 396 347Other 2,153 2,920
Total $ 4,672 $ 5,688
Warranty reserve movements in the years ended December 31,
2005 and 2006 for returns were $397 and $726, respectively. The peri-
odic charges for estimated warranty costs were $634 and $677 in the
years ended December 31, 2005 and 2006.

192006 Annual Report ANADIGICS
10. Income Taxes The current and deferred components of income taxes for each of
the years ended December 31, 2004, 2005 and 2006 were zero.
Deferred tax assets require a valuation allowance when, in the
opinion of management, it is more likely than not that some portion of
the deferred tax assets may not be realized. Whereas realization of the
deferred tax assets is dependent upon the timing and magnitude of
future taxable income prior to the expiration of the deferred tax attri-
butes, management began recording a full valuation allowance in
2001. The amount of the deferred tax assets considered realizable,
however, could change if estimates of future taxable income during
the carryforward period are changed.
Significant components of the Company’s net deferred taxes as of
December 31, 2005 and 2006 are as follows:December 31,
2005 2006
Deferred tax balances Accruals/reserves $ 3,148 $ 6,045 Net operating loss carryforwards 105,819 108,327 Research and experimentation credits 5,870 10,686 Deferred rent expense 1,215 1,336 Difference in basis of plant and equipment 3,560 4,136 Other — — Valuation allowance (119,612) (130,530)
Net deferred tax assets — —
As of December 31, 2006, the Company had net operating loss
carryforwards of approximately $298,000 for both federal and state
tax reporting purposes. The federal carryforward will begin to expire
in 2019, and the state carryforwards have begun to expire. At December
31, 2006, $27,403 of the deferred tax asset related to net operating loss
carryforwards and an equivalent amount of deferred tax asset valua-
tion allowance represented tax benefits associated with the exercise
of non-qualified stock options and restricted stock deduction over
book. Such benefit, when realized, will be credited to additional paid-
in capital.
The earnings associated with the Company’s investment in its
foreign subsidiaries is considered to be permanently invested and no
provision for U.S. federal and state income taxes on those earnings
or translation adjustments have been provided.
The reconciliation of income tax expense computed at the U.S.
federal statutory rate to the benefit from income taxes is as follows:
Year Ended December 31,
2004 2005 2006
Tax at US statu-tory rate $(15,079) (35.0)% $(10,932) (35.0)% $ (3,097) (35.0)%
Effect of perma-nent items (750) (1.7) (88) (0.3) (2,086) (23.6)
State and foreign tax (benefit), net of federal tax effect (1,470) (3.4) (1,023) (3.3) (481) (5.4)
Research and experimen-tation tax credits, net (516) (1.2) (797) (2.6) (4,816) (54.4)
Valuation allowance 17,850 41.4 12,763 40.9 10,918 123.3
Other (35) (0.1) 77 0.3 (438) (4.9)
Benefit from income taxes $ — 0.0% $ — 0.0% $ — 0.0%
11. Stockholders’ Equity In March 2006, the Company completed an underwritten public
offering of 10,446 shares of common stock at a price of $5.50 which
generated net proceeds to the Company of $53,110.
On December 17, 1998, the Company adopted a Shareholders’
Rights Agreement (the “Agreement”). Pursuant to the Agreement, as
amended on November 30, 2000, rights were distributed as a dividend
at the rate of one right for each share of ANADIGICS, Inc. common
stock, par value $0.01 per share, held by stockholders of record as of
the close of business on December 31, 1998. The rights will expire on
December 17, 2008, unless earlier redeemed or exchanged. Under the
Agreement, each right will entitle the registered holder to buy one
one-thousandth of a share of Series A Junior Participating Preferred
Stock at a price of $75.00 per one one-thousandth of a share, subject to
adjustment in accordance with the Agreement. The rights will become
exercisable only if a person or group of affiliated or associated persons
acquires, or obtains the right to acquire, beneficial ownership of
ANADIGICS, Inc. common stock or other voting securities that have
18% or more of the voting power of the outstanding shares of voting
stock, or upon the commencement or announcement of an intention
to make a tender offer or exchange offer, the consummation of which
would result in such person or group acquiring, or obtaining the right
to acquire, beneficial ownership of 18% or more of the voting power
of ANADIGICS, Inc. common stock or other voting securities.

20 ANADIGICS 2006 Annual Report
12. Employee Benefit Plans Effective January 1, 2006, the Company adopted the provisions of
FAS 123R in accounting for share-based payments to employees, hav-
ing previously followed the provisions of Accounting Principles Board
Opinion Number 25, “Accounting for Stock Issued to Employees,” as
permitted by FAS 123. The Company has adopted FAS 123R using the
modified-prospective transition method, which requires the recogni-
tion of compensation expense over the remaining vesting period for
all awards that remain unvested as of January 1, 2006. The Company
adopted the alternative transition method provided in FASB Staff
Position No. FAS 123R-3 “Transition Election Related to Accounting for
the Tax Effects of Share-Based Payment Awards” for calculating the tax
effects of stock-based compensation. The alternative transition method
includes simplified methods to establish the beginning balance of the
additional paid-in-capital pool (“APIC pool”) related to the tax effects
of employee stock-based compensation, and to determine the subse-
quent impact on the APIC pool and consolidated statements of cash
flows of the tax effects of employee stock-based compensation awards
that are outstanding upon adoption of FAS 123R.
EQUITY COMPENSATION PLANS
The Company had 4 equity compensation plans under which
equity securities are authorized for issuance to employees and/or
directors:
• The 1995 Long-Term Incentive and Share Award Plan for Officers
and Directors (terminated February 28, 2005) (“1995 Plan”);
• The 1997 Long-Term Incentive and Share Award Plan (“1997
Plan”);
• The 2005 Long-Term Incentive and Share Award Plan (“2005
Plan,” collectively with the 1995 Plan and the 1997 Plan, “the
Plans”); and
• The ESP Plan.
Employees and outside directors have been granted restricted
stock and options to purchase shares of common stock under stock
option plans adopted in 1995, 1997 and 2005. An aggregate of 4,913,
5,100 and 5,450 shares of common stock were reserved for issuance
under the 1995 Plan, the 1997 Plan and the 2005 Plan, respectively.
The Plans provide for the granting of stock options, stock appreciation
rights, restricted shares and other share-based awards to eligible
employees and directors, as defined in the Plans. Option grants have
terms of ten years and become exercisable in varying amounts over
periods of up to three years. To date, no stock appreciation rights
have been granted under the Plans.
In 1995, the Company adopted the ESP Plan under Section 423 of
the Internal Revenue Code. All full-time employees of ANADIGICS,
Inc. and part-time employees, as defined in the ESP Plan, are eligible
to participate in the ESP Plan. An aggregate of 2,694 shares of com-
mon stock were reserved for offering under the ESP Plan. Offerings
are made at the commencement of each calendar year and must be
purchased by the end of that calendar year. Pursuant to the terms of
the ESP Plan, shares purchased and the applicable per share price
were 182 ($3.11), 328 ($3.13) and 187 ($5.36), respectively, for the
years ended December 31, 2004, 2005 and 2006, respectively.
Under FAS 123R, stock-based compensation expense arises from
the amortization of restricted stock grants, unamortized stock option
grants and from the ESP Plan whereas in 2004 and 2005, only amor-
tization of restricted stock grants was required. The Company is using
the straight-line basis in calculating stock-based compensation expense.

212006 Annual Report ANADIGICS
The following table illustrates the effect on net loss and loss per common share as if the Company had applied the fair value method to
measure stock-based compensation, required under the disclosure provisions of FAS 123R(1):For Years Ended December 31,
US GAAP (as reported)
Pro Forma (comparison only)
2006 2005 2004 2005 2004
Amortization of restricted stock awards $ (7,754) $ (2,649) $ (669) $ (2,649) $ (669)Amortization of ESP Plan (400) — — (567) (483)Amortization of stock option awards (200) — (35) (542) (8,826)Total stock-based compensation $ (8,354) $ (2,649) $ (704) $ (3,758) $ (9,978)Net loss $ (8,850) $ (31,233) $ (43,082) $ (32,342) $ (52,356)Basic and diluted loss per share $ (0.20) $ (0.92) $ (1.33) $ (0.95) $ (1.62)By Financial Statement line itemCost of sales $ 1,829 $ 596 $ 115 $ 798 $ 1,118Research and development expenses 3,287 1,185 316 1,561 1,901Selling and administrative expenses 3,238 868 273 1,399 6,959
(1) Pro forma disclosure for 2004 and 2005 presents the full effect of share-based compensation expense as required under FAS 123R, which was adopted effective January 1, 2006 using the modified-prospective method. As reported historical GAAP results for periods prior to January 1, 2006 reflect only that portion of share-based compensation expense required by GAAP prior to the adoption of FAS 123R.
RESTRICTED STOCK AWARDS
Commencing in August 2004, the Company began granting restricted shares under the Plans. The value of the restricted stock awards are
fixed upon the date of grant and amortized over the related vesting period of one to three years. Restricted stock awards are subject to forfeiture
if employment terminates prior to vesting. The restricted stock awards carry voting and dividend rights commencing upon grant but may not be
traded or transferred prior to vesting. Grant, vest and forfeit activity and related weighted average (WA) price per share for restricted stock and for
stock options during the period from January 1, 2004 to December 31, 2006 is presented in tabular form below:
Restricted Shares Stock Options
SharesWA Price per Share
Issuable Upon
Exercise
WA Exercise
Price
Grants outstanding at January 1, 2004 — $ — 5,905 $ 7.30Granted 403 4.01 1,944 7.16Shares vested/options exercised — — (537) 2.53Forfeited/expired (22) 4.01 (520) 9.31
Balance at December 31, 2004 381 4.01 6,792 7.47Granted 1,303 2.71 159 3.12Shares vested/options exercised (357)* 4.01 (416) 2.80Forfeited/expired (113) 2.95 (591) 7.57
Balance at December 31, 2005 1,214 2.72 5,944 7.67Granted 2,685 6.90 994 8.80Shares vested/options exercised (675) 2.68 (983) 3.85Forfeited/expired (86) 5.46 (286) 11.16
Balance at December 31, 2006 3,138 $6.23 5,669 $ 8.36
*114 shares were repurchased by the Company to fund withholding tax obligations.

22 ANADIGICS 2006 Annual Report
Exercisable options and their related average exercise prices were
6,172 ($7.94), 5,759 ($7.83) and 4,644 ($8.30) as of December 31, 2004,
2005 and 2006, respectively. The total fair value of restricted shares
vested during the years ended December 31, 2005 and 2006 were
$808 and $4,003, respectively. The intrinsic value of exercised options
during the years ended December 31, 2004, 2005 and 2006 were
$2,098, $932 and $3,801, respectively.
In January 2007, the Company granted an additional 608 restricted
shares under the 2005 Plan at a market price equal to $9.53, which
represented the fair market value at the date of grants.
Weighted Average Information as of
December 31, 2006
Options currently exercisableShares issuable upon exercise 4,644Weighted average exercise price $ 8.30Weighted average remaining contractual term 4.8 yearsWeighted average remaining contractual term
for outstanding options 5.7 yearsIntrinsic value of exercisable options $12,490Intrinsic value of outstanding options $12,885Unrecognized stock-based compensation costOption plans $ 5,171Restricted stock $11,443Weighted average remaining vest period for
option plans 2.0 yearsWeighted average remaining vest period for
restricted stock 0.9 years
Stock options outstanding at December 31, 2006 are summarized
as follows:
Range of Exercise Prices
Outstanding Options at December 31, 2006
Weighted Average
Remaining Contractual
Life
Weighted Average Exercise
Price
Exercisable at December
31, 2006
Weighted Average Exercise
Price
$ 1.39–$ 4.17 1,548 4.52 $ 3.30 1,522 $ 3.32$ 4.33–$ 8.17 1,842 6.22 $ 6.88 1,820 $ 6.89$ 8.67–$13.59 1,626 7.30 $10.22 650 $12.28$13.94–$53.48 653 3.06 $19.87 652 $19.87
On July 3, 2003, the Company announced a voluntary stock option
exchange program for employees and officers. Directors of the
Company were not eligible for the exchange program. Pursuant to the
terms and conditions of the offer, which expired on August 4, 2003,
the Company accepted for cancellation options to purchase 1,674
shares of common stock having a weighted average exercise price of
$19.49. On February 6, 2004, participating employees were issued 552
stock options, under this one for three exchange program, for the can-
celled options. The new options have an exercise price equal to $7.27,
which represented the fair market value at the date of grant and are
now fully vested.
On December 22, 2004, the Company authorized the immediate
vesting of eligible employees’ unvested share options with an exer-
cise price greater than $5.00 per share. Directors were not eligible. In
total, 1,772 options with an average exercise price of $7.26 imme-
diately vested and had an average remaining contractual life of 9.1
years. The unamortized fair value associated with these accelerated-
vest shares in the amount of $2,654 amortized immediately. Had the
accelerated-vest program not occurred, the related cost in the years
ended December 31, 2006 and 2007 would have included $751 and
$57, respectively. In addition to its employee-retention value, the
Company’s decision to accelerate the vesting of these “out-of-the-
money” options was based upon the accounting of such costs moving
from disclosure-only in 2004 to being included in the Company’s con-
solidated statements of operations in 2005 based upon the Company’s
expected adoption of FAS 123R prior to its required adoption date
being deferred. For the year ended December 31, 2005, $1,846 would
have been included in the pro forma disclosure.
VALUATION FOR ESP PLAN AND STOCK OPTION AWARDS
The fair value of these equity awards was estimated at the date of
grant using a Black-Scholes option pricing model. The weighted aver-
age assumptions and fair values for stock-based compensation grants
used for the years ended December 31, 2004, 2005 and 2006 are sum-
marized below:Year Ended December 31,
2004 2005 2006
Stock option awardsRisk-free interest rate 2.2% 3.4% 4.6%Expected volatility 101% 95% 76%Average expected term (in years) 2.75 2.75 4.72Expected dividend yield 0.0% 0.0% 0.0%Weighted average fair value of
options granted $4.17 $1.70 $5.54ESP PlanRisk-free interest rate 2.8% 4.4% 5.0%Expected volatility 70% 80% 62%Average expected term 1 1 1Expected dividend yield 0% 0% 0%Weighted average fair value of
purchase option $2.66 $1.72 $2.13

232006 Annual Report ANADIGICS
In adopting FAS 123R on January 1, 2006, the Company evaluated
the assumptions used in the Black-Scholes model and modified its
methodology for computing the expected volatility and expected
term. Expected volatility was modified from being based solely on
Company historical volatility to a combination of both Company and
peer company historical volatility. The expected term of the stock
options was modified from being based solely on historical observa-
tions of employee exercise patterns to being also combined with
expectations of employee exercise behavior in the future giving con-
sideration to the contractual terms of the stock-based awards. The risk-
free interest rate assumption has consistently been based on the yield
at the time of grant of a U.S. Treasury security with an equivalent
remaining term. The Company has never paid cash dividends and does
not currently intend to pay cash dividends and has consistently
assumed a 0% dividend yield.
ANADIGICS, Inc. also sponsors an Employee Savings and Protec-
tion Plan under Section 401(k) of the Internal Revenue Code which is
available to all full-time employees. Employees can make voluntary
contributions up to limitations prescribed by the Internal Revenue
Code. This plan was amended in 2001 and the Company now matches
50% of employee contributions up to 6% of their gross pay. The
Company recorded expense of $730, $675 and $746 for the years
ended December 31, 2004, 2005 and 2006, respectively, relating to
plan contributions.
13. Earnings Per Share The reconciliation of shares used to calculate basic and diluted
earnings per share consists of the following:
Year Ended December 31,
2004 2005 2006
Weighted average common shares outstanding used to calculate basic earnings per share 32,413 34,012 43,814
Net effect of dilutive securities—based on treasury stock method using average market price —* —* —*
Weighted average common shares outstanding used to calculate diluted earnings per share 32,413 34,012 43,814
* Any dilution arising from the Company’s outstanding stock options or shares poten-tially issuable upon conversion of the convertible notes are not included as their effect is anti-dilutive.
14. Other Accumulated Comprehensive Income (Loss) The components of other accumulated comprehensive income
(loss) are as follows:Foreign
Currency Translation Adjustments
Unrealized Gain (Loss) on
Available-for-Sale Securities Total
Balance at December 31, 2004 $ 25 $(511) $ (486)Unrealized gain on available-for-
sale securities — 242 242Foreign currency translation
adjustment (72) — (72)
Balance at December 31, 2005 (47) (269) (316)Unrealized gain on available-for-
sale securities — 207 207Foreign currency translation
adjustment 9 — 9
Balance at December 31, 2006 $(38) $ (62) $ (100)
15. Legal Proceedings ANADIGICS is a party to litigation arising out of the operation of
our business. We believe that the ultimate resolution of such litigation
should not have a material adverse effect on our consolidated financial
condition or results of operation.

24 ANADIGICS 2006 Annual Report
16. Quarterly Financial Data (Unaudited)
2005 AND 2006 QUARTERLY FINANCIAL DATA
The following table sets forth certain unaudited results of operations for each quarter during 2005 and 2006. The unaudited information has
been prepared on the same basis as the audited consolidated financial statements and includes all adjustments which management considers
necessary for a fair presentation of the financial data shown. The operating results for any quarter are not necessarily indicative of the results to
be attained for any future period. Basic and diluted loss per share are computed independently for each of the periods presented. Accordingly, the
sum of the quarterly loss per share may not agree to the total for the year (in thousands, except for per share data).
Quarter Ended
2005 2006
April 2 July 2 Oct. 1 Dec. 31 April 1 July 1 Sept. 30 Dec. 31
Net sales $ 21,773 $ 23,943 $ 29,264 $ 33,301 $ 35,721 $ 40,215 $ 44,825 $ 49,124Cost of sales 19,252 19,511 22,691 24,475 26,284 28,940 31,035 32,916
Gross profit 2,521 4,432 6,573 8,826 9,437 11,275 13,790 16,208Research and development expenses 7,862 7,374 7,491 7,179 8,159 8,498 9,137 9,834Selling and administrative expense 5,552 5,506 5,234 5,001 5,493 5,869 6,328 6,872Restructuring and other charges (120) — — — — — — —
Operating loss (10,773) (8,448) (6,152) (3,354) (4,215) (3,092) (1,675) (498)Interest income 577 599 607 690 866 1,571 1,648 1,365Interest expense (1,249) (1,249) (1,250) (1,249) (1,288) (1,287) (1,285) (956)Other (expense) income (6) 9 15 — — 21 — (25)
Net loss $ (11,451) $ (9,089) $ (6,780) $ (3,913) $ (4,637) $ (2,787) $ (1,312) $ (114)
Basic and diluted loss per share $ (0.34) $ (0.27) $ (0.20) $ (0.11) $ (0.12) $ (0.06) $ (0.03) $ 0.00

252006 Annual Report ANADIGICS
To the Board of Directors and StockholdersANADIGICS, Inc.
We have audited the accompanying consolidated balance sheets of ANADIGICS, Inc. as of December 31, 2006 and 2005, and the related consolidated statements of operations, comprehensive loss, stockhold-ers’ equity and cash flows for the years then ended. Our audits also included the consolidated financial statement schedule for the year ended December 31, 2006 and 2005. These consolidated financial statements and schedule are the responsibility of the Company’s man-agement. Our responsibility is to express an opinion on these consoli-dated financial statements and schedule based on our audits. We conducted our audits in accordance with the standards of the Public Company Accounting Oversight Board (United States). Those standards require that we plan and perform the audits to obtain rea-sonable assurance about whether the financial statements are free of material misstatement. Our audits included examining, on a test basis, evidence supporting the amounts and disclosures in the financial statements, assessing the accounting principles used and significant estimates made by management, and evaluating the overall financial statement presentation. We believe that our audits provide a reason-able basis for our opinion. In our opinion, the financial statements referred to above present fairly, in all material respects, the consolidated financial position of ANADIGICS, Inc. as of December 31, 2006 and 2005, and their
consolidated results of operations and cash flows for the years then ended, in conformity with accounting principles generally accepted in the United States of America. Also, in our opinion, the related consoli-dated financial statement schedule for the years ended December 31, 2006 and 2005, when considered in relation to the basic consolidated financial statements taken as a whole, presents fairly, in all material respects, the information set forth therein. As discussed in note 12 to the consolidated financial statements, ANADIGICS, Inc. adopted Statement of Financial Accounting Standards No. 123(R), “Share-Based Payment” effective January 1, 2006. We also have audited, in accordance with the standards of the Public Company Accounting Oversight Board (United States), the effectiveness of ANADIGICS, Inc.’s internal control over financial reporting as of December 31, 2006, based on criteria established in “Internal Control—Integrated Framework” issued by the Committee of Sponsoring Organizations of the Treadway Commission and our report dated February 26, 2007 expressed an unqualified opinion thereon.
/s/ J.H. Cohn LLP
Roseland, New JerseyFebruary 27, 2007
REPORT OF INDEPENDENT REGISTERED PUBLIC ACCOUNTING FIRM—2006
The Board of Directors and StockholdersANADIGICS, Inc.
We have audited the accompanying consolidated statements of operations, comprehensive loss, stockholders’ equity, and cash flows of ANADIGICS, Inc. for the year ended December 31, 2004. Our audit also included the information for the year ended December 31, 2004 included in the financial statement schedule. These financial state-ments and schedule are the responsibility of the Company’s manage-ment. Our responsibility is to express an opinion on these financial statements and schedule based on our audit. We conducted our audit in accordance with the standards of the Public Company Accounting Oversight Board (United States). Those standards require that we plan and perform the audit to obtain reason-able assurance about whether the financial statements are free of material misstatement. An audit includes examining, on a test basis, evidence supporting the amounts and disclosures in the financial statements. An audit also includes assessing the accounting principles
used and significant estimates made by management, as well as evalu-ating the overall financial statement presentation. We believe that our audit provides a reasonable basis for our opinion. In our opinion, the financial statements referred to above present fairly, in all material respects, the consolidated results of ANADIGICS, Inc.’s operations and cash flows for the year ended December 31, 2004 in conformity with U.S. generally accepted accounting principles. Also, in our opinion, the information for the year ended December 31, 2004 in the related financial statement schedule, when considered in relation to the basic financial statements taken as a whole, presents fairly in all material respects the information set forth therein.
/s/ ERNST & YOUNG LLP
MetroPark, New JerseyMarch 2, 2005
REPORT OF INDEPENDENT REGISTERED PUBLIC ACCOUNTING FIRM—2005

26 ANADIGICS 2006 Annual Report
Conclusion Regarding the Effectiveness of Disclosure Controls and Procedures Under the supervision and with the participation of our man-
agement, including our Chief Executive Officer, or CEO and Chief
Financial Officer, or CFO, we conducted an evaluation of the effective-
ness of our disclosure controls and procedures as of December 31,
2006. Based on that evaluation, our management, including our CEO
and CFO, concluded that our disclosure controls and procedures were
effective to ensure that information required to be disclosed by us in
reports that we file or submit under the Exchange Act is recorded,
processed, summarized and reported as specified within the SEC’s
rules and forms.
Management’s Report on Internal Control Over Financial Reporting Our management is responsible for establishing and maintaining
adequate internal control over financial reporting, as such term is
defined in Exchange Act Rule 13a-15(f). Under the supervision and
with the participation of our management, including our CEO and
CFO, we conducted an evaluation of the effectiveness of our internal
control over financial reporting based on the framework of Internal
Control—Integrated Framework issued by the Committee of Spon-
soring Organizations of the Treadway Commission (COSO). Based on
that evaluation, our management concluded that our internal control
over financial reporting was effective as of December 31, 2006.
Our management’s evaluation of the effectiveness of our internal
control over financial reporting as of December 31, 2006 has been
audited by J.H. Cohn LLP, an independent registered public account-
ing firm, as stated in their report which is included below.
There was no change in the Company’s internal control over
financial reporting during the Company’s last fiscal quarter that has
materially affected, or is reasonably likely to materially affect, the
Company’s internal control over financial reporting.
Inherent Limitations of Controls Because of their inherent limitations, disclosure controls and
procedures and internal control over financial reporting may not
prevent or detect misstatements. Also, projections of any evaluation
of effectiveness to future periods are subject to the risk that controls
may become inadequate because of changes in conditions, or that the
degree of compliance with the policies or procedures may deteriorate.
/s/ Bami Bastani
Bami Bastani
President and Chief Executive Officer
/s/ Thomas C. Shields
Thomas C. Shields
Executive Vice President and
Chief Financial Officer
February 27, 2007
CONTROLS AND PROCEDURES

272006 Annual Report ANADIGICS
To the Board of Directors and Stockholders
ANADIGICS, Inc.
We have audited management’s assessment, Management’s Report
on Internal Control over Financial Reporting, that ANADIGICS, Inc.
maintained effective internal control over financial reporting as of
December 31, 2006 based on criteria established in “Internal Control
—Integrated Framework” issued by the Committee of Sponsoring
Organizations of the Treadway Commission. ANADIGICS, Inc.’s man-
agement is responsible for maintaining effective internal control over
financial reporting and for its assessment of the effectiveness of inter-
nal control over financial reporting. Our responsibility is to express
an opinion on management’s assessment and an opinion on the effec-
tiveness of the Company’s internal control over financial reporting
based on our audit.
We conducted our audit in accordance with the standards of the
Public Company Accounting Oversight Board (United States). Those
standards require that we plan and perform the audit to obtain rea-
sonable assurance about whether effective internal control over finan-
cial reporting was maintained in all material respects. Our audit
included obtaining an understanding of internal control over financial
reporting, evaluating management’s assessment, testing and evaluating
the design and operating effectiveness of internal control, and per-
forming such other procedures as we considered necessary in the
circumstances. We believe that our audit provides a reasonable basis
for our opinion.
A company’s internal control over financial reporting is a proc-
ess designed to provide reasonable assurance regarding the reliability
of financial reporting and the preparation of financial statements for
external purposes in accordance with accounting principles generally
accepted in the United States of America. A company’s internal control
over financial reporting includes those policies and procedures that
(1) pertain to the maintenance of records that, in reasonable detail,
accurately and fairly reflect the transactions and dispositions of the
assets of the company; (2) provide reasonable assurance that trans-
actions are recorded as necessary to permit preparation of financial
statements in accordance with accounting principles generally
accepted in the United States of America, and receipts and expendi-
tures of the company are being made only in accordance with authori-
zations of management and directors of the company; and (3) provide
reasonable assurance regarding prevention or timely detection of
unauthorized acquisition, use or disposition of the company’s assets
that could have a material effect on the financial statements.
Because of inherent limitations, internal control over financial
reporting may not prevent or detect misstatements. Also, projections
of any evaluation of effectiveness to future periods are subject to
the risk that controls may become inadequate because of changes
in conditions, or that the degree of compliance with the policies or
procedures may deteriorate.
In our opinion, management’s assessment that ANADIGICS, Inc.
maintained effective internal control over financial reporting as of
December 31, 2006, is fairly stated, in all material respects, based on
the criteria established in “Internal Control—Integrated Framework”
issued by the Committee of the Sponsoring Organizations of the
Treadway Commission. Also, in our opinion, ANADIGICS, Inc. main-
tained, in all material respects, effective internal control over financial
reporting as of December 31, 2006, based on such criteria.
We also have audited, in accordance with the standards of the
Public Company Accounting Oversight Board (United States), the
consolidated balance sheet of ANADIGICS, Inc. as of December 31,
2006, and the related consolidated statements of operations, compre-
hensive loss, stockholders’ equity and cash flows for the year then
ended, and our report dated February 27, 2007 expressed an unquali-
fied opinion thereon.
/s/ J.H. Cohn LLP
Roseland, New Jersey
February 27, 2007
REPORT OF INDEPENDENT REGISTERED PUBLIC ACCOUNTING FIRM

28 ANADIGICS 2006 Annual Report
MARKET FOR REGISTRANT’S COMMON EQUITY, RELATED STOCKHOLDER MATTERS AND ISSUER PURCHASES OF EQUITY SECURITIES
Our $0.01 par value Common Stock, (“Common Stock”) has been
quoted on the NASDAQ Global Market under the symbol “ANAD” since
the commencement of trading on April 21, 1995 following our ini-
tial public offering of our Common Stock. The following table sets
forth for the periods indicated the high and low sale prices for our
Common Stock.High Low
Calendar 2006Fourth Quarter $ 10.38 $ 6.80Third Quarter 8.60 5.03Second Quarter 9.26 6.08First Quarter 8.24 5.35
Calendar 2005Fourth Quarter $ 6.30 $ 3.05Third Quarter 3.55 1.70Second Quarter 1.95 1.26First Quarter 3.80 1.43
As of December 31, 2006, there were 49,108,435 shares of Com-
mon Stock outstanding (excluding Treasury) and 727 holders of record
of the Common Stock.
We have never paid cash dividends on our capital stock. We
currently anticipate that we will retain available funds for use in the
operation and expansion of our business, and do not anticipate paying
any cash dividends in the foreseeable future.

Executive Officers
Dr. Bami BastaniPresident, Chief Executive Officer and Director
Ronald RosenzweigChairman of the Board and Director
Dr. Charles HuangExecutive Vice President and Chief Technical Officer
Thomas ShieldsExecutive Vice President and Chief Financial Officer
Dr. Ali KhatibzadehSr. Vice President & General Manager Wireless Business Segment
Ronald MichelsSr. Vice President & General Manager Broadband Business Segment
Directors
Paul BachowPresident of Bachow & Associates, Inc.
Garry McGuireEx-CFO of AVAYA
Harry ReinGeneral Partner Foundation Medical Partners
Lewis SolomonChairman of G & L Investments
Dennis StriglPresident and Chief Operating Officer of Verizon
Corporate Information
Stock Listing: Nasdaq National Market®
Symbol: ANAD
Corporate Office
ANADIGICS, Inc.Attn: Investor Relations141 Mt. Bethel RoadWarren, NJ 07059908-668-5000908-668-5068 (fax)
Web Address
www.anadigics.com
Transfer Agent and Registrar
Mellon Investors ServicesP.O. Box 3315South Hackensack, NJ 076061-800-851-9677http://www.mellon-investors.com
Auditors
J.H. Cohn LLP4 Becker Farm RoadRoseland, NJ 07068
Annual Meeting
ANADIGICS Annual Meeting will be held on May 17, 2007 at 10:00 a.m. at the Somerset Hills Hotel, 200 Liberty Corner Road, Warren, NJ 07059.
Company Information
de
sig
ned
by
curr
an &
co
nno
rs, i
nc. /
ww
w.c
urra
n-c
onn
ors
.co
m
ANADIGICS 2006 Annual Report
BOARD OF DIRECTORS (FROM TOP TO BOTTOM, LEFT TO RIGHT)
Paul Bachow, Dr. Bami Bastani, Garry McGuire, Harry Rein, Ronald Rosenzweig, Lewis Solomon, Dennis Strigl
