broadband dielectric spectroscopy in nano-(bio)-physics
TRANSCRIPT
Proc. ESA Annual Meeting on Electrostatics 2010, Paper F1
Broadband Dielectric Spectroscopy in Nano-(Bio)-Physics
Friedrich Kremer, Anatoli Serghei, Joshua Rume Sangoro, Martin Treß and Emmanuel Urandu Mapesa
Institute of Experimental Physics I University of Leipzig phone: (49) 97-32550
e-mail: [email protected]
Abstract—Broadband Dielectric Spectroscopy as one of the major tools in molecular physics, benefits from the extraordinary advantage that its sensitivity increases with decreasing thickness of a sample capacitor and hence with a decreasing amount of sample material. This enables one, for instance, to carry out broadband spectroscopic measurements on quasi-isolated polymer coils in nano-structured capacitor arrangements having thicknesses as small as 10 nm. It is demonstrated that for polymers like atactic polystyrene (PS) or poly-2-vinyl-pyridine (P2VP), the dynamic glass transition can be measured for (averaged) sample thickness as small as ~ 2 nm in a wide spectral range (10 mHz to 10 MHz) and temperature interval (150 K to 350 K). No shift of the mean relaxation rate and no broadening of the relaxation time distribution function are found compared to the bulk liquid. Electrode polarization is a ubiquitous phenomenon that takes place at the interface between a metal and an ionic conductor. A quantitative theory is presented, which enables one to deduce from its characteristic frequency, temperature and concentration dependencies – by use of a novel formula – the bulk conductivity of the ion conducting liquid under study. It is shown that the electrical relaxation processes take place within a nanometric layer at the (ionic conductor/metal) interface.
I. INTRODUCTION
Broadband Dielectric Spectroscopy (BDS) is besides Nuclear Magnetic Resonance (NMR) spectroscopy the experimental tool to study molecular dynamics in a broad frequency (10-6 Hz to 10 +11 Hz) and temperature range [1-6]. It has the additional advantage that the sensitivity of the measurements increases with decreasing separation of the electrodes and hence with decreasing amount of sample material. Using nano-structured electrode arrangements, the ultimate goal of measuring the dynamics of single molecules or isolated molecular assemblies becomes feasible [7]. This offers exciting perspectives for sensor applications and for bio-physics.

Proc. ESA Annual Meeting on Electrostatics 2010 2
II. NANO-STRUCTURED ELECTRODES
A. Experiments with nano-structured electrode arrangements
To perform a dielectric measurement, a sample is usually placed between two metallic electrodes. For m thick layers of low molecular weight or polymeric samples, conventionally either appropriate spacers or evaporated electrodes are used (Fig.1a). This may not be possible for samples having thicknesses of 5 nm or below because of the increasing probability to obtain electrical shorts. Using nano-structured electrode arrangements (Fig.1b) this difficulty can be circumvented and the uncertain impact of the evaporation of a metal on soft material like thin polymer layers can be avoided [8,9].
As electrodes, ultra-flat and highly doped silicon wafers separated by a regular matrix of insulating nano-structures (root-mean-square roughness of 0.3 nm on a micrometer lateral scale, resistivity of 0.003 cm) are employed [7]. The latter are produced by thermal oxidation and standard optical lithography on the surface of one of the electrodes (microFAB Bremen GmbH). Its height can be adjusted between 100 nm to 1500 nm. On the counter-electrode, a thin polymer layer is deposited by spin coating. Depending on the polymer concentration in the solvent and on the spin-coating parameters, layer thicknesses ranging from a few to several hundred nanometres are easily realized.
Fig. 1. (a) Scheme of the conventional sample geometry where thin metal layers are evaporated as electrodes. (b) Sketch of the novel arrangement of nano-structured electrodes based on highly doped silicon. As insulating spacers, nanopillars made of SiO2 having a height ranging between 100 nm to 1500 nm, are attached to the upper electrode.
Focusing on the field of dynamics in thin polymer layers, there is an on-going
controversy, raised by the early Ellipsometry measurements of Keddie and Jones [10] about shifts of the glass transition temperature with decreasing thickness. Investigation by means of BDS provides - in addition to its advantage of increased signal intensity with decreasing sample size - the benefit of measuring a microscopic quantity, namely molecular fluctuations, rather than macroscopic quantities measured by Ellipsometry or Calorimetry. Furthermore, this method allows tracing the dynamic glass transition (-relaxation) in a wide frequency and temperature range.
Fig. 2 presents measurements of the -relaxation of thin layers of polystyrene (PS) prepared in both conventional and novel sample arrangements. Both approaches show that the α-relaxation peak is not shifted with decreasing layer thickness. Furthermore, the samples prepared with conventionally evaporated aluminum electrodes show a gradual increase of the maximum of the net dielectric loss ε΄΄net in the thinnest layers (Fig. 2a) and an extended broadening with decreasing layer thickness (Fig. 2b). In contrast, when nano-structured silicon electrodes are applied, the maximum of the net dielectric loss ε΄΄net decreases with decreasing layer thickness. This is expected when the amount of

Proc. ESA Annual Meeting on Electrostatics 2010 3
sample material in the capacitor is reduced (Fig. 2c). Rescaling with respect to the maxima of the curves shows no broadening even for the thinnest layers as thick as 4.8 nm (Fig. 2d).
Fig. 2. Temperature dependence of the net dielectric loss ε΄΄net of polystyrene layers measured at a frequency of 1 kHz and prepared with conventionally evaporated electrodes (a) and measured at a frequency of 0.8 kHz in a novel approach using nano-structured silicon wafers (b). The graphs (c) and (d) show the corresponding plots rescaled with respect to the maximum loss value. The layer thickness varies as indicated
The measured net imaginary part ε΄΄net. is different for the two sample geometries
used. This can be immediately comprehended within a layer model that treats the contributing layers as a serial arrangement of capacitances [9]. The model is based on the summation of N serial capacitances Cn as follows
1
1 1N
ntotal nC C
(1)
and the geometrical definition of the capacitance C
*0
AC
d (2)
where ε* = ε’ - iε’’ is the complex dielectric function, ε0 represents the permittivity of the vacuum, and A and d are the area and thickness of the capacitor, respectively. For an identical area of all contributing capacitors, the net dielectric function ε*net of the whole arrangement is
* *1
Nn
nnet n
dD
(3)
with the total sample thickness D, the complex dielectric function of the nth layer ε*n and the corresponding thickness dn. This allows a direct calculation of the expected dielectric signature of a layered sample if the single components are known. However, due to the

Proc. ESA Annual Meeting on Electrostatics 2010 4
fact that complex quantities are reciprocally added up, unexpected effects like shifts or broadening of relaxation peaks in the net dielectric loss can appear and hence a detailed analysis is necessary. In a first approach, we only consider the gap that is created due to the use of spacers in the nanostuctured electrode arrangement and the net dielectric function becomes
* * *
gapPS
net PS gap
ddD
(4)
Since this gap is typically filled with a gas, for example nitrogen in our BDS measurements, the complex dielectric function of this component is ε*gap = 1. Given a filling ratio below 10% and very low losses, like in the case of polystyrene, the thickness of the total arrangement D can be roughly determined using the capacitance as well as the lateral dimensions of the sample and setting ε΄ to one. The thickness of the polymer layer dPS is determined by AFM after the BDS measurement; hence, the thickness of the gap yields
gap PSd D d (5)
Theoretically, it is possible to eliminate the effects due to the air gap. However, due to the fact that the amount of polymer inside the sample capacitor is much smaller compared to the empty space, the removal of the contribution from the latter is marred by large uncertainty. It is more convenient to describe the layers involved by existing model functions. The complex dielectric function of polymers such as polystyrene can be described by the Havriliak-Negami function [11]
*
1HN
HNi
(6)
with the dielectric strength Δε, permittivity of the unrelaxed material ε∞, the parameters for symmetric and asymmetric broadening β and γ, the relaxation time τHN and the angular frequency of the external electrical field ω=2πf. The temperature dependence of the relaxation time can be modeled by a Vogel-Fulcher-Tammann equation. Fig. 3 shows schemes of the layer arrangements that were adopted to model both the conventional (a) and the novel (b) sample geometry. In the conventional approach with evaporated electrodes, a bulk-like polymer layer and oxide layers of the metal electrodes are considered. The oxide layers (alumina in this case) are assumed to have identical dielectric properties. Thus, they can be mathematically treated as a single layer of double thickness in the total sample arrangement
2 3
2 3
* * *
Al OPS
net PS Al O
ddD
(7)
Similarly, the arrangement prepared by nano-structured silica electrodes including an additional gap of empty space can be described as follows
2
2
* * * *
SiO gapPS
net PS SiO gap
d ddD
(8)

Proc. ESA Annual Meeting on Electrostatics 2010 5
Fig. 3. Schemes of the adopted layer models for the conventional (a) and the novel (b) approach of sample preparation
If the properties, in particular the thicknesses and the complex dielectric functions, of
all contributing layers including the polymer are known, the net dielectric function of the whole sample arrangement can be calculated and compared with the experimental data. While the thicknesses of the oxide layers are well known (1-2 nm for silica [12] and 2-3 nm for aluminum [13]) the corresponding dielectric functions of such thin layers are unknown. Additionally, in the case of aluminum even bulk samples show a large variation especially in their dielectric loss spectra, depending on the particular type and amount of impurities [14]. For this analysis, values ε΄alumina = 9.6, ε΄΄alumina = 0.03 best describe our experimental results in the studied temperature range. The dielectric function of the silica layer is taken from the measurement of a 200-nm thick sample of evaporated silica (ε΄silica = 9.6, ε΄΄silica = 0.001). Thus, considering the oxide layers of the electrodes allows a further, more detailed simulation of the net dielectric function of the investigated sample arrangements. As seen in Fig. 4, the same features as observed in the experiment (Fig. 2) are recovered, at least qualitatively. This indicates that the presence of oxide layers has an impact on the measured curves and needs to be considered in the analysis.
Fig. 4. Calculation of the expected net dielectric functions for polystyrene layers of different thicknesses in the two applied geometries with conventionally evaporated aluminum electrodes (a) and nano-structured silicon

Proc. ESA Annual Meeting on Electrostatics 2010 6
electrodes (c). The calculations are based on a layer model as described in the text. The graphs (b) and (d) present the corresponding normalized curves and labels indicating the thicknesses of the respective polystyrene layers
To show that there is indeed no shift of the glassy dynamics with decreasing layer thickness (which is the gist of our results), identical material was prepared in a similar way on silicon wafers for measurements by means of spectroscopic vis- Ellipsometry. Fig. 5 (a) shows the temperature dependence of the measured layer thickness normalized with respect to the initial thickness. In all studied samples ranging from 17 nm to 224 nm, a kink occurs which indicates the calorimetric glass transition. Its position is the ellipsometrically-determined glass transition temperature Tg. In this study the second derivatives of interpolated curves of d(T), as seen in Fig. 5 (b) were used to determine Tg because a higher accuracy is thereby attained [15]. Within the experimental error of ±2 K no shift of Tg is detected down to thicknesses of 17 nm. This finding coincides with the results of the dielectric measurements presented above.
Fig. 5. Ellipsometrically determined temperature dependence of the layer thickness of PS layers (initial thickness as indicated) normalized with respect to the layer thickness at 300 K (a). The second derivative of these curves served for the determination of the exact position of the discontinuity (b)
As already mentioned, many earlier experiments report drastic thickness-dependent
shifts of Tg in thin polystyrene layers [10,16-18] in contradiction to the results presented in the current article. In contrast, there are now studies that do not find indications for such dramatic changes in the glassy dynamics [19-21].
To put this controversy into proper perspective, a close look at the preparative conditions is helpful. It is well known that remaining solvent—even if in very small amounts—acts as a plasticizer and thus changes the molecular dynamics dramatically. This can be monitored in thin polymer layers by means of BDS. Typically during the annealing (keeping the sample for a sufficient long time at elevated temperatures in an inert atmosphere or vacuum) the measured curves of ε΄net and ε΄΄net show a pronounced decrease indicating the extraction of solvent. Subsequently, it is imperative that proper annealing is performed to obtain reliable and robust results. The particular conditions of a proper annealing need to be checked carefully; typically, annealing at 50 K above Tg for at least 12 h for thin layers is sufficient. Furthermore, mechanical strains in polymer layers, created by the spin coating preparation procedure and referred to as meta-stable “non-equilibrium” states (a glassy system, of course, has no equilibrium state, so the terms stressed or unrelaxed are more accurate) can be relaxed during such an annealing procedure.
The idea of keeping the sample in an inert atmosphere or vacuum during the annealing
Proc. ESA Annual Meeting on Electrostatics 2010 7
has a major impact on the chemical stability of the sample. It is clear that exposing a polymer sample, especially a thin layer, to high temperatures in the presence of oxygen leads to chemical degradation. Further, the presence of water vapour can lead to pronounced mechanical deformations and thus change the intended geometry. Moreover, dewetting can also happen when the sample is stored in an inert atmosphere, especially in low molecular weight polymers. This needs to be excluded by a detailed check of the surface topography.
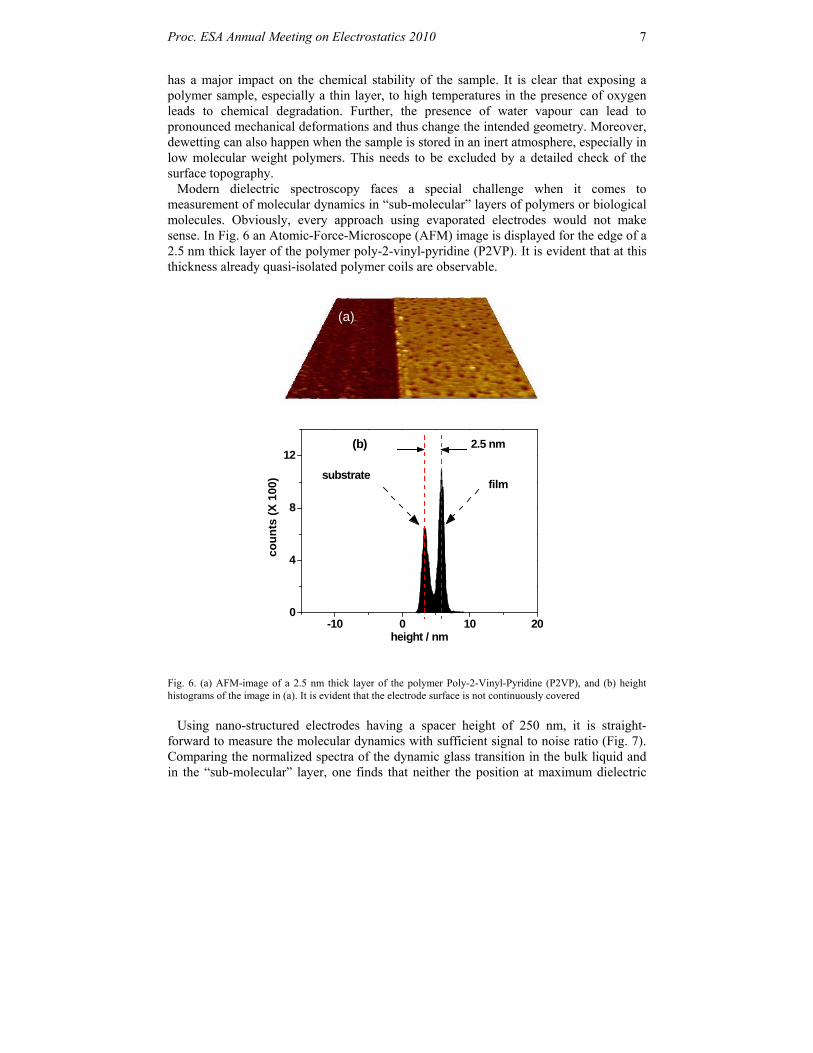
Modern dielectric spectroscopy faces a special challenge when it comes to measurement of molecular dynamics in “sub-molecular” layers of polymers or biological molecules. Obviously, every approach using evaporated electrodes would not make sense. In Fig. 6 an Atomic-Force-Microscope (AFM) image is displayed for the edge of a 2.5 nm thick layer of the polymer poly-2-vinyl-pyridine (P2VP). It is evident that at this thickness already quasi-isolated polymer coils are observable.
-10 0 10 200
4
8
122.5 nm
filmsubstrate
co
un
ts (
X 1
00)
height / nm
(b)
Fig. 6. (a) AFM-image of a 2.5 nm thick layer of the polymer Poly-2-Vinyl-Pyridine (P2VP), and (b) height histograms of the image in (a). It is evident that the electrode surface is not continuously covered
Using nano-structured electrodes having a spacer height of 250 nm, it is straight-
forward to measure the molecular dynamics with sufficient signal to noise ratio (Fig. 7). Comparing the normalized spectra of the dynamic glass transition in the bulk liquid and in the “sub-molecular” layer, one finds that neither the position at maximum dielectric
(a)

Proc. ESA Annual Meeting on Electrostatics 2010 8
loss nor the width of the relaxation peak is changed. Thus the fluctuations of the dynamic glass transition must take place at a length-scale that is considerably smaller than the averaged layer thickness of 2.5 nm.
360 380 400 420
0.0
0.4
0.8
0.4
0.8
n
orm
.
2.5 nm
P2VP
T / K
610 Hz 300 Hz 120 Hz 48 Hz 2.4 Hz
n
orm
.
bulk(a)

Proc. ESA Annual Meeting on Electrostatics 2010 9
360 380 400 420
0.0
0.4
0.8
bulk 2.5 nm
" nor
m.
T / K
P2VP, 120 Hz
(b)
Fig. 7. (a) Normalized dielectric loss ´´ versus temperature at different frequencies as indicated for bulk and a 2.5 nm thick layer of Poly-2-Vinyl-Pyridine (P2VP). (b) A comparison showing that the frequency position of the dynamic glass transition (-relaxation) is not shifted in the 2.5 nm layer
B. Perspectives for dielectric experiments with nano-structured electrodes
Using nano-structured electrode arrangements in BDS enables one to address a multiple of novel physical topics. As already shown above, it is possible to measure the molecular dynamics of submolecular layers of polymers. With refinement of this approach, it will be possible to study the dynamics of isolated grafted polymers in a wide frequency and temperature range. Furthermore it is - using modern preparative techniques - possible to anchor biological macromolecules on surfaces of doped silicon. Thus one can also expect measurements of the molecular dynamics in proteins and DNA. For sensor applications, it could be of interest to determine the dielectric properties of immobilized enzymes interacting with an appropriate partner molecule. For applications of polymer batteries, charge transport in polyelectrolytes close to solid-state surfaces is of central importance; this can be studied using nano-structured electrodes as well.

Proc. ESA Annual Meeting on Electrostatics 2010 10
III. ELECTRODE POLARIZATION
Electrode polarization (EP) is a ubiquitous phenomenon that takes place at the interface between a metal and an ionic conductor. Till now, a detailed quantitative description is missing. The general spectral features are presented in Fig. 8 for the dimethylimidazolium dimethylphosphate (2-MMIM-2MEPO4) ionic liquid [6].
0
4
0
4
0 4 8
-8
-4
0 4 8
-8
-4
268 K 248 K 228 K
log '
log "
log
' (S
/cm
)
log f (Hz)
log " (S
/cm
)
Fig. 8. Complex dielectric function * and complex conductivity * versus frequency at temperatures as indicated. The spectral range where the spectra are dominated by electrode polarisation depends strongly on temperature. It is indicated as hatched area
Proc. ESA Annual Meeting on Electrostatics 2010 11
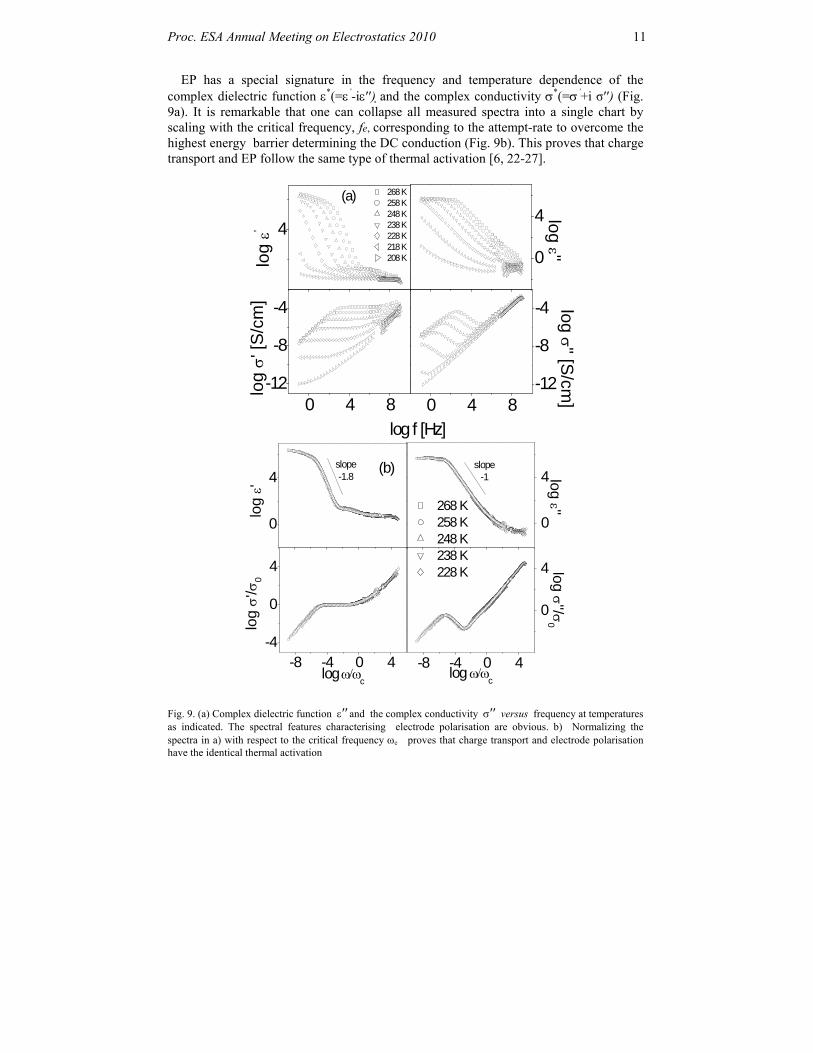
EP has a special signature in the frequency and temperature dependence of the complex dielectric function *(=’-i′′) and the complex conductivity *(=’+i σ′′) (Fig. 9a). It is remarkable that one can collapse all measured spectra into a single chart by scaling with the critical frequency, fe, corresponding to the attempt-rate to overcome the highest energy barrier determining the DC conduction (Fig. 9b). This proves that charge transport and EP follow the same type of thermal activation [6, 22-27].
4
0
4
0 4 8-12
-8
-4
0 4 8-12
-8
-4
268 K 258 K 248 K 238 K 228 K 218 K 208 Klo
g
'
(a)
log
''
log
' [
S/c
m]
log
'' [S/cm
]
log f [Hz]
0
4
0
4
-8 -4 0 4-4
0
4
-8 -4 0 4
0
4
slope-1
slope-1.8
268 K 258 K 248 K 238 K 228 K
log
'
(b)
log ''
log c
logc
log '
/0
log ''/0
Fig. 9. (a) Complex dielectric function ′′ and the complex conductivity ′′ versus frequency at temperatures as indicated. The spectral features characterising electrode polarisation are obvious. b) Normalizing the spectra in a) with respect to the critical frequency e proves that charge transport and electrode polarisation have the identical thermal activation
Proc. ESA Annual Meeting on Electrostatics 2010 12
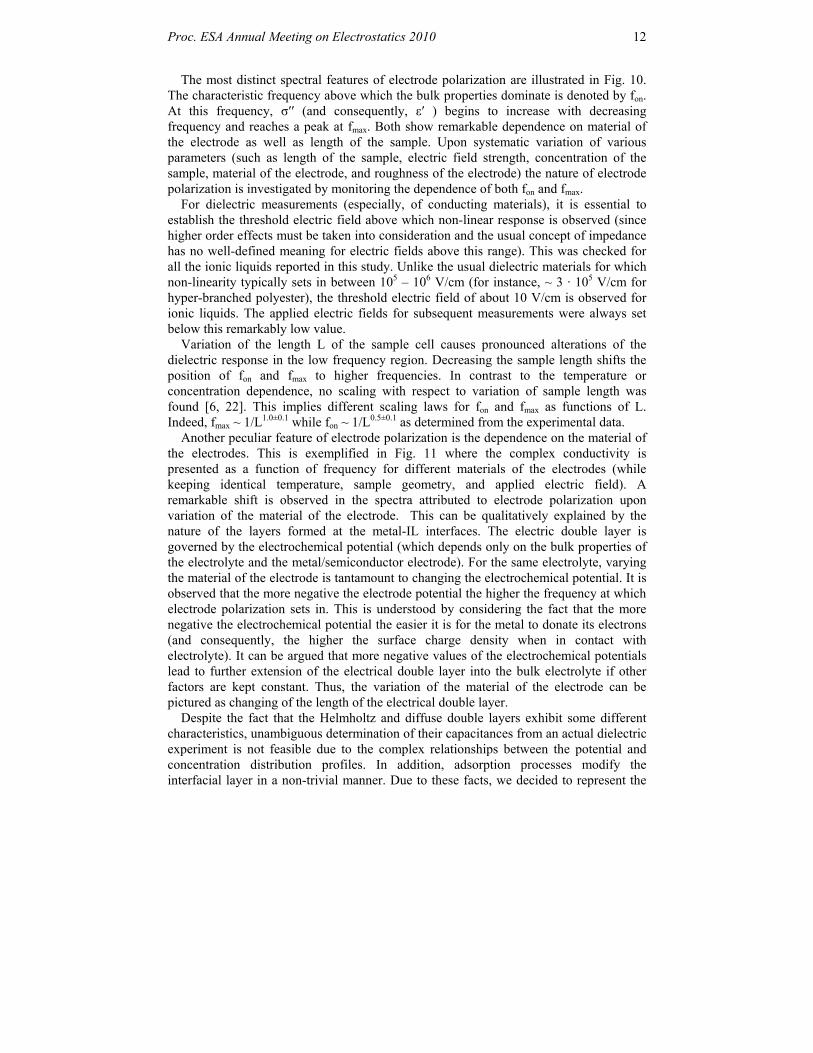
The most distinct spectral features of electrode polarization are illustrated in Fig. 10. The characteristic frequency above which the bulk properties dominate is denoted by fon. At this frequency, σ′′ (and consequently, ε′ ) begins to increase with decreasing frequency and reaches a peak at fmax. Both show remarkable dependence on material of the electrode as well as length of the sample. Upon systematic variation of various parameters (such as length of the sample, electric field strength, concentration of the sample, material of the electrode, and roughness of the electrode) the nature of electrode polarization is investigated by monitoring the dependence of both fon and fmax.
For dielectric measurements (especially, of conducting materials), it is essential to establish the threshold electric field above which non-linear response is observed (since higher order effects must be taken into consideration and the usual concept of impedance has no well-defined meaning for electric fields above this range). This was checked for all the ionic liquids reported in this study. Unlike the usual dielectric materials for which non-linearity typically sets in between 105 – 106 V/cm (for instance, ~ 3 · 105 V/cm for hyper-branched polyester), the threshold electric field of about 10 V/cm is observed for ionic liquids. The applied electric fields for subsequent measurements were always set below this remarkably low value.
Variation of the length L of the sample cell causes pronounced alterations of the dielectric response in the low frequency region. Decreasing the sample length shifts the position of fon and fmax to higher frequencies. In contrast to the temperature or concentration dependence, no scaling with respect to variation of sample length was found [6, 22]. This implies different scaling laws for fon and fmax as functions of L. Indeed, fmax ~ 1/L1.0±0.1 while fon ~ 1/L0.5±0.1 as determined from the experimental data.
Another peculiar feature of electrode polarization is the dependence on the material of the electrodes. This is exemplified in Fig. 11 where the complex conductivity is presented as a function of frequency for different materials of the electrodes (while keeping identical temperature, sample geometry, and applied electric field). A remarkable shift is observed in the spectra attributed to electrode polarization upon variation of the material of the electrode. This can be qualitatively explained by the nature of the layers formed at the metal-IL interfaces. The electric double layer is governed by the electrochemical potential (which depends only on the bulk properties of the electrolyte and the metal/semiconductor electrode). For the same electrolyte, varying the material of the electrode is tantamount to changing the electrochemical potential. It is observed that the more negative the electrode potential the higher the frequency at which electrode polarization sets in. This is understood by considering the fact that the more negative the electrochemical potential the easier it is for the metal to donate its electrons (and consequently, the higher the surface charge density when in contact with electrolyte). It can be argued that more negative values of the electrochemical potentials lead to further extension of the electrical double layer into the bulk electrolyte if other factors are kept constant. Thus, the variation of the material of the electrode can be pictured as changing of the length of the electrical double layer.
Despite the fact that the Helmholtz and diffuse double layers exhibit some different characteristics, unambiguous determination of their capacitances from an actual dielectric experiment is not feasible due to the complex relationships between the potential and concentration distribution profiles. In addition, adsorption processes modify the interfacial layer in a non-trivial manner. Due to these facts, we decided to represent the
Proc. ESA Annual Meeting on Electrostatics 2010 13
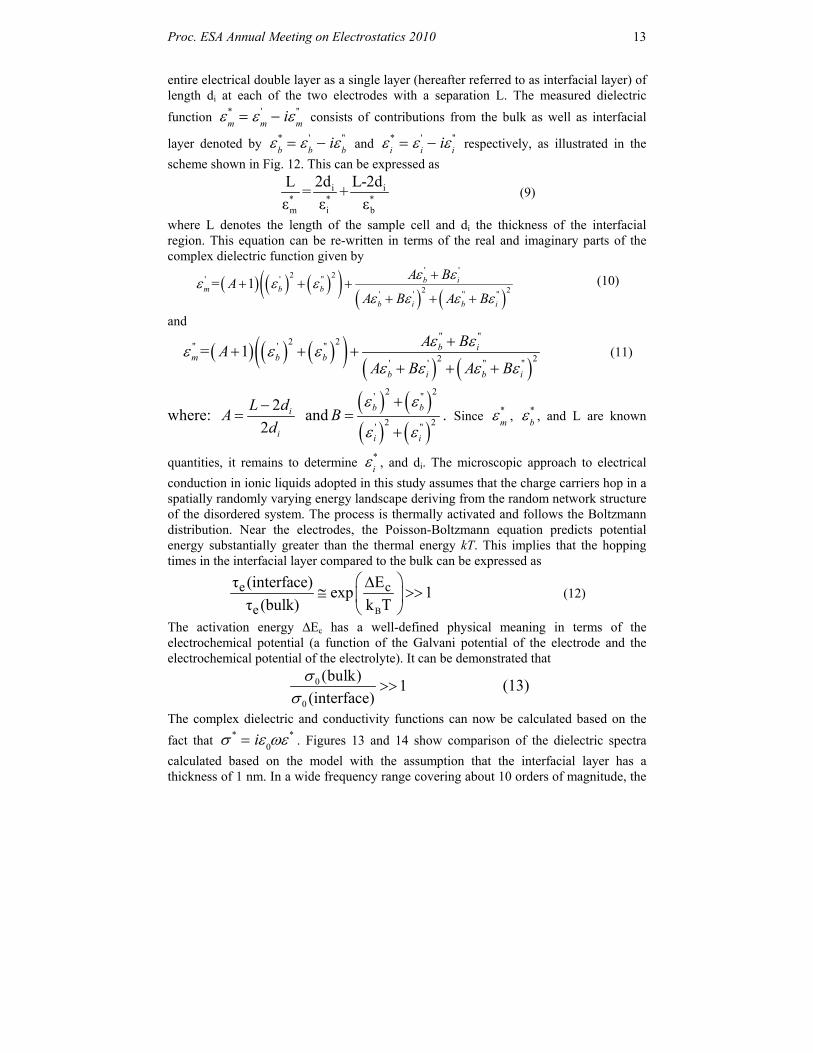
entire electrical double layer as a single layer (hereafter referred to as interfacial layer) of length di at each of the two electrodes with a separation L. The measured dielectric
function m*
m' i
m'' consists of contributions from the bulk as well as interfacial
layer denoted by b*
b' i
b'' and
i*
i' i
i'' respectively, as illustrated in the
scheme shown in Fig. 12. This can be expressed as
i i* * *m i b
2d L-2dL= +
ε ε ε (9)
where L denotes the length of the sample cell and di the thickness of the interfacial region. This equation can be re-written in terms of the real and imaginary parts of the complex dielectric function given by
' '
2 2' ' "2 2' ' " "
= 1 b im b b
b i b i
A BA
A B A B
(10)
and
" "
2 2" ' "2 2' ' " "
= 1 b im b b
b i b i
A BA
A B A B
(11)
where: 2
2i
i
L dA
d
and
2 2' "
2 2' "
b b
i i
B
. Since
m* ,
b* , and L are known
quantities, it remains to determine i* , and di. The microscopic approach to electrical
conduction in ionic liquids adopted in this study assumes that the charge carriers hop in a spatially randomly varying energy landscape deriving from the random network structure of the disordered system. The process is thermally activated and follows the Boltzmann distribution. Near the electrodes, the Poisson-Boltzmann equation predicts potential energy substantially greater than the thermal energy kT. This implies that the hopping times in the interfacial layer compared to the bulk can be expressed as
B
e c
e
τ (interface) Eexp 1
τ (bulk) k T
(12)
The activation energy ∆Ec has a well-defined physical meaning in terms of the electrochemical potential (a function of the Galvani potential of the electrode and the electrochemical potential of the electrolyte). It can be demonstrated that
0
0
(bulk)1
(interface)
(13)
The complex dielectric and conductivity functions can now be calculated based on the
fact that * i
0* . Figures 13 and 14 show comparison of the dielectric spectra
calculated based on the model with the assumption that the interfacial layer has a thickness of 1 nm. In a wide frequency range covering about 10 orders of magnitude, the

Proc. ESA Annual Meeting on Electrostatics 2010 14
spectral dependence of the electrode polarization effect (leading to changes by about 6 orders of magnitude in the intensity of the measured dielectric responses) is quantitatively reproduced. This approach, successful in describing the frequency dependence of the experimentally obtained dielectric and conductivity spectra in detail, can be approximated to a simpler form, suitable to treat analytically an important aspect related to the electrode polarization effects, namely: the scaling relations in respect to the variation of temperature, concentration, length of the sample cell and material of the electrodes. Contrary to dilute electrolytes where the double layer thickness is often less than 1 nm, ionic liquids exhibit unusual characteristics in this respect. In collaboration with researchers from the University of California and Princeton University, we recently made direct experimental measurements of the structure and dynamics of ILs at the solid-liquid interface comparable to the double-layers of electrolyte solutions using Surface Force Apparatus technique. We found typical lengths between 1-4 nm (much longer than expected from traditional theories and strongly dependent on the size and molecular structure of the anion/cation) [28]. The imaginary part of the complex conductivity exhibits distinct turning points corresponding to fmax and fon. From elementary calculus, it can be demonstrated that
2d10 ifo n L20 b i
(14)
and 2d10 ifmax 2 L0 i
(15)
where εb′ and εi′ are the dielectric permittivities of the material in the bulk and at the interface respectively. The approximation enables one to examine the scaling laws of the electrode polarization resulting into formulae for fon and fmax in dependence on σ0, εi′, εb′, L and di. It is immediately clear that:
1. max on 0f ~ f ~ , consistent with the scaling laws observed experimentally upon
varying the temperature or the concentration of the charge carriers.
2. on max
1 1f ~ , w hile f ~
LL, in quantitative agreement with the measured values and
with the experimental observation that the dielectric response does not scale with respect to the variation of the sample length.
3. on i max if ~ d , while f ~d , which delivers a qualitative explanation of the
dependence on the material of the electrodes, since varying the material of the electrodes is expected to change the thickness of the interfacial layers due to changes in the electrochemical potentials (and the Galvani potentials). Fig. 15 illustrates the picture of material dependence and a manifestation of the effect of the length of the interfacial layer. In addition, possible effects arising from adsorption processes on the electrodes should be considered as well. Furthermore, the experimental observation that the dielectric response does not scale upon variation of the electrode material is as well recovered.

Proc. ESA Annual Meeting on Electrostatics 2010 15
4. fmax is a solution of both m
d0
d
and m
d0
d
. This explains the
experimental observation that fmax occurs at the same frequency position for the two
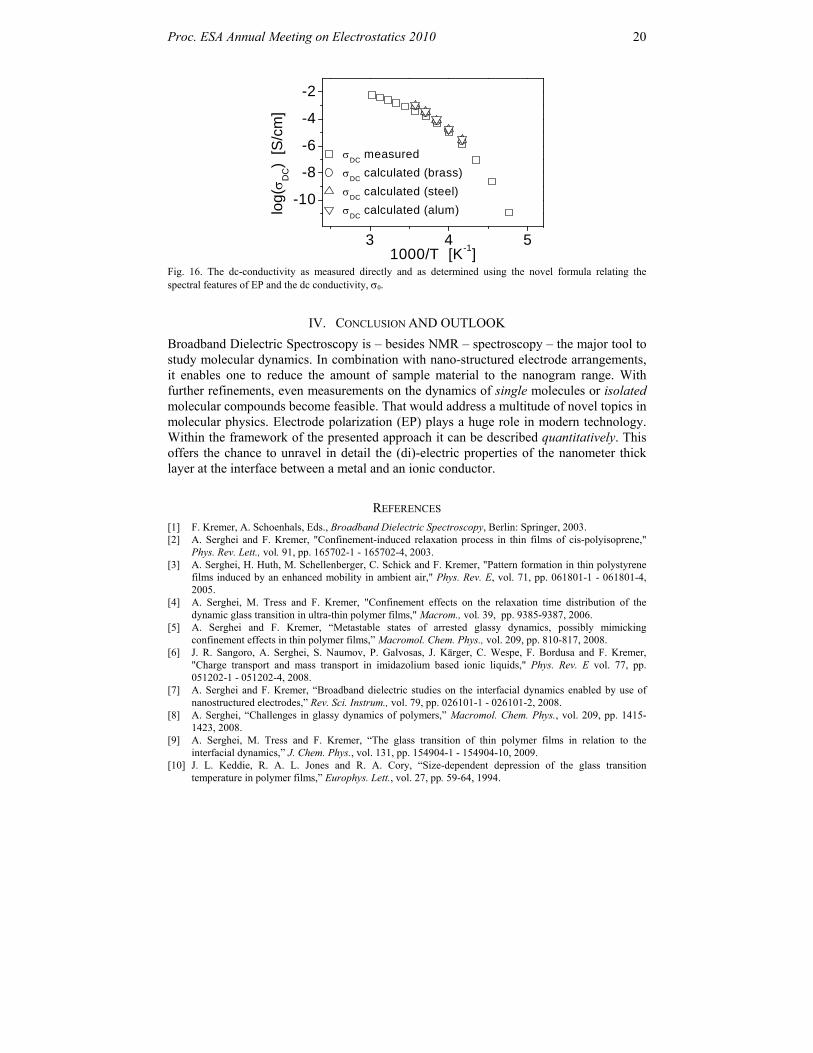
quantities (see Fig. 10). It is also readily evident that 2
0 0max
2 ons
f
f , where εs
denotes the static permittivity of the material under study. Using this formula, it becomes possible to determine the dc conductivity of a material from the spectral features of electrode polarization as demonstrated in Fig. 16. In cases where the dielectric response is dominated by electrode polarization, this novel equation can be used to deduce the dc conductivity. We have recently shown that this expression holds even in the case when both fon and fmax show remarkable dependence on the material of the electrodes used [12]. In detail EP is characterized by the following spectral features (Fig. 10): (i) the mean hopping time e = 1/fe which is necessary to overcome the highest energy barrier determining the DC conductivity 0, (ii) the frequency fon describing the onset of EP and (iii) the frequency fmax describing the full development of EP. Additionally, EP depends on the metal used as electrode (Fig. 11), but obviously fon and fmax do not scale similarly (inset Fig. 11). The ionic liquids 1-hexyl-3-methyimidazolium hexafluorophosphate (HMIM PF6) and dimethylimidazolium dimethylphosphate are measured to illustrate these features.
0
2
4
6
0
2
4
6
0 2 4 6 8
-6
-4
0 2 4 6 8
-6
-4
slope-0.1
fmax
fon
e
log ' eslope
-1.86
log "
slope -1
log '
' [S
/cm
]
log f [Hz]
log ' [S
/cm]
HMIM PF6 (264 K, 421 m cell thickness)ch
ang
e in
slo
pe
Fig. 10. The characteristic features of electrode polarisation (EP) show up in the real and imaginary part of the complex dielectric function * and the complex conductivity * quite differently: 1.) e: hopping time, 2.) 0: DC conductivity, 3.) fon: onset of EP, 4.) slope of –1.86 in ´ for f < fon 5.) fmax: full development of EP, 6.) slope of –0.1 in ´ for f < fmax 7.) change in slope of ´ for f < fmax . An analysis of the complex response of both quantities * and * are required to unravel EP

Proc. ESA Annual Meeting on Electrostatics 2010 16
0 1 2 3 4 5 6
-7
-6
-5
-4
-8
-7
-6
-5
-4
2-MIMM-2MEPO4
log('
') [S
/cm
]
log(f) [Hz]
-3
-2
-1
0
-4 -3 -2 -1 0 1 2 3 4 5 6f norm.
'' n
orm
.
brass stainless steel aluminium
log('
) [S
/cm
]
Fig. 11. The spectral features of electrode polarisation for different electrode materials as indicated. The ionic liquid under study is 2-MIMM-2MEPO4. In the inset spectra of normalized ’’ versus the normalized frequency is shown in order to prove that fon and fmax do not scale similarly with respect to the material of the electrode
In order to model EP quantitatively a three-layer model (illustrated in Fig. 12) is employed with nanometer thin interfacial layers in which the conductivity is reduced by 5 orders of magnitude compared to the bulk.

Proc. ESA Annual Meeting on Electrostatics 2010 17
Fig. 12. Microscopic model of the sample cell with nanometer thick interfacial layers in which the conductivity 0 is strongly reduced compared to the bulk
0 1 2 3 4 5
-12
-10
-8
-6
-4208 K224 K240 K256 K272 K288 K304 K320 K
log
'' [S
/cm
]
log f [Hz]
(a) Experiment
0 1 2 3 4 5
-12
-10
-8
-6
-4
log '
' [S
/cm
]
log f [Hz]
(b) Calculations
Fig. 13. Comparison between experiment and the predictions of the microscopic model
Proc. ESA Annual Meeting on Electrostatics 2010 18
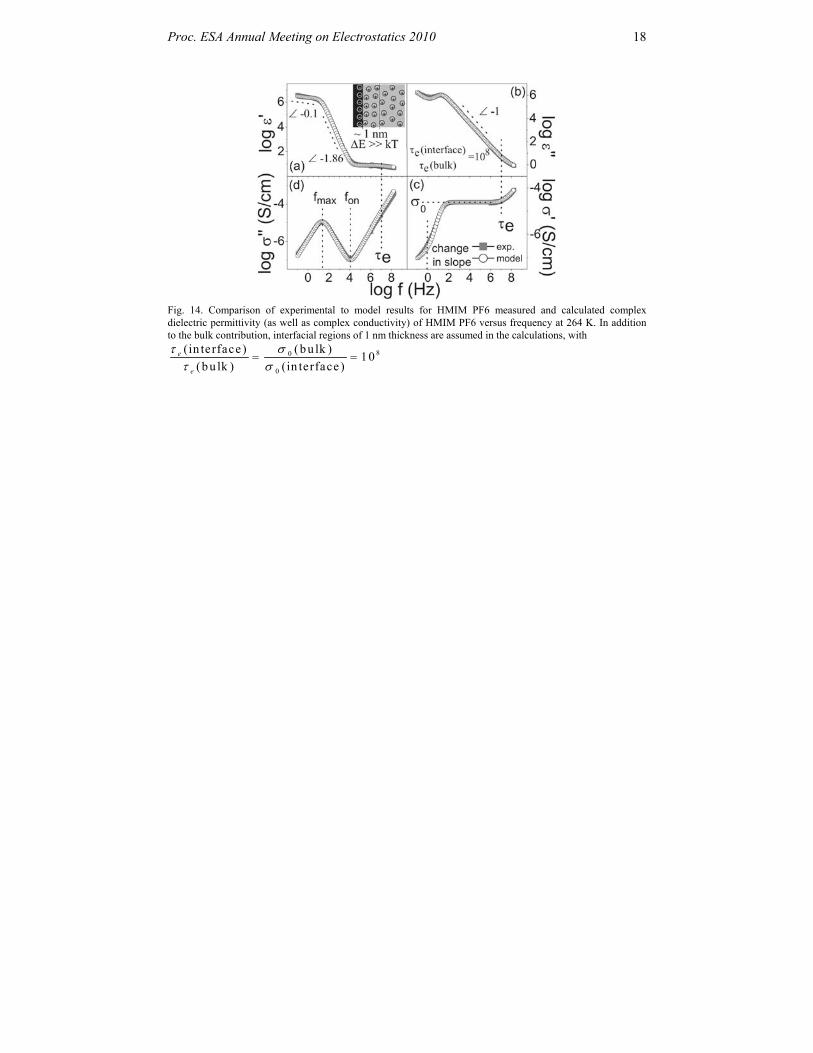
Fig. 14. Comparison of experimental to model results for HMIM PF6 measured and calculated complex dielectric permittivity (as well as complex conductivity) of HMIM PF6 versus frequency at 264 K. In addition to the bulk contribution, interfacial regions of 1 nm thickness are assumed in the calculations, with
80
0
(in terface ) (bu lk )10
(bu lk ) (in terface )e
e

Proc. ESA Annual Meeting on Electrostatics 2010 19
Fig. 15. Calculated complex conductivity of HMIM-PF6 versus frequency at 270 K for different interfacial layer thicknesses as indicated. In addition to the bulk contribution, it was assumed that
80
0
(in terface ) (bu lk )10
(bu lk ) (in terface )e
e
. Inset: No scaling obtained as experimental observed for
different electrode materials.
Working out this model [22] quantitatively enables one to compare it directly with experimental results (Fig. 13). From the mathematical description of the model, it follows that the frequencies fon and fmax are related to the DC conductivity 0 by:
2
0 0max
2 ons
f
f (16)
Based on this novel formula it is possible to deduce from the spectral features of EP the conductivity of the bulk ionic liquid. This works well independent of the material of the metal electrodes as demonstrated in Fig. 14.
Proc. ESA Annual Meeting on Electrostatics 2010 20
3 4 5
-10
-8
-6
-4
-2
DC
measured
DC
calculated (brass)
DC
calculated (steel)
DC
calculated (alum)log
(D
C)
[S/c
m]
1000/T [K-1] Fig. 16. The dc-conductivity as measured directly and as determined using the novel formula relating the spectral features of EP and the dc conductivity, 0.
IV. CONCLUSION AND OUTLOOK
Broadband Dielectric Spectroscopy is – besides NMR – spectroscopy – the major tool to study molecular dynamics. In combination with nano-structured electrode arrangements, it enables one to reduce the amount of sample material to the nanogram range. With further refinements, even measurements on the dynamics of single molecules or isolated molecular compounds become feasible. That would address a multitude of novel topics in molecular physics. Electrode polarization (EP) plays a huge role in modern technology. Within the framework of the presented approach it can be described quantitatively. This offers the chance to unravel in detail the (di)-electric properties of the nanometer thick layer at the interface between a metal and an ionic conductor.
REFERENCES [1] F. Kremer, A. Schoenhals, Eds., Broadband Dielectric Spectroscopy, Berlin: Springer, 2003. [2] A. Serghei and F. Kremer, "Confinement-induced relaxation process in thin films of cis-polyisoprene,"
Phys. Rev. Lett., vol. 91, pp. 165702-1 - 165702-4, 2003. [3] A. Serghei, H. Huth, M. Schellenberger, C. Schick and F. Kremer, "Pattern formation in thin polystyrene
films induced by an enhanced mobility in ambient air," Phys. Rev. E, vol. 71, pp. 061801-1 - 061801-4, 2005.
[4] A. Serghei, M. Tress and F. Kremer, "Confinement effects on the relaxation time distribution of the dynamic glass transition in ultra-thin polymer films," Macrom., vol. 39, pp. 9385-9387, 2006.
[5] A. Serghei and F. Kremer, “Metastable states of arrested glassy dynamics, possibly mimicking confinement effects in thin polymer films,” Macromol. Chem. Phys., vol. 209, pp. 810-817, 2008.
[6] J. R. Sangoro, A. Serghei, S. Naumov, P. Galvosas, J. Kärger, C. Wespe, F. Bordusa and F. Kremer, "Charge transport and mass transport in imidazolium based ionic liquids," Phys. Rev. E vol. 77, pp. 051202-1 - 051202-4, 2008.
[7] A. Serghei and F. Kremer, “Broadband dielectric studies on the interfacial dynamics enabled by use of nanostructured electrodes,” Rev. Sci. Instrum., vol. 79, pp. 026101-1 - 026101-2, 2008.
[8] A. Serghei, “Challenges in glassy dynamics of polymers,” Macromol. Chem. Phys., vol. 209, pp. 1415-1423, 2008.
[9] A. Serghei, M. Tress and F. Kremer, “The glass transition of thin polymer films in relation to the interfacial dynamics,” J. Chem. Phys., vol. 131, pp. 154904-1 - 154904-10, 2009.
[10] J. L. Keddie, R. A. L. Jones and R. A. Cory, “Size-dependent depression of the glass transition temperature in polymer films,” Europhys. Lett., vol. 27, pp. 59-64, 1994.

Proc. ESA Annual Meeting on Electrostatics 2010 21
[11] S. Havriliak and S. Negami, “A complex plane representation of dielectric and mechanical relaxation processes in some polymers,” Polym., vol. 8, pp. 161-210, 1967.
[12] M. Morita, T. Ohmi, E. Hasegawa, M. Kawakami and M. Ohwada, “Growth of native oxide on a silicon surface,” J. Appl. Phys., vol. 68, pp. 1272-1281, 1990.
[13] K. Konstadinidis, B. Thakkar, A. Chakraborty, L. Potts, R. Tannenbaum and M. Tirrell, “Segment Level Chemistry and Chain Conformation in the Reactive Adsorption of Poly(methy1 methacrylate) on Aluminum Oxide Surfaces,” Lang., vol. 8, pp.1307-1317, 1992.
[14] R. Vila, M. González, J. Mollá and A. Ibarra, “Dielectric spectroscopy of alumina ceramics over a wide frequency range,” J. Nuc. Mat., vol. 253, pp. 141-148, 1998
[15] M. Erber, A. Khalyavina, K.-J. Eichhorn and B. Voit, “Variations in the glass transition temperature of polyester with special architectures confined in thin films,” Polym., vol. 51, pp. 129-135, 2010
[16] J. S. Sharp and J. A. Forrest, “Free surfaces cause reductions in the glass transition temperature of thin polystyrene films,” Phys. Rev. Lett., vol. 91, pp. 235701-1 - 235701-4, 2003.
[17] C. Rotella, S. Napolitano and M. Wübbenhorst, “Segmental Mobility and Glass Transition Temperature of Freely Suspended Ultrathin Polymer Membranes,” Macrom., vol. 42, pp. 1415-1417, 2009.
[18] C. Ellison and J. Torkelson, “The distribution of glass-transition temperatures in nanoscopically confined glass formers,” Nat. Mat., vol. 2, pp. 695-700, 2003.
[19] M. Efremov, E. Olson, M. Zhang, Z. Zhang and L. Allen, “Probing Glass Transition of Ultrathin Polymer Films at a Time Scale of Seconds Using Fast Differential Scanning Calorimetry,” Macrom., vol. 37, pp. 4607-4616, 2004.
[20] V. Lupaşcu, H. Huth, C. Schick and M. Wübbenhorst, “Specific heat and dielectric relaxations in ultra-thin polystyrene layers,” Therm. Acta, vol. 432, pp. 222-228, 2005.
[21] A. Serghei, H. Huth, C. Schick, F. Kremer, “Glassy dynamics in thin polymer layers having a free upper interface,” Macrom., vol. 41, pp. 3636-3639, 2008.
[22] A. Serghei, M. Tress, J.R.Sangoro, F. Kremer, “Electrode polarization and charge transport at solid interfaces,” Phys. Rev. B, vol. 80, pp. 184301-1 - 184301-5, 2009.
[23] J. R. Sangoro, C. Iacob, A. Serghei, S. Naumov, P. Galvosas, J. Kärger, C. Wespe, F. Bordusa, A. Stoppa, J. Hunger, R. Buchner, F. Kremer, "Electrical conductivity and translational diffusion in the 1-butyl-3-methyllimidazolium tetrafluoroborate ionic liquid," J. Chem. Phys., vol. 128, pp. 212509-212514, 2008.
[24] J.R. Sangoro, C. Iacob, A. Serghei, C. Friedrich, F. Kremer, "Universality of charge transport in glass-forming ionic liquids," Phys. Chem. Chem. Phys., vol. 11, pp. 913-917, 2009.
[25] J. R. Sangoro, G. Turky, M. Abdel Rehim, S. Naumov, A. Ghoneim, J. Kärger and F. Kremer, "Charge transport and dipolar relaxation in hyper-branched polyamide amines," Macrom., vol. 42, pp. 1648-1651, 2009.
[26] G. Turky, J. R. Sangoro, M. Abdel-Rehim, and F. Kremer, “Secondary relaxations and electrical conductivity in hyperbranched polyester amides” J. Polym. Sci. B: Polym. Phys., vol. 48, pp. 1651-1657, 2010.
[27] C. Krause, J. R. Sangoro, C. Iacob, and F. Kremer, “Charge transport and dipolar relaxations in imidazolium-based ionic liquids,” J. Phys. Chem. B, vol. 114, pp. 382-386, 2010.
[28] Y. Min, M. Akbulut, J. R. Sangoro, F. Kremer, R. K. Prud’homme, J. Israelachvili, “Measurement of forces across room temperature ionic liquids between mica surfaces,” J. Phys. Chem. C, vol. 37, pp. 16445-16449, 2009.