broad indicatorskambing.ui.ac.id/onnopurbo/library/library-ref-eng/ref... · web viewthis chapter...
TRANSCRIPT
The International Institute forThe International Institute for Information Technology (INIIT)Information Technology (INIIT)
The SCAN-ICT Pilot Project
An Empirical Study of the Development,An Empirical Study of the Development, Deployment and the Exploitation of ICTs inDeployment and the Exploitation of ICTs in
GhanaGhana
Professor Clement DzidonuSenior Research Fellow, INIIT
An International Development Research Center (IDRC) and the Economic Commission for Africa (ECA) Initiative
© 2002, International Institute for Information Technology (INIIT)
Preface
In most African countries there is a serious lack of basic information on key ICT and related economic and social indicators as well as on ICT related activities and on the impact of ICT policy decisions and plans. The SCAN-ICT project – an initiative of the International Development Research Center (IDRC) and the Economic Commission for Africa (ECA) is designed to: build support for the phased development of a comprehensive African capability to collect and manage information on key ICT-related indicators to support the growing investment in ICTs as well as the transition of Africa to an information society.
The premise is that: the availability of these types of information and better access to them will improve decision making at all levels, as well as aid the process of monitoring and evaluation of the impact of ICT activities, policies and plans and facilitate R&D work appropriate to the Africa region. In addition, Scan-ICT project is designed to provide an opportunity to build capacity in Africa to influence ICT investments, to extend their impact, and to encourage the development of Africa solutions, applications and content. The goal is to create a pan-African ICT network, connecting all levels of ICT related issues, which will be co-ordinated and supported by national SCAN-ICT nodes.
The project is being implemented in two phases: the pilot phase and the full implementation phase. The pilot phase of the project involves five African countries namely: Ghana, Uganda, Senegal, Ethiopia, Mozambique and Morocco. The International Institute for Information Technology (INIIT) has been selected to serve as the country implementation and coordination agency for the Ghana Scan-ICT Pilot study.
This report documents the details of the research output of the Ghana Scan-ICT pilot study – The Ghana study was implemented in two stages: (i) the design stage, and (ii) the implementation stage. The design stage concentrated on the development of the methodology --- constituting a detailed design of the necessary processes, inputs and tools required for the data and information gathering, processing and presentation exercise. The implementation stage was devoted to the actual data collection/gathering and analysis based on the details of the methodology.
The Report is divided into two parts: Part One concentrates of the Study Methodology and Implementational issues; with Part Two devoted to details of the study documented in eleven chapters.
2
Table of Contents
1.0 The GHANA Scan-ICT METHODOLOGY AND TOPOLOGY
2.0 The GHANA Scan-ICT IMPLEMENATION STRATEGY AND RELATED ISSUES
3.0 GENERAL PROFILE: DEMOGRAPHIC & ECONOMIC
4.0 THE ICT SECTOR: AN OVERVIEW OF NATIONAL ICT POLICIES AND STRATEGIES
5.0 THE ICT SECTOR: THE KEY PLAYERS AND STAKEHOLDERS
6.0 THE ICT SECTOR: AN OVERVIEW OF KEY TELECOM AND COMMUNICATIONS INDICATORS
7.0 THE DEPLOYMENT AND EXPLOITATION OF ICTs: AN OVERVIEW OF THE GHANA ICT LANDSCAPE
8.0 SECTORAL APPLICATIONS: THE ICT SUB-SECTOR
9.0 SECTORAL APPLICATIONS: THE PUBLIC SECTOR and the PRIVATE SECTOR
10.0 SECTORAL APPLICATIONS: THE EDUCATIONAL SECTOR: THE DEPLOYMENT AND EXPLOITATION OF ICTs IN THE GHANA SCHOOLS
11.0 SECTORAL APPLICATIONS: THE EDUCATIONAL SECTOR: THE DEPLOYMENT AND EXPLOITATION OF ICTs IN THE UNIVERSITIES AND COLLEGES
12.0 SECTORAL APPLICATIONS: THE HEALTH SECTOR
13.0 THE PROFILE OF ICT PROJECTS AND INITIATIVES IN THE PUBLIC AND PRIVATE SECTOR
APPENDIX A: QUESTIONNAIRE USED IN THE SCAN-ICT SURVEYS
APPENDIX B: THE GHANA SCAN-ICT NETWORK NODES TEAM LEADERS
3

Part OnePart One
THE STUDY METHODOLOGYTHE STUDY METHODOLOGY AND IMPLEMENTATIONAND IMPLEMENTATION ALAL
ISSUESISSUES
4
CHAPTER ONECHAPTER ONE
THE GHANA SCAN-ICT METHODOLOGY AND TOPOLOGY
The Premise of the Methodology
The Ghana pilot Scan-ICT project, forms part of a 6-nation initiative under the auspices of the International Development Research Center (IDRC) and the United Nations Economic Commission for Africa (UNECA). The other countries participating in this African-wide initiative are: Uganda, Morocco, Ethiopia, Senegal and Mozambique.
The Ghana pilot project was based on a comprehensive methodology, developed to guide the data gathering and analysis exercise. The premise underlying the development of this methodology is that: given the long-term nature of the Scan-ICT project, it was found necessary to develop a detailed design of the underlying processes, procedures and the required tools to facilitate the implementation process – involving data collection, analysis and presentation of the study results
The outputs of the detailed design phase apart from serving as a means for facilitating the implementation process also serves as a key output of the Ghana Scan-ICT project --- being implemented in two stages: (i) the design stage involving the design of the details of the methodology and (ii) the implementation stage involving data collection/gathering and analysis.
The Methodology
For each of the specific indicators under each of the Scan-ICT theme --- the methodology provided specific details in relation to:
(i) the relevant information to be collected/gathered;
(ii) the possible sources of the relevant information to be gathered;
(iii) the methods to be used for obtaining or gathering the required information;
(iv) the relevant types of questionnaire to be used in cases where a postal survey or a face-to-face interview is required and
(v) the format in which the information gathered as per each indicator is to be presented or summarized.
Three main types of questionnaire have been designed as part of the detailed Methodology, these include:
(i) graphical-based questionnaire; --- these are used for face-to-face interviews;
5
(ii) standard (text-based) questionnaires, ---- which were used for both face-to-face interviews and postal questionnaires and
(iii) electronic-based questionnaires --- which are transmitted to target samples via e-mail.
The graphically-based, the text-based and the electronic-based questionnaires were all field tested using a sample from each of the targeted populations. These target populations include:
(i) the public sector institutions and establishments (Government Ministries, Agencies and Departments; Public Sector Organizations, Local, Regional and District organizations and institutions etc)
(ii) the private sector establishments and institutions; (small and medium scale enterprises (SMEs), large private enterprises etc)
(iii) schools (public and private primary and secondary schools);
(iv) universities, colleges and polytechnics;
(v) ICT (computer) companies, institutions and establishments including computer equipment vendors, retailers and distributors, software developers, retailers and distributors; computer training centers and institutions, computer systems development and support companies and establishments, communications centers and Telecenters; ISPs, Telecom Operators, Gateway/Broadband Service Providers and other Internet-based Service Providers
(vi) Hospitals, Clinics and Health Centers.
It is envisaged that the questionnaires and the other tools developed for use in the pilot project will be refined based on the outcome of the pilot project for use in the follow-up main Scan-ICT project.
6
This Page is Deliberately left Blank
7
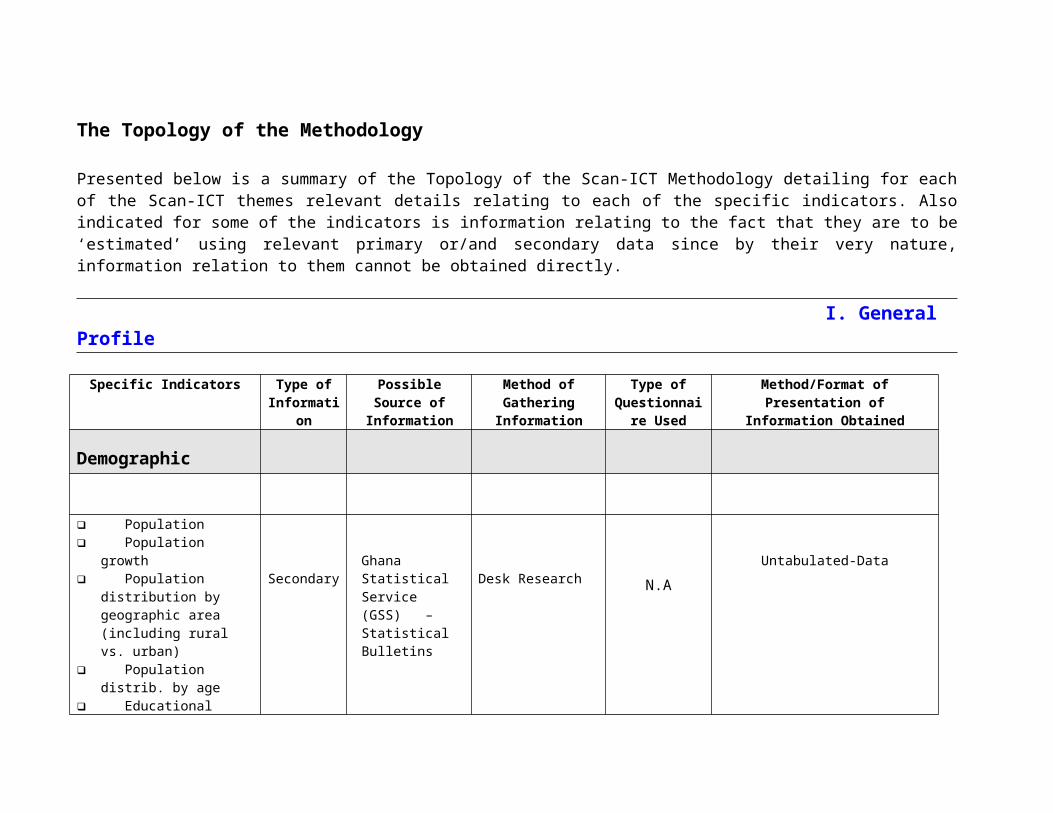
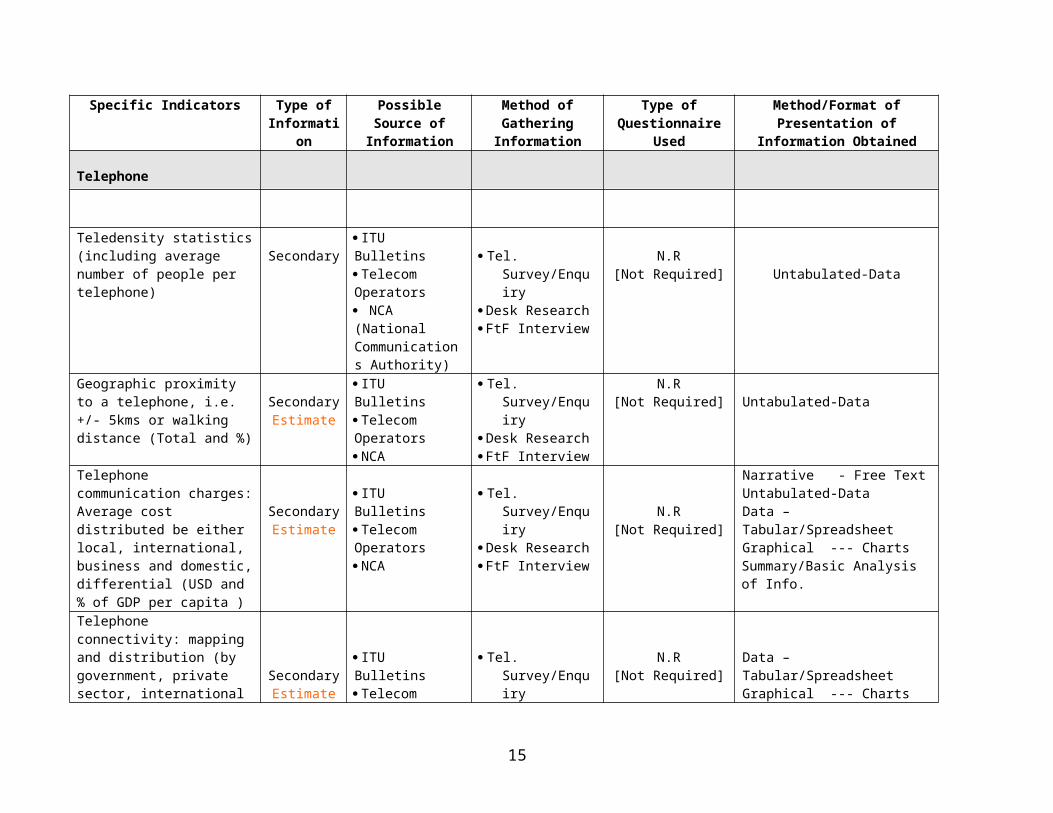
The Topology of the Methodology
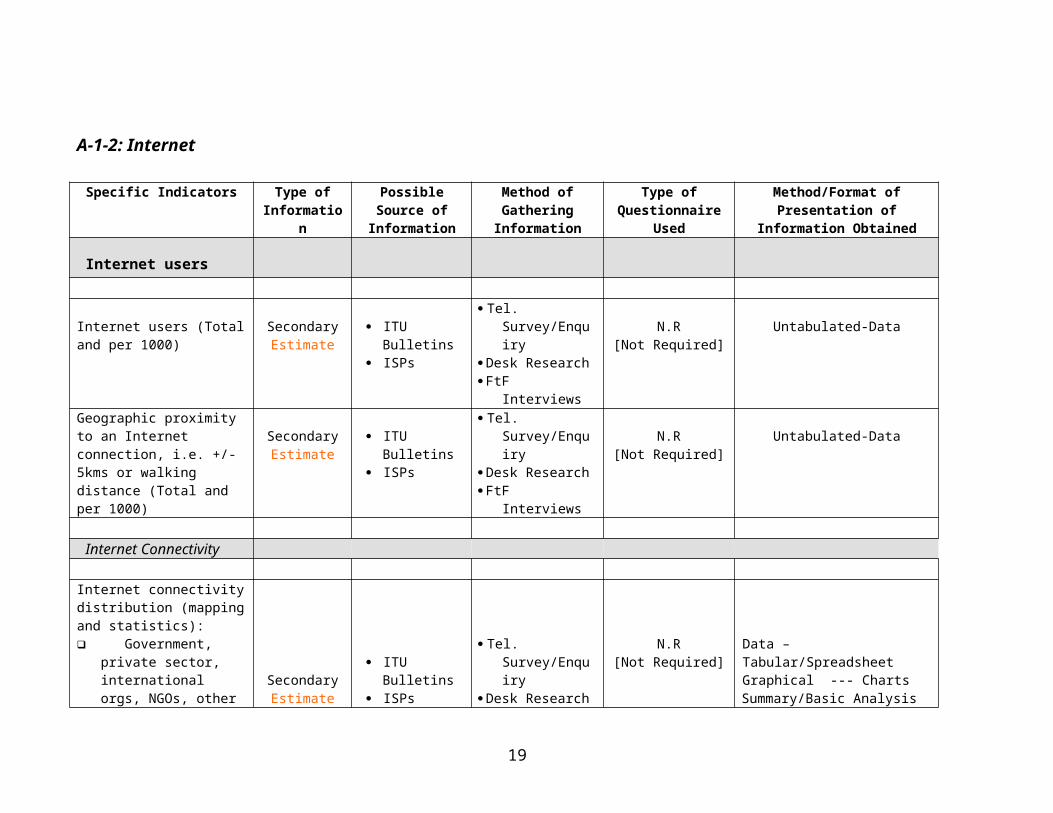
Presented below is a summary of the Topology of the Scan-ICT Methodology detailing for each of the Scan-ICT themes relevant details relating to each of the specific indicators. Also indicated for some of the indicators is information relating to the fact that they are to be ‘estimated’ using relevant primary or/and secondary data since by their very nature, information relation to them cannot be obtained directly.
I. General Profile
Specific Indicators Type of Information
Possible Source of Information
Method of Gathering
Information
Type of Questionnaire
Used
Method/Format of Presentation of Information Obtained
Demographic
Population Population growth Population distribution
by geographic area (including rural vs. urban)
Population distrib. by age
Educational levels Household patterns
SecondaryGhana Statistical Service (GSS) – Statistical Bulletins
Desk Research N.AUntabulated-Data
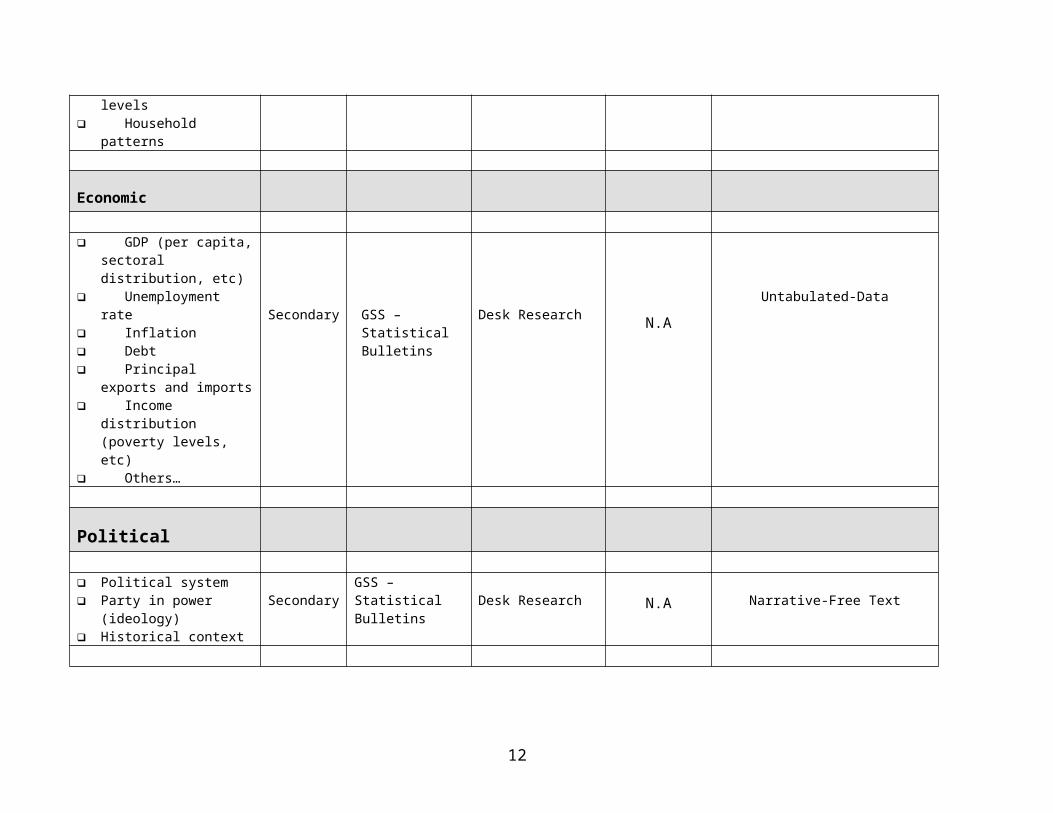
Economic
GDP (per capita, sectoral distribution, etc)
Unemployment rate Inflation Debt Secondary GSS – Statistical Desk Research N.A
Untabulated-Data
Principal exports and imports
Income distribution (poverty levels, etc)
Others…
Bulletins
Political
Political system Party in power (ideology) Historical context
SecondaryGSS – Statistical Bulletins Desk Research N.A Narrative-Free Text
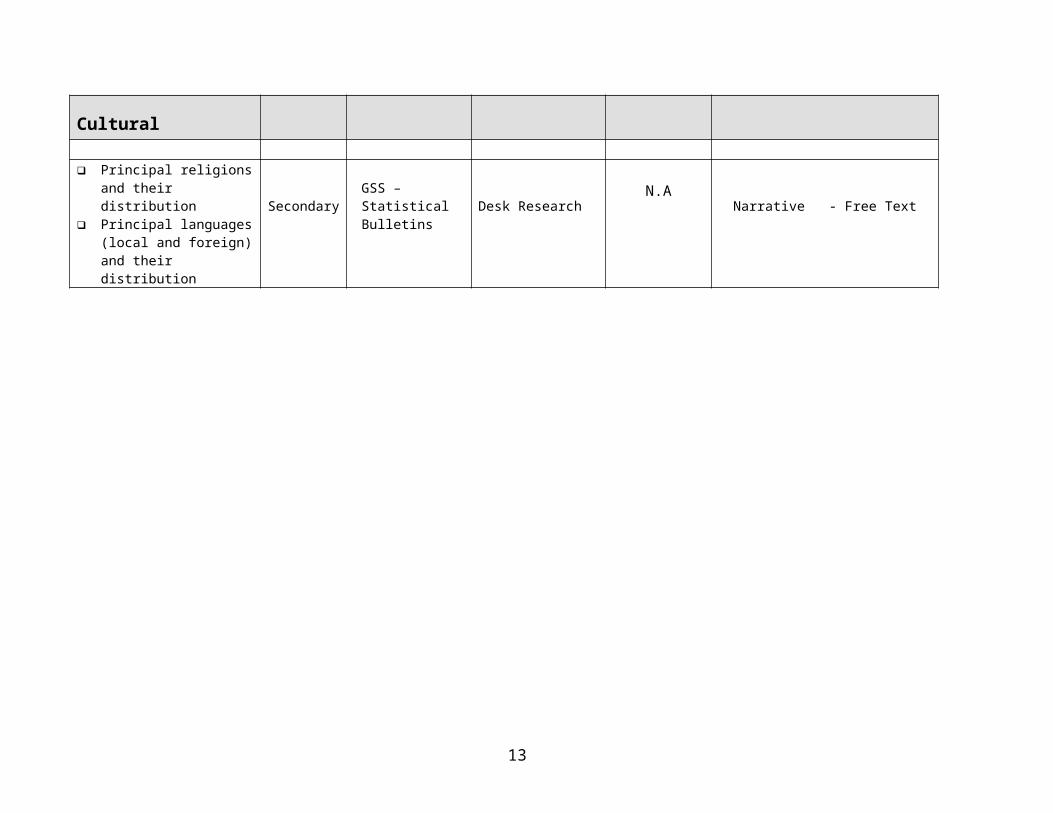
Cultural
Principal religions and their distribution
Principal languages (local and foreign) and their distribution
SecondaryGSS – Statistical Bulletins Desk Research
N.ANarrative - Free Text
9

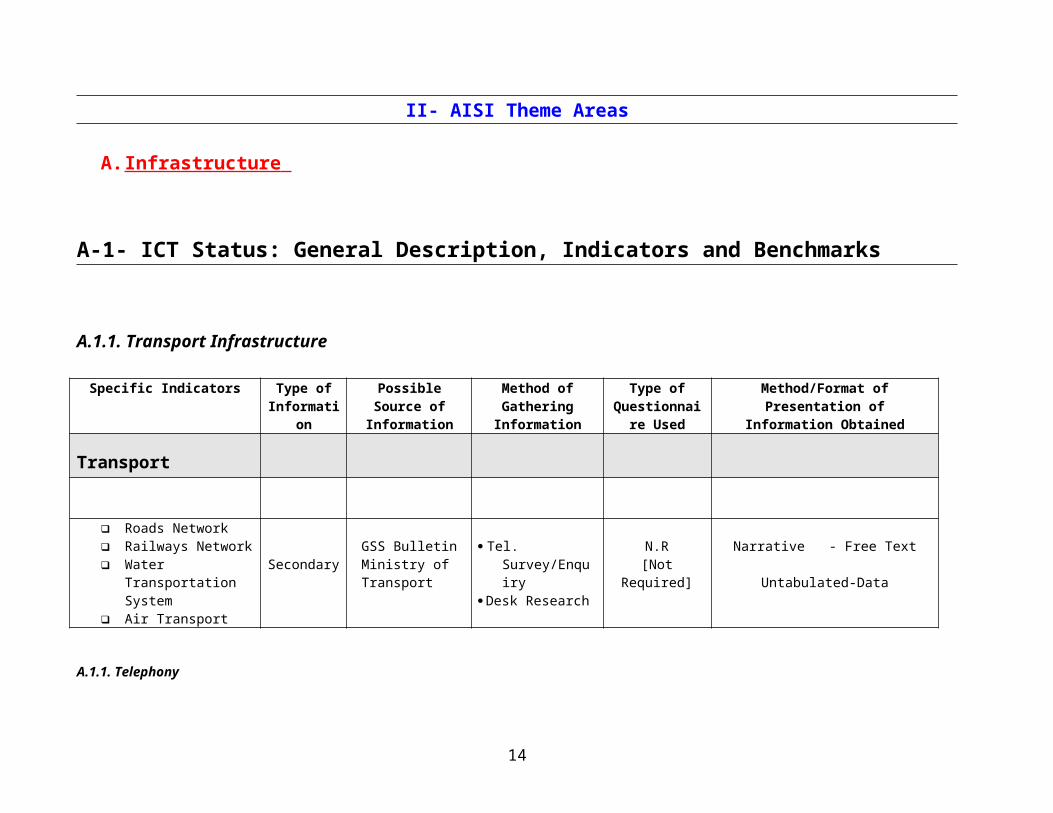
II- AISI Theme Areas
A. Infrastructure
A-1- ICT Status: General Description, Indicators and Benchmarks
A.1.1. Transport Infrastructure
Specific Indicators Type of Information
Possible Source of Information
Method of Gathering
Information
Type of Questionnaire
Used
Method/Format of Presentation of Information Obtained
Transport
Roads Network Railways Network Water Transportation
System Air Transport
SecondaryGSS BulletinMinistry of Transport
Tel. Survey/Enquiry Desk Research
N.R [Not Required]
Narrative - Free Text
Untabulated-Data
A.1.1. Telephony
Specific Indicators Type of Information
Possible Source of Information
Method of Gathering
Information
Type of Questionnaire Used
Method/Format of Presentation of Information Obtained
10
Telephone
Teledensity statistics (including average number of people per telephone)
Secondary ITU Bulletins Telecom Operators NCA (National Communications Authority)
Tel. Survey/Enquiry Desk Research FtF Interview
N.R [Not Required] Untabulated-Data
Geographic proximity to a telephone, i.e. +/- 5kms or walking distance (Total and %)
SecondaryEstimate
ITU Bulletins Telecom Operators NCA
Tel. Survey/Enquiry Desk Research FtF Interview
N.R [Not Required] Untabulated-Data
Telephone communication charges: Average cost distributed be either local, international, business and domestic, differential (USD and % of GDP per capita )
SecondaryEstimate
ITU Bulletins Telecom Operators NCA
Tel. Survey/Enquiry Desk Research FtF Interview
N.R [Not Required]
Narrative - Free TextUntabulated-DataData – Tabular/SpreadsheetGraphical --- ChartsSummary/Basic Analysis of Info.
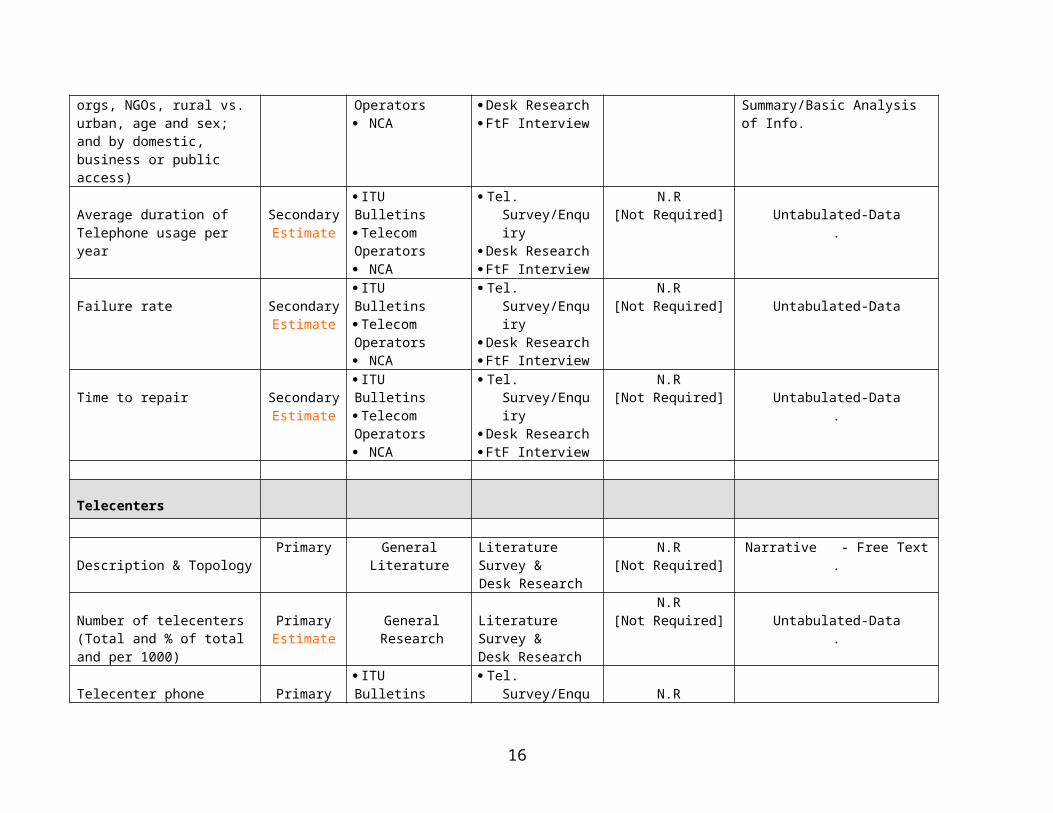
Telephone connectivity: mapping and distribution (by government, private sector, international orgs, NGOs, rural vs. urban, age and sex; and by domestic, business or public access)
SecondaryEstimate
ITU Bulletins Telecom Operators NCA
Tel. Survey/Enquiry Desk Research FtF Interview
N.R [Not Required]
Data – Tabular/SpreadsheetGraphical --- ChartsSummary/Basic Analysis of Info.
Average duration of Telephone usage per year
SecondaryEstimate
ITU Bulletins Telecom Operators NCA
Tel. Survey/Enquiry Desk Research FtF Interview
N.R[Not Required] Untabulated-Data
.
Failure rate SecondaryEstimate
ITU Bulletins Telecom Operators NCA
Tel. Survey/Enquiry Desk Research FtF Interview
N.R [Not Required] Untabulated-Data
Time to repair SecondaryEstimate
ITU Bulletins Telecom Operators NCA
Tel. Survey/Enquiry Desk Research FtF Interview
N.R [Not Required] Untabulated-Data
.
Telecenters
Primary General Literature Literature Survey & N.R Narrative - Free Text
11
Description & Topology Desk Research [Not Required] .
Number of telecenters (Total and % of total and per 1000)
PrimaryEstimate
General Research Literature Survey &Desk Research
N.R [Not Required] Untabulated-Data
.
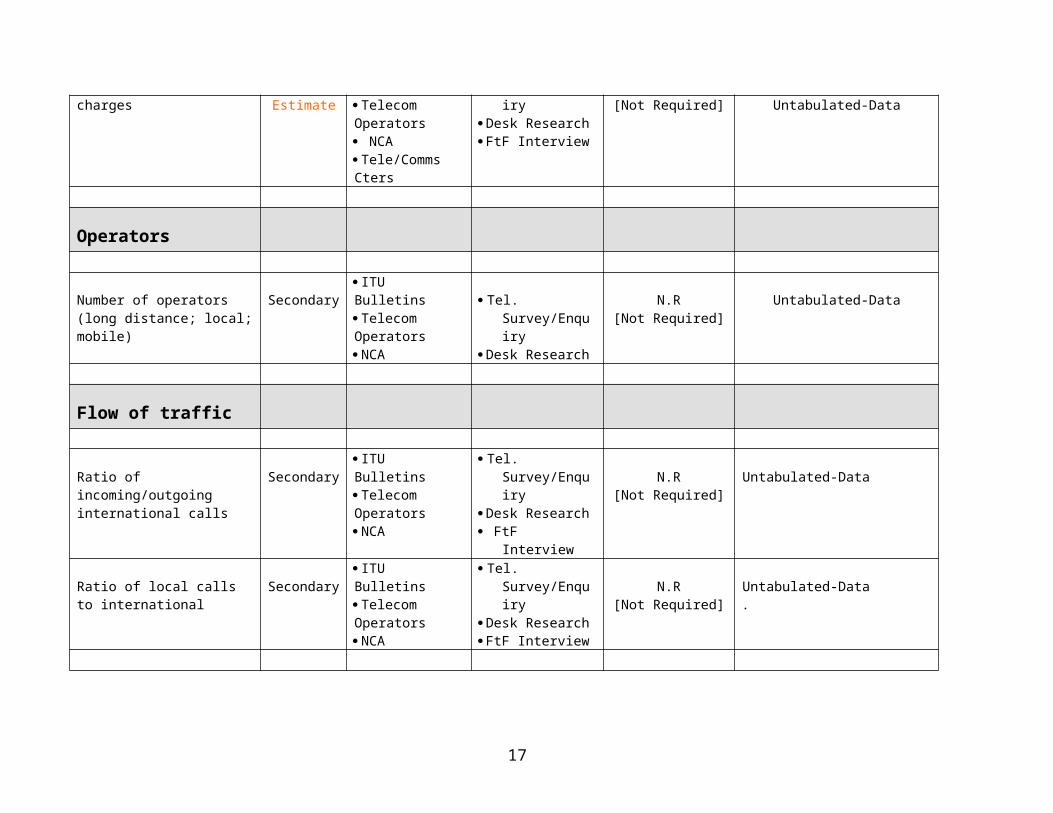
Telecenter phone charges PrimaryEstimate
ITU Bulletins Telecom Operators NCA Tele/Comms Cters
Tel. Survey/Enquiry Desk Research FtF Interview
N.R [Not Required] Untabulated-Data
Operators
Number of operators (long distance; local; mobile)
Secondary ITU Bulletins Telecom Operators NCA
Tel. Survey/Enquiry Desk Research
N.R [Not Required]
Untabulated-Data
Flow of traffic
Ratio of incoming/outgoing international calls
Secondary ITU Bulletins Telecom Operators NCA
Tel. Survey/Enquiry Desk Research FtF Interview
N.R [Not Required]
Untabulated-Data
Ratio of local calls to international
Secondary ITU Bulletins Telecom Operators NCA
Tel. Survey/Enquiry Desk Research FtF Interview
N.R [Not Required]
Untabulated-Data.
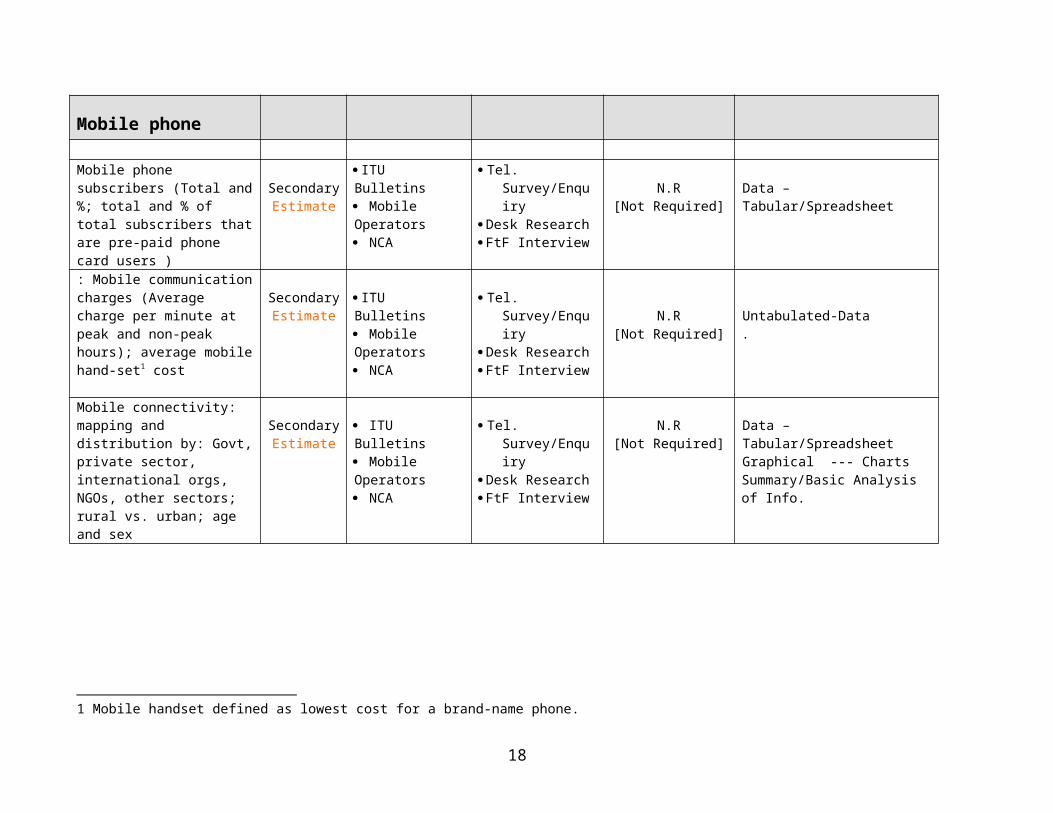
Mobile phone
Mobile phone subscribers (Total and %; total and % of total subscribers that are pre-paid phone card users )
SecondaryEstimate
ITU Bulletins Mobile Operators NCA
Tel. Survey/Enquiry Desk Research FtF Interview
N.R [Not Required]
Data – Tabular/Spreadsheet
: Mobile communication charges (Average charge per minute at peak and non-peak hours);
SecondaryEstimate
ITU Bulletins Mobile Operators
Tel. Survey/Enquiry Desk Research N.R Untabulated-Data
12
average mobile hand-set1 cost NCA FtF Interview [Not Required] .
Mobile connectivity: mapping and distribution by: Govt, private sector, international orgs, NGOs, other sectors; rural vs. urban; age and sex
SecondaryEstimate
ITU Bulletins Mobile Operators NCA
Tel. Survey/Enquiry Desk Research FtF Interview
N.R [Not Required]
Data – Tabular/SpreadsheetGraphical --- ChartsSummary/Basic Analysis of Info.
1 Mobile handset defined as lowest cost for a brand-name phone.
13
A-1-2: Internet
Specific Indicators Type of Information
Possible Source of Information
Method of Gathering
Information
Type of Questionnaire Used
Method/Format of Presentation of Information Obtained
Internet users
Internet users (Total and per 1000)
SecondaryEstimate
ITU Bulletins ISPs
Tel. Survey/Enquiry Desk Research FtF Interviews
N.R [Not Required]
Untabulated-Data
Geographic proximity to an Internet connection, i.e. +/- 5kms or walking distance (Total and per 1000)
SecondaryEstimate
ITU Bulletins ISPs
Tel. Survey/Enquiry Desk Research FtF Interviews
N.R [Not Required]
Untabulated-Data
Internet Connectivity
Internet connectivity distribution (mapping and statistics): Government, private
sector, international orgs, NGOs, other sectors
Geography (rural vs. urban, etc. )
age and sex domestic, business,
public
SecondaryEstimate
ITU Bulletins ISPs
Tel. Survey/Enquiry Desk Research FtF Interviews
N.R [Not Required]
Data – Tabular/SpreadsheetGraphical --- ChartsSummary/Basic Analysis of Info.
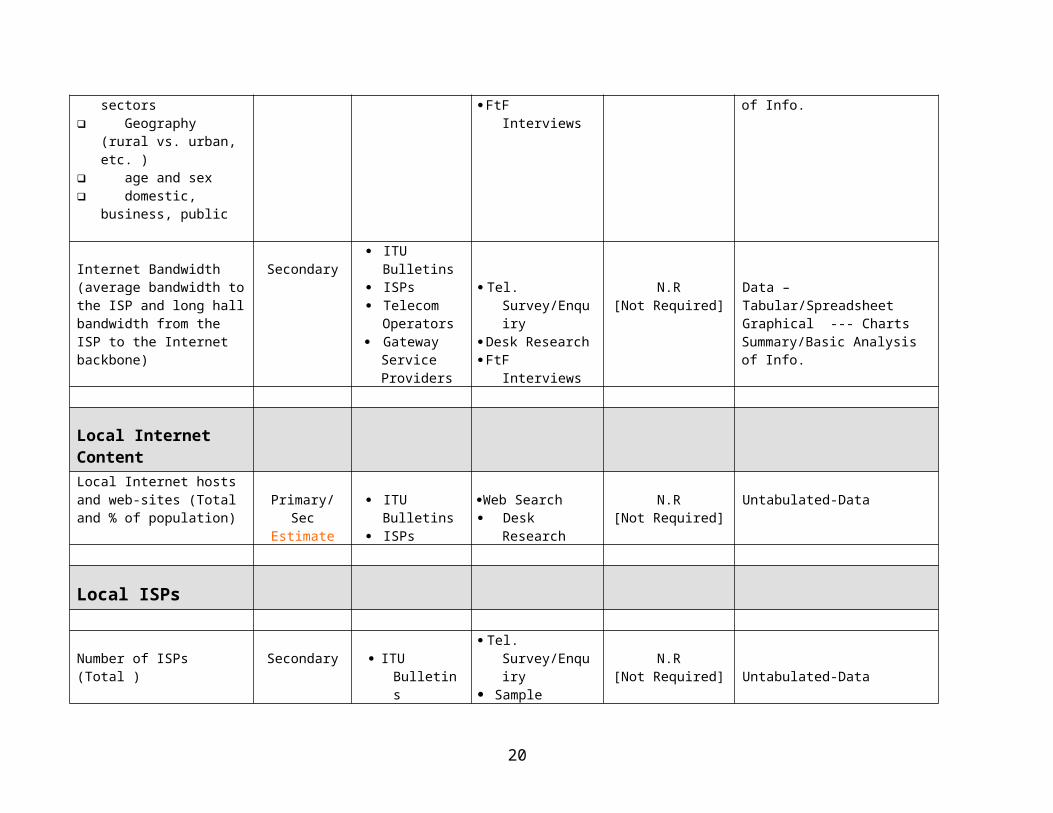
Internet Bandwidth (average bandwidth to the ISP and long hall bandwidth from the ISP to the Internet backbone)
Secondary ITU Bulletins ISPs Telecom
Operators Gateway
Tel. Survey/Enquiry Desk Research FtF Interviews
N.R [Not Required]
Data – Tabular/SpreadsheetGraphical --- ChartsSummary/Basic Analysis of Info.
14
Service Providers
Local Internet ContentLocal Internet hosts and web-sites (Total and % of population)
Primary/SecEstimate
ITU Bulletins ISPs
Web Search Desk Research
N.R [Not Required]
Untabulated-Data
Local ISPs
Number of ISPs (Total ) Secondary ITU Bulletins ISPs
Tel. Survey/Enquiry Sample Survey Desk Research
N.R [Not Required] Untabulated-Data
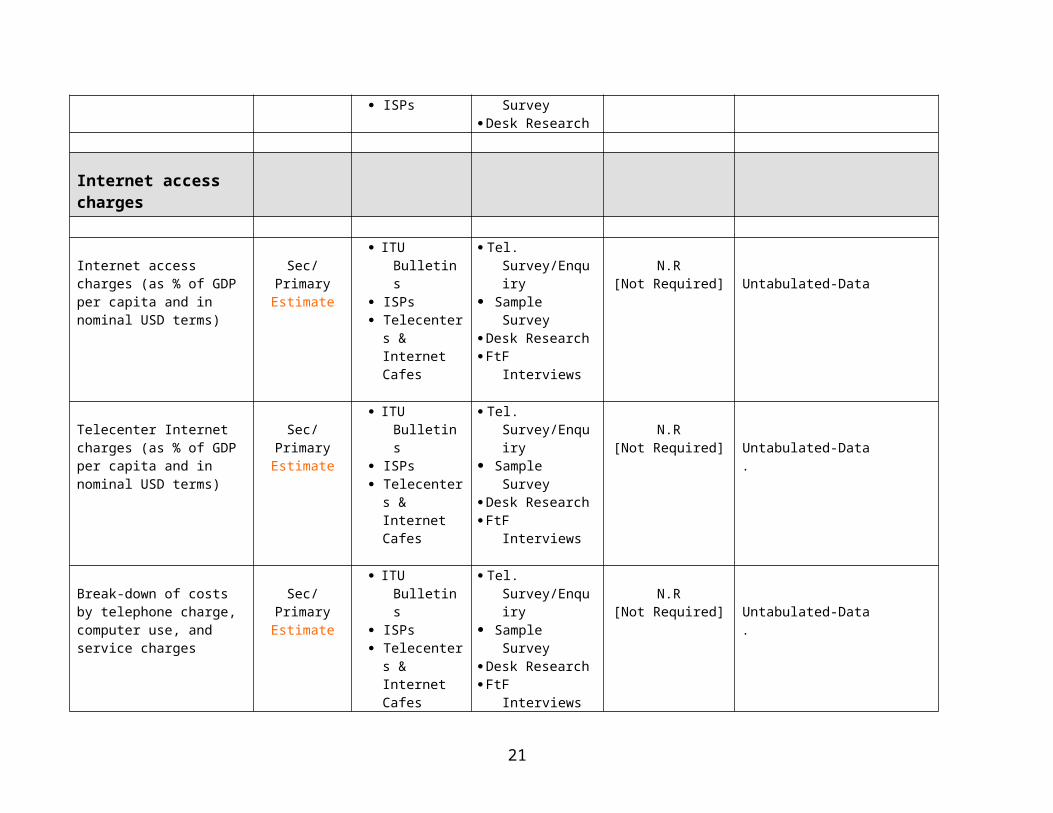
Internet access charges
Internet access charges (as % of GDP per capita and in nominal USD terms)
Sec/PrimaryEstimate
ITU Bulletins ISPs Telecenters &
Internet Cafes
Tel. Survey/Enquiry Sample Survey Desk Research FtF Interviews
N.R [Not Required] Untabulated-Data
Telecenter Internet charges (as % of GDP per capita and in nominal USD terms)
Sec/PrimaryEstimate
ITU Bulletins ISPs Telecenters &
Internet Cafes
Tel. Survey/Enquiry Sample Survey Desk Research FtF Interviews
N.R [Not Required] Untabulated-Data
.
Break-down of costs by telephone charge, computer use, and service charges
Sec/PrimaryEstimate
ITU Bulletins ISPs Telecenters &
Internet Cafes
Tel. Survey/Enquiry Sample Survey Desk Research FtF Interviews
N.R [Not Required] Untabulated-Data
.
15
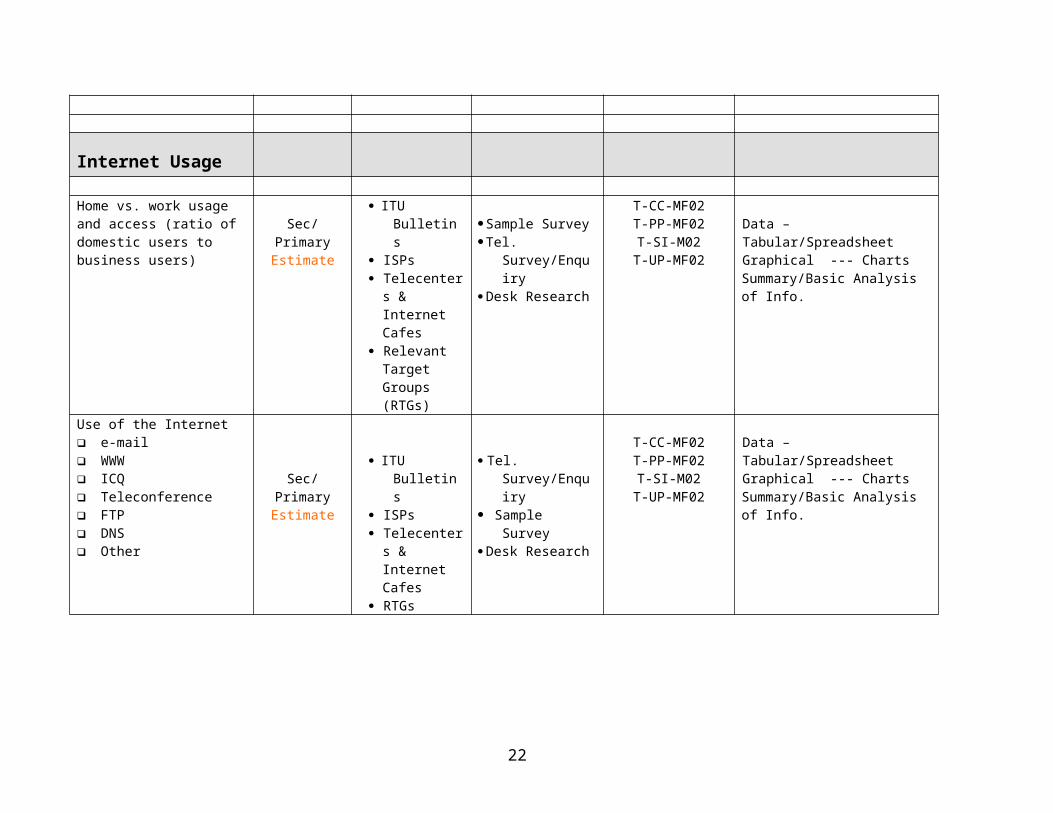
Internet Usage
Home vs. work usage and access (ratio of domestic users to business users)
Sec/PrimaryEstimate
ITU Bulletins ISPs Telecenters &
Internet Cafes Relevant
Target Groups (RTGs)
Sample SurveyTel. Survey/Enquiry Desk Research
T-CC-MF02T-PP-MF02T-SI-M02
T-UP-MF02
Data – Tabular/SpreadsheetGraphical --- ChartsSummary/Basic Analysis of Info.
Use of the Internet e-mail WWW ICQ Teleconference FTP DNS Other
Sec/PrimaryEstimate
ITU Bulletins ISPs Telecenters &
Internet Cafes RTGs
Tel. Survey/Enquiry Sample Survey Desk Research
T-CC-MF02T-PP-MF02T-SI-M02
T-UP-MF02
Data – Tabular/SpreadsheetGraphical --- ChartsSummary/Basic Analysis of Info.
16
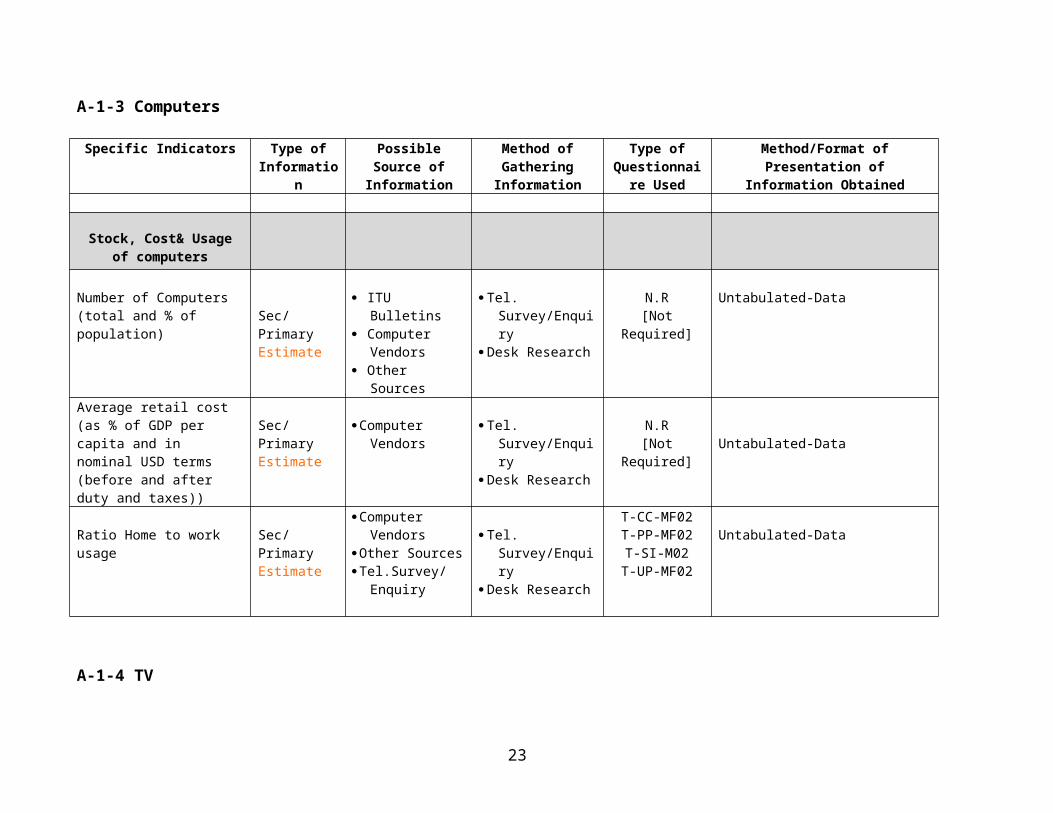
A-1-3 Computers
Specific Indicators Type of Information
Possible Source of Information
Method of Gathering
Information
Type of Questionnaire
Used
Method/Format of Presentation of Information Obtained
Stock, Cost& Usage of computers
Number of Computers (total and % of population) Sec/Primary
Estimate
ITU Bulletins Computer Vendors Other Sources
Tel. Survey/Enquiry Desk Research
N.R [Not Required]
Untabulated-Data
Average retail cost (as % of GDP per capita and in nominal USD terms (before and after duty and taxes))
Sec/PrimaryEstimate
Computer Vendors Tel. Survey/Enquiry Desk Research
N.R [Not Required] Untabulated-Data
Ratio Home to work usage Sec/PrimaryEstimate
Computer VendorsOther SourcesTel.Survey/Enquiry
Tel. Survey/Enquiry Desk Research
T-CC-MF02T-PP-MF02T-SI-M02
T-UP-MF02
Untabulated-Data
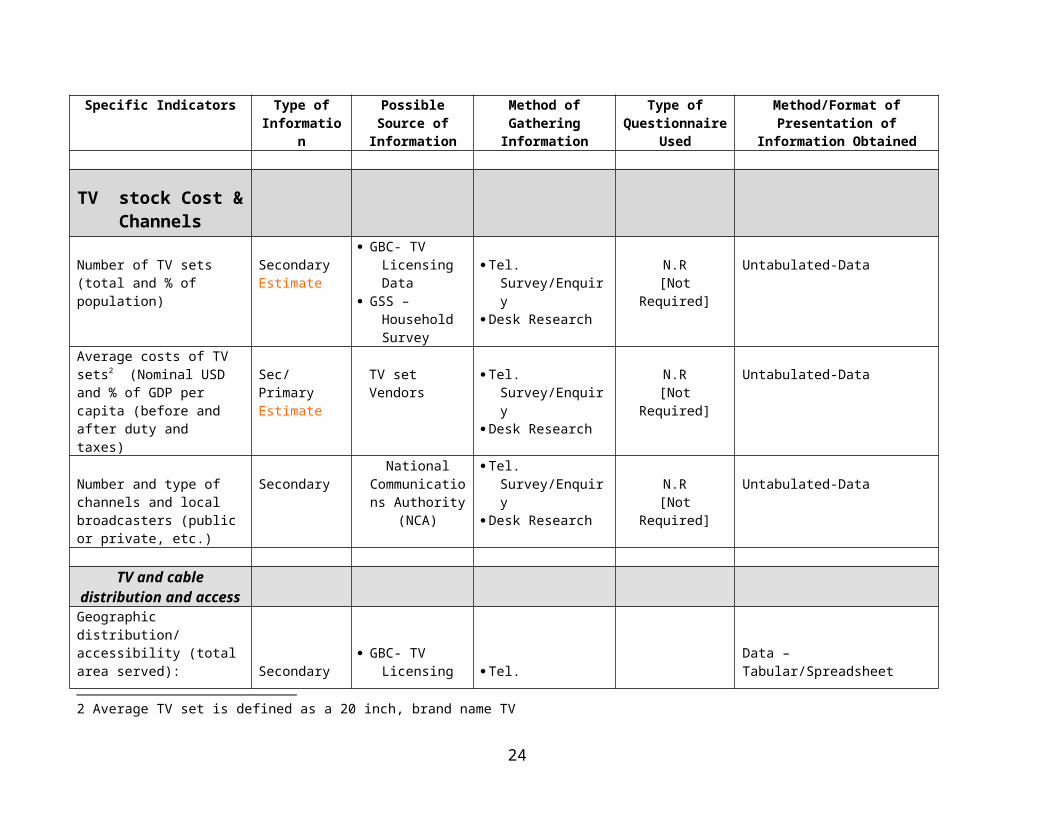
A-1-4 TV
Specific Indicators Type of Information
Possible Source of Information
Method of Gathering Information
Type of Questionnaire
Used
Method/Format of Presentation of Information Obtained
TV stock Cost & Channels
Number of TV sets (total and % of population)
SecondaryEstimate
GBC- TV Licensing Data
GSS – Household Survey
Tel. Survey/Enquiry Desk Research
N.R [Not Required]
Untabulated-Data
Average costs of TV sets2
17
(Nominal USD and % of GDP per capita (before and after duty and taxes)
Sec/PrimaryEstimate
TV set Vendors Tel. Survey/Enquiry Desk Research
N.R [Not Required]
Untabulated-Data
Number and type of channels and local broadcasters (public or private, etc.)
SecondaryNational
Communications Authority (NCA)
Tel. Survey/Enquiry Desk Research N.R
[Not Required]Untabulated-Data
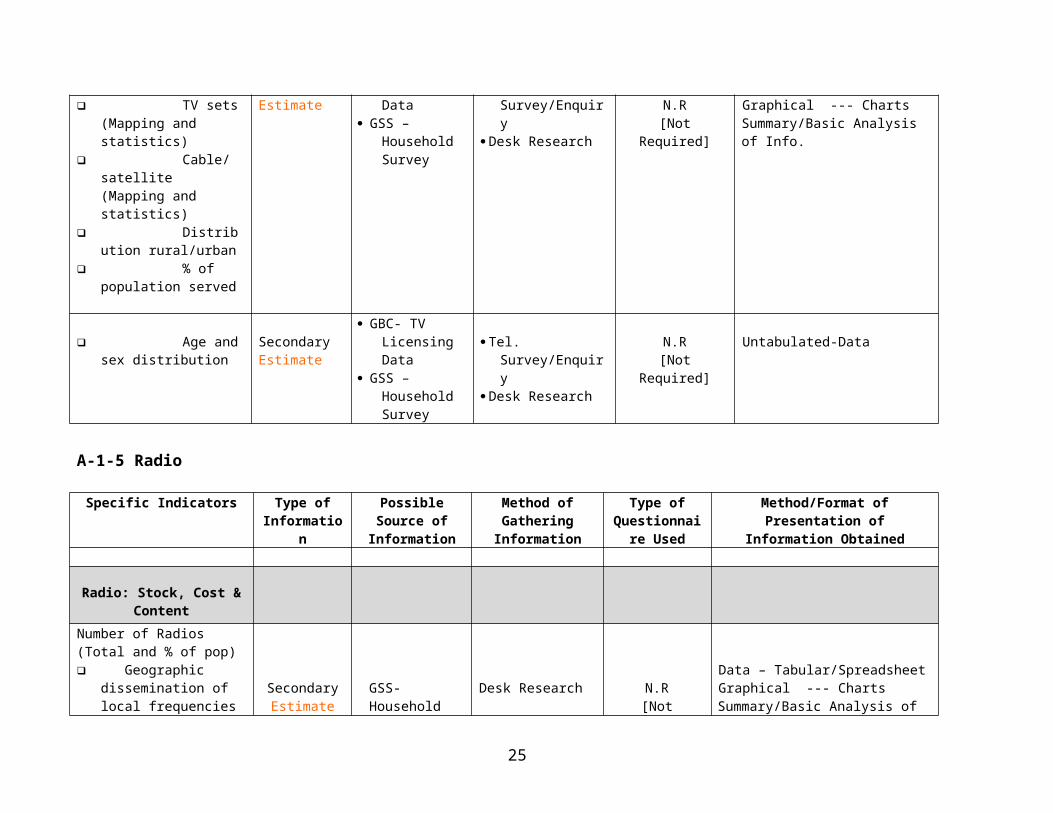
TV and cable distribution and access
Geographic distribution/ accessibility (total area served):
TV sets (Mapping and statistics)
Cable/satellite (Mapping and statistics)
Distribution rural/urban
% of population served
SecondaryEstimate
GBC- TV Licensing Data
GSS – Household Survey
Tel. Survey/Enquiry Desk Research N.R
[Not Required]
Data – Tabular/SpreadsheetGraphical --- ChartsSummary/Basic Analysis of Info.
Age and sex distribution
SecondaryEstimate
GBC- TV Licensing Data
GSS – Household Survey
Tel. Survey/Enquiry Desk Research
N.R [Not Required]
Untabulated-Data
A-1-5 Radio
Specific Indicators Type of Information
Possible Source of Information
Method of Gathering
Information
Type of Questionnaire
Used
Method/Format of Presentation of Information Obtained
2 Average TV set is defined as a 20 inch, brand name TV
18
Radio: Stock, Cost & Content
Number of Radios (Total and % of pop) Geographic
dissemination of local frequencies (Mapping and statistics)
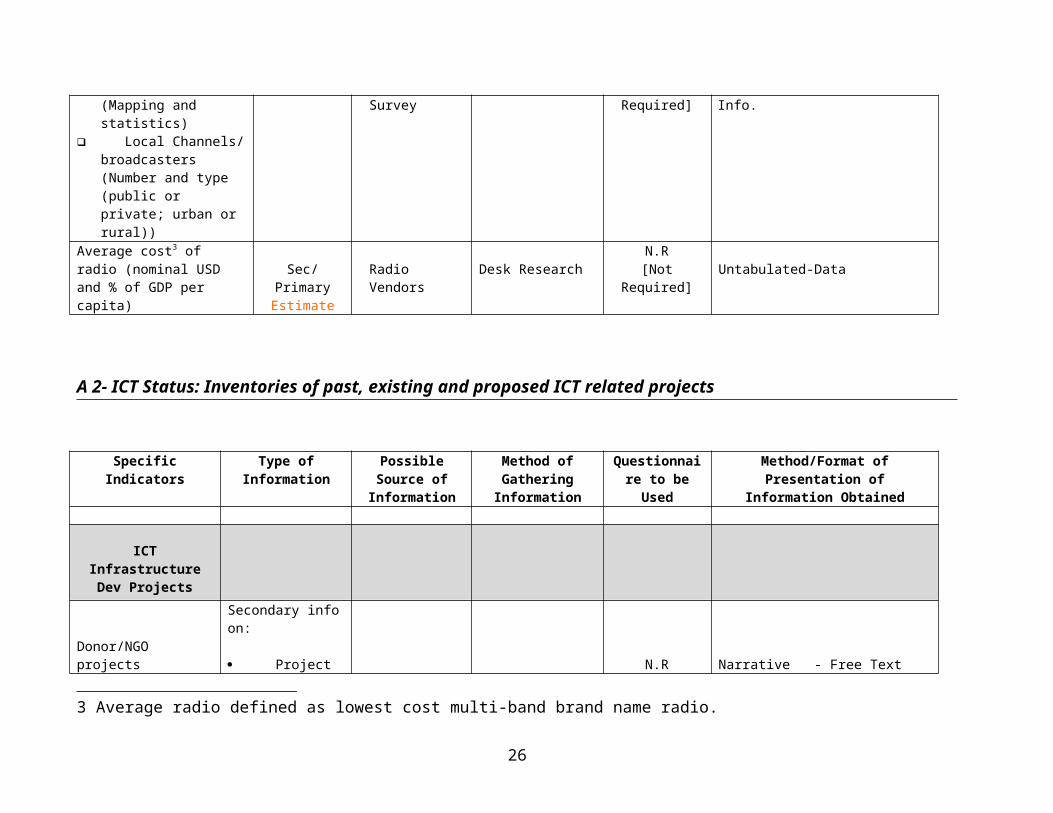
Local Channels/ broadcasters (Number and type (public or private; urban or rural))
SecondaryEstimate
GSS- Household Survey
Desk Research N.R [Not Required]
Data – Tabular/SpreadsheetGraphical --- ChartsSummary/Basic Analysis of Info.
Average cost3 of radio (nominal USD and % of GDP per capita)
Sec/PrimaryEstimate
Radio Vendors Desk ResearchN.R
[Not Required] Untabulated-Data
A 2- ICT Status: Inventories of past, existing and proposed ICT related projects
Specific Indicators Type of Information Possible Source of Information
Method of Gathering
Information
Questionnaire to be Used
Method/Format of Presentation of Information Obtained
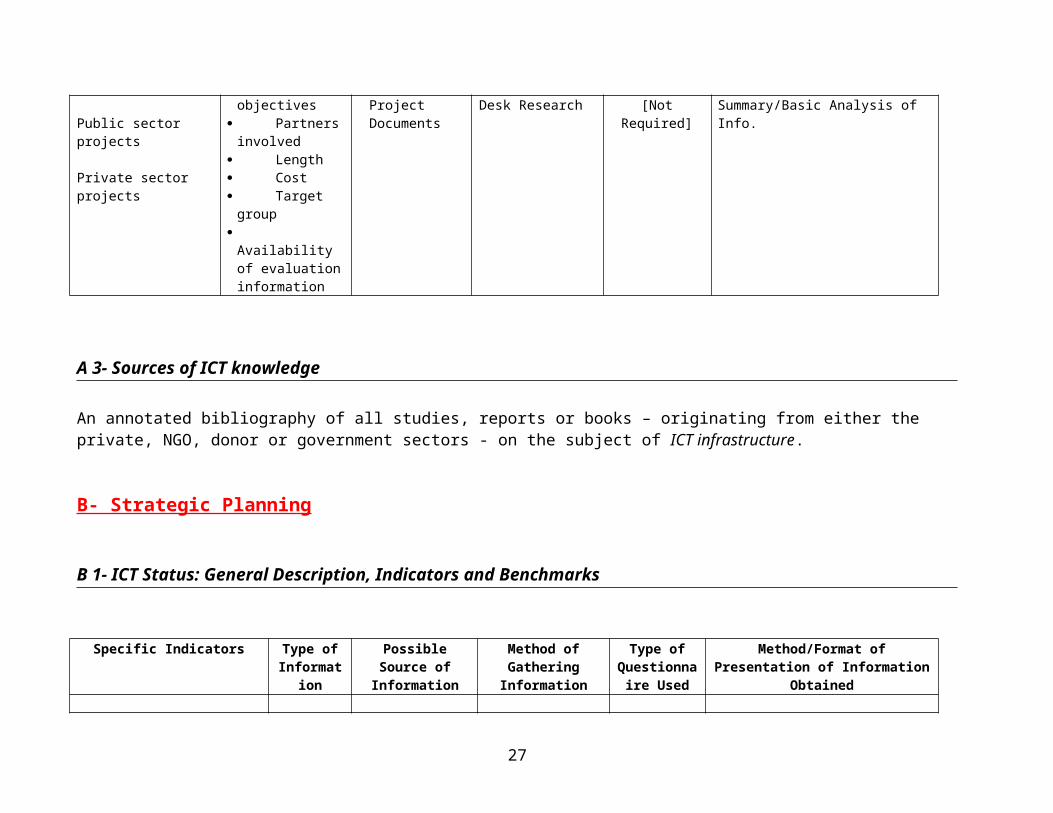
ICT Infrastructure Dev Projects
Donor/NGO projects
Public sector projects
Private sector projects
Secondary info on:
Project objectives
Partners involved
Length
Project Documents
Desk ResearchN.R
[Not Required]Narrative - Free TextSummary/Basic Analysis of Info.
3 Average radio defined as lowest cost multi-band brand name radio.
19
Cost Target group Availability
of evaluation information
A 3- Sources of ICT knowledge
An annotated bibliography of all studies, reports or books – originating from either the private, NGO, donor or government sectors - on the subject of ICT infrastructure.
B- Strategic Planning
B 1- ICT Status: General Description, Indicators and Benchmarks
Specific Indicators Type of Information
Possible Source of Information
Method of Gathering
Information
Type of Questionnaire
Used
Method/Format of Presentation of Information Obtained
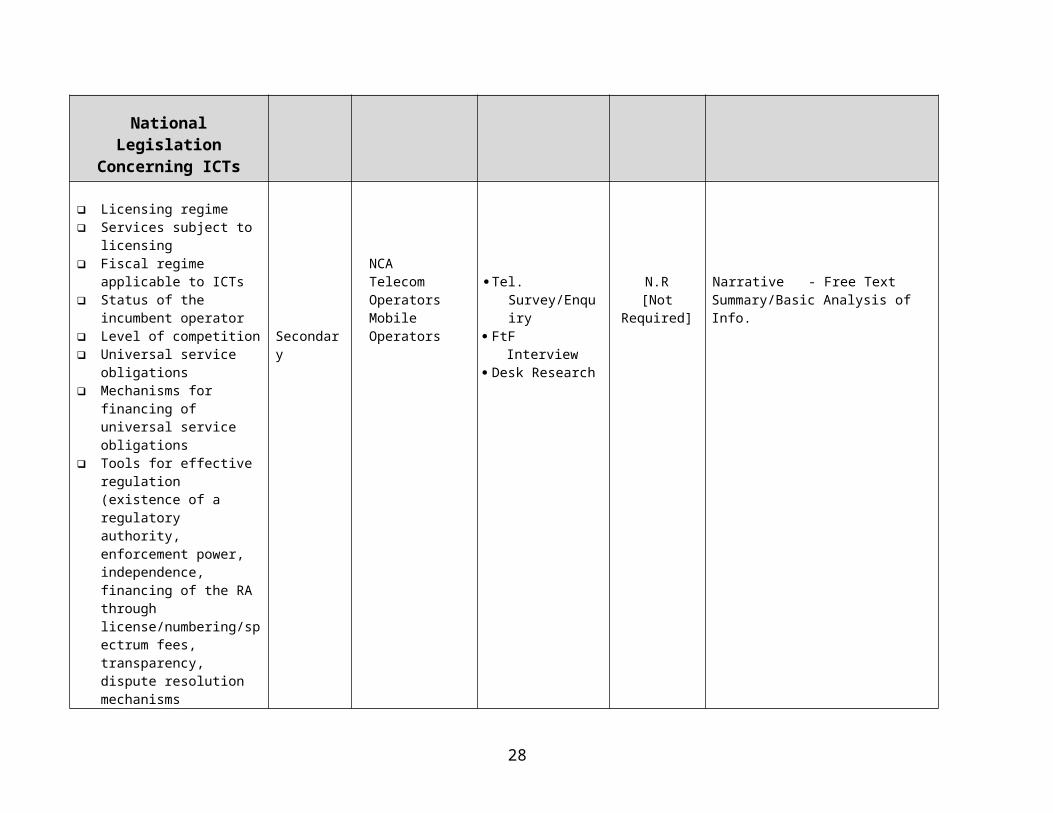
National Legislation Concerning ICTs
Licensing regime Services subject to licensing Fiscal regime applicable to
ICTs Status of the incumbent
operator Level of competition
NCATelecom OperatorsMobile Operators
Tel. Survey/Enquiry FtF Interview Desk Research
N.R [Not Required]
Narrative - Free TextSummary/Basic Analysis of Info.
20
Universal service obligations Mechanisms for financing of
universal service obligations Tools for effective regulation
(existence of a regulatory authority, enforcement power, independence, financing of the RA through license/numbering/spectrum fees, transparency, dispute resolution mechanisms
Secondary
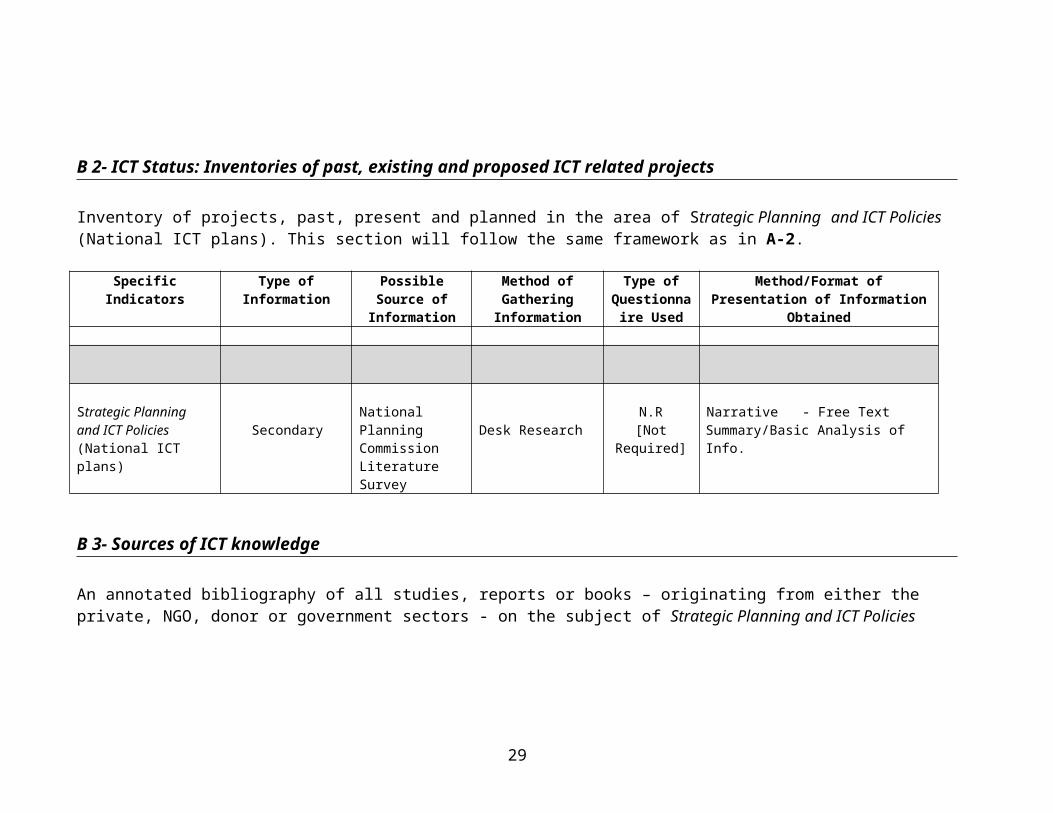
B 2- ICT Status: Inventories of past, existing and proposed ICT related projects
Inventory of projects, past, present and planned in the area of Strategic Planning and ICT Policies (National ICT plans). This section will follow the same framework as in A-2.
Specific Indicators Type of Information Possible Source of Information
Method of Gathering
Information
Type of Questionnaire
Used
Method/Format of Presentation of Information Obtained
Strategic Planning and ICT Policies (National ICT plans)
Secondary National Planning CommissionLiterature Survey
Desk ResearchN.R
[Not Required]Narrative - Free TextSummary/Basic Analysis of Info.
B 3- Sources of ICT knowledge
An annotated bibliography of all studies, reports or books – originating from either the private, NGO, donor or government sectors - on the subject of Strategic Planning and ICT Policies
21
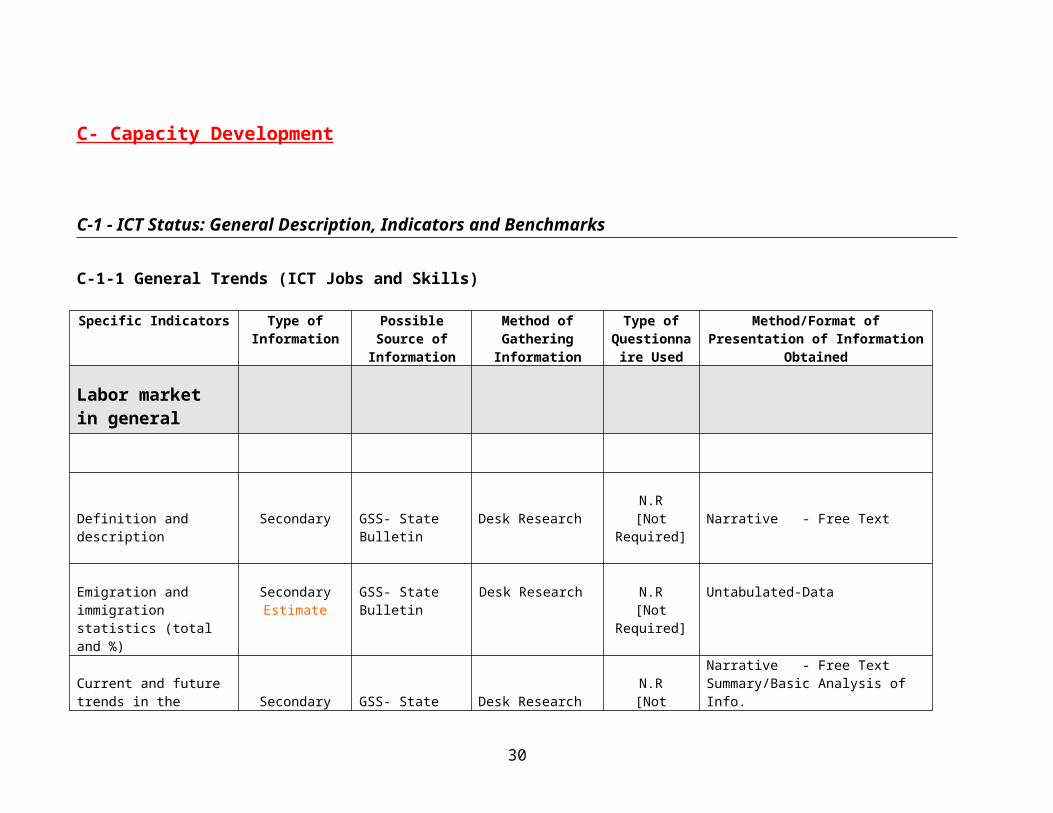
C- Capacity Development
C-1 - ICT Status: General Description, Indicators and Benchmarks
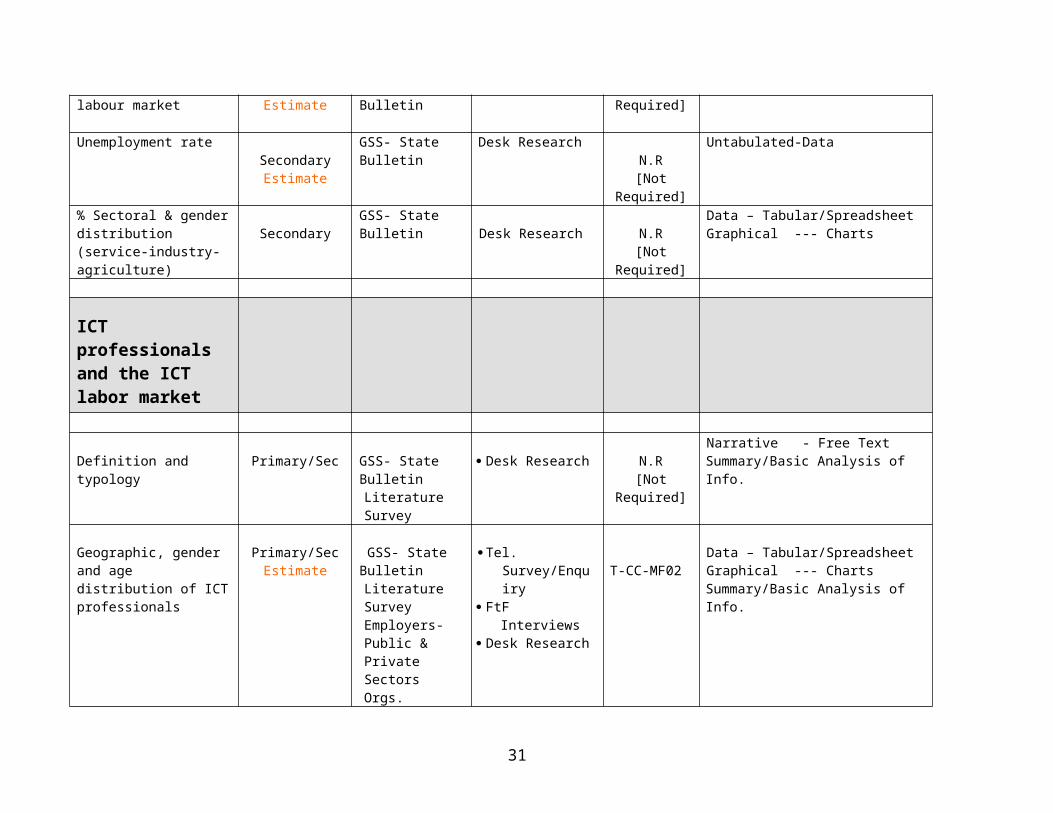
C-1-1 General Trends (ICT Jobs and Skills)
Specific Indicators Type of Information
Possible Source of Information
Method of Gathering
Information
Type of Questionnaire
Used
Method/Format of Presentation of Information Obtained
Labor market in general
Definition and description Secondary GSS- State Bulletin Desk ResearchN.R
[Not Required] Narrative - Free Text
Emigration and immigration statistics (total and %)
SecondaryEstimate
GSS- State Bulletin Desk Research N.R [Not Required]
Untabulated-Data
Current and future trends in the labour market Secondary
EstimateGSS- State Bulletin Desk Research
N.R [Not Required]
Narrative - Free TextSummary/Basic Analysis of Info.
Unemployment rateSecondaryEstimate
GSS- State Bulletin Desk ResearchN.R
[Not Required]
Untabulated-Data
% Sectoral & gender distribution (service-industry-agriculture)
SecondaryGSS- State Bulletin
Desk Research N.R [Not Required]
Data – Tabular/SpreadsheetGraphical --- Charts
22
ICT professionals and the ICT labor market
Definition and typology Primary/Sec GSS- State BulletinLiterature Survey
Desk Research N.R [Not Required]
Narrative - Free TextSummary/Basic Analysis of Info.
Geographic, gender and age distribution of ICT professionals
Primary/SecEstimate
GSS- State BulletinLiterature SurveyEmployers-Public & Private Sectors Orgs.
Tel. Survey/Enquiry FtF Interviews Desk Research
T-CC-MF02Data – Tabular/SpreadsheetGraphical --- ChartsSummary/Basic Analysis of Info.
Description of ICT professional associations Primary/Sec
Literature Survey
Tel. Survey/Enquiry FtF Interviews Desk Research
N.R [Not Required]
Narrative - Free Text
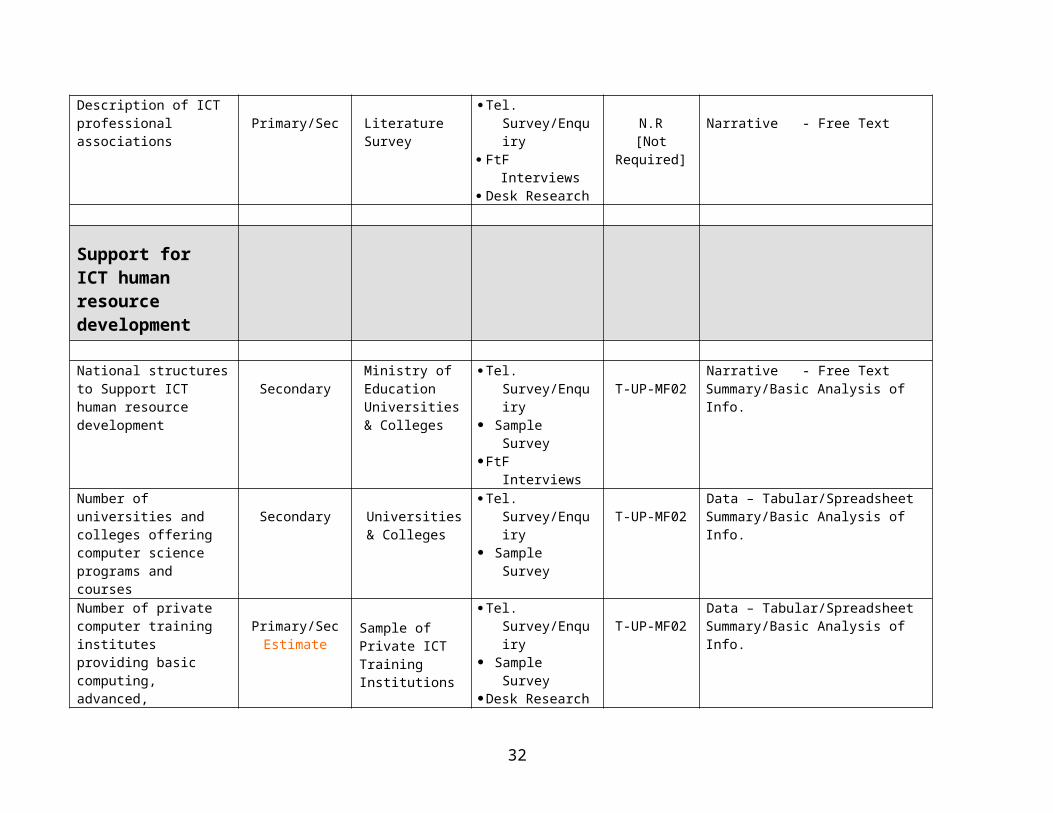
Support for ICT human resource development
National structures to Support ICT human resource development
SecondaryMinistry of EducationUniversities & Colleges
Tel. Survey/Enquiry Sample SurveyFtF Interviews
T-UP-MF02Narrative - Free TextSummary/Basic Analysis of Info.
Number of universities and colleges offering computer science programs and courses
Secondary Universities & Colleges
Tel. Survey/Enquiry Sample Survey T-UP-MF02
Data – Tabular/SpreadsheetSummary/Basic Analysis of Info.
Number of private computer training institutes providing basic computing, advanced, certificate or diploma
Primary/SecEstimate
Sample of Private ICT Training Institutions
Tel. Survey/Enquiry Sample SurveyDesk Research
T-UP-MF02Data – Tabular/SpreadsheetSummary/Basic Analysis of Info.
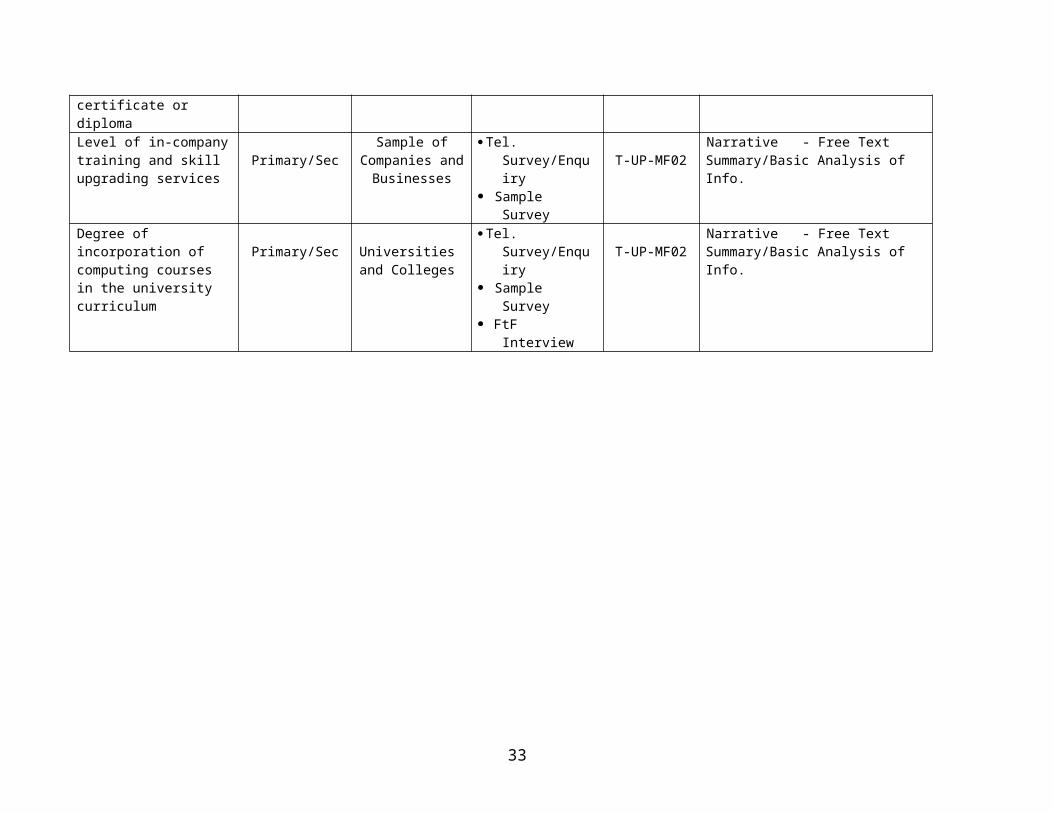
Level of in-company Sample of Tel. Survey/Enquiry Narrative - Free Text
23
training and skill upgrading services
Primary/Sec Companies and Businesses
Sample Survey T-UP-MF02 Summary/Basic Analysis of Info.
Degree of incorporation of computing courses in the university curriculum
Primary/Sec Universities and Colleges
Tel. Survey/Enquiry Sample Survey FtF Interview
T-UP-MF02Narrative - Free TextSummary/Basic Analysis of Info.
24
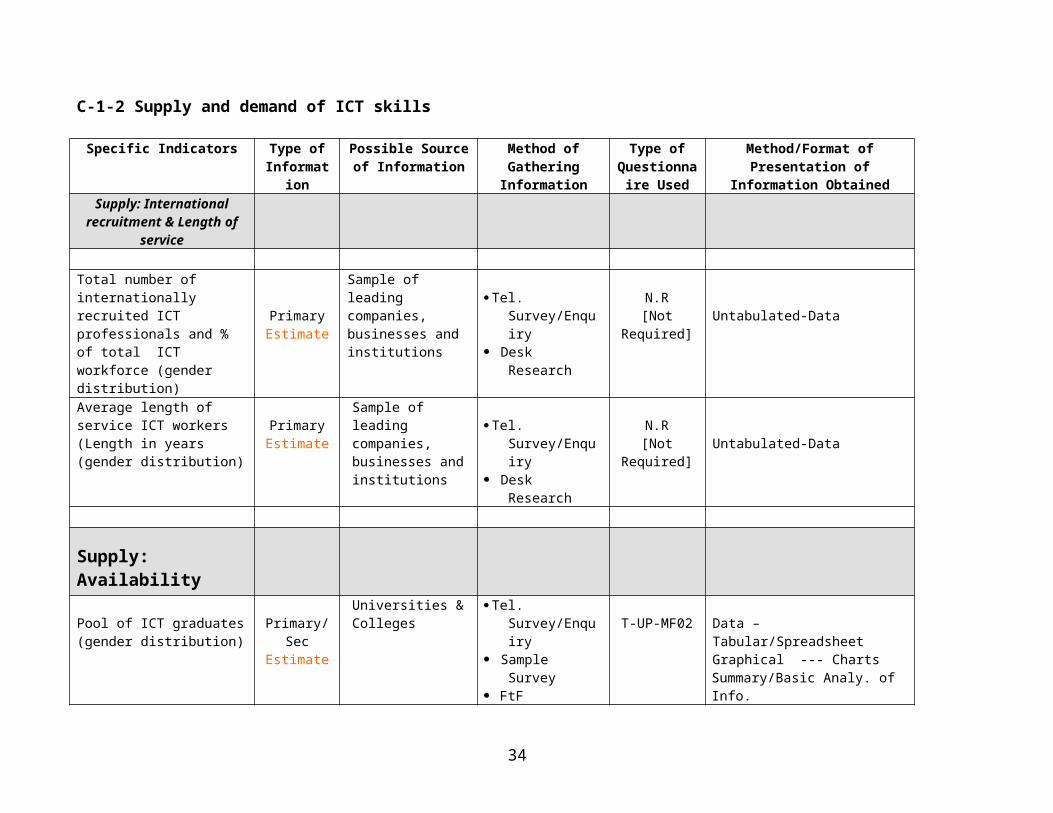
C-1-2 Supply and demand of ICT skills
Specific Indicators Type of Information
Possible Source of Information
Method of Gathering
Information
Type of Questionnaire
Used
Method/Format of Presentation of Information Obtained
Supply: International recruitment & Length of
service
Total number of internationally recruited ICT professionals and % of total ICT workforce (gender distribution)
PrimaryEstimate
Sample of leading companies, businesses and institutions
Tel. Survey/Enquiry Desk Research
N.R [Not Required] Untabulated-Data
Average length of service ICT workers (Length in years (gender distribution)
PrimaryEstimate
Sample of leading companies, businesses and institutions
Tel. Survey/Enquiry Desk Research
N.R [Not Required] Untabulated-Data
Supply: Availability
Pool of ICT graduates (gender distribution)
Primary/SecEstimate
Universities & Colleges
Tel. Survey/Enquiry Sample Survey FtF Interview
T-UP-MF02 Data – Tabular/SpreadsheetGraphical --- ChartsSummary/Basic Analy. of Info.
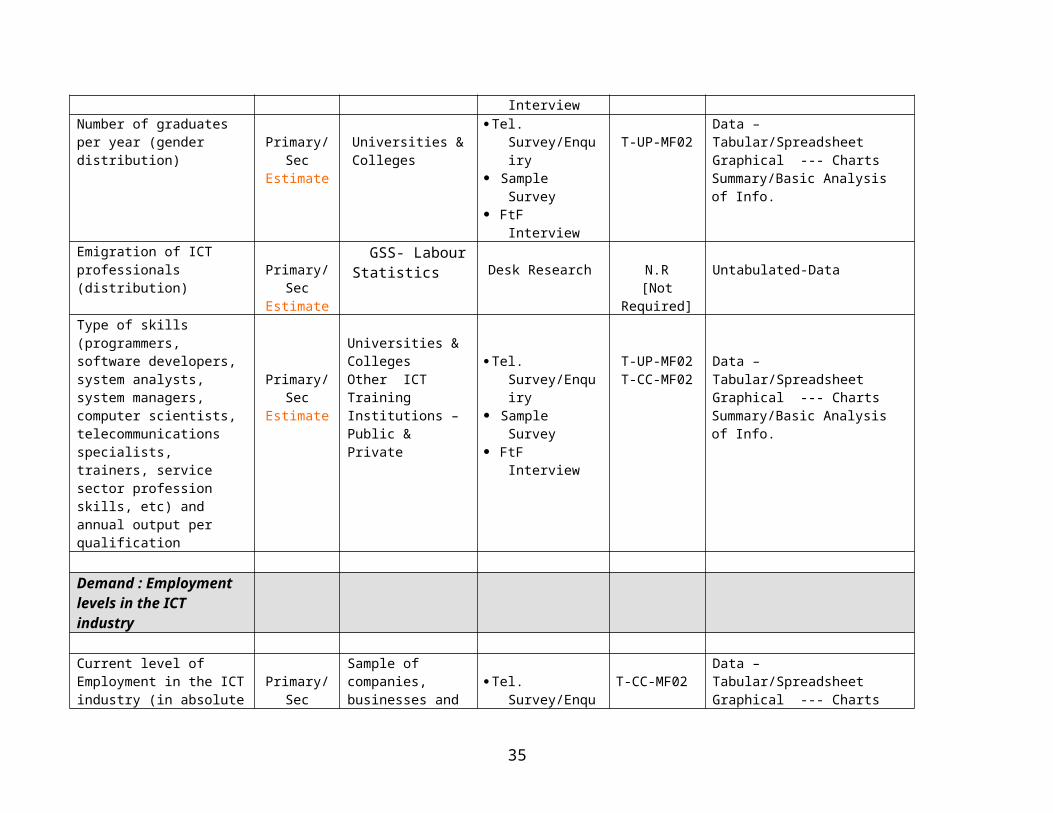
Number of graduates per year (gender distribution) Primary/Sec
EstimateUniversities & Colleges
Tel. Survey/Enquiry Sample Survey FtF Interview
T-UP-MF02Data – Tabular/SpreadsheetGraphical --- ChartsSummary/Basic Analysis of Info.
Emigration of ICT professionals (distribution) Primary/Sec
Estimate
GSS- Labour Statistics Desk Research N.R
[Not Required]Untabulated-Data
Type of skills (programmers, software developers, system analysts, system managers, computer scientists, telecommunications specialists, trainers, service sector profession skills, etc) and annual output per qualification
Primary/SecEstimate
Universities & CollegesOther ICT Training Institutions –Public & Private
Tel. Survey/Enquiry Sample Survey FtF Interview
T-UP-MF02T-CC-MF02
Data – Tabular/SpreadsheetGraphical --- ChartsSummary/Basic Analysis of Info.
25
Demand : Employment levels in the ICT industry
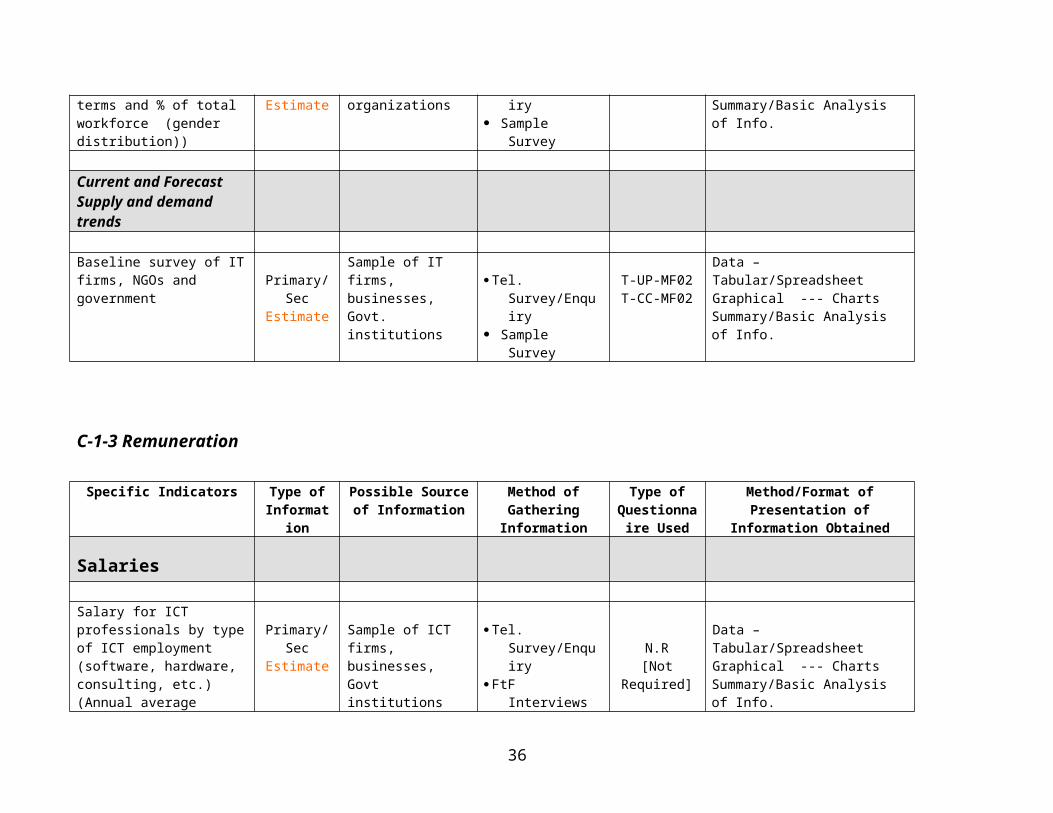
Current level of Employment in the ICT industry (in absolute terms and % of total workforce (gender distribution))
Primary/SecEstimate
Sample of companies, businesses and organizations
Tel. Survey/Enquiry Sample Survey
T-CC-MF02Data – Tabular/SpreadsheetGraphical --- ChartsSummary/Basic Analysis of Info.
Current and Forecast Supply and demand trends
Baseline survey of IT firms, NGOs and government Primary/Sec
Estimate
Sample of IT firms, businesses, Govt. institutions
Tel. Survey/Enquiry Sample Survey
T-UP-MF02T-CC-MF02
Data – Tabular/SpreadsheetGraphical --- ChartsSummary/Basic Analysis of Info.
C-1-3 Remuneration
Specific Indicators Type of Information
Possible Source of Information
Method of Gathering
Information
Type of Questionnaire
Used
Method/Format of Presentation of Information Obtained
Salaries
Salary for ICT professionals by type of ICT employment (software, hardware, consulting, etc.) (Annual average salary rates (USD))
Primary/SecEstimate
Sample of ICT firms, businesses, Govt institutions
Tel. Survey/Enquiry FtF Interviews N.R
[Not Required]
Data – Tabular/SpreadsheetGraphical --- ChartsSummary/Basic Analysis of Info.
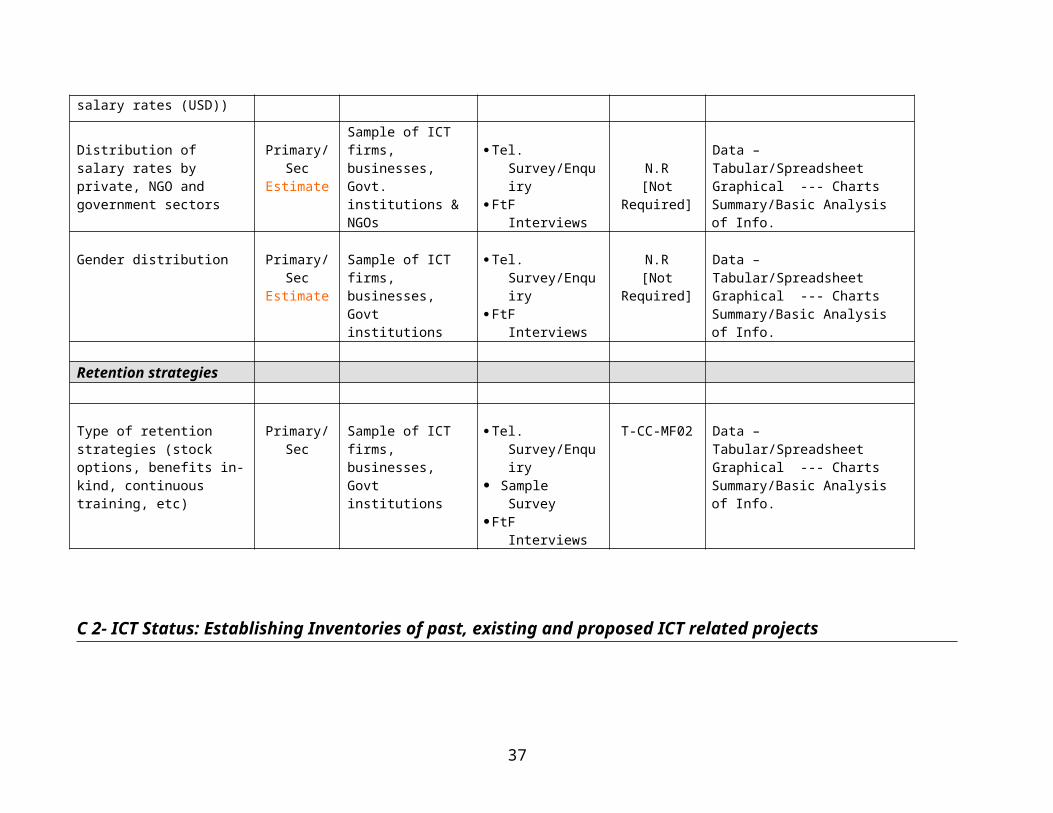
Distribution of salary rates by private, NGO and government sectors
Primary/SecEstimate
Sample of ICT firms, businesses, Govt. institutions & NGOs
Tel. Survey/Enquiry FtF Interviews N.R
[Not Required]
Data – Tabular/SpreadsheetGraphical --- ChartsSummary/Basic Analysis of Info.
26
Gender distribution Primary/SecEstimate
Sample of ICT firms, businesses, Govt institutions
Tel. Survey/Enquiry FtF Interviews
N.R [Not Required]
Data – Tabular/SpreadsheetGraphical --- ChartsSummary/Basic Analysis of Info.
Retention strategies
Type of retention strategies (stock options, benefits in-kind, continuous training, etc)
Primary/Sec Sample of ICT firms, businesses, Govt institutions
Tel. Survey/Enquiry Sample SurveyFtF Interviews
T-CC-MF02 Data – Tabular/SpreadsheetGraphical --- ChartsSummary/Basic Analysis of Info.
C 2- ICT Status: Establishing Inventories of past, existing and proposed ICT related projects
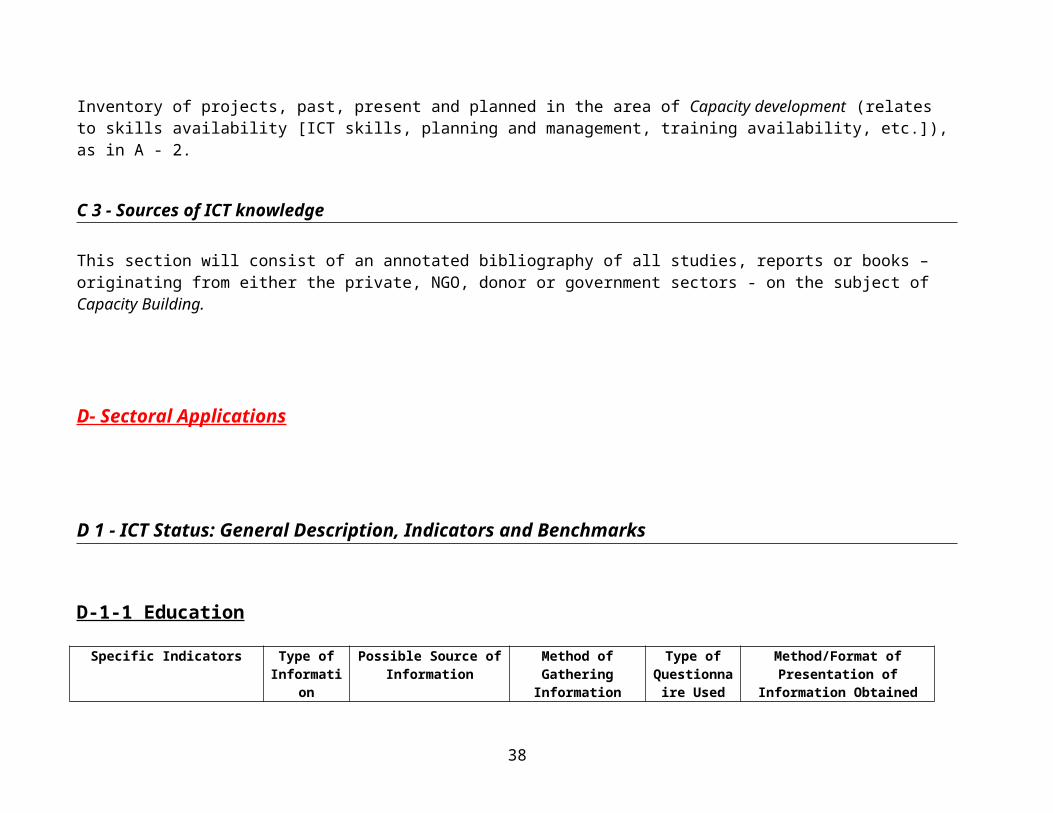
Inventory of projects, past, present and planned in the area of Capacity development (relates to skills availability [ICT skills, planning and management, training availability, etc.]), as in A - 2.
C 3 - Sources of ICT knowledge
This section will consist of an annotated bibliography of all studies, reports or books – originating from either the private, NGO, donor or government sectors - on the subject of Capacity Building.
D- Sectoral Applications
D 1 - ICT Status: General Description, Indicators and Benchmarks
27
D-1-1 Education
Specific Indicators Type of Information
Possible Source of Information
Method of Gathering Information
Type of Questionnaire
Used
Method/Format of Presentation of Information
Obtained
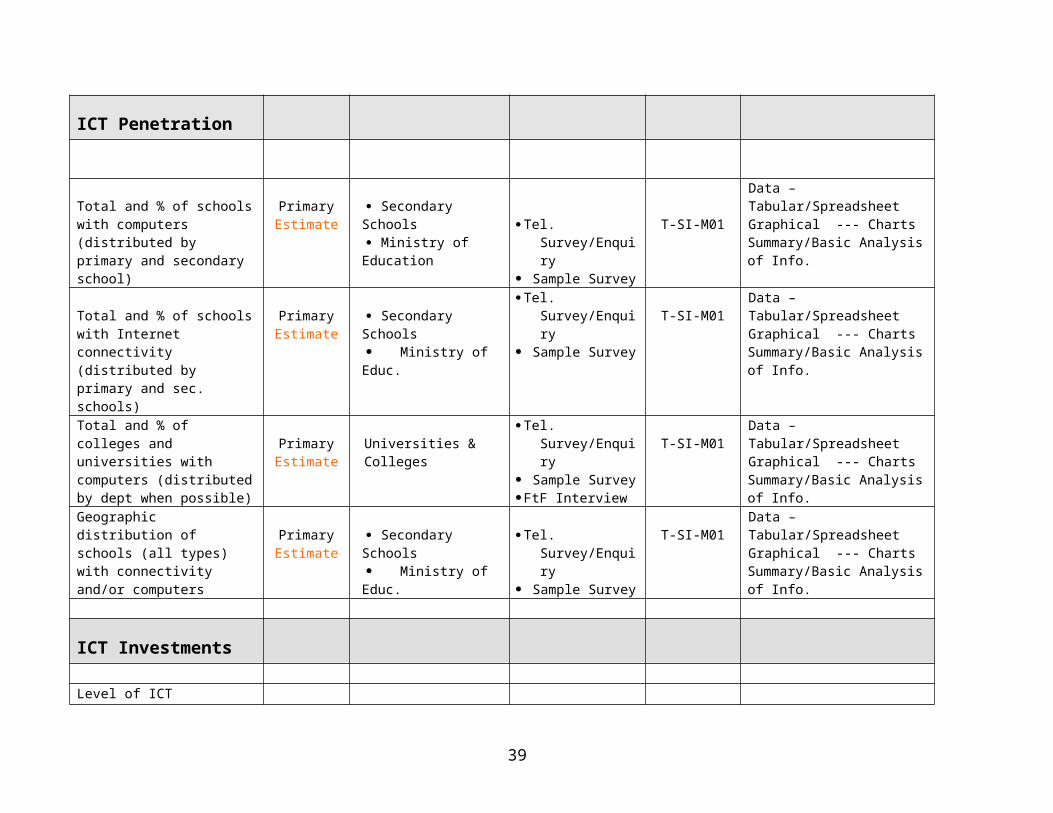
ICT Penetration
Total and % of schools with computers (distributed by primary and secondary school)
PrimaryEstimate
Secondary Schools Ministry of Education Tel. Survey/Enquiry
Sample SurveyT-SI-M01
Data – Tabular/SpreadsheetGraphical --- ChartsSummary/Basic Analysis of Info.
Total and % of schools with Internet connectivity (distributed by primary and sec. schools)
PrimaryEstimate
Secondary Schools Ministry of Educ.
Tel. Survey/Enquiry Sample Survey T-SI-M01
Data – Tabular/SpreadsheetGraphical --- ChartsSummary/Basic Analysis of Info.
Total and % of colleges and universities with computers (distributed by dept when possible)
PrimaryEstimate
Universities & Colleges Tel. Survey/Enquiry Sample SurveyFtF Interview
T-SI-M01Data – Tabular/SpreadsheetGraphical --- ChartsSummary/Basic Analysis of Info.
Geographic distribution of schools (all types) with connectivity and/or computers
PrimaryEstimate
Secondary Schools Ministry of Educ.
Tel. Survey/Enquiry Sample Survey
T-SI-M01Data – Tabular/SpreadsheetGraphical --- ChartsSummary/Basic Analysis of Info.
ICT Investments
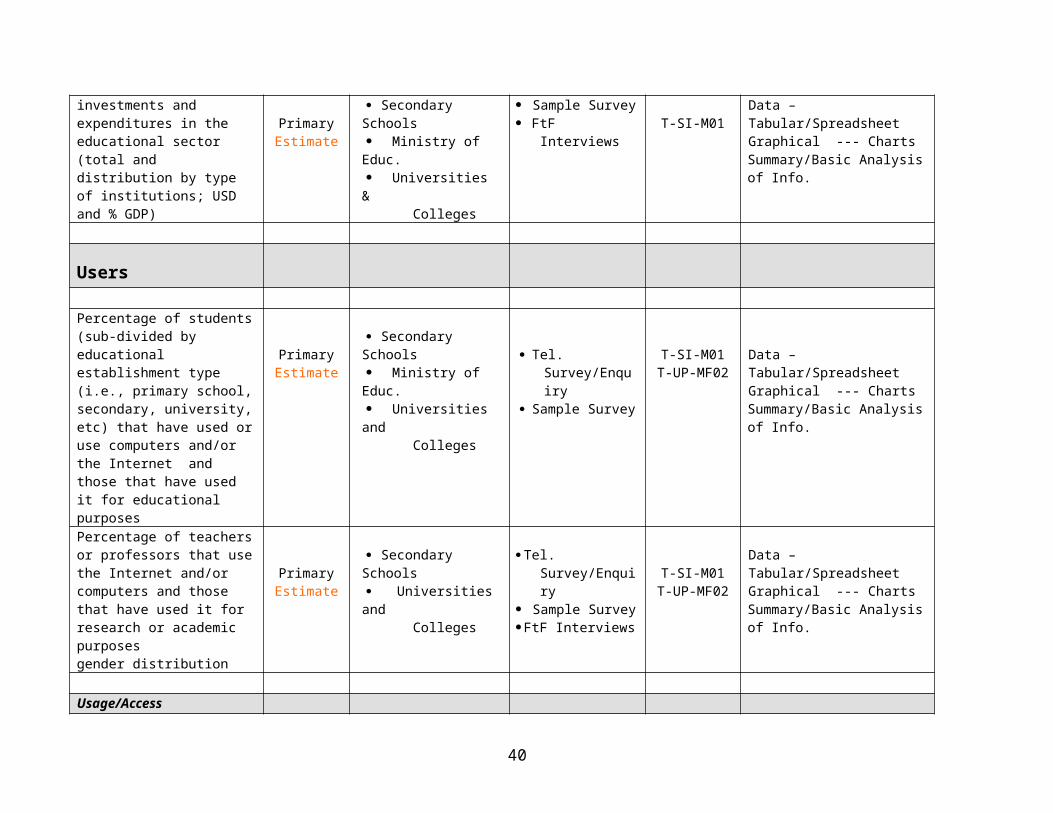
Level of ICT investments and expenditures in the educational sector (total and distribution by type of institutions; USD and % GDP)
PrimaryEstimate
Secondary Schools Ministry of Educ. Universities &
Colleges
Sample Survey FtF Interviews T-SI-M01
Data – Tabular/SpreadsheetGraphical --- ChartsSummary/Basic Analysis of Info.
28
Users
Percentage of students (sub-divided by educational establishment type (i.e., primary school, secondary, university, etc) that have used or use computers and/or the Internet and those that have used it for educational purposes
PrimaryEstimate
Secondary Schools Ministry of Educ. Universities and
Colleges
Tel. Survey/Enquiry
Sample Survey
T-SI-M01T-UP-MF02
Data – Tabular/SpreadsheetGraphical --- ChartsSummary/Basic Analysis of Info.
Percentage of teachers or professors that use the Internet and/or computers and those that have used it for research or academic purposesgender distribution
PrimaryEstimate
Secondary Schools Universities and
Colleges
Tel. Survey/Enquiry Sample SurveyFtF Interviews
T-SI-M01T-UP-MF02
Data – Tabular/SpreadsheetGraphical --- ChartsSummary/Basic Analysis of Info.
Usage/Access
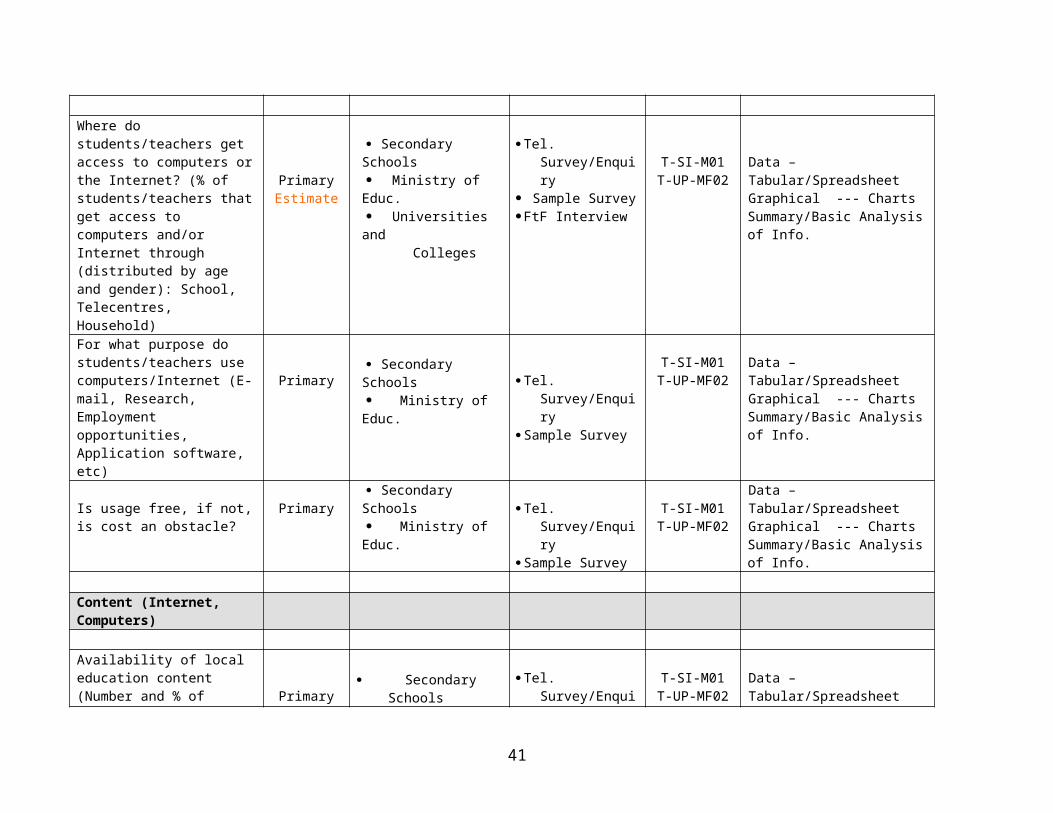
Where do students/teachers get access to computers or the Internet? (% of students/teachers that get access to computers and/or Internet through (distributed by age and gender): School, Telecentres, Household)
PrimaryEstimate
Secondary Schools Ministry of Educ. Universities and
Colleges
Tel. Survey/Enquiry Sample SurveyFtF Interview
T-SI-M01T-UP-MF02
Data – Tabular/SpreadsheetGraphical --- ChartsSummary/Basic Analysis of Info.
For what purpose do students/teachers use computers/Internet (E-mail, Research, Employment opportunities, Application software, etc)
Primary Secondary Schools Ministry of Educ. Tel. Survey/Enquiry
Sample Survey
T-SI-M01T-UP-MF02
Data – Tabular/SpreadsheetGraphical --- ChartsSummary/Basic Analysis of Info.
Is usage free, if not, is cost an obstacle?
Primary Secondary Schools Ministry of Educ. Tel. Survey/Enquiry
Sample SurveyT-SI-M01
T-UP-MF02
Data – Tabular/SpreadsheetGraphical --- ChartsSummary/Basic Analysis of Info.
29
Content (Internet, Computers)
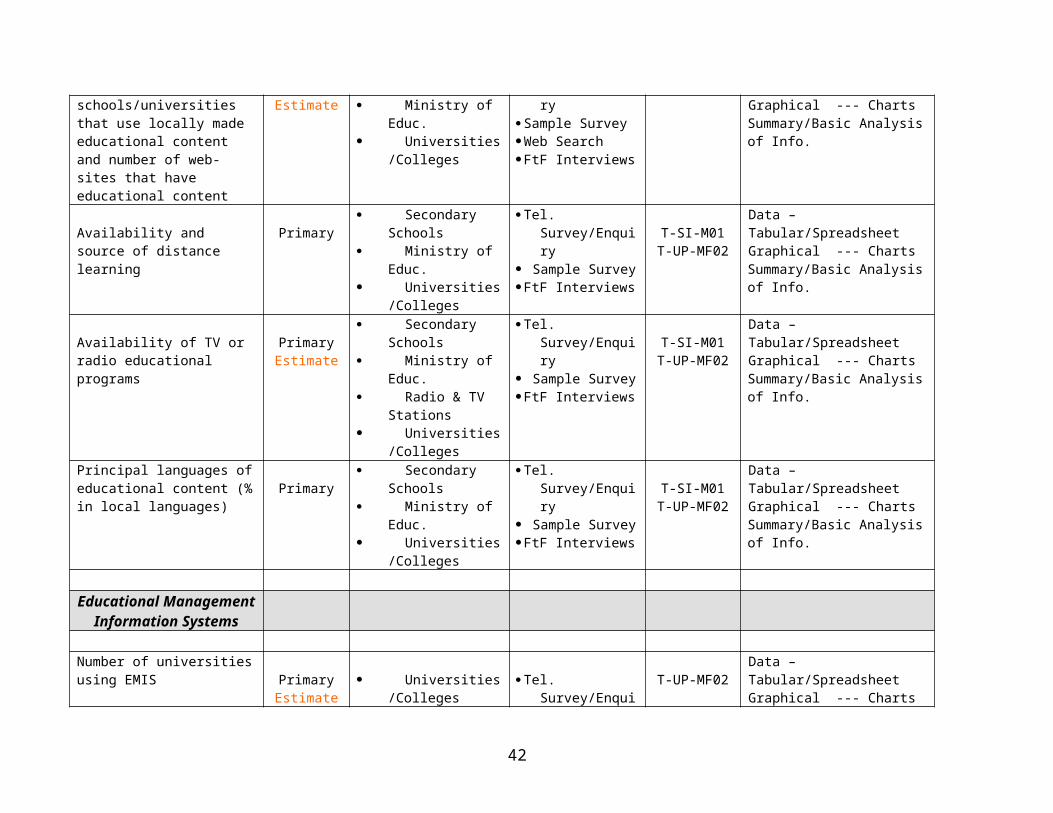
Availability of local education content (Number and % of schools/universities that use locally made educational content and number of web-sites that have educational content
PrimaryEstimate
Secondary Schools
Ministry of Educ. Universities/
Colleges
Tel. Survey/Enquiry Sample SurveyWeb SearchFtF Interviews
T-SI-M01T-UP-MF02
Data – Tabular/SpreadsheetGraphical --- ChartsSummary/Basic Analysis of Info.
Availability and source of distance learning
Primary Secondary
Schools Ministry of Educ. Universities/
Colleges
Tel. Survey/Enquiry Sample SurveyFtF Interviews
T-SI-M01T-UP-MF02
Data – Tabular/SpreadsheetGraphical --- ChartsSummary/Basic Analysis of Info.
Availability of TV or radio educational programs
PrimaryEstimate
Secondary Schools
Ministry of Educ. Radio & TV
Stations Universities/
Colleges
Tel. Survey/Enquiry Sample SurveyFtF Interviews
T-SI-M01T-UP-MF02
Data – Tabular/SpreadsheetGraphical --- ChartsSummary/Basic Analysis of Info.
Principal languages of educational content (% in local languages)
Primary Secondary
Schools Ministry of Educ. Universities/
Colleges
Tel. Survey/Enquiry Sample SurveyFtF Interviews
T-SI-M01T-UP-MF02
Data – Tabular/SpreadsheetGraphical --- ChartsSummary/Basic Analysis of Info.
Educational Management Information Systems
Number of universities using EMIS Primary
Estimate Universities/
Colleges Tel. Survey/Enquiry Sample SurveyFtF Interviews
T-UP-MF02Data – Tabular/SpreadsheetGraphical --- ChartsSummary/Basic Analysis of Info.
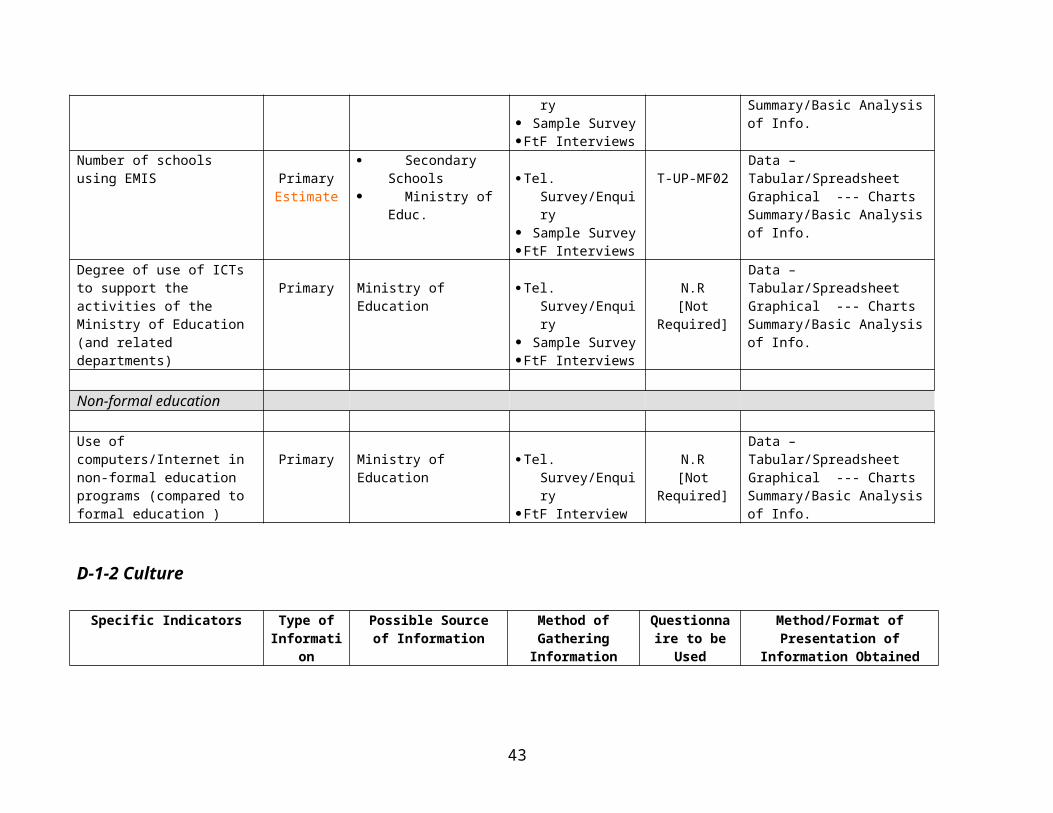
Number of schools using EMISPrimaryEstimate
Secondary Schools
Ministry of Educ. Tel. Survey/Enquiry Sample SurveyFtF Interviews
T-UP-MF02Data – Tabular/SpreadsheetGraphical --- ChartsSummary/Basic Analysis of Info.
Degree of use of ICTs to support the activities of the Ministry of Primary Ministry of Education Tel. Survey/Enquiry N.R
Data – Tabular/SpreadsheetGraphical --- Charts
30
Education (and related departments)
Sample SurveyFtF Interviews
[Not Required] Summary/Basic Analysis of Info.
Non-formal education
Use of computers/Internet in non-formal education programs (compared to formal education )
Primary Ministry of Education Tel. Survey/EnquiryFtF Interview
N.R [Not Required]
Data – Tabular/SpreadsheetGraphical --- ChartsSummary/Basic Analysis of Info.
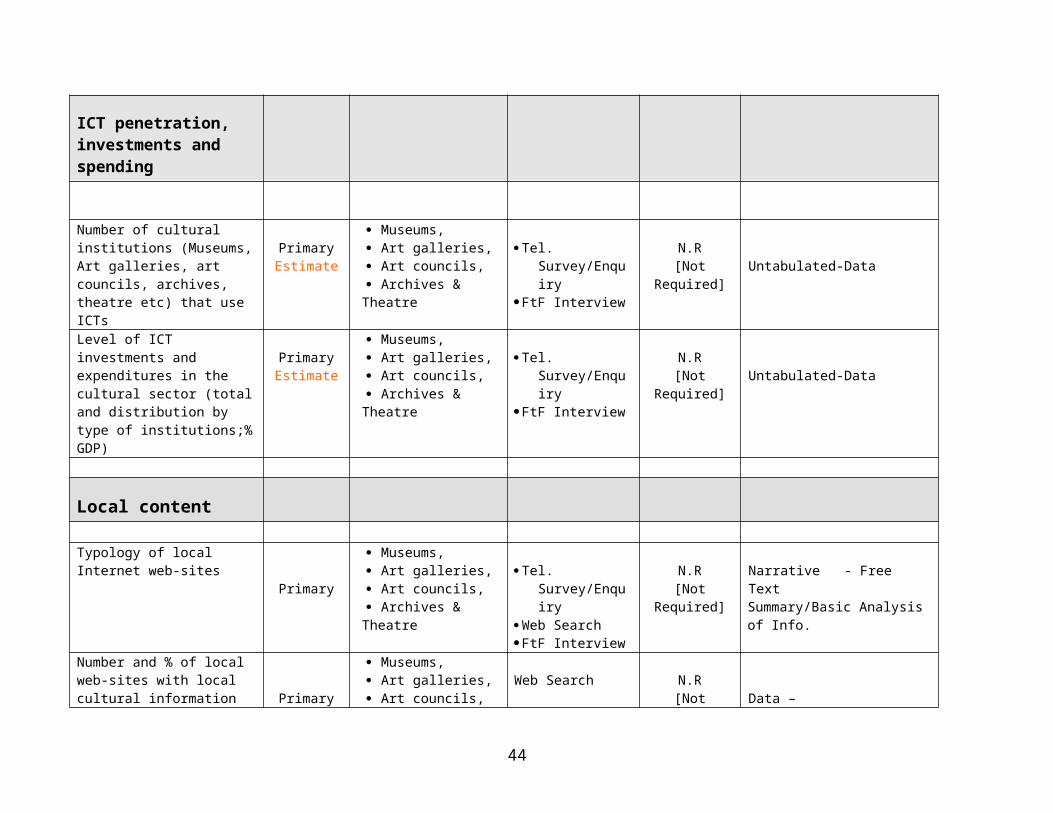
D-1-2 Culture
Specific Indicators Type of Information
Possible Source of Information
Method of Gathering
Information
Questionnaire to be Used
Method/Format of Presentation of Information Obtained
ICT penetration, investments and spending
Number of cultural institutions (Museums, Art galleries, art councils, archives, theatre etc) that use ICTs
PrimaryEstimate
Museums, Art galleries, Art councils, Archives & Theatre
Tel. Survey/EnquiryFtF Interview
N.R [Not Required] Untabulated-Data
Level of ICT investments and expenditures in the cultural sector (total and distribution by type of institutions;% GDP)
PrimaryEstimate
Museums, Art galleries, Art councils, Archives & Theatre
Tel. Survey/EnquiryFtF Interview
N.R [Not Required] Untabulated-Data
Local content
Typology of local Internet web-sites
Primary
Museums, Art galleries, Art councils, Archives & Theatre
Tel. Survey/Enquiry Web SearchFtF Interview
N.R [Not Required]
Narrative - Free TextSummary/Basic Analysis of Info.
31
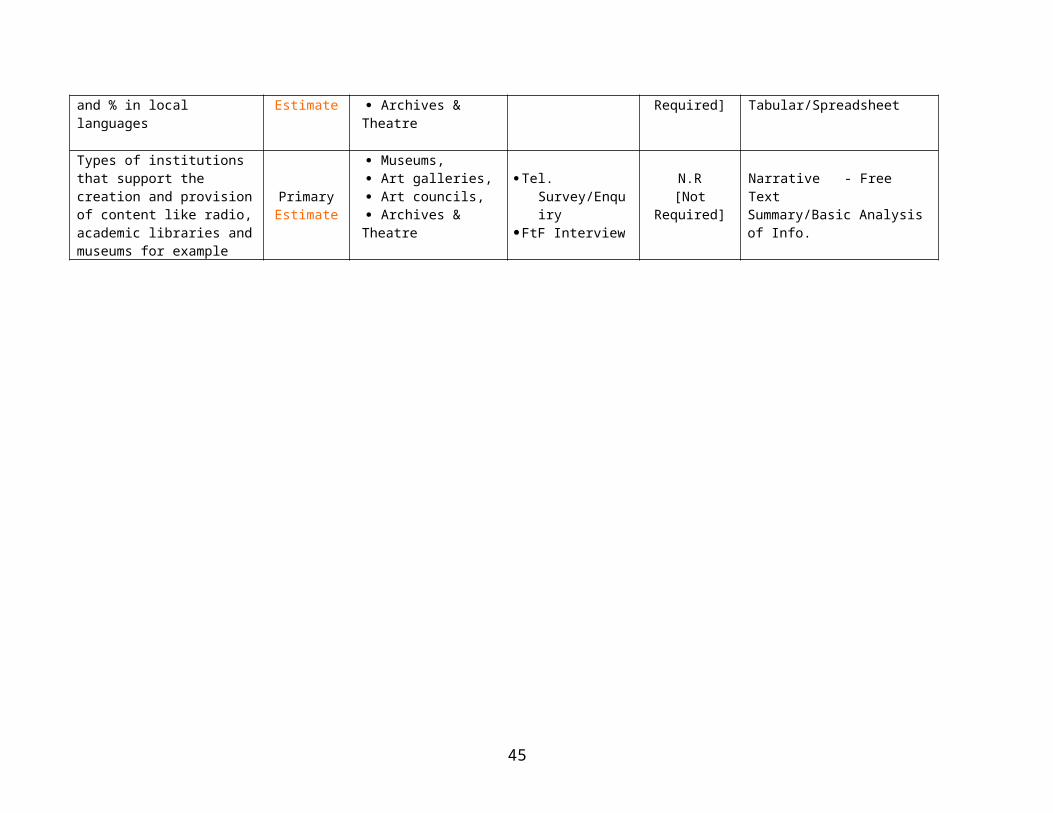
Number and % of local web-sites with local cultural information and % in local languages Primary
Estimate
Museums, Art galleries, Art councils, Archives & Theatre
Web Search N.R [Not Required] Data – Tabular/Spreadsheet
Types of institutions that support the creation and provision of content like radio, academic libraries and museums for example
PrimaryEstimate
Museums, Art galleries, Art councils, Archives & Theatre
Tel. Survey/EnquiryFtF Interview
N.R [Not Required]
Narrative - Free TextSummary/Basic Analysis of Info.
32
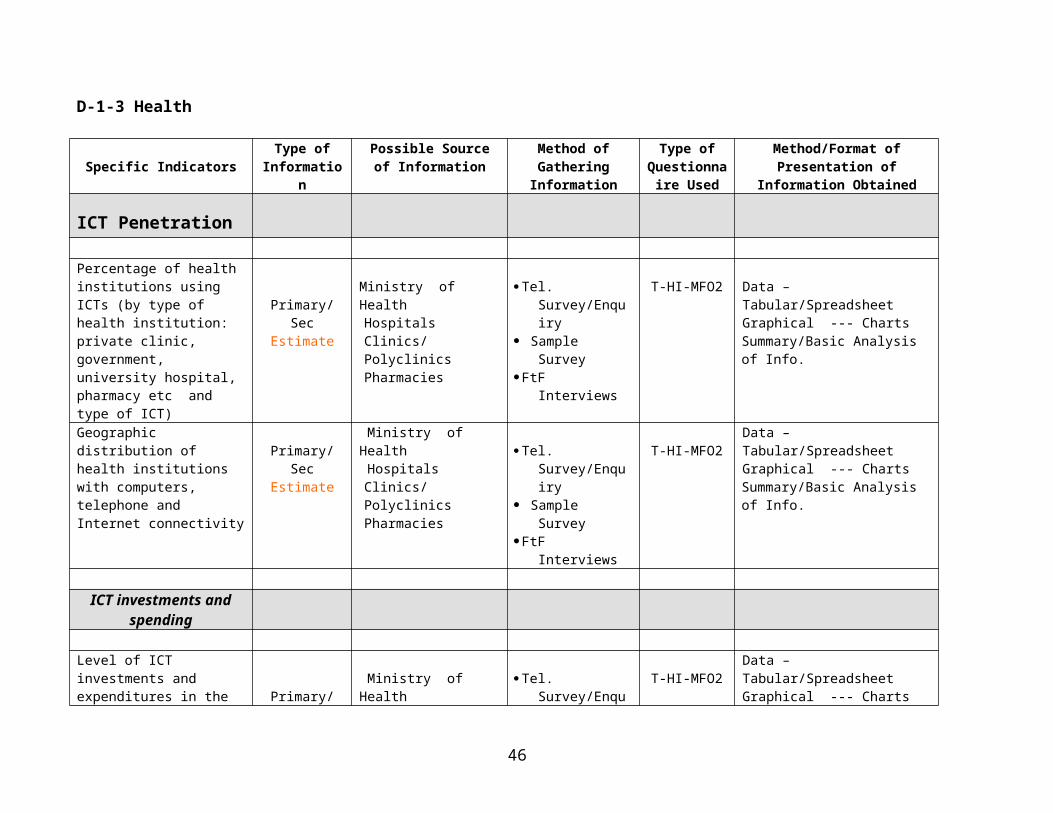
D-1-3 Health
Specific IndicatorsType of
InformationPossible Source of
InformationMethod of Gathering
Information
Type of Questionnaire
Used
Method/Format of Presentation of Information Obtained
ICT Penetration
Percentage of health institutions using ICTs (by type of health institution: private clinic, government, university hospital, pharmacy etc and type of ICT)
Primary/SecEstimate
Ministry of HealthHospitalsClinics/PolyclinicsPharmacies
Tel. Survey/Enquiry Sample SurveyFtF Interviews
T-HI-MFO2 Data – Tabular/SpreadsheetGraphical --- ChartsSummary/Basic Analysis of Info.
Geographic distribution of health institutions with computers, telephone and Internet connectivity
Primary/SecEstimate
Ministry of Health HospitalsClinics/PolyclinicsPharmacies
Tel. Survey/Enquiry Sample SurveyFtF Interviews
T-HI-MFO2Data – Tabular/SpreadsheetGraphical --- ChartsSummary/Basic Analysis of Info.
ICT investments and spending
Level of ICT investments and expenditures in the health sector (total and distribution by type of institutions; USD and % GDP)
Primary/SecEstimate
Ministry of Health HospitalsClinics/PolyclinicsPharmacies
Tel. Survey/Enquiry Sample SurveyFtF Interviews
T-HI-MFO2Data – Tabular/SpreadsheetGraphical --- ChartsSummary/Basic Analysis of Info.
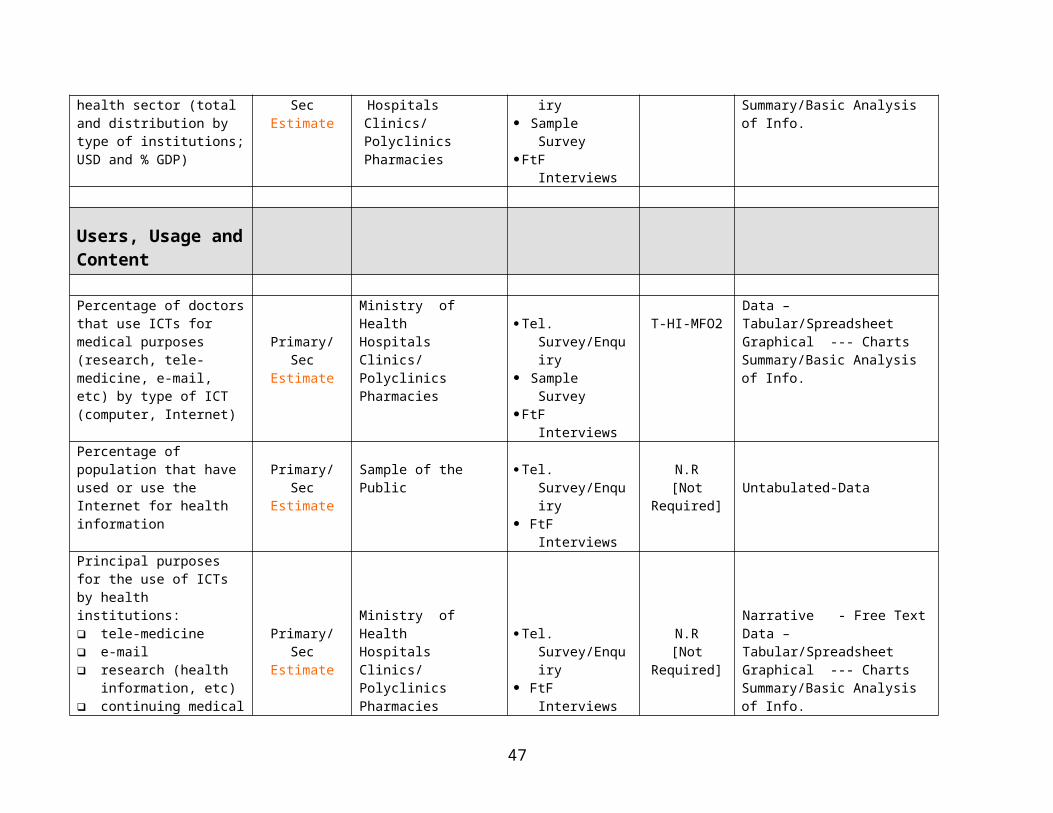
Users, Usage and Content
Percentage of doctors that use ICTs for medical purposes (research, tele-medicine, e-mail, etc) by type of ICT (computer, Internet)
Primary/SecEstimate
Ministry of HealthHospitalsClinics/PolyclinicsPharmacies
Tel. Survey/Enquiry Sample SurveyFtF Interviews
T-HI-MFO2Data – Tabular/SpreadsheetGraphical --- ChartsSummary/Basic Analysis of Info.
33
Percentage of population that have used or use the Internet for health information
Primary/SecEstimate
Sample of the Public Tel. Survey/Enquiry FtF Interviews
N.R [Not Required] Untabulated-Data
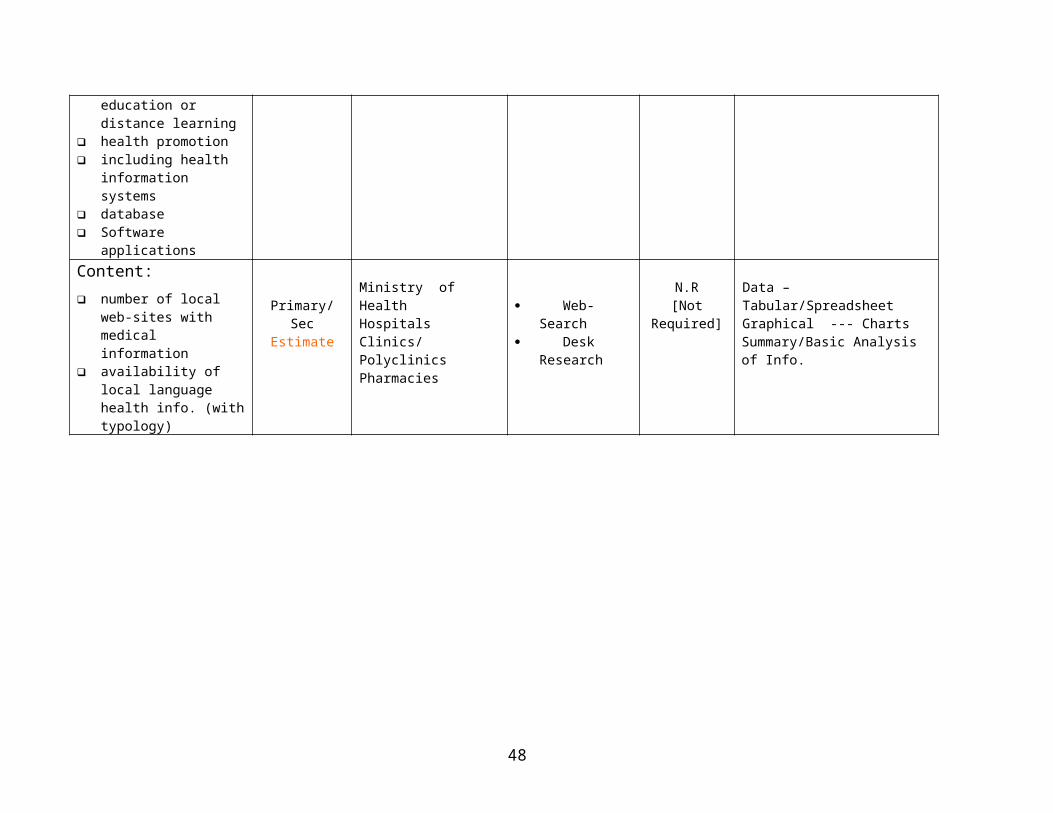
Principal purposes for the use of ICTs by health institutions: tele-medicine e-mail research (health
information, etc) continuing medical
education or distance learning
health promotion including health
information systems database Software applications
Primary/SecEstimate
Ministry of HealthHospitalsClinics/PolyclinicsPharmacies
Tel. Survey/Enquiry FtF Interviews
N.R [Not Required]
Narrative - Free TextData – Tabular/SpreadsheetGraphical --- ChartsSummary/Basic Analysis of Info.
Content: number of local web-sites
with medical information availability of local
language health info. (with typology)
Primary/SecEstimate
Ministry of HealthHospitalsClinics/PolyclinicsPharmacies
Web-Search Desk
Research
N.R [Not Required]
Data – Tabular/SpreadsheetGraphical --- ChartsSummary/Basic Analysis of Info.
34
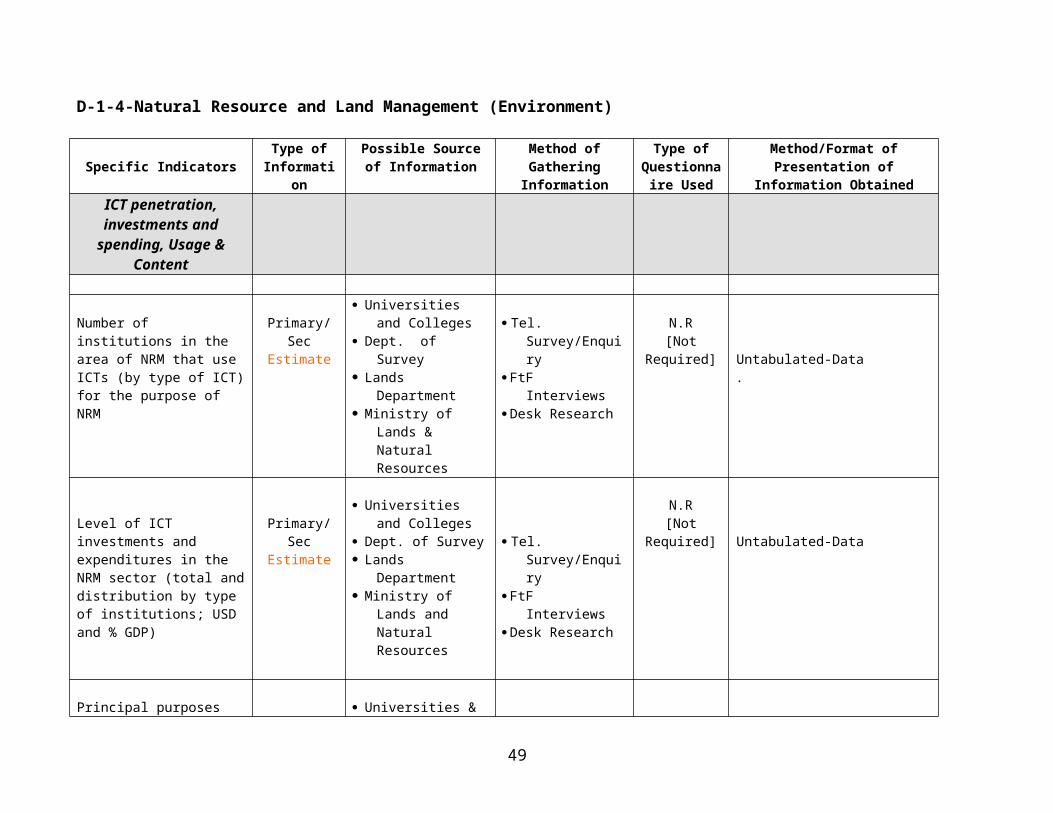
D-1-4-Natural Resource and Land Management (Environment)
Specific IndicatorsType of
InformationPossible Source of
InformationMethod of Gathering
InformationType of
Questionnaire Used
Method/Format of Presentation of Information Obtained
ICT penetration, investments and spending,
Usage & Content
Number of institutions in the area of NRM that use ICTs (by type of ICT) for the purpose of NRM
Primary/SecEstimate
Universities and Colleges
Dept. of Survey Lands Department Ministry of Lands &
Natural Resources
Tel. Survey/Enquiry FtF Interviews Desk Research
N.R [Not Required]
Untabulated-Data.
Level of ICT investments and expenditures in the NRM sector (total and distribution by type of institutions; USD and % GDP)
Primary/SecEstimate
Universities and Colleges
Dept. of Survey Lands Department Ministry of Lands and
Natural Resources
Tel. Survey/Enquiry FtF Interviews Desk Research
N.R [Not Required]
Untabulated-Data
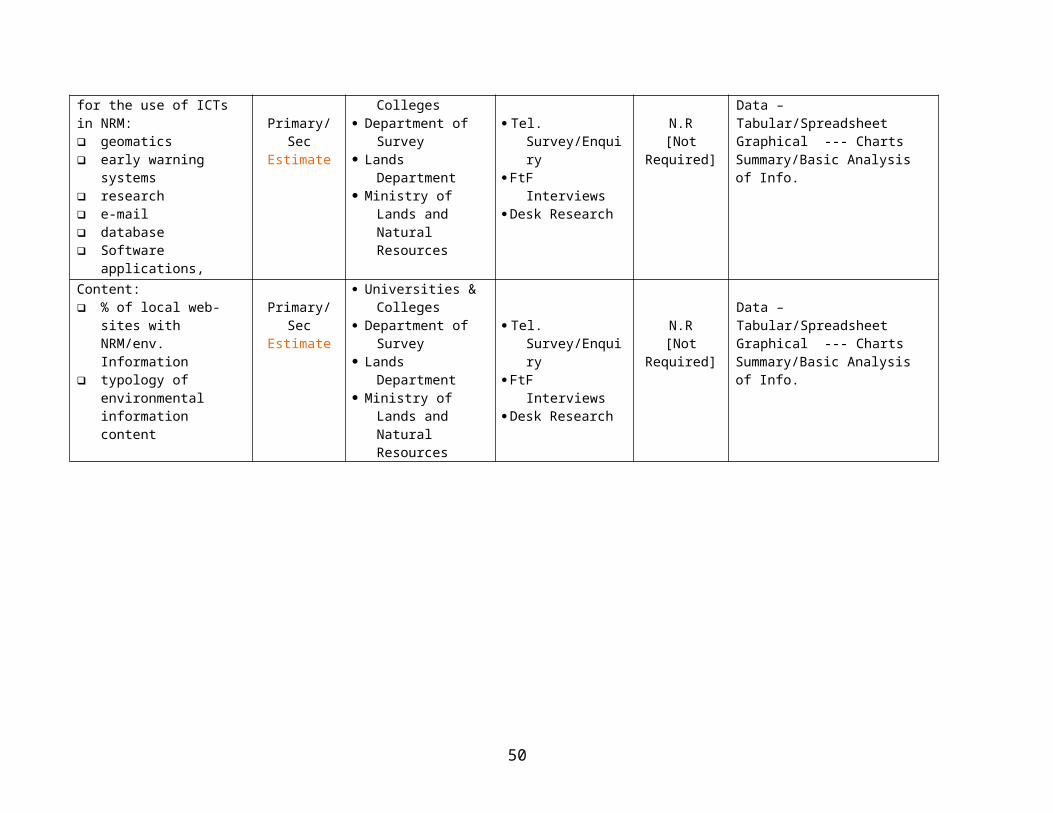
Principal purposes for the use of ICTs in NRM: geomatics early warning systems research e-mail database Software applications,
Primary/SecEstimate
Universities & Colleges
Department of Survey Lands Department Ministry of Lands and
Natural Resources
Tel. Survey/Enquiry FtF Interviews Desk Research
N.R [Not Required]
Data – Tabular/SpreadsheetGraphical --- ChartsSummary/Basic Analysis of Info.
Content: % of local web-sites with
NRM/env. Information typology of environmental
information content
Primary/SecEstimate
Universities & Colleges
Department of Survey Lands Department Ministry of Lands and
Natural Resources
Tel. Survey/Enquiry FtF Interviews Desk Research
N.R [Not Required]
Data – Tabular/SpreadsheetGraphical --- ChartsSummary/Basic Analysis of Info.
35
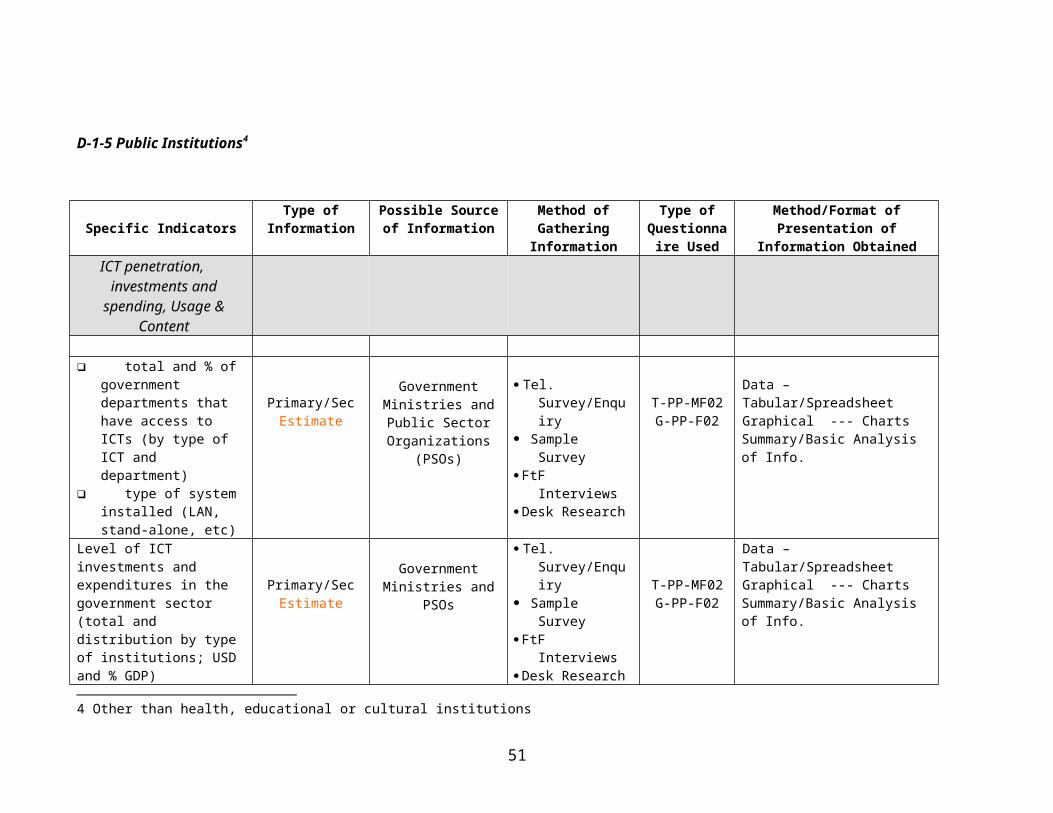
D-1-5 Public Institutions4
Specific IndicatorsType of
InformationPossible Source of
InformationMethod of Gathering
Information
Type of Questionnaire
Used
Method/Format of Presentation of Information Obtained
ICT penetration, investments and
spending, Usage & Content
total and % of government departments that have access to ICTs (by type of ICT and department)
type of system installed (LAN, stand-alone, etc)
Primary/SecEstimate
Government Ministries and Public Sector
Organizations (PSOs)
Tel. Survey/Enquiry Sample Survey FtF Interviews Desk Research
T-PP-MF02G-PP-F02
Data – Tabular/SpreadsheetGraphical --- ChartsSummary/Basic Analysis of Info.
Level of ICT investments and expenditures in the government sector (total and distribution by type of institutions; USD and % GDP)
Primary/SecEstimate
Government Ministries and PSOs
Tel. Survey/Enquiry Sample Survey FtF Interviews Desk Research
T-PP-MF02G-PP-F02
Data – Tabular/SpreadsheetGraphical --- ChartsSummary/Basic Analysis of Info.
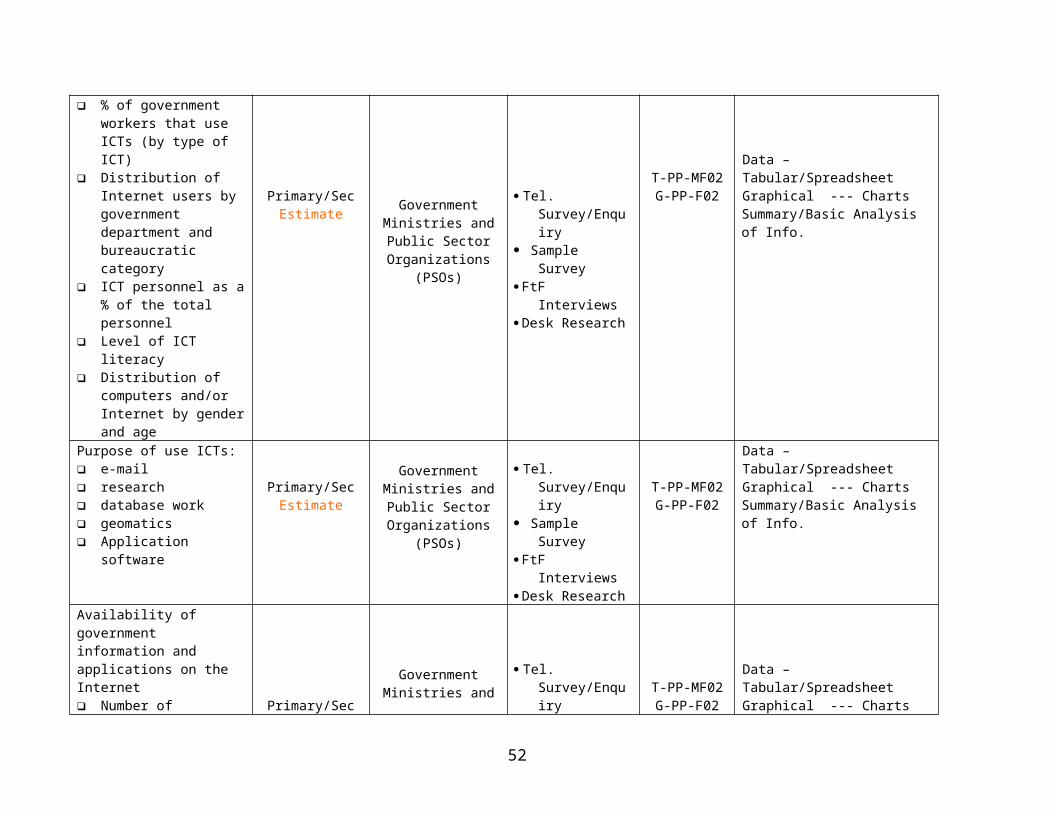
% of government workers that use ICTs (by type of ICT)
Distribution of Internet users by government department and bureaucratic category
ICT personnel as a % of the total personnel
Level of ICT literacy Distribution of computers
Primary/SecEstimate Government Ministries
and Public Sector Organizations (PSOs)
Tel. Survey/Enquiry Sample Survey FtF Interviews Desk Research
T-PP-MF02G-PP-F02
Data – Tabular/SpreadsheetGraphical --- ChartsSummary/Basic Analysis of Info.
4 Other than health, educational or cultural institutions
36
and/or Internet by gender and age
Purpose of use ICTs: e-mail research database work geomatics Application software
Primary/SecEstimate
Government Ministries and Public Sector
Organizations (PSOs)
Tel. Survey/Enquiry Sample Survey FtF Interviews Desk Research
T-PP-MF02G-PP-F02
Data – Tabular/SpreadsheetGraphical --- ChartsSummary/Basic Analysis of Info.
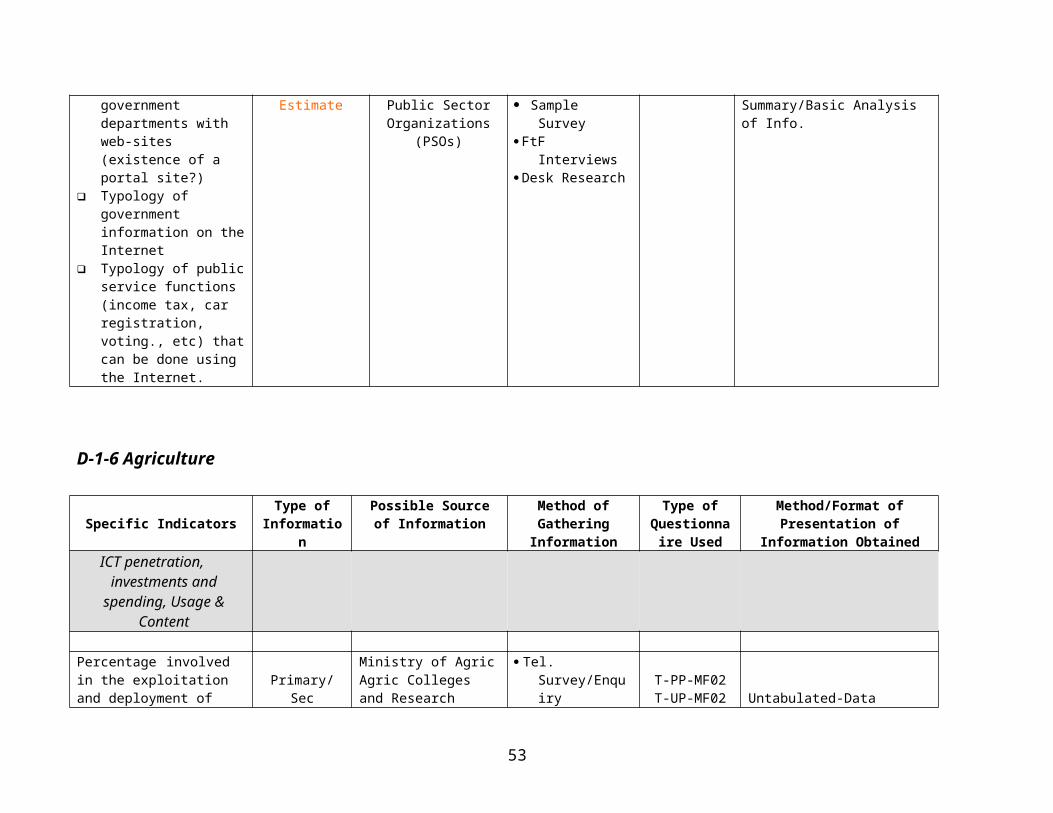
Availability of government information and applications on the Internet Number of government
departments with web-sites (existence of a portal site?)
Typology of government information on the Internet
Typology of public service functions (income tax, car registration, voting., etc) that can be done using the Internet.
Primary/SecEstimate
Government Ministries and Public Sector
Organizations (PSOs)
Tel. Survey/Enquiry Sample Survey FtF Interviews Desk Research
T-PP-MF02G-PP-F02
Data – Tabular/SpreadsheetGraphical --- ChartsSummary/Basic Analysis of Info.
D-1-6 Agriculture
Specific IndicatorsType of
InformationPossible Source of
InformationMethod of Gathering
Information
Type of Questionnaire
Used
Method/Format of Presentation of Information Obtained
ICT penetration, investments and
spending, Usage & Content
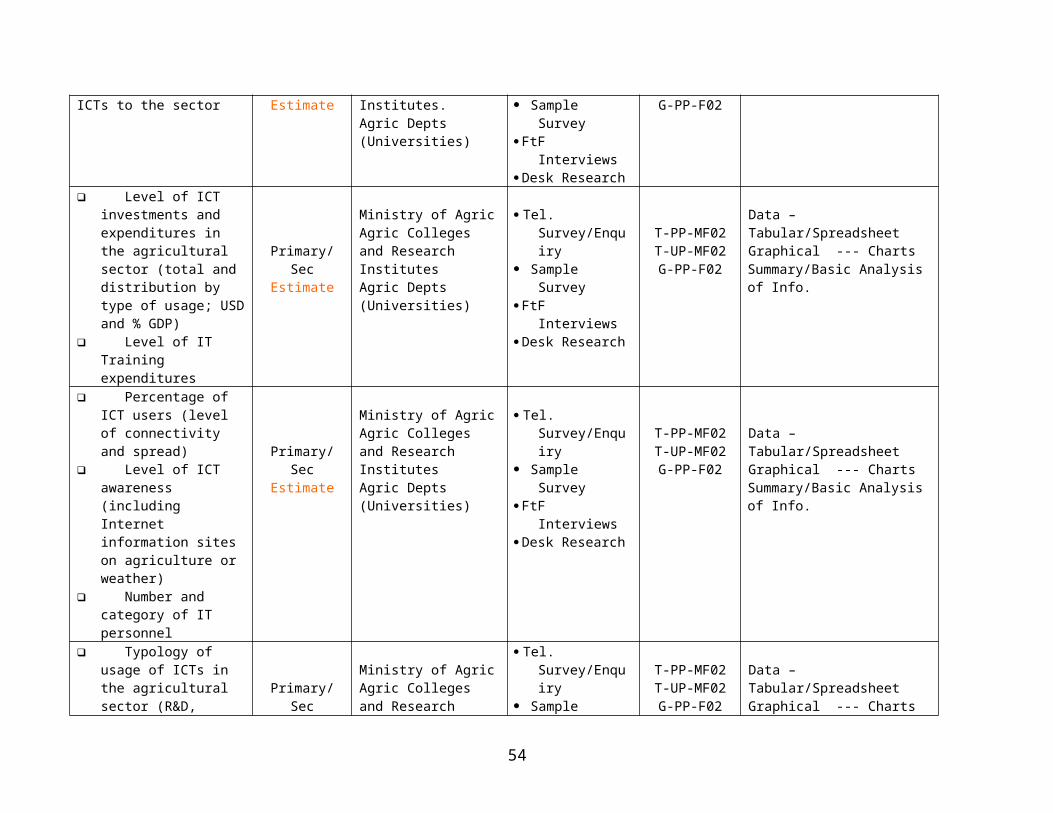
Percentage involved in the exploitation and deployment of ICTs to the sector
Primary/SecEstimate
Ministry of AgricAgric Colleges and Research Institutes.
Tel. Survey/Enquiry Sample Survey FtF Interviews
T-PP-MF02T-UP-MF02 Untabulated-Data
37
Agric Depts (Universities) Desk Research G-PP-F02 Level of ICT
investments and expenditures in the agricultural sector (total and distribution by type of usage; USD and % GDP)
Level of IT Training expenditures
Primary/SecEstimate
Ministry of AgricAgric Colleges and Research InstitutesAgric Depts (Universities)
Tel. Survey/Enquiry Sample Survey FtF Interviews Desk Research
T-PP-MF02T-UP-MF02G-PP-F02
Data – Tabular/SpreadsheetGraphical --- ChartsSummary/Basic Analysis of Info.
Percentage of ICT users (level of connectivity and spread)
Level of ICT awareness (including Internet information sites on agriculture or weather)
Number and category of IT personnel
Primary/SecEstimate
Ministry of AgricAgric Colleges and Research InstitutesAgric Depts (Universities)
Tel. Survey/Enquiry Sample Survey FtF Interviews Desk Research
T-PP-MF02T-UP-MF02G-PP-F02
Data – Tabular/SpreadsheetGraphical --- ChartsSummary/Basic Analysis of Info.
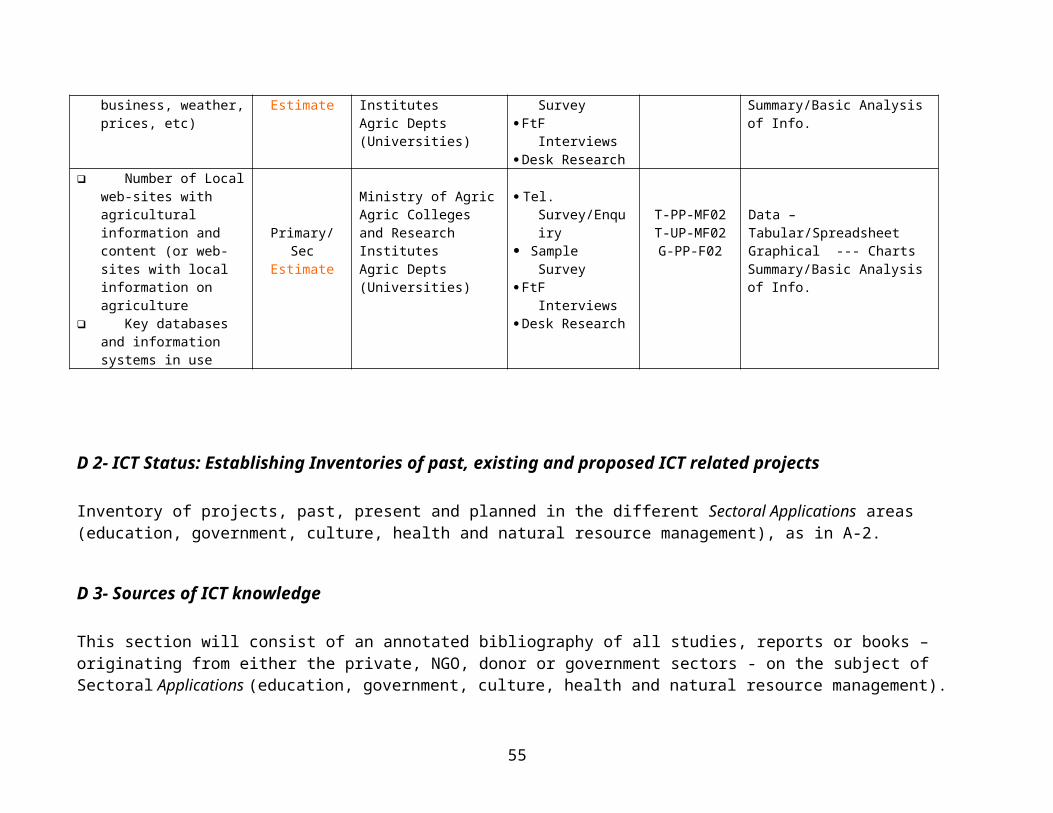
Typology of usage of ICTs in the agricultural sector (R&D, business, weather, prices, etc)
Primary/SecEstimate
Ministry of AgricAgric Colleges and Research InstitutesAgric Depts (Universities)
Tel. Survey/Enquiry Sample Survey FtF Interviews Desk Research
T-PP-MF02T-UP-MF02G-PP-F02
Data – Tabular/SpreadsheetGraphical --- ChartsSummary/Basic Analysis of Info.
Number of Local web-sites with agricultural information and content (or web-sites with local information on agriculture
Key databases and information systems in use
Primary/SecEstimate
Ministry of AgricAgric Colleges and Research InstitutesAgric Depts (Universities)
Tel. Survey/Enquiry Sample Survey FtF Interviews Desk Research
T-PP-MF02T-UP-MF02G-PP-F02
Data – Tabular/SpreadsheetGraphical --- ChartsSummary/Basic Analysis of Info.
D 2- ICT Status: Establishing Inventories of past, existing and proposed ICT related projects
Inventory of projects, past, present and planned in the different Sectoral Applications areas (education, government, culture, health and natural resource management), as in A-2.
38
D 3- Sources of ICT knowledge
This section will consist of an annotated bibliography of all studies, reports or books – originating from either the private, NGO, donor or government sectors - on the subject of Sectoral Applications (education, government, culture, health and natural resource management).
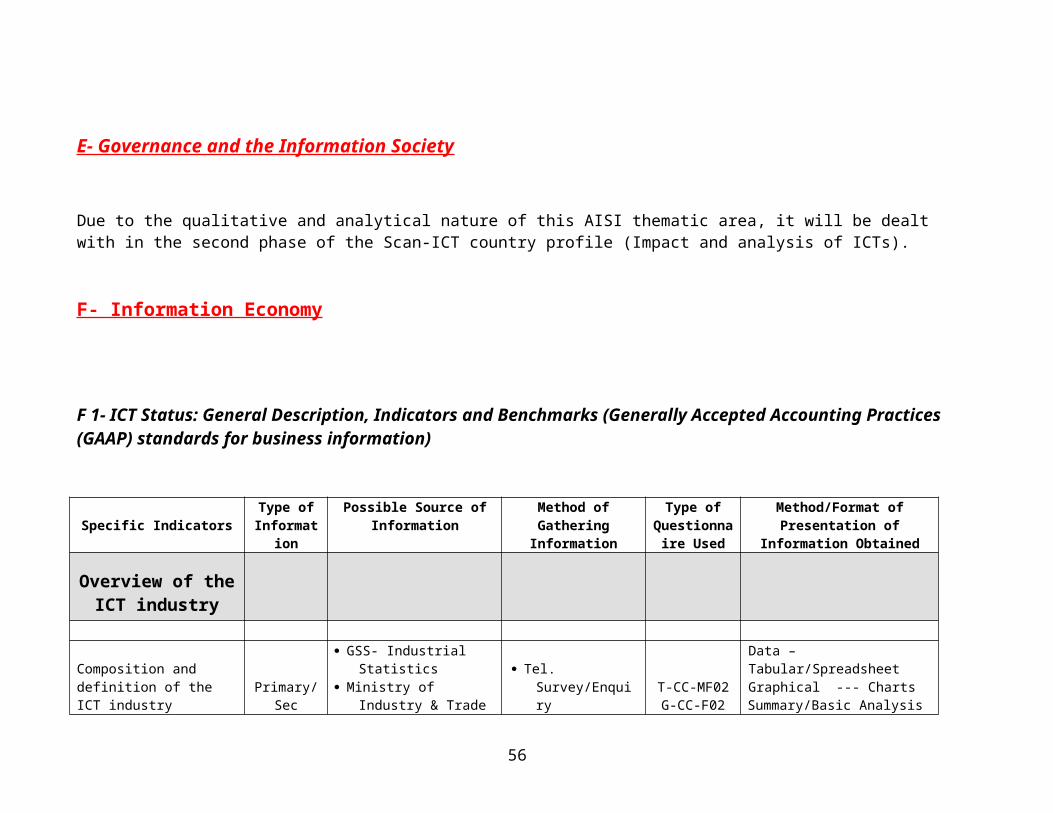
E- Governance and the Information Society
Due to the qualitative and analytical nature of this AISI thematic area, it will be dealt with in the second phase of the Scan-ICT country profile (Impact and analysis of ICTs).
F- Information Economy
F 1- ICT Status: General Description, Indicators and Benchmarks (Generally Accepted Accounting Practices (GAAP) standards for business information)
Specific IndicatorsType of
Information
Possible Source of Information
Method of Gathering Information
Type of Questionnaire
Used
Method/Format of Presentation of Information Obtained
Overview of the ICT industry
GSS- Industrial Statistics Data – Tabular/Spreadsheet
39
Composition and definition of the ICT industry (Telecom, Hardware, software, etc)
Primary/Sec Ministry of Industry &
Trade Sample of ICT Companies
& Businesses
Tel. Survey/Enquiry Sample Survey Desk Research
T-CC-MF02G-CC-F02
Graphical --- ChartsSummary/Basic Analysis of Info.
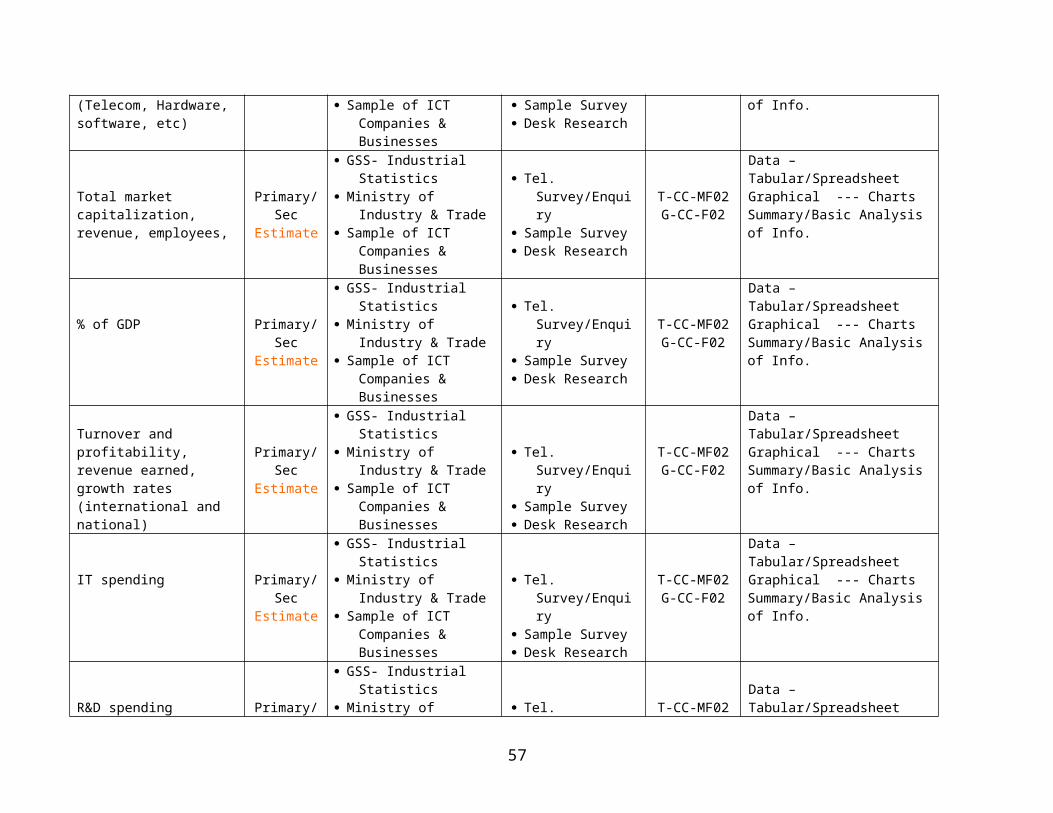
Total market capitalization, revenue, employees,
Primary/SecEstimate
GSS- Industrial Statistics Ministry of Industry &
Trade Sample of ICT Companies
& Businesses
Tel. Survey/Enquiry Sample Survey Desk Research
T-CC-MF02G-CC-F02
Data – Tabular/SpreadsheetGraphical --- ChartsSummary/Basic Analysis of Info.
% of GDP Primary/SecEstimate
GSS- Industrial Statistics Ministry of Industry &
Trade Sample of ICT Companies
& Businesses
Tel. Survey/Enquiry Sample Survey Desk Research
T-CC-MF02G-CC-F02
Data – Tabular/SpreadsheetGraphical --- ChartsSummary/Basic Analysis of Info.
Turnover and profitability, revenue earned, growth rates (international and national)
Primary/SecEstimate
GSS- Industrial Statistics Ministry of Industry &
Trade Sample of ICT Companies
& Businesses
Tel. Survey/Enquiry Sample Survey Desk Research
T-CC-MF02G-CC-F02
Data – Tabular/SpreadsheetGraphical --- ChartsSummary/Basic Analysis of Info.
IT spending Primary/SecEstimate
GSS- Industrial Statistics Ministry of Industry &
Trade Sample of ICT Companies
& Businesses
Tel. Survey/Enquiry Sample Survey Desk Research
T-CC-MF02G-CC-F02
Data – Tabular/SpreadsheetGraphical --- ChartsSummary/Basic Analysis of Info.
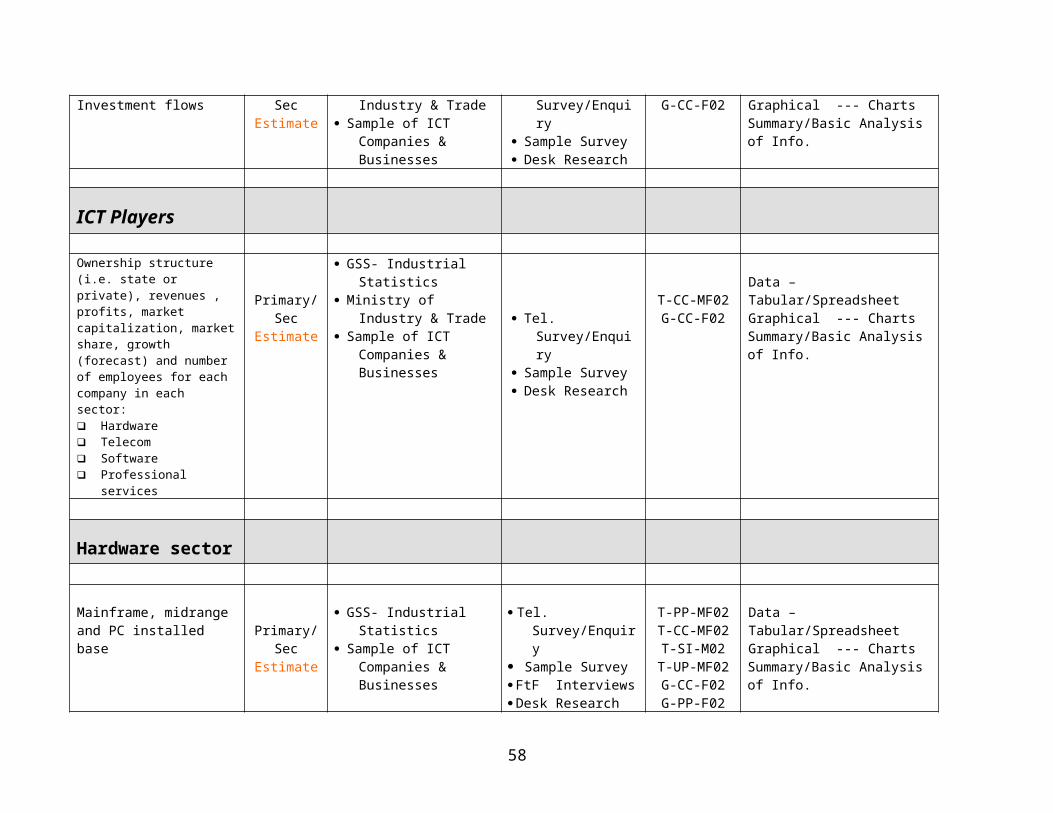
R&D spending Investment flows
Primary/SecEstimate
GSS- Industrial Statistics Ministry of Industry &
Trade Sample of ICT Companies
& Businesses
Tel. Survey/Enquiry Sample Survey Desk Research
T-CC-MF02G-CC-F02
Data – Tabular/SpreadsheetGraphical --- ChartsSummary/Basic Analysis of Info.
ICT Players
Ownership structure (i.e. state or private), revenues , profits, market capitalization, market share, growth (forecast) and number of employees for each company in each sector:
Primary/SecEstimate
GSS- Industrial Statistics Ministry of Industry &
Trade Sample of ICT Companies
& Businesses Tel. Survey/Enquiry Sample Survey Desk Research
T-CC-MF02G-CC-F02
Data – Tabular/SpreadsheetGraphical --- ChartsSummary/Basic Analysis of Info.
40
Hardware Telecom Software Professional services
Hardware sector
Mainframe, midrange and PC installed base Primary/Sec
Estimate
GSS- Industrial Statistics Sample of ICT Companies
& Businesses
Tel. Survey/Enquiry Sample Survey FtF Interviews Desk Research
T-PP-MF02T-CC-MF02T-SI-M02
T-UP-MF02G-CC-F02G-PP-F02
Data – Tabular/SpreadsheetGraphical --- ChartsSummary/Basic Analysis of Info.
Computer hardware sales, revenues, profitability, growth rates
Primary/SecEstimate
GSS- Industrial Statistics Sample of ICT Companies
& Businesses
Tel. Survey/Enquiry Sample Survey FtF Interviews Desk Research
T-CC-MF02G-CC-F02
Data – Tabular/SpreadsheetGraphical --- ChartsSummary/Basic Analysis of Info.
R&D spending Primary/SecEstimate
GSS- Industrial Statistics Sample of ICT Companies
& Businesses
Tel. Survey/Enquiry Sample Survey FtF Interviews Desk Research
T-CC-MF02G-CC-F02
Data – Tabular/SpreadsheetGraphical --- ChartsSummary/Basic Analysis of Info.
Total employeesPrimary/Sec
Estimate GSS- Industrial Statistics Sample of ICT Companies
& Businesses
Tel. Survey/Enquiry Sample Survey FtF Interviews Desk Research
T-CC-MF02G-CC-F02
Data – Tabular/SpreadsheetGraphical --- ChartsSummary/Basic Analysis of Info.
Software sector
Sales, revenues, profitability, growth rates Primary/Sec
Estimate
GSS- Industrial Statistics Sample of ICT Companies
& Businesses
Tel. Survey/Enquiry Sample Survey FtF Interviews Desk Research
T-CC-MF02G-CC-F02
Data – Tabular/SpreadsheetGraphical --- ChartsSummary/Basic Analysis of Info.
Software sales by software type
Primary/SecEstimate
GSS- Industrial Statistics Sample of ICT Companies
& Businesses
Tel. Survey/Enquiry Sample Survey FtF Interviews Desk Research
T-CC-MF02G-CC-F02
Data – Tabular/SpreadsheetGraphical --- ChartsSummary/Basic Analysis of Info.
Sales of locally developed Primary/Sec GSS- Industrial Statistics Tel. Survey/Enquiry Sample Survey T-CC-MF02
Data – Tabular/SpreadsheetGraphical --- Charts
41
software type Estimate Sample of ICT Companies & Businesses
FtF Interviews Desk Research
G-CC-F02 Summary/Basic Analysis of Info.
Total employeesPrimary/Sec
Estimate GSS- Industrial Statistics Sample of ICT Companies
& Businesses
Tel. Survey/Enquiry Sample Survey FtF Interviews Desk Research
T-CC-MF02G-CC-F02
Data – Tabular/SpreadsheetGraphical --- ChartsSummary/Basic Analysis of Info.
Telecommunications (hardware and operator)
sector
Sales, revenues, profitability, growth rates
Primary/SecEstimate
GSS- Industrial Statistics Telecom Operators
Tel. Survey/Enquiry Sample Survey FtF Interviews Desk Research
T-CC-MF02T-PP-MF02G-CC-F02
Data – Tabular/SpreadsheetGraphical --- ChartsSummary/Basic Analysis of Info.
Structure (mobile, landlines, cable, etc) Primary/Sec
GSS- Industrial Statistics Telecom Operators
Tel. Survey/Enquiry Sample Survey FtF Interviews Desk Research
T-CC-MF02G-CC-F02
Data – Tabular/SpreadsheetGraphical --- ChartsSummary/Basic Analysis of Info.
Total employees
Primary/Sec GSS- Industrial Statistics Telecom Operators
Tel. Survey/Enquiry Sample Survey FtF Interviews Desk Research
T-CC-MF02G-CC-F02
Data – Tabular/SpreadsheetGraphical --- ChartsSummary/Basic Analysis of Info.
Degree of competition in the different services (local, long distance, international, leased lines, mobile)
Primary/Sec GSS- Industrial Statistics Telecom Operators
Tel. Survey/Enquiry Sample Survey FtF Interviews Desk Research
T-CC-MF02G-CC-F02
Narrative - Free TextData – Tabular/SpreadsheetGraphical --- ChartsSummary/Basic Analysis of Info.
Professional services (consulting, etc) sector
Sales, revenues, profitability, growth rates,
Primary/Sec
Telephone/Business Directory
Sample Professional Service Establishments
Tel. Survey/Enquiry Sample Survey FtF Interviews Desk Research
T-CC-MF02T-PP-MF02G-CC-F02
Data – Tabular/SpreadsheetGraphical --- ChartsSummary/Basic Analysis of Info.
Typology of services offered
Primary/Sec
Telephone/Business Directory
Sample Professional Service Establishments
Tel. Survey/Enquiry Sample Survey FtF Interviews Desk Research
T-CC-MF02G-CC-F02
Data – Tabular/SpreadsheetGraphical --- ChartsSummary/Basic Analysis of Info.
42
F-1-2 Informal ICT Sector
Specific IndicatorsType of
InformationPossible Source of
InformationMethod of Gathering
InformationType of
Questionnaire Used
Method/Format of Presentation of Information Obtained
Overview, Usage & Actors
DefinitionPrimary Sample of ICT Informal
Sector Establishments
Tel. Survey/Enquiry Sample Survey Desk Research
T-CC-MF02G-CC-F02
Narrative - Free Text
Number of people involved and % of total workforce
Primary Sample of ICT Informal Sector Establishments
Tel. Survey/Enquiry Sample Survey Desk Research
T-CC-MF02T-PP-MF02G-CC-F02
Untabulated-Data
Revenues generated (USD) and % of GDP and % of ICT formal sector
Primary Sample of ICT Informal Sector Establishments
Tel. Survey/Enquiry Sample Survey Desk Research
T-CC-MF02G-CC-F02
Untabulated-Data
Type of informal section uses of ICTs (mobile telephony sub-contracting; pirate VSATs, etc)
Primary Sample of ICT Informal Sector Establishments
Tel. Survey/Enquiry Sample Survey Desk Research
T-CC-MF02G-CC-F02
Data – Tabular/SpreadsheetGraphical --- ChartsSummary/Basic Analysis of Info.
Actors: Typology of Informal sector (typology and distribution by sex and age)
Primary Sample of ICT Informal Sector Establishments
Tel. Survey/Enquiry Sample Survey Desk Research
T-CC-MF02G-CC-F02
Data – Tabular/SpreadsheetGraphical --- ChartsSummary/Basic Analysis of Info.
43
F-1-3 E-Commerce
Specific IndicatorsType of
InformationPossible Source of
InformationMethod of Gathering
InformationType of
Questionnaire Used
Method/Format of Presentation of Information
Obtained
Overview
Availability of e-commerce portals (centers): EC-DC Trade points, etc
Primary/SecSample of Possible E-commerce Businesses and Operators
Tel. Survey/Enquiry Sample Survey Web-Search Desk Research FtF Interviews
T-CC-MF02T-PP-MF02G-CC-F02
Data – Tabular/SpreadsheetGraphical --- ChartsSummary/Basic Analysis of Info.
E-commerce revenues, including projections (USD) Business to business Business to consumer
Primary/SecSample of Possible E-commerce Businesses and Operators
Tel. Survey/Enquiry Sample Survey Web-Search Desk Research FtF Interviews
T-CC-MF02T-PP-MF02G-CC-F02
Data – Tabular/SpreadsheetGraphical --- ChartsSummary/Basic Analysis of Info.
Value of on-line transactions, with projections Primary/Sec
Sample of Possible E-commerce Businesses and Operators
Tel. Survey/Enquiry Sample Survey Web-Search Desk Research FtF Interviews
T-CC-MF02T-PP-MF02G-CC-F02
Data – Tabular/SpreadsheetGraphical --- ChartsSummary/Basic Analysis of Info.
Top 10 e-commerce sites (with description) Primary/Sec
Sample of Possible E-commerce Businesses and Operators
Tel. Survey/Enquiry Sample Survey Web-Search Desk Research FtF Interviews
T-CC-MF02T-PP-MF02G-CC-F02
Data – Tabular/SpreadsheetGraphical --- ChartsSummary/Basic Analysis of Info.
Geographic distribution of e-commerce activity Primary/Sec
Sample of Possible E-commerce Businesses and Operators
Tel. Survey/Enquiry Sample Survey Web-Search Desk Research FtF Interviews
T-CC-MF02T-PP-MF02G-CC-F02
Data – Tabular/SpreadsheetGraphical --- ChartsSummary/Basic Analysis of Info.
Value of “imports” and “exports” through the use of e- Primary/Sec
Sample of Possible E-commerce Businesses
Tel. Survey/Enquiry Sample Survey Web-Search
T-CC-MF02T-PP-MF02
Data – Tabular/SpreadsheetGraphical --- Charts
44
commerce and Operators Desk Research FtF Interviews
G-CC-F02 Summary/Basic Analysis of Info.
Users, Usage & Content
Typology of transactions (type of products or services offered) Primary/Sec
Sample of Possible E-commerce Businesses and Operators
Tel. Survey/Enquiry Sample Survey Web-Search Desk Research FtF Interviews
T-CC-MF02T-PP-MF02G-CC-F02
Data – Tabular/SpreadsheetGraphical --- ChartsSummary/Basic Analysis of Info.
Typology of usage (teleservices, etc) Primary/Sec
Sample of Possible E-commerce Businesses and Operators
Tel. Survey/Enquiry Sample Survey Web-Search Desk Research FtF Interviews
T-CC-MF02T-PP-MF02G-CC-F02
Data – Tabular/SpreadsheetGraphical --- ChartsSummary/Basic Analysis of Info.
Number and % of consumers who have used e-commerce (or plan to) Primary/Sec
Sample of Possible E-commerce Businesses and Operators
Tel. Survey/Enquiry Sample Survey Web-Search Desk Research FtF Interviews
T-CC-MF02T-PP-MF02G-CC-F02
Data – Tabular/SpreadsheetGraphical --- ChartsSummary/Basic Analysis of Info.
% of local web-sites that are used for e-commerce
Primary/SecSample of Possible E-commerce Businesses and Operators
Tel. Survey/Enquiry Sample Survey Web-Search Desk Research FtF Interviews
T-CC-MF02T-PP-MF02G-CC-F02
Data – Tabular/SpreadsheetGraphical --- ChartsSummary/Basic Analysis of Info.
45
F-1-4 ICTs and the Commercial Sector (E-Business)
Specific IndicatorsType of
InformationPossible Source of
InformationMethod of Gathering
InformationType of
Questionnaire Used
Method/Format of Presentation of Information Obtained
ICT penetration
Percentage and number of firms that use ICTs, notably the Internet; by type of sector (agriculture, industry, services [banking, consulting, etc]) and by size of firm (SMEs, LE, MNE)
Primary/SecSample of companies,
businesses and establishments in
key sectors
Tel. Survey/Enquiry Sample Survey Web-Search Desk Research FtF Interviews
T-CC-MF02T-PP-MF02G-CC-F02
Data – Tabular/SpreadsheetGraphical --- ChartsSummary/Basic Analysis of Info.
Percentage and number of firms that have a web-site Primary/Sec
Sample of companies,
businesses and establishments in
key sectors
Tel. Survey/Enquiry Sample Survey Web-Search Desk Research FtF Interviews
T-CC-MF02T-PP-MF02G-CC-F02
Data – Tabular/SpreadsheetGraphical --- ChartsSummary/Basic Analysis of Info.
Percentage of expenses on investments in ICTs Primary/Sec
Sample of companies,
businesses and establishments in
key sectors
Tel. Survey/Enquiry Sample Survey Web-Search Desk Research FtF Interviews
T-CC-MF02T-PP-MF02G-CC-F02
Data – Tabular/SpreadsheetGraphical --- ChartsSummary/Basic Analysis of Info.
Usage
-Purpose of the use of ICTs: e-mail e-commerce Internet research
Primary/SecSample of companies,
businesses and establishments in
Tel. Survey/Enquiry Sample Survey Web-Search Desk Research
T-CC-MF02T-PP-MF02G-CC-F02
Data – Tabular/SpreadsheetGraphical --- ChartsSummary/Basic Analysis of Info.
46
(marketing intelligence, partnerships, distribution or client searches, etc…)
Software applications
key sectors FtF Interviews
Business use of the internet: Revenue generation Customer service Cost-saving Marketing, etc…
Primary/SecSample of companies,
businesses and establishments in
key sectors
Tel. Survey/Enquiry Sample Survey Web-Search Desk Research FtF Interviews
T-CC-MF02T-PP-MF02G-CC-F02
Data – Tabular/SpreadsheetGraphical --- ChartsSummary/Basic Analysis of Info.
-Types of Internet Information sought: Technical and
computer General Financial market Economic and
government Supplier, etc
Primary/SecSample of companies,
businesses and establishments in
key sectors
Tel. Survey/Enquiry Sample Survey Web-Search Desk Research FtF Interviews
T-CC-MF02T-PP-MF02G-CC-F02
Data – Tabular/SpreadsheetGraphical --- ChartsSummary/Basic Analysis of Info.
Notes on Terms
GBC Ghana Broadcasting CorporationGSS Ghana Statistical ServicesNCA National Communications Authority
47
This Page is Deliberately Left Blank
CHAPTER TWOCHAPTER TWO
THE GHANA SCAN-ICT IMPLEMENATION STRATEGY AND RELATED ISSUES
Introduction
This chapter provides details of the project implementation strategy with specific reference to the setting-up of the Ghana Scan-ICT Research Network and the Respondents’ Network. Also touched on are other related implementational issues, including those relating to the data collection methods, the success rate of each of the methods used and the lessons learnt.
2.1 Project Implementation Activities
The implementation of the Ghana Pilot Scan-ICT project involved a number of key activities, these include:
Developing and Customizing the Scan-ICT Methodology (the details of which are presented in Chapter One of the Report)
Developing the Questionnaire
Field Testing and Revising the Questionnaire
Using the Questionnaire to carryout the postal, face-face and the online (e-mail shots and Website-direct) data gathering exercise
Compilation of the survey data, analysis of the results and the preparation of the Project Report and
Project Report Submission and Dissemination
2.2 Setting-up the Scan-ICT Networks
The SCAN-ICT Research Network: [Data Collection and Research]
To facilitate the data collection and research work, a Scan-ICT Research Network was set-up with members from the Universities, Polytechnics and Research Institutions spread all over the country. The key institutions forming part of the Network and their respective roles are described below. Also described as per each participating institutions are the areas of the country covered during the nation-wide
49
study by the members of the Network based at these institutions. Also identified for each area is the type of survey carried out by the relevant institution.
Apart from INIIT serving as the national coordinating agency, some of the nodes of the network are designated as regional coordinating nodes --- with each partnering with a number of partnering nodes. There are also a number of collaborating nodes.
International Institute for Information Technology (INIIT) – National (Project) Coordination Agency
Regions Covered:
All Regions (Postal Survey) All Regions (Online Survey) All Regions (Newspaper Inserts)
University of Ghana --- Regional Coordinating Node
Partnering-Nodes:
Accra Polytechnic Institute of Professional Studies
Regions Covered:
Greater Accra (Face-to-Face Survey)
Council for Scientific and Industrial Research (CSIR) --- Collaborating Node
Regions Covered:
Greater Accra (Face-to-Face Survey)
Valley View University – Collaborating Node
Regions Covered
Greater Accra Region (Face-to-Face Survey) Eastern Region (Face-to-Face Survey) Volta Region (Face-to-Face Survey)
University of Cape – Regional Coordinating Node
Partnering-Nodes:
University College of Winneba Cape Coast Polytechnic Takoradi Polytechnic
Regions Covered:
Central Region (Face-to-Face Survey) Western Region (Face-to-Face Survey)
50
Kwami Nkrumah University of Science and Technology – Regional Coordinating Node
Partnering-Nodes:
Kumasi Polytechnic Sunyani Polytechnic University of Development Studies
Regions Covered:
Ashanti Region (Face-to-Face Survey) Brong Ahafo Region (Face-to-Face Survey) Northern Region (Postal Survey) Upper East Region (Postal Survey) Upper West Region (Postal Survey)
The SCAN-ICT Respondent Network
The Pilot project also involved the setting up of the Scan-ICT Respondents Network made of the respondents of most of the face-to-face survey and the postal survey. Each respondent was requested to complete a form providing contact details. The database of respondents’ containing the details of the members of the respondents’ network has been implemented. This will be used in the future for follow-up Scan-ICT surveys and for dissemination of some of the study reports.
2.3 Methods of Data Collection
A number of methods were used to collect data on the identified indicators listed in the Scan-ICT methodology topology described in Chapter 1. Identified below for each of these methods, are the targeted institutions and the response rate for each of these institutions and establishments. Note that for each of these target institutions, a number of data collection methods were used with varying degrees of success.
Postal Questionnaire
This involved posting relevant questionnaires to a representative sample of institutions in each of the targeted categories. The completed questionnaires were return by post by the respondents.
Targeted Categories of Institutions:
Schools Universities and Colleges Private and Public Sector Establishments ICT Service Providers and Computer Companies
Success Rate: Reasonable
Schools [50%]
51
Universities and Colleges [25%] Private and Public Sector Establishments [ 10%] ICT Service Providers and Computer Companies [5%]
Face-to-Face
This involved a face-to-face meeting with the respondent, during which the questionnaire is completed on the spot by the respondent guided by the Scan-ICT Researcher.
Targeted Categories of Institutions:
Universities and Colleges Private and Public Sector Establishments ICT Service Providers and Computer Companies Hospitals Cultural and Heritage Organizations
Success Rate: Very Good
Universities and Colleges [100%] Private and Public Sector Establishments [ 100%] ICT Service Providers and Computer Companies [100%] Hospitals [100%] Cultural and Heritage Organizations [100%]
E-mail Shots
This involve sending questionnaire embedded in an e-mail message to a sample of respondents, who completes the questionnaire and return it to INIIT again by e-mail
Targeted Categories of Institutions:
Private and Public Sector Establishments ICT Service Providers and Computer Companies
Success Rate: Good
Web-Site Direction
This involve a using a newspaper advertisement directing people to a Web-site, where they complete the questionnaire and submit it automatically.
Targeted Categories of Institutions:
National (All Sectors)
Success Rate: Reasonable
52
Newspaper Inserts
This involved inserting the questionnaire in a local monthly Computer Publication with a national circulation. Readers complete the questionnaire and send it by post to INIIT. It is also planned to use this Computer Publication for the dissemination of the Study results
Targeted Categories of Institutions:
National (All Sectors)
Success Rate: Reasonable
Radio Shows
During the Scan-ICT project, INIIT staff was interviewed on a local radio station about the project. The publicity generated by this radio programme did have some impact on the response rate of some of the other data collection methods used.
Targeted Categories of Institutions:
National (All Sectors)
Success Rate: Reasonable
2.4 Lessons Learnt
Some of the lessons learnt as part of the implementation of the project can be summarized as follows.
Postal Questionnaire – Limited Success [Data Gathering –Limited, Setting up Respondent Network – Successful]
Face-to-face Data Collection Exercise – Successful [Data Gathering, Setting Up Research Network and Building Capacity, Setting-up the Respondents Network]
53
Part TwoPart Two
THE MAIN REPORT THE MAIN REPORT
54
CHAPTER THREECHAPTER THREE
GENERAL PROFILE: DEMOGRAPHIC & ECONOMIC
Introduction
This chapter provides details of key demographic and economic indicators, including those relating to population distribution and economic performance (gross domestic product (GDP), gross national income (GNI), unemployment rate, inflation rate etc). Also documented are trade related indicators as well as specific details relating to the evolution of Ghana’s socio-economic development programmes and political system. Most of the information documented in this chapter was obtained from secondary statistical sources and relevant documents through desk research work.
3.1 POPULATION AND DEMOGRAPHIC INDICATORSGhana has a land area of 238,537 square kilometers and a population of approximately 18.4 million, with a population growth rate of between 2.5% and 2.9% and a population density of 77 per km2. About 44.1% of the population is under 14 years, while 51.3% between 15 - 64 years and 4.7 % aged 60 years and above. About 62% of the population lives in the rural areas.
Basic Demographic Indicators
Indicator Value (2000)
Total Population (million) 18,412,247
Population: Percent of Males 51%
Population: Percent of Females 49%
Annual Population Growth Rate 2.5%
Population Density (persons per sq. km) 77Population Distribution (%)
Urban Population (% of total)38%
Rural Population (% of total)62%
Age Distribution of Population
55
Under 15 years43.5%
15 to 2417.4%
25 to 3917.6%
40 to 5411.9%
55 to 644.5%
65 and above5.0%
Other Demographic Indicators
Total Fertility Rate 4.6
Crude Birth Rate per 1000 33
Life Expectancy (number of years) 60 (all) 59 (men) 62 (women)
Infant Mortality (per 1000 live births) 67
Maternal Mortality (per 10,000 live births) 240 Source: Ghana Statistical Service
56
Regional Distribution of Demographic Indicators (2000)
Population (million)
Pop. (% of total)
Males Pop (million)
Female Pop. (million)
Pop. Growth
Rate
Pop. Density (per km2)
Region
Western 1,8242878 10% 925,708 917,170 2.9 77
Central 1,580,047 8.6% 753,053 826,994 2.0 161
Gt. Accra 2,909,643 15.8% 1,433,093 1,476,550 4.4 161
Volta 1,612,290 8.8% 775,257 837,042 1.8 78
Eastern 2,108,852 11.4% 1,034,922 1,073,930 1.4 109
Ashanti 3,187,601 17.3% 1,556,587 1,631,014 2.6 131
Brong Ahafo 1,824,822 9.9% 913,035 911,787 2.6 46
Northern 1,854,994 10.1% 921,138 933,856 2.9 26
Upper West 274,981 3.1% 274,981 298,879 1.7 31
Upper East 917,251 5.0% 437,245 480,006 1.1 104
All Regions 18,412,247 100% 9,025,019 9,387,228 2.5 77 Source: Ghana Statistical Service
57
0 500,000 1,000,000 1,500,000 2,000,000 2,500,000 3,000,000 3,500,000
Western
Central
Gt. Accra
Volta
Eastern
Ashanti
Brong Ahafo
Northern
Upper West
Upper East Regional Distribution of Population
3.2 More on Population Distribution
0 500,000 1,000,000 1,500,000 2,000,000
Western
Central
Gt. Accra
Volta
Eastern
Ashanti
Brong Ahafo
Northern
Upper West
Upper East
Males Female
Regional Distribtion of Male & Femaie Pop.
58
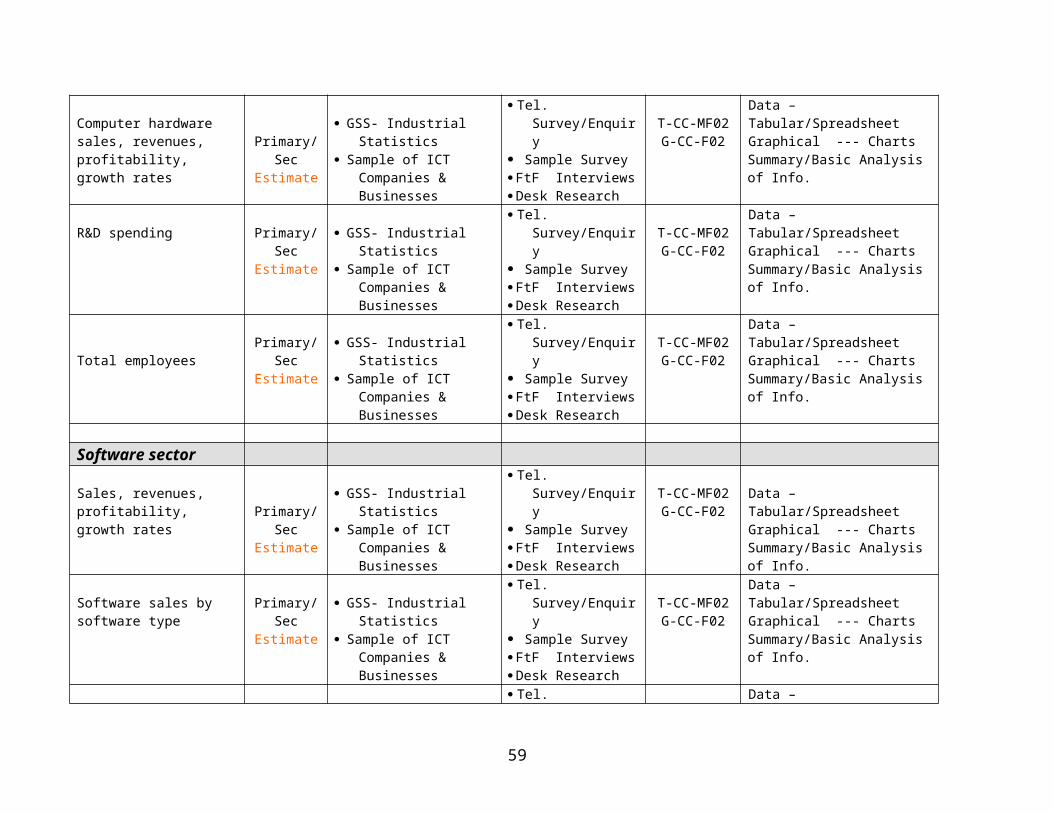
Wes
tern
Cen
tral
Gt.
Acc
ra
Vol
ta
Eas
tern
Ash
anti
Bro
ng A
hafo
Nor
ther
n
Upp
er W
est
Upp
er E
ast
Pop. Growth Rate
Pop. Density
Volta
Brong Ahafo
Ashanti
Eastern
Gt. Accra
Central
WesternUpper East
Northern
Upper West
3.3 THE ECONOMY: A GENERAL PROFILEGhana, with a UNDP Human Development Index of 133 is reasonably endowed with natural resources , which include: forests, and mineral deposits (gold, diamond, manganese and bauxite). Ghana is the second largest gold producer in Africa, after South Africa. Ghana is ranked 10th gold producing country in the World. It is the 3 rd
leading producer of cocoa in the world.
Gross Domestic Product (GDP) by Kind of Economic Activity (at 1993 Constant Prices (billion cedis) (2000)
Sector Contribution to GDP Percent Contribution to GDP Growth Rate
Agriculture Sector 1,852.0 39.6%2.3
Services Sector 1,307.6 28.0%4.8
Industrial Sector 1,517.3 32.4%4.7
59
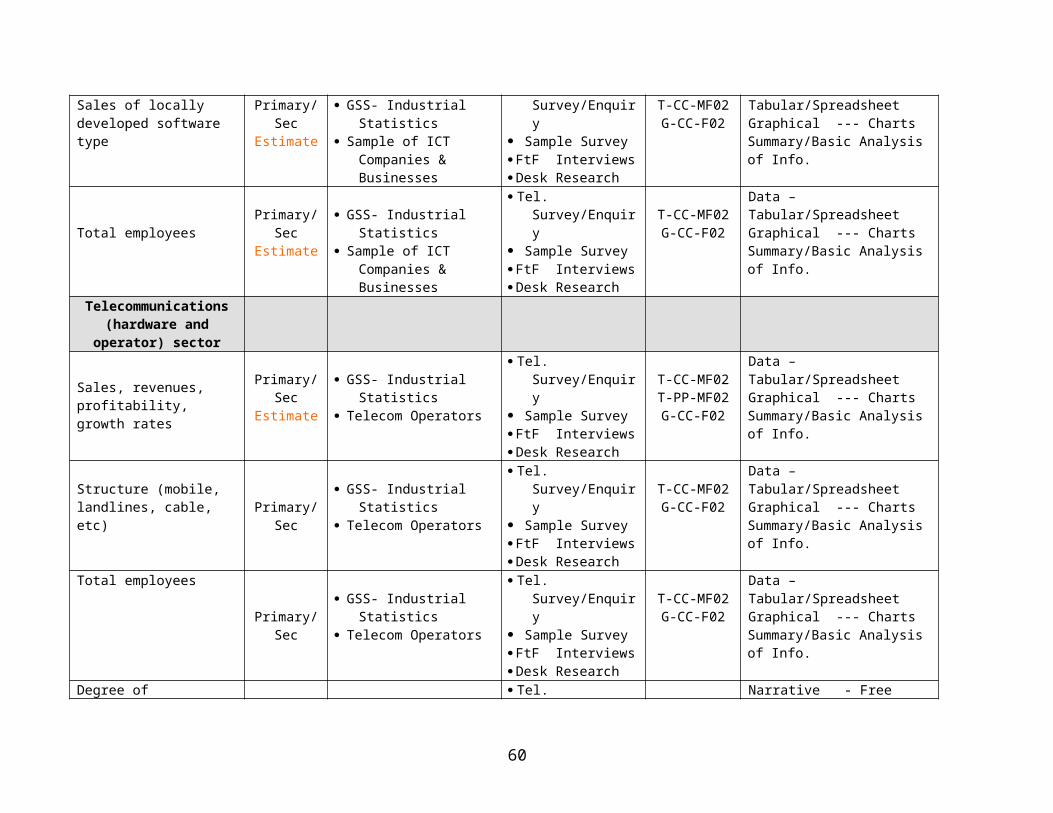
Total 4,676.8 100%3.8
Source: Ghana Statistical Service
GDP Growth Rate
-2
0
2
4
6
8
10
75-'79' 1980 1984 1985 1986 1987 1988 1989 1990 1991 1992 1993 1994 1995 1996 1997 1998 1999 2000
GNI/cap ($)
050
100150200250300350400450500
75-'7
9'19
8019
8419
8519
8619
8719
8819
8919
9019
9119
9219
9319
9419
9519
9619
9719
9819
9920
00
Agricultural Sector:
Agriculture is currently the backbone of the Ghanaian economy. In 2000, the agricultural sector employed 70% of the labour force, contributed 39.6% to GDP and accounted for 57% of foreign exchange earnings. This sector is also a key source of raw materials for the cottage and the modern industries. It is also the main source of income for majority of the population and has five sub-sectors -- crops (excluding cocoa), cocoa, livestock, fisheries and forestry.
60
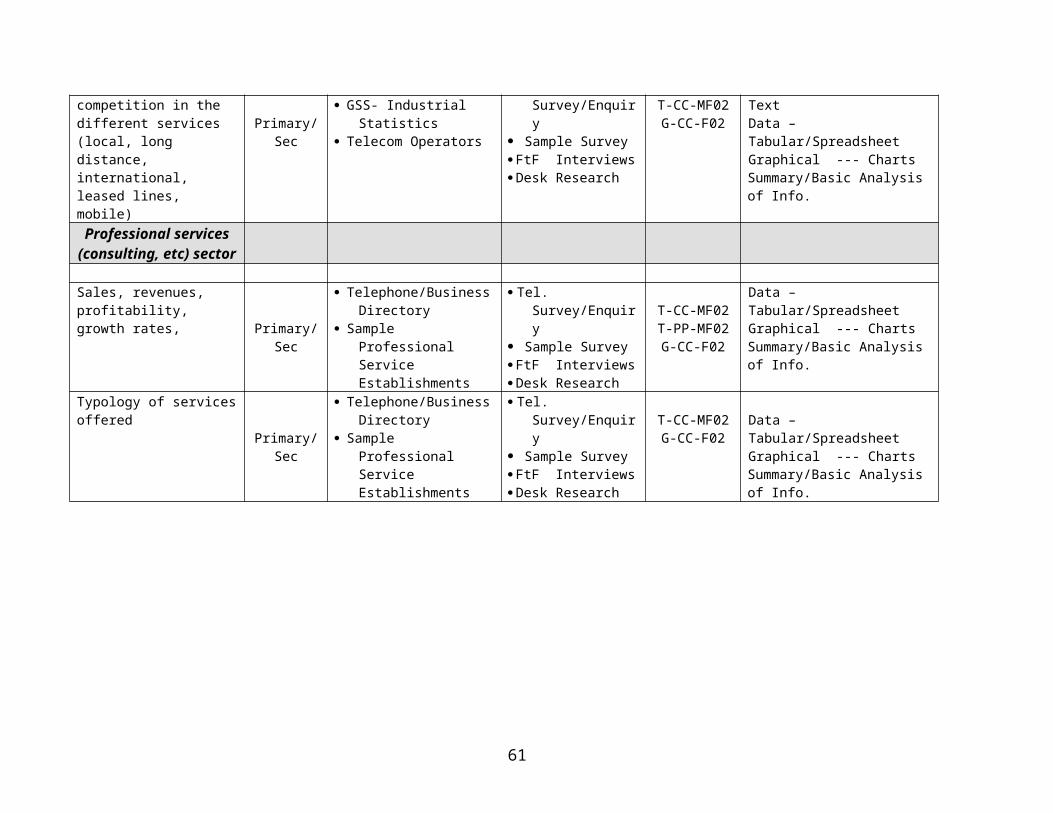
050
100
150200250300350
400450
2000 2001 2002
Cocoa Production ('000 tonnes)
0
0.5
1
1.5
2
2.5
3
1980 2000 Annual Average
Agric Yield (Cocoa) [‘000 of hectogram per hectare]
0
200
400
600
800
1980 1997 Annual Average
Value of Agric Exports ($mill, current prices)
The Industrial and Services Sectors:
Industry, mining, and construction account for about 32% of GDP and 13% of the total work force. Manufacturing is dominated by import-substitution industries. Trade, transportation, finances, public administration, and services account for nearly 28% of the GDP and employ more than 25% of the work force.
Further Sectorial Comparisons
61
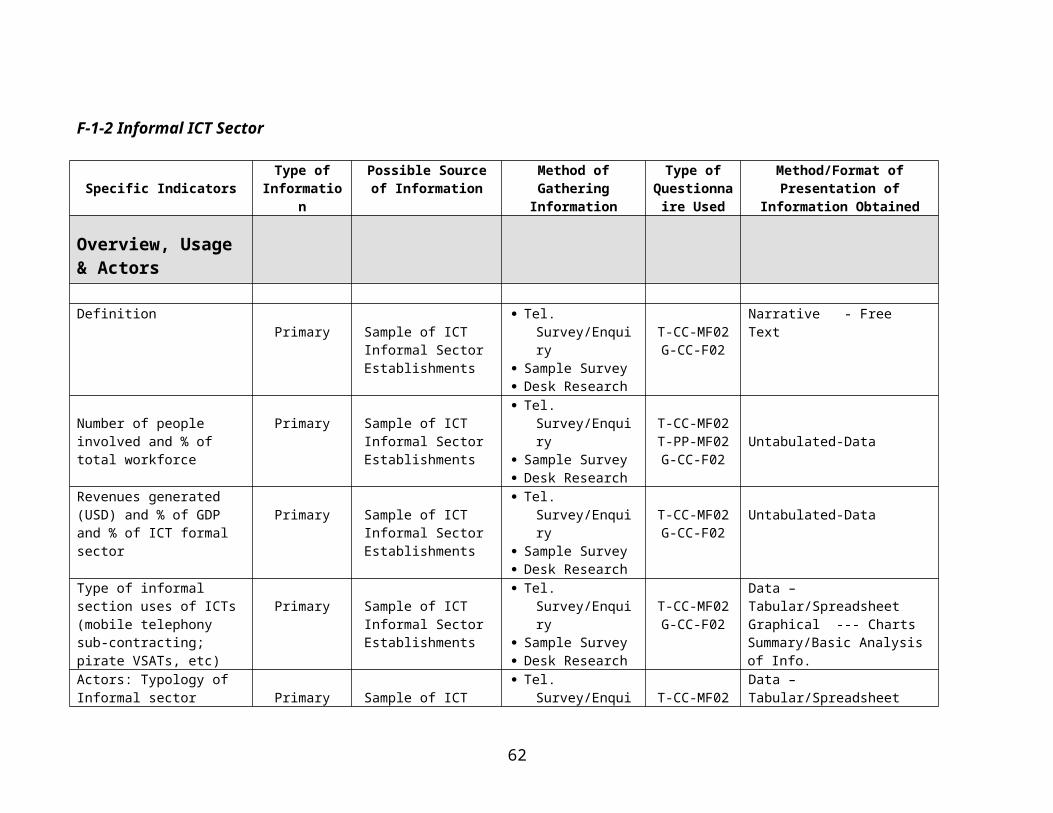
0.00% 10.00% 20.00% 30.00% 40.00%
Agriculture
Industry
Services
Percent Contribution to GDP
% of GDP 36.00% 25.20% 29.70%
Agriculture Industry ServicesAgriculture Sector Services Sector Industrial Sector Total
2.3
4.84.7
3.8
Growth Rate
0
20
40
60
80
100
120
140
Agriculture Industry Services
Percent of population economically active in…
2000
1980
010
20304050
60
1980 2000
Ghana: Structure of the Econ (%GDP)
Agric Indust. Servc
37.8
38.8
39.0
35.8
36.1
24.9
24.3
23.6
25.7
25.3
27.3
27.8
26.2
27.9
28.2
0%
20%
40%
60%
80%
100%
Agriculture Industry Services
Sector as % GDP
1994 1995 1996 1997 1998
62
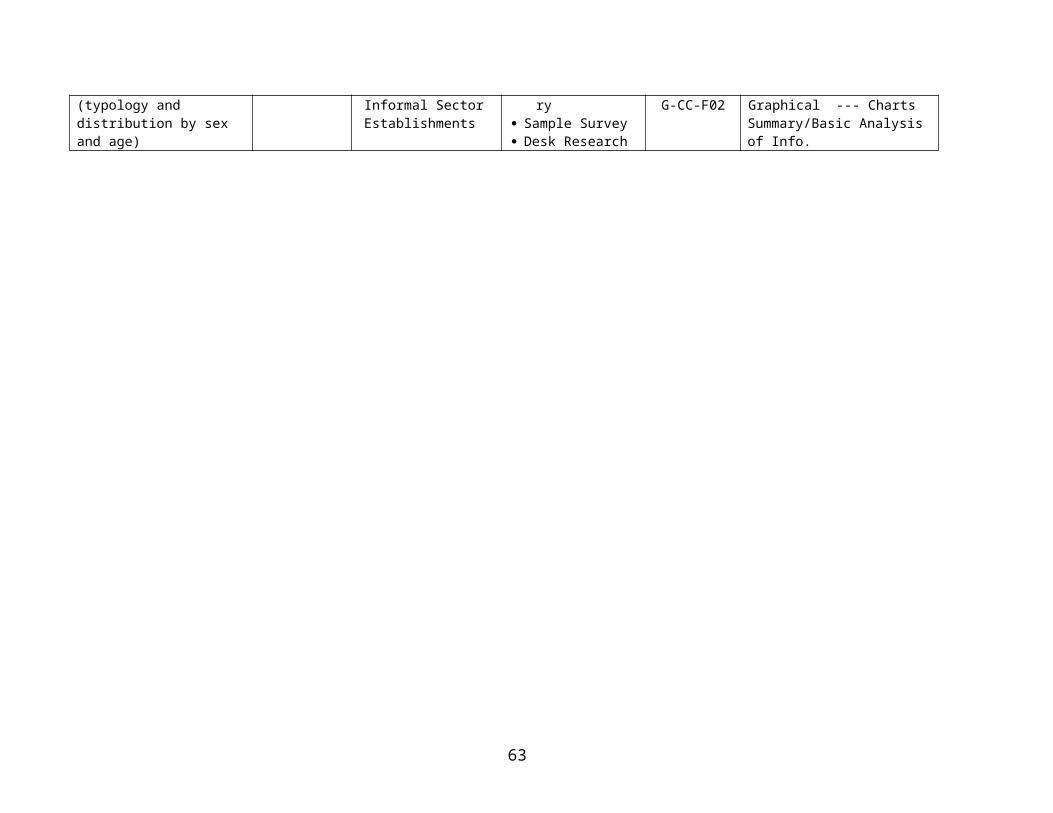
3.4 OTHER KEY ECONOMIC INDICATORS
External Trade and Balance of Payment (cedis million)Year Imports Exports
TotalExports of Domestic
ProduceExports of Foreign
ProduceBalance of
Trade1998 6,737,197 3,889,326 3,889,326 720 (2,847,151)1999 8,700,726 4,724,353 4,723,731 622 (3,976,373)2000 15,792,097 8,754,224 8,658,536 95,688 (7,037,873)
Source: Ghana Statistical Service
-20,000,000
-10,000,000
0
10,000,000
20,000,000
30,000,000
40,000,000
2000 15,792,097 8,754,224 -7,037,873
1999 8,700,726 4,724,353 -3,976,373
1998 6,737,197 3,889,326 -2,847,151
Imports Exports BoP
External Trade and Balance of Payment
Average Yearly Inflation Rate (%)Year Food Non-Food Combined1999 10.275 15.025 12.775 2000 7.908333 24.83333 16.591672001 20.71667 45.38333 34.2752002 21.175 33.35 28.15
Source: Ghana Statistical Service
0
10
20
30
40
50
1999 10.275 15.025 12.775
2000 7.908333 24.83333 16.59167
2001 20.71667 45.38333 34.275
Food Non-Food Combined
Average Y early Inflation Rate
63
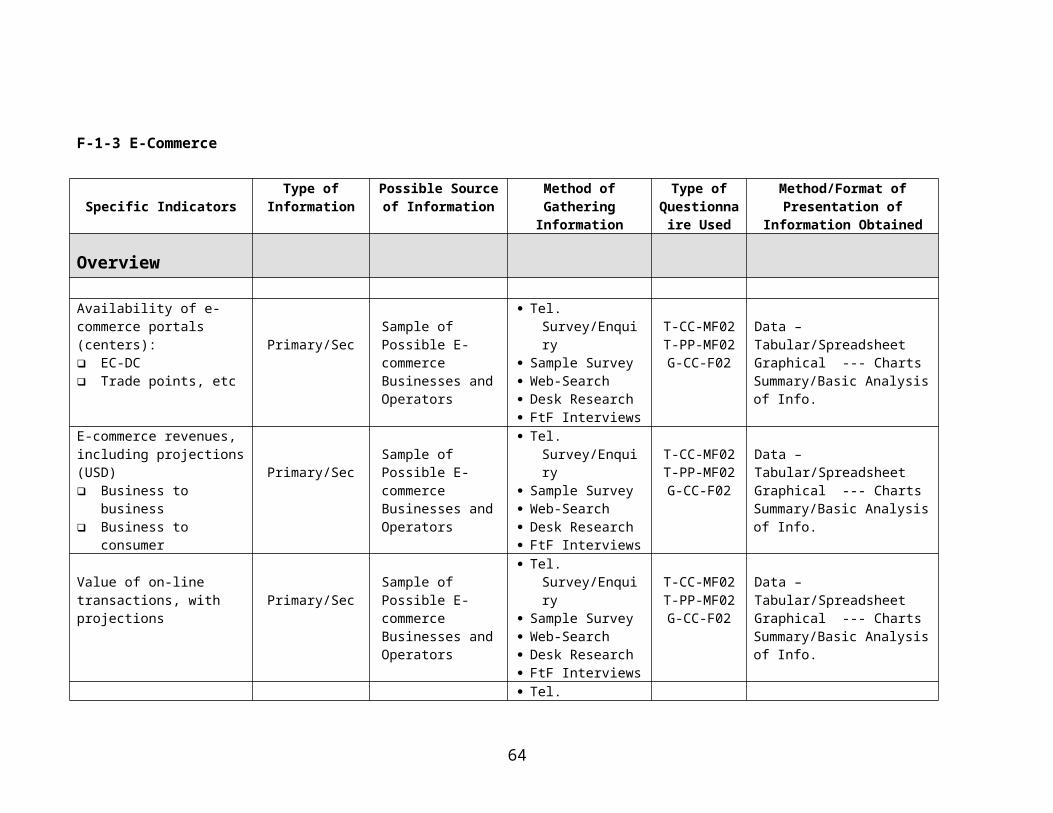
273 272
390
635 645
0
100
200
300
400
500
600
700
1970-1974 1975-1979 1980-2000 2000-2016 2000-2013
Average GNI/cap (US$)
0
1,000
2,000
3,000
4,000
5,000
6,000
7,000
1980 2000
Total External Debt ($ million, current prices)
64
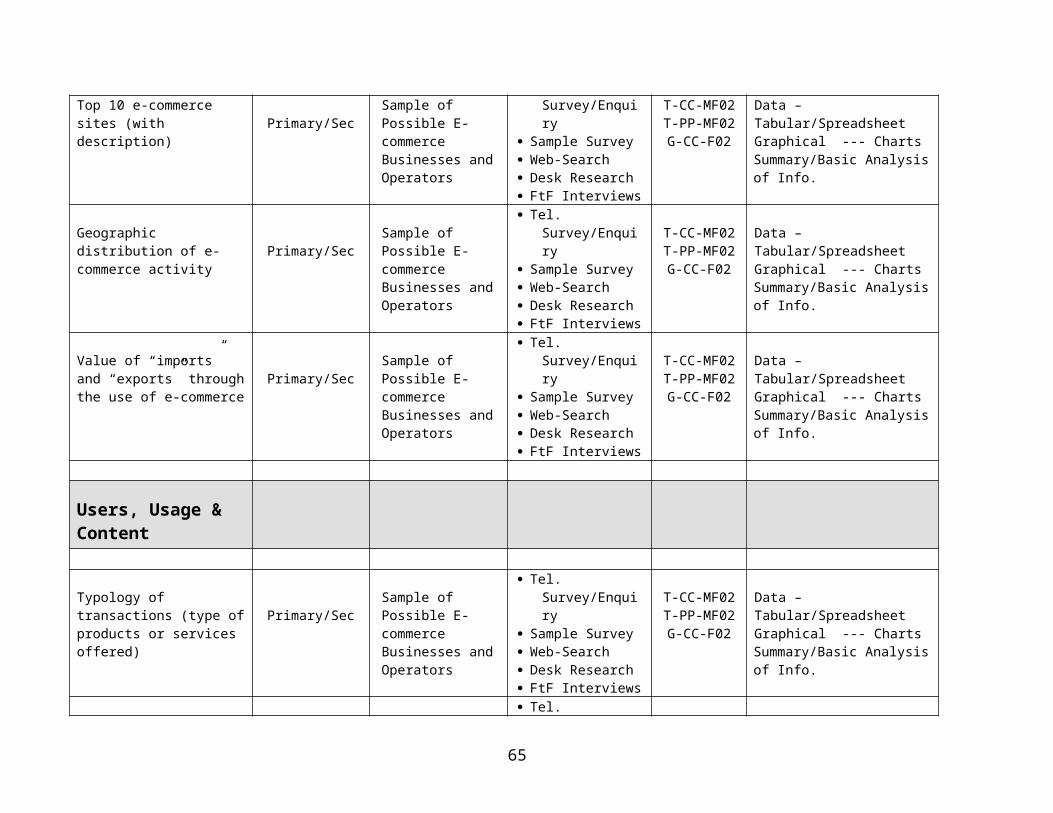
Age and Sex Distribution of Unemployment Rates
Unemployment RatesUrban Rural Ghana
Male Age Group15 – 24 25.3 8.1 12.725-44 14.4 3.2 7.345-64 7.0 3.8 4.8
All 13.9 4.3 7.5Female Age
Group15 – 24 25.9 14.8 18.725-44 11.7 5.2 7.545-64 6.6 3.5 4.5
All 13.0 6.4 8.7Both Sexes
15 – 24 25.6 11.5 15.925-44 12.9 4.3 7.445-64 6.8 3.6 4.7
All 13.4 5.5 8.2 Source: Ghana Living Standard Survey (2000),Ghana Statistical Service
0
5
10
15
20
25
30
Rural 25.6 12.9 6.8 13.4
Urban 11.5 4.3 3.6 5.5
Rural+Urban 15.9 7.4 4.7 8.2
15 – 24 25-44 45-64 All
Unemployment Rates: Urban vrs. Rural
3.5 A PROFILE OF SOCIO-ECONOMIC DEVELOPMENT PROGRAMMES
65
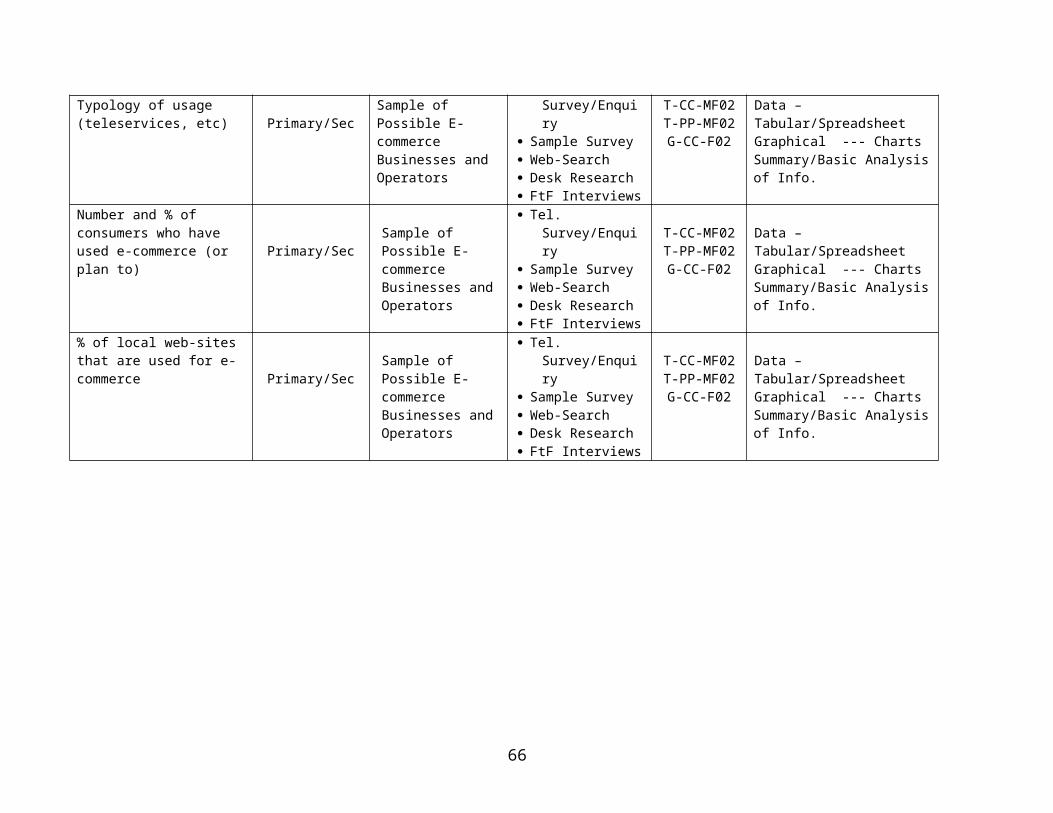
Introduction
Ghana since the 1950’s (and in particular after independence in 1957) developed and implemented a number of socio-economic development programmes.
Prior to the 1980’s the socio-economic development plans formulated and implemented include:
The 1st and 2nd Development and Consolidated Plans (1951- 1959) The Seven-Year Development Plan (1963/64 – 1969/70) The 2-Year Development Plan (1968 – 1970) The Five-Year Development Plan (1975/76 – 1970/80)
The main goals and objective of these pre-1980 socio-economic development programmes and plans include:
To establish a strong progressive society and economy and improve the well-being of all Ghanaians To reduce poverty and facilitate equitable distribution of income Improve access to education, health and housing and reduce the level and impact of unemployment Stimulate overall economic growth, improve agriculture and promote industrialization Enhance human, rural and urban development
The post 1980 saw the development of the Vision 2020: The First Steps (1996-2000), the Interim Ghana Poverty Reduction Strategy Paper (I-PRSP) (2000 -2004) and the Ghana Poverty Reduction Strategy (2002 -2004). A national visioning consultative process to develop a broad-based socio-economic development framework for Ghana is now ongoing.
The Economic Recovery and Structural Adjustment Programmes
Ghana in the early 1980’s embarked on an Economic Recovery Programme (ERP) as part of a Structural Adjustment Economic Programme with the support of the International Monetary Fund (IMF), the World Bank and other donors. The ERP was aimed at reversing the serious economic decline of the pre-1980 and transforming the economy to a liberalized market-driven economy. The programme led to the liberalization of trade, the end of exchange controls and establishment of the Ghana Stock Exchange and the privatization of a number of state owned enterprises.
On the whole the programme resulted in drastic reduction in the rate of inflation from 142% in 1983 to 10% in 1993 and real GDP growth rate improved from 4.6% to 5.3% within the same period. Other improvements include major rehabilitation in the country’s economic, social and physical infrastructure.
The Vision 2020 Programme
The Ghana Vision 2020 is a socio-economic development programme aimed at transforming the country into a middle-income country by 2020. The programme encompasses a number of aspects including: human, rural, urban and economic development. It is also aimed the creation of the requisite infrastructure for public and private participation in the country’s development.
The programme has two phases: the medium term (1996-2000), and the long term. The medium term phase is designed to consolidate the gains achieved through the ERP and lay a solid foundation for accelerated development in the next two decades.
Key Objectives of the Vision 2020
to transform the country’s economy by the target year 2020, from its present low-income status to that of a middle-
66
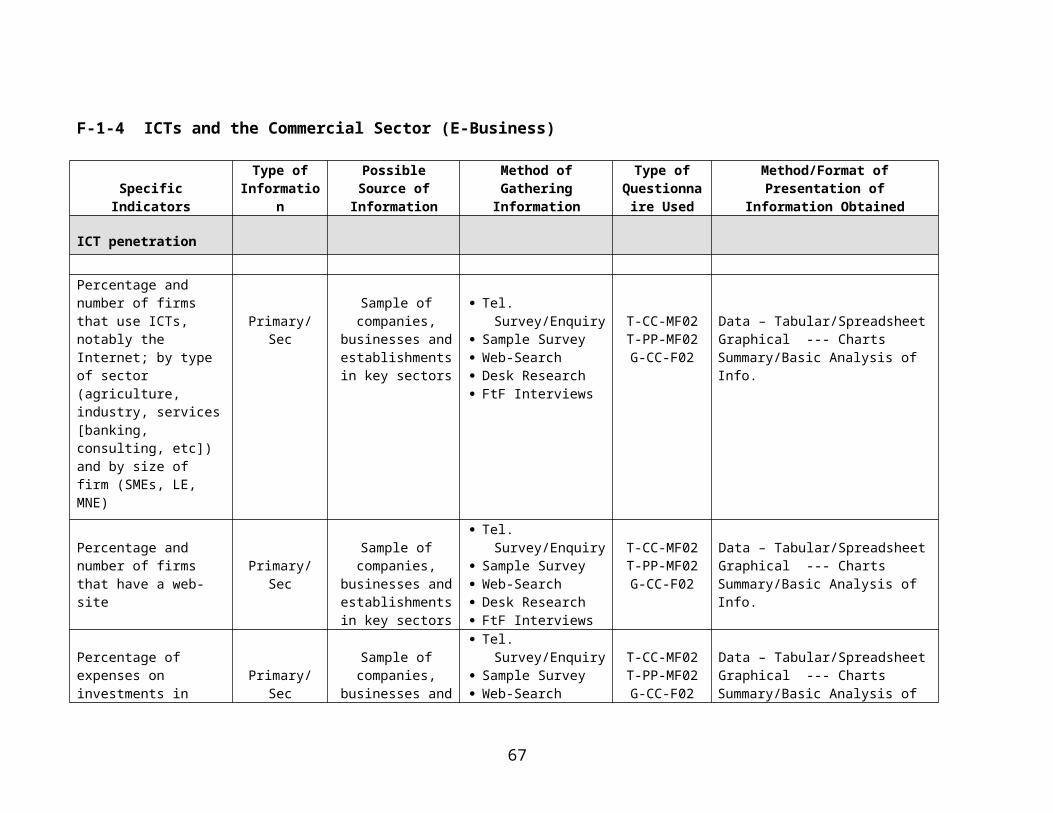
income country of the ranks of the so-called Newly Industrialized Countries; to create an open and liberal market economy, founded on competition, initiative and creativity; to employ science and technology to derive maximum productivity from the use of all our human and natural
resources;, to optimize the rate of economic and social development, with due regard to the protection of the environment and
to equity in the distribution of the benefits of development; to reduce the population growth rate by one percent and increase the national income growth by at least 8% per
annum; and to eventually make Ghana a country in which the people will have, among other things, a long, healthy and
productive life with access to an enlarged range of choices of employment, shelter and leisure.
The Ghana Poverty Reduction Strategy (2002 -2004)
The Ghana Poverty Reduction Strategy (2002 -2004) representing a policy framework to support growth and poverty reduction over a three year period has its goal as: ensuring a sustainable equitable growth, accelerated poverty reduction and the protection of the vulnerable and excluded within a decentralized democratic environment. The broad objectives of the GPRS is to: ensure economic stability for accelerated growth; increase production and gainful employment; facilitate equitable human development and provision for the vulnerable and the excluded; ensure good governance and partner with the private sector as the main engine of growth.
Developing a New Development Vision: From Poverty Reduction to Wealth Creation
The ongoing socio-economic framework development visioning processing currently being referred to as: From Poverty Reduction to Wealth Creation --- Creating a Vision for Ghana, has as its main goals a focus on the promotion of private sector-led economy; the development of the agro-based industry, the development of agriculture sector through the concentration on selected crops – cocoa, cassava and oil palm and on ICT-driven socio-economic development with the aspiration to transform Ghana into the IT hub of Africa. The key objectives are to: ensure rule of law and good governance; provide direct support for human development and provision of basic services; sound economic management; provide special programme in support of the vulnerable and excluded; and to decentralize government operations
67
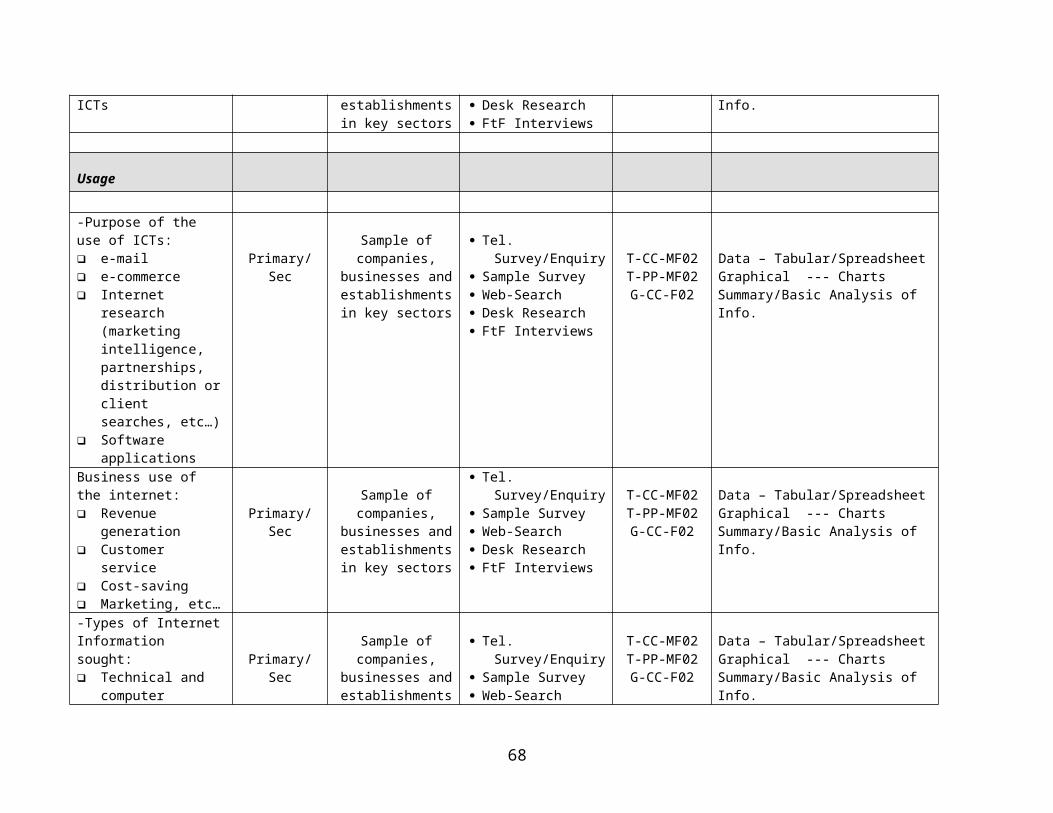
3.6 THE POLITICAL SYSTEM OF GHANA: AN OVERVIEWThe Present Political System
Political System:Party in Power:
Political & Economic Ideology:
Multiparty Democracy New Patriotic Party (NPP) (2001 -) Liberal Political & Parliamentary Democracy, Free Market Economic
Historical Highlights of the Political Regimes of Ghana (1897 to Date)Period Description
1897-1920s British West Africa Aborigine Rights Protection Society founded by small urban elite to protect
property rights from British encroachment.
1920s National Congress of British West Africa. --- Regional educated elites' made an effort to influence the British to provide Africans with some elected representation.
1947-55 United Gold Coast Convention (UGCC). Postwar party of educated Africans demanding a voice in the government. The UGCC brought Kwame Nkrumah back from England as its General Secretary.
1949-66 Convention People's Party (CPP) civilian government led by Dr. Kwame Nkrumah. The CPP government was the first government after independence. This government was overthrown in military coup in 1966.
1966-72 National Liberation Council (NLC) military Government led Gen. J.A Ankrah and later on by Gen. A.K Afrifa
1969-72 Progress Party (PP) civilian Government led by Dr. K.A Busia. This government was overthrown by a military coup led by General I.K Acheampong in 1972
1972-75 National Redemption Council (NRC) military Government led by Gen. I.K Acheampong.
1975-79
Supreme Military Council (SMC) Government led by Gen. I.K Acheampong who was later on deposed in a palace coup in 1978 and replaced by Gen. K. Akuffo as Head of State. The SMC Government under Gen. Akuffo was overthrown by junior officers in 1979 that subsequently formed the Armed Forces Revolutionary Council (AFRC) under the leadership of Flt Lt. J.J Rawlings. The AFRC conducted elections and hand over to a civilian government after 6 months in power.
1979-81 People's National Party (PNP) civilian Government led by Dr. Hilla Limann. This government was overthrown in a military coup in 1981 led by Flt. Lt. J.J Rawlings
1982-92 Provisional National Defence Council (PNDC) military government led by . Flt. Lt. J.J Rawlings. The PNDC Government conducted elections in 1992, this was won by the National Democratic Congress (NDC) under the leadership of Flt. Lt. J.J. Rawlings
1992-2001 National Democratic Congress (NDC) civilian government under the leadership of Flt. Lt. J.J. Rawlings as President
2001 - National Patriotic Party (NPP) civilian Government under the leadership of Mr. J.A Kuffour.
68
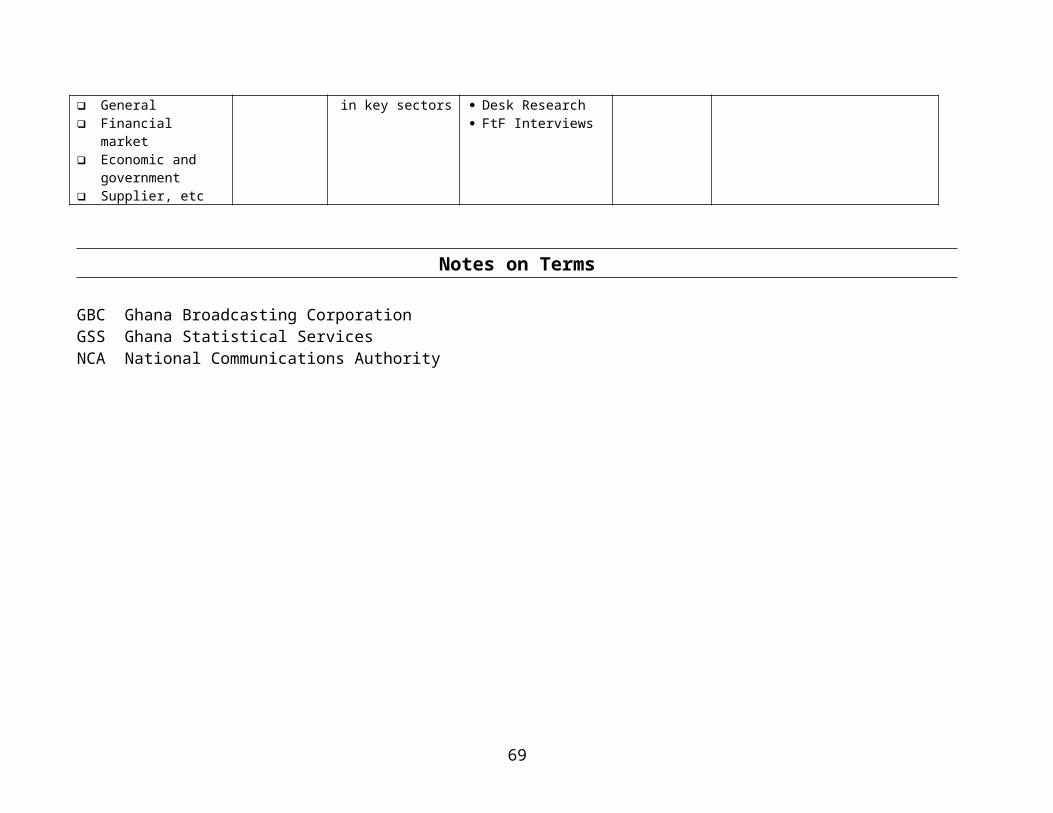
3.7 Summary of Ghana’s Political, Administrative and Judicial Systems
Government
Ghana at independence in 1957 had a parliamentary democracy, followed by a number of alternating military and civilian governments. In January 1993, military Government gave way to Fourth Republic after presidential and parliamentary elections in late 1992. A change of Government took place in January 2001 after presidential and parliamentary election in December 2000. The 1992 constitution, which is the current constitution of Ghana divides powers among a President, Parliament, Cabinet, Council of State, and an independent Judiciary.
Administrative Divisions
Ghana is divided into ten administrative regions which are in turn divided into 110 districts, each with its own District Assembly. The local government administrative system is made up of various types of councils, including 58 town or area councils, 108 zonal councils, and 626 area councils. 16,000 unit committees on lowest level.
Judicial System
Ghana’s legal system is based on Ghanaian common law, customary (traditional) law, and the 1992 constitution. Court hierarchy consists of Supreme Court of Ghana (highest court), Court of Appeal, and High Court of Justice. Beneath these bodies are district and local courts. Other judicial institutions include public tribunals, and traditional courts administered by local traditional elders and rulers.
69

3.8 CULTURAL
Principal Religions and their Distribution
Ghana, by its constitution is a secular state with a number of principal religions; the main ones are: Christians, Moslems and a number of indigenous religious dominations. There are a number of Christian dominations, including, Catholics, Anglicans, Methodists, Presbyterians, Seventh Day Adventist, Jehovah Witness, Pentecostal, Evangelists among others. There are also a number of Moslem sects but not as many as is the case of the Christian dominations. On the whole, official statistics shows that the Christians are in the majority.
Cultural: Religion
Percent Distribution
Principal Religion
Christian 72.8%
Moslem 7.8%
Others 19.4% Source: Ghana Statistical Service
Percent Distribution of Prncipal Religions
Christian
Moslem
Others
70
The Principal Languages of Ghana
Ghana’s official language is English. There are over hundred indigenous languages and dialects. The principal local languages are Akan (which have dialects like: Ashanti, Fanti, Akwapim etc), Ewe, Hausa, Dagomba, Nzima among others. Apart from the English language, other foreign languages spoken are: French, Arabic, Russian and others.
Principal Languages Percentage of Population
Akan 52.6%
Ewe 12.4%
Ga 10.2% Hausa
1.3% Dagomba
3.8% Others
19.7%Foreign Languages
Percentage of Population
English (0fficial)85%
French3%
Arabic2%
Others10%
Source: Ghana Statistical Service
71
Percentage Distribution of Princ ipal Languages
Ga
Others
Ewe
Akan
Hausa
Dagomba
72
CHAPTER FOURCHAPTER FOUR
THE ICT SECTOR: AN OVERVIEW OF NATIONAL ICT POLICY REGIMES, FRAMEWORKS AND STRATEGIES
Introduction
This chapter documents details relating to Ghana’s ICT policy regimes, frameworks and strategies. Specifically, details are provided in relation to the evolution and development of the ICT sector as well as issues relating the liberalization of the ICT sector and the regulatory regime of the country. Also documented are specific details relating to Ghana’s national ICT policy and plan development process.
4.1 The Evolution and Development of the ICT Sector
Ghana’s ICT sector has undergone a remarkable transformation during the past decade and half. This has brought about a number of significant changes in the sector, including the introduction of cellular phones, FM radios , cable TV and the Internet. The emergence of these communications services gave rise to a number of institutional and regulatory initiatives including: the separation of posts and telecommunication (P&T) into different corporations the separation of regulatory responsibilities from operational and service provision functions the diversification of sources of telecommunication services and the creation of a new Ministry of Communication (now, the Ministry of Communications and
Technology)
The Genesis of the Accelerated Development Program (ADP -2000)
Ghana deregulated the communications sector in 1994 when the government initiated the implementation of a five year comprehensive restructuring of the industry --- the Accelerated Development Program 1994-2000 (ADP 2000). A National Communications Act which was passed in 1995 provided for the creation of a fixed network duopoly. The aim of the ADP was to increase the teledensity of the country, allow private participation in some sectors of the industry and permit other network operators to have the same rights and privileges to compete with the national operator, Ghana Telecom Ltd --- as a step towards introducing competition at all operational levels of the telecommunications market place.
The main policy objectives of the ADP were to:
achieve a teledensity between 1.5 and 2.5 lines per 100 people; improve public access in rural and urban areas, through the provision of payphone facilities (public and
private); expand the coverage of mobile services; promote Ghanaian ownership and control of telecommunications companies; retain an overall public regulatory control of the sector through the creation of a single agency: the National
Communications Authority (NCA).
The Government through the ADP programme, adopted a number of strategies including:
the authorization of two national network operators: Ghana Telecom Ltd. and WESTEL (Westel
73
Telesystems); support of new financing arrangements which promote investment in new telecommunications infrastructure
throughout the country; and privatization of Ghana Telecom through the sale of a strategic stake to an international operating company
combined with measures to broaden share ownership in Ghana.
The ADP Programme ended in 2000 with the realization of the following objectives: Teledensity increased from 0.34 lines for 1000 inhabitants in 1994 to 1.16 lines for 1000 inhabitants in
2000 Public phones per 1000 inhabitants increased from 0.001 in 1994 to 0.16 in 2000 The creation of the National Communications Authority (NCA) in 1996 as an independent
communications regulatory agency. The licensing of a second national operator - Westel Telesystems The partial privatization of Ghana Telecom with Government maintaining 70% share with GCom
Malaysia, the strategic investor having 30% share The liberalization of the communication sector, enabling the operations of numerous private FM stations
and a number of private TV stations.
Below is a comparison of the performance of the ICT Sector measured in terms of key indicators during the time-frame of ADP
Measuring the Impact of the ADP
Indicator 1995 2001 Percent Change
Telephone Lines 63,067 242,100 284%
Teledensity 0.36 1.16 222%
Digital main line (%) 89.53 100 12%
Waiting list for mail lines 28,349 15,567 45%
Public Telephone 30 3180 10500%
Public Tel.(per 1000 inhabitants) 0.001 0.16 15900%
Number .of Mobile Subscribers 6,200 193,800 3026%
Mobile Subscriber (per 100 inhab.) 0.04 0.926 2215%
Number of Telecenters 30 1500 4900%
Comms Centers (per 100 households) 2 12 500%
74
Personal Computer (per 100 inhab) 0.12 0.33 175%
TV’s per 100 inhab. 4.04 11.42 183%
Number of Internet Host sites 6 235 3817%
Number of ISPs 1 10 900%
No. Internet Users 300 40,500 13400%
Internet Users (per 10,000 inhab.) 0.18 19.36 10656%
4.2 Liberalizing the Ghana ICT Sector
The liberalization of the communications sector, was a key component of the Accelerated Development Programme (ADP) for the ICT sector. As part of its policy to liberalize the sector and open it up for competition, the Government granted a second national operating license (the "SNO License") for the provision of telecommunications services to Westel Telesystems. As with the license issued to Ghana Telecom the SNO License permit Westel Telesystems to provide domestic and international telecommunications services within Ghana including voice telephony, leased lines, public pay phones, telegraph and telex, data, mobile and value added communication services. The GT License and the SNO License allows each of the licensee to:
develop, own and operate a fixed telecommunications service system, develop own and operate a wireless system; develop, own and operate transmission, reception, switching and any other associated equipment for the
exchange of wireline and wireless communications; develop, own and operate earth stations to be connected to other public and private satellite communication
systems; connect to other licensed public and private systems in Ghana and to public and private
telecommunications systems abroad; procure, distribute, sell, rent, install and maintain customer equipment; and offer any other related activities under the scope of the license.
The GT License and the SNO License were each granted for an initial period of 20 years, with the possibility of renewal at the expiration of the initial term as long as the licensee is in compliance with the material provisions of its license. During the first five-year period of each license, the SNO and GT will be the exclusive operators of fixed telecommunications services in Ghana. This exclusivity period terminated in February 2002.
The liberalization of the communication sector also resulted in the setting up of Capital Telecom, a wholly owned Ghanaian company that was set up in 1994 and began operations in February 1997, provides rural telecommunications. Capital Telecom provides rural communications using WLL to about 500 subscribers in southern Ghana.
75
4.3 On the Regulatory Environment and FrameworkThe separation of telecommunication regulatory responsibilities from operational functions was a key component of the telecommunication industry reform programme embarked on by the Government of Ghana as part of the ADP-2000. A result of this was the setting up the National Communications Authority (NCA) by an Act of Parliament in 1996 --- with the aim to regulate communications by wire, cable, radio, television, satellite and similar means of technology for the orderly development and operation of efficient communications services in Ghana and to provide for related purposes. The NCA is serving as the main communications regulatory agency provides mechanisms for the regulation of the communications sector and to promote a stable operating environment for all participants, while promoting fair competition and efficiency.
The specific objectives of the Authority are to:
ensure that there are provided throughout Ghana as far as practicable such communications services as are reasonably necessary to satisfy demand for the services;
ensure that communications system operators achieve the highest level of efficiency in the provision of communications services and are responsive to customer and community needs;
promote fair competition among, persons engaged in the provision of communications services; protect operators and consumers from unfair conduct of other operators with regard to quality of
communications services and payment of tariffs in respect of the services; protect the interest of consumers; facilitate the availability of quality equipment to consumers and operators; promote research into and the development of technologies and use of new techniques by providers of
communications services and to develop adequate human resources in collaboration with such other government departments and agencies, as the Authority considers appropriate.
The Authority is tasked with the responsibility to:
advise the Ministry of Communications and Technology on policy formulation and development strategies for the communications industry;
grant license for the operation of communications systems; assign allocate and regulate the use of frequencies in conformity with international requirements pursuant to any
relevant treaties. Protocols or conventions to which Ghana is signatory; prepare and review National Frequency Allocation Plan; establish the national numbering plan and to assign numbers accordingly; act internationally as the national body representing Ghana in respect of communications; designate standards of communications equipment; determine a code of practice relating to dealings by operators with international communications operators and
regulate international accounting rates; provide guidelines on tariffs chargeable for the provision of communications services; provide where practicable authorizations to operators of radio telephone stations on ships and aircraft registered
76

in Ghana; establish training standards for communications operators and to monitor the implementation of the training
standards; provide advice and assistance to operators in the communications industry for which there may be charged such
fees as the Authority considers appropriate; and maintain a register of operators; establish by regulations the protection of data on computer files and their transmission and to safeguard the
secrecy of communications and the protection of personal data in conjunction with communications systems operators; and
to perform any other functions assigned to it under the Act or any other enactment.
4.4 On the Ghana ICT for Accelerated Development (ICT4AD) NICI Process
The Ghana national information and communications infrastructure (NICI) process began in 1998 under the auspices of the Economic Commission for Africa (ECA) in partnership wit the International Development Research Center (IDRC) and other development partners. A number of national workshops and meetings were held on the process resulting in a draft document on various types of national ICT projects that could be undertaken by the Government, with the involvement of the private sector and civil society.
The change of government in 2001 gave rise to a renew impetus to develop a comprehensive ICT policy and Plan for Ghana as part of the African Information Society Initiative (AISI) Initiative of the ECA.
The Government has set-up a National ICT Policy and Plan Development Committee to develop for Ghana an ICT-led Socio-economic Development Policy and the corresponding Plan on the basis of an extensive national consultative exercise.
The process, commonly referred to as: the Ghana ICT for Accelerated Development (ICT4AD) process is based on a methodology developed by the ECA, and is to being carried out in three phases:
Phase 1 : The first phase concentrates on the development of an Integrated ICT-led Socio-Economic Development Framework for Ghana (The Ghana Framework Document). The Framework Document will among other things provide an analytical basis for the development of the subsequent Policy document and the Plan. The study underlying the development of the Framework will be based on the review and analysis of the current national socio-economic development frameworks, policies, strategies and provisions as well as the ICT development, deployment and exploitation profile of Ghana;
The premise is that: the Framework Document will specify and define the general problem and policy areas as well identify specific policy issues and orientations that are required to guide the Policy development process and the subsequent Plan.
Phase 2: This phase of the Ghana Process concentrates on the development of an Integrated ICT-led Socio-Economic Development Policy and Strategies for Ghana (The Policy Document).
The Policy Document will provide details of the Government’s policy commitments in relation to WHAT need to be done towards the realization of the Vision for Ghana through the exploitation and development of ICTs. The Plan, to be developed in the 3rd Phase of the Process will provide details of HOW these policy commitments of the Government can be translated into concrete programmes and initiatives for implementation.
Phase 3: This final phase of the Process is to be devoted to the development of 1 st ICT-led Socio-Economic Development Plan for Ghana guided by the Government’s policy commitments detailed in the Policy Document.
77

This Plan, the first of four Yearly Plan is to serve as a cornerstone of the Government’s socio-economic development plan over four year. The Task is to develop an integrated ICT and socio-economic development Plan with the capability to support the development of the necessary economic base and environment for accelerating Ghana’s development towards an information rich and knowledge base economy and society.
78
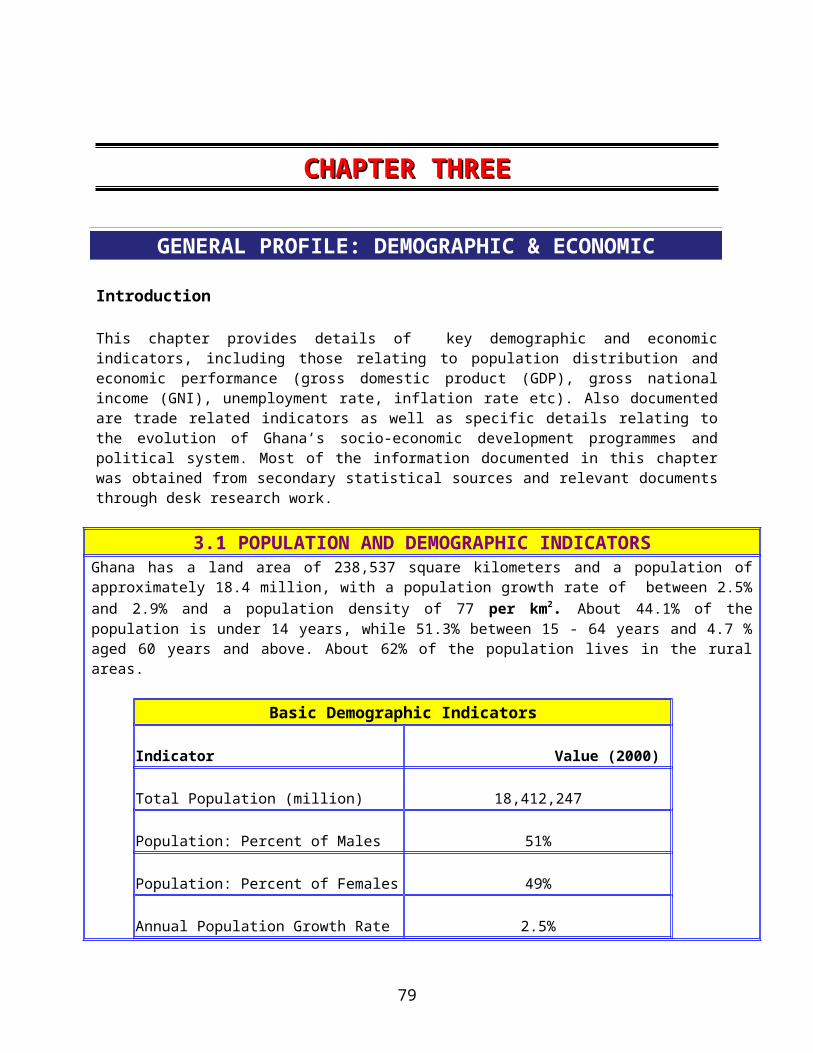
CHAPTER FIVECHAPTER FIVE
THE ICT SECTOR: THE KEY PLAYERS AND STAKEHOLDERS
Introduction
This chapter provides details of the key players and stakeholders in the Ghana ICT Sector. This sector is dominated by a number of key stakeholders from both the public and the private sector. The key ones are:
The Ministry of Communications and Technology The National Communications Authority The Communications Service Providers Computer Companies
5.1 The Ministry of Communications and Technology
The Ministry of Communications and Technology (formerly known as the Ministry of Communications) was created in 1997 to facilitate the strategic development and application of best practices and use of the various communication channels resources ( human, material and technological) for effective communications in Ghana. It embarked on a process aimed at formulating a comprehensive National Communications Policy for Ghana. A draft Policy document is still under development,
5.2 The National Communications Authority (NCA)
The separation of telecommunication regulatory responsibilities from operational functions was a key component of the communications industry reform programme embarked on by the Government of Ghana since 1994. A result of this was the establishment of the National Communications Authority (NCA) by an Act of Parliament in 1996 to regulate communications sector.
5.3 The Communications Service Providers
Three broad types of communications service providers can be identified, namely: Telecom Operators, Cellular Phone Service Providers and Internet and Connectivity Service Providers.
Telecom Operators
Two companies have been licensed to provide national and international telecommunication services; these are: Ghana Telecom Ltd. ACG Telesystems Ltd and Capital Telecom
Ghana Telecom (GT) was incorporated in 1995 as a successor to the telecommunications division of Ghana Posts and Telecommunications Corporation. The company was privatized in 1996, with a Malaysian-led Consortium (Telkom Malaysia) taking a 30% stake in the company. As part of the
79
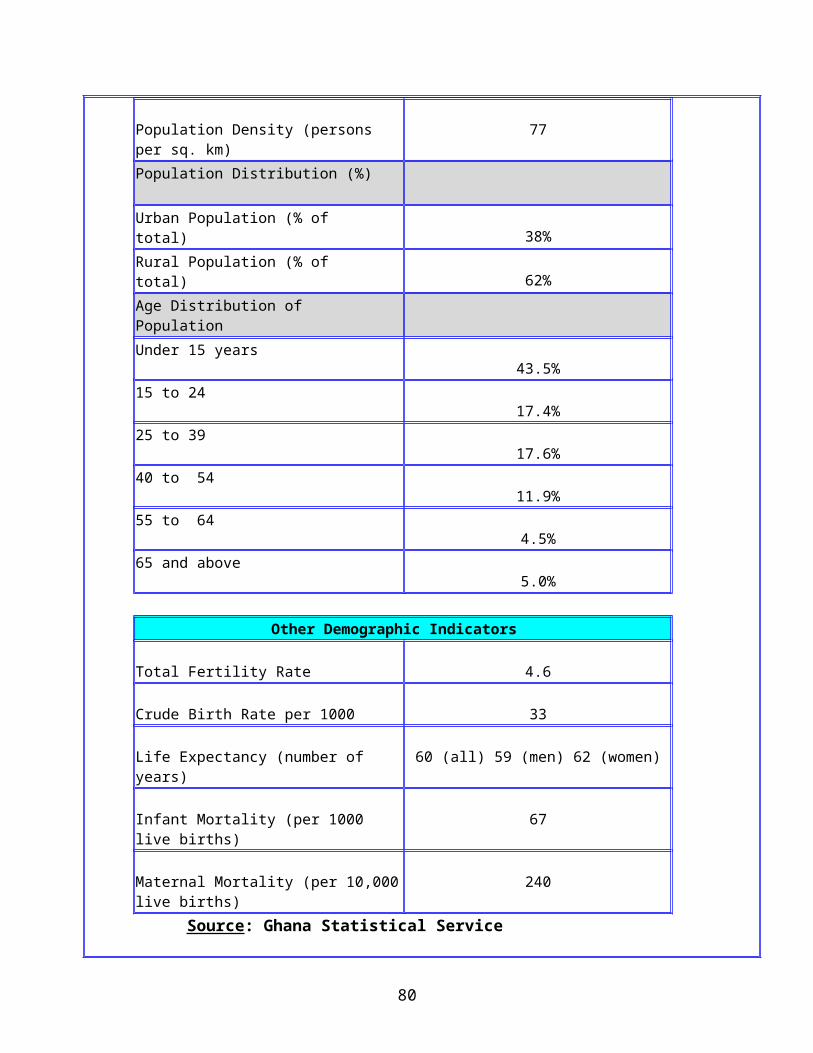
conditions governing the sale of 30% of its shares and the granting of its operating license, GT is required to meet two main development targets: network expansion and service quality improvements.
Ghana Telecom is currently the leading provider of telecommunication and related services in Ghana. It is also one of Ghana's largest companies, with 1995 sales and assets of US$571 million and US$222 million, respectively. The primary focus of Ghana Telecom’s business strategy is to enhance its position as the leading provider of telecommunications services in Ghana and further develop its strong customer base and expand the scope of its telecommunications services and products. The key elements of this strategy include:
continued network investment; introduction of new technologies; enhanced marketing and customer service; new value-added products; mobile . services, and improved management and organizational structure.
As at the end of 1997, GT has a total of 160,000 telephone lines, of this about 100,000 have been connected, resulting in a teledensity of 0.6 lines per 100 inhabitants. By April 1998, the figure of connected lines was about 112,000 compared to an estimated demand in excess of 300,000. GT’s current network has the following features: switching network, transmission network, customer access, and gateway access and data services. Ghana Telecom currently operates both digital and analogue systems. At present its switching system and transmission network is 100% digital.
ACG Telesystems Ltd. is a joint venture between the US owned Western Wireless Company (56% share), Ghana National Petroleum Company (GNPC, 34% share) and ECG Telesystems (10% share). This Consortium trade under the name WESTEL. The licensing of a second national operator is expected to meet the current backlog of telephone lines being demanded by consumers and to ensure efficiency and improved services. WESTEL provides, voice, fax, and data services as well as network transit services to mobile operators.
Capital Telecom is the third telecom operator. The company is not a national operator like the other two. It is licensed to provide only rural telecommunication services.
Cellular Phone Service Providers
Ghana currently has four cellular phone operators: Millicom Ghana Ltd., Celltel Ltd. and Scancom. Ltd.
Millicom Ghana Ltd. is the first cellular network and is a subsidiary of Millicom International. It started its operations 1991. Millicom Ghana uses the ETAC System and had over 22,000 subscribers in 1998 with a market share of above 70% of the mobile market in the country. The company started operating GSM system in 2002. The services offered by the company include voice, data and fax services.
Celltel Ltd. was licensed in 1993, and became operational in 1995. It uses the AMPS technology. The services they currently offer include: voice (with facilities for call waiting, call forwarding and conferencing), data and fax transmission.
Scancom Ltd. was licensed in 1994 and became operational in 1996. Operating under the service name Spacefon, it provides a GSM 900 based fully digital mobile telephone service covering voice, data and fax services.
80
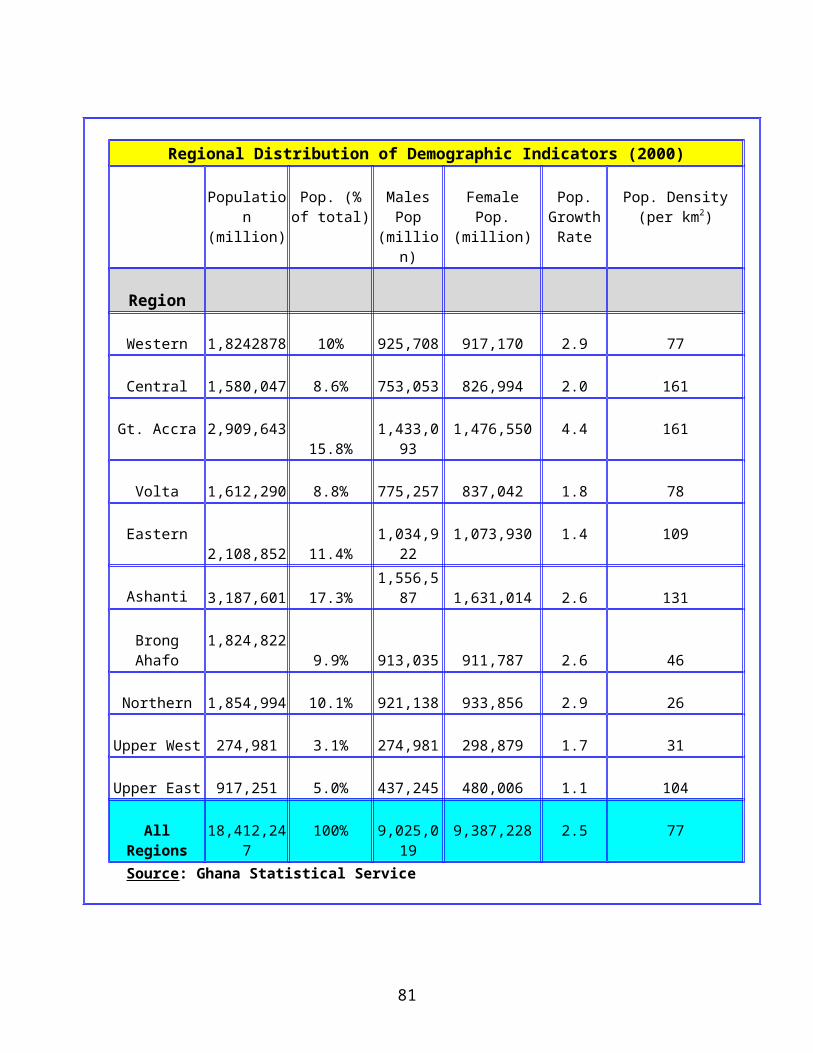
Ghana Telecom Ltd, one of the national fixed line operators, is also providing GSM mobile services to subscribers from all the 10 regions of Ghana. Finally, WESTEL Ltd, the second national operator, is also planning to operate a nation-wide GSM cellular service.
Internet and Connectivity Service Providers
The Internet service market is one of the dynamic and competitive areas of Ghana’s information and communication sector. Currently there are a number of Internet and Connectivity Service Providers operating in Ghana --- all private companies. The key ones are: Network Computer Systems (NCS) Ltd, Internet Ghana Ltd., and AfricaOnline (GH) Ltd, Some of the Universities and the Research Institutes also provide Internet services to their staff and students and to the public on a limited scale. A number of the large ISPs like the NCS and Internet Ghana also serve as connectivity and gateway service providers to large corporations and the smaller ISPs. Ghana now has over 4MB long haul link to the international Internet backbone via these gateway service providers.
The services provided by the ISPs in Ghana include:
Dial-up access to the Internet Leased line Connectivity for corporate body accounts, transiting GT network. National Backbone connectivity services Wireless Connectivity for Corporate bodies and Institutions. Web hosting and Publishing Services Web broadcasting services Electronic Commerce (e-commerce) services
Summary of Communications Service Providers
Category No. Authorized No. Operational
National Fixed Line Operators 3 3
Mobile Cellular Operators 5 4
Paging Service Providers 10 7
Internet Service Providers (ISPs) 42 9
VSAT Data Network Operators 45 31
Public/Corporate Data Operators 26 12 Source: National Communications Authority (2001)
5.4 The Computer Companies and Service Providers
The Ghanaian ICT sector is dominated by computer vendors and distributors of computer products and services. The hardware sector is dominated by small enterprises mainly involve in the sale of computer
81
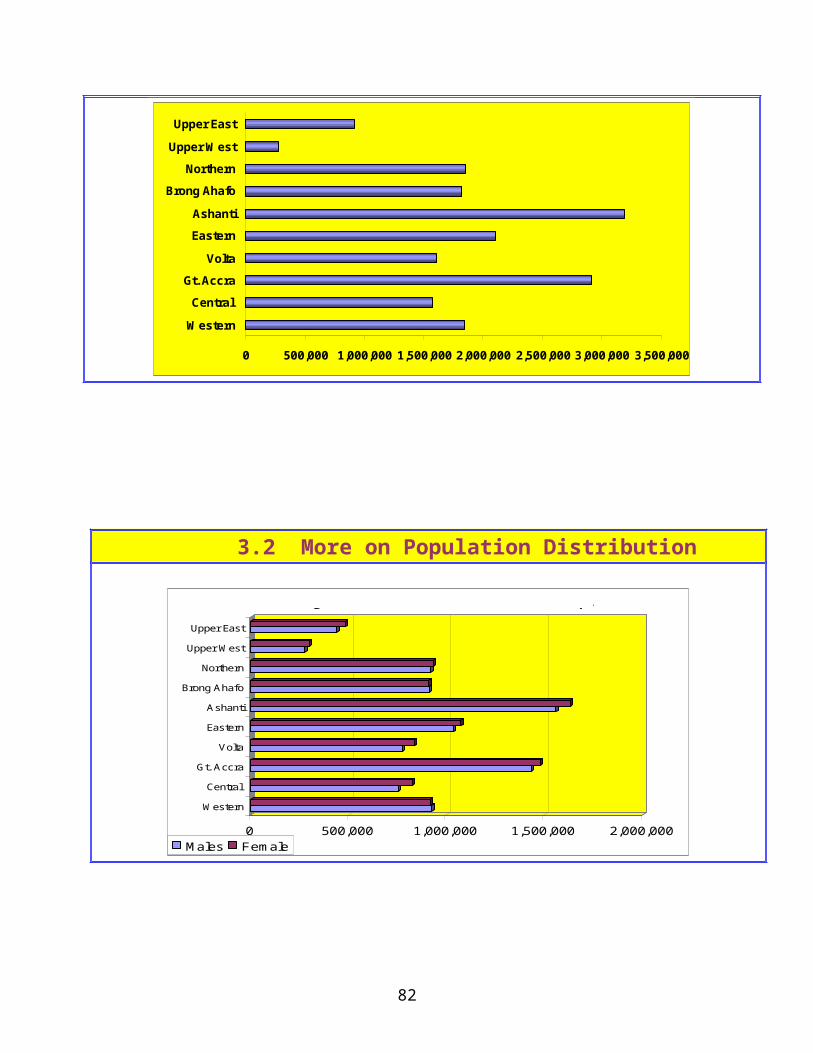
and peripheral units, while the software sector mainly consist of companies selling standard and off-the-shelf packages and software.
On the whole there is not much happening in the ICT production sector of the Ghanaian economy. Most of the ICT equipment and products are imported. There is some limited local assembly of computers. There are, however, facilities for computer system repair and maintenance. Software development is also done on a limited scale by a number of local software development houses, however, most are involved in customizing applications for clients in the banking and financial sector.
Major Communications Service ProvidersTelecom Operators [Fixed Line]National operator Ghana TelecomSecondary PTO Westel TelesystemsRegional telecom operators Capital Telecom LtdMobile OperatorsMobile operator 1 Ghana Telecom LimitedMobile operator 2 Milicom Ghana LimitedMobile operator 3 Scancom Ghana LimitedMobile operator 4 CelTel GhanaVSAT Service ProvidersProvider 1 Westel TelesystemsProvider 2 Ghana TelecomMajor Paging Service ProvidersProvider 1 Punch Communications LtdProvider 2 American Telecoms SystemsProvider 3 Cubic Paging Systems LtdProvider 4 Page One Comms. LtdProvider 5 City Pagers LtdProvider 5 Ameritel CompanyMajor Internet Service ProvidersProvider 1 Network Computer SystemsProvider 2 Africa OnlineProvider 3 Internet GhanaProvider 4 Africa Express Comms. LtdProvider 5 Ghana TelecomProvider 6 Ghana Classifieds Provider 7 World Link Comms. LtdProvider 8 IDNMajor Backbone Access ProvidersProvider 1 Volta Comms Ltd (VoltaCom)Major Public/Corporate Data Network Service ProvidersProvider 1 Data Telecom LtdProvider 2 Volta Comms Ltd (VoltaCom)Provider 3 GS Telecom LtdProvider 4 Afripa Telecom GroupProvider 5 Satellite Connexions
82
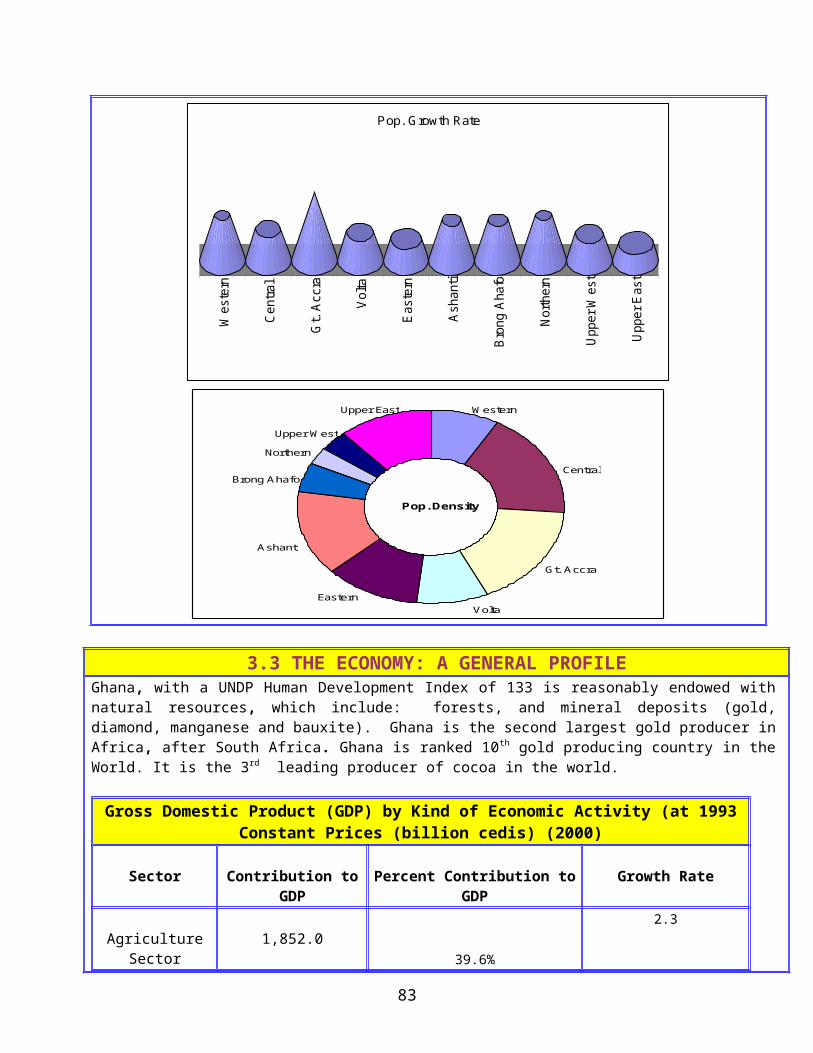
Source: National Communications Authority, Ghana
83

Profile of Telecommunications Operators and Service ProvidersFixed & Mobile Operators Mobile Operators
Ghana Telecom
Westel Telesystems
Capital Telecom
Milicom (Gh) Ltd
Scancom (Gh) Ltd
CelTel Ghana
Fixed + Mobile Operator
Fixed + Mobile Operator
Fixed Rural Operator
Mobile Operator
Mobile Operator
Mobile Operator
Launch Date Fixed 1995 1999 1997 Mobile 2001 2001 1992 1996 1993Technology Fixed Analog
DigitalDigital DECT WLL
CD1000
Mobile GSM GSM n.a Analog TACS, GSM
GSM AMPS
Capacity Fixed 230,00 108,000 10,000 Mobile 70,000 nda [no data
available]n.a 150,000 100,000 nda
Coverage Geographic Fixed 80% Accra & Tema Mobile 100% nda 30% nda Population Fixed 50% nda 60% Potential Mobile nda nda n.a 0.19% ndaOwnership Fixed Govt. – 70%
G Com – 30%Western Wireless Interna’tl – 56%GNPC – 34%ACG – 10%
Local Investors
Mobile
70% - Govt.30% -G Com
Western Wireless – 56%
GNPC – 34%
ACG – 10%
n.a
Millicom International
Local Investors
Investcom 94%
Others 6%
nda
Services Value AddedDataInternet
Value Added n.a RoamingVoicemailCall WaitingCaller ID
WAP-SMSGPRS
Data Transmn X.25 (Planned)ISDN (Planned)
n.a n.a n.a
84
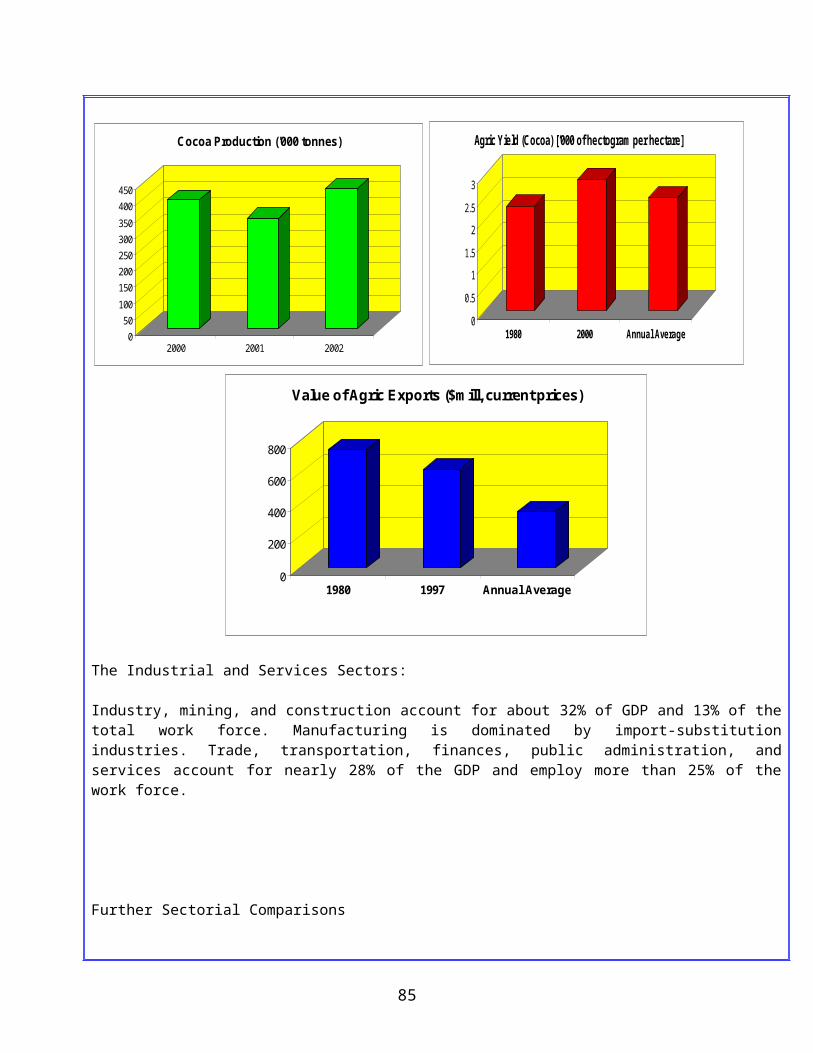
CHAPTER SIXCHAPTER SIX
THE ICT SECTOR: An Overview of Key ICT-Related Indicators
Introduction
This chapter provides a broad overview of key ICT-related indicators including those relating to the telecommunications and communications system and services. Also documented are specific details relating to the regional distribution of telecommunication services; the transportation network; the regional distribution of radio and TV stations among others. Most of the information documented in this chapter was obtained from secondary sources.
6.1 Basic Telecommunications DataTotal No. of Tel. Subscribes (fixed line + mobile) 455,000Total Fixed Line Subscribers 225,000Mobile System Subscribers 230,000Total Number of Subscriber (per 100 inhabitants) 2.08Main Telephone lines 242100Teledensity 1.16Main Tel. Line Capacity Used 82.2%Main Telephone Line (Residential %) 42.0%Total Residential Main Line 99,600Residential Main Lines (per 100 inhabitants) 2.4Digital main lines (%) 100%Waiting list for main lines 15,567 (’98)Public telephones 4180Public Telephones (per 1000 inhabitants) 0.17Public Telephones as % of Main Lines 1.35Mobile subscribers 19,3800Mobile subscribers per 100 inhabitants. 0.93Mobile Subscriber as % total Tel Subscribers 44.5Telephone Tariffs: ResidentialConnection (US$) 75Monthly Subscription rate (US$) 0.5
85
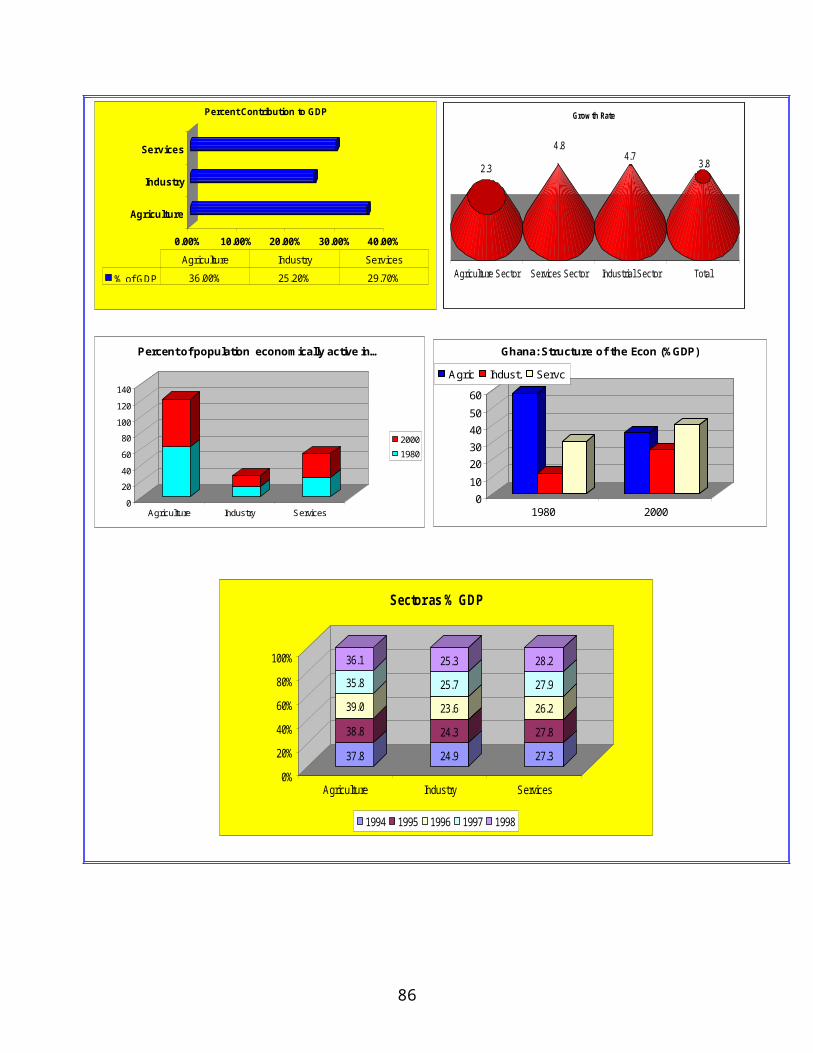
Telephone Tarrifs: BusinessConnection (US$) 75Monthly Subscription rate (US$) 0.5Telephone Tariffs: 3 minutes Local Call (US$) 0.09Telephone Tariffs: Subscription as % GDP per capita 3.9Mobile Telephone Tarrifs:Connection (US$) 50Monthly Subscription rate (US$) 103 minutes local call (US4) 0.81Source: ITU World Telecom Indicators (2002) and National Communications Authority, Ghana
6.2 Basic Telecommunications Data: Traffic, Revenue & Investment
Outgoing Telephone TrafficTotal (million minutes) 43.8Minutes per inhabitant 2,2Minutes per subscriber 184.8International Telephone Circuit 1000Telecommunications Staff 3,800Telecom Staff (% of Female) 20.5Main Lines per Telecom Employee 63Telecommunication Revenue (US$)Total (million) 91.4Per Inhabitant 4.5Per Main Line 385Per Employee 24,206As % GDP 2.5Telecommunication Investment (US$)Total (million) 153.7Per Inhabitant 7.6Per Main Line 648As % of Revenue 168.1As % GFCF 22.6Telecom Equipment: Exports (US$ million) 2.2
Source: ITU World Telecom Indicators (2002) and National Communications Authority, Ghana
86
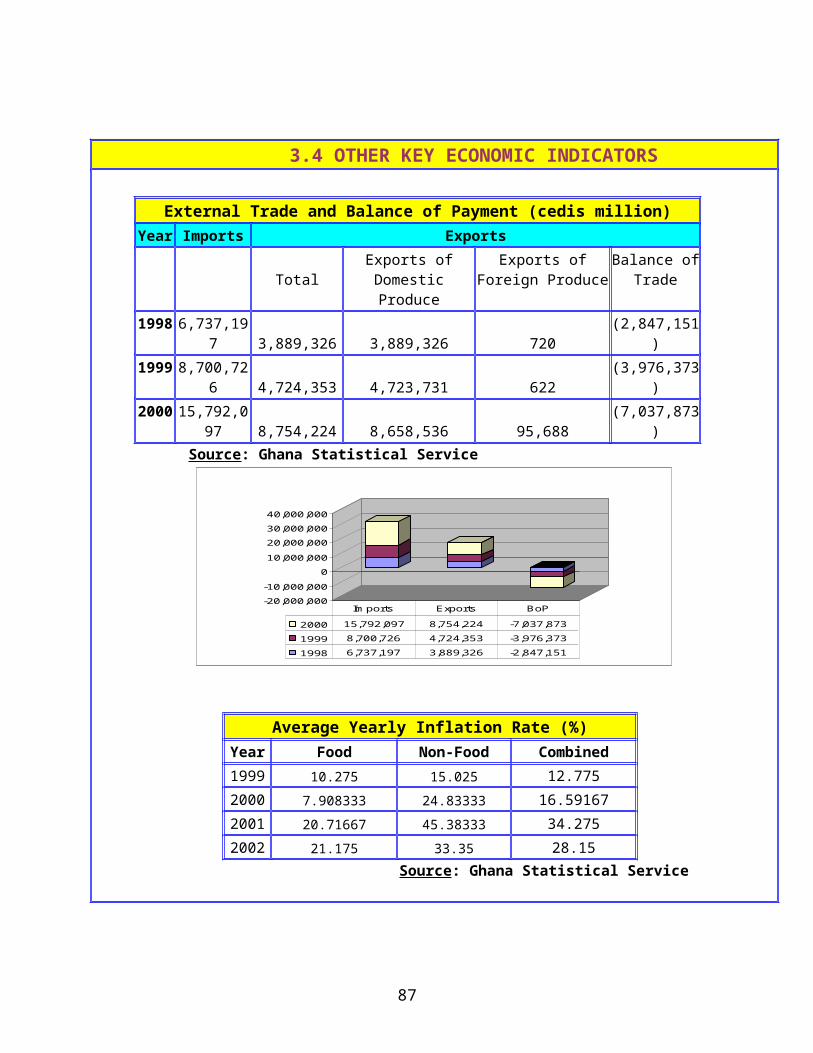
6.3 Other ICT Indicators
Personal Computer (Per 1000 persons) 3
Internet Hosts 235
Long-Haul Internet Bandwidth Over 4MB
Internet Users 40,500
Number of Daily Newspapers [1998] 14
Radios (per 1000 persons) [2000] 710
TVs (per 1000 persons) [2000] 118 Source: ITU World Telecom Indicators (2002)
87
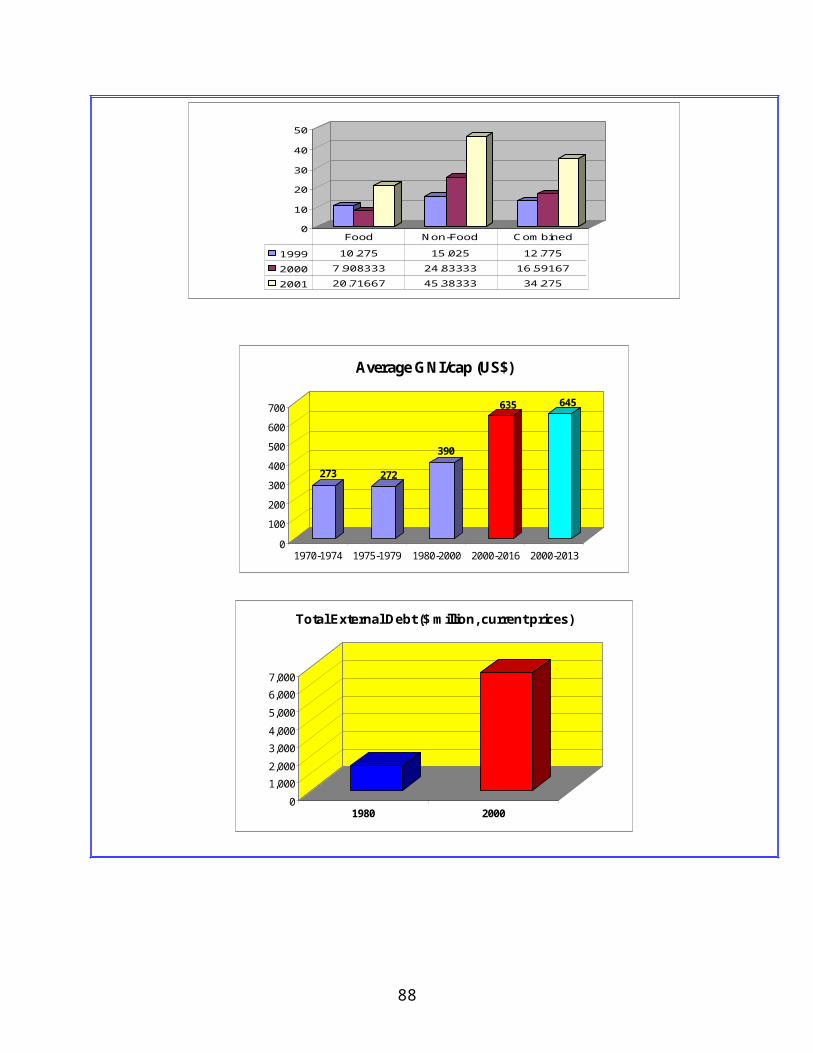
6.4 Regional Distribution of Telephone ServicesFixed Line Distribution
Regional Distribution of Fixed Line Subscribers (2000)
Region Percent Fixed Line Subscriber Base
Greater Accra 66%
Ashanti 12%
Western 6%
Eastern 4%
Central 3%
Brong Ahafo 3%
Volta 2%
Northern 2%
Upper East 1%
Upper West 1% Source: State of the Ghanaian Economy (2000)
88
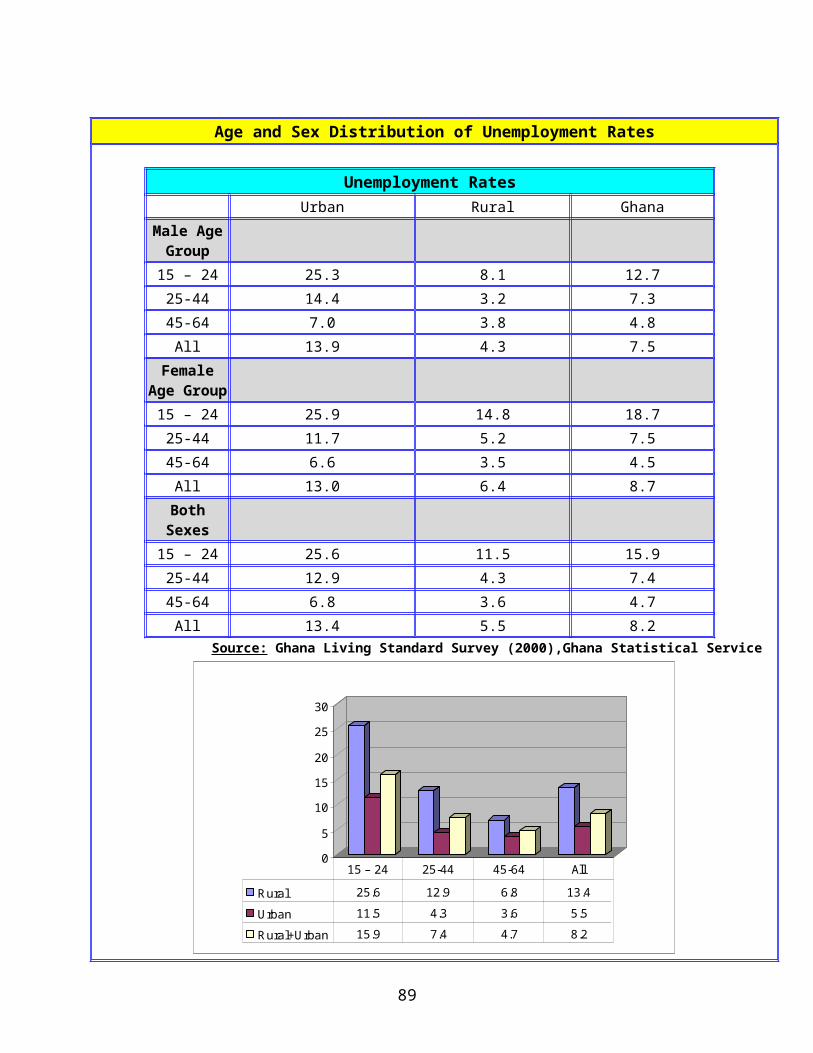
66%12%
6%4%
3%3%
2%2%
1%1%
Greater Accra
Ashanti
Western
Eastern
Central
Brong Ahafo
Volta
Northern
Upper East
Upper West Regional Distribution of Fixed Line Subscribers (2000)
Comparing Regional Population Distribution with Fixed Line Distribution
Region Fixed Tel. Line PopulationGreater Accra 66% 15.80%
Ashanti 12% 17.30%
Western 6% 10%
Eastern 4% 11.40%
Central 3% 8.60%
Brong Ahafo 3% 9.90%
Volta 2% 8.80%
Northern 2% 10.10%
Upper East 1% 5.00%
Upper West 1% 3.10%
89
0%
20%
40%
60%
80%
100%
Fixed Tel. Line Population
Comparing Regional Pop. Distribution with Fixed Telephone Lines
Pay Phone Distribution
Ghana Telecom (the main payphone service provider) has deployed over 4,000 payphones (public phones all over the ten regions of the country. The regional breakdown of the payphones as at 2001 is as follows.
Regional Distribution of Public Phones
Region Percent Distribution of Public phones
Greater Accra 43%
Ashanti 20%
Western 11%
Eastern 6%
Central 5%
Northern 4%
90
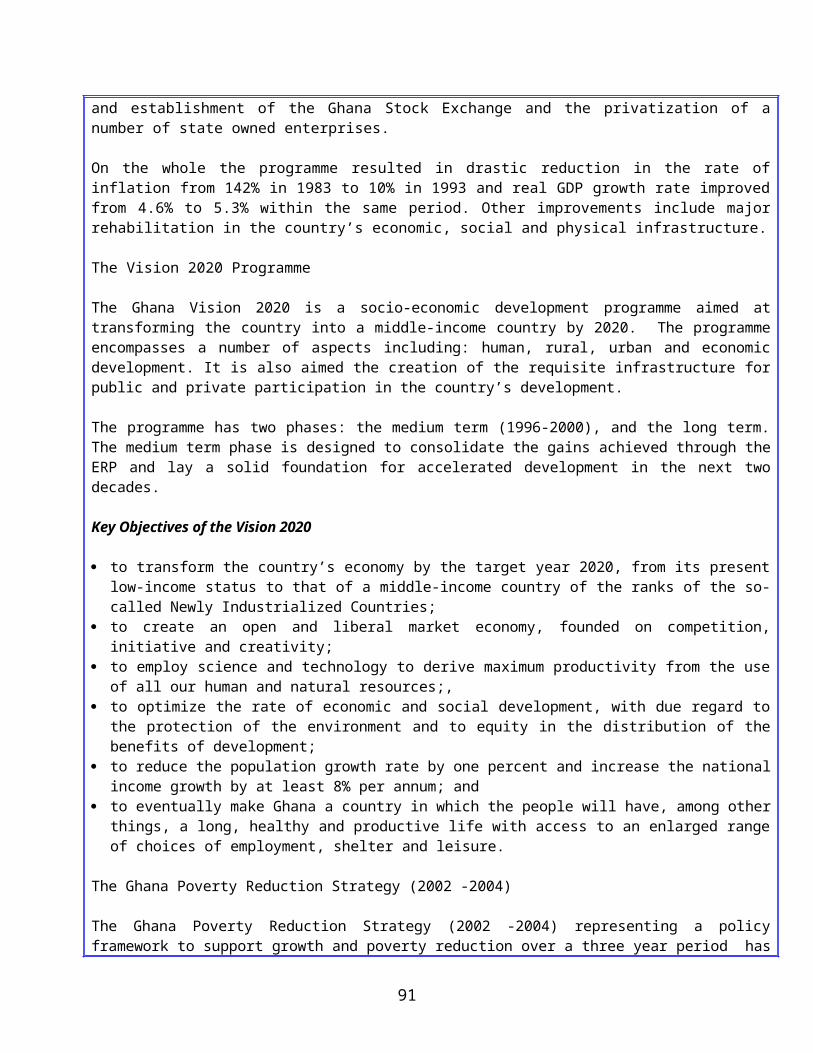
Upper East 3%
Volta 3%
Brong Ahafo 3%
Upper West 2%
Total Number or Public phones 4,180
0% 10% 20% 30% 40% 50%
Greater Accra
Ashanti
WesternEastern
Central
Northern
Upper East
Volta
Brong AhafoUpper West
Regional Distribution of Public Payphones
Comparing Regional Population Distribution with Payphone Distribution
Region Payphones PopulationGreater Accra 43% 15.80%
Ashanti 20% 17.30%
Western 11% 10%
Eastern 6% 11.40%
Central 5% 8.60%
Northern 4% 10.10%
91
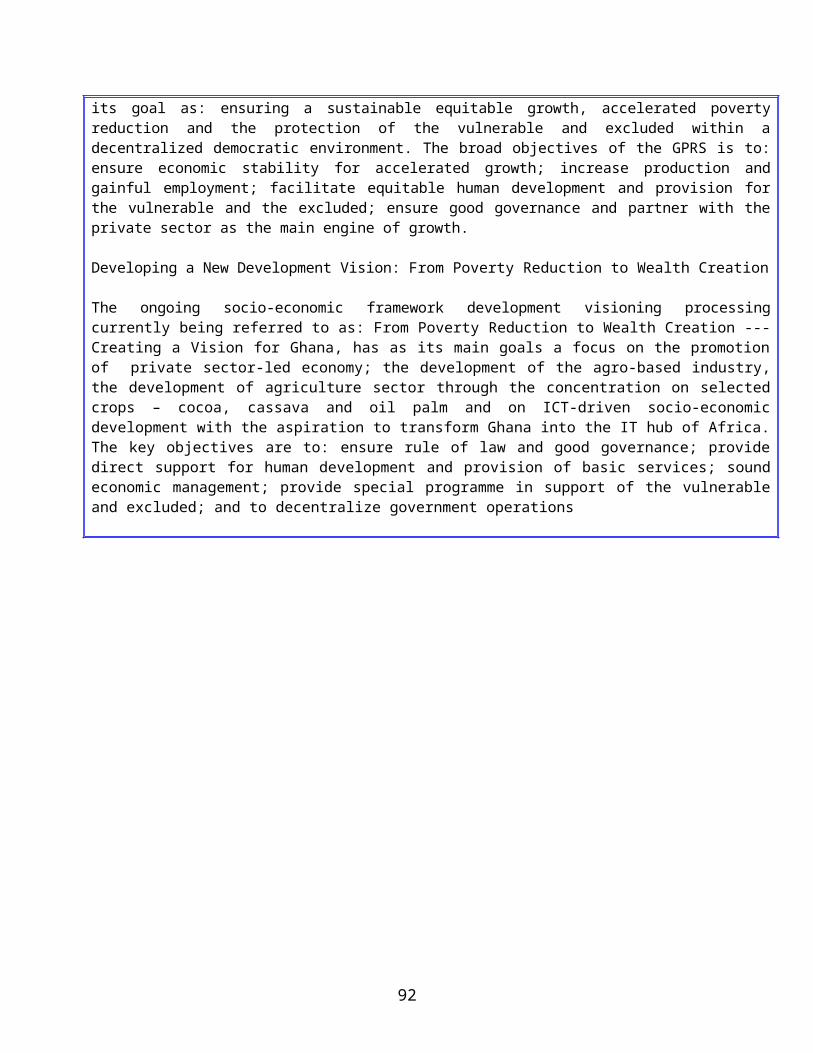
Upper East 3% 5.00%
Volta 3% 8.80%
Brong Ahafo 3% 9.90%
Upper West 2% 3.10%
0%10%20%30%40%50%60%70%80%90%
100%
Payphones Population
Comparing Regional Population Distribution with Payphone Distribution
6.5 The Transportation Network
RoadsMost of the 10 regions of Ghana are accessible by road network of more than 39,409 kms; of which 12,000 kms is classified as main roads. About 11,000 kms (29.6%) are paved, the remainder is either gravel or earth roads.
RailwaysGhana has 953 kilometers of narrow gauge (1.067 meter) track; of these only thirty-two kilometers double-tracked. The railway network only serves the southern industrial/commercial centers, mainly connecting Accra, Sekondi-Takoradi, and Kumasi.
Civil AviationGhana has eleven airfields, including: one international airport: -- the Kotoka International Airport at Accra; and a number of major domestic airports at Takoradi, Kumasi, and Tamale.
92

Ports and WaterwaysGhana has two deep artificial harbors--Tema (2.7 million ton capacity) and Takoradi (projected 1.6 million ton capacity). More than 1,100-kilometer navigable network on Lake Volta, with additional ports planned; 168 kilometers of Ankobra River, Tano River, and Volta River navigable.
6.6 Regional Distribution of Radio Stations
Region No. Authorized On Air Not on Air
Ashanti 12 9 3
Brong Ahafo 8 8 0
Central 6 6 0
Eastern 5 2 3
Greater Accra 17 14 3
Northern 1 1 0
Upper East 1 1 0
Upper West 2 2 0
Volta 3 3 0
Western 3 3 0
TOTAL 58 49 9
Private Radio Stations 47 38 9
Government Radio Stations
11 11 0
Source: National Communications Authority (2001)
93
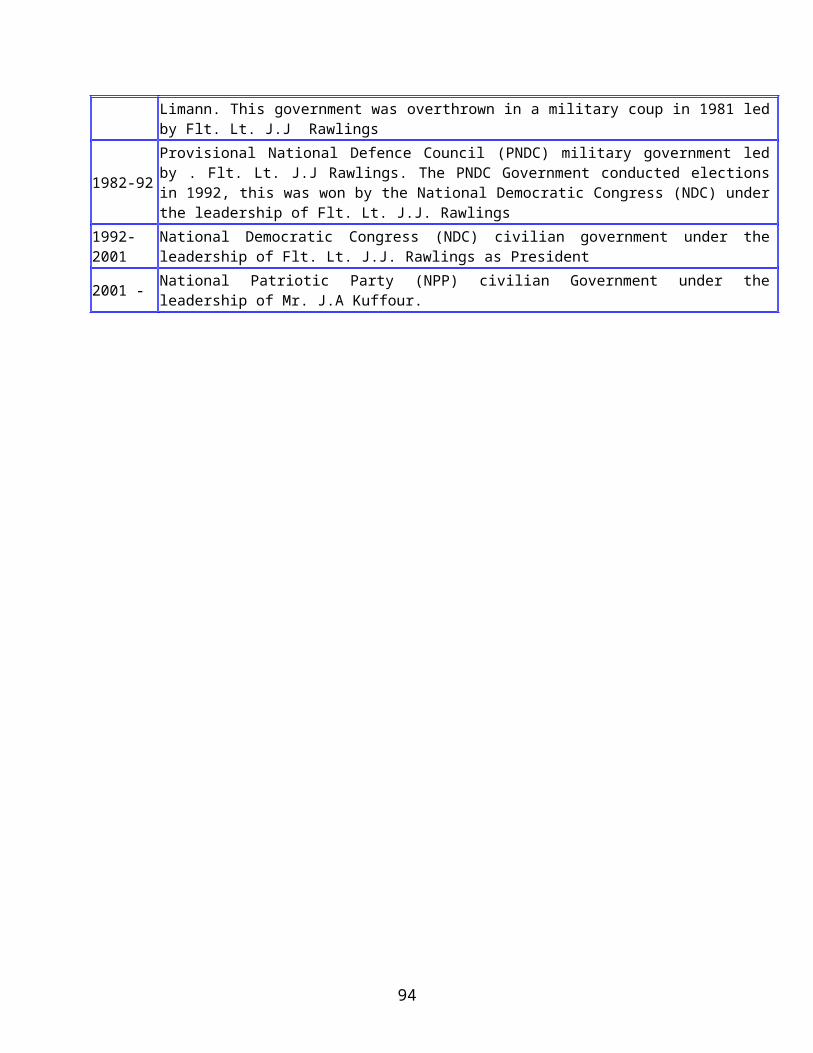
0 5 10 15 20
AshantiBrong Ahafo
CentralEastern
Greater AccraNorthern
Upper EastUpper West
Volta Western
Regional Distribution of Radio Stations ON AIR
6.7 Regional Distribution of TV Stations
Region No. Authorized Operational Not Operational
Ashanti 5 4 1
Brong Ahafo 0 0 0
Central 0 0 0
Eastern 0 0 0
Greater Accra 9 5 4
Northern 0 0 0
Upper East 0 0 0
Upper West 0 0 0
Volta 0 0 0
Western 2 2 0
National Coverage 1 1 0
TOTAL 17 12 5
94
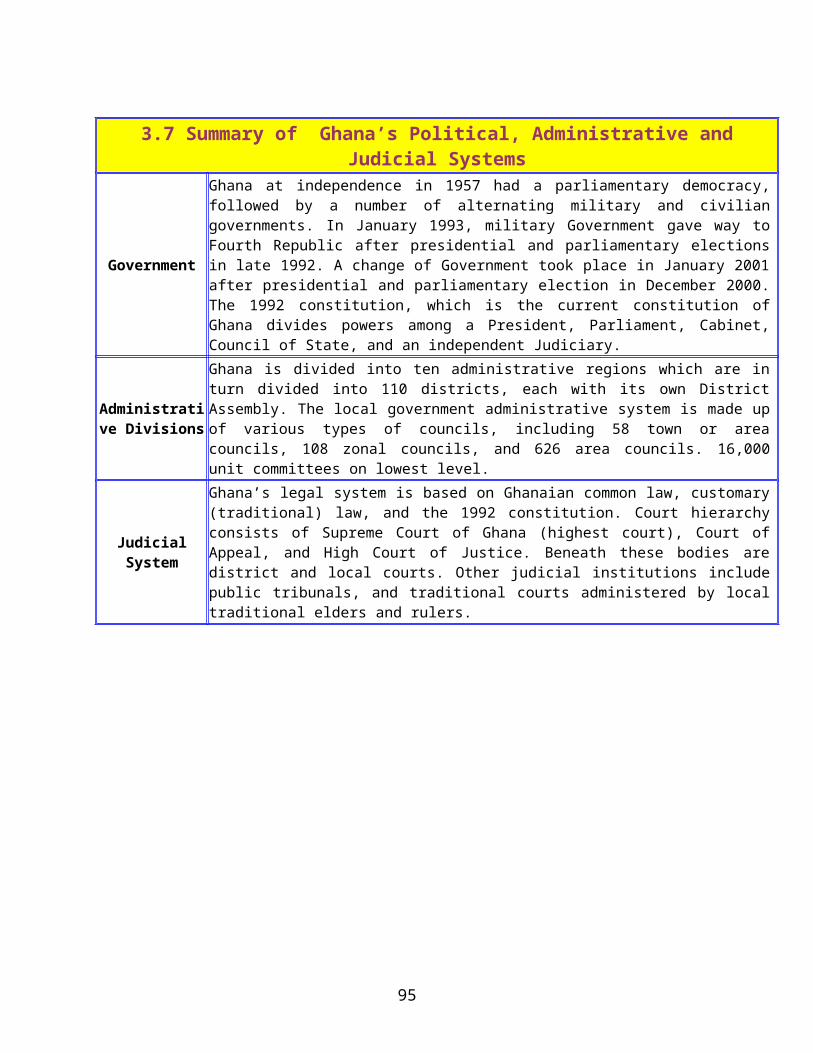
Private TV Stations 16 11 5
Govt TV Stations 1 1 0Source: National Communications Authority (2001)
6.8 Cable/Satellite TV Networks
Company Channel Location: City [Region]
Operational Status
Vision Network Communications
MMDS Accra [Greater Accra] Not On Air
All Time Broadcasting Ltd CH.21,24,29,47,50,52Accra [Greater Accra],
Kumasi [Ashanti] On Air
Multi Choice Ltd CH.35, 38, 41, 55, 58, 61
Accra [Greater Accra], Kumasi/Obuasi
[Ashanti]On Air
CATV Ltd (Cable Gold) Cable TV Tema [Greater Accra], On Air
Integrated Fiber-Optic Communications
Fiber-Optic Cable TV Accra [Greater Accra Region]
Not On Air
GPD Communications Inc. Ltd
LMDS Accra [Greater Accra Region]
Not On Air
Star Broadcasting Ltd MMDS Kumasi [Ashanti] On Air
Crystal Radio Vision MMDS Kumasi [Ashanti] On Air
Focal Point Ltd MMDS Kumasi [Ashanti] On Air
TVK Communications MMDS Accra [Greater Accra] Not On Air
Total Cable Network Authorized 10
Number On Air 6
Number Not On Air 4Source: National Communications Authority (2001)
95
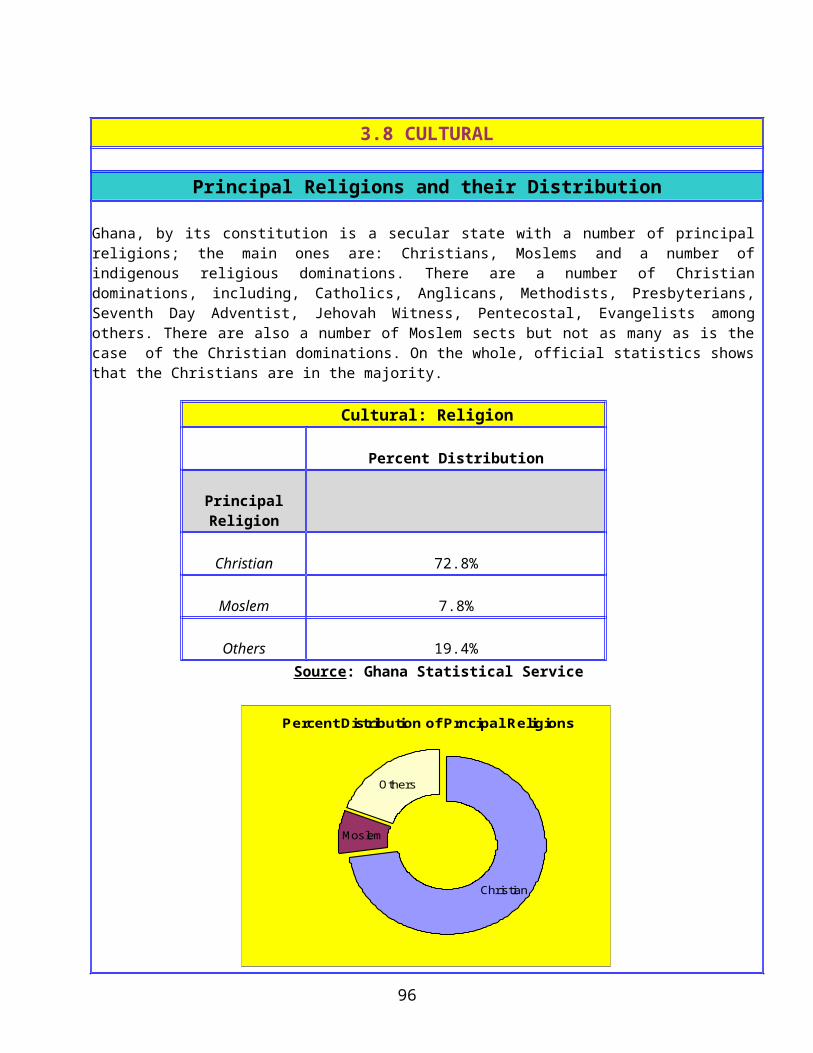
CHAPTER SEVENCHAPTER SEVEN
AN OVERVIEW OF THE GHANA ICT LANDSCAPEIntroduction
We provide in this chapter a general overview of the Ghana ICT landscape. A number of analyses were carried out to document among other things: the contribution of the ICT sector to the Ghanaian economy; the problems associated with organizational deployment of ICTs and the factors inhibiting the growth of the ICT Sector. Also documented are specific details relating to: ICTs in the educational sector and ICT human resource development.
7.1 Analysis of the Contribution of the ICT Sector to the Ghana Economy
Contribution to the GDP
There are indications are that the ICT sector is making some positive contribution to GDP. For the example, the expansion in the telecommunication sector and other communications and Internet related activities did have some multiplier effect on other sectors of the economy like the service and industrial sector – these in turn did have some impact on the GDP which has been on the rise for the last couple of years.
Contribution to Export Earnings
The ICT sector have made some indirect contribution to export sector, through its multiplier effect on other sectors like agriculture and the industrial sector which are directly linked to the export market.
Contribution to Employment and Job Creation
The expansion of the communications sector, has in recent years led to the explosion of telecommunications and communication services; this has contributed to employment and job creation especially in the service sector. For example, the numerous Communication Centers (providing telephone, fax and in some cases Internet café services to the public) which are now operating in every city, town and village has in the last couple of years created hundreds of jobs in the community. Every small neighbourhood of about 20 households has approximately 3 to 5 communication centers each, employing about 2 to 3 people.
These centers alone have contributed to employment creation in the economy in the last couple of years. A rough estimate is that these communications centers employ 12,000 to 15,000 workers within the communities throughout the country. About 80% of those employed at these Centers are women; the majority of them being secondary school leavers between the age 18 – 24 years.. Apart from the Communication Centers, there are other related ICT based small to medium scale (SMEs) business entities. For example, Web publishing set-ups, computer service providers, Internet café service providers, mobile phone services providers, FM and community radio stations, which have also contributed to the creation of ICT-related jobs in the economy in the last couple of years.
The growth in the telecommunication and the ICT service provision sub-sectors of the economy has led to the
96
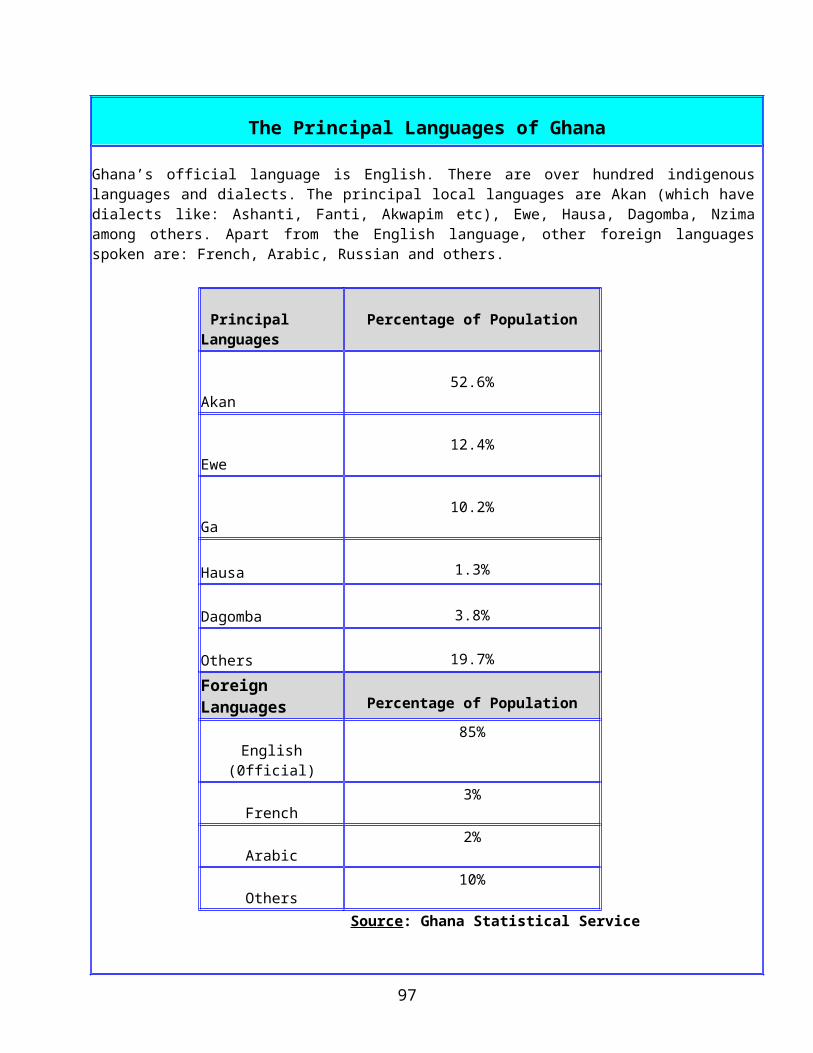
creation of quality technical, management and servicing jobs within the ICT sector of the economy. A number of the leading companies, involved in the telecommunications sector and the computer industry in general, are regularly recruiting middle and senior level staff to meet the demands of their expanding operations. This increase in the creation of quality jobs in the ICT sector is evidenced by the number of job adverts for ICT personnel in Ghanaian newspapers.
These include: network operating engineers, telecommunication managers and engineers, software developers and engineers, computer technicians, Web Designers, ICT-related sales staff, and trainers and radio technicians; the trend shows that the demand can only rise. The anticipation is that the ICT sector alone will be creating hundreds of jobs in the next couple of years. In addition, organizations and establishments operating in other sectors of the economy, namely agriculture, service and the industrial sector are expected to create more computer-related jobs as they increasingly move towards the computerization of their operations and activities.
The results of the SCAN-ICT survey show that the most common ICT skills (personnel) in organizations (for all sectors) are computer programmers. About 22% of all organizations reporting have computer programmers. This is also the case for public sectors organizations. In the case of private sector organizations about 17% reported having programmers on their staff with a higher percentage of 21% reporting having system analysts on their computer staff. While 16% of NGOs reporting having computer programmers, a higher percentage of 24% reported having network engineers/technicians on their ICT staff.
Impact on the Salaries of ICT Professionals
In comparison to many other non-ICT related jobs, those with high-end computer skills tend to attract higher salaries in Ghana. On the issue of salary levels; Ghana as in the case of other countries, ICT-related jobs especially those relating to high-end computer skills on the whole attracts higher salaries in comparison to other equivalent jobs. For example, a middle-level computer personnel is likely to earn in the region of 20% to 25% more than a non-computer personnel of the same level. As expected, computer personnel in the private sector get higher salaries than their counterparts in the public sector. By way of example, a computer technician in the bank or private company earns about USD1600 per annum while their counterpart in a government ministry earns about USD1100 per annum.
97
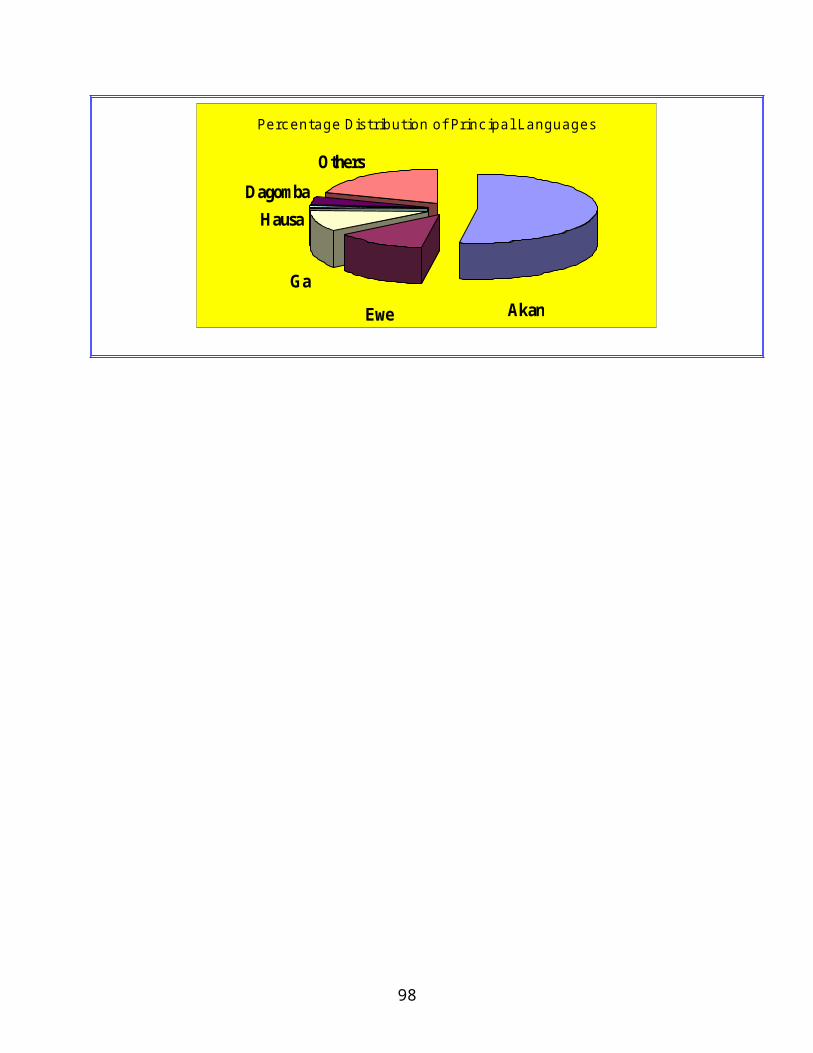
7.2 ICTs in the Educational System
Educational InstitutionsInstitutions Number
Primary Schools 11,765 Junior Secondary Schools 5,597 Senior Secondary Schools 456 Technical Schools 22 Vocational Schools 22 Teacher Training Colleges 38 Special Education 18 Diploma & Specialist Training Colleges 7 Polytechnics 8 Universities Public Universities 5 Private Universities 5
Source: Ghana Statistical Service
ICTs in the Universities and Colleges
The use of computers to support education, training and research is widespread in Ghanaian higher educational institutions. In most universities and colleges, basic computer training forms an integral part of all diploma and degree level programmes. Access to the Internet to support learning teaching and research is also reasonably widespread in the countries five universities. The polytechnics and the colleges, in most cases, have at least a dial-up link to the Internet for e-mail access via an ISP.
A number of the academic departments in the major universities have their own local area networks (LANs) and a number of the universities are implementing a campus-wide local area networks
ICTs in the Schools
The late 1990’s saw the introduction of computers into a number of Ghanaian secondary school. The Ministry of Education is currently considering plans to introduce computers into all secondary with Science Resource Centers. Close to 50% of secondary schools have Science Resource Centers. The SCAN-ICT survey shows that currently close 79% of schools have some computers. Most of the schools obtained their computers through the help of PTA, NGOs and in some cases by way of corporate donations. Most of the schools involved in the use of computers only offer basic computer education and training as supplementary courses. The aim is to simply expose the students to the technology. Some of the schools that have introduced computers into their system are part of a pilot SchoolNet system that in addition to basic training also provides access to the Internet.
Electronic-Based Education and Training Projects and Initiatives in Ghana
SchoolNet in Ghana: The WorLD Link Project-Ghana
98
The WorLD Link project is an on-going pilot SchoolNet project designed to introduce ICTs into a number of Senior Secondary Schools in Ghana and connect them to the Internet. The objectives of the Ghana project is to:
implement the use of ICT tools in schools link students and teachers with the aid of ICTs to improve educational opportunities and to build global
awareness supplement inadequate educational material in school libraries with current and relevant educational
material on the Internet encourage the use of ICTs as a teaching and learning aid. assist students and teachers to create educational content on the Internet, pertaining to their curriculum assist the youth gain the knowledge and technological skills they need to contribute effectively to Ghana's
development as part of the global economy and the information age
The Ghana pilot project begun with three Senior Secondary Schools in Accra (the capital) in 1997. In the same year the number of schools involved in the project increased to 14 to include schools from Accra and other cities and town including Kumasi, Cape Coast, and Tema. Each of the schools involved in the project are equipped with a fully furnished computer laboratory that house a local area network connected to the Internet. As part of the project both students and teachers of the participating schools are provided basic training in the use of computers and the Internet. Topics covered as part of the training programme are: Computer Literacy and Basics; E-mail, Internet Browsing; Collaborative Projects Design and Implementation; Integration of Technology into Schools Curriculum; and Web Page Design
Other Individual SchoolNet Initiatives
There are other schools connected to the Internet as part of individual schoolnet initiatives. Most of these well-endowed schools in the urban areas whose connectivity initiatives are most often financially supported by PTA, Alumni, or corporate bodies. The SCAN-ICT survey shows that on the whole only 15% of schools have access to the Internet and of this about 43% had access less than one year and 29% with access 1- 2 years. A total of 14% of those who use to have access no more have access to the Internet.
The GhaCLAD Project
The Ghana Computer Literacy & Distance Learning [GhaCLAD] project began in 1996 as an electronic distance education project of the Voluntary Workcamps Association of Ghana in collaboration with Projectscope Inc. of Boston, USA. The objectives of project are to:
explore means of utilising computers, telecommunications, audio/visual media and information technology to enhance primary, secondary, tertiary, vocational, professional development and continuing adult education in Ghana;
strengthen the capacity of grassroots organisations, low income communities and local schools to initiate, choose, plan and manage their own self-help projects through information technology and telecommunications;
create a demonstration effect on public opinion in terms of what information technology, electronic networking and community based computing can offer for national and international development;
increase awareness of how the computer and electronic connectivity can re-orient youth groups toward the economy and labour market of the 21st century; and
99
foster opportunities for youth from the all continents to engage in "service learning" providing computer literacy instruction to Ghanaian participants and technical assistance to the Project as they learn about Ghanaian culture and society.
The Africa Virtual University Project
The African Virtual University project is a World Bank electronic distance education (EDE) initiative involving universities and colleges in 15 African countries. The Ghana-end of the project is being implemented at the University of Ghana, University of Cape Coast, the University of Ghana and the Kwami Nkrumah University of Science and Technology (KNUST). The project aims at making educational programmes in various subject areas available to participating institutions. In Ghana most of the programmes offered through the AVU system are non-credit programmes. AVU does not offer its own degree in Ghana, it seeks to collaborate with the participating Ghanaian universities to supplement and complement their campus-based courses via electronic means.
The GIMPA EDE Programme
The Ghana Institute of Management and Public Administration (GIMPA), a Government professional skill development Institute is running a distance education programme in collaboration with the Multimedia University of Malaysia. GIMPA is offering a number of postgraduate degree courses including Executive MBA through this programme.
100
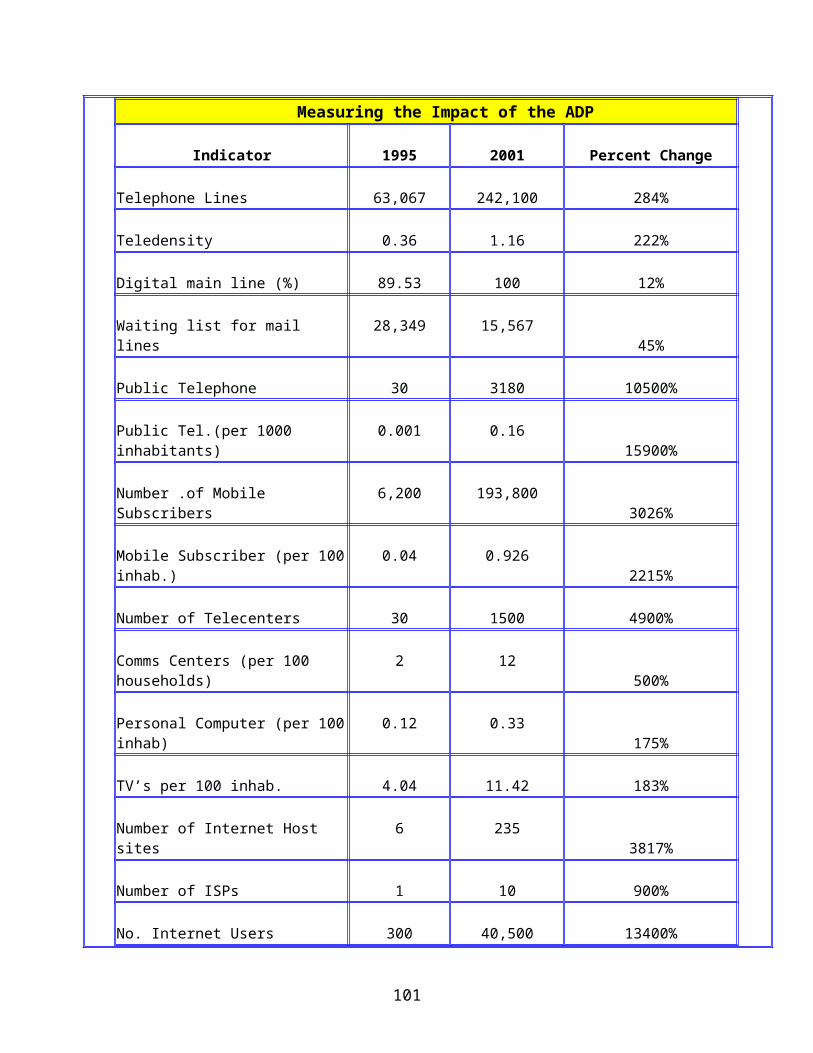
7.3 ICT Human Resource Development in Ghana
Basic IT Skill Training in the Private Sector
Various organizations, institutions and business establishment are involved in ICT related human resource and skill development in Ghana. There are numerous private computer training centers operating in the country but mostly offering non-certificate courses, which are popular with school leavers and the job seekers, but there still is a skill shortage in some key ICT areas. These include networking (e.g. network management, network engineering, installation and maintenance), system integration, software development and enhancement (e.g. application systems development, the development of customized systems for user-organizations) as well as in areas like systems analysis and design.
ICT Human Resource Development at the Universities, Colleges and Other Institutions of Higher Learning
The institutions of higher education are involved in ICT human resource development in a number of ways. In fact, out of the five universities three currently run degree level ICT programme; these include: University of Ghana, the Kwame Nkrumah University of Science and Technology (KNUST) and the Valley View University, --- the premier private university in Ghana. The Computer Science Department of the University of Ghana runs a Combined Honours Programme leading to a B.Sc. or B.A degree in Computer Science and either Statistics, Mathematics, Physics, Psychology or Economics.
The Department of Computer Science at KNUST runs a four-year programme leading to a BSc (Hons) degree in Computer Science. The Valley View University Computer Science Department runs a number of computer-related joint degree programmes and a full four-year BSc (Hons) in Computer Science. Others like Central University College which is affiliated to University of Cape Coast also run a number of computer courses.
To complement the programmes at the universities, a number of the country's polytechnics also run programmes leading to Ordinary Diploma and Higher National Diploma (HND) in Information Technology. There are also numerous private computer-training centers offering ranges of computer courses from basic computing and programming to professional level certified courses like the City and Guilds Microtechnology Programme.
Some corporate bodies and allied institutions have also set up training centers to bridge the gap between skills acquired at the conventional training centers and skills required in industry. The key example is the Ghana Telecom Training Center which provides in-house training to its staff. The Center has entered into a collaborative agreement with the Kwame Nkrumah University of Science and Technology (KNUST) to run some of its programmes. Every year the Center trains more than 2,500 trainees mostly from Ghana Telecom through its long and short term courses and seminars.
101
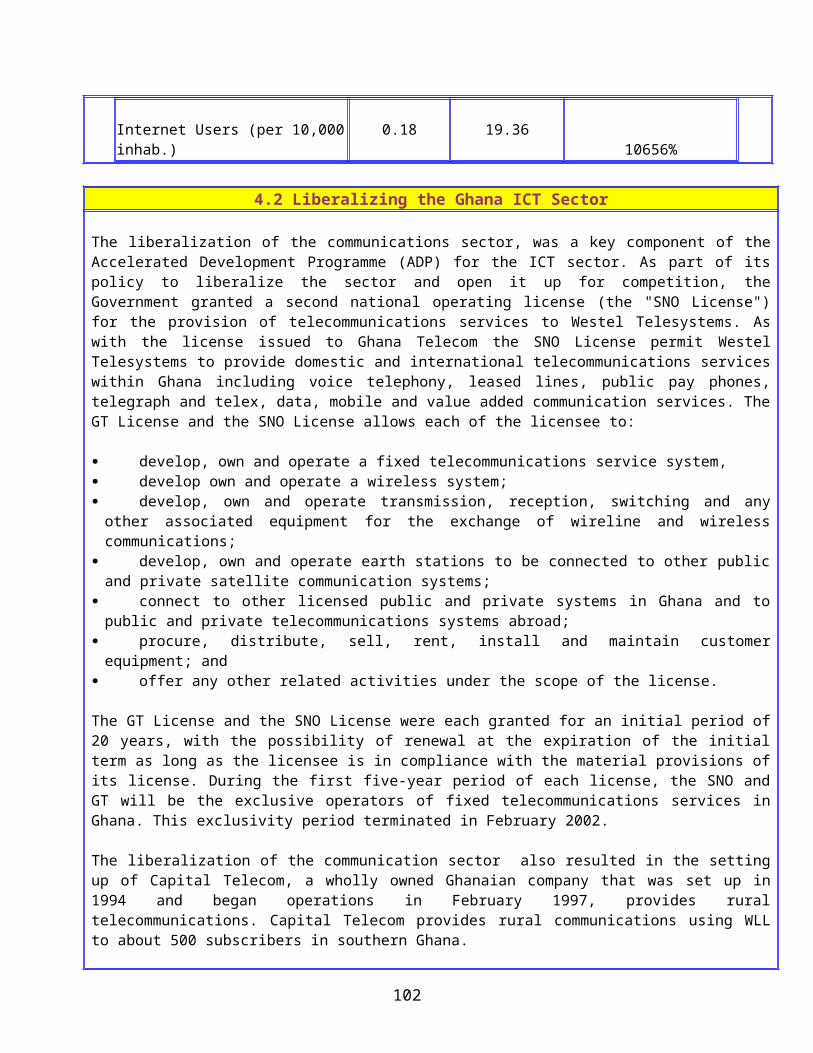
Computing and Computer Studies as Integral to Diploma and Degree Programmes
Most of the departments in the universities, colleges and polytechnics offer basic computing and computer studies as part of their diploma and degree programmes. The SCAN-ICT survey shows that 52% of all departments in the universities and polytechnics have computer studies as an integral component of their diploma and degree programmes. The corresponding figure for Engineering and Computer related Departments is 84%
In-Company ICT Human Resource Skill Development
Apart from the traditional teaching and learning environments like the schools and universities, ICTs are also being deployed for training within companies and organizations. A number of these are making use of computer based education and training for in-house training and skills upgrade. There is now a growing demand for employees in both the public and the private sector to have modern technological skills, with emphasis on ICT skills. Putting in place a human resource development (HRD) program to facilitate re-training and rapid skills update to meet changing requirements and needs of industry and commerce is now a priority for most organizations.
Government Policies, for Supporting ICT Education and Training
Primary and Secondary Schools
The Government has recognized the need for introducing computers in the schools; the Ministry of Education is yet to introduce comprehensive computer curricula in the school system. Most of the school involve in the use of computers only offer basic computer education and training as supplementing courses. The aim is just to expose the students to the technology.
Within the school system, there are no specific government incentives to promote and encourage ICT base education and basic computer training in the schools. Apart from the plans to introduce computers and the Internet into all schools with Science Resource Centers, there is no specific government initiated IT awareness promotion programme in the schools either. The school system also lacks trained computer teachers who could be deployed to teach basic computers in the schools. Although the SCAN-ICT survey shows that close to 85% of schools indicated having one or two computer literate teachers there is no specific government programme aimed at training computer literacy teachers at the nation’s Teacher Training colleges.
Tertiary Institutions
The Government recognized the need for implementing electronic distance education to supplement and complement campus-base education and training in the higher institutions of learning. Apart from the various EDE initiatives on-going at the various universities and colleges, there is currently no national Government sponsored EDE initiative targeted at the tertiary level. There are plans to establish the Ghana Open University along the lines of the Open University of the UK to offer EDE programmes.
7.4 An Analysis of Factors Inhibiting the Growth of the Ghana ICT Sector102
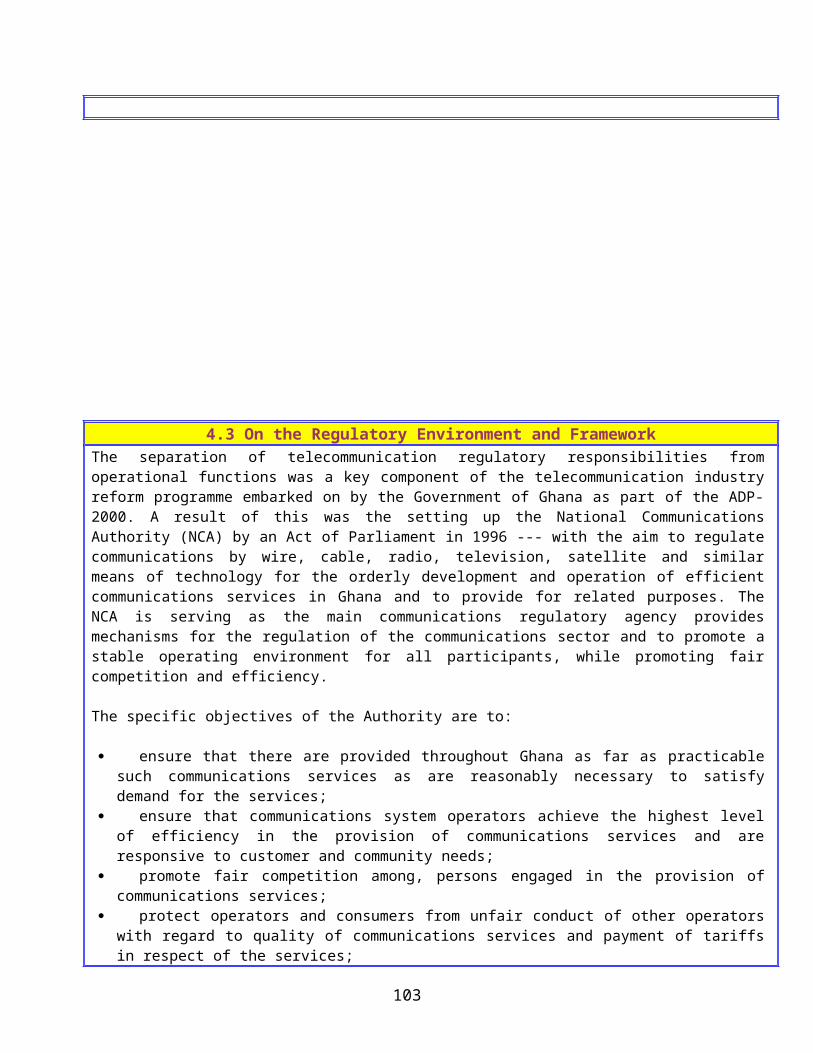
Skill Shortage
There is a worldwide shortage of critical ICT skills. This problem is more acute in developing countries like Ghana. There is skill shortage in critical areas like networking (e.g. network management, network engineering, installation and maintenance), system integration, software development and enhancement (e.g. application systems development, the development of customized systems for user-organizations) as well as in areas like systems analysis and design, computer engineers, system integrators, telecommunication engineers and Internet Node operators and engineers. Most user-organizations have problems in getting suitably qualified staff in a number of these areas to develop, install and maintain and manage their systems and advise them on the numerous problems faced by users in implementing some of these systems.
A nationwide SCAN-ICT survey of ICT related companies and service providers shows that 11% of the respondents cited ICT skill shortage as an inhibiting factor for growth in the sector. About 14% regarded the small size of the Ghanaian market as an inhibiting factor, while 26% regarded the low level of computer literacy/awareness in the country as a key factor that is limiting the growth of the Ghana ICT sector. Dis-incentives like taxes and import duties imposed on ICT products and services was cited by 21% of the respondents as a key inhibiting factor for the growth of their respective companies and the ICT industry as a whole.
Limited ICT Infrastructure Development
The growth of the ICT sector is also being inhibited by lack of infrastructure development in areas like transport, telecommunications, and electricity. For example the lack of the electricity infrastructure in some sections of the country has been identified as a bottleneck to the expansion of ICT-related services.
Lack of Capital Investment
The ICT sector is capital intensive. The inability to attract adequate capital through domestic and foreign direct investment has been one of the main obstacles to the development of the local ICT. Apart from the sale of Ghana Telecom and the licensing of the second national Telecom operator, which attracted some foreign direct investment, capital investment in the sector has not been significant.
7.5 An Analysis of Problems Associated with Organizational Deployment of ICTs
Problems Associated with Monitoring and Benefiting from Advances in ICTs
Many user-organizations in Ghana have not been able to keep up with the rapid technological developments. In some, they lack the expertise to digest new information about these technologies and to integrate them into the existing operations of the organization with minimal disruption. Even in organizations where such expertise is readily available, the problem of the acceptance of these technologies by the staff in general is still a problem. In cases where problems relating to the acceptance of and adjustment to these technologies can be resolved, other problems associated with providing continuous training to the user-staff in the rapidly changing aspects of these technologies with minimal disruption to the operations of the organization have to be handled. This no doubt makes it difficult for them to take full advantage of these technological advances.
In fact, even most ICT managers cannot keep up with the rapid technological advances. Particular areas include integration of diverse technologies, use of system-development tools, networking, telecommunications and standards. Few organizations in Ghana are willing to devote sufficient time and scarce resources to monitoring these new developments in the market by subscribing to as many ICT journals and periodicals as possible,
103
reading suppliers' and vendors' brochures and attending some conferences, exhibitions, product demonstrations and training programmes. Very few organizations in Ghana involved in full-time monitoring of the technological developments in ICTs; most rely on vendors to act as their technological gatekeepers.
Problems Relating to User-Staff Acceptance of ICTs
Although computer technology has been around for some time there are still some organizations in Ghana with problems associated with acceptance of and/or adjustment to the technology once it is accepted.
Industrial Relation Problems
Contrary to popular belief, industrial relations problems specifically caused by the introduction of ICTs into the organizational structure are not common in Ghanaian organizations. In most cases where industrial action occurred, they were taken so as to enable the labour unions to negotiate appropriate terms and conditions for their members. The broad objectives of these labour unions in these negotiations include: protecting employment levels, ensuring that current conditions of work are retained and if possible improved, improving the environment for work and the prospects for workers and possibly secure improvements in earnings and reductions in working time. The unions in Ghana in most cases do not obstruct the program for technological change but often demand to play a major role in the decision-making process, which is bringing about the change.
Ergonomics Issues
Ergonomics issues relating to the implementation of ICTs is a problem in a number of user organizations in Ghana. These problems are mainly related to the working environment of the offices and the design of office furniture being used, and in some cases the design of the equipment used. Key problem areas regarding the unsuitability of the working environments of some of the organizations include: unsafe cabling systems, unacceptably high noise level when using some equipment, poor ventilation, lack of text holders for the VDUs, high workstation density and unsuitable lighting and electrical wiring. Problem areas in the design of office furniture include: small desk tops, clumsy chairs, un-adjustable chairs, desks and chairs with unsuitable heights making it impossible to have full leg room and to have a comfortable sitting position thus leading to posture complaints. Problems relating to the design of some of the equipment include un-adjustable screens, un-detachable keyboards, poorly designed keyboards, noisy printers, and hard disks and VDUs without filters.
104
CHAPTER EIGHTCHAPTER EIGHT
SECTORAL APPLICATIONS: THE ICT INDUSTRY
Introduction
The Scan-ICT study of the ICT industry was conducted country-wide- involving both, face-to-face survey as well as postal questionnaire survey. The study targeted ICT (computer) companies, institutions and establishments including computer equipment vendors, retailers and distributors, software developers, retailers and distributors; computer training centers and institutions, computer systems development and support companies and establishments, communications centers and Telecenters; ISPs, Telecom Operators, Gateway/Broadband Service Providers and other Internet-based Service Providers. The findings of the study are summarized below.
8.1 The Distribution of Size of ICT Companies in Ghana.
The SCAN-ICT survey of the Ghana ICT industry and sector shows that the majority of the ICT-based companies and service providers are small to medium scale companies. About 87% of the ICT companies that took part in the nationwide study have staff less than 50 personnel, while just about 9% have between 50 and 100. ---These can be categorized as small-scale establishment. Of those that can be classified as medium scale establishments, about 3% are of size between 100 and 200 staff and only 1% has staff size between 200 and 500. In exception of the large Telecom Operators like Ghana Telecom, none of the Ghanaian ICT-related companies have size beyond 500 personnel.
Size of Company (Total number of Staff) Percent of RespondentsBelow 50 87%50 –100 9%100-200 3%200-500 1%500-1000 0%Over 1000 0%
Source: INIIT, The Ghana Scan-ICT Study, 2002, © 2002, International Institute for Information Technology (INIIT)
105
Distribution of Size of ICT Companies
50 –100
Below 50
100-200 200-500
8.2 Regional Distribution of ICT Companies in Ghana
The majority of ICT companies and service providers are based in the Greater Accra Region, mostly in the capital Accra. Some of the regional capitals like Kumasi (Ashanti Region) which is the second largest city in Ghana also have a number of ICT companies and establishments. Regions which are mostly rural-based hardly serve as ideal locations for ICT companies given the nature of their services and client-base. A number of the ICT companies, in particular the major ones do have branch offices in some of the regions to service their clients in those regions.
RegionRegional Distribution of ICT
companiesGt. Accra Region 45%Ashanti Region 31%Brong Ahafo Region 2%Eastern Region 3%Volta Region 2%Northern Region 1%Western Region 4%Upper West Region 1%Upper East Region 1%Central Region 10%
Source: INIIT, The Ghana Scan-ICT Study, 2002, © 2002, International Institute for Information Technology (INIIT)
On the whole the Scan-ICT study shows that close to 45% of the ICT companies surveyed are located in the Greater Accra region (mainly in Accra), with 31% located in the Ashanti region, mainly in Kumasi and about 10% in the Central Region.
8.3 The Landscape of Services Provided by the ICT Companies
The majority of the small-to-medium scale ICT companies in Ghana are mainly involved in retailing and the distribution of computer products and providing on-site support services to their customers. Most of the hardware related ICT companies, (the vast majority of which are small scale establishments with staff averaging between 5 and 20) are involved in retailing computers (mainly personal computers) and their peripherals like printers, UPSs, scanners, modems and consumables like floppy disks, toners, cartridriges etc. A number of these also serve as retailers of standard applications software and in some cases systems software. A number of them specialize in the sale of software related products.
106
There is very little activity within the Ghana ICT sector in the area of assembly of computer hardware systems like personal computers. Apart from a handful of companies, most of which are small-scale set-ups involve in local assembly on a limited scale, the majority of companies retailing computer hardware import them as complete systems which they retail to the public.
The majority of the applications software (mostly standard of-the-shelf products) on the Ghanaian market are not developed locally. The Ghanaian software development industry is still under-developed. Only a couple of establishments are involved in limited software development work; the majority of these are into customizing applications for clients with very little done in the area of developing systems from the scratch. In exception of a number of accounting, banking and database applications where there is some local software development efforts, the vast majority of Ghanaian companies involved in implementing IT systems used imported software as turnkey ‘off-the-shelf’ software or slightly customized systems.
In exception of the large telecommunication and communications service providers and the ISPs, the Scan-ICT survey of computer companies shows that close to 22% are involve in retailing and on-site installation of computer hardware/software and/or systems like network systems for their clients. The study also discovered that a number of the ICT companies (about 20% or the respondents) are involved in on-site servicing and maintenance of computer systems (hardware/software/system).
On-site and off-site training in the use of computer systems is also a common type of services undertaken by computer companies for their clients. There are a number of private computer training centers and schools in Ghana, the majority of which are involved in the training of school leavers and job seekers in standard applications like word-processing, spreadsheet, database systems and in the use of the Internet. Some of these teach programming in high level languages like Basics, C/C++ and in some few cases JAVA.
Main Types of Activities and Services Provided by ICT Companies in Ghana
Percent of ICT Companies
Retailing and On-site installation of hardware/software/systems 22%On-site servicing/maintenance (computer system) 20%On-site training (hardware/software) 16%Off-site servicing/maintenance (computer system) 15%Off-site training (hardware/software) 12%Help Desk/Customer Info and Advisory Support 10%Seminars, Exhibitions & Demonstrations 5%
Source: INIIT, The Ghana Scan-ICT Study, 2002, © 2002, International Institute for Information Technology (INIIT)
Among some of the computer companies providing off-site training are the specialist private computer training centers and Institutes involved in providing some of the internationally recognized ICT proficiency professional certification programmes like: MSCE, Cisco Academy, and City and Guilds Certification programs among others.
107
8.4 The Local Component/Context Capacity of the Ghana ICT Sector
The majority of the ICT-related companies and service providers, trade in products and services with very little local context. The Scan-ICT survey of these companies shows that only 18% of the respondents, trade in products/services that are 100% locally produced/developed. In otherwise the vast majority of 78% of the companies locally trade in ICT products/services that have less than 100% local context. About 34% (a relatively high proportion) of the companies reported trading in ICT products and services with less than 10% local context measured in terms of produced/developed locally.
Percentage of Products/services sold Locally that are Produced/developed Locally Percent of ICT Companies
below 10% 34%10% - 25% 17%25% - 50% 14%50% - 75 % 17%
100% 18% Source: INIIT, The Ghana Scan-ICT Study, 2002, © 2002, International Institute for Information Technology (INIIT)
0%
5%
10%
15%
20%
25%
30%
35%
below 10% 10% - 25% 25% - 50% 50% - 75 % 100%
Percent of Locally Sold Products Produced Locally
8.5 Analysis of the Client-Base/Profile of ICT Companies and Service Providers
The Scan-ICT Study examined the distribution of the client-base of the ICT companies in Ghana as a measure of the major concentration of ICTs service consumers. Three broad client-based sectors were identified: Government and Public Sector; Corporate Sector; and the Educational Sector. The study shows that about 43% of the ICT companies serving the Government and Public Sector, indicating that only 10% of their total business comes from that sector. Only 5% of the respondents have most of their clients from the Government and Public Sector; most of these indicated that 75% to 100% of their clients comes from this sector.
Size of the Client-Base within a Given Sector Percent of ICT Companies
108
Government & Public Sector
Corporate Sector Educational Sector
below 10% 43% 15% 47%25% -50% 40% 51% 35%
About 50% -75% 12% 25% 14%75 % - 100% 5% 9% 5%
Source: INIIT, The Ghana Scan-ICT Study, 2002, © 2002, International Institute for Information Technology (INIIT)
The Study also shows that of the ICT companies with corporate sector client-base, the majority (51%) indicated that between 25% to 50% of their clients comes from that sector. A further 25% have between 50% to 75% of their clients concentrated in this sector. With the Educational Sector, unlike the Corporate Sector, the majority of ICT companies with clients in that sector indicated that it does not constitute a major source of business for them.
0%20%40%60%80%
100%120%140%
below 10% 25% -50% About 50% -75%
75 % -100%
Size of the Client-Base within a Given Sector
Government & Public Sector Corporate Sector Educational Sector
On the whole the study indirectly shows that the Corporate Sector and the Government and Public sector are the major consumers of ICTs in Ghana and hence a major source of business (client-base) for the majority of ICT companies in Ghana. Also the Study shows that the client-base of most ICT companies and establishments are multi-sectorial with a minority of companies with a high concentration of their clients (75%-100% of their clients) based in a single sector.
The evidence shows that unlike in the more developed ICT industries of the developed countries where some of the large ICT companies concentrate their services in a given sector (e.g. the corporate sector or government sector) the Ghana ICT companies, because of their size (the majority being small-scale operators) and the distributive nature of their operations cannot be viable having a uni-sector client base.
109
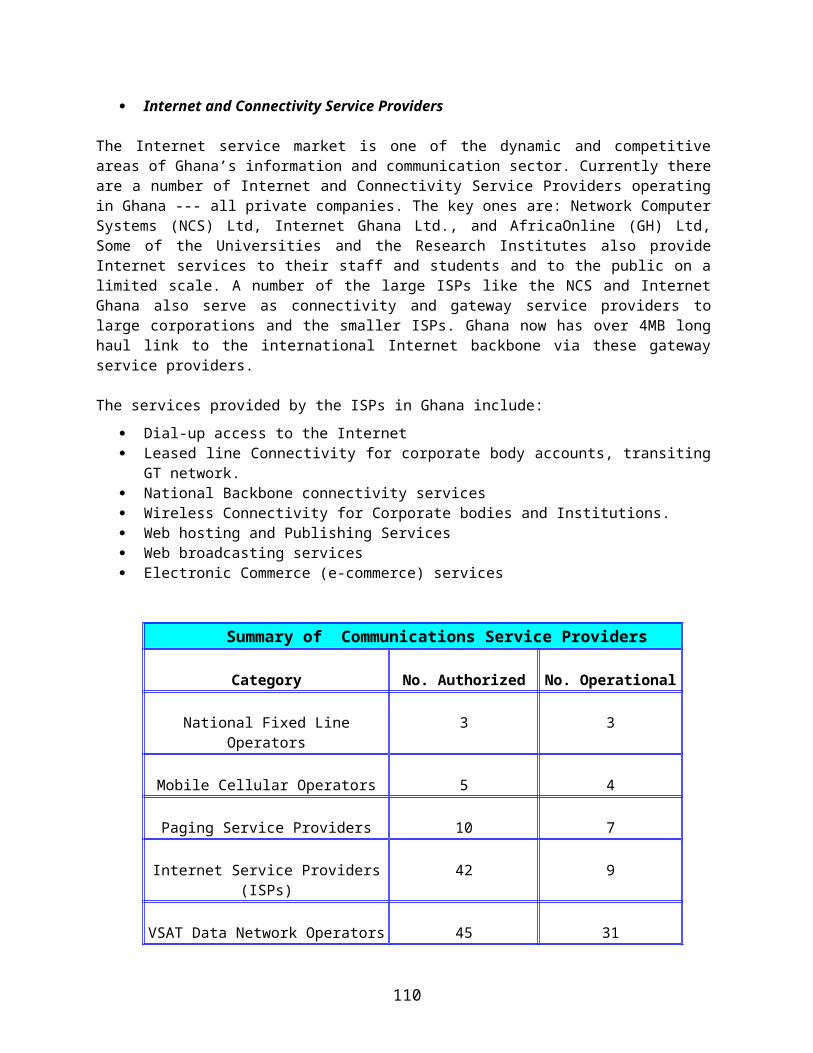
8.6 Factors Inhibiting the Growth of the ICT Sector in Ghana
The Scan-ICT Study, in its survey of the key factors inhibiting the development and growth of the Ghanaian ICT sector and industry, discovered that 26% of the companies identified the low level of computer literacy and awareness of what computers can do as one of the key factors limiting the development of the sector.
Factors inhibiting growth of the ICT sector and Industry Percent of RespondentsSkill Shortage in the ICT area 11%Size of the Ghanaian Market 14%Lack of Govt Incentives for the ICT Sector 16%The level of Computer Literacy/Awareness 26%Level of home-grown IT R&D work 12%De-incentives like the taxation & import duties 21%
Source: INIIT, The Ghana Scan-ICT Study, 2002, © 2002, International Institute for Information Technology (INIIT)
Factors Inhibiting the Growth of the ICT Sector
Size of the Ghanaian Market
Skill Shortage in the ICT areaDe-incentives like
the taxation & import duties
Level of home-grow n IT R&D
w ork
The level of Computer Literacy/
Aw areness
Lack of Govt Incentives for the
ICT Sector
Only 11% of the companies listed ICT skill shortage as a limiting factor, while about 21% considered de-incentives like taxation and in particular import duties on computer products and services as a major factor inhibiting the growth of the Ghana ICT sector. Given that the majority of ICT products on the Ghanaian market are imported, with very little local component, key players on the Ghana ICT scene do see import duties and taxes on computer products and services as having negative impact on the expansion of the ICT sector, a major part of which is involve in retailing of ICTs products and services.
110
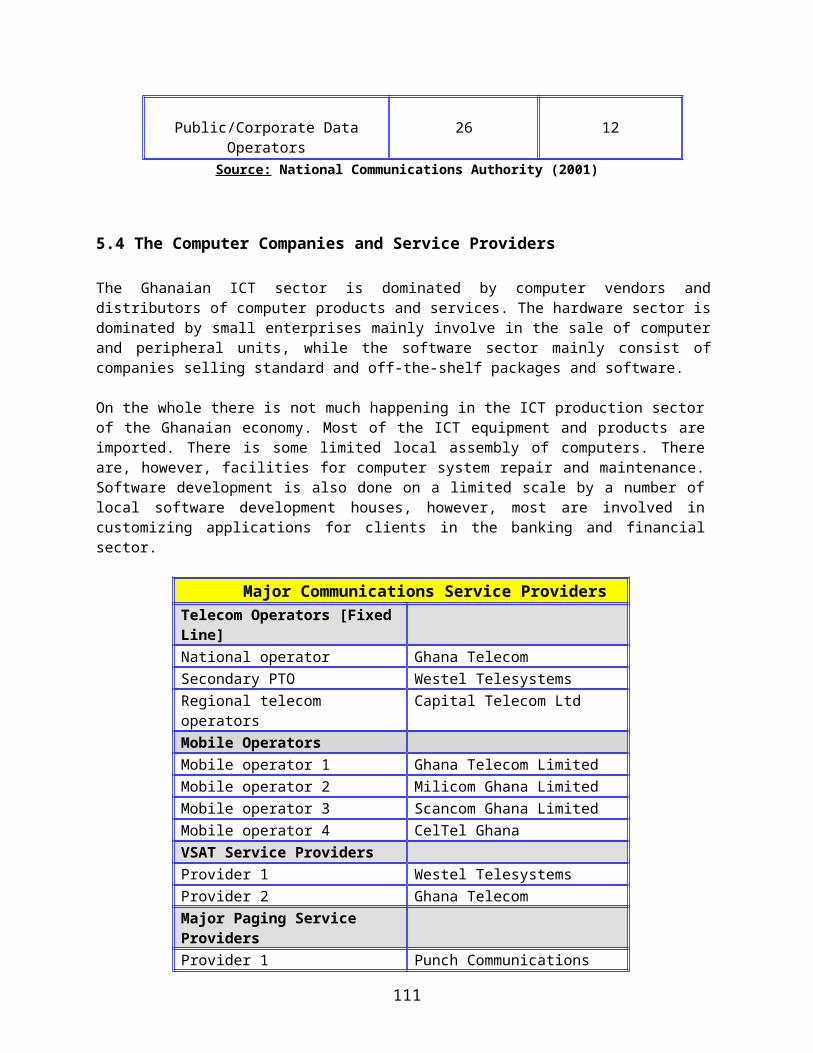
8.7 Skills within the Ghana ICT Sector and Industry
A survey of the ICT Skill base of computer companies and service providers shows that close to 21% have network engineers or technicians and 18% have IT trainers. The relatively high proportion of companies with IT Trainers confirmed the fact that a number of them are involved in on-site and off-site training of the ICT personnel and users of their client organizations. The relatively low percentage of ICT companies having computer scientist may be an indication of the shortage of these types of skills within the Ghanaian economy. Of the computer organization reporting on their ICT skill base, 11% and 10% respectively have programmers and software developers. As low as 4% of the ICT companies reported having a telecommunication specialist on their staff.
Type of ICT SkillPercent of ICT Companies with Specific ICT Personnel
Average number of ICT Personnel per Company
Programmers 11% 3Software developers 10% 3System analysts 10% 2Computer System managers 7% 2Computer scientists 6% 2Telecom Specialists 4% 3Network Engineers/Technicians 21% 3Network Managers 5% 3IT trainers 18% 4Others 8% 7
Source: INIIT, The Ghana Scan-ICT Study, 2002, © 2002, International Institute for Information Technology (INIIT)
The Scan-ICT survey shows that: ICT companies and establishments have on average 3 programmers on their staff, 4 IT trainers and 2 computer scientists on their ICT staff. On the whole the average number of personnel in each of the key ICT skill areas is about 2.5 per organization. This figure is rather low for ICT companies, and goes to confirm that the majority of ICT companies in Ghana are more involve in retailing and distribution of computer products (mostly imported --- with very little local context);, activities requiring very little technical computer expertise like programmers, software developers, computer scientists among others.
8.8 Overview of Staff Retention Strategies of ICT Companies in Ghana
The Scan-ICT survey shows that a high proportion (about 44%) of ICT companies and service providers provide training opportunities to their staff as part of their staff retention strategies. Of the companies surveyed, the provision of stock/company share options to staff is not a popular staff retention strategy among Ghanaian ICT companies and service. Only 7% of those participating in the nationwide survey indicated using this strategy to retain staff. Most of the ICT companies are small to medium scale set-ups operating as solely owned or partnerships entities whose scale of operations and management structure does not favour the issuing of stock options to their staff.
111
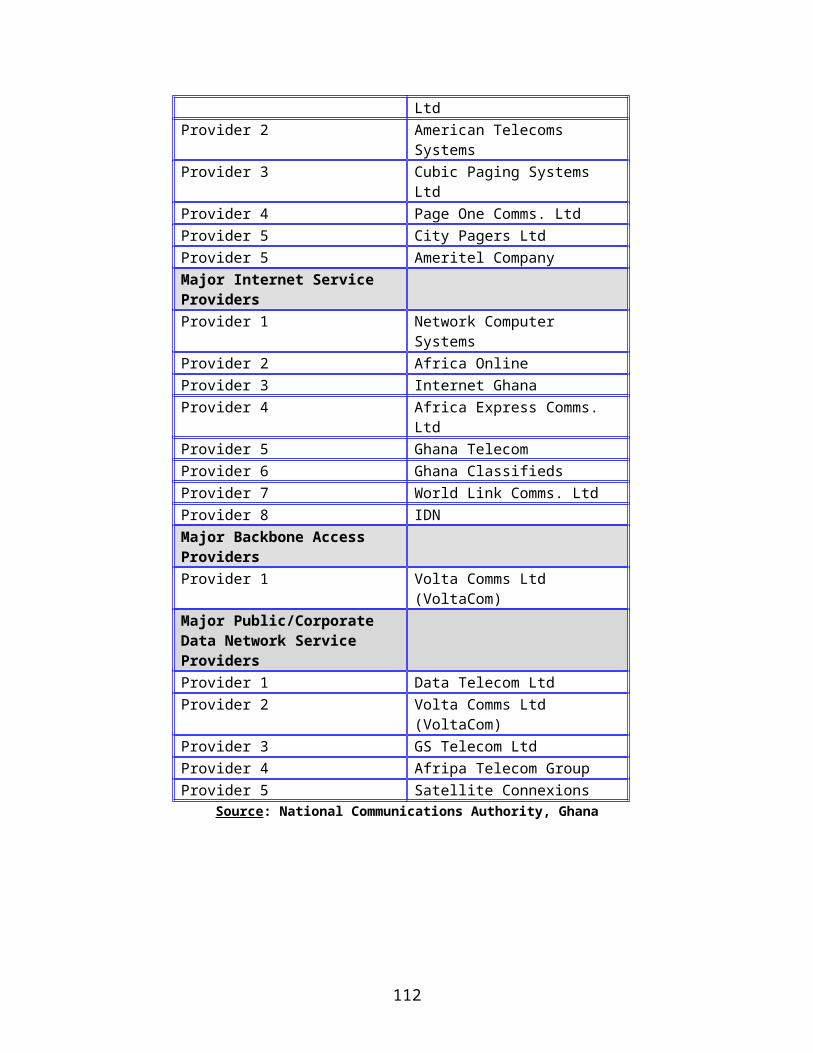
Types of Staff Retention Strategies Percent of ICT CompaniesStock/Company Share options 7%Benefits in-kind 24%Training opportunities 44%Others 7%None 18%Source: INIIT, The Ghana Scan-ICT Study, 2002, © 2002, International Institute for Information Technology (INIIT)
Staff Retention Strategies
Benefits in-kind
Training
Others
NoneStock/Share
options
A relatively high percentage (18%) of the companies do not have any staff retention strategy. About 24% of the ICT companies surveyed provides some form of benefits-in-kind (like car, holidays housing allowance) as a staff retention strategy
8.9 Home Ownership of Computers by Staff of ICT Companies
The staff of the majority of the ICT companies involved in the Scan-ICT Study have computers at home. About 86% of the companies surveyed indicated that some proportion of their staff do have computers at home. Of these 53% stated that less than 10% of their staff has computers at home with only about 2% indicating that all their staff (100%) own computers at home.
Percent total Staff with Computers at Home Percent of ICT CompaniesBelow 10% 53%About 25% 27%About 50% 10%About 75 % 8%About 100% 2%
Source: INIIT, The Ghana Scan-ICT Study, 2002, © 2002, International Institute for Information Technology (INIIT)
112
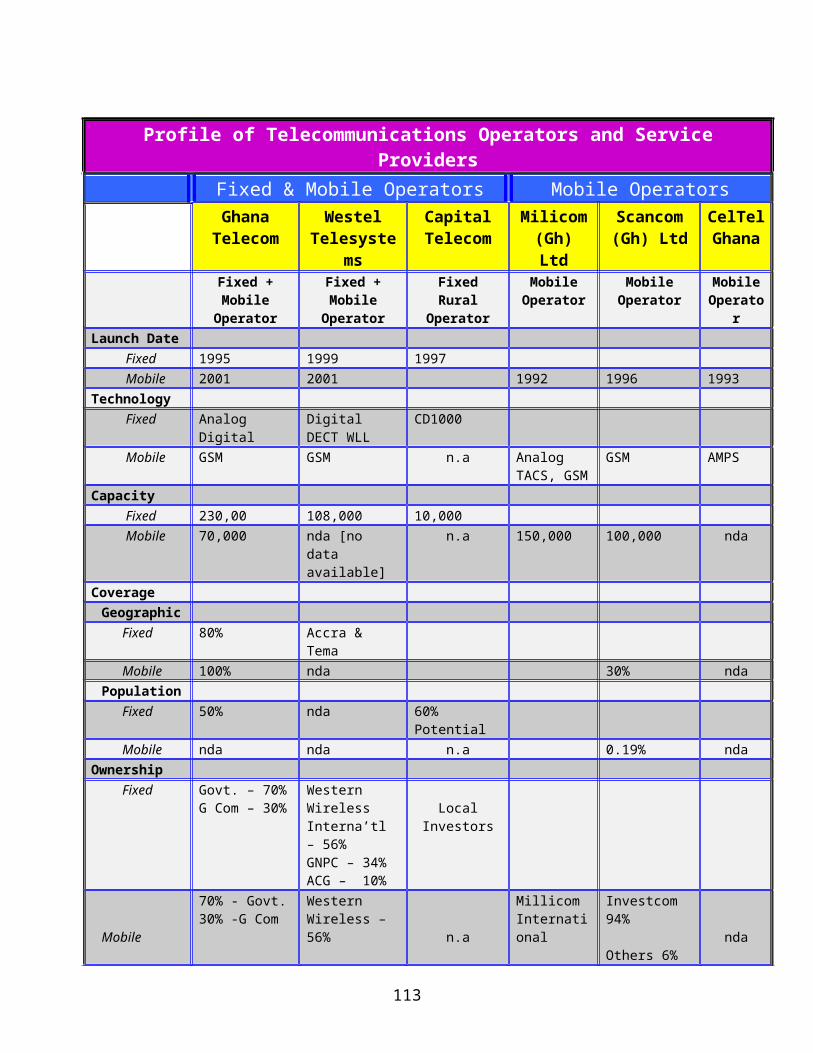
Distribution of Home Ownership of ComputersAbout 75 % About 100%
About 25%
About 50%
Below 10%
On the whole, the majority of the companies (80%) have less than a quarter of their staff with computers at home. This figure coupled with the fact that about 14% of the companies reporting having none of their staff with computers at home, indicates a relatively low prevalence of home ownership of computers among the staff of ICT companies in Ghana.
8.10 The Degree of Internet Access, Usage and Presence
About 86% of the ICT Companies taking part in the Scan-ICT national survey have Internet connectivity; the majority of these have a dial-up access through a local ISP. Some of the medium to large-scale ones do have leased line access (fixed, wireless) to the Internet via an ISP
Of the companies with access to the Internet, 28% reported using it for e-mail; 25% for access to the Web and just 11% indicated using the Internet for advertising the marketing their services with just 12% reporting using the Internet for providing information and publicity about their organization. With most of the companies reporting using the Internet for a number of purposes the majority are involved in using it for e-mail and Web browsing rather than for promoting or marketing their services
Type of Usage of the Internet Percent of ICT CompaniesE-mail 28%Access to the Web 25%Downloading Materials 24%Providing info/publicity about the organization 12%Advertising and/or marketing 11%
Source: INIIT, The Ghana Scan-ICT Study, 2002, © 2002, International Institute for Information Technology (INIIT)
113
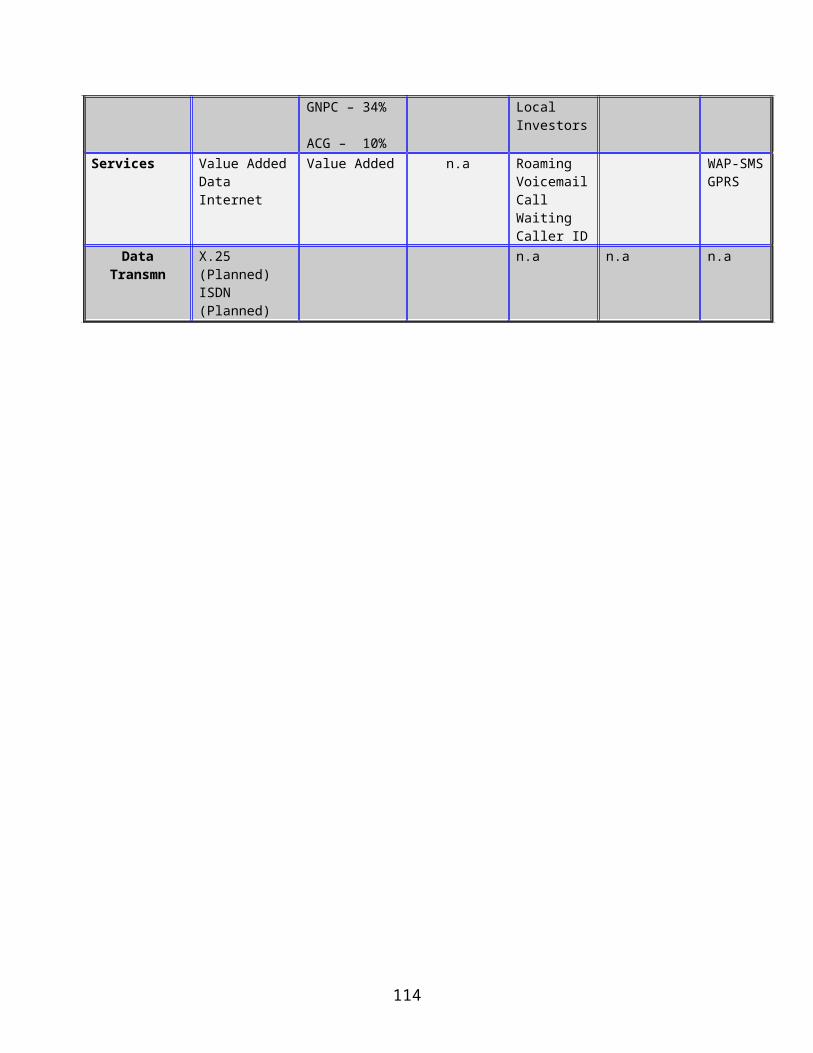
E-m
ail
Acc
ess
to th
eW
eb
Dow
nloa
ding
Mat
eria
ls
Pro
vidin
gin
fo/p
ublic
ity
Adv
ertis
ing/
mar
ketin
g
Types of Internet Usage
On the question of Web presence of the ICT companies surveyed, about 65% do not have a presence on the Internet. In other words, only 35% of the companies reported having a Web site on the Internet. Relating to electronic commerce, the vast majority (84%) of the companies reported not involve in e-commerce.
Internet Access Web Presence E-CommerceYes 81% 35% 16%No 19% 65% 84%
Source: INIIT, The Ghana Scan-ICT Study, 2002, © 2002, International Institute for Information Technology (INIIT)
Yes
No
Yes
No
Yes
No
0%
20%
40%
60%
80%
100%
Internet Access Web Presence E-Commerce
Internet Access, Web Presence and E-commerce Involvement
Summarizing on Internet access, usage and Web presence, the Scan-ICT survey shows that although a relatively high percentage of Ghanaian ICT companies have access to the Internet, most of them use it for e-mail and web browsing, with very little using it for facilitating, promoting or selling their products and services. The resources of the Internet as a tool for business and commerce is yet to make its mark on the Ghanaian ICT sector and industry.
114
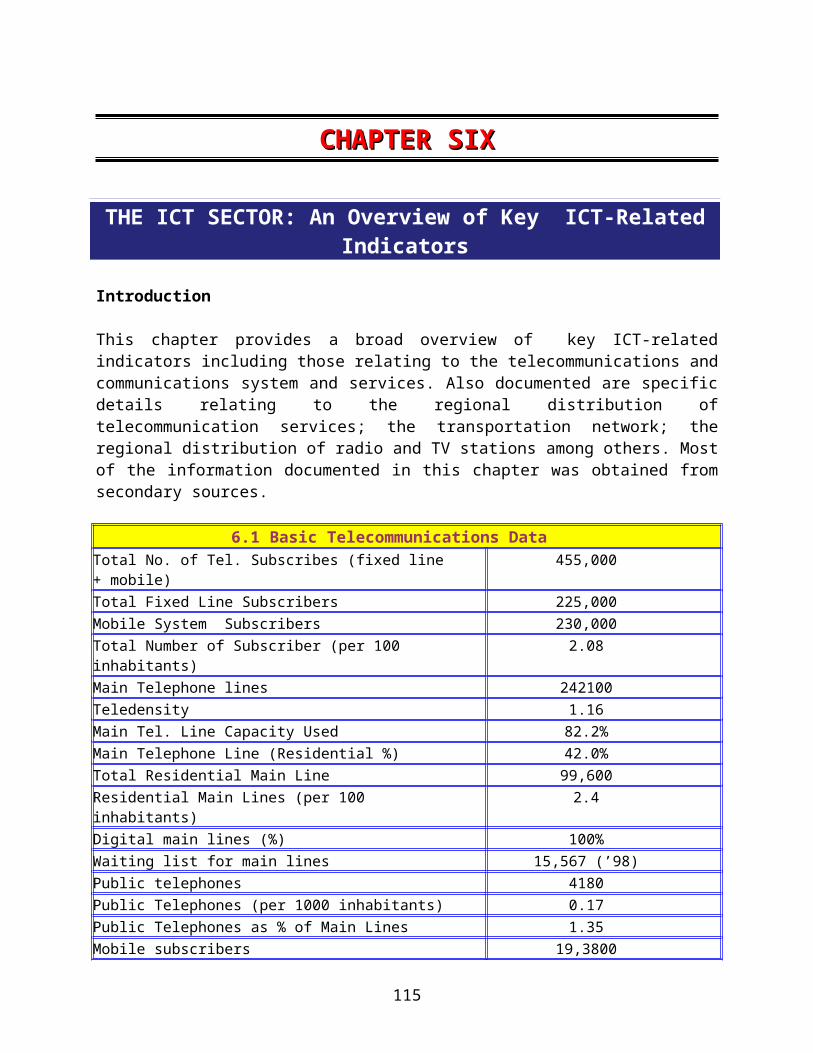
CHAPTER NINECHAPTER NINE
SECTORAL APPLICATIONS: THE PUBLIC SECTOR and the PRIVATE SECTOR
Introduction
The Scan-ICT study on the deployment and exploitation of ICTs in the public and private sector institutions was conducted country-wide. The study involved, both face-to-face survey and postal questionnaire survey. The public institutions targeted included: the Government Ministries and Departments as well as a number of public sector organizations (PSOs). The private sector establishments include: SMEs (small-to-middle enterprises) as well as large private sector organizations. The NGOs included both local and international non-governmental organizations. The findings of the study are summarized in the sections below.
9.1 The Distribution of the Size of Public and Private Sector Organizations
The Scan-ICT survey of public and private sector organizations and institutions shows that the majority of them, (accounting for 64%) have less than 100 employers; with 39% of them having less than 50 employers. Based on this evidence, most of Ghanaian public and private sector establishment can be described as small-to-medium scale (SME) type of organizations.
Comparing the public sector with the private sector, shows that: 54% of the public sector organizations have less than 100 employers, while a higher percentage of 73% of the private sector establishment have less than 100 personnel. The comparable figure for the NGO sector is 71%. On the whole private sector organizations and NGOs are more likely to be of a smaller size compared to public sector organizations. For example, while only 26% of the public sector organizations have size less than 50 employers the comparable figures for the private sector and the NGO sector are: 54% and 57% respectively.
Size of Organization (Number of Employees)
All Sectors
PublicSector
PrivateSector
NGO Sector
Below 50 39% 26% 54% 57%50 –100 25% 28% 19% 14%100-200 15% 16% 13% 21%200-500 8% 11% 6% 0%500-1000 4% 3% 5% 7%Over 1000 9% 17% 3% 0%
Source: INIIT, The Ghana Scan-ICT Study, 2002, © 2002, International Institute for Information Technology (INIIT)
The Scan-ICT Study also reveals that public sector organizations are on the whole larger than private sector organizations. For example, while 20% of the public sector organizations have staff of 500 and above, the comparable figures for the private sector and the NGO sector are: 8% and 7% respectively.
115

0%
10%
20%
30%
40%
50%
60%
All Sectors PublicSector
PrivateSector
NGOs
The Size of Public and Private Sector Organizations
Below 5050 –100100-200200-500500-1000Over 1000
9.2 Distribution of Types of the Public and Private Sector Organizations and Establishments
Of the organizations involved in the Scan-ICT nation-wide study, 38% are servicing companies (utilities, telecom and communications providers; banking, insurance and finance establishments; computer companies; etc); 11% are manufacturing and industrial type of establishments; 26% are Government, public or local authorities; and 8% are Academic and Research Institutions.
Type of Organization/ Establishment
All Sectors PublicSector
PrivateSector
Servicing Company 38% 32% 55%Manufacturing/Industrial Company 11% 0% 15%Government/Public/Local Authority 26% 54% 0%Academic/Research Institution 8% 10% 5%Others 17% 3% 24%
Source: INIIT, the Ghana Scan-ICT Study, 2002, © 2002, International Institute for Information Technology (INIIT)
Specifically in relation to the private sector; the majority of organizations are servicing companies, accounting for 55% with manufacturing/industrial companies accounting for only 15%. This distribution of types of private sector organizations do reflect the composition of the Ghanaian private sector which is dominated by distributive and servicing types of companies. The survey results also reflect the composition of the Ghana public sector which is dominated by Government Administrative type of establishments.
116
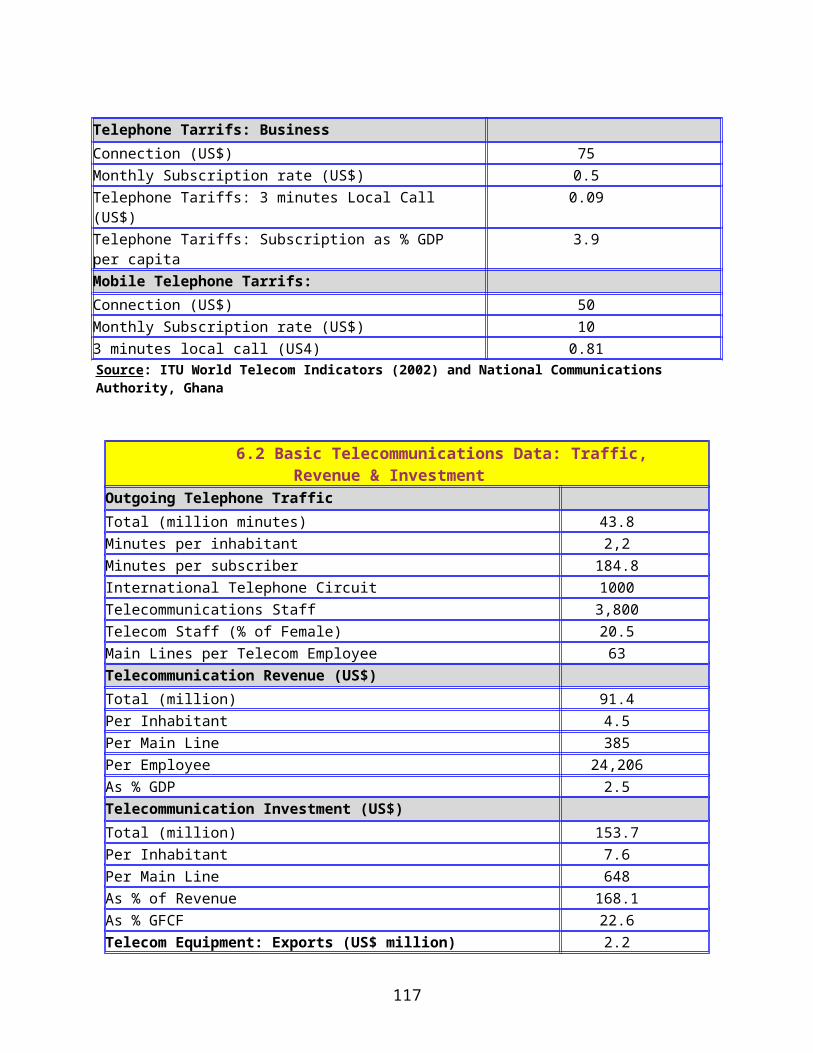
0%
10%
20%
30%
40%
50%
60%
All Sectors Public Sector Private Sector
Types of Organizations within each Sector
Servicing Company Manuf./Industrial
Govt/Public/Local Auth Academic/Res.Inst
9.3 Regional Distributions of Public and Private Sector Organizations and Establishments
The majority of the organizations involved in the study are located in the Greater Accra region, mostly in Accra. About 60% of the organization are based in the Greater Accra region with 19% for the Ashanti region; 8% for the Western Region and about 7% for the Central region.
RegionAll Sectors Public
SectorPrivateSector
Gt. Accra Region 60% 28% 74%Ashanti Region 19% 23% 11%Brong Ahafo Region 1% 5% 0%Eastern Region 2% 5% 1%Volta Region 1% 5% 0%Northern Region 1% 5% 0%Western Region 8% 11% 7%Upper West Region 1% 4% 0%Upper East Region 1% 5% 0%Central Region 7% 9% 6%
Source: INIIT, The Ghana Scan-ICT Study, 2002, © 2002, International Institute for Information Technology (INIIT)
Sectorial-wise, 28% of the public organizations surveyed are based in Accra; 23% in Ashanti region and about 11% for the Western region. The majority of the private sector establishments are traditionally based in the Greater Accra region, mainly in Accra. The Scan-ICT study reflected this with about 74% of the private sector organizations located in that region. The corresponding figures for the Ashanti, Western and Central regions are: 11%, 7% and 6% respectively. It is however important to note that some of these private sector organization, although most of them are based in Accra, do have branch offices and operations in other regions of the country. In relation to the NGO sector, most of these have their offices in Accra although the areas of operations of some of these are national in nature.
9.4 The Degree of Deployment of Computer Systems in Public and Private Sector Institutions
The vast majority of public and private sector organization in Ghana are computerized. The Scan-ICT national survey of these organization shows that 92% of them have computers. Comparative analysis
117

indicates that: 83% of the public sector organizations have computer systems in place; the corresponding figures for the private sector and the NGO sector are 99% and 100% respectively.
All Sectors PublicSector
PrivateSector
NGO Sector
Percent of Organization with computers 92% 83% 99% 100%Percent of Organizations without computers 8% 17% 1% 0%
Source: INIIT, The Ghana Scan-ICT Study, 2002, © 2002, International Institute for Information Technology (INIIT)
On the type of computer system installed in the public and private sector organizations including the NGOs, evidence as per the Scan-ICT study shows that 41% of all the organizations have stand-alone computer systems; with 42% having local area networks; 3% with organizational backbone network systems and 13% have wide area networks (WANs) in place. The organization with WANs are predominately the large ones with nation-wide operations.
Yes
No
Yes
No
Yes
No
Yes
No
0%
20%
40%
60%
80%
100%
All Sectors Public Sector Private Sector NGOs
Computer Deployment in Organizations
Type of Computer System Deployed
All Sectors PublicSector
PrivateSector
NGO Sector
Standalone Computers 41% 48% 35% 21%A Local Area Network 42% 40% 41% 57%A Backbone Network 3% 5% 4% 0%A Wide Area Network 13% 7% 20% 21%
Source: INIIT, The Ghana Scan-ICT Study, 2002, © 2002, International Institute for Information Technology (INIIT)
118
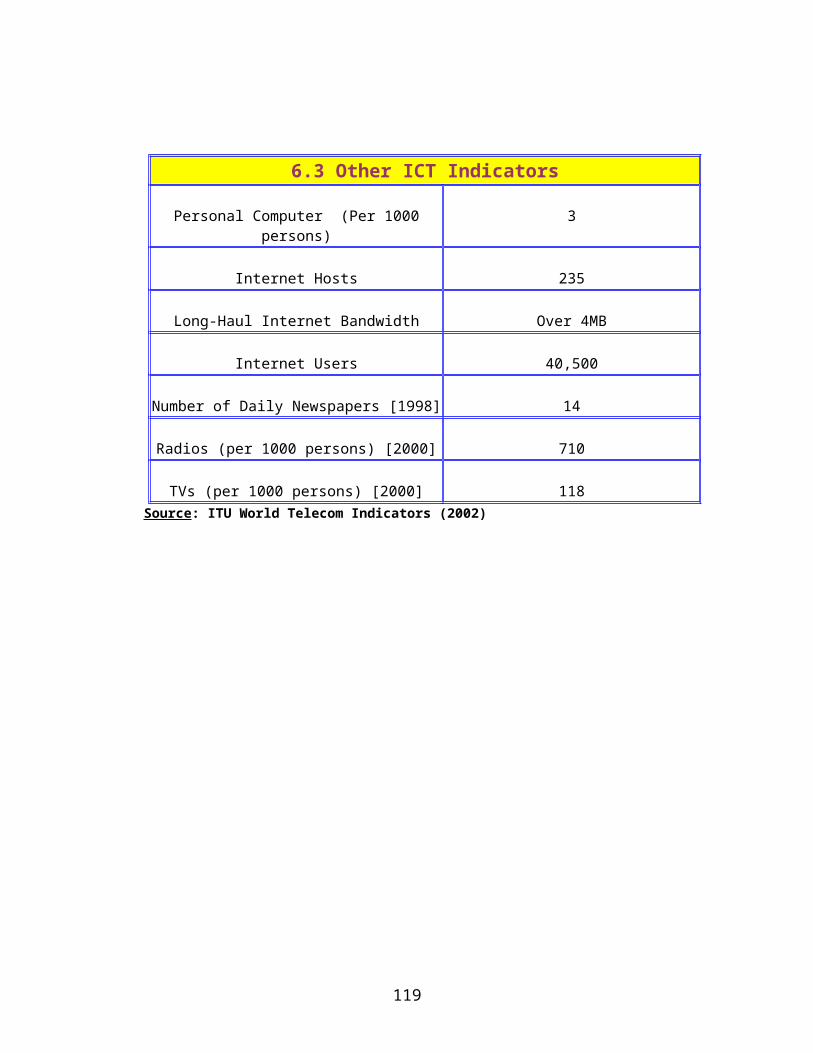
Examining the computer system deployment figures on a sectorial basis shows that while a higher percentage of the public sector organization have stand-alone systems compared to those having LANs, the reverse is the case of private sector establishments and the NGOs. The private sector establishment and the NGOs have a higher proportion of networked organizations than stand-alone computer system organizations.
0%10%20%30%40%50%60%
All SectorsPublic Sector PrivateSector
NGOs
Types of Computer Systems Deployed in Orgnizations
Standalone Computers A Local Area Network A Backbone Network A Wide Area Network
Also while only 5% of the public sector organizations have WANs in place the corresponding figure for the private sector and the NGO sector are 20% and 21% respectively. The relatively low percentage of public sector organization (a high proportion of which are Government agencies) with WANs is an indication that not many of the Government and other public agencies (with nation-wide branches and offices) have national networks in place.
9.5 The Level of Computer Usage in by the Personnel of Public & Private Sector Organizations
The Scan-ICT nationwide study on the degree of usage of computers to support the activities and operations of public and private sector organizations including the NGOs shows that: about 22% of the organizations reported having below 10% their staff that uses computers within the organization. About 28% reported that about a quarter of their staff use computers and 13% reported that about half use computers to do their work. Only 12% of the organizations have all their staff using computers.
Percent of Staff that uses computers in the Organization
All Sectors PublicSector
PrivateSector
NGO Sector
0% (none) 1% 0% 1% 0%below 10% 22% 30% 17% 7%About 25% 28% 36% 24% 7%About 50% 13% 17% 14% 0%About 75 % 24% 13% 27% 50%About 100% 12% 4% 17% 36%
Source: INIIT, The Ghana Scan-ICT Study, 2002, © 2002, International Institute for Information Technology (INIIT)
Sectorially, while 30% of the public sector organizations have only about a quarter of their staff using computers, the corresponding figures for the private sector and the NGO sector are: 24% and 7%
119
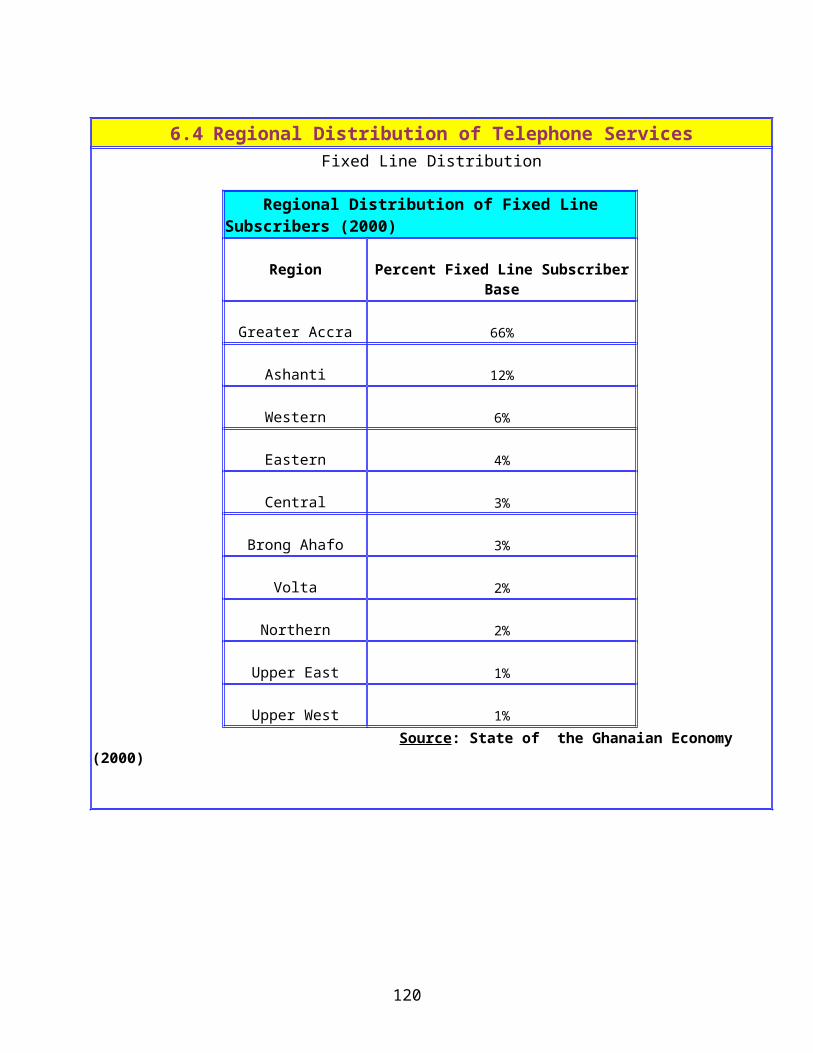
respectively. The NGOs on the whole have more of their staff using computers as compared to the public and private sector organizations. For example, while 36% of the NGOs reported having all their staff using computers to do their work; the corresponding figures for the public sector and the private sector are 17% and 4% respectively. On the whole the statistics shows that private sector workers are more likely to use computers to support their work than their public sector counterparts.
9.5 Landscape of ICT Human Resources and Expertise in Public and Private Sector Organizations
Proportion of ICT Personnel
About 20% of the organizations involve in the Scan-ICT study do not have computer personnel while about 50% indicated that less than 10% of their staff are computer personnel. Just about 11% have about a quarter of their staff as computer personnel.
Percent of total staff who are Computer Personnel
All Sectors
PublicSector
PrivateSector
NGO Sector
0% (none) 20% 22% 22% 0%below 10% 58% 66% 53% 79%About 25% 11% 7% 9% 14%About 50% 5% 3% 8% 0%About 75 % 3% 3% 5% 0%
About 100% 2% 0% 3% 7% Source: INIIT, The Ghana Scan-ICT Study, 2002, © 2002, International Institute for Information Technology (INIIT)
Sectorial comparisons of the figures shows that for both the public sector and the private sector, 22% of the organizations do not have computer staff. As high as 66% of the public sector organization half less than 10% of their staff as computer personnel and the corresponding figures for the private sector and the NGO sector are: 53% and 79% respectively. Also only 7% of the public sector organizations have about a quarter of their staff as computer personnel; the corresponding figures for the private sector and the NGO sector are: 9% and 14% respectively.
None of the public sector organization half close to 100% computer staff, while about 3% of the private sector organizations reported having a near 100% computer personal as staff. The corresponding figure for the NGO sector is 7%.
0%
20%
40%
60%
80%
All Sectors Public Sector Private Sector NGOs
IT Personnel as Percent of Total Staff
0% (none) below 10% About 25% About 50%
About 75 % About 100%
120
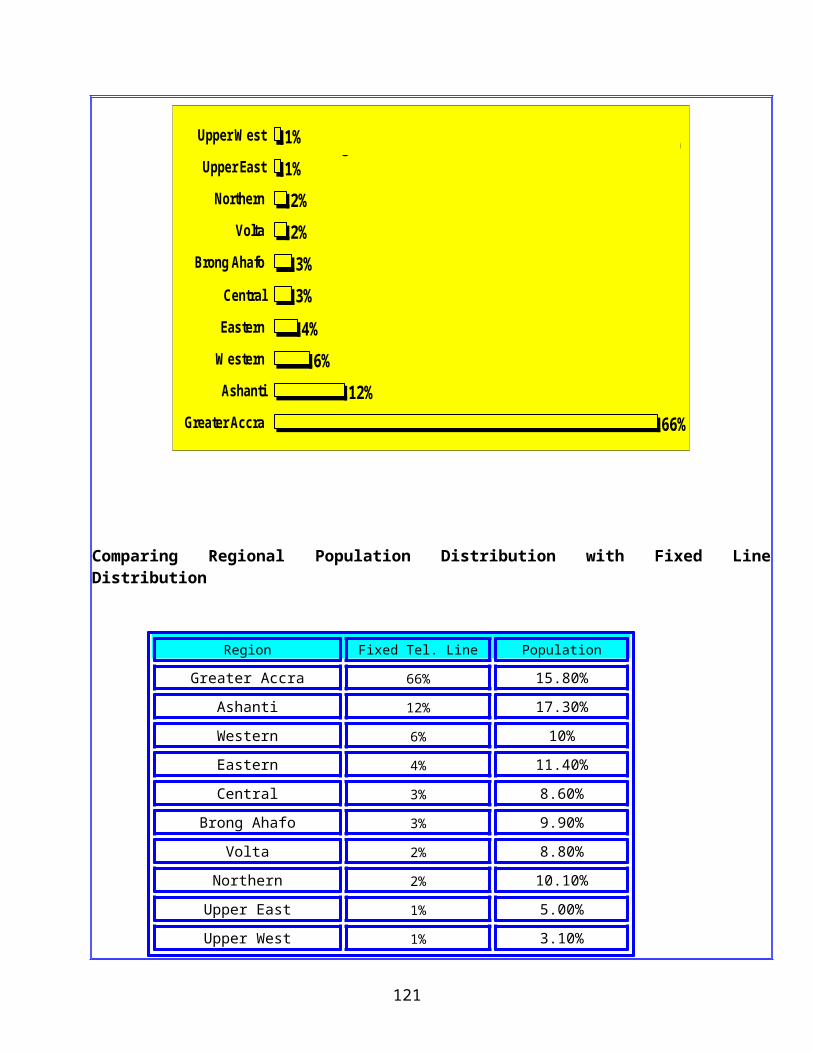
On the whole the majority of the public and private sector organizations including the NGOs have a relatively low percentage of computer staff. This result confirms the low level of skilled ICT manpower within Ghanaian companies, institutions and establishments.
Specific ICT Skills
Relating particularly to specific types of ICT skills within the organizations in both the public and private sector as well as the NGO sector; the results of the Scan-ICT national survey of these organizations shows that: about 22% have programmers; 15% have software developers and about 16% having computer scientists on their IT staff.
Type of ICT Expertise/SkillAll Sectors Public
SectorPrivateSector
NGO Sector
Programmers 22% 22% 17% 16%Software developers 15% 18% 13% 16%System analysts 16% 10% 21% 22%Computer scientists 16% 18% 14% 13%Telecom Specialists 4% 5% 4% 0%Network Engineers/Technicians 16% 12% 19% 25%IT trainers 11% 14% 11% 9%
Source: INIIT, The Ghana Scan-ICT Study, 2002, © 2002, International Institute for Information Technology (INIIT)
Comparatively, a higher percentage of private sector organizations reported having network engineers/technicians than public sector organizations. The figure for the private sector is 19% compared to that of the public sector of 12%. However, higher proportion of the public sector organizations have computer scientists on their IT staff compared to the private sector organization and the NGOs.
121
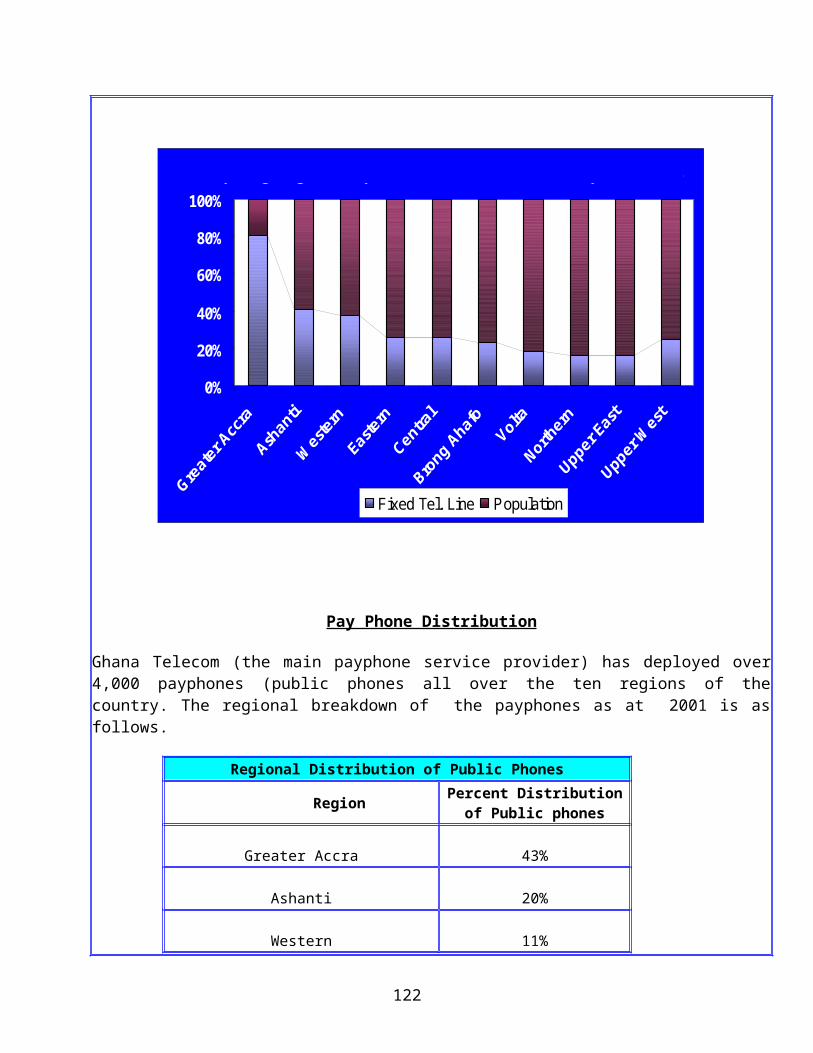
Average Number of Specific ICT Personnel per Organization
Most of the public and private sector organization have on average 2 programmers, 2 software developers, 2 system analysts and 2 computer scientists on their ICT staff
Type of ICT Expertise/SkillAll
SectorsPublicSector
PrivateSector
NGO Sector
Programmers 2 2 3 1Software developers 2 2 1 2System analysts 2 4 1 1Computer scientists 2 3 2 2Telecom Specialists 3 5 4 0Network Engineers/Technicians 3 4 3 2IT trainers 3 2 3 2
Source: INIIT, The Ghana Scan-ICT Study, 2002, © 2002, International Institute for Information Technology (INIIT)
There is no major disparity between the sectorial figures. On the whole, the average number or ICT personnel in each skill category is low for all organizations. The average of all the skill areas is about 2.5 per organization.
9.6 Expenditure on ICT as Percentage of Total Organizational Expenditure
The majority of public and private sector organizations spend less than 10% of their total budget on ICT (including acquisition of hardware software, training, maintenance of ICT systems etc). About 51% indicated that their ICT expenditure as a percentage of their total expenditure is below 19%. Close to 36% of the public and private sector organizations reported devoting about a quarter of their total expenditure to ICTs. On the whole most of the organizations in all sectors spend less than half of their annual budget on information technology
ICT expenditure as percentage of total organizational annual
expenditure
All Sectors PublicSector
PrivateSector
NGO Sector
0% (none) 2% 4% 0% 0%below 10% 51% 60% 52% 43%About 25% 36% 32% 31% 50%About 50% 7% 0% 11% 0%About 75 % 3% 3% 4% 7%About 100% 1% 0% 1% 0%
Source: INIIT, The Ghana Scan-ICT Study, 2002, © 2002, International Institute for Information Technology (INIIT)
Looking closely at the sectorial breakdown of the organizations: about 60% of the public sector organizations spend less than 10% of their annual budget on ICTs; the corresponding figures for the private sector and the NGO sector are: 52% and 43% respectively. The ICT budget of about 32% of the public sector organizations accounts for about half of their total expenditure; the corresponding figures for the private sector is 32% and that for the NGOs is 50%.
122
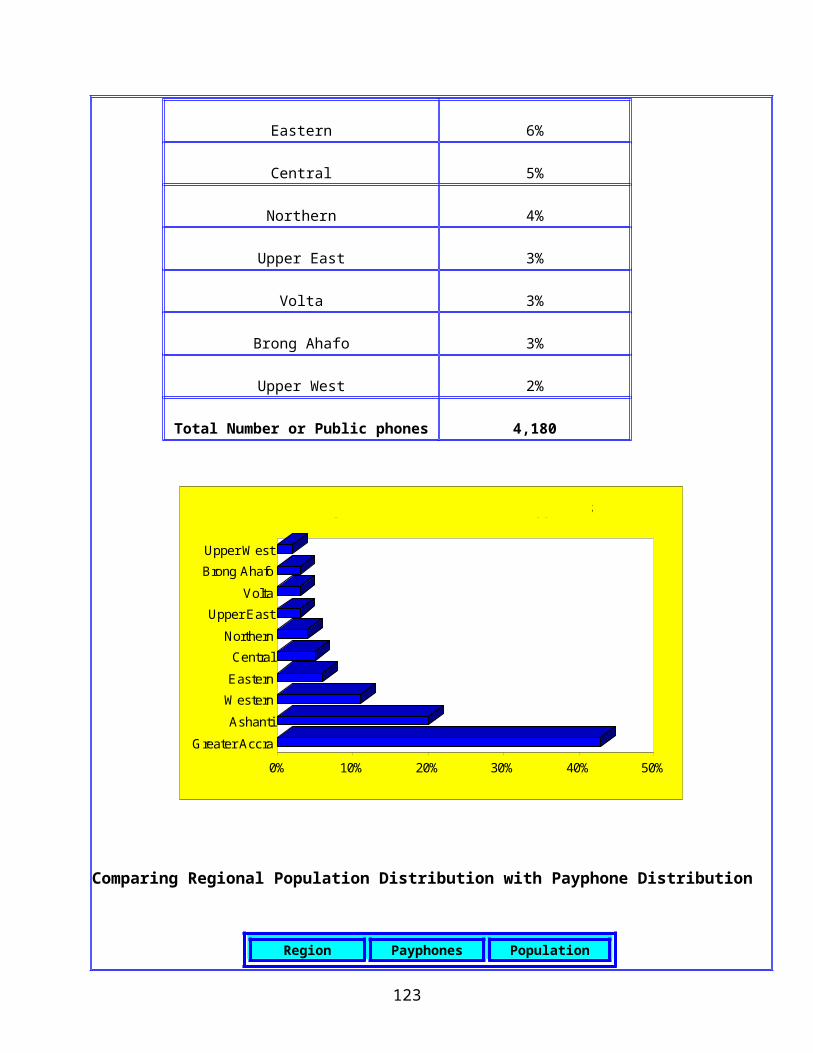
0%
10%
20%
30%
40%
50%
60%
AllSectors
PublicSector
PrivateSector
NGOs
Expenditure on IT as Percentage of Total Organizational Expenditure
0% (none)
below 10%
About 25%
About 50%
About 75 %
About 100%
9.7 Home Ownership of Computers by Staff
The results of the nationwide Scan-ICT survey on the home ownership of computers by employees of public and private sector organizations and establishments shows that: a high 81% of organizations have some proportion of their staff that own and use computers at home.
All Sectors
PublicSector
PrivateSector
NGO Sector
Percent of Staff with computers at Home 81% 68% 81% 93%
Percent of Staff without computers at Home 19% 32% 19% 7%
Source: INIIT, The Ghana Scan-ICT Study, 2002, © 2002, International Institute for Information Technology (INIIT)
Sectorially, about 68% of the public sector organizations have staff with computers at home. The corresponding figures for the private sector and the NGO sector are: 81% and 93% respectively.
Yes
No
Yes
No
Yes
No
Yes
No
0%10%20%30%40%50%60%70%80%90%
100%
All Sectors Public Sector Private Sector NGOs
Home Ownership of Computers
Of the organizations with staff who have computers at home, about 57% have less than 10% of their staff with computers at home, only about 3% have about half of their staff with computers at home and as low as 1% of the organization have all their staff with computers at home. On the whole, although 81% of the
123
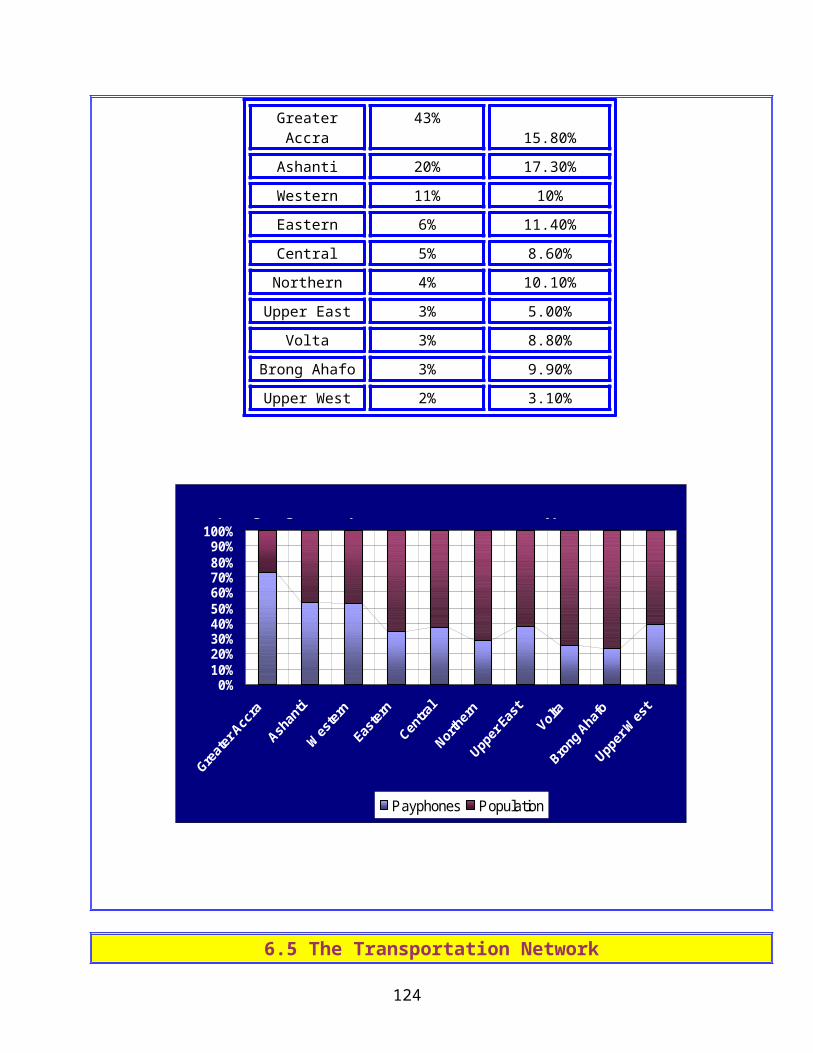
organizations reported having staff who are home owners of computers, the majority of them have less than a quarter of their staff in this category
Percent distribution of Staff with computers at
home
All Sectors
PublicSector
PrivateSector
NGO Sector
Below 10% 57% 95% 67% 31%About 25% 15% 3% 22% 46%About 50% 3% 2% 5% 8%About 75 % 3% 0% 5% 8%About 100% 1% 0% 2% 0%
Source: INIIT, The Ghana Scan-ICT Study, 2002, © 2002, International Institute for Information Technology (INIIT)
Looking at the findings on a sectorial basis, while as high is 95% of the public sector organizations reported having less than 10% of their staff having computers at home, the private sector organizations recorded just about 67% with the NGO figure at 31%. Only 3% of the public sector organizations have about a quarter of their staff with computers at home; the corresponding figures for the private sector and the NGOs are: 22% and 46% respectively.
0%10%20%30%40%50%60%70%80%90%
100%
AllSectors
PublicSector
PrivateSector
NGOs
Distribution of Home Computer Ownership
About 100%
About 75 %
About 50%
About 25%
Below 10%
124
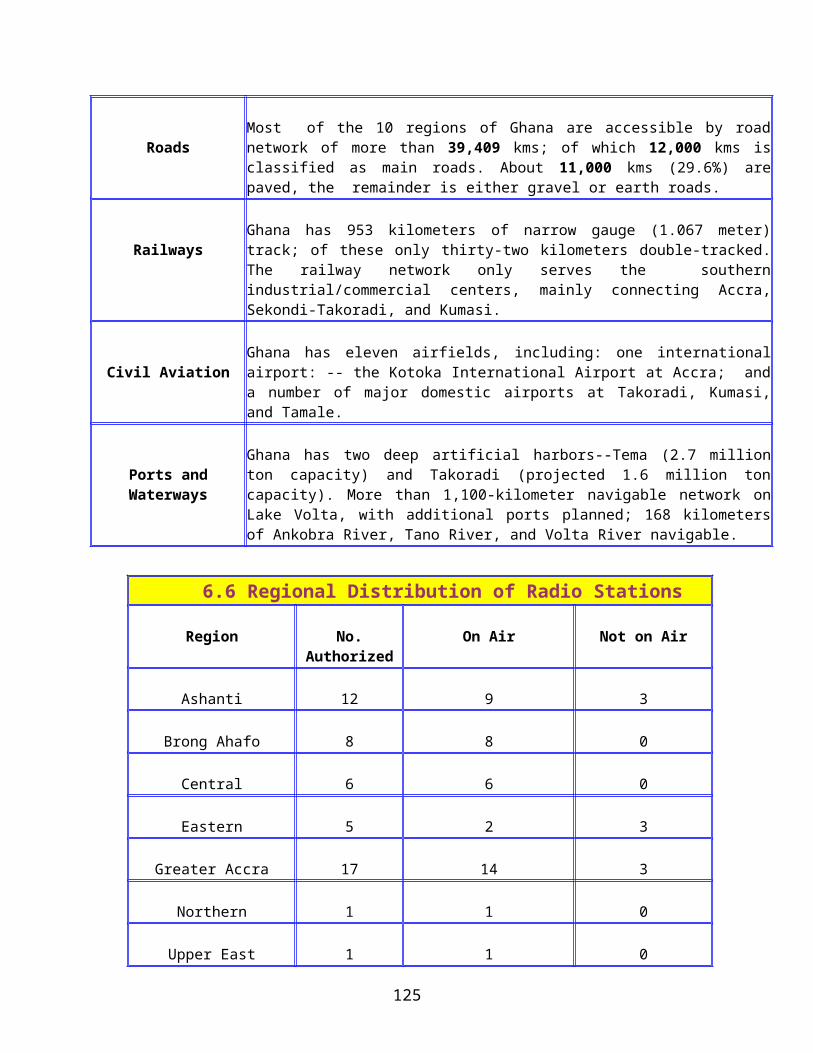
9.8 The Degree of Internet Access, Usage and Presence
The Level of Internet Access
The Scan-ICT survey on the level of Internet connectivity shows that: close to 81% of the public and private sector organizations including the NGOs have access to the Internet. Sectorially, 69% of the public sector organization have Internet access compared to 90% of the private sector establishment and 100% in the case of the NGOs
All Sectors PublicSector
PrivateSector
NGO Sector
Percent of Organizations with access to the Internet 81% 69% 90% 100%Percent of Organizations without access to the Internet 19% 31% 10% 0%
Source: INIIT, The Ghana Scan-ICT Study, 2002, © 2002, International Institute for Information Technology (INIIT)
Yes
No
Yes
No
Yes
No
Yes
No
0%10%20%30%40%50%60%70%80%90%
100%
All Sectors Public Sector Private Sector NGOs
Internet Access
The Spread of Internet Usage within Organizations
Of the organizations with Internet access, 44% reported that below 10% of their staff uses the Internet; while about 14% reported that about a quarter of their staff uses the Internet. Only 9% of the organization have half of their staff using the Internet. On the whole although close to 81% of the organizations have Internet access, the vast majority of them have less than half of their staff that uses the Internet.
125
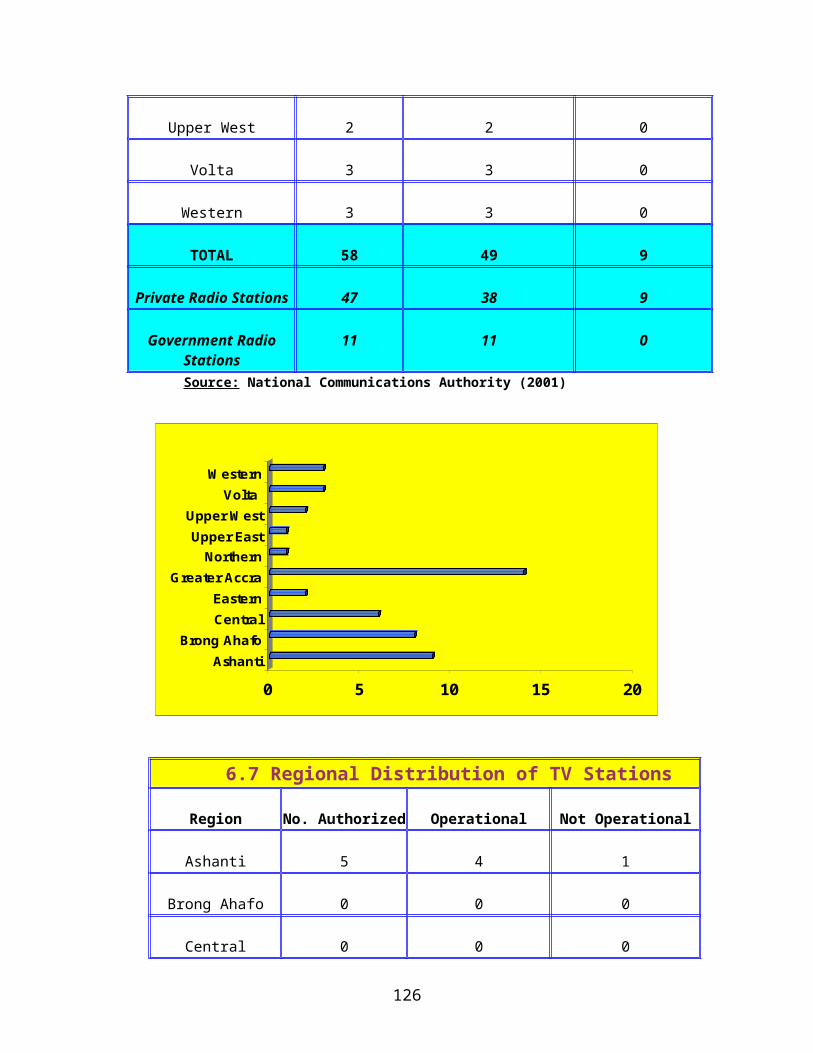
Percent of staff within the Organization who uses the Internet
All Sectors PublicSector
PrivateSector
NGO Sector
0% (none) 20% 28% 14% 0%below 10% 44% 54% 45% 31%About 25% 14% 9% 13% 23%About 50% 9% 6% 9% 8%About 75 % 7% 1% 11% 23%About 100% 7% 3% 8% 15%
Source: INIIT, The Ghana Scan-ICT Study, 2002, © 2002, International Institute for Information Technology (INIIT)
Examining the results in terms of the spread of usage of the Internet within each sector, about 54% of the connected public sector organizations reported that less than 10% of their staff uses the Internet. The corresponding figures for the private sector and the NGO sector are: 45% and 31% respectively.
Only 9% of the public sector organizations have about a quarter of their staff that uses the Internet although 69% of these organizations have access to the Internet. In the case of the private sector organizations, close to 13% have about a quarter of their staff using the Internet. The corresponding figure for the NGO sector is a higher 23%. On the whole it is only in the NGO sector that a reasonable percentage of the organizations have a slightly higher proportion of their staff that uses the Internet. For example, about 15% of the NGOs have all their staff having access to the Internet; the corresponding figures for the public sector and the private sectors are: 3% and 8% respectively.
0%
10%
20%
30%
40%
50%
60%
All Sectors PublicSector
PrivateSector
NGOs
Spread of Internet Usage within Organizations
0% (none)
below 10%About 25%
About 50%About 75 %
126
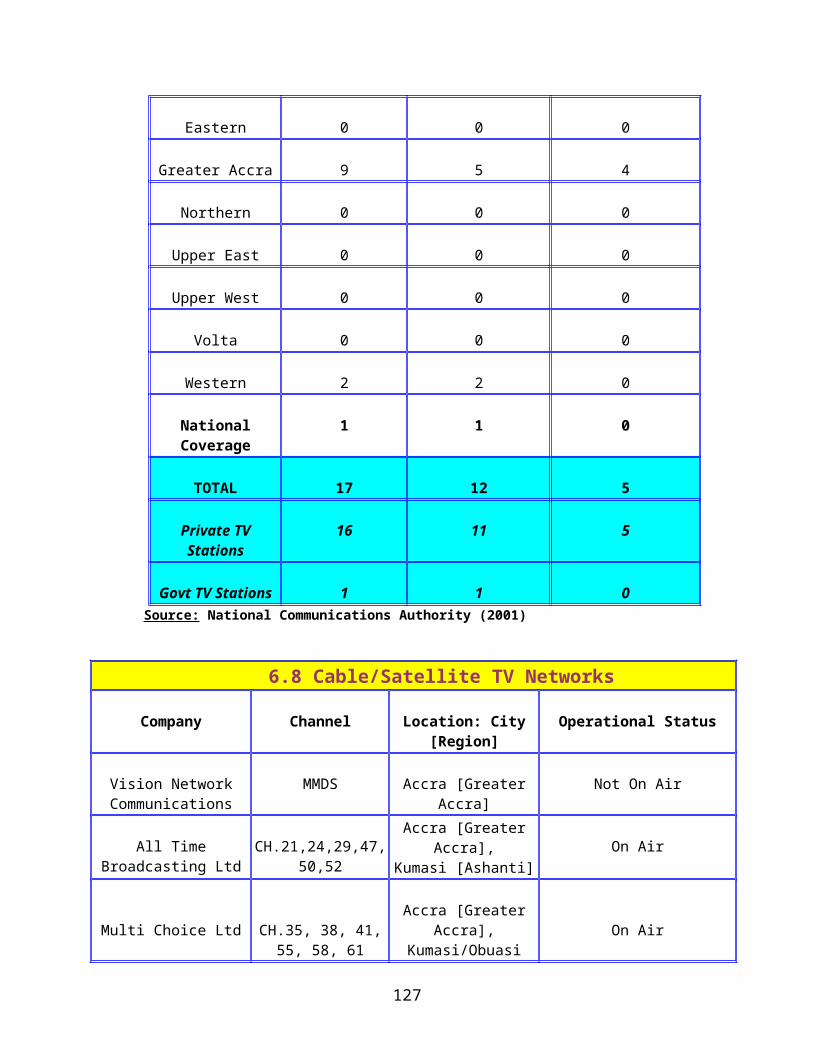
9.9 Type of Internet Usage
In relation to the type of usage of the resources of the Internet, about 30% of the organizations involved in the Scan-ICT nation-wide survey use the Internet for e-mail while 26% use it for Web browsing and 24% for downloading materials among others. Only 14% use the Internet for providing information or publicity material about their organizations. A much lower percentage of 7% use the Internet for advertising or marketing their products or services. On the whole the majority of the organizations do not use the Internet to promote or inform their prospective clients or the public at large about what they do or the services they offer.
Types of UsageAll
SectorsPublicSector
PrivateSector
NGO Sector
E-mail 30% 31% 30% 30%Access to the Web 26% 26% 26% 27%Downloading Materials 24% 24% 23% 25%Providing info/publicity about the org. 14% 14% 13% 14%Advertising and/or marketing 7% 5% 8% 5%
Source: INIIT, The Ghana Scan-ICT Study, 2002, © 2002, International Institute for Information Technology (INIIT)
There is no major disparity between the various sectors in terms of what the organizations use the Internet for. The striking feature in all cases is that the Internet is use by the vast majority of them for e-mail and Web-browsing. Although the percentage of private sector establishments using the Internet for advertising is relatively high compared to the other sectors, the figure of 8% is still very low.
0%
5%
10%
15%
20%
25%
30%
35%
AllSectors
PublicSector
PrivateSector
NGOs
Types of Internet Usage
Access to the Web
Downloading Materials
Providing info/publicityabout the organization
Advertising and/or marketing
127
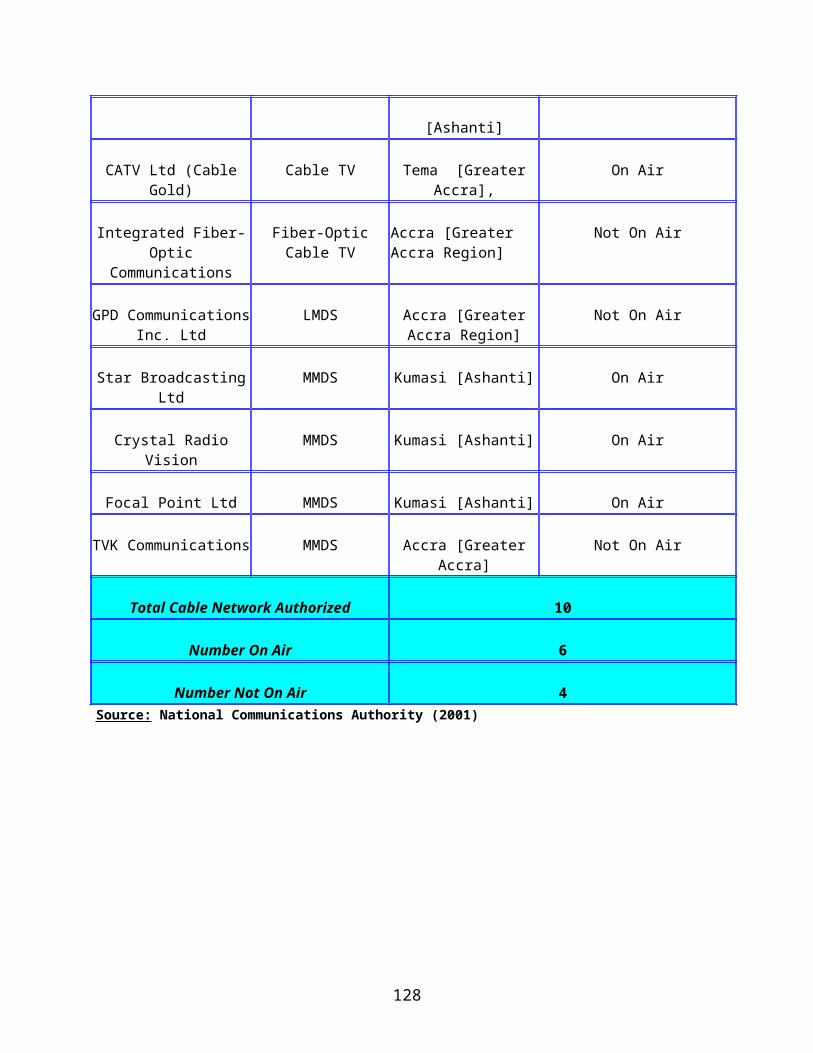
9.10 Web Presence
Just about 48% of the organizations involve in the study indicated having their own Web site. On the whole a higher proportion of private sector organizations (about 58%) have Web-sites compare to 41% of public sector companies and 54% of NGOs.
All Sectors
PublicSector
PrivateSector
NGO Sector
Percent of organization with own Web site 48% 41% 53% 54%Percent of organization without own Web site 52% 59% 47% 46%
Source: INIIT, The Ghana Scan-ICT Study, 2002, © 2002, International Institute for Information Technology (INIIT)
YesNo
Yes
NoYes
No
Yes
No
0%
10%
20%
30%
40%
50%
60%
All Sectors Public Sector Private Sector NGOs
Web Presence
Comparing the sectors in relation to the degree of Internet access and the level of the web presence of the organizations within each of the sectors shows that for all sectors just a small proportion of those with Internet access have Web sites. The relatively low level of Web presence as per these organizations imply that Ghanaian organizations are weak on content development in relation to the Internet
0%
20%
40%
60%
80%
100%
All Sectors Public Sector PrivateSector
NGOs
Comparing Internet Access and Web Presence
Interne Access Web Presence
128
9.11 Level of Involvement in E-Commerce
The vast majority of the organizations in both the public and private as per the details of the Scan-ICT national survey on e-commerce activities are not involved in trading their goods and services on the Internet. About 91% of the organizations and establishments that took part in the study are not involved in e-commerce.
All Sectors PublicSector
PrivateSector
NGO Sector
Percent of organizations involve in e-commerce 9% 7% 10% 0%Percent of organizations not involve in e-commerce 91% 93% 90% 100%
Source: INIIT, The Ghana Scan-ICT Study, 2002, © 2002, International Institute for Information Technology (INIIT)
Sectorially, about 93% of the public sector organizations are not involved in e-commerce; the corresponding figures for the private sector and the NGO sector are 90% and 100% respectively.
Involvement in E-Commerce
0%10%20%30%40%50%60%70%80%90%
100%
All Sectors Public Sector Private Sector NGOs
Yes No
9.12 Comparing Internet Access, Web Presence and Involvement in E-Commerce
Across all sectors, the proportion of organizations with Web presence are relatively lower than the proportion with Internet access and the proportion involve in e-commerce is considerably lower than those with Web presence. For all sectors there is a huge disparity between the percentage of organization with Internet access compared to those involved in e-commerce. Very few Ghanaian establishments across all sectors are using the Internet to promote their organization and do business.
129
0%
20%
40%
60%
80%
100%
All Sectors Public Sector Private Sector NGOs
Internet Access, Web Presence and Involvement in E-Commerce
Internet Access Web Presence E-Commerce Involvement
9.13 Development of Organizational IT Strategy
Close to 61% of the organizations who participated in the Scan-ICT survey indicated having in place their organizational IT policy or strategy. Sectorially, 66% of the public sector organizations have their IT policy/strategy, while a slightly less proportion of 58% of the private sector organizations indicated having their organizational IT policy/strategy. The corresponding figure for the NGOs is 64%
All Sectors PublicSector
PrivateSector
NGO Sector
Percent of organization with IT policy/strategy or plan 61% 66% 58% 64%Percent of organization without IT policy/strategy or plan 39% 34% 42% 36%
Source: INIIT, The Ghana Scan-ICT Study, 2002, © 2002, International Institute for Information Technology (INIIT)
Yes
No
Yes
No
Yes
No
Yes
No
0%
10%
20%
30%
40%
50%
60%
70%
All Sectors Public Sector Private Sector NGOs
Organizational IT Policy/Strategy
130
9.14 Degree of Computer Resource Utilization
The degree of underutilization of computer resources in widespread in Ghanaian organizations and establishments across all sectors. The Scan-ICT national survey reveals that, about 22% of the organizations reported a below 10% computer resource utilization. About 13% reported achieving a resource utilization rate close to 25%, while 25% of the respondents reported about 50% level of computer resource utilization. Only about 9% of the organizations achieve about 100% resource utilization level.
Percent of computer resource utilization
All Sectors PublicSector
PrivateSector
NGO Sector
below 10% 22% 32% 12% 14%About 25% 13% 15% 8% 14%About 50% 25% 23% 28% 7%About 75 % 32% 27% 41% 36%About 100% 9% 2% 11% 29%
Source: INIIT, The Ghana Scan-ICT Study, 2002, © 2002, International Institute for Information Technology (INIIT)
0%
20%
40%
60%
80%
100%
120%
AllSectors
PublicSector
PrivateSector
NGOs
Degree of Computer Resource Utilization
About 100%
About 75 % About 50%
About 25% below 10%
The sectorial breakdown of the figures indicates that while 32% of the public sector organization reported a below 10% computer resource utilization level, a lower percentage of 12% of the private sector establishments reported the same level of utilization. The corresponding figure for the NGOs is about 14%. Regarding 50% level of utilization, the figures are: 23% of the public sector organization; 28% of the private sector establishment and a low 7% of the NGOs.
While only 2% of the public sector organization reported closed to 100% computer resource utilization, the corresponding figures for the private sector and the NGO sector are: 11% and 29% respectively.
131
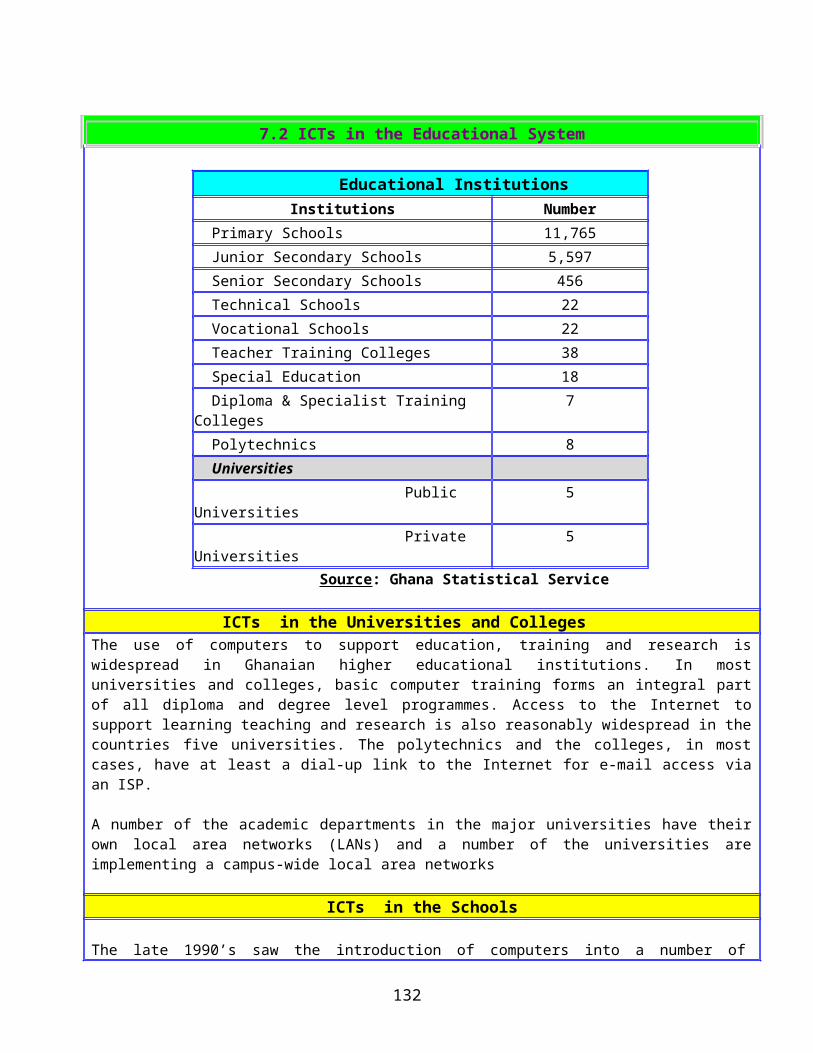
9.15 Levels of Organizational Operations Supported by Use of Computers
A national survey in relation to the level to which the operations of organizations are supported by the use of computers shows that 16% of the organizations do not use computers to support any of their organizational activities or operations. About 23% indicated using computers to support below 10% of their operations. On the whole, close to 16% of the organizations surveyed used computers to support all their operations and activities
Percent of organizational operations supported by computers
All Sectors PublicSector
PrivateSector
NGO Sector
0% (none) 16% 0% 12% 1%below 10% 23% 21% 17% 1%About 25% 21% 26% 21% 20%About 50% 27% 28% 32% 21%About 75 % 12% 19% 18% 50%About 100% 16% 6% 12% 7%
Source: INIIT, The Ghana Scan-ICT Study, 2002, © 2002, International Institute for Information Technology (INIIT)
Sectorial analysis of the study results shows that about 21% of the public sector organizations support less than 10% of their operations with computers. The corresponding figures for the private sector and the NGO sector are 17% and 1% respectively. On the whole the NGOs use computers to support a higher proportion of their operations and activities than is the case of the public sector organizations and to some extent the private sector establishments.
0%
10%
20%
30%
40%
50%
All Sectors Public Sector Private Sector NGOs
Organizational Operations Supported by the Use of Computers
0% (none) below 10% About 25% About 50% About 75 %
132
9.16 Information Technology Deployment and Exploitation Problems Face by Organizations
The Scan-ICT survey of the types of IT deployment and exploitation problems being face by organizations in the public and private sector shows that a relatively high percentage of them single out the cost of computer products and the shortage of computer skills as some of the major problems they face. For example, about 26% of the organizations surveyed identified the high cost of computer products and services as inhibiting the deployment and exploitation ICTs within their respective organizations. Of those surveyed, 17% singled out the shortage of computer skills nationally and within their respective organizations as a major problem area.
Close to 13% of the organizations consider computer system installation and implementation problems as a limiting factor while 12% reported problems relating to poor after sales customer support by computer vendors as one of the key problem areas of affecting the deployment and exploitation of computers within their respective organizations. Finally only a small proportion (about 2%) of the organization regarded industrial relations problems due to computerization as a major problem area.
IT related problems face by organizations
All Sectors PublicSector
PrivateSector
NGO Sector
Computer Skill Shortage within the org 17% 20% 13% 13%Problem with staff acceptance of computers 5% 5% 7% 0%Problem with adjustment to computer systems 7% 8% 6% 6%Computer system installation, implementation problems 13% 11% 15% 13%Problems relating to after sales customer support 12% 12% 14% 13%Problems with monitoring new dev 11% 11% 9% 25%Problem with proliferation of computer products 5% 5% 4% 6%High cost of computer products and services 26% 26% 29% 25%Industrial relations problems due to computerization 2% 2% 2% 0%
Source: INIIT, The Ghana Scan-ICT Study, 2002, © 2002, International Institute for Information Technology (INIIT)
133
0%
20%
40%
60%
80%
100%
All Sectors Public Sector Private Sector NGOs
IT Deployment and Exploitation Problems
Industrial relations problems due to computerization High cost of computer products and services
Problem with proliferation of computer productsProblems with monitoring new dev
The sectorial distribution of the survey results shows that: organizations irrespective of the sector they belong, rank the cost of computer products and services as the most problematic. On the whole a higher proportion of public sector companies regarded computer skill shortage as a problem area compared to those in either the private sector or the NGO sector. While the percentage for the public sector is about 20%, the corresponding figures for both the private and the NGO sectors is 13%.
0%
20%
40%60%
80%
100%
All Sectors Public Sector PrivateSector
NGOs
IT Deployment and Exploitation Problems
Problems relating to after sales customer supportComputer system installation, implementation problems
Problem with adjustment to computer systems Problem with staff acceptance of computersComputer Skill Shortage within the org
134
CHAPTER TENCHAPTER TEN
SECTORAL APPLICATIONS: THE EDUCATIONAL SECTOR
THE DEPLOYMENT AND EXPLOITATION OF ICTs IN THE SCHOOLS
Introduction
The Scan-ICT study on the deployment and exploitation of ICTs within the Ghana educational system involved schools (primary and secondary) nationwide. Postal questionnaires were used and these were posted to a represented sample of over 500 schools nationwide. About 13% of the schools are rural based. Of the urban-based schools, 52% are based in towns while 33% are based in cities, the majority of which are the regional capitals including Accra the national capital
Location of Schools Percentage of SchoolsVillage (rural) 13%Town (urban) 52%City (urban) 33%
Source: INIIT, The Ghana Scan-ICT Study, 2002, © 2002, International Institute for Information Technology (INIIT)
Location of Schools
City (urban)
Town (urban)
Village (rural)
The average size of the schools that participated in the Scan-ICT study is about 732 pupils per school and the corresponding average number of teachers was estimated at 34 teachers per school. The corresponding teacher-to-pupils ratio for Ghanaian schools is 22 as per the details of the study.
135
Average of Number Pupils per School 732Average Number of Teachers per School 34Average Pupil – Teacher Ratio (average class size) 22
Source: INIIT, The Ghana Scan-ICT Study, 2002, © 2002, International Institute for Information Technology (INIIT)
10.1 Computers in Schools
A number of Ghanaian schools especially the secondary schools have computers. About 79% of the schools reported having computers, with the average number of computers per school estimated at 19
Percent of School with Computers 79%Percent of School without Computers 17%Average number of computers per school 19
Source: INIIT, The Ghana Scan-ICT Study, 2002, © 2002, International Institute for Information Technology (INIIT)
0%
20%
40%
60%
80%
Yes No
Schools with Computers
Of the schools reporting having computers, about 13% indicated having them for less than a year. A relatively high proportion of 26% indicated a period of 1 to 2 years of ownership of computers. The corresponding figure for 2- 3 years and 3- 4 years are: 18% and 13% respectively. Only about 8% of the schools reported having computers for more than five years. None of the schools indicated that: they use to have computers but no more. In other words, the schools without computers never had computers in the past.
136
Duration of Computer Ownership (To-Date) Percent of Schoolsless than a year, 13%
1- 2 years, 26%2- 3 years, 18%3-4 years 13%4-5 years 11%
more than 5 years 8% Source: INIIT, The Ghana Scan-ICT Study, 2002, © 2002, International Institute for Information Technology (INIIT)
Duration of Computer Ownership (To-Date)
4-5 years
3-4 years
2- 3 years,
1- 2 years,
less than a year,
more than 5 years
10.2 Computer Literacy of the Teaching Staff
The Scan-ICT study also shows that 85% of the schools have computer literate teachers. Based on the nation-wide survey results, the average number of computer literate teachers per school in Ghana is estimated at 7 per school.
Although a high percentage of schools reported having computer literate teachers, the number of teachers per school that are computer literate is low. On the whole, the study revealed that about 16% of teachers per school are computer literate
Percent of Schools with Computer Literate Teachers 85%Percent of School without Computer Literate Teachers 4%Average No. of Computer Literate Teachers per school 7Percent of teachers who are computer literate teachers per school 16%
Source: INIIT, The Ghana Scan-ICT Study, 2002, © 2002, International Institute for Information Technology (INIIT)
137
10.3 The Usage of Computers in the Schools
Of the schools with computers about 53% reported using computers to support school administrative work, with a high 97% reporting using the computers to support teaching and only 16% indicated using their computers to access the Internet.
Type of Computer Usage Percent of SchoolTo Support School Admin. work 53%To support Teaching 97%Access the Internet 16%
Source: INIIT, The Ghana Scan-ICT Study, 2002, © 2002, International Institute for Information Technology (INIIT)
0% 20% 40% 60% 80% 100%
To Support SchoolAdmin. work
To supportTeaching
Access theInternet
Type of Computer Usage in Schools
10.4 Level of Usage of Computers by Teachers
The percentage of teachers who uses computers to support teaching, administrative work and/or access to the Internet varies from school to schools. About 58% of the schools indicated that below 10% of their teachers use computers to support their work with 24% reporting that close to a quarter of their staff use computers. About 18% reported that none of their teachers use the computer.
Percent distribution of Teachers who Use Computers in School
Percent of Schools
0% (none) 18%below 10% 58%About 25% 24%About 50% 0%About 75 % 0%About 100% 0%
Source: INIIT, The Ghana Scan-ICT Study, 2002, © 2002, International Institute for Information Technology (INIIT)
138
0%
10%
20%
30%
40%
50%
60%
0%(none)
below10%
About25%
About50%
About75 %
About 100%
Percent distribution of Teachers who Use Computers in School
10.5 Level of Usage of Computers by Students/Pupils
Of the schools involved in the Scan-ICT study, about 11% reported that none of their pupils use the computer for learning and/or access to the Internet. About 24% indicated that below 10% of their student population use the computers with about 8% reporting that about half of their students use the computers. A relatively high proportion of the schools reported that all their pupils uses the computer for learning and/or access to the Internet.
Percent Distribution of Pupils who use Computers in School
Percent of Schools
0% (none) 11%below 10% 24%About 25% 8%About 50% 8%About 75 % 24%About 100% 26%
Source: INIIT, The Ghana Scan-ICT Study, 2002, © 2002, International Institute for Information Technology (INIIT)
0%
5%
10%
15%
20%
25%
30%
0%(none)
below10%
About25%
About50%
About75 %
About 100%
Percent Distribution of Pupils who use Computers in School
10.6 Home Ownership of Computers
139
Home ownership of computers by teachers is not widespread in Ghanaian school, only about 25% of the schools reported having staff that have computers at home. Close to 63% of the schools reported that their staff do not have computers at home.
Percent of Staff with computers at Home 25%Percent of Staff without computers at Home 63%
Source: INIIT, The Ghana Scan-ICT Study, 2002, © 2002, International Institute for Information Technology (INIIT)
Of those schools with staff who are home owners of computers, the majority reported that below 10% of their staff have computers at home. Only 2% of the schools reported that close to a quarter of their staff have computers at home.
10.7 Internet Access and Usage in the Schools
A high percentage of Ghanaian schools don’t have access to the Internet. Of the schools surveyed nationally 81% of them reported not having connectivity to the Internet. Only about 15% reported having Internet access.
0%
20%
40%
60%
80%
100%
Yes No
Internet Access
Usage of Internet Access
Most of the schools with access to the Internet use it for e-mail, Web browsing and for downloading teaching learning materials. About 57% of the schools reported using their Internet accessing for these types of activities
Schools with Science Resource Centers
Of the schools taking part in the study, 46% have Science Resource Centers. There are plans by the Government to connect all schools with Science Resource Centers to the Internet as part of the nation-wide school Internet connectivity initiative.
Percent of Schools with Science Resource Centers 46%Percent of Schools without Science Resource Centers 52%
Source: INIIT, The Ghana Scan-ICT Study, 2002, © 2002, International Institute for Information Technology (INIIT)
Schools with Web Presence
140
About 71% of the schools reported not having a Website on the Internet with about 19% reporting having a Web presence.
Percent of Schools with Web site/Home Page 19%Percent of Schools without Web site/Home Page 71%
Source: INIIT, The Ghana Scan-ICT Study, 2002, © 2002, International Institute for Information Technology (INIIT)
0%10%
20%30%40%50%60%70%80%
Yes No
Web Presence
Yes
No
Yes
No
0%
20%
40%
60%
80%
100%
Intenet Connectivity Web Site/Presence
Comparing Internet Access and Web Presence in Schools
141

Users of the Internet in Schools
Of the schools with Internet connectivity, 29% reported that access is available to staff only with 14% having access to their students only. About 86% of the schools reported making the access available to both their students and staff.
Internet Access Available to… Percent of SchoolsStaff only 29%Students only 14%Staff and student 86%
Source: INIIT, The Ghana Scan-ICT Study, 2002, © 2002, International Institute for Information Technology (INIIT)
Duration of Internet Access by Schools
The vast majority of the Ghanaian schools with access to the Internet had connectivity for less than a year. About 43% of the schools reported having access for less than a year, with 29% reporting having access for 1 to 2 years. About 14% indicated having connectivity to the Internet in the last 2 to 3 years. None of the schools surveyed have access for more than 4 years.
About 14% of the schools reported having Internet access in the past, but not any more; in other words their connectivity was terminated for one reason or another.
Duration of Internet Access Percent of Schoolsless than a year, 43%1- 2 years, 29%2- 3 years, 14%3-4 years 0%4-5 years 0%more than 5 years 0%Percent of schools who use to have access to the Internet but no more
14%
Source: INIIT, The Ghana Scan-ICT Study, 2002, © 2002, International Institute for Information Technology (INIIT)
142
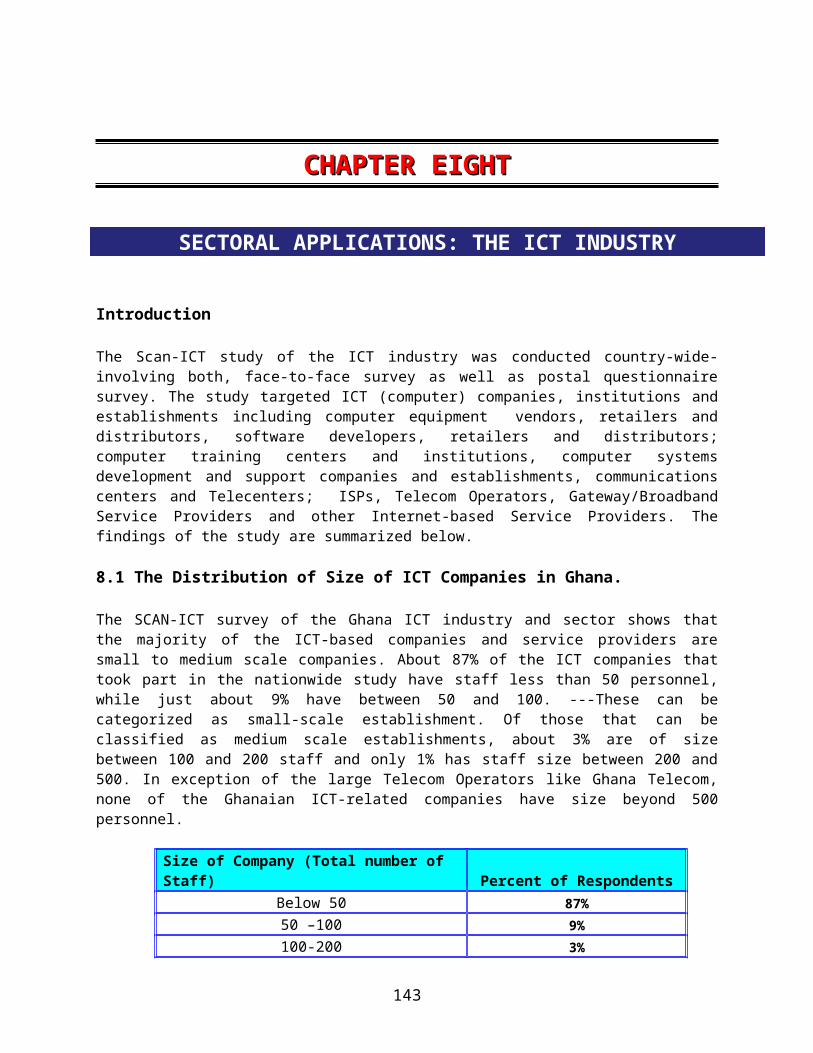
0%
10%
20%
30%
40%
50%
less thana year,
1- 2 years, 2- 3 years, 3-4 years 4-5 years more than5 years
Duration of Access to the Internet (To-Date)
Paying for Internet Access
Of the schools with access to the Internet, only 14% indicated having free access, in other words the schools does not pay for the service from its own resources. As high as 43% of the schools indicated paying for their Internet connectivity and usage from their own resources, with another 43% reporting paying for some of the cost.
Free Access Pay all Cost Pay Some Cost
Paying for Cost of Internet Access in Ghanaian Schools
143
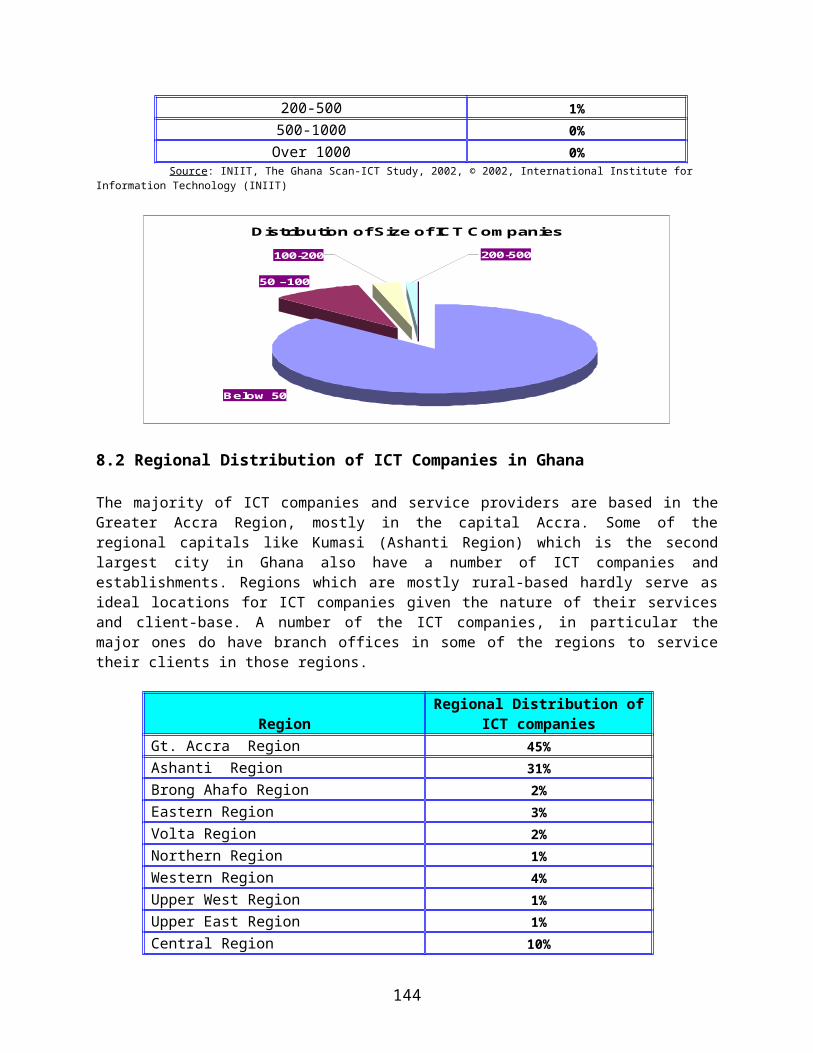
CHAPTER ELEVENCHAPTER ELEVEN
SECTORAL APPLICATIONS: THE EDUCATIONAL SECTOR
THE DEPLOYMENT AND EXPLOITATION OF ICTs IN THE UNIVERSITIES AND COLLEGES
Introduction
The Scan-ICT Study surveyed the level of ICT deployment and exploitation in the Higher Institutions of Education including the Universities, Colleges and Polytechnics. The study involved a face-to-face data collection exercise targeting all the teaching and research departments and units as well as the, administrative and support departments, divisions and units of these institutions. The analysis of the study results involves a comparative analysis that compared the results relating to all the departments of the universities and colleges with those obtained for the engineering, computing, computer science departments and other computer related units within the universities colleges and the polytechnics. The premise is that latter types of departments are relevant to the development of the Ghana information society and economy and as such need to be separately examined in some detail.
11.1 Types of Departmental Activities
The Scan-ICT survey identified three broad areas of activities forming the core functions of the of departments and units of the higher level institutions; these include: teaching, research, support services and other general activities. Of the departments surveyed, 41% indicated being involved in teaching, 37% in research and 18% in support services. Concentrating on the Engineering, Computing and Computer Science (Eng & CS) departments, the corresponding figures are: 90%, 71% and 29% respectively.
Type of ActivitiesAll Departments and
Faculties(ALL)
Engineering, Computing and Computer Science Departments
(Eng. & CS)Teaching 41% 90%Research 37% 71%Support Services 18% 39%Others 4% 6%
Source: INIIT, The Ghana Scan-ICT Study, 2002, © 2002, International Institute for Information Technology (INIIT)
144
0%
20%
40%
60%
80%
100%
All Departments Eng & CS
Types of Departmental Activities
Teaching Research Support Services Others
11.2 Distribution of Total Number of Students within the Departments
Of the University and Polytechnic departments which participated in the study, 20% indicated that they have below 100 students, the corresponding figure for Eng & CS departments is 16% having below 100 students. About 18% of all departments reported having between 100 to 200 students while 15% indicated having between 200 and 300 students. The corresponding figures for the Engineering, Computing and Computer Science departments are: 20% (for 100-200 students) and 20% ( for 200-300 students).
Percent distribution of total number of students
All Departments and Faculties (ALL)
Engineering, Computing and Computer Science Depts
(Eng. & CS)Below 100 20% 16%100 - 200 18% 20%200 -300 15% 20%300 - 400 10% 8%400 - 500 8% 8%500 - 600 10% 8%600 - 700 1% 0%700 - 800 2% 4%800 - 900 1% 0%
900 - 1000 4% 0%1000 and above 12% 0%
Source: INIIT, The Ghana Scan-ICT Study, 2002, © 2002, International Institute for Information Technology (INIIT)
145
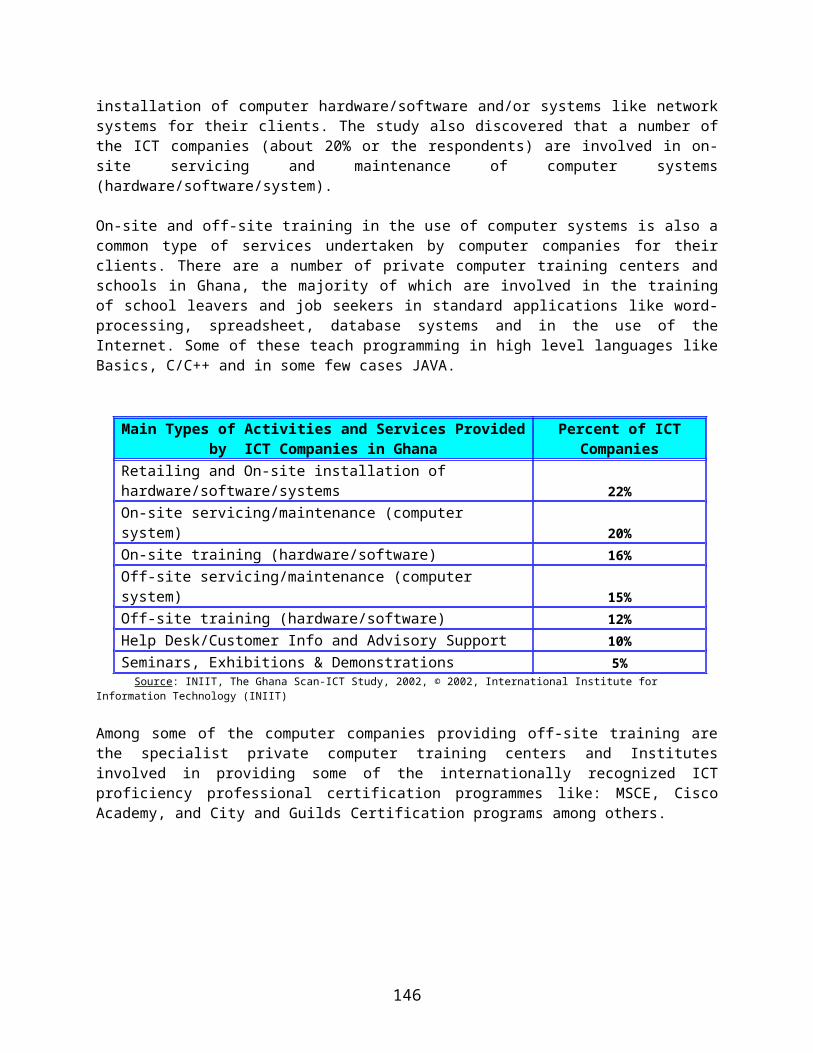
0%2%4%6%8%
10%12%14%16%18%20%
Below100
200 -300
400 -500
600 -700
800 -900
Distribution of Total Number of Students
All Departments Eng & CS
11.3 Distribution of Total Number of Students within the Departments
The average number of students per department for all departments that participated in the Scan-ICT study is estimated at 365, the corresponding figure for the Engineering, Computing and Computer Science departments is 429 students per department. The average number of lecturers for all departments is 10 per department with the equivalent figure of 8 per department for the Engineering, Computing and Computer Science departments. Based on these figures, the average student-lecture ratio is estimated at 37 students per lecturer (for all departments) and 54 students per lecturer (for Engineering, Computing and Computer Science departments)
All Departments and Faculties
(ALL)
Engineering, Computing and Computer Science
Depts (Eng. & CS)Average Number of Students per Dept 365 429Average Number of Lecturers per Dept. 10 8Average students to lecture ratio 37 54
Source: INIIT, The Ghana Scan-ICT Study, 2002, © 2002, International Institute for Information Technology (INIIT)
11.4 The Deployment of Computers in the Universities and Colleges
About 95% of all Departments indicated having computers with all the Engineering, Computing and Computer Science departments reported having computers. On the whole the average number of computers per department ( in the case of all departments and units within the universities and colleges) is estimated at 9. The corresponding figure for the Engineering, Computing and Computer Science departments is an average of 26 computers per department.
146
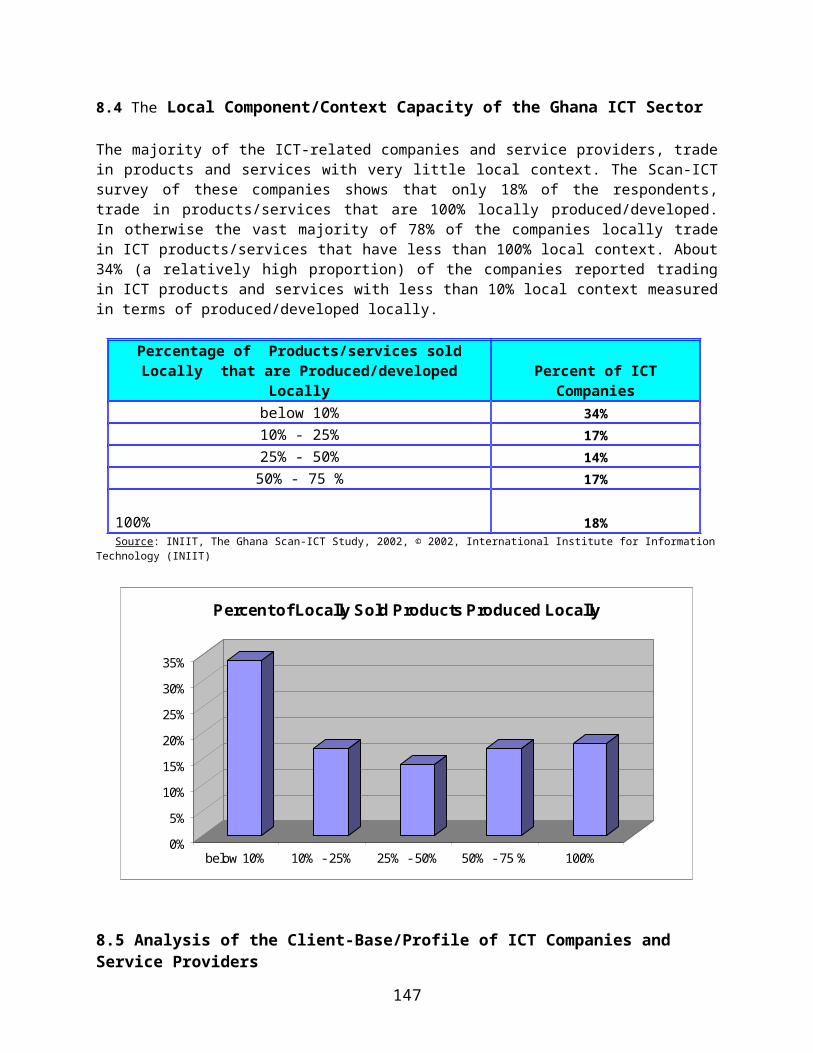
Percent distribution of departments with computers
All Departments and Faculties (ALL)
Engineering, Computing and Computer Science
Depts (Eng. & CS)Percent of Departments/Units/Centers with computers 95% 100%Percent of Departments/Units/Centers without computers 5% 0%Average No. of Computer per Department/Unit/Center 9 26
Source: INIIT, The Ghana Scan-ICT Study, 2002, © 2002, International Institute for Information Technology (INIIT)
Relating to the percentage of lecturers who are computer literate within each of the Departments, about 95% of Departments reported having computer literate lecturers. The corresponding figure for Engineering, Computing and Computer Science departments is 81%. The average number of computer lecturers per department (for all departments) is estimated at 8 with a corresponding figure of 7 for Engineering, Computing and Computer Science departments.
All Departments and Faculties
(ALL)
Engineering, Computing and
Computer Science Depts (Eng. & CS)
Percent of Departments with Computer Literate Lecturers 97% 81%Percent of Departments without Computer Literate Lecturers 3% 19%Average number of computer literate lecturers per Dept. 8 7
Source: INIIT, The Ghana Scan-ICT Study, 2002, © 2002, International Institute for Information Technology (INIIT)
11.5 The Exploitation of ICTs in the Universities and Colleges
The Scan-ICT survey relating to the exploitation of ICTs in the Universities and Colleges, shows that of all the University and College Departments surveyed, 35% indicated using computers to support their administrative work; 22% for supporting teaching; 22% for supporting research work of staff and students and 12% for accessing the Internet. The corresponding figures for Engineering, Computing and Computer Science departments are: 81% (for supporting administrative work); 81% (to support teaching); 65% (for supporting research work of staff and students); and 23% for Internet access.
147
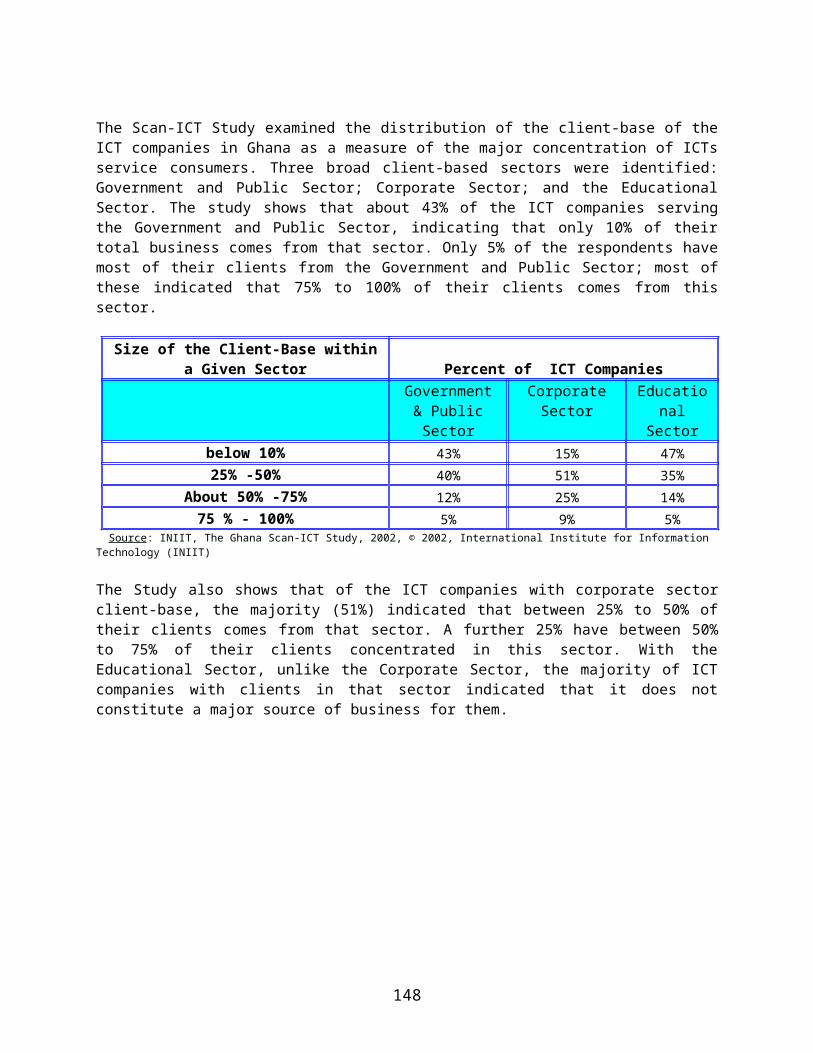
Percent distribution of what Departments use computers for
All Departments and Faculties
(ALL)
Engineering, Computing and Computer Science
Depts (Eng. & CS)Support admin work 35% 81%Support teaching 22% 81%Support research work of only staff 7% 13%Support research work of only students 3% 3%Support research work of staff and students 22% 65%Access the Internet 12% 23%
Source: INIIT, The Ghana Scan-ICT Study, 2002, © 2002, International Institute for Information Technology (INIIT)
Uses of Computers
0%10%20%30%40%50%60%70%80%90%
100%
Supportadminwork
Supportteaching
Researchwork of
only staff
Researchwork of
only students
Researchwork ofstaff andstudents
Accessthe
Internet
All Departments Eng & CS
In relation to other types of ICTs exploitation to support administrative work within the departments, the Scan-ICT survey of the departments and units in the country’s universities and colleges reveals that only 26% of them uses Educational and Management Information System (EMIS). The corresponding figure for the Engineering, Computing and Computer Science departments is about 39%.
All Departments and Faculties (ALL)
Engineering, Computing and Computer Science
Depts (Eng. & CS)Percent of Depts/Units who use EMIS 26% 39%Percent of Depts/Units who do not use EMIS 62% 53%
Source: INIIT, The Ghana Scan-ICT Study, 2002, © 2002, International Institute for Information Technology (INIIT)
148
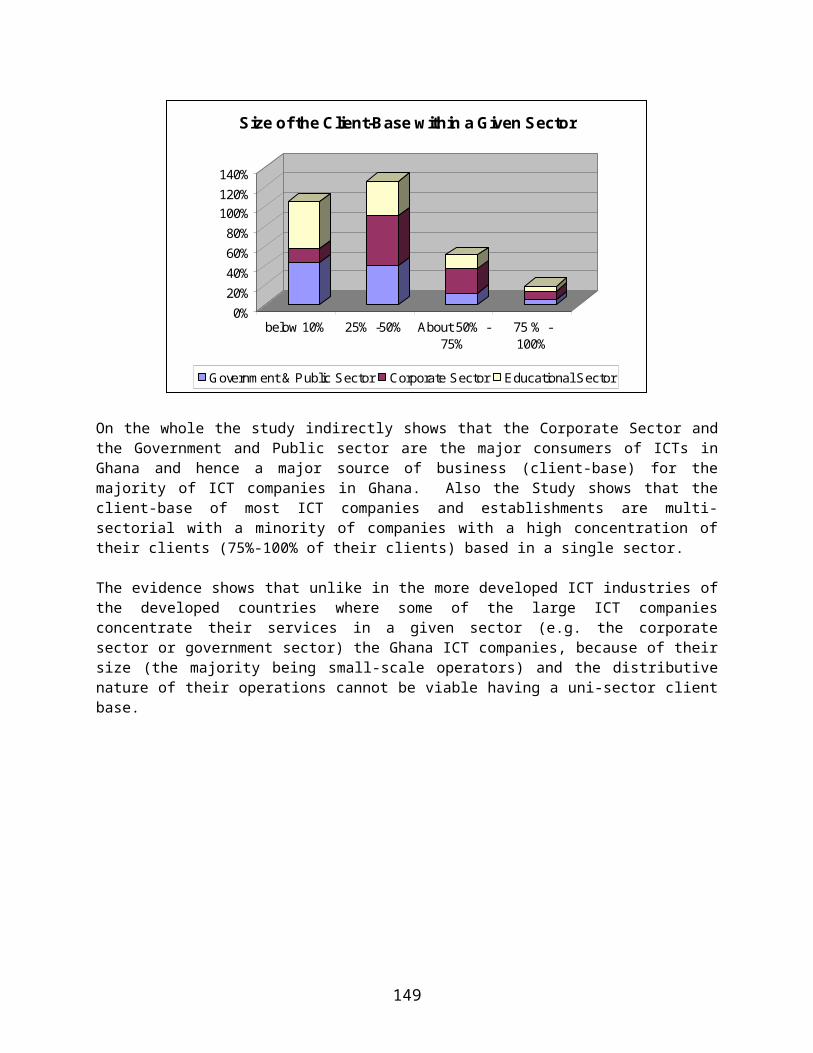
11.6 Computer Education and Training in the Universities and Colleges
About 52% of the departments within the Universities and Colleges reported making computing and/or computer studies an integral part of their diploma and degree programmes. The corresponding figure for the Engineering, Computing and Computer Science departments is much higher, about 84% indicated making computing/computer studies mandatory for all their programmes.
All Departments and Faculties
(ALL)
Engineering, Computing and
Computer Science Depts (Eng. & CS)
Percent of Departments with basic computing and/or computer studies as part of degree/diploma programmes 52% 84%Percent of Departments without basic computing and/or computer studies as part of degree/diploma programmes 48% 16%
Source: INIIT, The Ghana Scan-ICT Study, 2002, © 2002, International Institute for Information Technology (INIIT)
0% 20% 40% 60% 80% 100%
All Departments
Eng & CS
Computer Education and Training in the Universities and Colleges
NoYes
On the question of the degree to which the university and college departments are involved in electronic distance education (EDE) to compliment and supplement campus-based education in their respective departments, only 3% of the departments indicated involvement in EDE. None of the Engineering, Computing and Computer Science departments surveyed as part of the Scan-ICT study are involved in any form of electronic distance education.
149
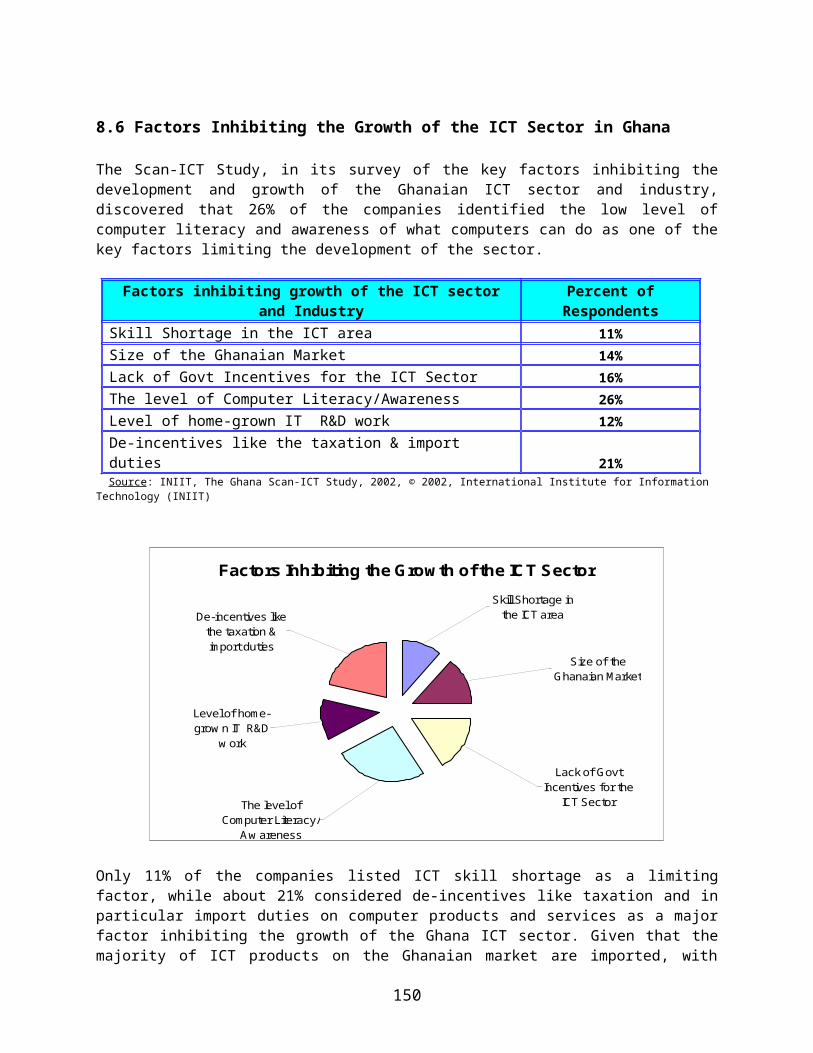
All Departments and Faculties (ALL)
Engineering, Computing and Computer Science
Depts (Eng. & CS)Percent of Depts/Units involve in EDE 3% 0%Percent of Depts/Units not involve in EDE 84% 97%
Source: INIIT, The Ghana Scan-ICT Study, 2002, © 2002, International Institute for Information Technology (INIIT)
0%
20%
40%
60%
80%
100%
All Departments Eng & CS
Implementation of EDE
Yes
No
11.7 The Use of Computers to Support Teaching, Research and Learning
The majority of the University and College departments who took part in the Scan-ICT survey indicated that some percentage of their staff use computers for teaching, research, administrative work, and/or access to the Internet. Of those surveyed, about 24% indicated that below 10% of their staff use computers, with 14% reporting that about a quarter of their staff use computers to support their work. About 21% of the departments reported having almost all their staff using computers. The corresponding figures for the Engineering, Computing and Computer Science departments are: 6% reporting below 10% of their staff use computers; about 10% indicating that close to a quarter of their staff use computers to support their work, with about 42% indicating that almost all their staff use computers.
Percent distribution of staff who uses computers for teaching/
research/admin work, access to the Internet
All Departments and Faculties (ALL)
Engineering, Computing and
Computer Science Depts (Eng. & CS)
0% (none) 2% 0%below 10% 24% 6%About 25% 14% 10%About 50% 19% 13%About 75 % 21% 29%About 100% 21% 42%
Source: INIIT, The Ghana Scan-ICT Study, 2002, © 2002, International Institute for Information Technology (INIIT)
150

Percent Distribution of Staff who uses Computers
0%
20%
40%
60%
80%
100%
0% (none) below10%
About25%
About50%
About 75%
About 100%
All Departments Eng & CS
Relating to the percentage of students within each department who use computers for learning and/or access to the Internet, about 21% of the departments indicated that their students do not use computers; the corresponding figure for the Engineering, Computing and Computer Science departments is only 6% reporting that their students do not have access to computers to supporting their learning process or access to the Internet. Close to 30% of the departments reported have below 10% of their student population using computers while about 14% indicated that close to a quarter of their students do have access to computers to support learning and/or access to the Internet.
Of all the departments surveyed in the Universities and Colleges, only about 16% reported having close to 100% of their students with access to computers. In the case of the Engineering, Computing and Computer Science departments surveyed, about 16% indicated having less than 10% of their students with access to computers to support their learning process and/or access to the Internet; with a relatively high proportion (45%) reporting that about a quarter of their students have access to computers. Close to 23% of the Engineering, Computing and Computer Science departments reported that almost all their students have access to computers.
Percent distribution of students who uses the computers for learning and/or
access to the InternetAll Departments and
Faculties (ALL)
Engineering, Computing and
Computer Science Depts (Eng. & CS)
0% (none) 21% 6%below 10% 30% 16%About 25% 14% 45%About 50% 10% 10%About 75 % 8% 26%About 100% 16% 23%
Source: INIIT, The Ghana Scan-ICT Study, 2002, © 2002, International Institute for Information Technology (INIIT)
151
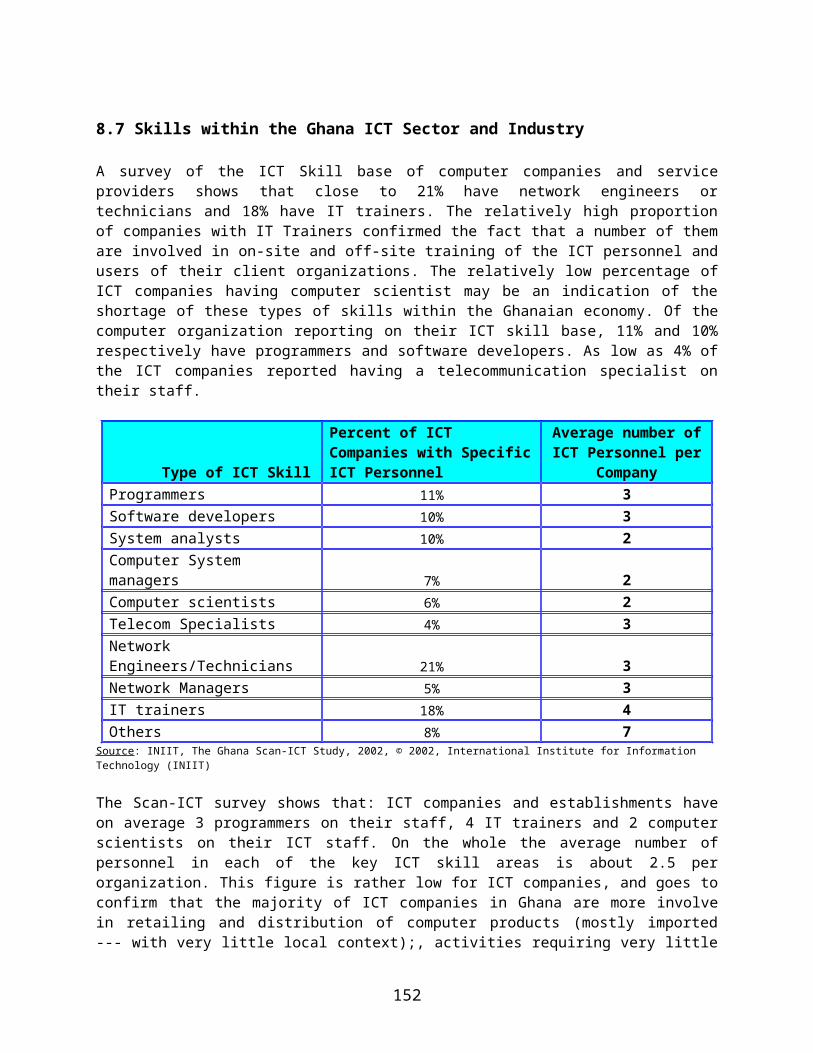
Percent Distribution of Students who uses the Computers
0%
20%
40%
60%
80%
100%
0% (none) below10%
About25%
About50%
About 75%
About 100%
All Departments Eng & CS
11.8 Home Ownership of Computers among the Staff of Universities and Colleges
A high percentage of university staff indicated having computers at home. Of all the University and College departments surveyed, close to 82% of the departments indicated having some percentage of their staff with computers at home. The corresponding figure for the Engineering, Computing and Computer Science departments is 74%.
All Departments and Faculties (ALL)
Engineering, Computing and Computer Science
Depts (Eng. & CS)Percent of Departments with Staff who owns computers at Home 82% 74%Percent of Departments without Staff who owns computers at Home 18% 26%
Source: INIIT, The Ghana Scan-ICT Study, 2002, © 2002, International Institute for Information Technology (INIIT)
Yes
No
Yes
No
0%
10%20%
30%
40%50%
60%
70%80%
90%
All Departments Eng & CS
Home Ownership of Computers among the Staff
152
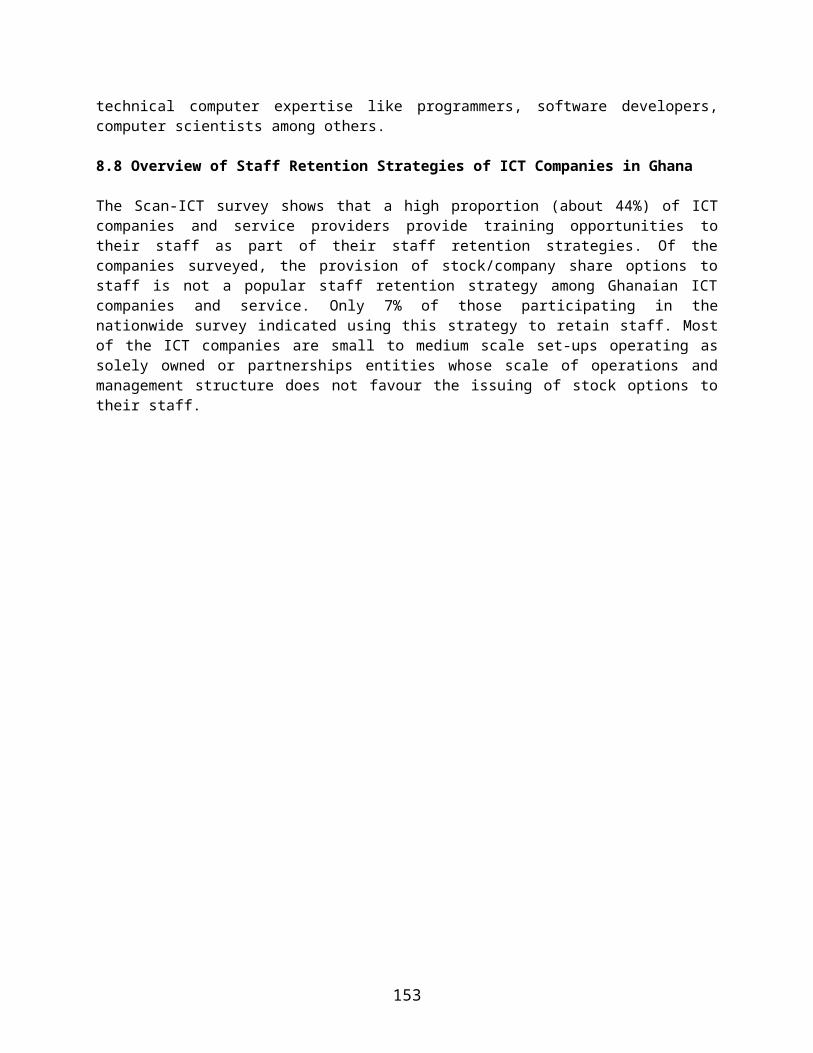
Relating to the actual percentage of staff in each department having computers at home, 36% of all the departments surveyed indicated that less than 10% of their staff have computers at home. The corresponding figure for the Engineering, Computing and Computer Science departments is 10%. Of all the departments involved in the Scan-ICT study, about 31% indicated that close to a quarter of their staff have computers at home, while about 20% indicated that close to half of their staff do have computers at home.
Only 5% of all the departments surveyed indicated that almost all their staff has computers at home. In relation to the Engineering, Computing and Computer Science departments, about 29% of them reported having close to a quarter of their staff with computers at home, while about 13% reporting having close to 50% of their staff with computers at home. Of the Engineering, Computing and Computer Science departments surveyed only about 6% indicated that almost all their staff have computers at home.
Percent distribution of staff with computers at home
All Departments and Faculties (ALL)
Engineering, Computing and Computer Science Depts
(Eng. & CS)below 10% 36% 10%About 25% 31% 29%About 50% 20% 13%About 75 % 8% 16%
About 100% 5% 6%Source: INIIT, The Ghana Scan-ICT Study, 2002, © 2002, International Institute for Information Technology (INIIT)
11.9 The Level of Internet Access and Usage with the Universities and Colleges
Close to about 42% of all the Department and Units within the Universities and Colleges surveyed as part of the Scan-ICT study have access to the Internet, the corresponding figure for the Engineering, Computing and Computer Science departments is slightly higher at 48%.
All Departments and Faculties
(ALL)
Engineering, Computing and Computer Science
Depts (Eng. & CS)Percent of Depts/Units with access to the Internet 42% 48%Percent of Depts/Units without access to the Internet 58% 52%
Source: INIIT, The Ghana Scan-ICT Study, 2002, © 2002, International Institute for Information Technology (INIIT)
153
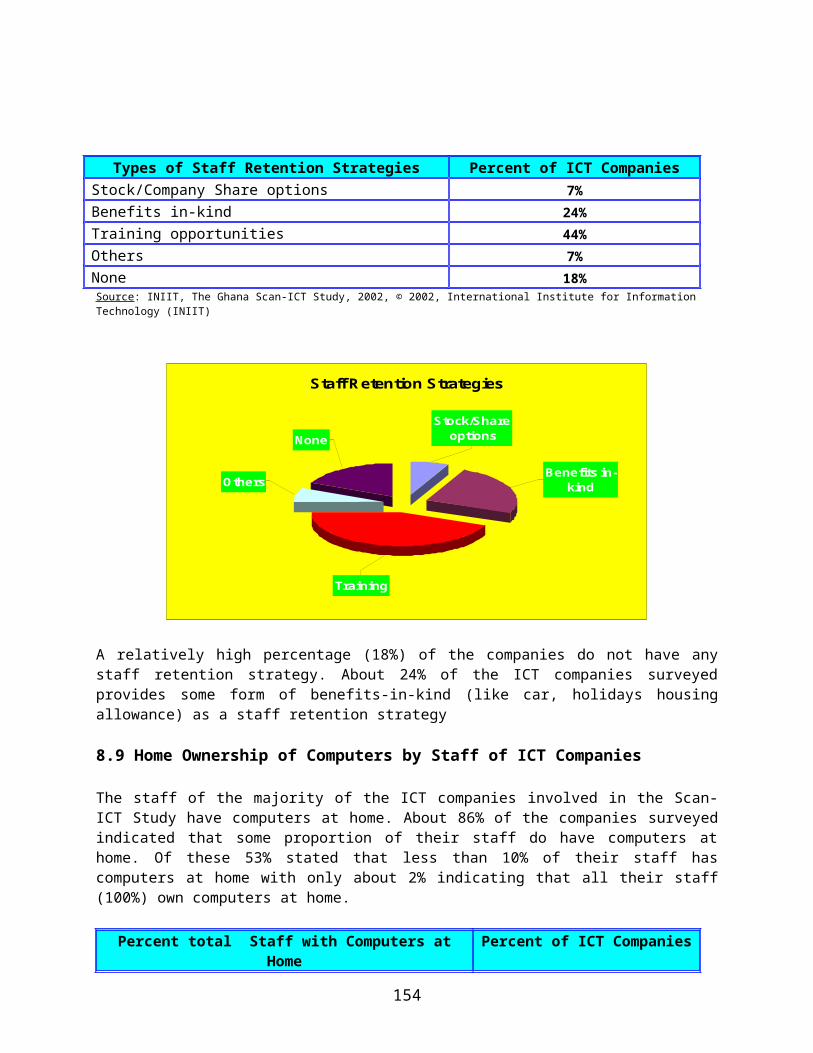
Yes
No
YesNo
0%
10%
20%
30%
40%
50%
60%
All Departments Eng & CS
Internet Access
Of those departments with access to the Internet, 41% indicated that access is available to only the academic and administrative staff, with none reporting access to students only. About 59% of those departments with Internet access reported making the access available to both their staff and students. The corresponding figures for those Engineering, Computing and Computer Science departments with Internet access shows that, 47% of them reported that: access is available to only their staff with 53% indicating that both staff and students of their departments have access to the Internet.
Users of the Internet All Departments and Faculties
(ALL)
Engineering, Computing and Computer Science Depts
(Eng. & CS)Academic & Admin Staff only 41% 47%Students only 0% 0%Staff and students 59% 53%
Source: INIIT, The Ghana Scan-ICT Study, 2002, © 2002, International Institute for Information Technology (INIIT)
0%
10%
20%
30%
40%
50%
60%
Academic &Admin Staff only
Students only Staff andstudents
Users of the Internet within the Departments
All Departments Eng & CS
154
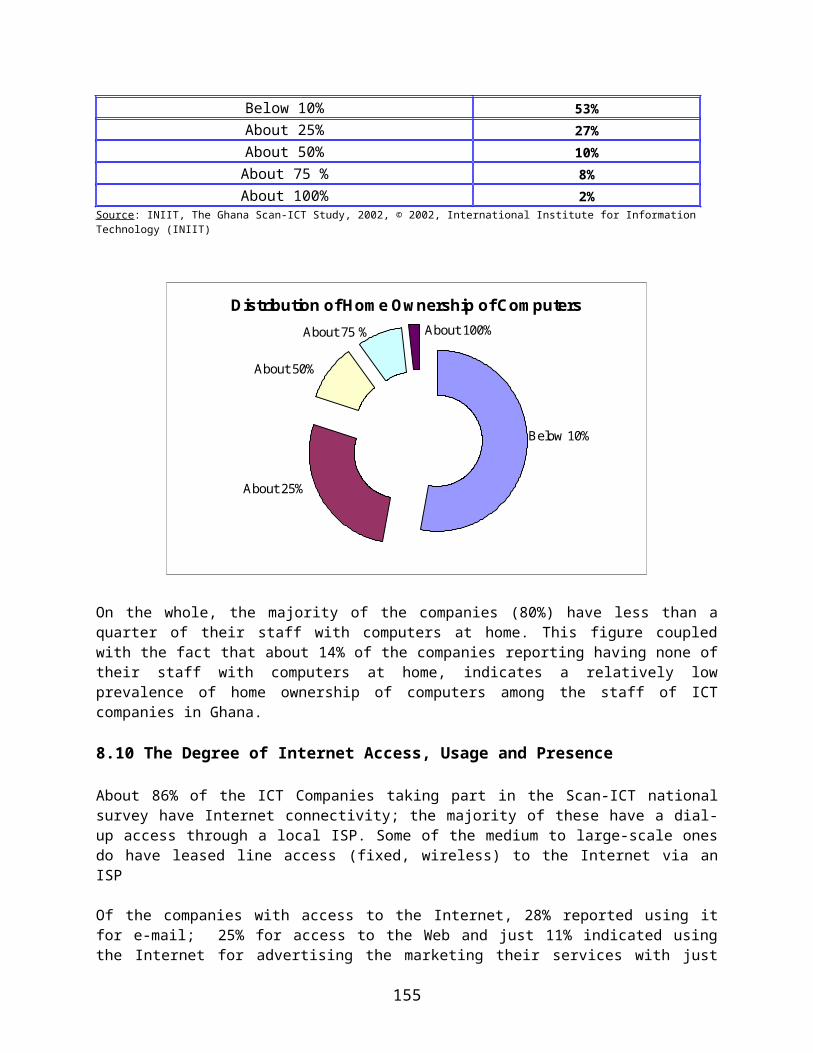
11.10 Duration of Internet Access within the Universities and Colleges
Most of the departments and units within the universities and colleges had access to Internet for less than 3 years. Of the departments and units surveyed during the Scan-ICT Study, about 42% had access for less than one year with 21% of them having access between 1 - 2 years, and 17% indicating that they had their Internet access between 2- 3 years. The corresponding figures for the Engineering, Computing and Computer Science departments are: 33% of them reported having access to the Internet for less than one year, 20% for between 1 - 2 years and 27% between 2 - 3 years.
Of all the university departments surveyed only 1% reported having access to the Internet for more than 5 years. The corresponding figure for the Engineering, Computing and Computer Science departments is slightly higher at 7%. The Scan-ICT survey also revealed that 9% of all the departments that participated in the survey used to have access to the Internet but no more have access for one reason or another.
Percent distribution of how long Depts/Units had access to the Internet
All Departments and Faculties
(ALL)
Engineering, Computing and Computer Science
Depts (Eng. & CS)less than a year, 42% 33%
1- 2 years, 21% 20%2- 3 years, 17% 27%3-4 years 4% 0%4-5 years 6% 13%
more than 5 years 1% 7%Percent of Depts/Units who use to have access to the Internet but no more
9% 0%
Source: INIIT, The Ghana Scan-ICT Study, 2002, © 2002, International Institute for Information Technology (INIIT)
0%5%
10%15%20%25%30%35%40%45%
lessthan ayear
1- 2years
2- 3years
3-4years
4-5years
morethan 5years
Percent Duration of Internet Access
All Departments Eng & CS
11.11 Usage of the Internet
In relation to what the Universities and Colleges use their Internet access for, about 38% of those departments with Internet access indicated using it for e-mail, with 33% indicating using the Internet for Web access and browsing with 29% reporting using it for downloading materials. The corresponding figures for the Engineering, Computing and Computer Science departments are: a high 93% reported
155
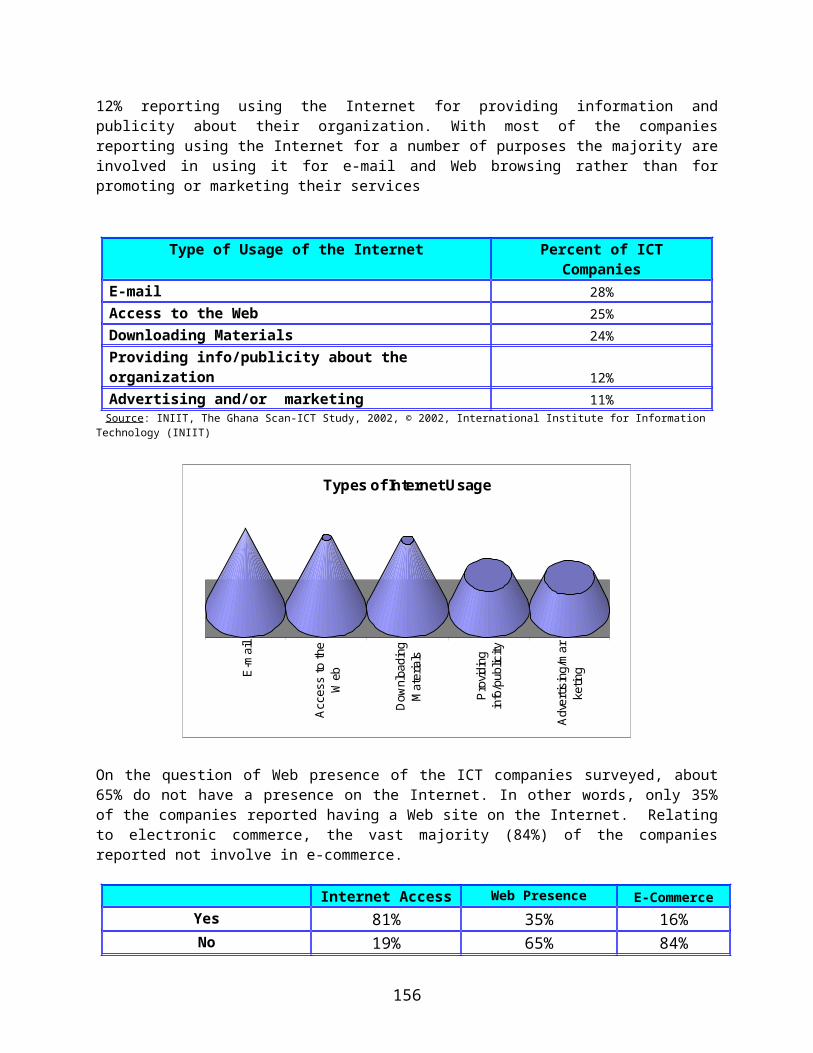
using their Internet access for e-mail, 87% indicating using it also for Web access and 80% for downloading materials.
Percent distribution of what Depts/Units use the Internet for:
All Departments and Faculties (ALL)
Engineering, Computing and Computer Science
Depts (Eng. & CS)E-mail 38% 93%Access to the Web 33% 87%Downloading materials 29% 80%
Source: INIIT, The Ghana Scan-ICT Study, 2002, © 2002, International Institute for Information Technology (INIIT)
0%
20%
40%
60%
80%
100%
E-mail Access to theWeb
Downloadingmaterials
What Depts/Units use the Internet for
All Departments Eng & CS
In relation to meeting the cost of Internet access; only 2% of the departments that participated in the Scan-ICT study, indicated that they have free access to the Internet. --- In other words, some other agency pay for the cost of access. The corresponding figure of Engineering, Computing and Computer Science departments who do not pay for their Internet access is as high as 33%. Of all the departments surveyed within the universities, a high 81% indicated that they meet the cost of their Internet access from their own resources, while 17% reported that they meet part of the cost. The corresponding figures for Engineering, Computing and Computer Science departments are: 60% meeting all cost and 7% meeting part of the cost.
All Departments and Faculties (ALL)
Engineering, Computing and
Computer Science Depts (Eng. & CS)
Percent of Departments/Units with free access to the Internet 2% 33%Percent of Departments/Units who pay for access to the Internet from own resources 81% 60%Percent of Departments/Units who pay for some of the cost of access to the Internet 17% 7%Source: INIIT, The Ghana Scan-ICT Study, 2002, © 2002, International Institute for Information Technology (INIIT)
156
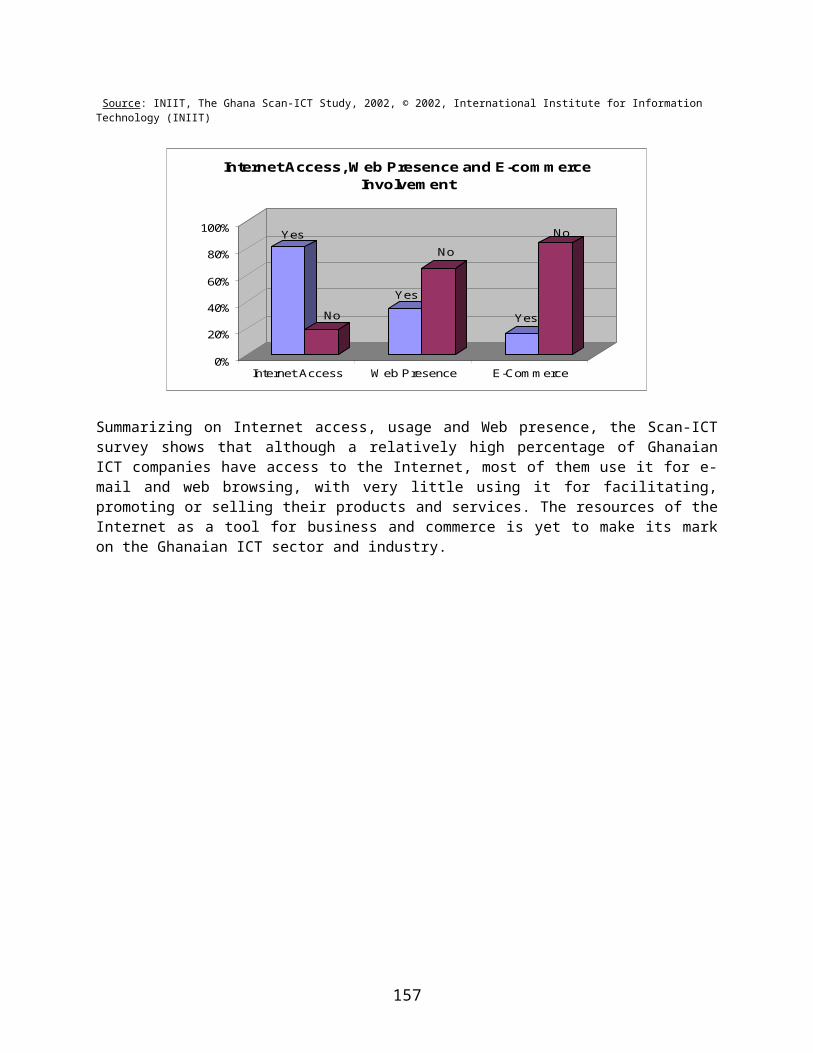
0%
20%
40%
60%
80%
100%
Free Access Pay for allAccess Cost
Pay part ofAccess Cost
Paying for Cost of Internet Access
All Departments Eng & CS
In relation to Web presence, only 24% of all the university and college departments surveyed have their own Web site. The corresponding figure for the Engineering, Computing and Computer Science departments is 26%. On the whole the majority of university departments and units do not have web presence.
All Departments and Faculties (ALL)
Engineering, Computing and Computer Science
Depts (Eng. & CS)Percent of Depts/Units with Web site 24% 26%Percent of Depts/Units without Web site 76% 74%
Source: INIIT, The Ghana Scan-ICT Study, 2002, © 2002, International Institute for Information Technology (INIIT)
0%10%20%30%40%50%60%70%80%
All Departments Eng & CS
Web Presence
Yes No
157
0%
10%
20%
30%
40%
50%
All Departments Eng & CS
Internet Access vrs. Web Presence
Web Presence Intenet Access
11.12 Expenditure on ICT Deployment and Exploitation in the Universities and Colleges
The Scan-ICT revealed that the majority of university and college departments spend less than a quarter of their total annual budgetary allocation of ICTs. About 37% of the departments and units indicated that they spend less than 10% on ICTs while 46% reported spending between 10% and 25% on their total annual budget on ICTs including expenditure of equipment and software procurement, training and system maintenance. The corresponding figures for the Engineering, Computing and Computer Science departments are: 26% spending less than 10% on ICT and 32% using between 10% and 25% of the annual budget on ICT-related expenditure.
Only 1% of the departments and units surveyed indicated devoting between 75% and 100% of their annual budget to ICT expenditure. The corresponding figure for Engineering, Computing and Computer Science departments is also only about 3%
Percentage of annual Departmental budget devoted to ICT-related
expenditure
All Departments and Faculties (ALL)
Engineering, Computing and Computer Science
Depts (Eng. & CS)0% 6% 0%
less than 10% 37% 26%10% -25% 46% 32%25% -50% 8% 13%50% - 75% 3% 6%75% - 100% 1% 3%
Source: INIIT, The Ghana Scan-ICT Study, 2002, © 2002, International Institute for Information Technology (INIIT)
158
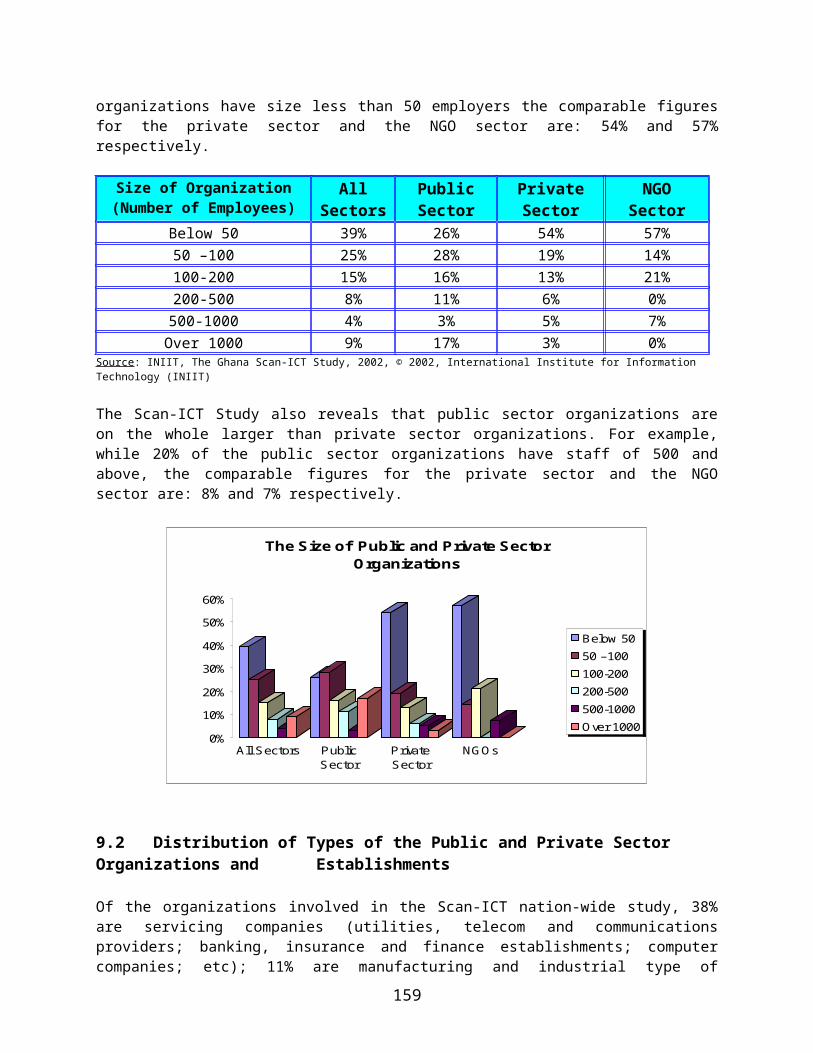
0%
10%
20%
30%
40%
50%
0% below10%
10% -25%
25% -50%
50% -75%
75% -100%
IT Expenditure
All Departments Eng & CS
159
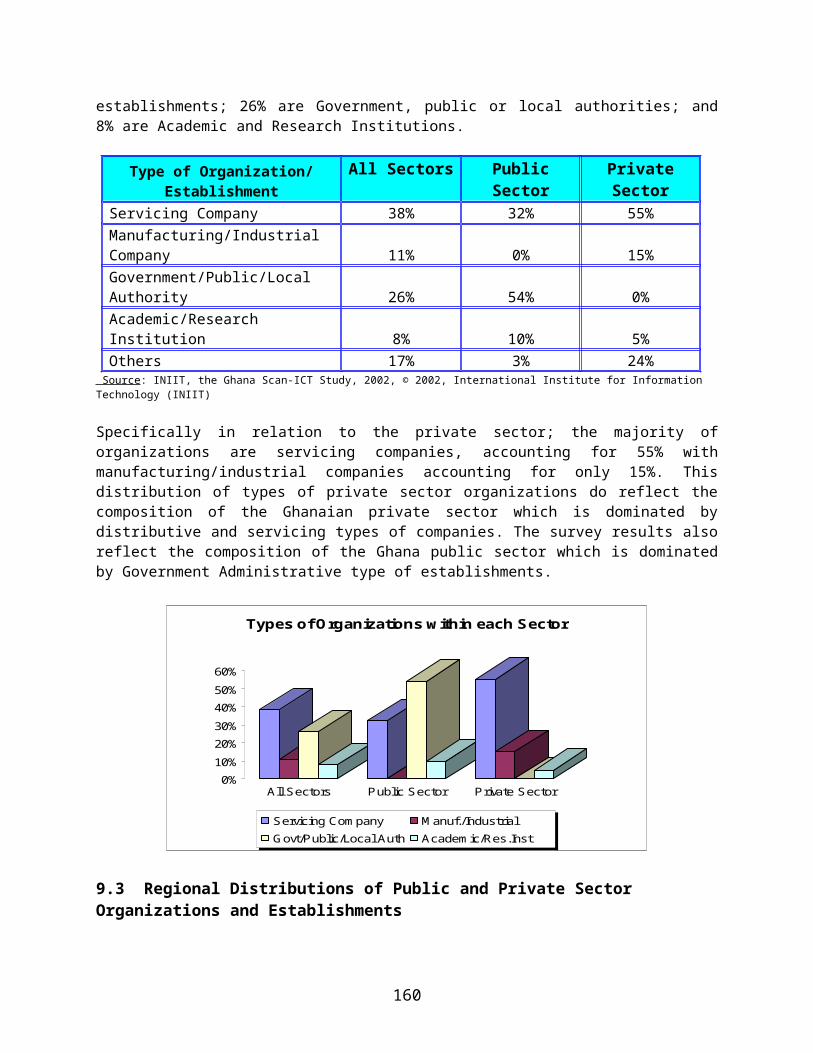
11.13 Human Resource Development: Average Intake on Undergraduate and Post Graduate Programmes in the Last Five Years
About 16% of all the departments that took part in the Scan-ICT study reported an annual intake on their undergraduate programmes in the last five years as below 25; with 27% taking between 25 and 50 annually and a further 17% taking between 50 and 75 annually. The corresponding figures for the Engineering, Computing and Computer Science departments are: about 28% taking below 25 students annually in the last five years; 24% taking between 25; and 50% annually and 16% taking between 50 and 75.
The Table below provides a breakdown relating to other categories of intake. For example close to 13% of all departments reported taking above 200 students annually in the last five years. On the whole, the average annual intake on undergraduate programmes in the universities and colleges is 112 with the corresponding figure for Engineering, Computing and Computer Science departments estimated at 105.
Percent distribution of annual (average) intake on undergraduate programmes in
the last five years
All Departments and Faculties
(ALL)
Engineering, Computing and
Computer Science Depts (Eng. & CS)
below 25 16% 28%25 to 50 27% 24%50 to 75 17% 16%75 to 100 16% 12%
100 to 150 6% 4%150 to 200 6% 0%
200 and above 13% 16%Annual (average) Departmental intake on undergraduate programmes in the last five years
112 105
Source: INIIT, The Ghana Scan-ICT Study, 2002, © 2002, International Institute for Information Technology (INIIT)
0%
5%
10%
15%
20%
25%
30%
below25
25 to50
50 to75
75 to100
100 to150
150 to200
200+
Annual (Avrg) Intake of Undegrads: Last 5 Yrs
All Departments Eng & CS
160
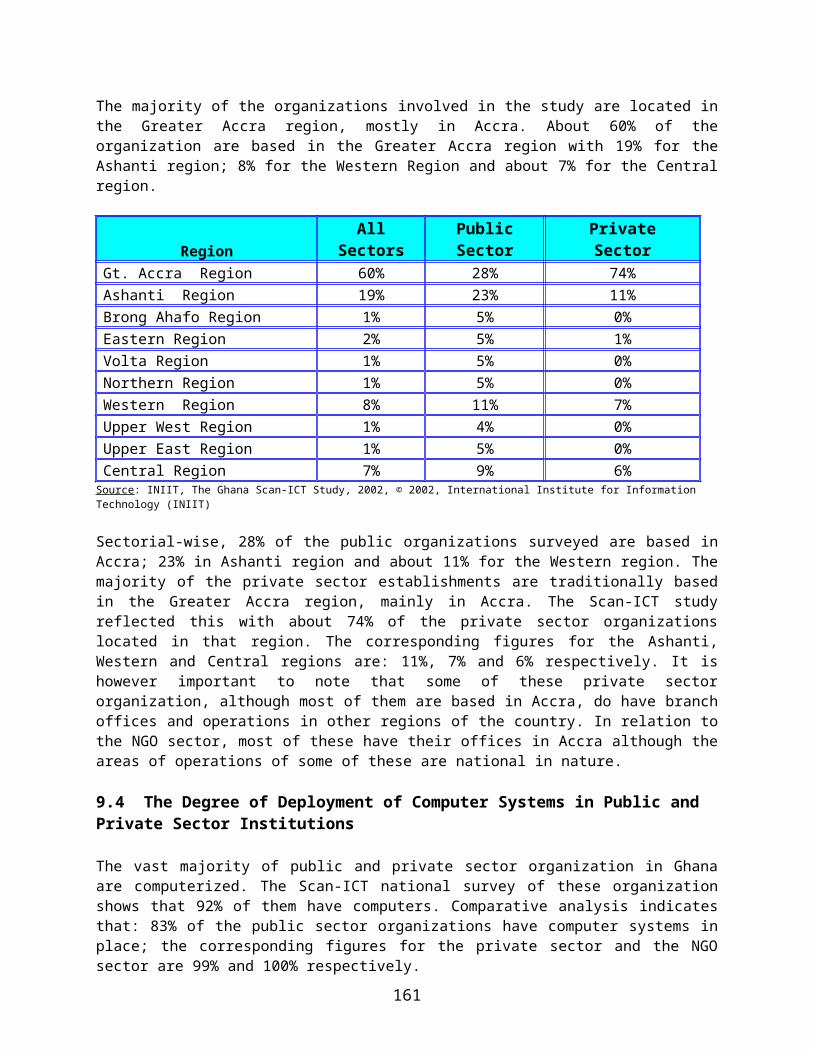
In relation to postgraduate intake in the last five years; the majority of department (close to 84%) indicated taking below 5 students per year. Only 7% indicated an annual intake of between 5 and 10 and another 7% having an annual intake of 10 to 15 students per year. Only 2% of the university departments reported an annual intake of above 15. Of the Engineering, Computing and Computer Science departments surveyed, as high as 75% of them indicated an annual intake of postgraduates of less than 5, with the remaining 25% taking between 5 and 10 postgraduates annually.
On the whole the average annual intake of postgraduate per department in the last five years is about 9 and the corresponding figure for Engineering, Computing and Computer Science departments is about 4 postgraduates per annum.
Percent distribution of annual (average) intake on postgraduate programmes in
the last five years
All Departments and Faculties (ALL)
Engineering, Computing and Computer Science
Depts (Eng. & CS)below 5 84% 75%5 to 10 7% 25%
10 to 15 7% 0%above 15 2% 0%
Annual (average) Departmental intake on postgraduate programmes in the last five years
9 4
Source: INIIT, The Ghana Scan-ICT Study, 2002, © 2002, International Institute for Information Technology (INIIT)
0%
20%
40%
60%
80%
100%
below 5 5 to 10 10 to 15
Annual (Avrg) Intake Postgrads: Last 5 Years
All Departments Eng & CS
11.14 Human Resource Development: Average Output on Undergraduate and Post Graduate Programmes in the Last Five Years
About 20% of the university and college departments reported graduating below 25 candidates per annum in the last five years, with 30% graduating between 25 and 50; and 14% between 50 and 75. The corresponding figures for the Engineering, Computing and Computer Science departments are: 38% graduating below 25 candidates, 38% between 25 and 50 and 10% between 50 and 75 candidates.
On the whole the average annual output of graduates for all departments in the last five years is 63 per department. The corresponding figure for the Engineering, Computing and Computer Science departments is 46 graduates per annum.
Percent distribution of annual (average) All Departments and Engineering, Computing
161
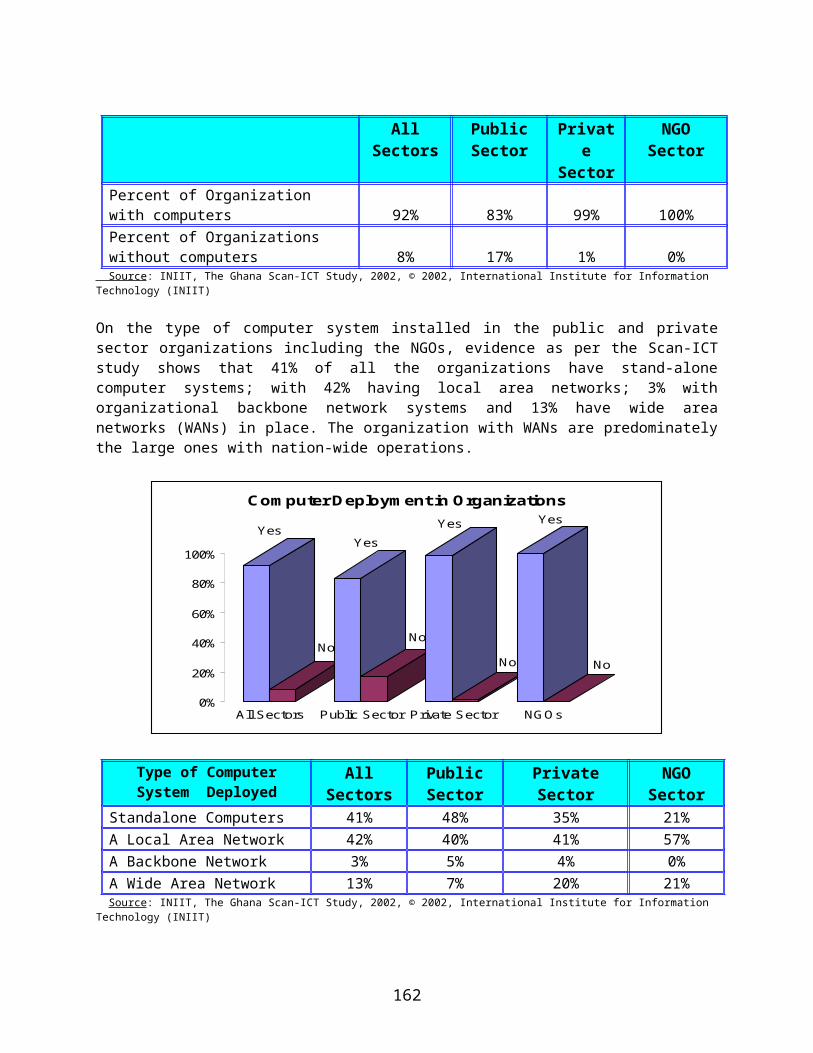
output of graduate in the last five years Faculties (ALL) and Computer Science Depts (Eng. & CS)
below 25 20% 38%25 to 50 30% 38%50 to 75 14% 10%75 to 100 14% 10%
100 to 150 8% 0%150 to 200 5% 5%
200 and above 9% 0%Annual (average) Departmental output of graduates in the last five years
63 46
Source: INIIT, The Ghana Scan-ICT Study, 2002, © 2002, International Institute for Information Technology (INIIT)
0%5%
10%15%20%25%30%35%40%
below25
25 to50
50 to75
75 to100
100 to150
150 to200
200+
Annual (Avg) Graduates Output: Last 5 Years
All Departments Eng & CS
Relating to postgraduates, the vast majority of departments (about 78%) reported graduating below 5 postgraduate per annum in the last five year. All the Engineering, Computing and Computer Science departments taking part in the survey indicate graduating below 5 postgraduates per annum. The average annual output of postgraduate for all departments was estimated at 8 per department in the last five years. The corresponding figure for the Engineering, Computing and Computer Science departments is about 3 postgraduates per department per annum in the last five years.
Percent distribution of annual (average) output of postgraduate in the last five
years
All Departments and Faculties (ALL)
Engineering, Computing and
Computer Science Depts (Eng. & CS)
below 5 78% 100%5 to 10 10% 0%
10 to 15 3% 0%above 15 10% 0%
Annual (average) Departmental output of postgraduates in the last five years
8 3
Source: INIIT, The Ghana Scan-ICT Study, 2002, © 2002, International Institute for Information Technology (INIIT)
162
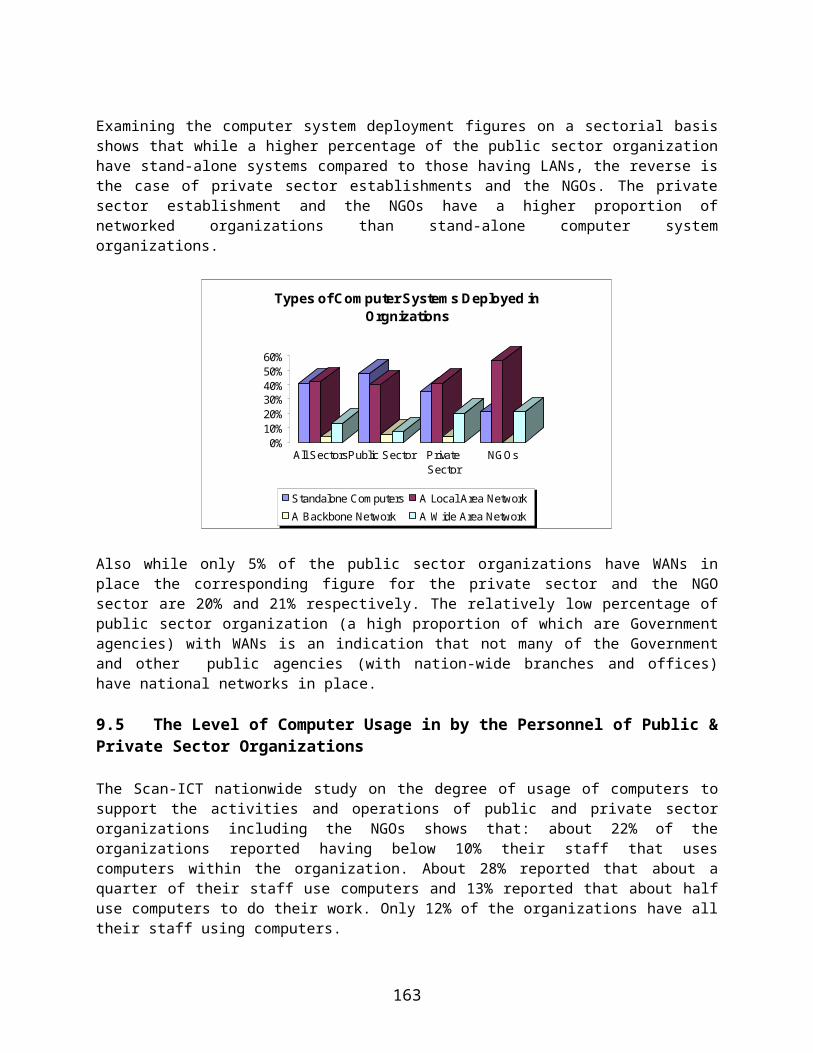
0%
20%
40%
60%
80%
100%
below 5 5 to 10 10 to 15
Annual (Avrg) Output of Postgrads: Last 5 Years
All Departments Eng & CS
11.15 Human Resource Development: Forecast of Intake on Undergraduate and Post Graduate Programmes in the Next Five Years
University and College departments participating in the Scan-ICT study were asked to forecast their intake on their respective undergraduate programmes in the next five years. The results shows that, 29% indicated a forecast figure between 30 and 50 undergraduates per annum in the next five years, with 44% forecasting between 50 and 100 candidates. The corresponding figures for the Engineering, Computing and Computer Science departments are: 40% forecasting between 30 and 50 intake per annum and 35% between 50 and 100 per annum.
The details of other forecast are presented in the Table below. On the whole the average annual forecast of intake per department in the next five years is 90; with the corresponding forecast for the Engineering, Computing and Computer Science departments set at about 74 candidates per annum.
Percent distribution of annual (average) forecast of intake on undergraduate
programmes in the next five years
All Departments and Faculties
(ALL)
Engineering, Computing and
Computer Science Depts (Eng. & CS)
30 -50 29% 40%50 -100 44% 35%100-150 15% 15%150-200 8% 10%
above 200 4% 0%Annual (average) intake on undergraduate programmes in the next five years
90 74
Source: INIIT, The Ghana Scan-ICT Study, 2002, © 2002, International Institute for Information Technology (INIIT)
163
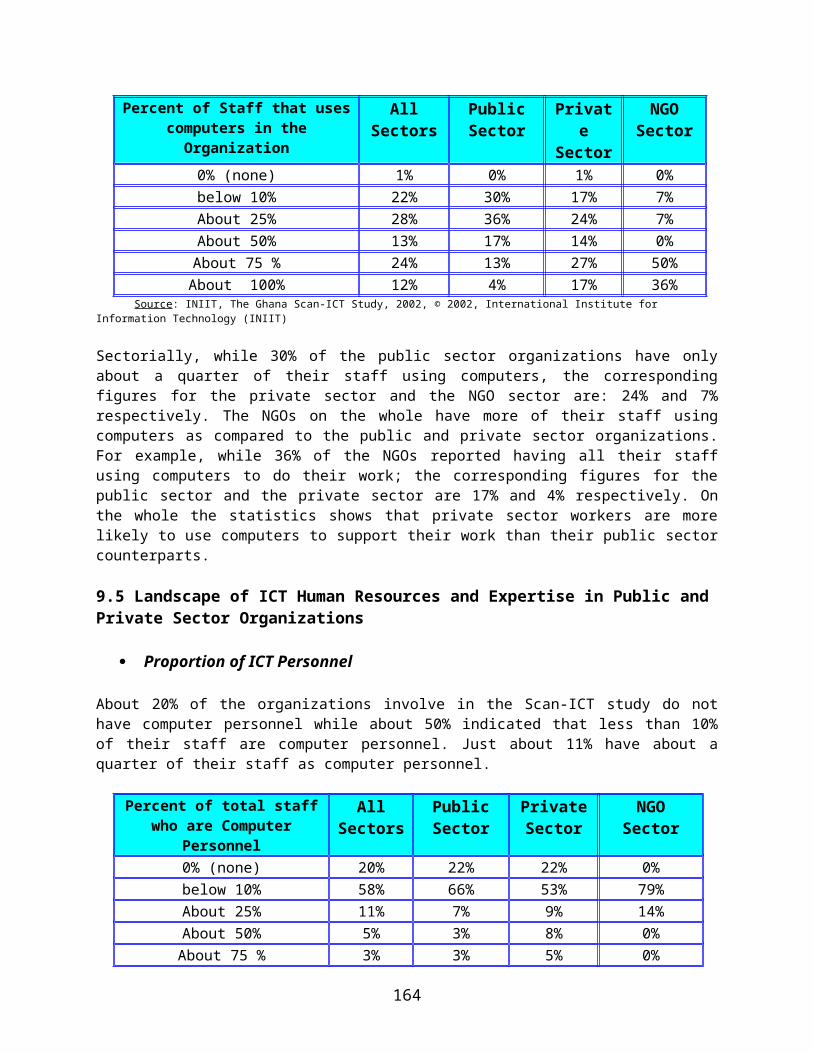
0%5%
10%15%20%25%30%35%40%45%
30 -50 50 -100 100-150 150-200 above 200
Annual (Avrg) Forcast Intake of Undegrads: Next 5 Yrs
All Departments Eng & CS
In relation to intake on postgraduate programmes in the next five years, a high 54% of the departments indicated that they will be taking less than 5 per annum, with 25% planning to take between 5 and 10 per annum. All the Engineering, Computing and Computer Science departments indicated that they will be taking less than 5 per annum in the next five years.
On the whole, the average annual forecasted intake per year in the next five year is about 13 candidates per department. The corresponding figure for the Engineering, Computing and Computer Science departments is about 4 per department per annum.
Percent distribution of annual (average) forecast of intake on postgraduate programmes in the next five years
All Departments and Faculties (ALL)
Engineering, Computing and
Computer Science Depts (Eng. & CS)
below 5 54% 100%5 to 10 25% 0%10 to 15 4% 0%above 15 17% 0%
Annual (average) forecast of Departmental intake on postgraduate programmes in the next five years
13 4
Source: INIIT, The Ghana Scan-ICT Study, 2002, © 2002, International Institute for Information Technology (INIIT)
164
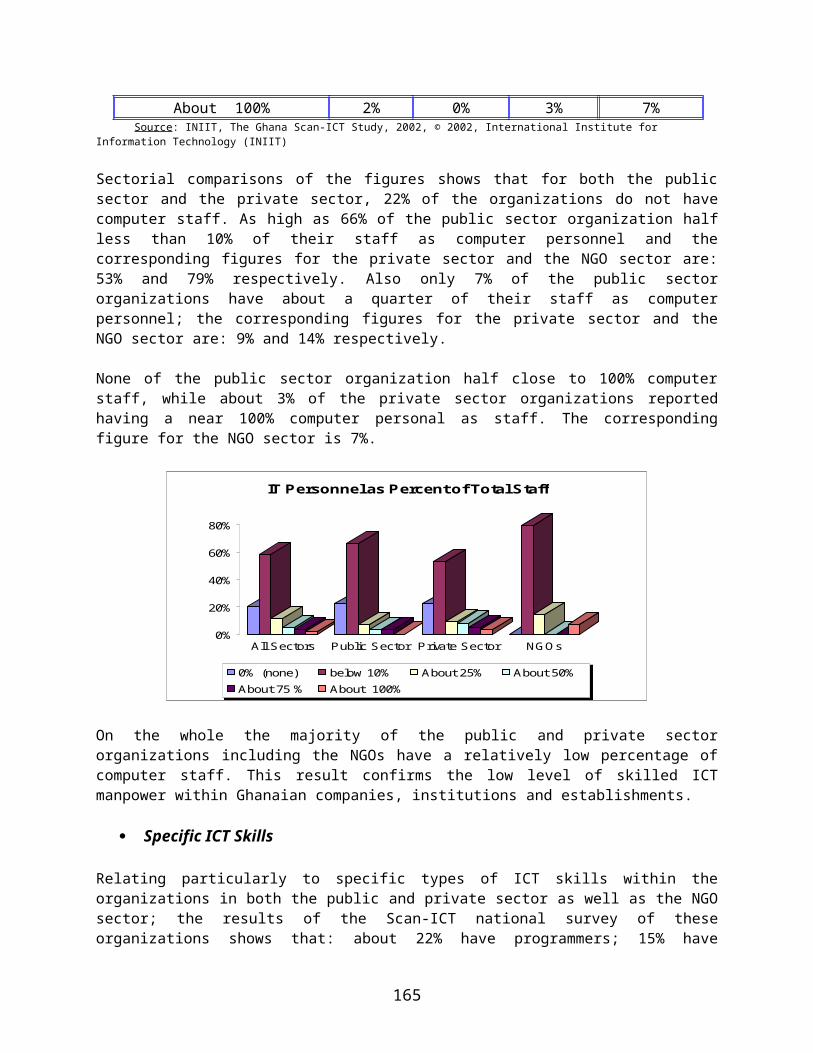
0%
20%
40%
60%
80%
100%
below 5 5 to 10 10 to 15 above 15
Annual (Avrg) Forcast Intake of Postgrads: Next 5 Years
All Departments Eng & CS
11.16 Human Resource Development: Forecast of Output on Undergraduate and Post Graduate Programmes in the Next Five Years
Of the departments surveyed in the universities and colleges, 32% planned to graduate between 30 and 50 candidates per annum in the next five years, while 53% forecasted between 50 and 100 per annum. The corresponding figures for the Engineering, Computing and Computer Science departments are: 42% forecasting between 30 and 50 graduates per annum and 47% between 50 and 100 per year for the next five years. The average annual forecast of graduates per department for the next five years is 88, with the corresponding figure of 67 per department as the forecast for the Engineering, Computing and Computer Science departments.
Percent distribution of annual (average) forecast output of graduate in the next five years
All Departments and Faculties (ALL)
Engineering, Computing and
Computer Science Depts (Eng. & CS)
30 -50 32% 42%50 -100 53% 47%100-150 2% 0%150-200 11% 11%
above 200 2% 0%Annual (average) forecast of Departmental output of graduates in the next five years
88 67
Source: INIIT, The Ghana Scan-ICT Study, 2002, © 2002, International Institute for Information Technology (INIIT)
165
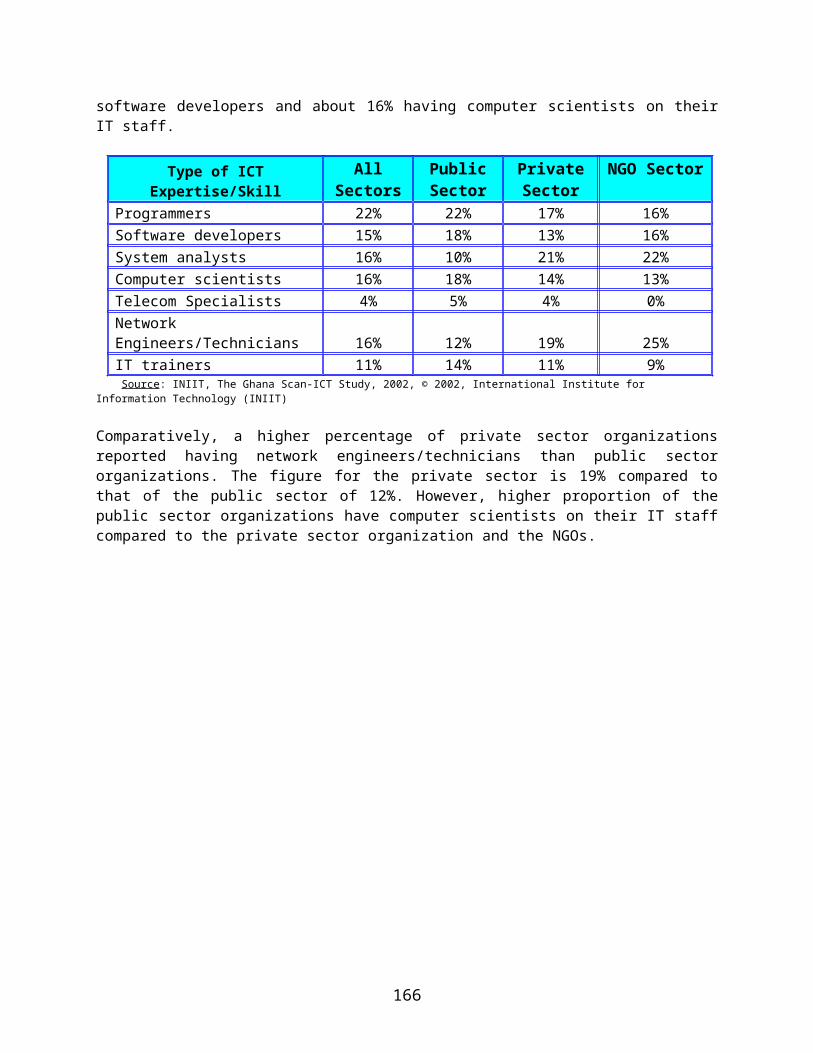
0%
10%
20%
30%
40%
50%
60%
30 -50 50 -100 100-150 150-200 above 200
Annual (Avrg) Forcast Output of Graduates: Next 5 Yrs
All Departments Eng & CS
In relation to forecast for postgraduate students in the next five years, about 48% of the departments indicated that they planned to graduate below 5 candidates per year, with 17% forecasting an annual output of postgraduates between 5 and 10.
Percent distribution of annual (average) forecast output of postgraduate in the next five years
All Departments and Faculties (ALL)
Engineering, Computing and
Computer Science Depts (Eng. & CS)
below 5 48% 100%5 to 10 17% 0%10 to 15 4% 0%above 15 30% 0%
Annual (average) forecast of Departmental output of postgraduates in the next five years
11 3
Source: INIIT, The Ghana Scan-ICT Study, 2002, © 2002, International Institute for Information Technology (INIIT)
0%
20%
40%
60%
80%
100%
below 5 5 to 10 10 to 15 above 15
Annual (Avrg) ForcastOutput of Postgrads: Next 5 Years
All Departments Eng & CS
166
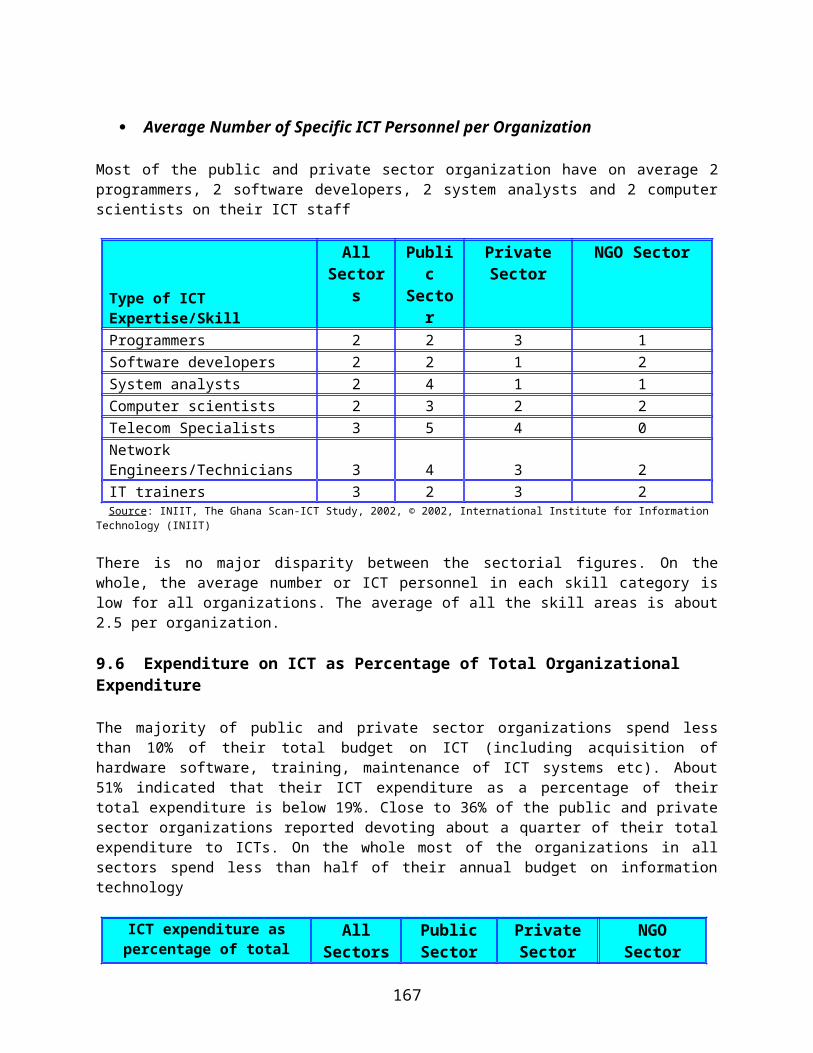
CHAPTER TWELVECHAPTER TWELVE
SECTORAL APPLICATIONS: THE HEALTH SECTOR
Introduction
The Scan-ICT nationwide face-to-face survey on the deployment and exploitation of ICTs in the Health Institutions was targeted at both Teaching and Non-Teaching Hospitals, as well as Clinics, Health Posts/Centers and Maternity Homes. In cases of the large Hospitals, the respondents were Departments or Units within the Hospital, while the Clinics, Health Post/Center and Maternity Homes which took part in the survey were considered as the responding entity as per the survey. Of those the institutions targeted, 44% were Departments or Units within Non-Teaching Hospitals, while 33% are of Teaching Hospitals. About 33% of the respondents are Clinics while the Health Post/Center accounted for 3% and the Maternity Homes also accounting for 3% of the respondents.
Type of Institution Percent of Health InstitutionsNon Teaching Hospital (Departments/Units) 44%Teaching Hospital (Departments/Units) 31%Clinics 21%Health Posts/Centers 3%Maternity Homes 3%Source: INIIT, The Ghana Scan-ICT Study, 2002, © 2002, International Institute for Information Technology (INIIT)
0%5%
10%15%20%25%30%35%40%45%
Non-Teach
Hospitals
TeachingHospitals
Clinics HealthCenters
MaternityHomes
Type of Health Institutions
Of the Health Institutions surveyed, 53% are public health establishments while 43% are private health institutions. About 4% reported as being other type of institutions
167
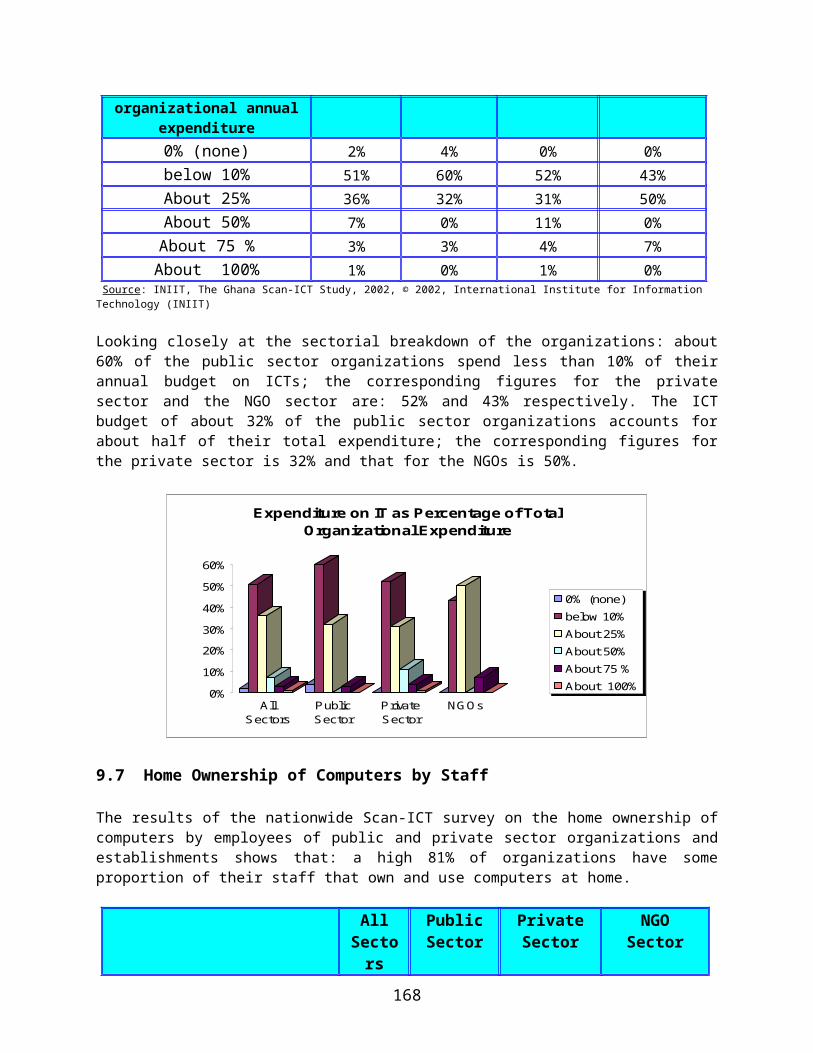
Type of Sector Percent of Health InstitutionsPrivate Sector 43%Public Sector 53%Others 4%Source: INIIT, The Ghana Scan-ICT Study, 2002, © 2002, International Institute for Information Technology (INIIT)
Sectorial Representation of Health Institutions
Others
Public Sector
Private Sector
Of the Health Institutions that took part in the study, as high as 73% of them are based in the city, with 22% located in towns and only 5% are village based health Institutions. The large hospitals are based in the cities while the institutions based in the towns and villages are mainly the clinics and the health centers.
Location Percent of Health InstitutionsLocated in City 73%Located in Town 22%Located in a Village 5%
Source: INIIT, The Ghana Scan-ICT Study, 2002, © 2002, International Institute for Information Technology (INIIT)
168
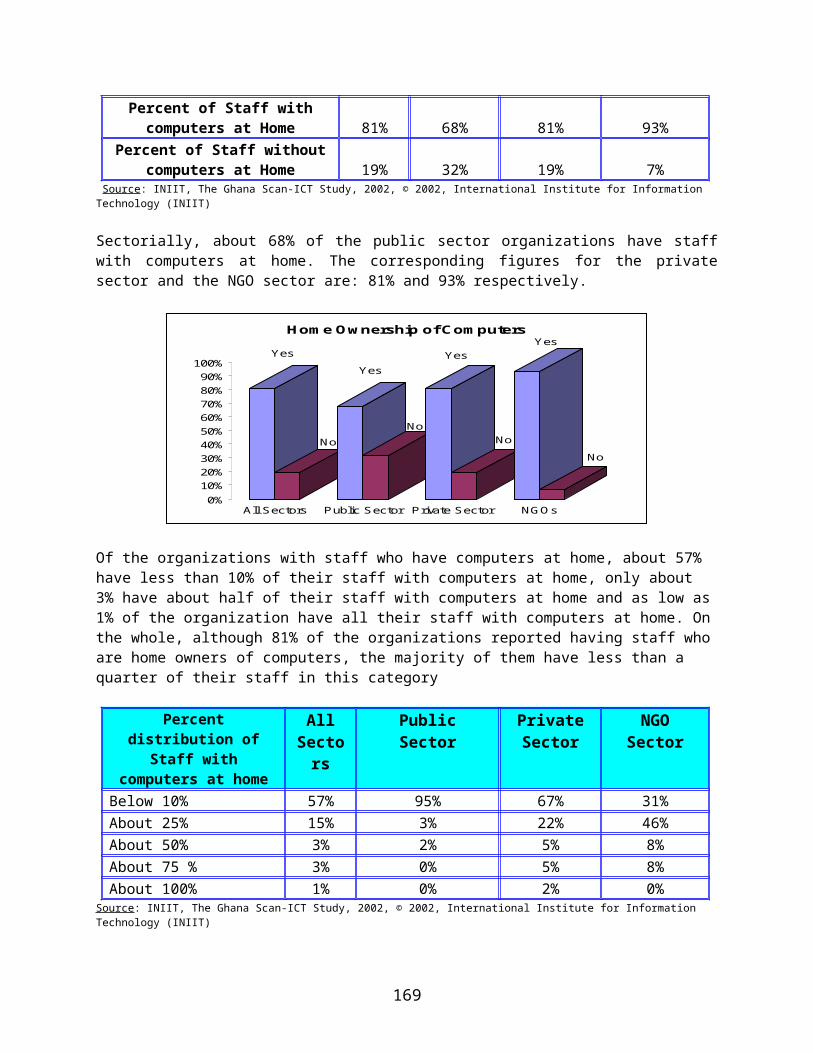
0%10%20%30%40%50%60%70%80%
Located in City Located inTown
Located in aVillage
Location of Health Institutions
12.1 Distribution of the Size of Health Institutions
A high proportion (about 48%) of the Health establishments and Units have staff below 50 personnel, while about 23% have between 50 and 100, with 15% having between 100 and 200 personnel. About 10% of the institutions reported having over 1000 personnel.
Size of Health Institutions (Number of Staff) Percent of Health InstitutionsBelow 50 48%50 –100 23%100-200 15%200-500 5%
500-1000 0%Over 1000 10%
Source: INIIT, The Ghana Scan-ICT Study, 2002, © 2002, International Institute for Information Technology (INIIT)
0% 10% 20% 30% 40% 50%
Below 50
50 –100
100-200
200-500
500-1000
Over 1000
Distribution of Size of Health Institutions
12.2 Ownership of Computers
169
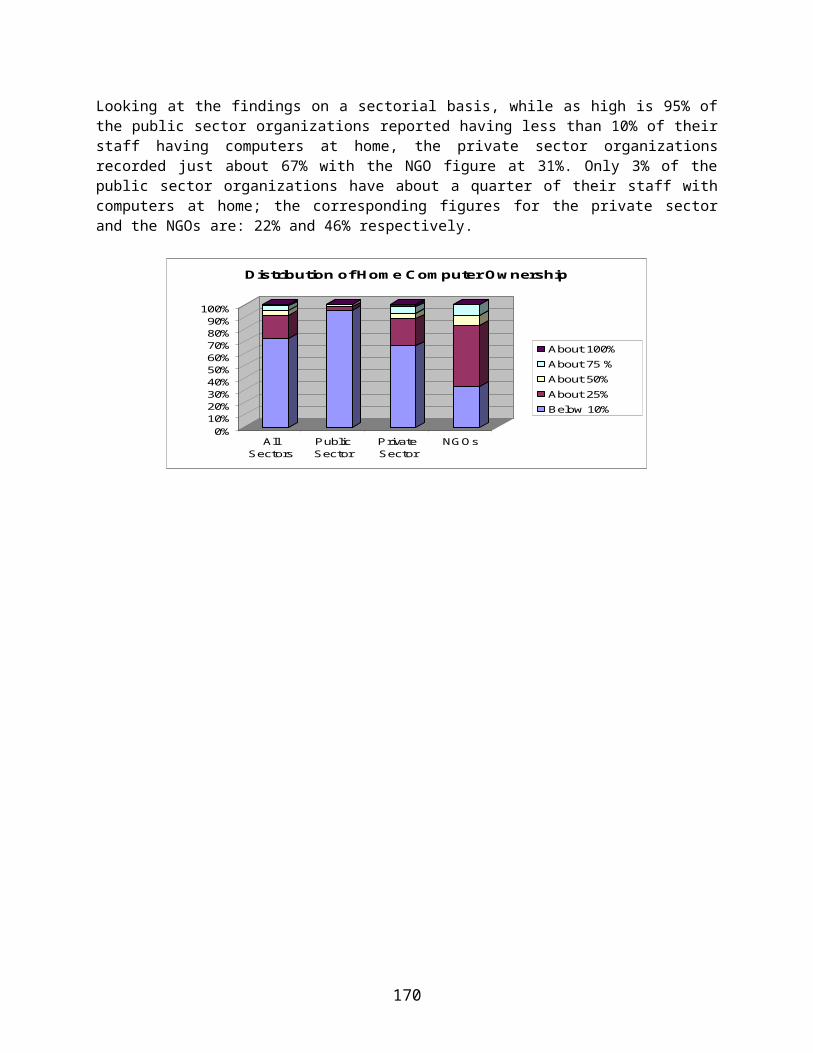
Of the Health Institutions surveyed, 62% indicated having computers which they use for supporting their administrative and other operational activities including using it for accessing the Internet (as is the case in some of the Institutions). About 38% reported not having computers
Percent of Health InstitutionsPercent of Health Institutions with computers 62%Percent of Health Institutions without computers 38%
Source: INIIT, The Ghana Scan-ICT Study, 2002, © 2002, International Institute for Information Technology (INIIT)
0%
10%
20%
30%
40%
50%
60%
70%
Yes No
Health Institutions with Computers
Of the Health Institutions having computers, the majority 79% indicated that their computer system is made up of stand-alone computers, with 19% reporting having a local area network (LAN) computer system. None of the Institution have a backbone network, while 2% reported having a wide area network (WAN) in place.
Type of Computer System Percent of Health InstitutionsStandalone Computers 79%A Local Area Network 19%A Backbone Network 0%A Wide Area Network 2%
Source: INIIT, The Ghana Scan-ICT Study, 2002, © 2002, International Institute for Information Technology (INIIT)
170
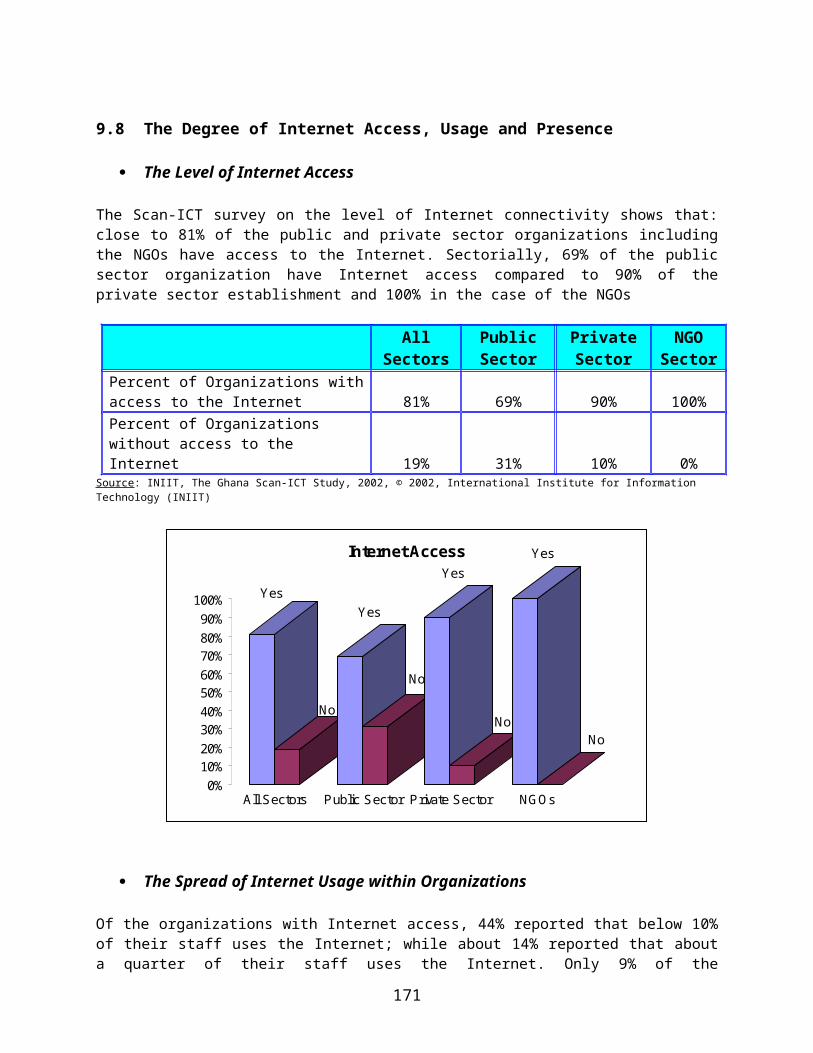
0% 20% 40% 60% 80%
StandaloneComputers
LAN
Backbone Network
WAN
Type of Computer System in Health Institutions
12.3 Types of Uses of Computers in the Health Institutions.
The Health Institutions with computers uses them for a variety of applications. A high proportion (42%) of the Health Institutions reported using their computer system to support general administrative work with 22% indicating using their computers to support health-related database and information system applications. About 17% indicated using computers to support medical research work, with 11% reporting using computers to support their health promotion and awareness campaign work. Only 2% of the Institutions reported implementing Telemedicine applications, with 6% reporting being involved in continuing medical education or distance education types of applications.
Use of ICTs in Health Institutions Percent of Health Institutions
Telemedicine Applications 2%Medical Research Work 17%Continuing Medical Education/Distance Education 6%Health promotion and awareness 11%Health-related Database and Info. Systems Applications 22%General Administration Work 42%
Source: INIIT, The Ghana Scan-ICT Study, 2002, © 2002, International Institute for Information Technology (INIIT)
171

0% 10% 20% 30% 40% 50%
Telemedicine
Med. Research Work
Cont Med. Educ/DE
Health Promotion
Database and Info. Sys
Admin Work
Type of Health-Related Uses of Computers
12.4 Staff Usage of Computers within Health Institutions
Of the Health Institutions involved in the Scan-ICT study, a high 53% reported having below 10% of their staff that use computers to support their work. Close to 29% indicated that about a quarter of their staff uses computers, while only 8% reported that about half of their staff use computers. Only 5% reporting having almost all their staff involved in using computers to support their functions within their Institutions.
Percent Distribution of Staff who use Computers Percent of Health Institutionsbelow 10% 53%About 25% 29%About 50% 8%About 75 % 5%
About 100% 5% Source: INIIT, The Ghana Scan-ICT Study, 2002, © 2002, International Institute for Information Technology (INIIT)
172
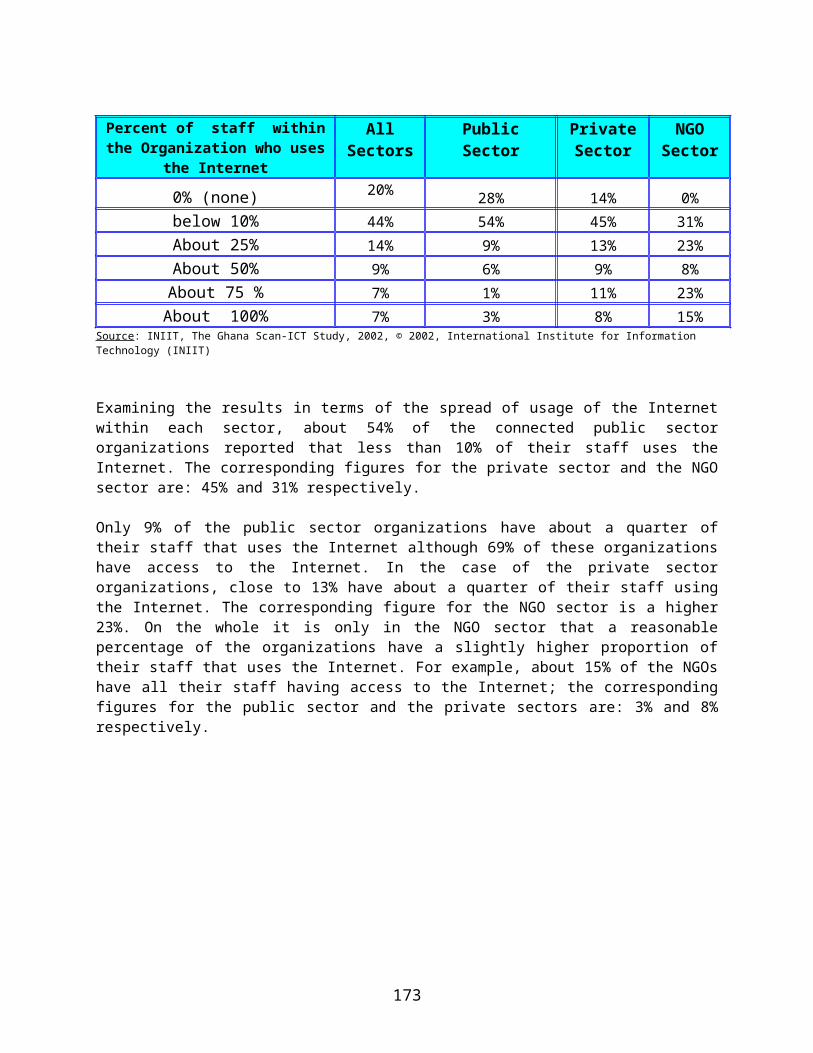
12.5 Computer Personnel within Health Institutions
The majority of Health Institutions, either have minimal or no computer personnel. About 47% of the Institutions reported not having any computer personnel, with 42% indicating having less than 10% of their staff are computer personnel. About 11% reported that a quarter of their staff are computer personnel.
Percent Distribution of Staff who are Computer Personnel Percent of Health Institutions
0% (none) 47%below 10% 42%About 25% 11%About 50% 0%About 75 % 0%
About 100% 0% Source: INIIT, The Ghana Scan-ICT Study, 2002, © 2002, International Institute for Information Technology (INIIT)
0% (none) below 10% About 25% About 50% About 75 % About 100%
Percent Distribution of Computer Personnel within Health Inst.
12.6 Level of IT Expenditure in Health Institutions
Expenditure on information technology resources including training and maintenance of IT equipment and system does not constitute a major component of the total expenditure of Health Institutions in Ghana. The Scan-ICT survey of these institutions revealed that, a high 58% of them spend less than 10% of their total annual budget allocations on IT while about 30% indicated spending close to a quarter of their total budget on ICTs. Only 6% reported having an IT budget which constitute close to half of their total expenditure.
173
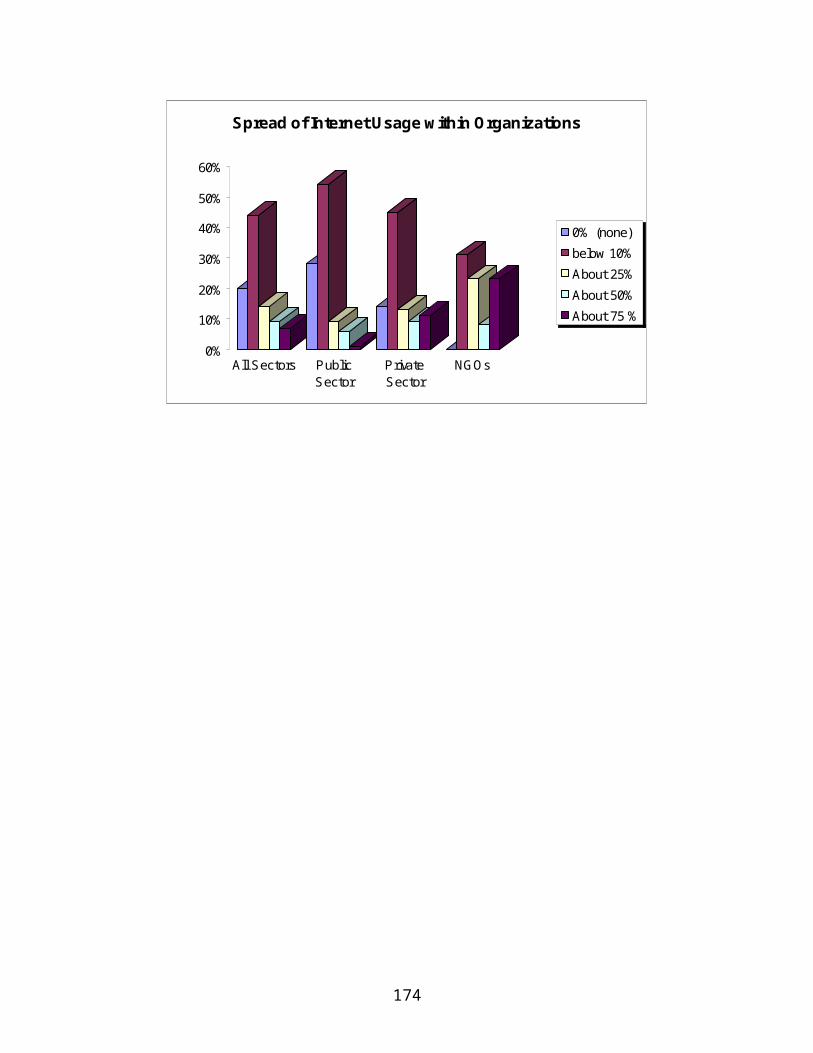
Percent of IT Expenditure as Proportion of Total Expenditure
Percent of Health Institutions
0% (none) 3%below 10% 58%About 25% 30%About 50% 6%About 75 % 3%About 100% 0%
Source: INIIT, The Ghana Scan-ICT Study, 2002, © 2002, International Institute for Information Technology (INIIT)
0%
10%
20%
30%
40%
50%
60%
0%(none)
below10%
About25%
About50%
About75 %
About 100%
Level of IT Expenditure in Health Institutions
12.7 Home Ownership of Computers
A high proportion (70%) of the Health Institutions participating in the Scan-ICT study indicated that their staff do have computers at home. Only 30% reported that none of their staff have their own computer at home
Percent of Health Institutions
Percent of Staff with computers at Home 70%Percent of Staff without computers at Home 30%
Source: INIIT, The Ghana Scan-ICT Study, 2002, © 2002, International Institute for Information Technology (INIIT)
174

Health Institution with Staff who own Computers at Home
No
Yes
Although a high proportion of the Health Institutions indicated having staff who own computers at home, in the majority of cases, only a small proportion of the staff have computers at home. The Scan-ICT study reveals that of the Health Institutions participating in the study, close to 93% indicated that less than 10% of their staff have computer at home. Only 7% indicated that a quarter of their staff have computers at home.
Percent distribution of staff with computers at home Percent of Health Institutions
Below 10% 93%About 25% 7%About 50% 0%About 75 % 0%About 100% 0%
Source: INIIT, The Ghana Scan-ICT Study, 2002, © 2002, International Institute for Information Technology (INIIT)
0% 20% 40% 60% 80% 100%
Below 10%
About 25%
About 50%
About 75 %
About 100%
Distribution of Staff with Computers at Home
12.8 Internet Access and Usage within the Heath Institutions
175
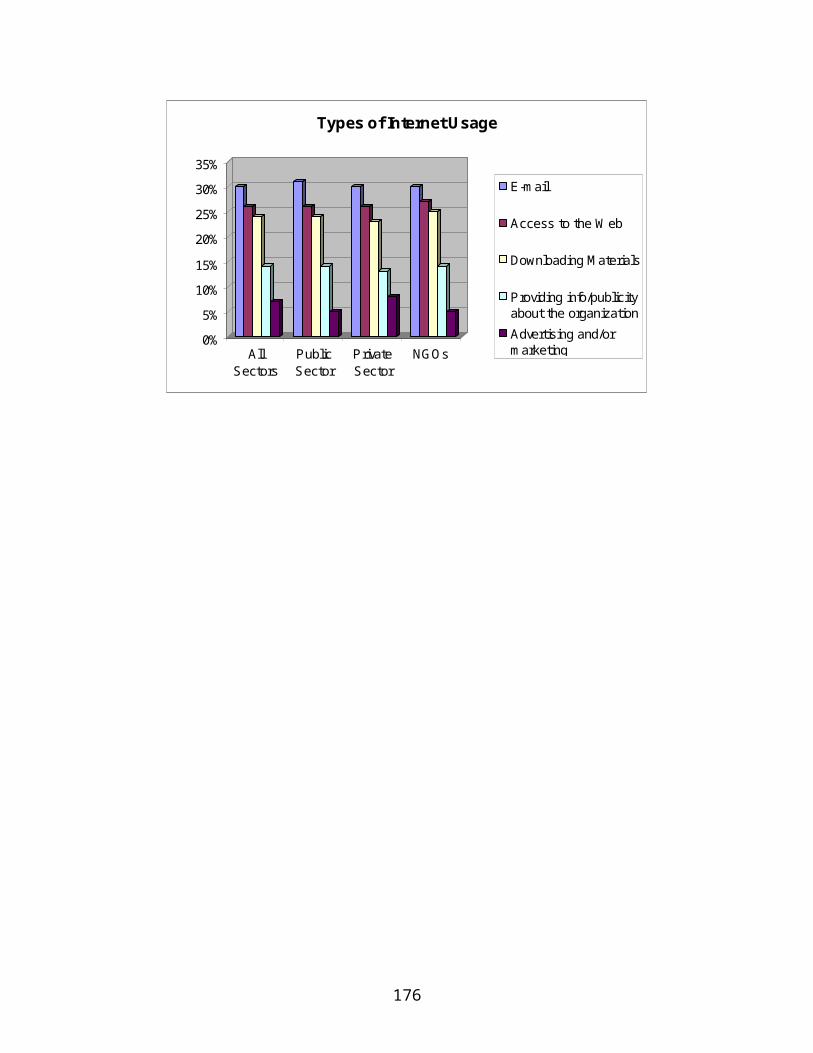
A reasonable proportion of the Health Institutions surveyed nationwide as part of the Scan-ICT study do have access to the Internet. The Study revealed that about 46% of the Institutions have access to the Internet. The vast majority of these have dial-up access via local ISPs.
Percent of Health Institutions
Percent of Health Institutions with access to the Internet 46%Percent of Health Institutions without access to the Internet 54%
Source: INIIT, The Ghana Scan-ICT Study, 2002, © 2002, International Institute for Information Technology (INIIT)
On the whole Internet usage within the Health Institutions is not wide-spread among their staff. Of the Institutions who participated in the Scan-ICT survey about 44% indicated that below 10% of their staff use the Internet, with only 6% reporting that a quarter of their staff use the Internet. None of the Institutions reported having all their staff using the Internet
Percent of staff within Health Institution who Uses the Internet
Percent of Health Institutions
0% (none) 42%below 10% 44%About 25% 9%About 50% 6%About 75 % 0%
About 100% 0%Source: INIIT, The Ghana Scan-ICT Study, 2002, © 2002, International Institute for Information Technology (INIIT)
0%
10%
20%
30%
40%
50%
0%(none)
below10%
About25%
About50%
About75 %
About 100%
Percent Distribution of Staff who Uses the Internet
Relating to what the Health Institutions use the Internet for, 37% of them use it for e-mail; while 27% indicated using it for Web access and browsing. Only 9% of the Institutions indicated using the Internet for providing information about their organization. None of them according to the survey use the Internet for advertising and marketing.
176
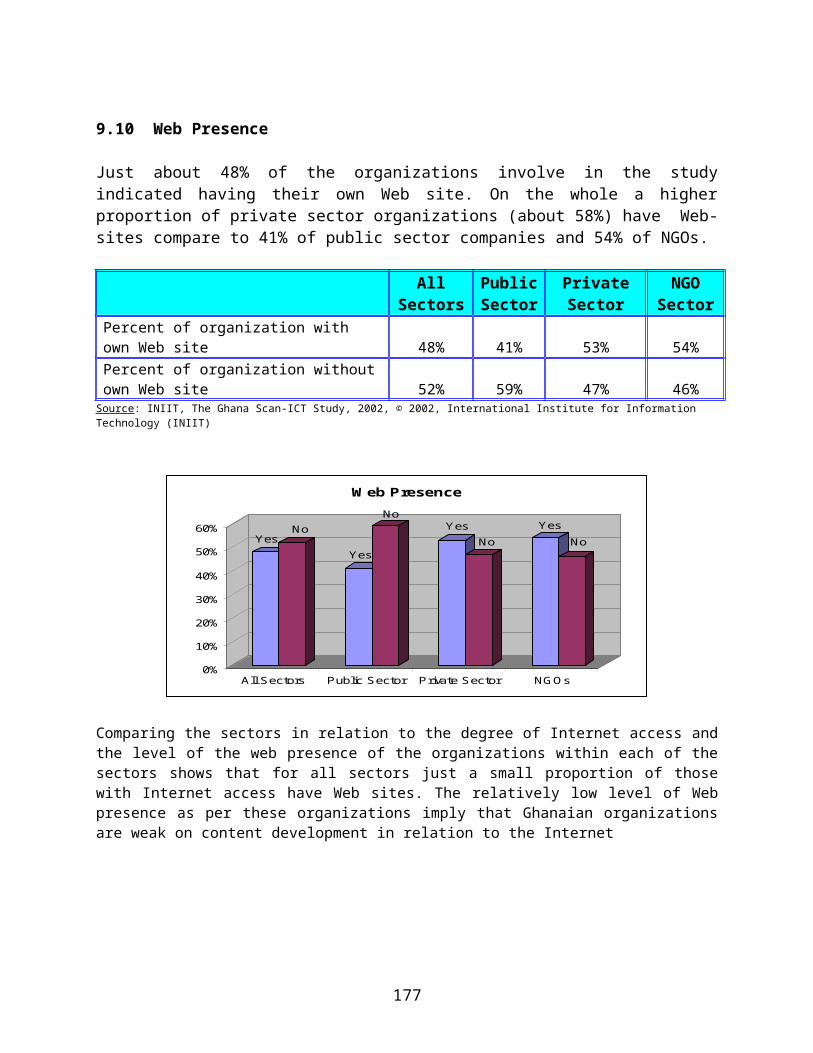
Percent distribution of what Health Institutions use the Internet for
Percent of Health Institutions
E-mail 37%Access to the Web 27%Downloading Materials 27%Providing info/publicity about the organization 9%Advertising and/or marketing 0%
Source: INIIT, The Ghana Scan-ICT Study, 2002, © 2002, International Institute for Information Technology (INIIT)
0% 10% 20% 30% 40%
Access to the Web
Downloading Materials
Providing info/publicity
Advert + Marketing
Distribution of what Health Institutions Use the Internet for
On the issue of Web presence, the vast majority of the Institutions do not have their own Web site on the Internet. Only 17% of the Institutions indicated having web presence.
Percent of Health InstitutionsPercent of Health Institutions with own Web site 17%Percent of Health Institutions without own Web site 83%
Source: INIIT, The Ghana Scan-ICT Study, 2002, © 2002, International Institute for Information Technology (INIIT)
177
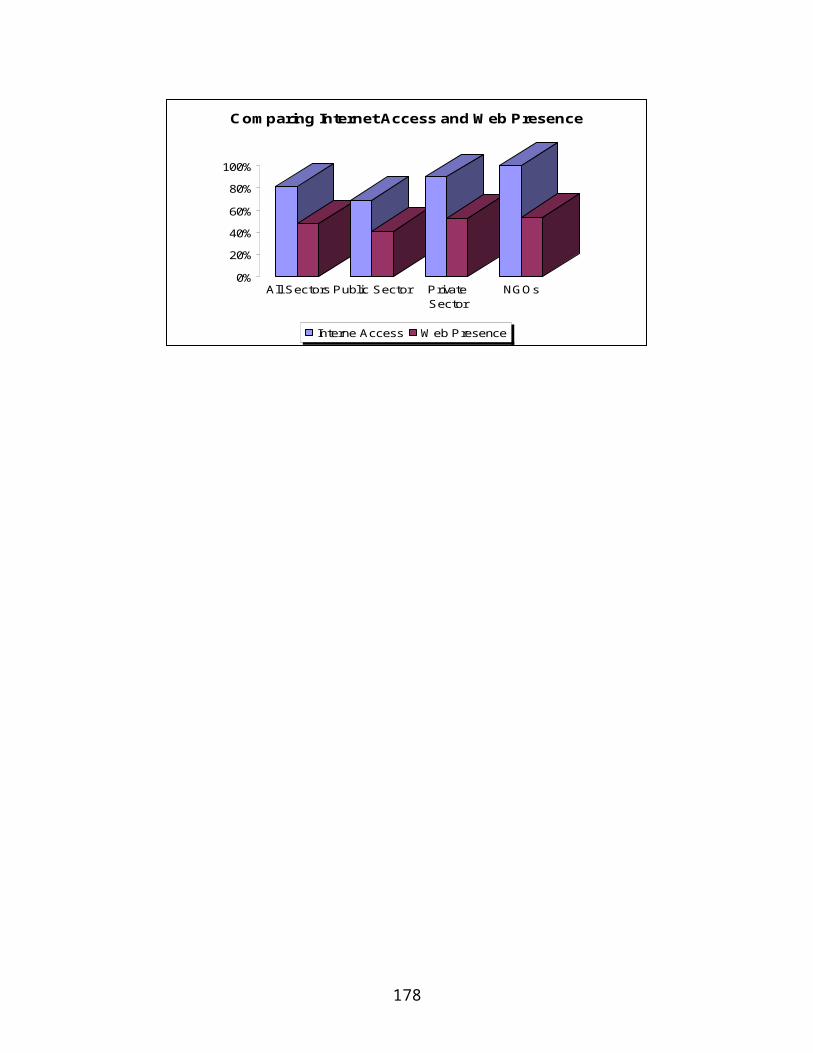
0%
20%
40%
60%
80%
100%
Yes No
Comparing Internet Access with Web Presence
Internet Access Web Site
12.9 IT Strategy and the Level of Computer Resource Utilization within the Health Institutions
Most of the Health Institutions surveyed do not have an IT policy, strategy or plan to guide the deployment and exploitation of ICTs to support their activities and operations. The Scan-ICT study revealed that only 30% of the Health institutions surveyed have some policy or strategy in place.
Percent of Health Institutions
Percent of Health Institutions with IT policy/strategy/plan 30%Percent of Health Institutions without IT policy/strategy/plan 70%
Source: INIIT, The Ghana Scan-ICT Study, 2002, © 2002, International Institute for Information Technology (INIIT)
0%
10%
20%
30%
40%
50%
60%
70%
Yes No
Health Institutions with IT Strategy/Plan
On the computer resource utilization, including the utilization of the capacities and facilities of the computer hardware and systems, as well the software resources, it was discovered that a relatively high proportion of the Health Institutions are under-utilizing their computer resources. The Scan-ICT study
178
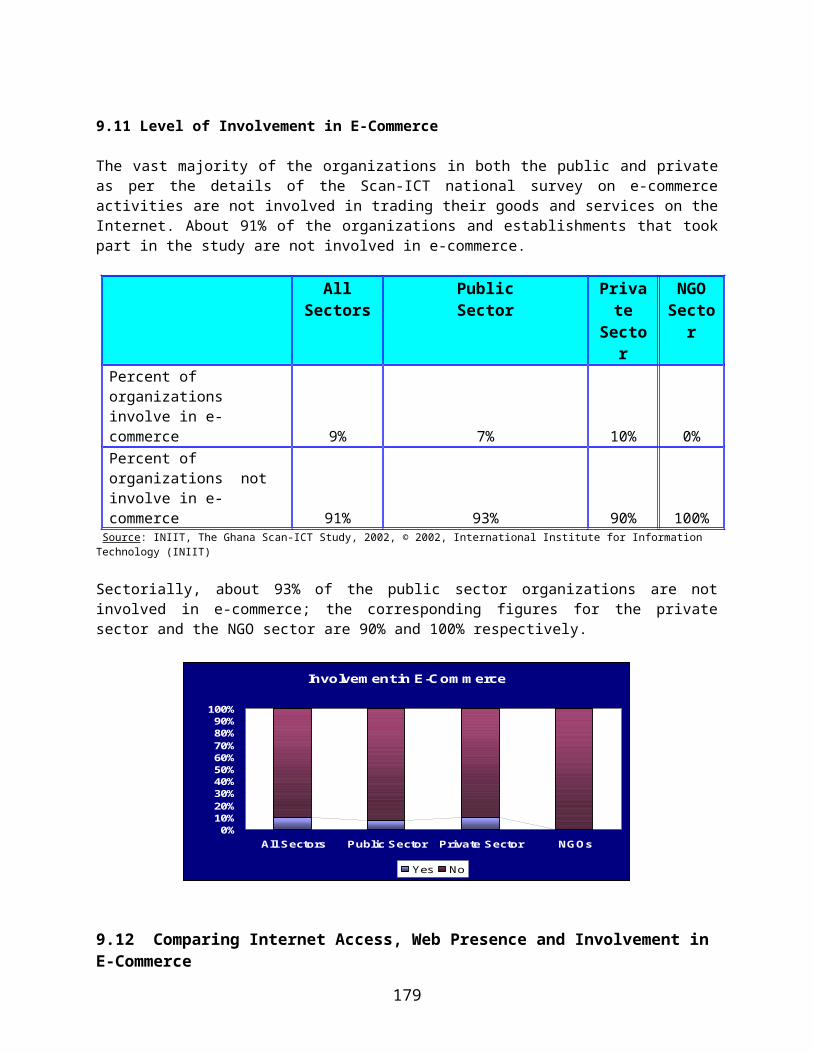
revealed that close to 46% of the Health Institutions that participated in the study, are utilizing less than 10% of their computer resources. Close to 31% reported utilizing about a quarter of their computer resources. None of the Institutions reported using close to 100% of their computer resources to facilitate their operations and activities.
Percent of computer resource Utilization in Health Institutions
Percent of Health Institutions
below 10% 46%About 25% 31%About 50% 18%About 75 % 5%About 100% 0%Source: INIIT, The Ghana Scan-ICT Study, 2002, © 2002, International Institute for Information Technology (INIIT)
0%
10%
20%
30%
40%
50%
below10%
About25%
About50%
About 75%
About 100%
Rate of Computer Resource Utilization in Health Institutions
179
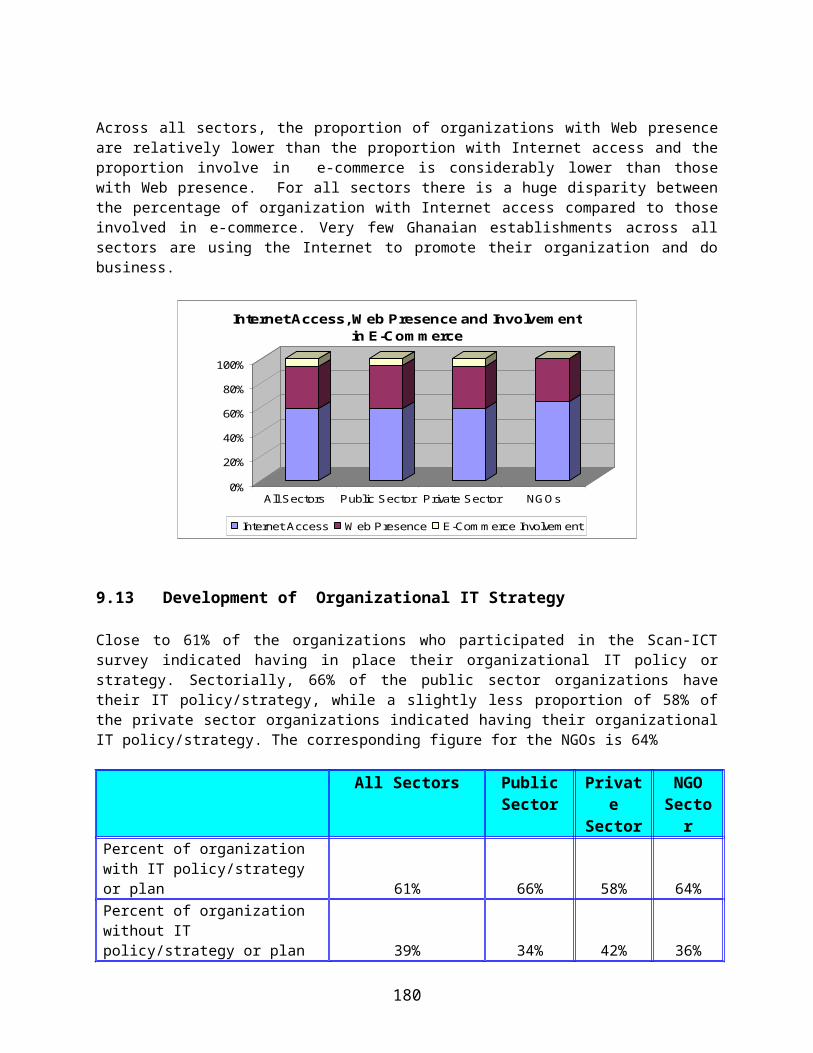
12.10 The Degree of Exploitation of ICTs within the Health Institutions
Although close to 64% of the Institutions reported having computers, a relatively high proportion of them indicated that they do not use computers to support their activities and operations. Of the Institutions surveyed, about 23% reported that less than 10% of their organizational activities are supported by computers. About 10% of them reported having close to a quarter of their operations supported by the use of computers.
Percent distribution of Proportion of organizational operations supported by computers
Percent of Health Institutions
0% (none) 54%below 10% 23%About 25% 10%About 50% 13%About 75 % 0About 100% 0
Source: INIIT, The Ghana Scan-ICT Study, 2002, © 2002, International Institute for Information Technology (INIIT)
0% 10% 20% 30% 40% 50% 60%
0% (none)
below 10%
About 25%
About 50%
About 75 %
About 100%
Distribution of Proportion of Organizational Operations Supported by Computers
12.11 The Types of ICT Deployment Problems within the Health Institutions
The Health institutions surveyed do face a number specific problems in deploying ICTs to support their operations and activities. Of the Institutions involved the Scan-ICT study, 22% indicated that computer skill shortage within their organization is a major problem area. A relatively higher proportion of 27% identified the high cost of computer products and services as a major problem area that is have implications on the deployment and exploitation of ICTs within their Institutions.
180
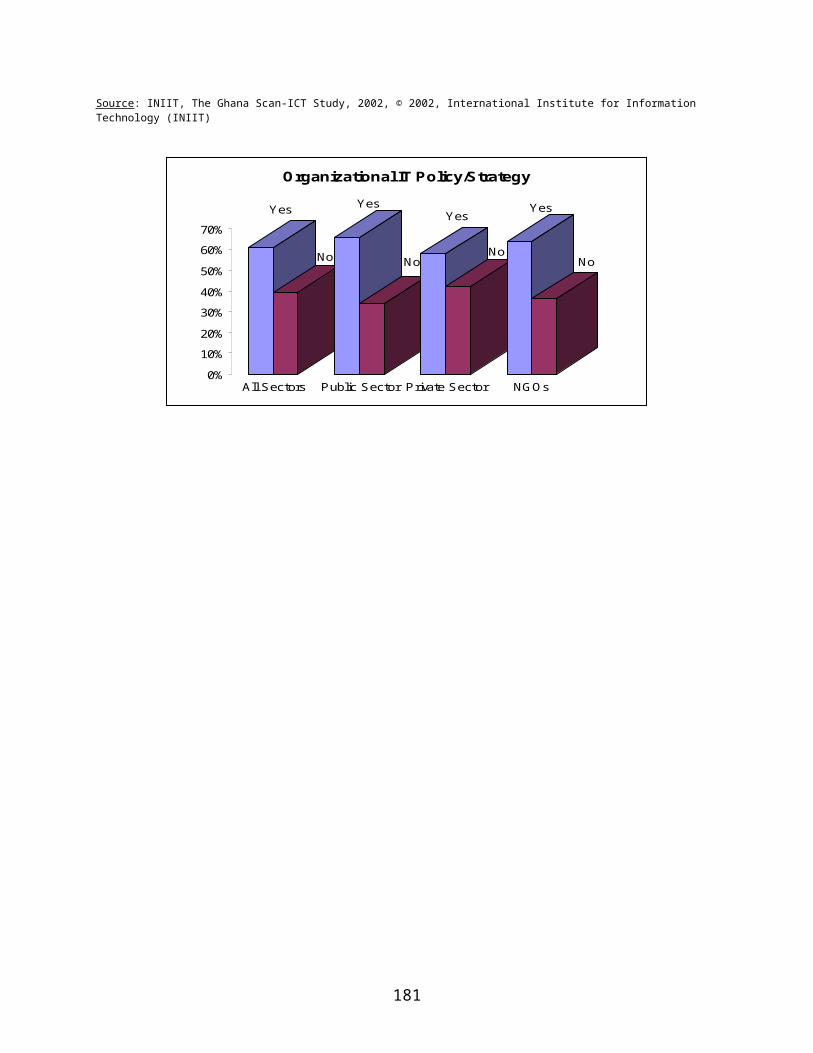
Percent distribution of IT related problems face by Health Institutions
Percent of Health Institutions
Computer Skill Shortage within the org 22%Problem with staff acceptance of computers 3%Problem with adjustment to computer systems 3%Computer system installation, implementation problems 14%Problems relating to after sales customer support 8%Problems with monitoring new dev 10%Problem with proliferation of computer products 6%High cost of computer products and services 27%Industrial relations problems due to computerization 8%Source: INIIT, The Ghana Scan-ICT Study, 2002, © 2002, International Institute for Information Technology (INIIT)
Distribution of IT Related Problems
22%
3%3%
14%
Computer Skill Shortage within the orgProblem with staff acceptance of computersProblem with adjustment to computer systems Computer system installation, implementation problems
Distribution of IT Related Problems8%
10%
6%27%
8%
Problems relating to after sales customer supportProblems with monitoring new devProblem with proliferation of computer productsHigh cost of computer products and servicesIndustrial relations problems due to computerization
Only a small proportion of the Health Institutions surveyed nationally think they have problem with staff acceptance of computers; also only 3% indicated that their staff have problem adjusting with computer systems when it was introduced into their Institution. Industrial relation problems arising from computerization is also not a problem area for most of the Institutions; only 8% reported ever having this problem.
181
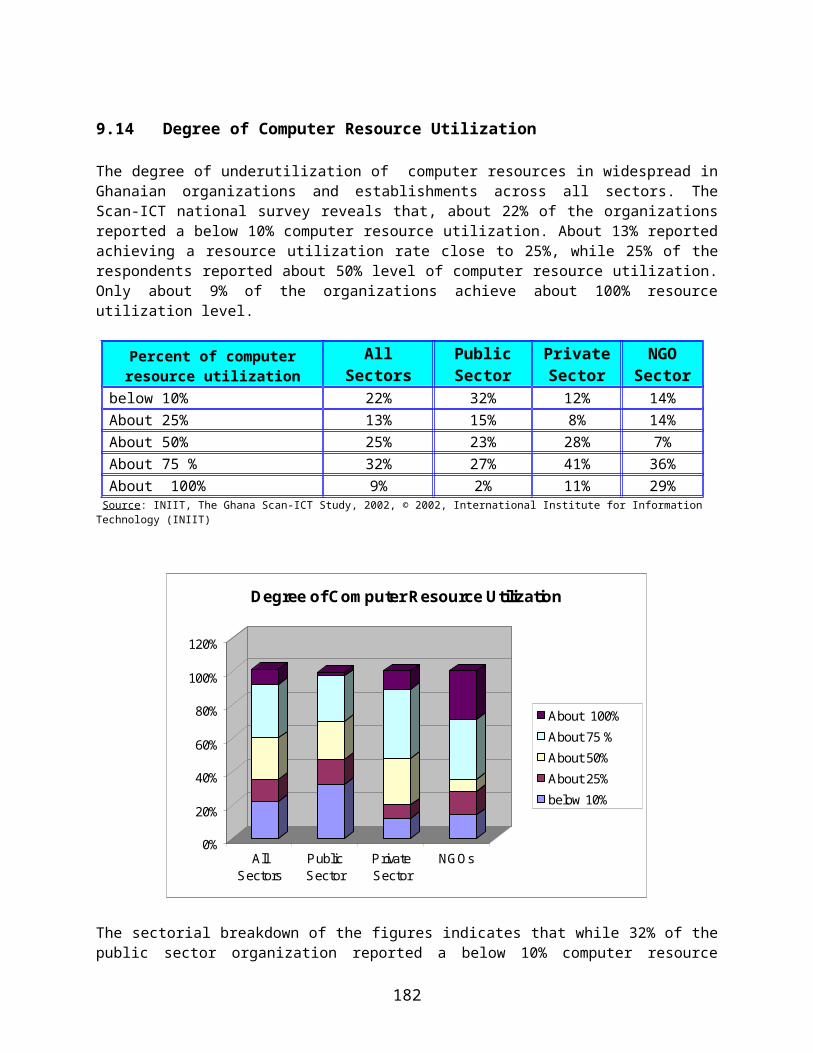
This Page is Deliberately Left Blank
182
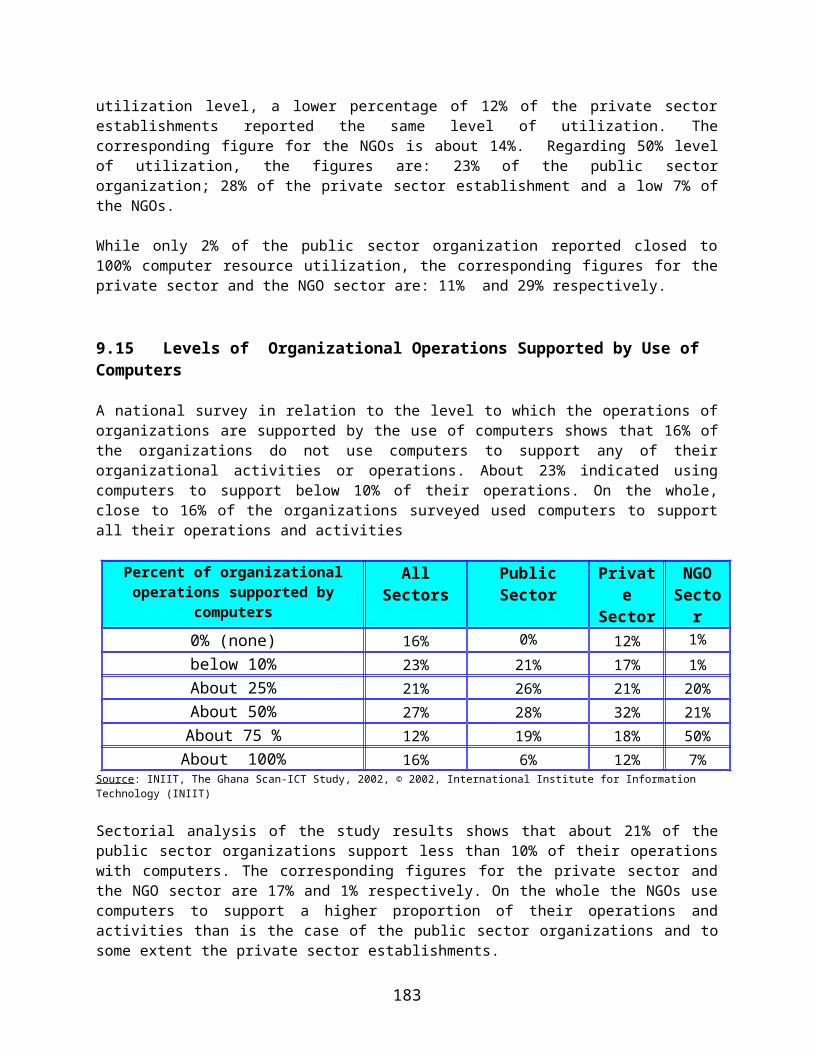
CHAPTER THIRTEENCHAPTER THIRTEEN
THE PROFILE OF ICT PROJECTS AND INITIATIVES IN THE PUBLIC AND PRIVATE SECTOR
Project Name Science for Children projectImplementing Organization Ghana Academy of Arts and SciencesProject Description Science Teaching in Primary Schools
Scope of Project Project Time Frame Stage of Project Funding SourcesNational Started in 1996 and is On-going Pilot UNESCO, Ford Foundation
Project Name IT Capacity Building and PublicationsImplementing Organization Ghana Academy of Arts and SciencesProject Description Use of ICT in publishing. Up-Grading the Academy’s ICT Systems.
Scope of Project Project Time Frame Stage of Project Funding SourcesOrganizational Two Years Full Implementation Inter Academy Panel (IAP) and
Ford Foundation
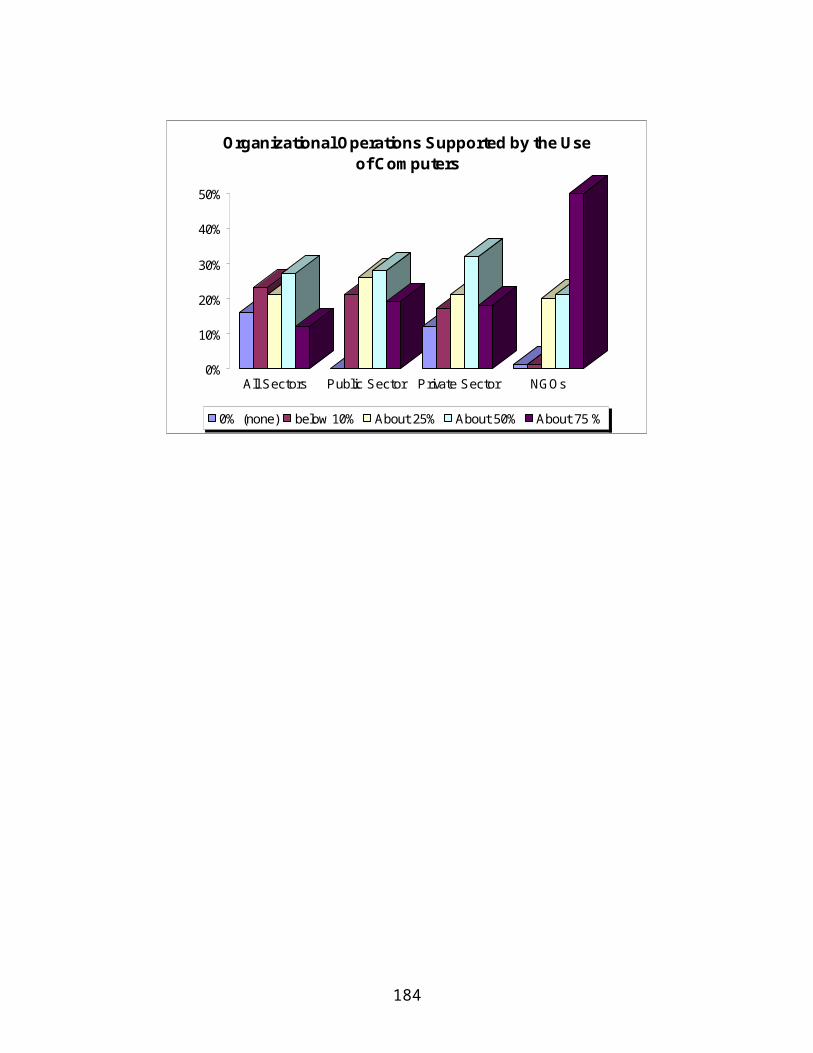
Project Name Fastnet-GT data network nationwideImplementing Organization Ghana TelecomProject Description Data Voice Multimedia Broadband Service
Scope of Project Project Time Frame Stage of Project Funding SourcesNationwide 1st phase, Southern Ghana Full Implementation
(25%complete)Ghana Telecom’s own Resources
Project Name GT-SAT-GT Satellite Network nationwideImplementing Organization Ghana TelecomProject Description Data Voice Status Needs Expansion
Scope of Project Project Time Frame Stage of Project Funding SourcesNationwide 1999-1st quarter nationwide Implementation (75%complete) Ghana Telecom’s own Resources
Project Name GT-Net (ISP)-GT Commercial Internet Services networkImplementing Organization Ghana TelecomProject Description Data Voice internet and Multimedia services
Scope of Project Project Time Frame Stage of Project Funding SourcesNationwide 1st phase, Southern Ghana Implementation (50%complete) Ghana Telecom’s own Resources
184
Project Name SAT/WASC/SAFE-GT Fiber network Connection to Continental fiber (backhaul or terrestrial fiber)Implementing Organization Ghana TelecomProject Description Data Voice Multimedia Broadband service
Scope of Project Project Time Frame Stage of Project Funding SourcesNationwide Before End of 2004 Implementation , Phase 1
Uncompleted (50% PHI)Ghana Telecom’s own Resources
Project Name O/A, CMBS-Internal Billing and Intranet systemImplementing Organization Ghana TelecomProject Description Data Voice Multimedia Broadband service
Scope of Project Project Time Frame Stage of Project Funding SourcesNationwide 1st phase, Southern Ghana Implementation (25%complete) Ghana Telecom’s own Resources
Project Name Bank of Ghana RTGS Project- (OR GISImplementing Organization Bank of GhanaProject Description The Ghana Interbank Settlement is the Bank of Ghana’s Real Time Gross Settlement (RTGS) system.
Designed to enforce, through the system, the processing and settlement of high-value payments and other inter-bank transactions including Funds Transfer and Electronic Payments
Scope of Project Project Time Frame Stage of Project Funding SourcesSectoral – Financial Sector Ten months, January, 2002 Full Implementation IDA, Bank of Ghana
185
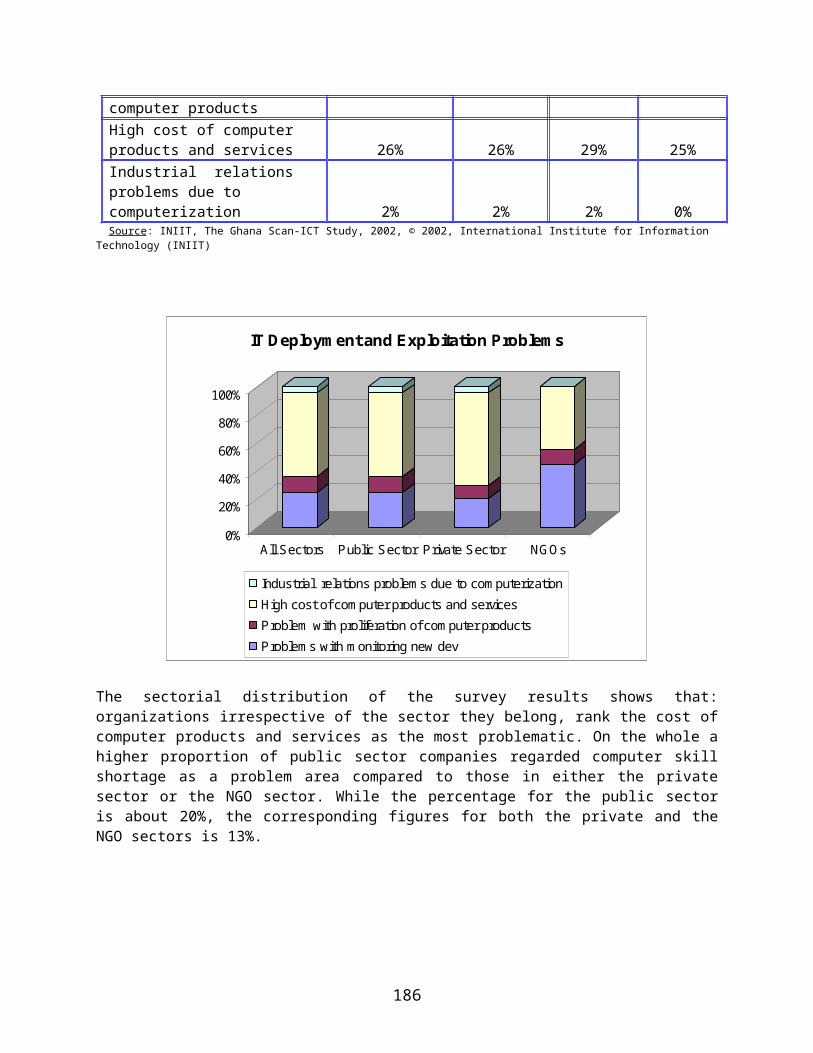
Project Name Court Automation and Modernization ProjectImplementing Organization Judicial ServicesProject Description Automating the Court System.
Scope of Project Project Time Frame Stage of Project Funding SourcesSectoral – Judicial Sector September 2002-June 2003 Pilot World Bank
Project Name Public Financial Management Reform Programme (PUFMARP)Implementing Organization Ministry of FinanceProject Description The project is designed to develop an integrated public financial management system in Ghana involving an
inter-related set of sub-systems. The project has an ICT component.Scope of Project Project Time Frame Stage of Project Funding Sources
Sectoral – The Financial Sector 6 Years Full Implementation IDA, DFID, EU, CIDA, Government of Ghana
Project Name Networking the OfficesImplementing Organization National Communications Authority (NCA)Project Description To implement an organizational corporate network for the NCA
Scope of Project Project Time Frame Stage of Project Funding SourcesOrganizational September-November, 2002 Full Implementation NCA own Resources
186
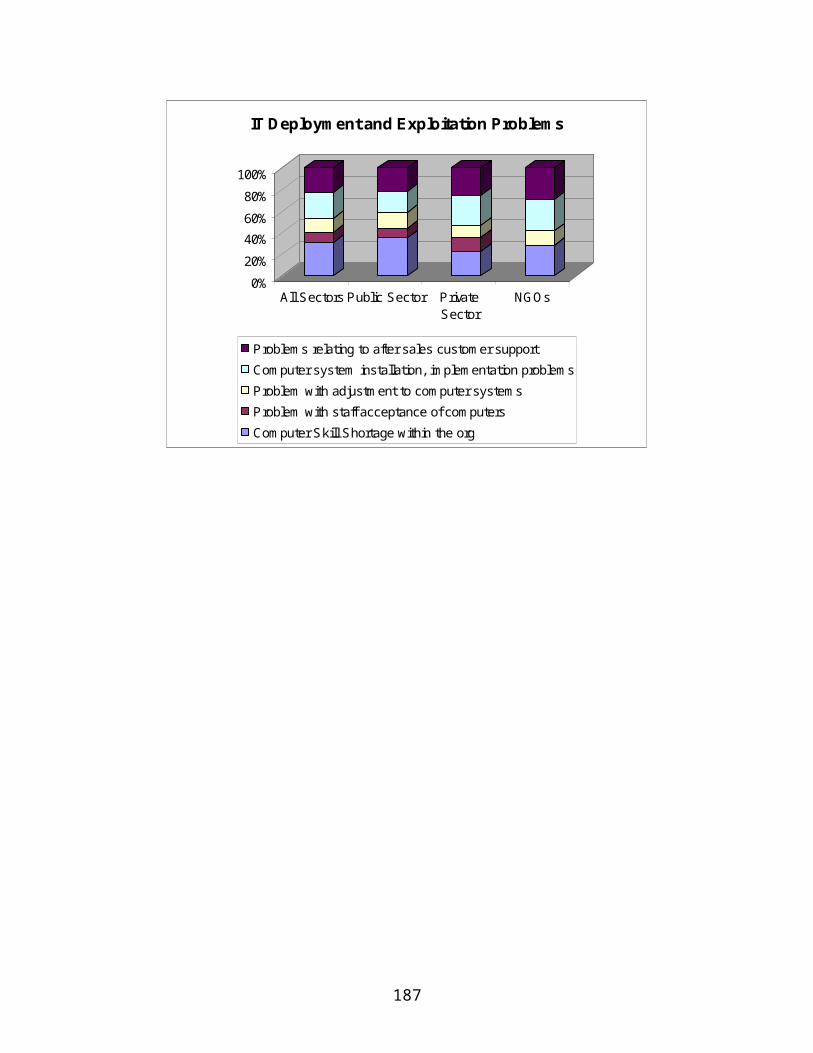
Project Name The Local Area Network ProjectImplementing Organization Ministry of Environment and ScienceProject Description To enhance the IT facility of the Ministry of Environment and Science
Scope of Project Project Time Frame Stage of Project Funding SourcesOrganizational On-going Pilot Government of Ghana
Project Name Supply and Installation of Computers and AccessoriesImplementing Organization Ministry of JusticeProject Description Legal Sector Reform Project (Computerization Component)
Scope of Project Project Time Frame Stage of Project Funding SourcesSectoral 10 weeks Full Implementation Donors
Project Name Campus Area NetworkImplementing Organization Ghana Atomic Energy CommissionProject Description Project designed to network the entire campus of the Commission
Scope of Project Project Time Frame Stage of Project Funding SourcesOrganizational On-going Full Implementation Various institution and centers of
the Commission
187
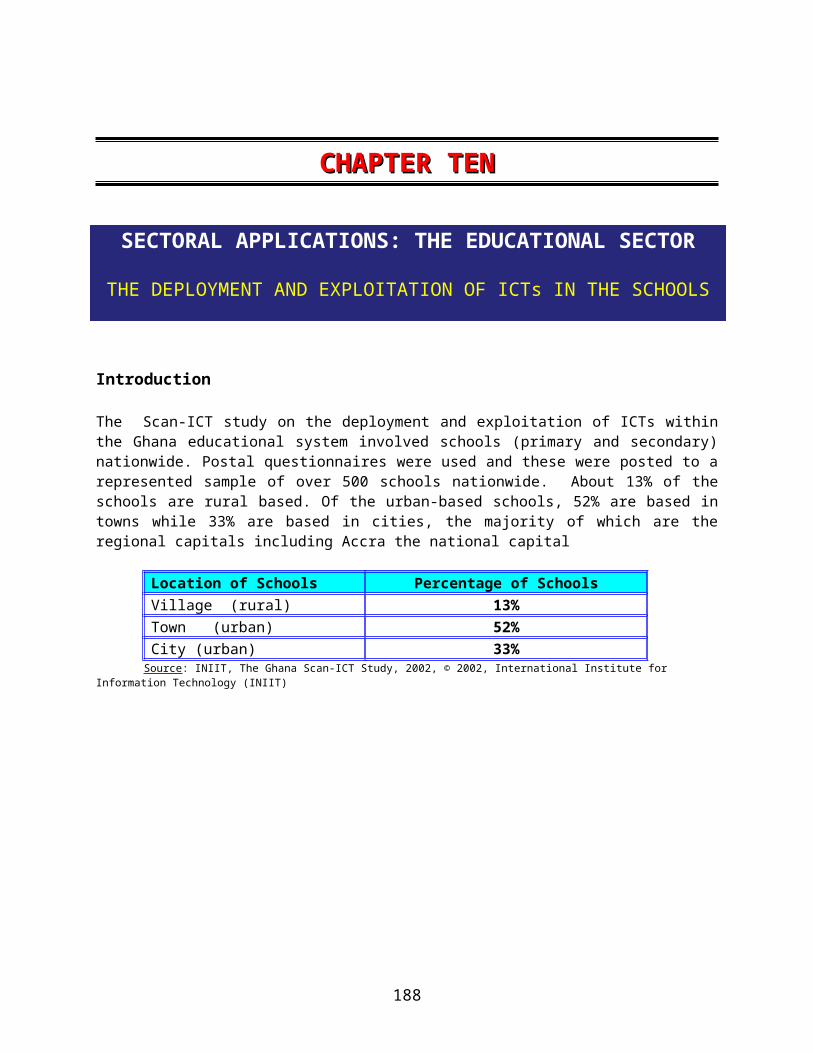
Project Name Computerization of the MinistryImplementing Organization Ministry of Trade and IndustryProject Description The Project is designed to implement a LAN system and provide Internet Connectivity for the Ministry
Scope of Project Project Time Frame Stage of Project Funding SourcesOrganizational 13 Weeks Full Implementation Government of Ghana
Project Name Creating of Centre of Excellence for Technology EducationImplementing Organization Ministry of EducationProject Description The Centre of Excellence for Technology Education will be a place to demonstrate the effectiveness of a
technology based approach to teaching and learning and serve as a resource for computer managed distance learning across all the Science Resource Centers within the country
Scope of Project Project Time Frame Stage of Project Funding SourcesSectoral To be completed by June, 2003 Pilot Government of Ghana/Ministry of
Education/Get Fund
Project Name Establishment of a National Computer CentreImplementing Organization Ministry of EducationProject Description To provide a facility for the Training of students, teachers, civil/public servants in ICT
To serve as a training Center for Science Resource Centers, Teachers and Technicians and other service personnel
Scope of Project Project Time Frame Stage of Project Funding SourcesOrganizational To be completed by the end of 2003 Pilot JICA
188
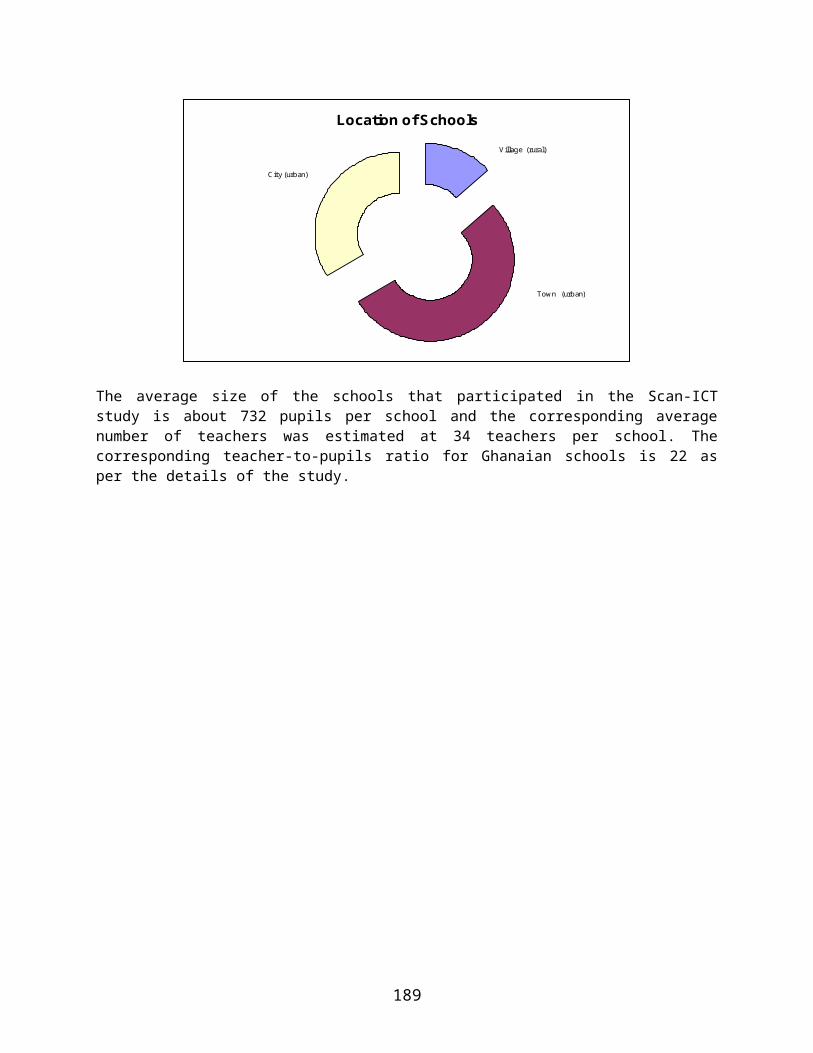
Project Name Internet and Website Development ProjectImplementing Organization Ministry of Private Sector DevelopmentProject Description The Project is designed to link the entire Ministry and its agencies to the Internet and develop a Web-site
for the Ministry.Scope of Project Project Time Frame Stage of Project Funding Sources
Organizational On-going Full Implementation Ministry’s own Resources
Project Name Website Upgrade ProjectImplementing Organization The Ghana Investment Promotion Center (GIPC)Project Description To develop the GIPC Web Site
Scope of Project Project Time Frame Stage of Project Funding SourcesOrganizational 4 Months Full implementation World Bank, MIGA
Project Name Investor Tracking SystemImplementing Organization The Ghana Investment Promotion Center (GIPC)Project Description The Project is designed to effectively manage relationship with investors and provide indicators of success.
Project has an ICT componentScope of Project Project Time Frame Stage of Project Funding Sources
Organizational 4 Months Post Feasibility Stage World Bank, MIGA
189
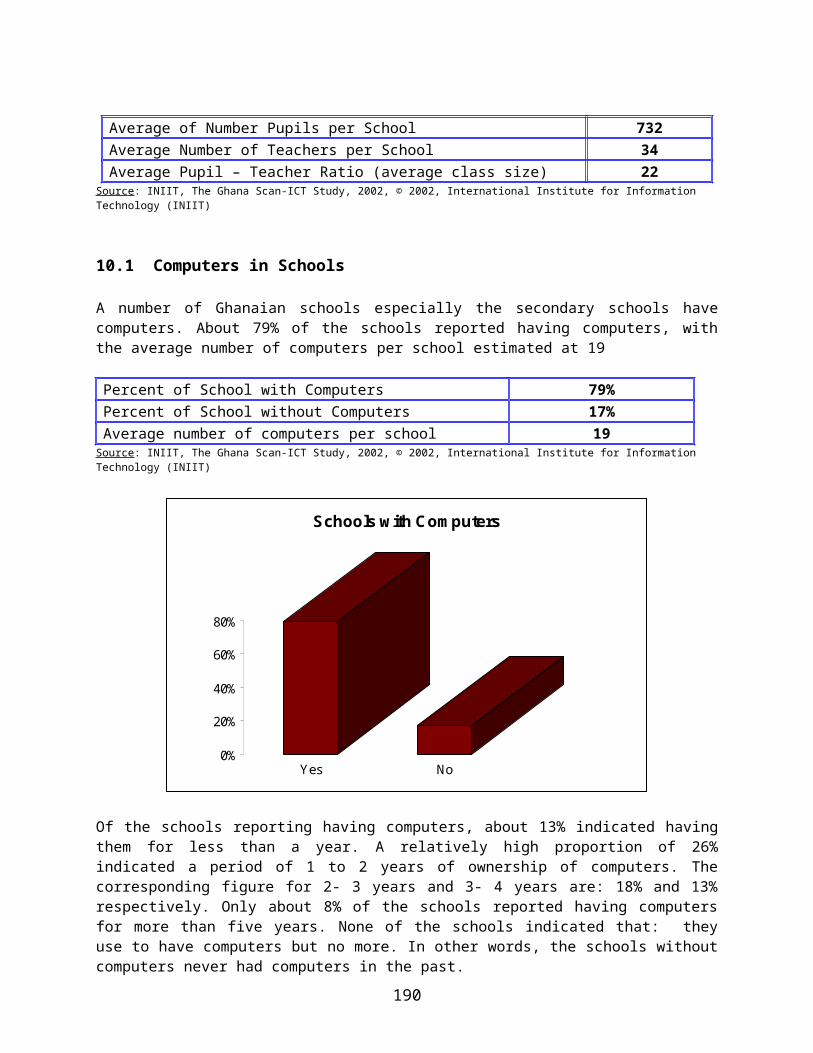
Project Name Broadband Internet ConnectivityImplementing Organization The Ghana Investment Promotion Center (GIPC)Project Description Provision of Broadband Wireless Internet Access to facilitate Investment Promotion
Scope of Project Project Time Frame Stage of Project Funding SourcesOrganizational 4 Months Full implementation World Bank
Project Name Ghana Customs Management Systems (GCMS)Implementing Organization Customs Excise and Preventive Service (CEPSProject Description Full automation of customs clearance procedures.
Scope of Project Project Time Frame Stage of Project Funding SourcesOrganizational 3 years Pilot Government of Ghana and World
Bank
Project Name ICT Centre of ExcellenceImplementing Organization Ministry of Communication and TechnologyProject Description Training in ICT skills and provide linkage with Academic Institutions involve in ICTs
Scope of Project Project Time Frame Stage of Project Funding SourcesNational /Sub Regional Nov. 2002 to Feb. 2003 Full Implementation. Government of India and
Government of Ghana.
190
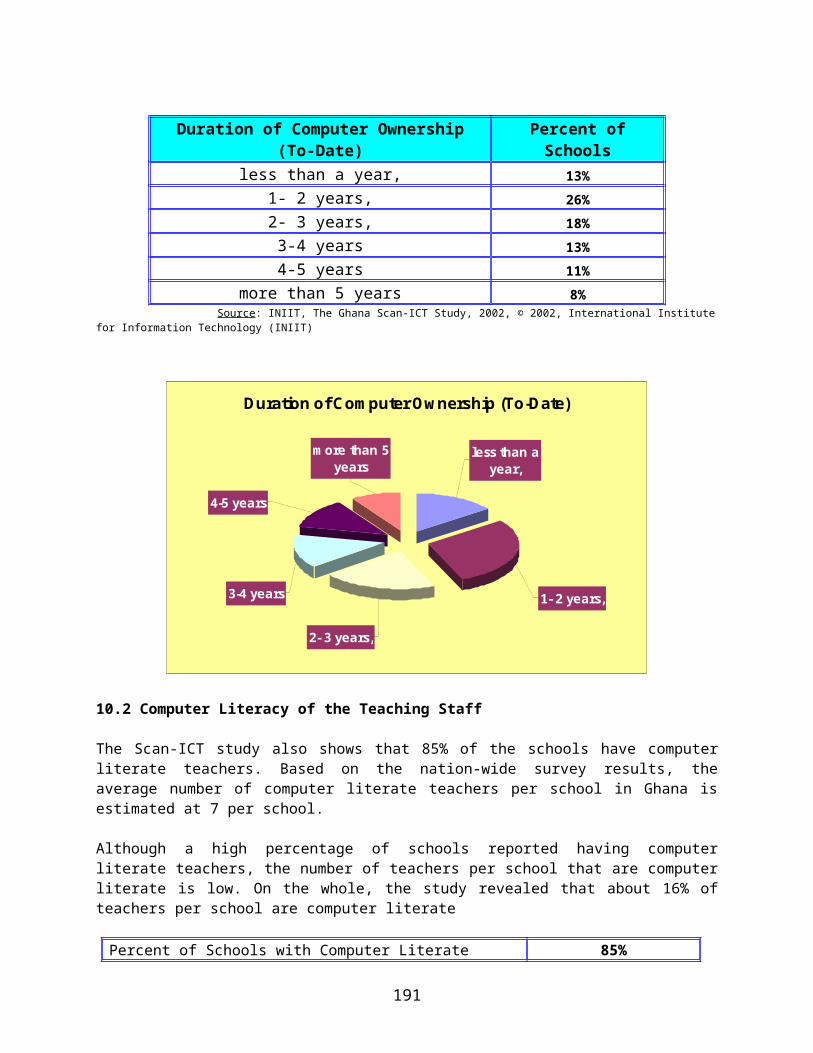
Project Name ICT Policy and strategy for the health sectorImplementing Organization Ministry of HealthProject Description To develop a framework for the procurement, deployment and the use of ICT in the health sector.
Scope of Project Project Time Frame Stage of Project Funding SourcesOrganizational On-going Full Implementation. Donor Agencies
Project Name IRS Computerization Project.(As part of phase 2 of PUFMARP)Implementing Organization Internal Revenue Service (IRS)Project Description To computerize the IRS
Scope of Project Project Time Frame Stage of Project Funding SourcesOrganizational 5 years Full Implementation. World Bank
Project Name Wide Area Network (WAN) Development ProjectImplementing Organization Ministry of Roads and TransportProject Description Establish a WAN to link the Departments and Agencies of the Ministry
Scope of Project Project Time Frame Stage of Project Funding SourcesOrganizational 2 Months Full Implementation. Foreign Donors/Ghana
Government
191
Project Name Development of the Ministry of Roads and Transport Web SiteImplementing Organization Ministry of Roads and TransportProject Description Develop a website featuring the necessary data/information about all the Government agencies in the sector.
Scope of Project Project Time Frame Stage of Project Funding SourcesOrganizational 8 Weeks Full implementation Foreign Donors/Ghana
Government
Project Name Ghana Dot Gov ProjectImplementing Organization Ministry of Information & Presidential AffairsProject Description To provide a primary web portal (domain: www.ghana.gov.gh) for the MIPA.
Scope of Project Project Time Frame Stage of Project Funding SourcesNational 3 Months Pilot Government of Ghana (20%) and
Donor Agencies (80%)
192
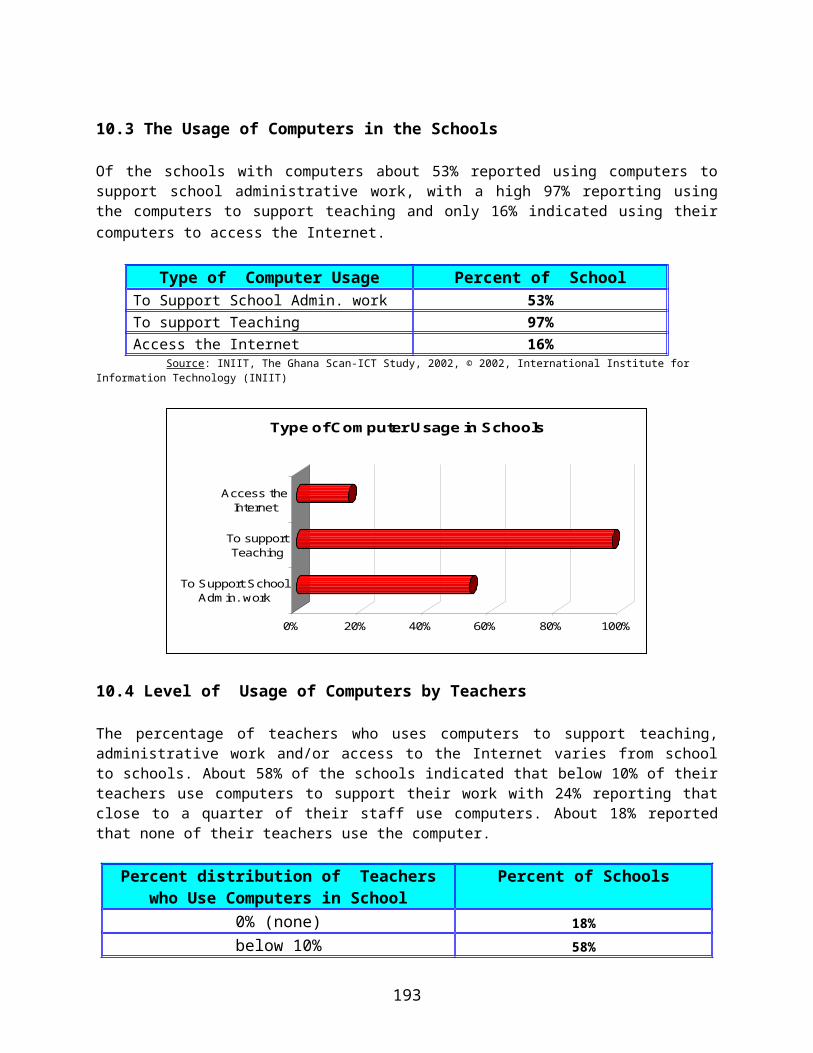
This Page is Deliberately Left Blank
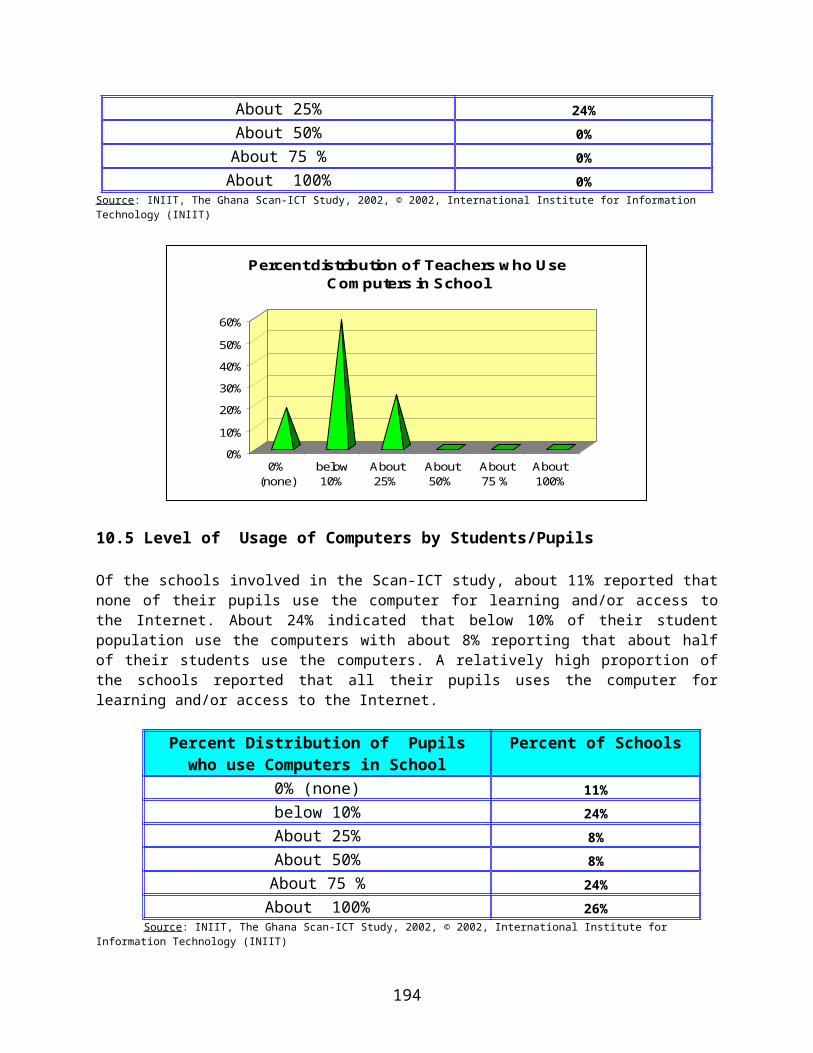
APPENDICESAPPENDICES
194
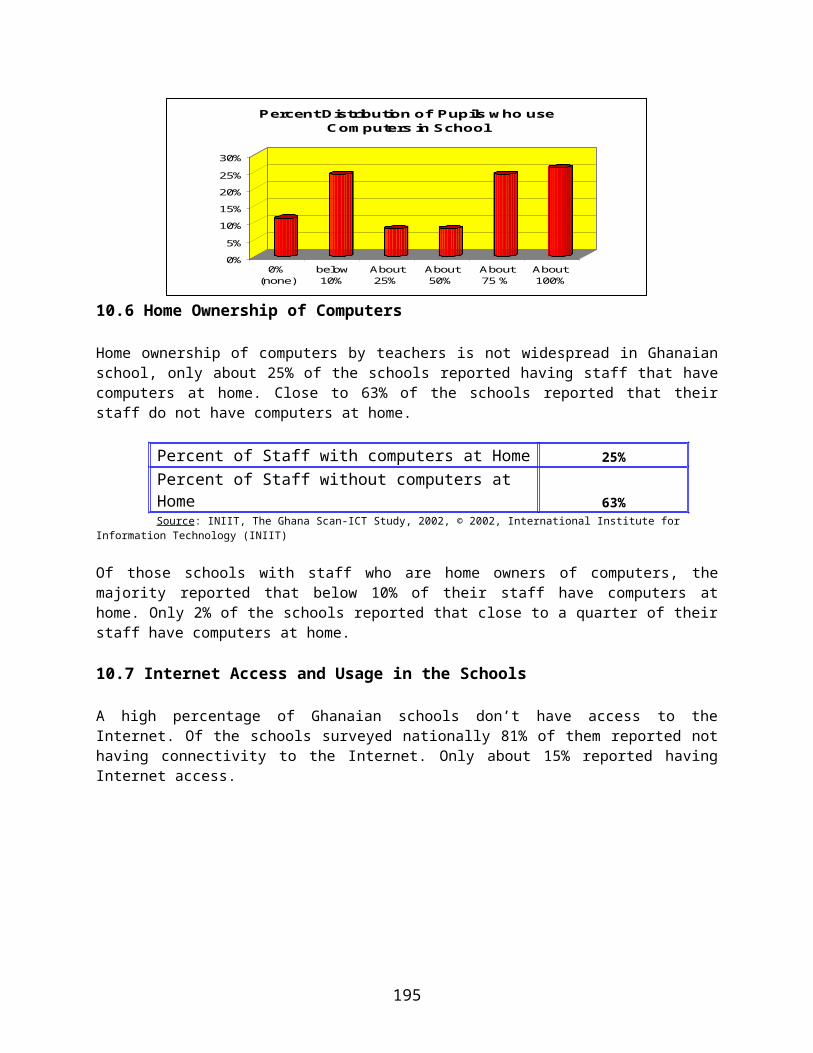
APPENDIX A: QUESTIONNAIRE USED IN THE SCAN-ICT SURVEYS
The Ghana SCAN-ICT Questionnaire: A Nation-wide Study on the Deployment and Exploitation of ICTs [information and communications technologies] in the Public and
Private Sector [T-PP-MF02]
1. Which of the following sectors does your organization/establishment belong to? (please tick one) Public Sector Private Sector Non-governmental Organization (NGO)
2. What is the size of your organization/establishment (in terms of number of staff)? Below 50 50 –100 100-200 200-500 500-1000 Over 1000
3. Which of the followings best describe your organization/establishment? (please tick one) Servicing Company/Establishment (an establishment in the Service Sector) Manufacturing/Industrial Company/Establishment Government/Public/Local Authority Establishment Academic/Research Institution (University, College, Polytechnic, Research Institute) Non-Governmental Organization (NGO) Others (Please specify) _________________________________________
4. In which region is your organization/establishment located? (please tick one):Gt. Accra Region. Ashanti Region Brong Ahafo Region Eastern Region Volta Region Northern Region Western Region Upper West Region Upper East Region Central Region
5. Does your organization/establishment use computers to support its activities and operations (in other words is your establishment computerized)? Yes No. If Yes, please answer the rest of the questions. Thanks
6. Which of the followings best describe your computer system? (please tick one) Standalone Computers (e.g. a number of Personal Computers (PCs) not connected/networked) A Local Area Network (LAN) ---- A number of computers connected/networked in a single building A Backbone (campus/corporate) Network ---- A couple of LANs connected over a number of buildings A Wide Area Network (WAN) ---- A geographically dispersed network connected over a number of geographically spread locations (e.g. towns, cities, regions)
7. What percentage of the staff of the organization use computers to support their activities and functions?
195
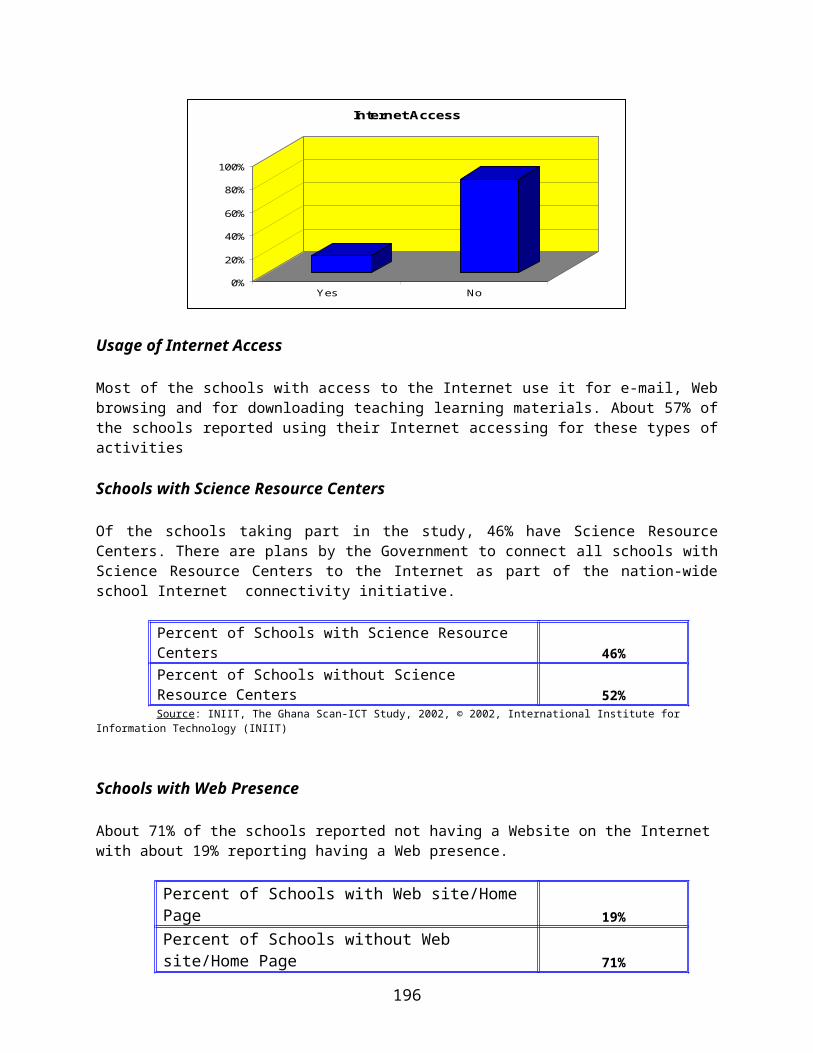
0% (none) below 10% About 25% About 50% About 75 % About 100%
8. What percentage of the staff of the entire organization are computer personnel/staff (e.g. programmers, computer technicians, system analysts, computer network managers and technicians etc)? 0% (none) below 10% About 25% About 50% About 75 % About 100%
9. Which of the following IT Personnel does your establishment currently employ. Programmers/ Software developers Number of Personnel ___________ System analysts Number of Personnel ___________ Computer scientists Number of Personnel ___________ Telecommunications specialists Number of Personnel ___________ Network Engineers/Technicians Number of Personnel ___________ IT trainers Number of Personnel ___________10. What percentage of your total organizational expenditure is on information technology [IT] – (including expenditure of computers, software, training of staff in the use of computers etc)? 0% (none) below 10% About 25% About 50% About 75 % About 100%
11. Does any staff member use computers at home? Yes No. If Yes, which proportion of staff use computers at home? below 10% About 25% About 50% About 75 % 100%
12. Does your organization/establishment have access to the Internet? Yes No
13. What percentage of staff uses the Internet to support their activities and functions in the establishment? 0% (none) below 10% About 25% About 50% About 75 % About 100%
14. Does your organization/establishment have its own Web-site on the Internet? Yes No
15. Please indicate below which of the followings best describe what the Internet is used for in your organization/establishment? (you may tick more than one): For Electronic Mail (e-mail) For access to the Web (browsing/accessing the Web) For Downloading Relevant Materials from the Internet For providing information/publicity about our organization/establishment to the public at large For advertising and/or marketing of our products/services
196
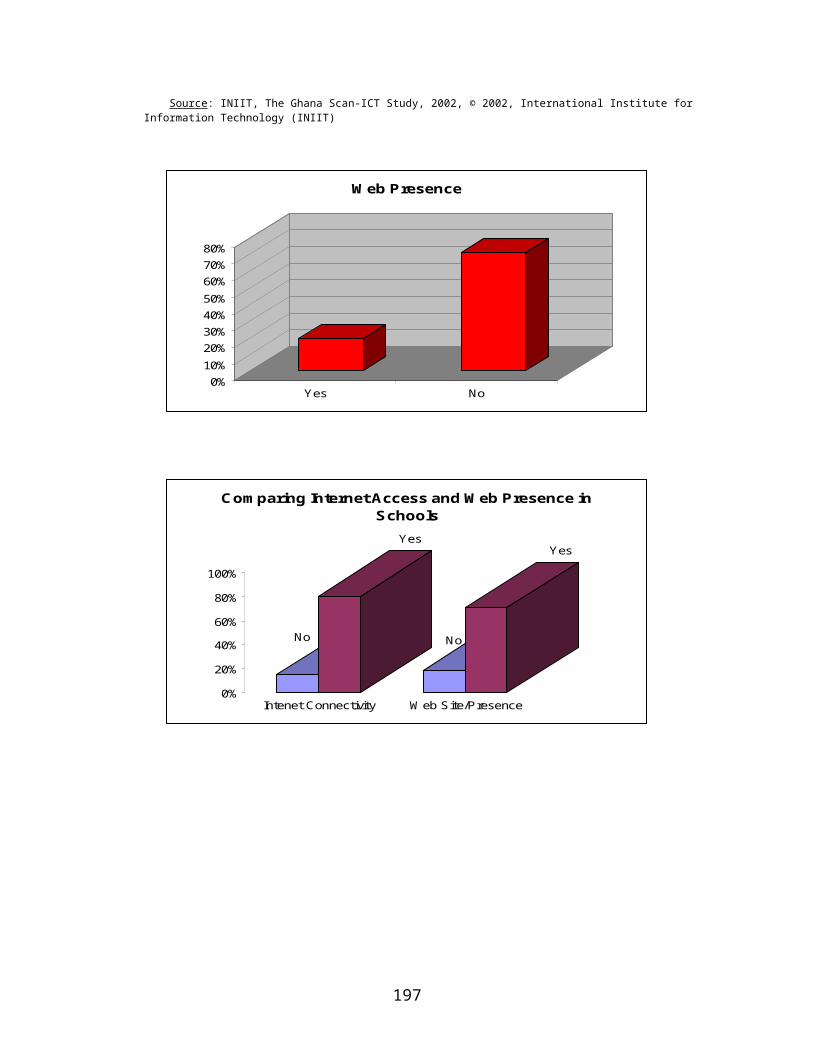
16. Is your organization/establishment involve in electronic commerce (e-commerce) ---- i.e. selling its goods or services over the Internet? Yes No
17. Does your organization/establishment have an IT (information technology) Policy/Strategy or Plan (i.e. a policy and/or strategic plan to guide the deployment and exploitation of computer resources within the organization)? Yes No
18. How will you rate the level of computer resource (hardware, software and applications) utilization in your establishment? below 10% About 25% About 50% About 75 % About 100%
19. Approximately, what percentage of the operations, or activities of your organization are supported by the use of computers? below 10% About 25% About 50% About 75 % About 100%
20. Which of the followings IT-related problem areas (constraints) apply to your establishment? (you may tick more than one): Computer Skill Shortage within the organization/establishment Problem with staff acceptance of computers to support their activities and functions Problem with adjustment to computer systems by the organization/establishment Computer system installation, implementation and/or maintenance problems Problems relating to after-sales customer support by computer vendors Problems with monitoring new developments in the computer industry/field, because of rapid advances. Problem with proliferation of computer products, --- making it difficult to decide on suitable products High cost of computer products and services Industrial relations problems due to the computerization of our organizational activities or operations
197
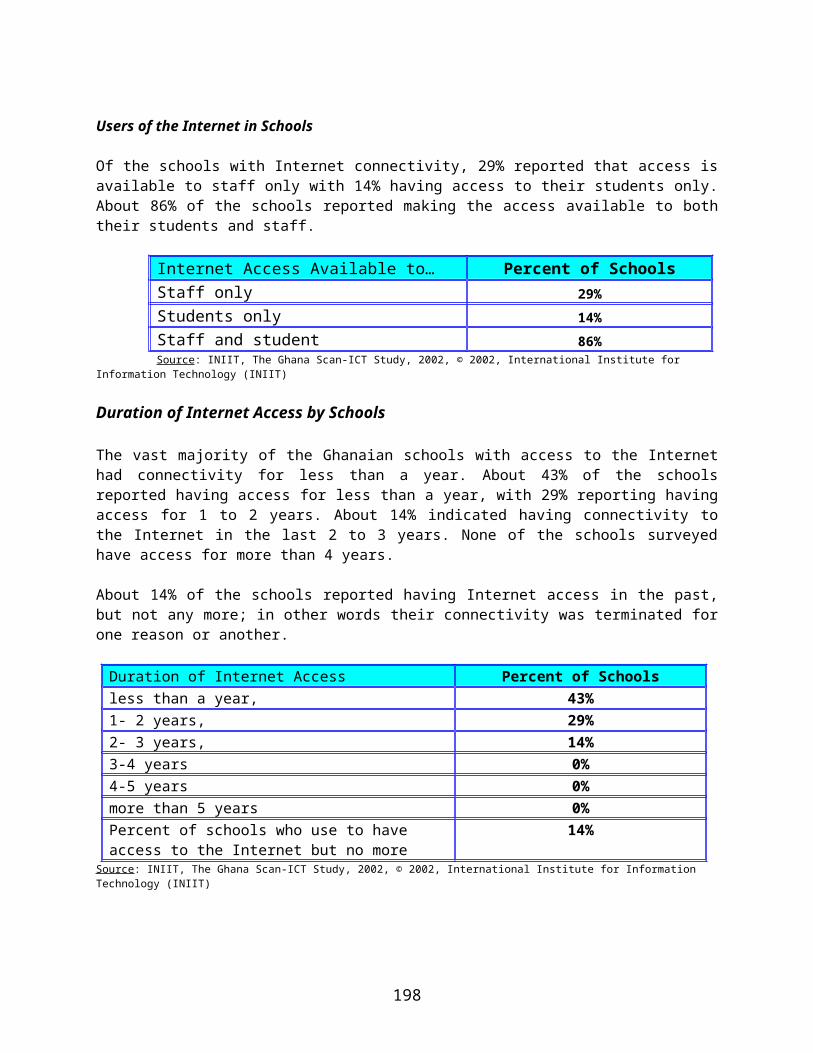
The Ghana SCAN-ICT Questionnaire: A Nation-wide Study on the Deployment and Exploitation of ICTs [information and communications technologies] in Schools/Institutions
[T-SI-M02]
1. Which of the followings best describe your school/institution? (please tick one) Primary Sch. Junior Sec. Sch Senior Sec Sch. Sec-Tech School Teachers’ Training College Technical/Commercial/Vocational Institution Others (please specify) ____________________________________
2. Which of the followings best describe your school/institution? Private sch./institution Public/Government sch./institution Others (please specify) ____________________________________
3. In which region is your school/institution located? (please tick one)Gt. Accra Region. Ashanti Region Brong Ahafo Region Eastern Region Volta Region Northern Region Western Region Upper West Region Upper East Region Central Region
4. Which of the followings best describe where your school/institution is located? Located in a village Located in a town Located in a city (e.g. Accra or Regional Capitals)
5. Does your school/institution have a Ministry of Education Science Resource Center? Yes No
6. How many pupils/students are there in your school/institution? _____________
7. How many teachers/tutors do you have in your school/institution? _____________
8. Does your school/institution have computers Yes No If Yes, how many do you have _______
9. Does your school/institution have computer literate teachers/tutors? ( i.e. those with basic knowledge in computers and know how to use them)? Yes No. If Yes, how many do have __________
10. In case your school/institution have computers, which of the followings best describe what they are being used for? (you may tick more than one) To support school/institution administrative work To support teaching ( i.e. used for teaching of pupils/students) To access (connect to) the Internet
198
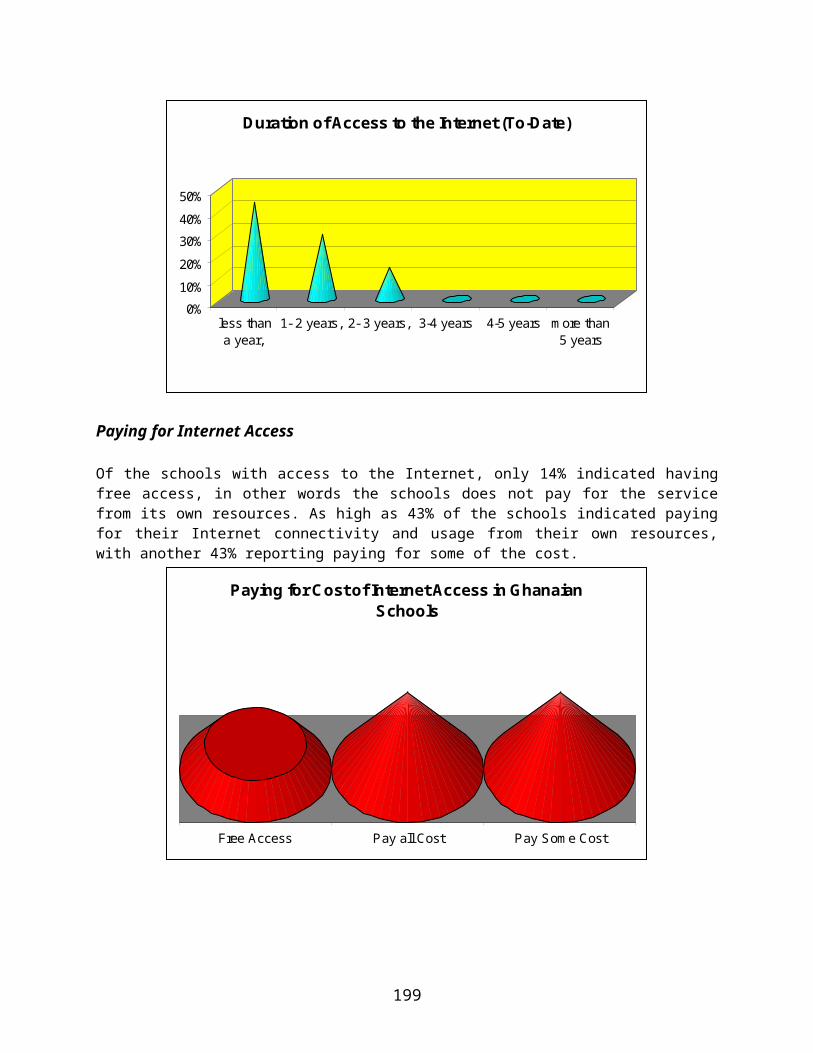
11. For schools/institutions with computers, which of the followings best describe the percentage of your teachers/tutors who use the computers (for teaching, administrative work and/or access to the Internet) 0% (none) below 10% About 25% About 50% About 75 % About 100%
12. For schools/institutions with computers, which of the followings best describe the percentage of your pupils/students who use the computers (for learning and/or access to the Internet) 0% (none) below 10% About 25% About 50% About 75 % About 100%
13. Does any staff member use computers at home? Yes No. If Yes, which proportion of staff use computers at home? below 10% About 25% About 50% About 75 % 100%
199
14. For schools/institutions with computers, please indicate which of the followings best describe your situation: We used to have computers but not any more We currently have computers, and this has been the case for (please tick one): less than a year, 1- 2 years, 2- 3 years, 3-4 years 4-5 years more than 5 years
15. Does your school/institution have access to the Internet? Yes No
16. Does your school/institution have its own Web-site on the Internet? Yes No
17. For schools/institutions with access to the Internet please indicate which of the followings apply? The Internet access is available to only the administration and teaching staff The Internet access is only available to pupils/students The Internet access is available to the administration and teaching staff as well as to pupils/students
18. For schools/institutions with Internet access, please indicate which of the followings best describe the duration of access We used to have access to the Internet but not any more We currently have access to the Internet, and this has been in operation for (please tick one): less than a year, 1- 2 years, 2- 3 years, 3-4 years 4-5 years more than 5 years
19. For schools/institutions with access to the Internet please indicate which of the followings best describe what the Internet is being used for (you may tick more than one) For Electronic Mail (e-mail) For access to the Web (browsing/accessing the Web) For Downloading/Access to educational materials on the Internet Others (please specify) ____________________________________
20. For schools/institutions with access to the Internet, ---- is your access free or does your school/institution pay for the access charges (e.g. telephone charges, monthly payment to Internet Service Providers (ISPs) from its own resources?
We have free access (i.e. we don’t pay for telephone, ISP and other charges) from our own resources We pay for access (telephone and/or ISP charges) from our own (school/institution) resources We pay for some charges. (please specify): _____________________________________
The Ghana SCAN-ICT Questionnaire: A Nation-wide Study Targeting ICT (information and communications technology)/Computer Companies and Establishments [T-CC-
MF02]
200
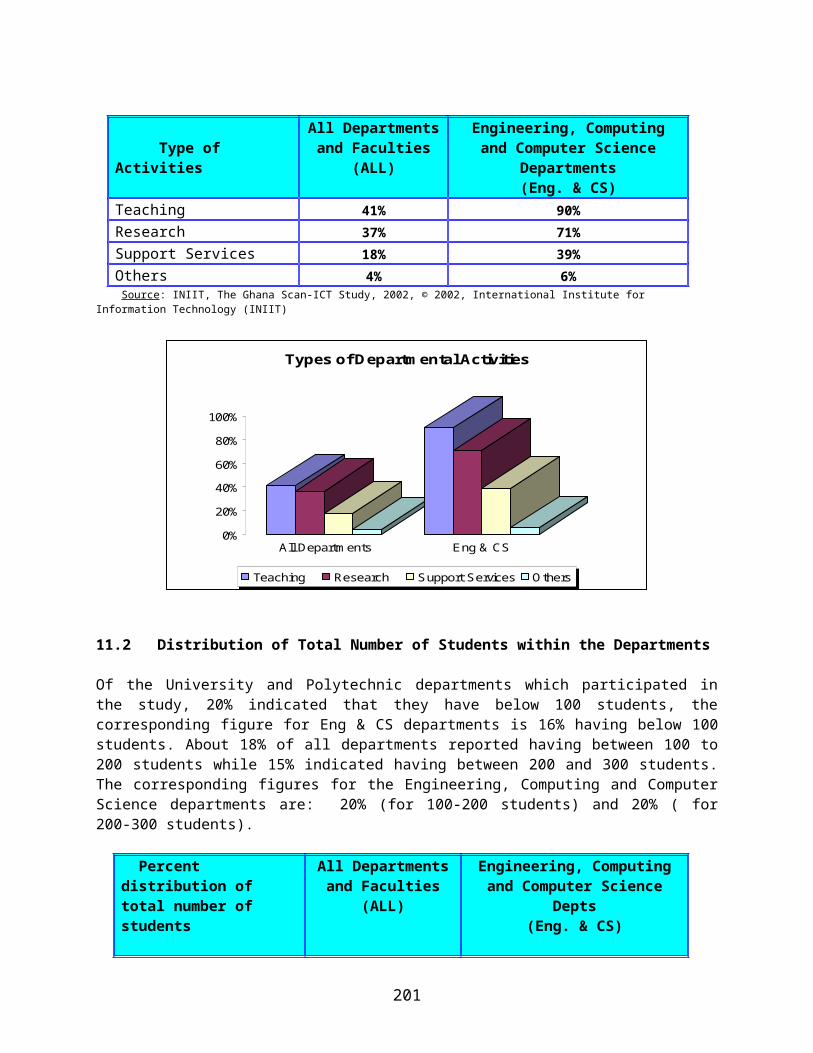
1. Which of the followings best describe the main activities of your establishment? (you may tick more than one) Computer (Hardware) Manufacturer/Assembler Computer (Hardware) Distributor/Retailer Software Developer/Software House Software Distributor/Retailer Peripheral (Hardware) Manufacturer/Assembler Peripheral (Hardware) Distributor/Retailer Others (please specify)___________________________________
2. What is the size of your organization/establishment (in terms of number of staff)? Below 50 50 –100 100-200 200-500 500-1000 Over 1000
3. In which region is your establishment/establishment located? (please tick one):Gt. Accra Region. Ashanti Region Brong Ahafo Region Eastern Region Volta Region Northern Region Western Region Upper West Region Upper East Region Central Region
4. Which of the following customer-based services does your establishment provide? (you may tick more than one) On-site installation (hardware/software) On-site servicing/maintenance (computer system) On-site training (hardware/software) Off-site servicing/maintenance (computer system) Off-site training (hardware/software) Help Desk/Customer Information and Advisory Support Seminars, Demonstrations & Exhibitions
5. What is the distribution of your customer base in terms of the following sectors?Government and Public Sector: below 10% 25% -50% About 50% -75% 75 % - 100%
Corporate Sector: below 10% 25% -50% About 50% -75% 75 % - 100%
Education Sector: below 10% 25% -50% About 50% -75% 75 % - 100%
6. Which of the following factors inhibits the growth of your organization/establishment?
Skill Shortage in the ICT (information and communications technologies) area Size of the Ghanaian Market Lack of Government Incentives for the ICT Sector The level of Computer Literacy/Awareness in the Country Level of home-grown IT (information technology) research and development (R&D) work
201
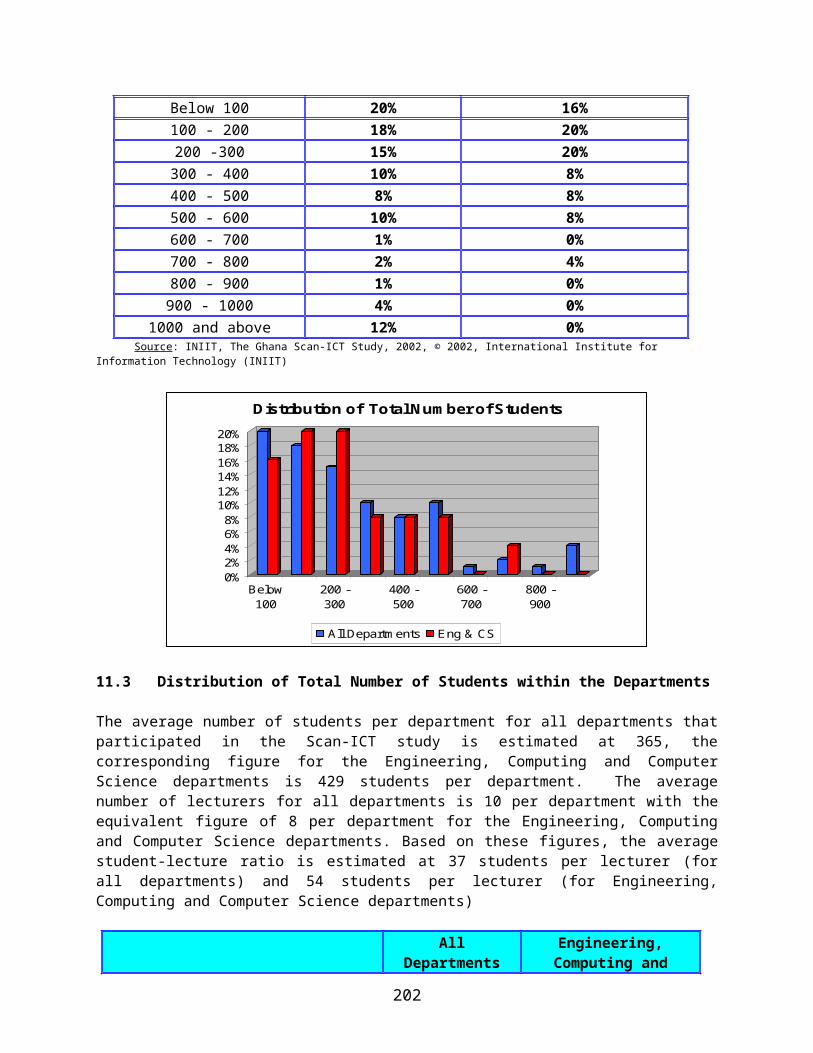
De-incentives like the taxation and import duties on computer products and services
7. Which of the following IT Personnel does your establishment currently employ (you may tick more than one) Programmers Number of Personnel ___________ Software developers Number of Personnel ___________ System analysts Number of Personnel ___________ Computer System managers Number of Personnel ___________ Computer scientists Number of Personnel ___________ Telecommunications specialists Number of Personnel ___________ Network Engineers/Technicians Number of Personnel ___________ Network Managers Number of Personnel ___________ IT trainers Number of Personnel ___________ Others (please specify)___________________________________ Number of Personnel ___________
8. Which of the following staff-retention strategies does your organization/establishment pursue? Stock/Company Share options Benefits in-kind (e.g. car, house/housing allowance, holidays etc) Training opportunities (e.g. in-company training, short courses and training programmes, professional qualification training [e.g. MSCE, Cisco Academy etc]) Others (please specify): _________________________________________________ None
9. Does any staff member use computers at home? Yes No. If Yes, which proportion of staff use computers at home? below 10% About 25% About 50% About 75 % 100%
10. Does your organization/establishment have access to the Internet? Yes No
11. Does your organization/establishment have its own Web-site on the Internet? Yes No
12. For organizations with Internet access, please indicate below which of the followings best describe what the Internet is used for in your establishment (you may tick more than one): For Electronic Mail (e-mail) For access to the Web (browsing/accessing the Web) For Downloading Relevant Materials from the Internet For providing information/publicity about our establishment to the public at large For advertising and/or marketing of our products/services
13. What percentage of your products/services is produced/developed in this country?
202
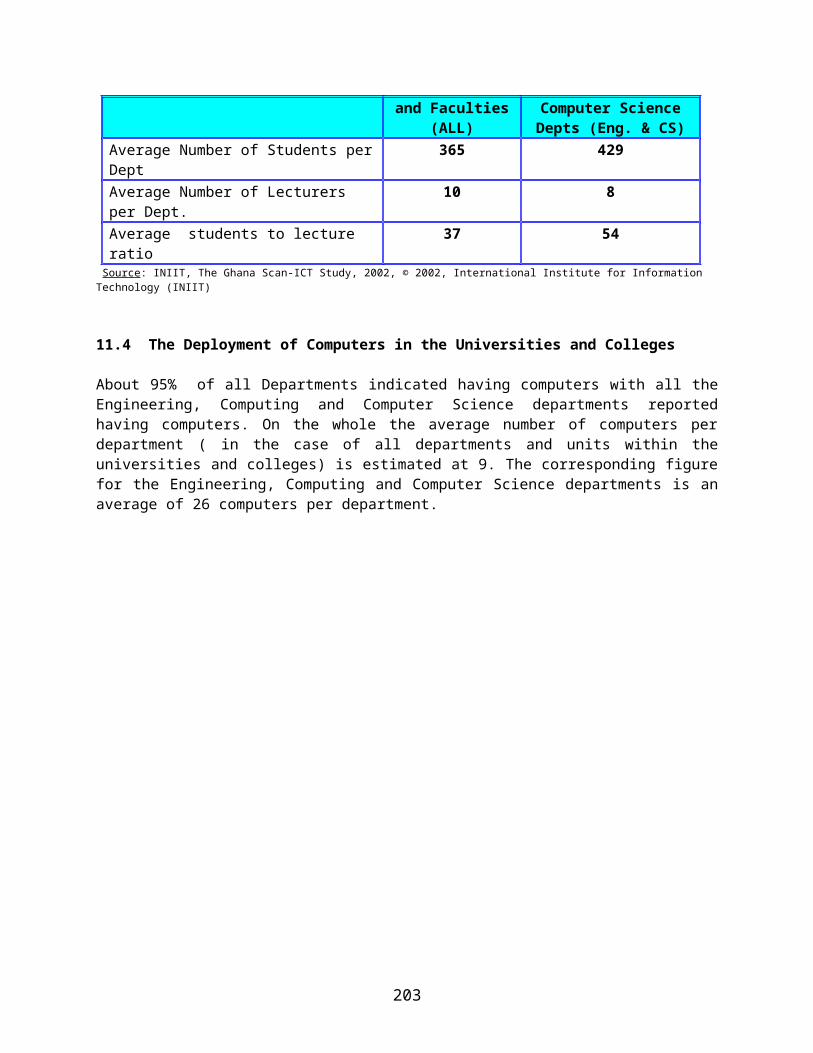
below 10% 10%- 25% 25%-50% 50% -75 % 75%-100%
14. What percentage of your products/services is sold/provided in this country? below 10% 10%- 25% 25%-50% 50% -75 % 75%-100%
15. Is your organization/establishment involve in electronic commerce (e-commerce) ---- i.e. selling its goods or services over the Internet? Yes No
203
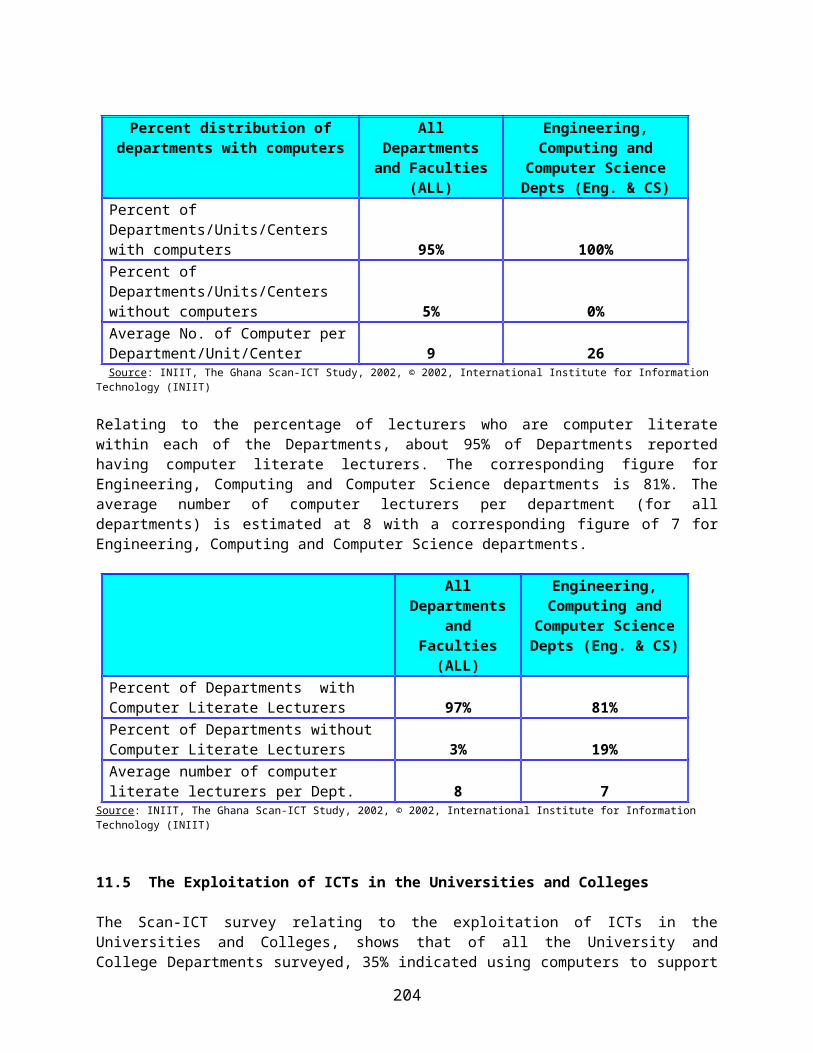
The Ghana SCAN-ICT Questionnaire: A Nation-wide Study on the Deployment and Exploitation of ICTs [information and communications technologies] in the Universities, Polytechnics
& Colleges [T-UP-MF02]
PART I
Note: Part I of the Questionnaire applies to all Departments/Units/Centers within a given Institution.
1. Which of the followings best describe your University/Institution/College? Private institution Public/Government institution Others (please specify): _________________
2. What is the name of your Department/Unit/Center ______________________________________
3. Which of the followings best describe the main activities of your Department/Unit/Center (you may tick more than one)? Teaching Research Support Services (e.g. Library, Computer Center, Registry, etc) Others (please indicate)_________
4. How many students are there in your Department/Unit/Center? ___________ Not Applicable
5. How many lecturers do you have in your Department/Unit/Center? ___________ Not Applicable
6. Does your Dept/Unit/Center have computers? Yes No If Yes how many do you have _______
7. Does your Department/Unit/Center have computer literate lecturers/staff ( i.e. those with basic knowledge in computer and know how to use them)? Yes No. If Yes how many do have __________
8. In case your Department/Unit/Center have computers, which of the followings best describe what they are being used for? (you may tick more than one):
To support administrative work To support teaching (i.e. used for teaching of students) To support research work of only staff To support research work of only students To support research work of staff and students To access (connect to ) the Internet
204

9. For Depts/Units/Centers involve in teaching, is basic computing/computer studies taught as part of your degree/diploma programmes? Yes No
10. For Departments/Units/Centers with computers which of the followings best describe the percentage of your staff who use the computers (for teaching/research/admin work and/or access to the Internet) 0% (none) below 10% About 25% About 50% About 75 % About 100%
11. For Departments/Units/Centers with computers, which of the followings best describe the percentage of your students who use the computers (for learning and/or access to the Internet) 0% (none) below 10% About 25% About 50% About 75 % About 100%12. Does any staff member use computers at home? Yes No. If Yes, which proportion of staff use computers at home? below 10% About 25% About 50% About 75 % 100%
13. Does your Dept/Unit/Center or Institution (as a whole) have its own Web-site on the Internet? Yes No
14. Does your Department/Unit/Center use any type of Educational and Management Information System (EMIS) or software to support its activities Yes No Not Applicable
15. Is your Department/Unit/Center involve in any form of Electronic Distance Education (EDE) to complement or supplement its teaching and training activities Yes No Not Applicable
16. Does your Department/Unit/Center have access to the Internet? Yes No
17. For Depts/Units/Centers with access to the Internet please indicate which of the followings apply? The Internet access is available to only the administration and teaching staff The Internet access is available to only students The Internet access is available to the administration and teaching staff as well as to students
18. For Departments/Units/Centers with Internet access, please indicate which of the followings best describe the duration of access We used to have access to the Internet but not any more We currently have access to the Internet, and this has been in operation for (please tick one): less than a year, 1- 2 years, 2- 3 years, 3-5 years 4-5 years more than 5 years
19. For Departments/Units/Centers with access to the Internet please indicate which of the followings best describe what the Internet is being used for (you may tick more than one)
205
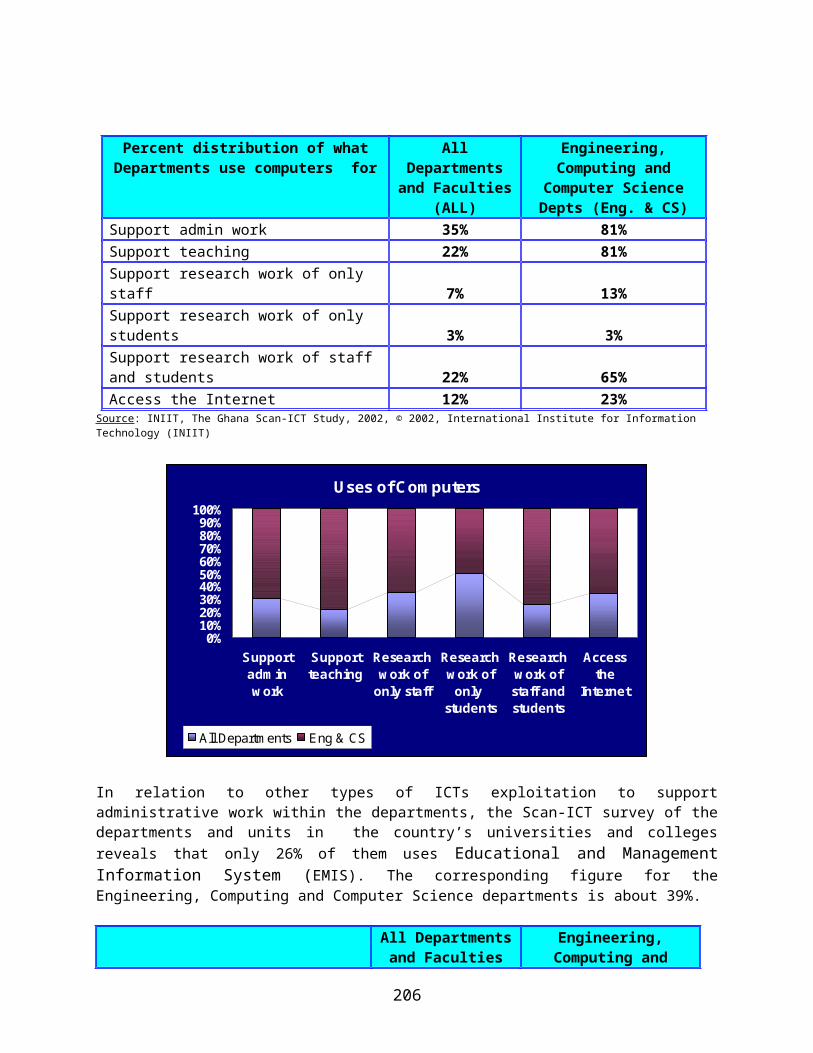
For Electronic Mail (e-mail) For access to the Web (browsing/accessing the Web) For Downloading/Access to educational and/or research materials on the Internet Others (please specify) ____________________________________
20. For Departments/Units/Centers with access to the Internet, ---- is your access free or does your Department/Unit/Center pay for the access charges (e.g. telephone charges, monthly payment to Internet Service Providers (ISPs) from its own resources?
We have free access (i.e. we don’t pay for telephone, ISP and other charges) from our own resources We pay for access (telephone and/or ISP charges) from our own (Dept/Unit/Center) resources We pay for some charges. (please specify): _____________________________________
21. What percentage of the annual budget of your Department/Unit/Center is devoted to ICT-related expenditure (e.g. expenditure on computers, software, training in ICT, maintenance of ICT equipment etc): 0% 1% - 10% 10% -25% 25% -50% 50% - 75% 75% - 100%
206
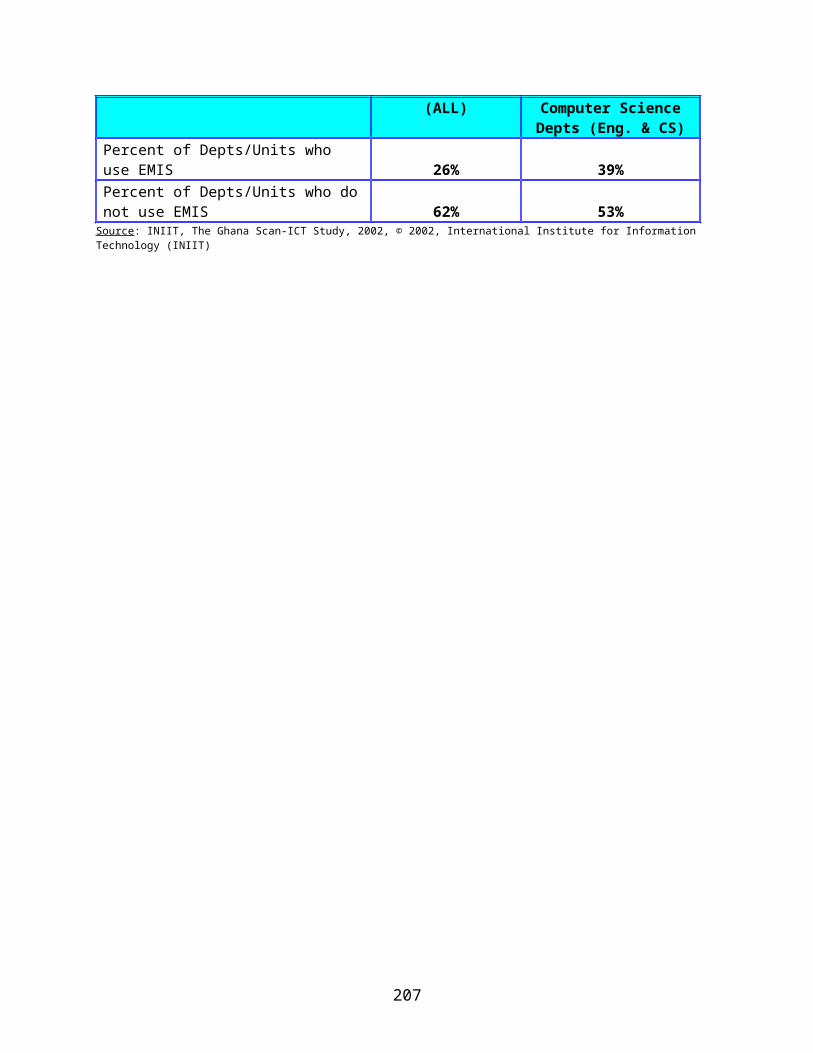
PART II
Note: Part II applies only to Departments/Units/Centers involved in ICT-related education, training and research (for example, the following departments: Computer Science, Information Systems Engineering [Computer, Electronic, Electrical, Mechanical etc], Mathematics, Physics, Chemistry, Statistics, Business Studies/Administration, Economics, Psychology etc)
22. For each of the Undergraduate and Postgraduate Degree/Diploma programmes being administered by your Department/Unit/Center, please indicate the average annual intake in the last FIVE years:
Programme (e.g. BSc Computer Science) Average annual intake in the last 5 Years
23. For each of the Undergraduate and Postgraduate Degree/Diploma level programmes being administered by your Dept/Unit/Center, please indicate the average annual output of graduates in the last FIVE years:
Programme (e.g. BSc Computer Science) Annual output of Graduates in the last 5 Yrs.
24. For each of the Undergraduate and Postgraduate Degree/Diploma level programmes administer by your Department/Unit/Center, please provide an annual forecast of intake in the next FIVE years:
Programme (e.g. BSc Computer Science) Forecast: Annual intake in the next 5 Years
25. For each of the Undergraduate and Postgraduate Degree/Diploma programmes administer by your Department/Unit/Center, please provide an annual forecast of graduates in the next FIVE years:
207
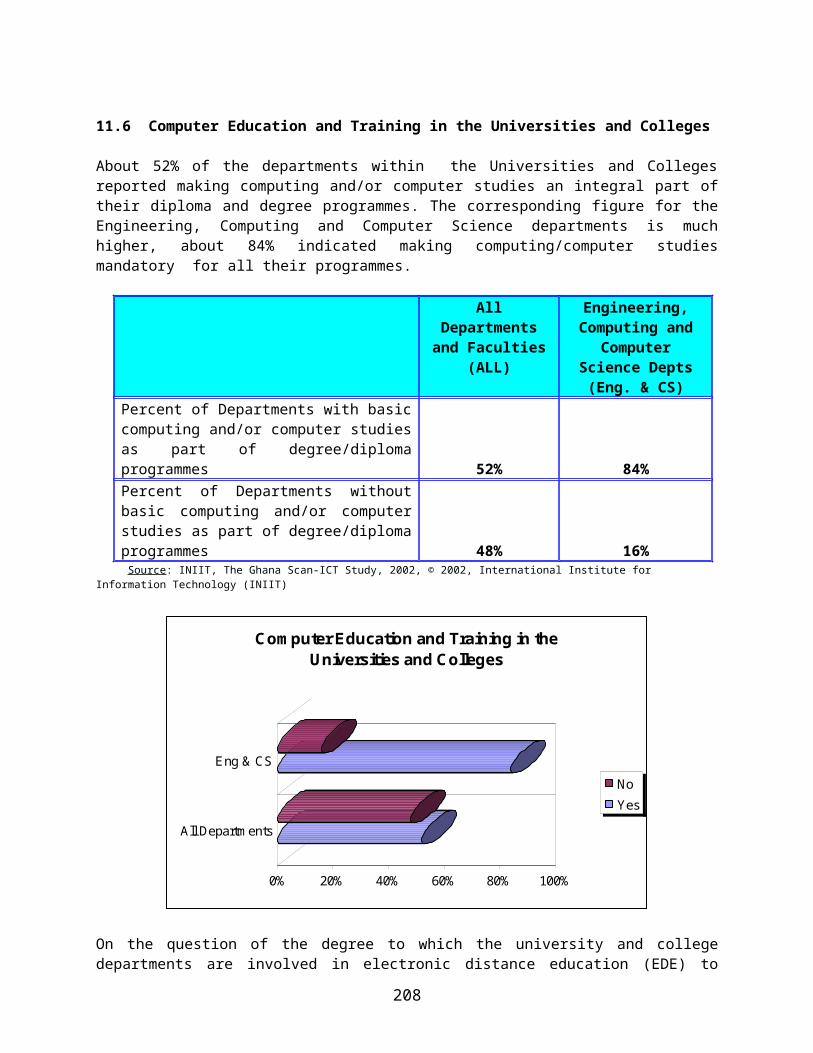
Programme (e.g. BSc Computer Science) Forecast: Annual Output of Graduates in the next 5 Years.
208

The Ghana SCAN-ICT Questionnaire: A Nation-wide Study on the Deployment and Exploitation of ICTs [information and communications technologies] in the Health
Institutions [T-HI-MF02]
1. Which of the followings best describe your Health Institution/Establishment Hospital (Non-Teaching) Teaching Hospital Clinic Health Post/Center Maternity Home 2. Which of the following sectors does your Health Institution/Establishment belong to? (please tick one) Public Sector Private Sector Others (please specify) __________________________________
3. What is the size of your Health Institution/Establishment (in terms of number of staff)? Below 50 50 –100 100-200 200-500 500-1000 Over 1000
4. In which region is your Health Institution/Establishment located? (please tick one):Gt. Accra Region. Ashanti Region Brong Ahafo Region Eastern Region Volta Region Northern Region Western Region Upper West Region Upper East Region Central Region
5. Which of the followings best describe where your Health Institution/Establishment is located Located in a village Located in a town Located in a city (e.g. Accra or Regional Capitals)
6. Does your Health Institution/Establishment use computers to support any of its activities or operations? Yes No. If Yes, please answer the rest of the questions. Thanks
7. Which of the followings best describe your computer system? (please tick one) Standalone Computers (e.g. a number of Personal Computers (PCs) not connected/networked) A Local Area Network (LAN) ---- A number of computers connected/networked in a single building A Backbone (campus/corporate) Network ---- A couple of LANs connected over a number of buildings A Wide Area Network (WAN) ---- A geographically dispersed network connected over a number of geographically spread locations (e.g. towns, cities, regions)
8. Please indicate below the principal use of ICTs in your establishment (you may tick more than one)Telemedicine ApplicationsMedical Research WorkContinuing Medical Education or Distance EducationHealth promotion and awareness
209
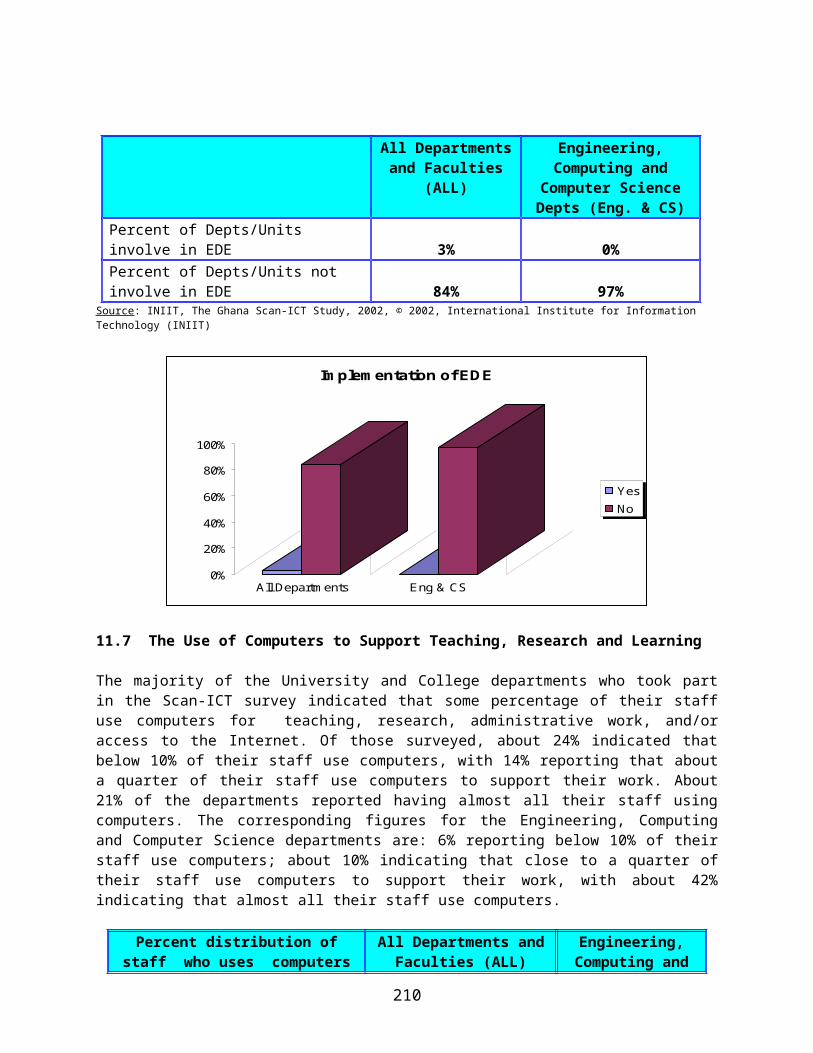
Health-related Database and Information Systems ApplicationsGeneral Administration Work
9. What percentage of the staff of the establishment use computers to support their activities and functions? 0% (none) below 10% About 25% About 50% About 75 % About 100%
10. What percentage of the staff of the entire establishment are computer personnel/staff (e.g. programmers, computer technicians, system analysts, computer network managers and technicians etc)? 0% (none) below 10% About 25% About 50% About 75 % About 100%
11. What percentage of your total organizational expenditure is on information technology [IT] – (including expenditure of computers, software, training of staff in the use of computers etc)? 0% (none) below 10% About 25% About 50% About 75 % About 100%
12. Does any staff member use computers at home? Yes No. If Yes, which proportion of staff use computers at home? below 10% About 25% About 50% About 75 % 100%
13. Does your Health Institution/Establishment have access to the Internet? Yes No
14. What percentage of staff uses the Internet to support their activities and functions in the establishment? 0% (none) below 10% About 25% About 50% About 75 % About 100%
15. Does your Health Institution/Establishment have its own Web-site on the Internet? Yes No
16. Please indicate below which of the followings best describe what the Internet is used for in your Health Institution/Establishment? (you may tick more than one): For Electronic Mail (e-mail) For access to the Web (browsing/accessing the Web) For Downloading Relevant Materials from the Internet For providing information/publicity about our Health Institution/Establishment to the public at large For advertising and/or marketing of our products/services
210
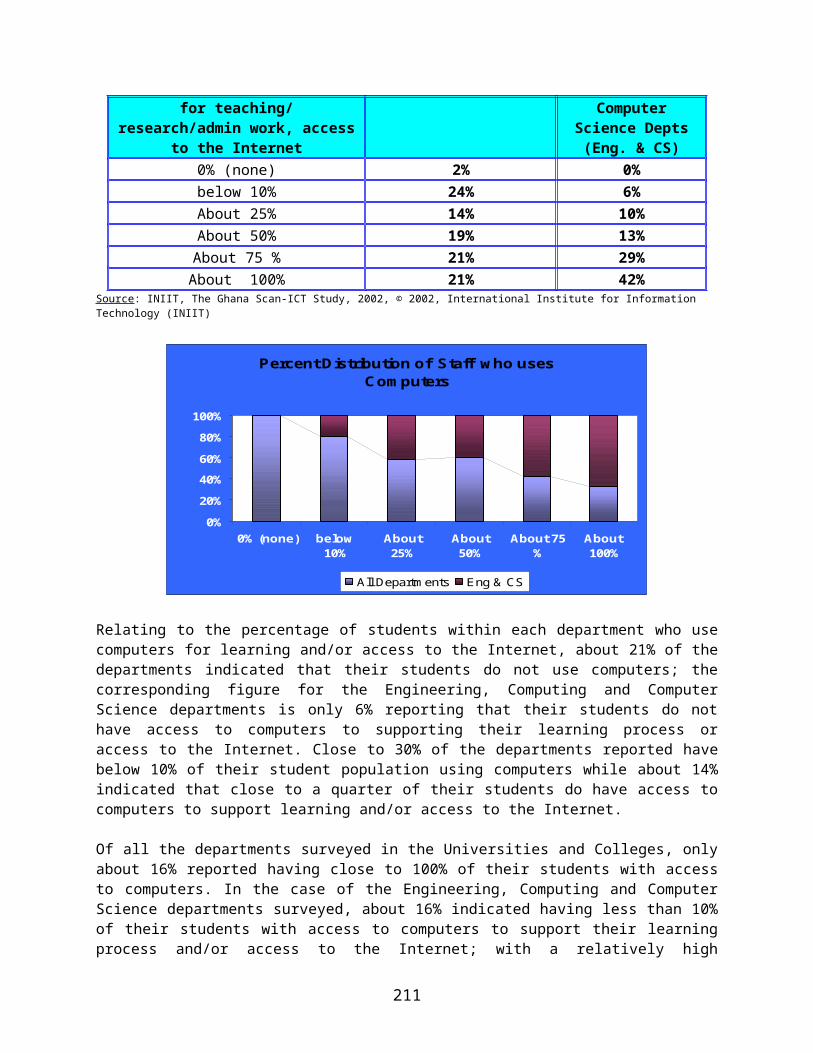
17. Does your Health Institution/Establishment have an IT (information technology) Policy/Strategy or Plan (i.e. a policy and/or strategic plan to guide the deployment and exploitation of computer resources within the organization)? Yes No
18. How will you rate the level of computer resource (hardware, software and applications) utilization in your establishment? below 10% About 25% About 50% About 75 % About 100%
19. Approximately, what percentage of the operations, or activities of your organization are supported by the use of computers? below 10% About 25% About 50% About 75 % About 100%
20. Which of the followings IT-related problem areas (constraints) apply to your establishment? (you may tick more than one): Computer Skill Shortage within the your Institution/Establishment Problem with staff acceptance of computers to support their activities and functions Problem with adjustment to computer systems by the your establishment Computer system installation, implementation and/or maintenance problems Problems relating to after-sales customer support by computer vendors Problems with monitoring new developments in the computer industry/field, because of rapid advances. Problem with proliferation of computer products, --- making it difficult to decide on suitable products High cost of computer products and services Industrial relations problems due to the computerization of our organizational activities or operations
211
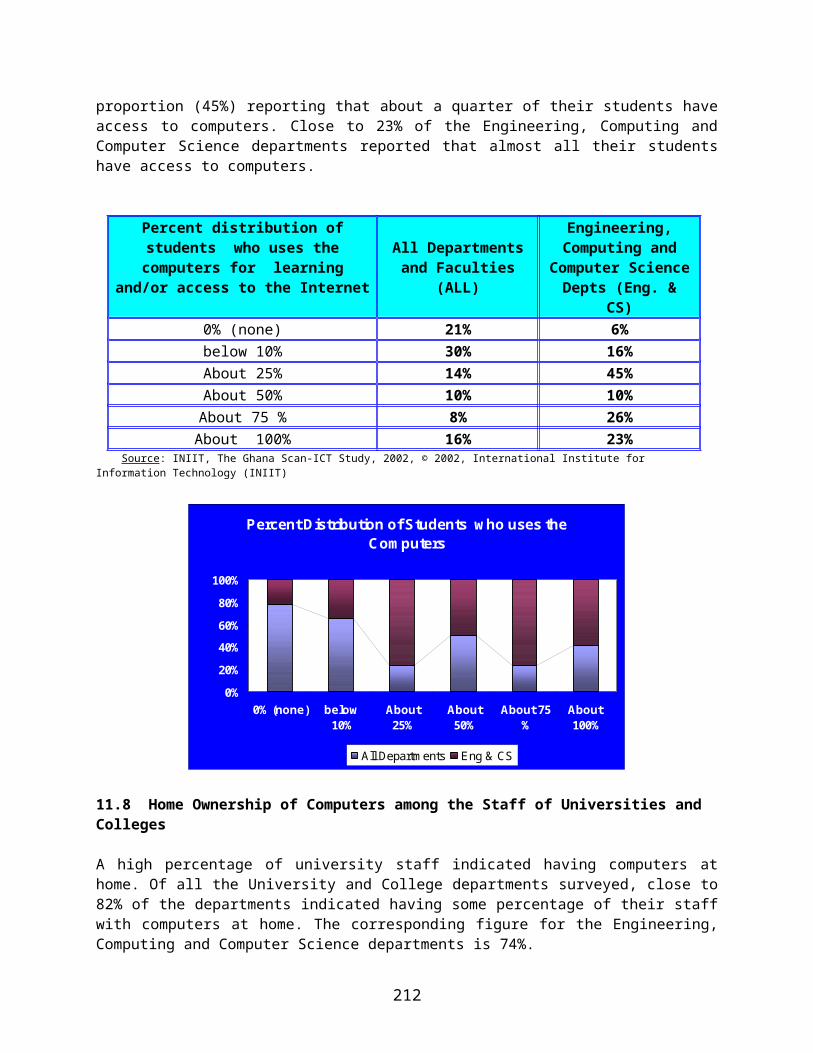
Appendix B: The Ghana SCAN-ICT Network Nodes Team Leaders
Prof. Clement DzidonuSenior Research FellowInternational Institute for Information Technology (INIIT)
Mr. Daniel ObuobiHeadUniversity Computer CenterUniversity of Cape CoastCape, Coast
Dr Andrew DadsonSenior LecturerDepartment of PhysicsKwami Nkrumah University of Science and Technology (KNUST)Kumasi
Mr. Jacob AryeeteyHead Department of Computer ScienceUniversity of GhanaLegon, Accra
Mr. Emmanuel AsamoahLecturerDepartment of Computer ScienceValley View UniversityAccra
Mr. Godfred FrempongSenior Research OfficerCouncil for Scientific and Industrial Research (CSIR)Accra
Mr. Michael AsaManaging DirectorEl-Misa VenturesAccra
Notes:
1. Each Node of the Network apart from the Team Leader also has a number of Team members involve in the SCAN-ICT project.
2. Some of the nodes have sub-nodes (with one or two members) based at sister or neighbouring institutions.
212