british columbia tree fruit industry - bc fruit growers ... tree fruit industry workshop - slides...
TRANSCRIPT

British Columbia Tree Fruit Industry
The road ahead?
Facilitators: Svan Lembke, Ph.D.Lee Cartier, P.Ag.
School of Business

Workshop Agenda9:00 - 9:15 Welcome and introduction
9:16 – 10:30 Summary of research findings
10:31 - 10:45 Refreshments break
10:46 - 11:30 Workgroup discussions – Opportunities and Challenges
11:31 - 12:00 Session debrief and summaries
2

Executive Summary• Economic assessment of financial information across different value
chains & 17 in-depth interviews with industry cluster stakeholders was carried out June – Nov 2016.
• Agriculture is a fundamental part of the Okanagan’s economy although compared to other industries, agricultural product exports are less than imports, despite a claim for exceptional quality that should encourage specialization and trade to new markets.
• Price volatility, product lifecycles, changes in market behaviours are mapped to industry responses and it becomes apparent that change and opportunities are not pro-actively managed.
• A multitude of opportunities are available to the industry and change seems inevitable.
© 2017, Cartier & Lembke 3

2016 Research Design• Confirmation of the current economic structures of the Okanagan
tree fruit value chains:
• Conventional Apples
• Organic Apples
• Cider
• Cherries
• Identification of major obstacles and barriers to growth and innovation in the Okanagan region:
• Internal cluster dynamics
• External drivers of change
Quantitative data sources
Qualitative data sources
© 2017, Cartier & Lembke 4
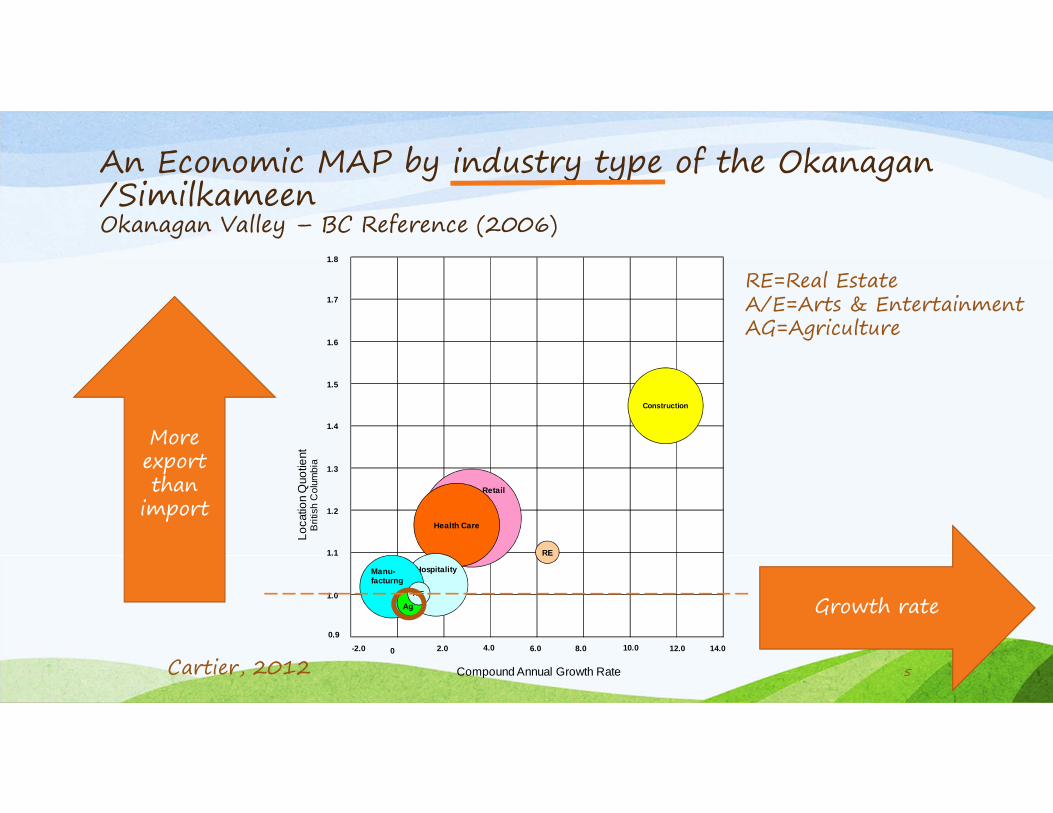
An Economic MAP by industry type of the Okanagan /SimilkameenOkanagan Valley – BC Reference (2006)
Cartier, 2012
Retail
Health Care
Hospitality
Loca
tion
Quo
tient
Brit
ish
Col
umbi
a
Compound Annual Growth Rate
1.0
0.9
1.1
1.2
1.5
1.4
1.3
1.6
0 2.0 4.0 6.0 8.0 10.0 12.0 14.0
Construction
RE
-2.0
1.7
Manu-facturng
Ag
1.8
A/E
More export than
import
Growth rate
RE=Real EstateA/E=Arts & EntertainmentAG=Agriculture
5

Industry Cluster Map Okanagan Valley – BC Reference
Cartier, 2012
Life Sciences
Hospitality & Tourism
Loc
atio
n Q
uotie
ntB
ritis
h C
olum
bia
Compound Annual Growth Rate
1.0
0.9
1.1
1.2
1.5
1.4
1.3
1.6
0 1.0 2.0 3.0 4.0 5.0-1.0
Ag. Products
Only three clustersAg Products Cluster has highest growth potential
6
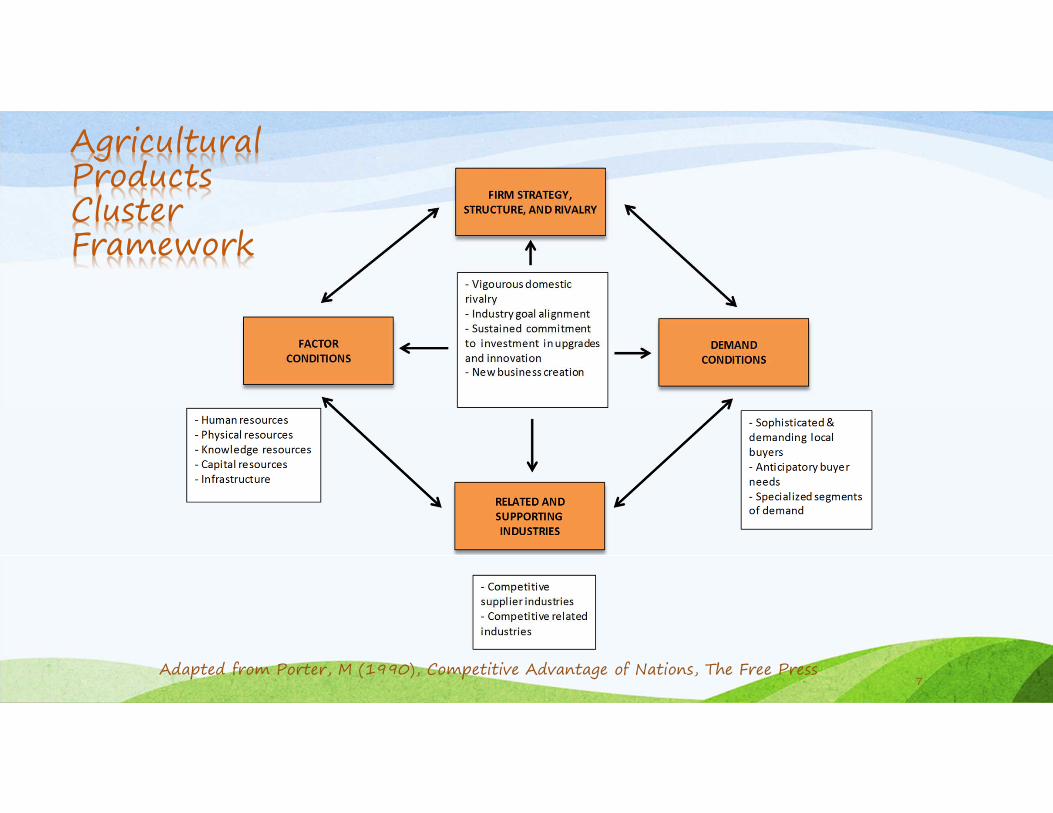
Agricultural Products Cluster Framework
Adapted from Porter, M (1990), Competitive Advantage of Nations, The Free Press7

Agricultural Products Cluster Sectors
1 Farm management services
2 Soil preparation services
3 Irrigation equipment & services
4 Processing and packaging machinery
5 Fertilizers
6 Farm primary products
7 Wine or brandy
8 Milling and refining products
9 Product distribution and wholesale services
10 Malt beverages
11 Specialty processed food products
12 Animal health products
13 Agricultural chemicals (excluding fertilizer)
14 Supplies distribution and wholesaling
15 Related financial services
16 Transportation and logistic services
17 Bulk packaging
18 Other related services
Cartier, 2012: Value Chain Analysis of the British Columbia Wine Industry8

The building blocks of the Agricultural Products industry cluster
• The tree fruit industry value chains
• The wine industry value chain (includes cider)
• Dairy and poultry value chains (north Okanagan)
Fixed land-base for agricultureChanges are on-going and are
influenced by value chain performance
© 2017, Cartier & Lembke 9

Okanagan Tree Fruit Value IndustryAn Industry in Transformation
Acres
2011 2006 2001 CAGR
Apples 8,677 10,005 13,430 -4.3%
Pears 479 602 753 -4.4%
Plums 314 323 311 0.1%
Cherries (sweet) 3,532 2,515 1,930 6.2%
Cherries (sour) 75 147 254 -11.5%
Peaches 1,209 1,387 1,357 -1.1%
Apricots 216 320 433 -6.7%
Grapes 9,515 6,589 4,831 7.0%
Total 24,017 21,888 23,299
© 2017, Cartier & Lembke 10

British Columbia Apple & Cherry Industry Value Chain - 2016
© 2017, Cartier & Lembke 11

British Columbia Cider Industry Value Chain - 2016
© 2017, Cartier & Lembke12

BC Apple Sales Volume, Price, Quality
0.0%
20.0%
40.0%
60.0%
80.0%
100.0%
120.0%
2007 2008 2009 2010 2011 2012 2013 2014 2015
Pe
rce
nt
of
Pa
cke
d C
rop
Apple Quality - Selected Varieties
FCY or better Commercial Cull
0.0
5.0
10.0
15.0
20.0
25.0
30.0
35.0
40.0
45.0
50.0
2007 2008 2009 2010 2011 2012 2013 2014 2015
0.0
50.0
100.0
150.0
200.0
250.0
Do
lla
rs (
mil
lio
ns)
(Po
un
ds
(mil
lio
ns)
BCTF Apple Sales
Apple Sales Pounds Apple Sales Revenue
Volatility in apple prices (partially off-set by government programs)
© 2017, Cartier & Lembke 13

Historic Apple Prices
0.000
0.100
0.200
0.300
0.400
0.500
0.600
2007 2008 2009 2010 2011 2012 2013 2014
$ p
er
Po
un
dApple Prices - Selected Varieties
McIntosh Royal Gala Red Delecious
Honeycrisp Ambrosia Average - All Varieties
Linear (Red Delecious) Linear (Ambrosia)
New apple varieties are needed to keep average price high (lifecycle <20yrs)
© 2017, Cartier & Lembke14

Apple Sales by Geographic Market
0
20,000,000
40,000,000
60,000,000
80,000,000
100,000,000
120,000,000
140,000,000
160,000,000
0.0%
10.0%
20.0%
30.0%
40.0%
50.0%
60.0%
70.0%
80.0%
90.0%
100.0%
2008 2009 2010 2011 2012 2013 2014 2015
Po
un
ds
Pe
rce
nt
Channel Sales Percentage
Apples
Local Canadian U.S. Export Pounds
0.000
0.100
0.200
0.300
0.400
0.500
0.600
0.700
0.800
0.000
0.200
0.400
0.600
0.800
1.000
1.200
1.400
2008 2009 2010 2011 2012 2013 2014 2015
$/p
ou
nd
$/p
ou
nd
Channel Sales $/pound
Apples
Local Canadian U.S. Export Average
Sales process does not seem to follow attractive markets
© 2017, Cartier & Lembke15

17 In-depth Interviews (with innovative stakeholders in the cluster)
12
2
3
Interview sample distribution
Apples Cherries Other
Where is the apple stakeholder’s main focus
and attention?
© 2017, Cartier & Lembke16

Industry Key Success Factors
N Minimum Maximum MeanStd.
Deviation
product_number 14 2 5 3.86 0.864
product_frequency 14 2 5 3.79 0.893
technology_changes 14 2 5 3.86 0.770
distribution_channels 14 3 5 4.07 0.829
competitor_aggression 14 2 5 3.79 0.975
internet_usage 14 1 5 3.50 1.454
local_access 14 2 5 3.64 0.929
External force
© 2017, Cartier & Lembke 17

Focus on Marketing vs Technical Innovation
Focused Primarily on Technical Strength
Technical Somewhat More than Marketing
About Equally Balanced
Marketing Somewhat more than Technical
Focused Primarily on Marketing Strength?
Not a strong focus on marketing
© 2017, Cartier & Lembke18

0
1
2
3
4
Conventional
Apples
Organic Apples Cherries Other
Marketing vs Technical across Value Chains
Focused Primarily on Technical Strength
Technical Somewhat More than Marketing
About Equally Balanced
Marketing Somewhat more than Technical
© 2017, Cartier & Lembke 19

Strategic importance to the business
N Minimum Maximum MeanStd.
Deviation
product_price 14 3 4 3.71 0.469
product_differentiation 14 3 5 4.21 0.802
innovativeness 14 3 5 4.14 0.535
marketing_mix 14 3 5 3.86 0.663
production_process 14 3 5 4.21 0.699
production_costs 14 3 5 4.00 0.679
Internal focus
© 2017, Cartier & Lembke 20

Apple Producer MarginExisting Planting Yields
-3,000
-2,000
-1,000
0
1,000
2,000
3,000
4,000
-0.100
0.000
0.100
0.200
0.300
0.400
0.500
0.600
2007 2008 2009 2010 2011 2012 2013 2014 2015
$ p
er
Acr
e
$ p
er
Po
un
d
Conventional Apple Production
Margin/lb Average cost / Lb Average price/lb Margin/Acre
Average Apple Yield: 30.5 Bins/AcreAverage Organic Yield: 27.5 Bins/Acre
Is this a realistic yield for organic production?
This is the historic yield for conventional production?
© 2017, Cartier & Lembke 21
0
1,000
2,000
3,000
4,000
5,000
6,000
7,000
8,000
9,000
0.000
0.200
0.400
0.600
0.800
1.000
1.200
1.400
2011 2012 2013 2014 2015
$ p
er
Acr
e
$ p
er
Po
un
d
Organic Apple Production
Margin/lb Average cost / Lb Average price/lb Margin/Acre

Apple Orchard Densities
Low density: <400 trees/acMedium density: 401 - 1,000 trees/acHigh density: >1,000 trees/ac
Low 36%
Medium 32%
High 32%
Apple Orchard Densities
Low Medium High Sample Acres
Zone 1 3,754
Zone 2 590 525 331 1,446 2,947
Zone 3 211 174 377 762 1,590
801 699 708 2,208 8,290
Cartier 2014:Source SIR program data22

Apple Production Margin OpportunitiesExisting Yields Compared to Super Spindle Yields
30 Bins/Acre 50 Bins/Acre 75 Bins/Acre
Average price/lb 0.226 0.226 0.226
Average cost / Lb 0.186 0.121 0.088
Margin/lb 0.040 0.105 0.138
Margin/Acre 1,260.87 5,529.22 10,891.13
18%
46%61%
82%
54%39%
100% 100% 100%
0
2,000
4,000
6,000
8,000
10,000
12,000
0%
10%
20%
30%
40%
50%
60%
70%
80%
90%
100%
$ p
er
Acr
e
Pe
rce
nt
of
$ p
er
Po
un
d
Potential Conventional Apple Margins
© 2017, Cartier & Lembke 23
25 Bins/Acre 45 Bins/Acre
Average price/lb 0.626 0.626
Average cost / Lb 0.255 0.200
Margin/lb 0.371 0.426
Margin/Acre 7,415.87 15,322.99
59%68%
41%32%
100% 100%
0
2,000
4,000
6,000
8,000
10,000
12,000
14,000
16,000
18,000
0%
10%
20%
30%
40%
50%
60%
70%
80%
90%
100%
$ p
er
Acr
e
Pe
rce
nt
of
$ p
er
Po
un
d
Potential Organic Apple Margins

Packing and Shipping Cost StructureApples - Existing and Potential Yields
0.0
50.0
100.0
150.0
200.0
250.0
300.0
350.0
400.0
2015 50 Bins/Acre 75 Bins/Acre
Do
lla
rs (
mil
lio
ns)Packinghouse Cost Structure
Income
Cost of sales
Shipping
Labour cost
Materials cost
Apple cost
Overhead
Net sales
Costs indicate little change in sales approach
© 2017, Cartier & Lembke24
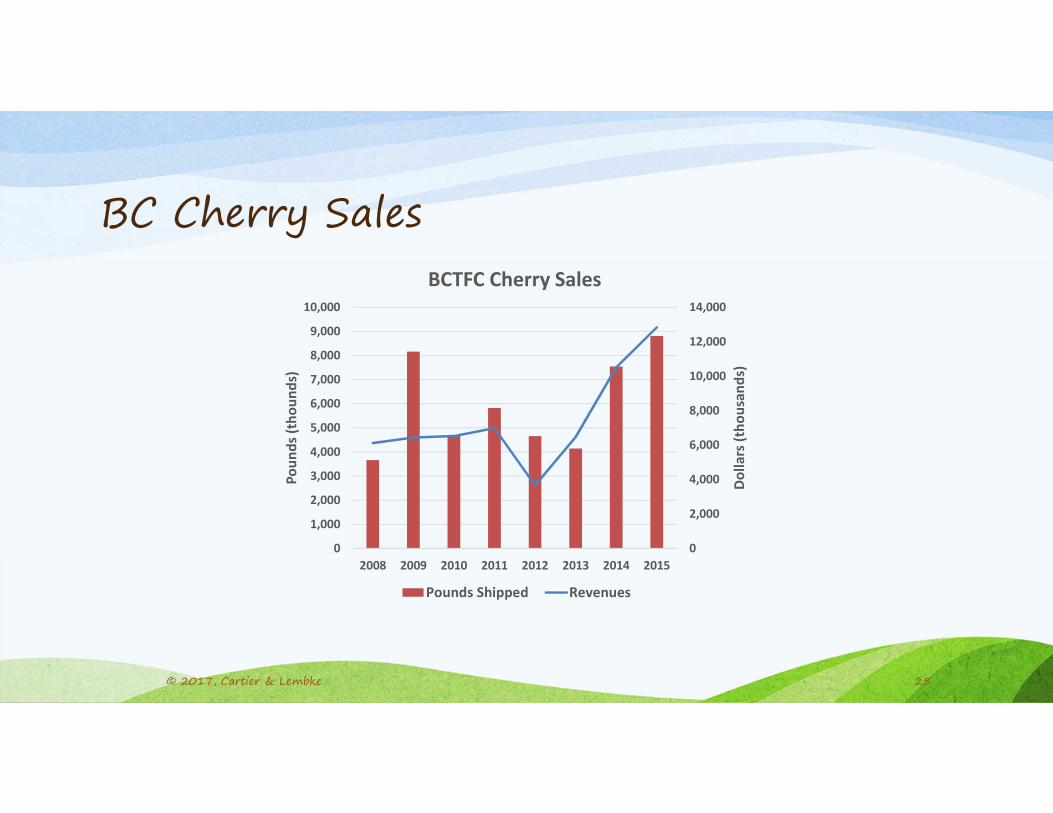
BC Cherry Sales
0
2,000
4,000
6,000
8,000
10,000
12,000
14,000
0
1,000
2,000
3,000
4,000
5,000
6,000
7,000
8,000
9,000
10,000
2008 2009 2010 2011 2012 2013 2014 2015
Do
lla
rs (
tho
usa
nd
s)
Po
un
ds
(th
ou
nd
s)BCTFC Cherry Sales
Pounds Shipped Revenues
© 2017, Cartier & Lembke 25

Cherry Sales by Geographic MarketBCTFC
$0.00
$0.50
$1.00
$1.50
$2.00
$2.50
0.00
0.50
1.00
1.50
2.00
2.50
3.00
3.50
4.00
4.50
2008 2009 2010 2011 2012 2013 2014 2015
$/p
ou
nd
$/p
ou
nd
Channel Sales $/pound
Cherries
Local Canadian U.S. Export Average
0
1,000,000
2,000,000
3,000,000
4,000,000
5,000,000
6,000,000
7,000,000
8,000,000
9,000,000
0.0%
10.0%
20.0%
30.0%
40.0%
50.0%
60.0%
70.0%
80.0%
90.0%
2008 2009 2010 2011 2012 2013 2014 2015
Po
un
ds
Pe
rce
nt
Channel Sales Percentage
Cherries
Local Canadian U.S. Export Pounds
Large independent cherry producers are vertically integrated. In contrast to BCTFC 80% of their crop is exported out of Canada and 20% is sold across Canada
© 2017, Cartier & Lembke26

Cherry Producer Margin
-4,000
-3,000
-2,000
-1,000
0
1,000
2,000
3,000
4,000
-1.00
-0.50
0.00
0.50
1.00
1.50
2.00
2.50
3.00
3.50
2008 2009 2010 2011 2012 2013 2014 2015
$ p
er
Acr
e
$ p
er
Po
un
dCherry Production Margin
Margin/lb Average cost / Lb Average price/lb Margin/Acre
Average Cherry Yield: 12,000 pounds/Acre
An even more volatile market
Are 12-18,000 pounds/acre possible?
© 2017, Cartier & Lembke 27

Cherry Production Margin OpportunitiesExisting Yields Compared to High Density Yields
© 2017, Cartier & Lembke 28
12,000 Lbs/Ac 20,000 Lbs/Ac
Average price/lb 1.232 1.232
Average cost / Lb 0.830 0.658
Margin/lb 0.402 0.574
Margin/Acre 4,821 11,473
33%47%
67%53%
100% 100%
0
2,000
4,000
6,000
8,000
10,000
12,000
14,000
0%
10%
20%
30%
40%
50%
60%
70%
80%
90%
100%
$/A
cre
$/P
ou
nd
Potential Cherry Production Margins

Packing and Shipping Cost StructureCherries
0
5,000
10,000
15,000
20,000
25,000
30,000
35,000
40,000
2015
Do
lla
rs (
tho
usa
nd
s)
Packinghouse Cost Structure
Revenue
Cost of sales
Shipping
Labour cost
Materials cost
Cherry cost
Overhead
Net sales
© 2017, Cartier & Lembke 29

Agricultural Products ClusterCurrent Primary Producer Margins
Vertically Integrated Vineyard and Winery
Red VQA 3.5
Tons/Ac
Red VQA
4.0 Tons/Ac
Wine margin/acre 9,232.58 10,551.52
Grape margin/acre 2,668.17 3,835.91
Total margin/acre 11,900.75 14,387.44
© 2017, Cartier & Lembke 30
5,4
41
12
,52
0 14
,78
5
8,6
02
6,8
96
2,2
38
2,6
53
6,1
23
3,9
47
3,9
47
2,2
46
2,4
51 3,8
41
1,9
87
1,9
87
95
7
7,4
16
4,8
21
2,6
68
96
2
0
2,000
4,000
6,000
8,000
10,000
12,000
14,000
16,000
30 BINS/AC 25 BINS/AC 12,000 LB/AC 3.5 TONS/AC 3.5 TONS/AC
APPLES ORGANIC
APPLES
CHERRIES RED GRAPES WHITE
GRAPES
DO
LLA
RS
PE
R A
CR
E
PRIMARY PRODUCER MARGINS
Revenue Labour cost Materials cost Net
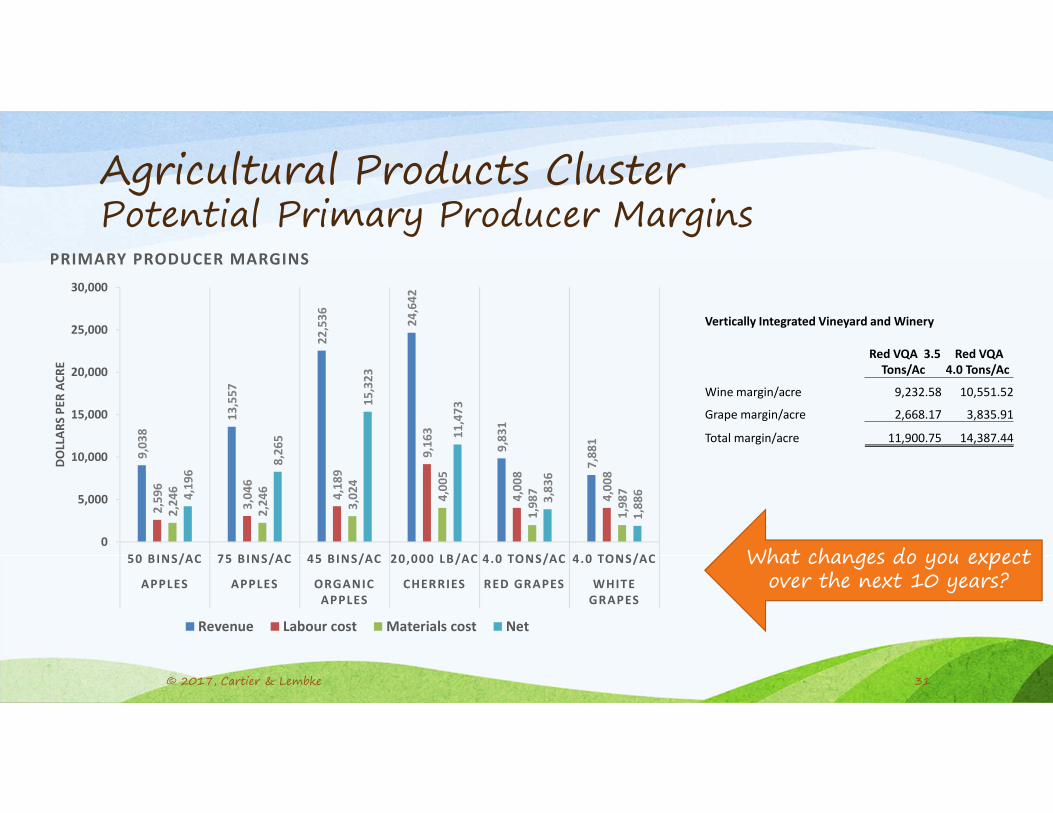
Agricultural Products ClusterPotential Primary Producer Margins
Vertically Integrated Vineyard and Winery
Red VQA 3.5
Tons/Ac
Red VQA
4.0 Tons/Ac
Wine margin/acre 9,232.58 10,551.52
Grape margin/acre 2,668.17 3,835.91
Total margin/acre 11,900.75 14,387.44
What changes do you expect over the next 10 years?
© 2017, Cartier & Lembke 31
9,0
38
13
,55
7
22
,53
6
24
,64
2
9,8
31
7,8
81
2,5
96
3,0
46
4,1
89
9,1
63
4,0
08
4,0
08
2,2
46
2,2
46
3,0
24
4,0
05
1,9
87
1,9
874,1
96
8,2
65
15
,32
3
11
,47
3
3,8
36
1,8
86
0
5,000
10,000
15,000
20,000
25,000
30,000
50 BINS/AC 75 BINS/AC 45 BINS/AC 20,000 LB/AC 4.0 TONS/AC 4.0 TONS/AC
APPLES APPLES ORGANIC
APPLES
CHERRIES RED GRAPES WHITE
GRAPES
DO
LLA
RS
PE
R A
CR
E
PRIMARY PRODUCER MARGINS
Revenue Labour cost Materials cost Net

Strategic Context: Organic Apples
© 2017, Cartier & Lembke 32
Demand Supply?6% of apple production is organic (Washington)
3% of apple production is organic (BC)
Demand meets
supply at 12%
production
Taylor, M & Granatstein, D. (2013) ‘A Cost Comparison of Organic and ConventionalApple Production in the State of Washington’, Plant Management Network.
(10-13% more costly)
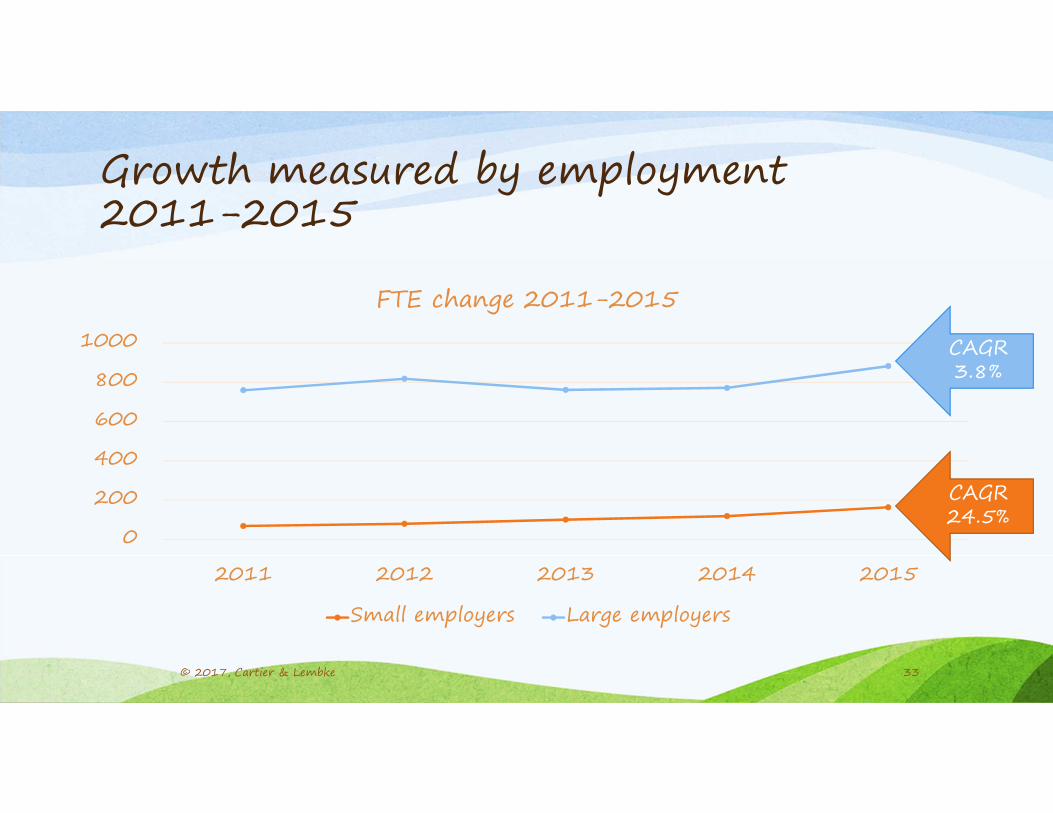
Growth measured by employment 2011-2015
0
200
400
600
800
1000
2011 2012 2013 2014 2015
FTE change 2011-2015
Small employers Large employers
CAGR 24.5%
CAGR 3.8%
© 2017, Cartier & Lembke 33

Small Innovation Moderate Innovation
Radical Innovation Vertical Integration
New Varieties
Small to moderate innovation is most frequent
What kind of growth initiative are we seeing?
© 2017, Cartier & Lembke 34

Defensive, we react to competitor actions or customer demands?
© 2017, Cartier & Lembke35

0
1
2
3
4
5
Conventional
Apples
Organic Apples Cherries Other
Perceived industry prospects
industry_prospects Neither pessimistic nor optimistic
industry_prospects Somewhat optimistic
industry_prospects Very optimistic
?
© 2017, Cartier & Lembke 36

Okanagan Apple Cider
• Wine and Cider Demand
• Price and Per-capita Consumption
• Price and Per-capita Consumption Growth
• Price Elasticity of Demand
© 2017, Cartier & Lembke 37

Wine and Cider Demand
0.00
2.00
4.00
6.00
8.00
10.00
12.00
14.00
16.00
18.00
20.00
11.20 11.40 11.60 11.80 12.00 12.20 12.40 12.60 12.80 13.00
Pe
r C
ap
ita
Qu
an
tity
So
ld (
L)
Price/L
Total Wine
0.00
1.00
2.00
3.00
4.00
5.00
6.00
7.00
8.00
9.00
10.00
3.80 3.90 4.00 4.10 4.20 4.30 4.40 4.50 4.60 4.70 4.80
Pe
r C
ap
ita
Qu
an
tity
So
ld (
L)Price/L
Coolers & Cider
© 2017, Cartier & Lembke 38

Price and Per-capita Consumption
0.00
0.50
1.00
1.50
2.00
2.50
3.00
3.50
4.00
4.50
5.00
1998 2001 2004 2006 2009 2012 2014 2017
$/L
itre
Time
Coolers & Cider Price
0.00
1.00
2.00
3.00
4.00
5.00
6.00
7.00
8.00
9.00
10.00
1998 2001 2004 2006 2009 2012 2014 2017
Pe
r C
ap
ita
Qu
an
tity
So
ld (
L)
Time
Coolers & Cider Consumption
© 2017, Cartier & Lembke 39

Cider Price and Per-capita Consumption
Minimum Maximum Mean SD
Cider Price/L 3.93 4.68 4.38 0.238
Cider Per-capita Consumption (Liters) 5.00 8.78 6.35 0.867
© 2017, Cartier & Lembke 40

Comparison of Price and Per-capita Consumption Growth
CAGR (2000 -2014)
Cider/Cooler Price -0.87%
Total Wine Price 0.61%BC VQA Price 1.62%
Foreign Imports Price 2.29%
CIC Price 1.73%
Beer Price 0.41%
Cider/Cooler Consumption 4.11%
Total Wine Consumption 3.59%BC VQA Consumption 8.46%
Foreign Imports Consumption 2.53%
CIC Consumption 3.20%
Beer Consumption -0.63%
© 2017, Cartier & Lembke 41
Cider is not like wine!
Key to success is marketing
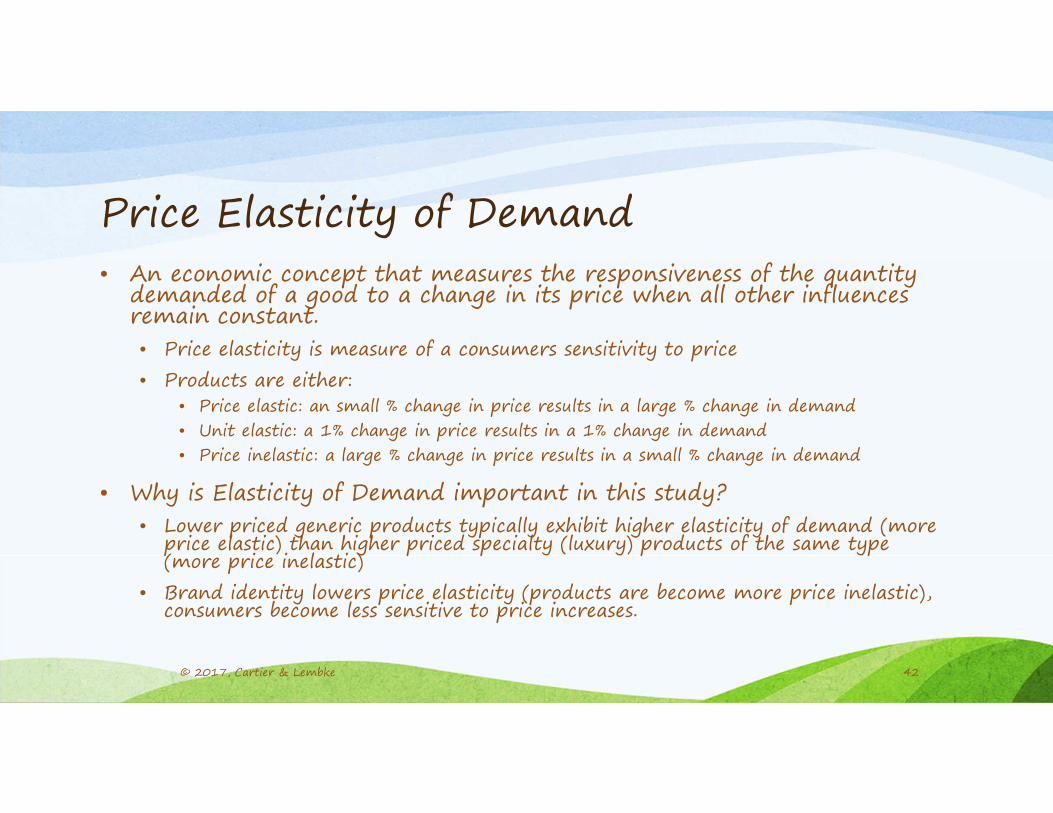
Price Elasticity of Demand• An economic concept that measures the responsiveness of the quantity
demanded of a good to a change in its price when all other influences remain constant.• Price elasticity is measure of a consumers sensitivity to price
• Products are either:• Price elastic: an small % change in price results in a large % change in demand• Unit elastic: a 1% change in price results in a 1% change in demand• Price inelastic: a large % change in price results in a small % change in demand
• Why is Elasticity of Demand important in this study?• Lower priced generic products typically exhibit higher elasticity of demand (more
price elastic) than higher priced specialty (luxury) products of the same type (more price inelastic)
• Brand identity lowers price elasticity (products are become more price inelastic), consumers become less sensitive to price increases.
© 2017, Cartier & Lembke 42
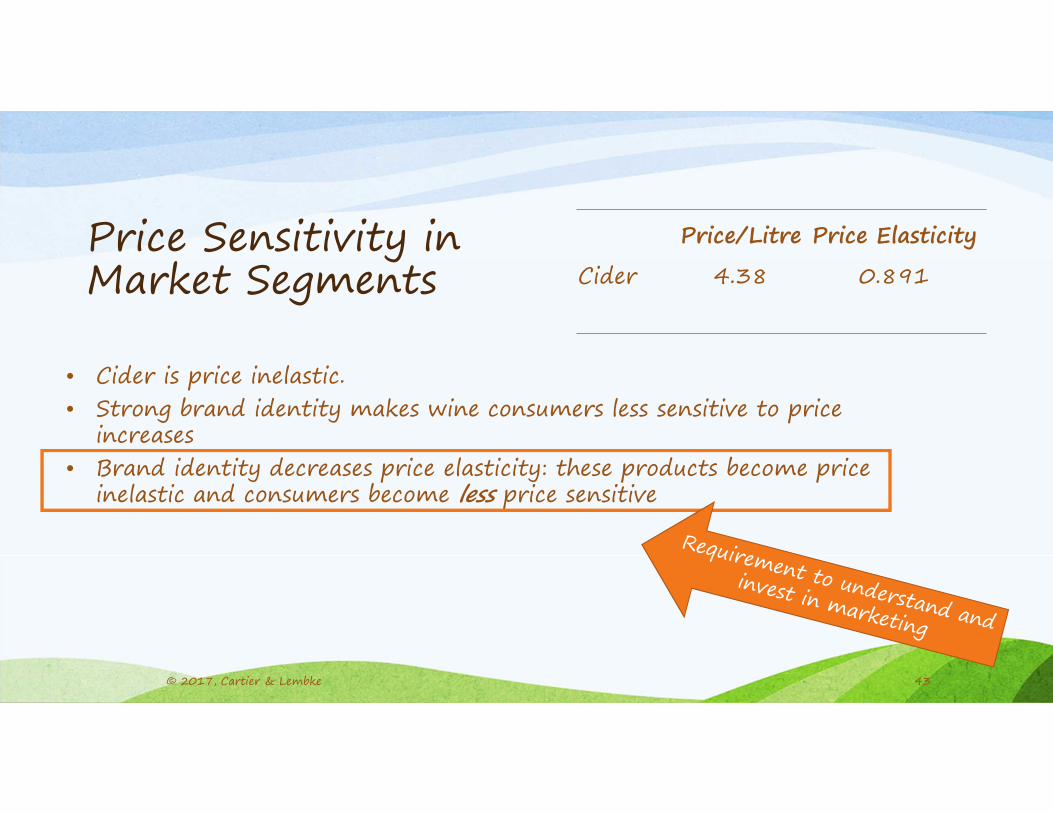
Price Sensitivity in Market Segments
• Cider is price inelastic.• Strong brand identity makes wine consumers less sensitive to price
increases
• Brand identity decreases price elasticity: these products become price inelastic and consumers become less price sensitive
Price/Litre Price Elasticity
Cider 4.38 0.891
© 2017, Cartier & Lembke 43

Together we are strong!
How can the cluster
environment deliver
strength?
© 2017, Cartier & Lembke 44

© 2017, Cartier & Lembke 45
Demand Conditions
(Markets)
Rival Firms
(Exporters)
Support and
Related Industries
(Suppliers)
Factor Conditions
(Foundation Level)
AGRICULTURAL PRODUCTS CLUSTER
Local Market
Cideries
Conventional
Packers &
Shippers
Organic
Packers &
Shippers
Canada International
Cherry
Growers
Farm Management Services
Soil Preparation Services
Irrigation Equipment
Processing & Packaging
Equipment
Fertilizer
Distribution & Wholesaling
ServicesSpecialty manufacttured Food
Products & Services
Agricultural
Chemicals
Related Financial ServicesTransportation & Logistics
Services
Okanagan
College
BCWI &
BCWA
Physical
Infrastructure
Local
Government
BCFGABC LDB &
BC LLC
SR&DC
BC Ministry of
Agriculture
UBCO
Irrigation Services
Provided by local suppliers
Imported into the region
Mixed local and imported
Legend
© 2017 Lee Cartier, Svan Lenbke
Organic Apple
Growers Conventional
Apple Growers
Rest of Canada
CherriesConventional
Apples
Organic
Apples
U.S. China OhersBC Market
Fruit
Processors
Nutraceuticals?
Health?
Other?
CherriesConventional
Apples
Organic
ApplesCider
Fruit
Products

Demand conditions: Which markets are we targeting?
Are we leveraging our
connections and brand
awareness?
© 2017, Cartier & Lembke 46

Importance of Trade Agreements
Not an opportunity for any business in the industry
Potentially an opportunity for the industry but unlikely to be an
opportunity for my business`
Potentially an opportunity for my business if we as a business or the
Canadian government take certain actions
Definitely an opportunity if we as a business or the Canadian
government take certain actions
Definitely an opportunity
Not an opportunity
A significant opportunity and we already have a plan?© 2017, Cartier & Lembke
47

Rival Firms: How well do we work together?
Clusters benefit from spill-over effects of knowledge, innovation and alliances.
© 2017, Cartier & Lembke 48

Support and Related Industries: How well do we work together?
Support and related industry stakeholders are hesitant to grow their business in the Okanagan.
© 2017, Cartier & Lembke 49
Support and
Related Industries
(Suppliers) Cherry
Growers
Farm Management Services
Soil Preparation Services
Irrigation Equipment
Processing & Packaging
Equipment
Fertilizer
Distribution & Wholesaling
ServicesSpecialty manufacttured Food
Products & Services
Agricultural
Chemicals
Related Financial ServicesTransportation & Logistics
Services
Irrigation Services
Provided by local suppliers
Imported into the region
Mixed local and imported
Legend
Organic Apple
Growers Conventional
Apple Growers

Conventional Apples: Sharing of information
There is no sharing of important information
Some of the industry players have in the past shared some important
information
Some of the industry players or associations have in the past shared some
information and have made some joint decisions
Key industry players and associations actively seek each other out to share
information
Limited ‘spill over’ effects
Key industry players and industry associations drive knowledge sharing and industry-wide decision making beyond their own benefits© 2017, Cartier & Lembke 50

Factor Conditions: How well do we work together?
Simple, single-action policy and decision making rarely works for complex market and cluster dynamics.
© 2017, Cartier & Lembke 51

What is our strategy?
Organic apples
Foundations of Strategy (Canadian Edition)’ (2015) R.M. Grant, J. Jordan and P.R.
© 2017, Cartier & Lembke 52

Demand Conditions
(Markets)
Rival Firms
(Exporters)
Support and
Related Industries
(Suppliers)
Factor Conditions
(Foundation Level)
AGRICULTURAL PRODUCTS CLUSTER
Local Market
Cideries
Conventional
Packers &
Shippers
Organic
Packers &
Shippers
Canada International
Cherry
Growers
Farm Management Services
Soil Preparation Services
Irrigation Equipment
Processing & Packaging
Equipment
Fertilizer
Distribution & Wholesaling
ServicesSpecialty manufacttured Food
Products & Services
Agricultural
Chemicals
Related Financial ServicesTransportation & Logistics
Services
BC LDB & BC Ministry of
Irrigation Services
Provided by local suppliers
Imported into the region
Mixed local and imported
Legend
Organic Apple
Growers Conventional
Apple Growers
Rest of Canada
CherriesConventional
Apples
Organic
Apples
U.S. China OhersBC Market
Fruit
Processors
Nutraceuticals?
Health?
Other?
CherriesConventional
Apples
Organic
ApplesCider
Fruit
Products
2 opportunities
2 related opportunities Diversification
Develop new profitable export markets
Build a strong unique brand
Increase yields and maintain quality
Focus on specific ‘quality’ criteria
Lower quality product
management
© 2017, Cartier & Lembke
53

Four potential strategic opportunities for conventional apple production1. Increase the yield per acre with good quality and re-plant new
varieties where possible, and hope for high apple prices and government support programs
2. Focus on the ‘high quality fruit’ brand by removing any lower quality (and cheaper) BC apples from the market (eg into cider production) leaving the lower cost market for imported apples.
3. Follow the cherries and develop export markets for high quality apples as a luxury good.
4. Follow the organic apple producers and build a low pesticide brand for the growing demand of high quality (healthy) fruit
© 2017, Cartier & Lembke 54

Let’s Get to Work: The Workshop Process
• You chose your own group
• Each group will be asked to develop a strategy for one or more of the opportunities identified from the research
• Each groups will present their strategy
• There will be discussion to summarize the strategies and possible next steps
• You will receive a summary of the research and workshop findings
55

Group Discussion: 30 minutes
56
Strategic Opportunity
Increase the yield
per acre with good
quality and re-
plant new varieties
where possible
Desired Outcomes
10 minutesStrategy / Strategies
20 minutes
Present

Four potential strategic opportunities for conventional apple production1. Increase the yield per acre with good quality and re-plant new
varieties where possible, and hope for high apple prices and government support programs
2. Focus on the ‘high quality fruit’ brand by removing any lower quality (and cheaper) BC apples from the market (eg into cider production) leaving the lower cost market for imported apples.
3. Follow the cherries and develop export markets for high quality apples as a luxury good.
4. Follow the organic apple producers and build a low pesticide brand for the growing demand of high quality (healthy) fruit
© 2017, Cartier & Lembke 57
Not all opportunities are mutually exclusive – a combination can be selected

Increase the yield per acre with good quality and re-plant new varieties where possible
• Outcomes (broad differentiation):
• Partnering with retailers for new varieties (input and commitment)
• Increased yield and quality from growers
• Increased prices for consumers (increased returns to the industry)
• Strategies (broad differentiation):
• Industry needs to coordinate their efforts:
• Develop a strategy for uniqueness/differentiation & a plan for execution
• Agree new bi-directional contracts to plant acres & sell specific varieties
© 2017, Cartier & Lembke 58
Workshop Group 1:

Focus on the ‘high quality fruit’ brand by removing any lower quality BC apples from the market
• Outcomes (focused differentiation):
• Increase returns to growers (30c/lb net return; assume no change in production cost)
• Predictable quality from growers (low volumes but high return varieties)
• Strategies (focused differentiation):
• Focus on growing low volume but high return varieties
• Enforce grade segregation with clear standards for quality
• Work with retailers on brand specific programs
• Triple investment in a pro-active sales approach and marketing
© 2017, Cartier & Lembke 59
Workshop Group 2:
Ensure growers are involved and agree on strategy (trigger psychological change)

Follow the cherries and develop export markets for high quality apples as a luxury good
• Outcomes:
• Increase in exports (100% over 3 years)
• Strategies:
• Leverage the Canada brand for food safety
• Cultivate and increase quality of production
• Active marketing and lobbying for government support
• Need international trade expert (hire)
• Send apple representative globally (use Canadian trade commission)
• Work closely with Summerland research station to develop new high quality varieties
© 2017, Cartier & Lembke 60
Workshop Group 3:
Explore opportunities to change property tax policy & subsidy programs to support export strategy

Follow the organic apple producers and build a low pesticide brand for high quality (healthy) fruit
• Outcomes:1. More organic growers (supply 12% of Canadian market with organic apples)
2. Lead the development of organic cherry production (and sales)
3. 10% of conventional apples grown in BC meet IPM standards
4. 50% of Canadian and 100% of Export market know that Canada is #1 in food safety
• Strategies:1. Increased education and ‘active recruitment’ of growers
2. More research on pest management for cherries
3. Develop an IPM standard and credible monitoring / certification
4. Develop a credible food safety rating system and adherence for all stakeholders along the value chain (including retailers)
© 2017, Cartier & Lembke 61
Workshop Group 4:

Conclusion: Evaluation of opportunitiesThere is a multitude of opportunities across the different stakeholder groups and working together will achieve better leverage of resources and increase chance of success.
1. A new strategic approach is needed. The BCFGA can trigger the process but development and execution of the plan will have to be led by the BCTFC and independent growers.
2. A better understanding of new market developments and involvement of the grower community are essential for buy-in and success. This cannot be achieved without industry champions. They have to be identified first!
3. Investment is needed to pursue the opportunities, especially for better marketing of BC tree fruits. Much of this investment may come from government but only when offering a clear focus and commitment to a plan. Our next step has to be a collaborative development of this plan.
© 2017, Cartier & Lembke 62