britain's fiscal squeeze: the choices ahead
TRANSCRIPT


Britain’s fiscal squeeze: the choices ahead
by Robert Chote, Rowena Crawford, Carl Emmerson and Gemma Tetlow
Institute for Fiscal Studies1
1. Introduction The economic and financial crisis that has unfolded over the last two years has caused a dramatic deterioration in the UK’s public finances, with public sector borrowing set to peak this year at a level not seen since the Second World War and public sector indebtedness set to climb to levels not seen since the late 1960s. The crisis and its consequences for the public finances have prompted a two-pronged fiscal response by the Government, announced in PreBudget Report 2008 and Budget 2009: • a shortterm fiscal stimulus package, taking effect in 2008–09 and 2009–10, designed to help limit the depth and duration of the recession, followed by; • a longterm fiscal tightening, starting in 2010–11 and increasing in size until 2017–18, designed to return government borrowing to a sustainable level and to halt and then begin to reverse the large increase in public sector indebtedness. To date the Government has sketched out only the broad outlines of the proposed tightening, and most of this is couched in terms of “projections” rather than firm plans. With the next general election less than a year away, the Government and the main opposition parties alike will be under pressure to offer more detailed proposals to repair the public finances. This process may begin during this year’s party conferences, with the Government then due to publish new official forecasts and projections in its PreBudget Report 2009 later in the year. This note discusses some of the key questions all the parties will have to grapple with: • How big will the fiscal tightening need to be? (Section 2)
• When should it start? (Section 3)
• How rapidly should it be completed? (Section 3)
• How should the pain be spread between tax increases, cuts in planned spending on public services and cuts in projected welfare payments? (Section 4)
• What specific measures could the parties opt for? (Section 4) A brief conclusion is provided in Section 5. We do not seek to give definitive answers to these questions, some of which are political judgements as much as economic ones. Rather we aim to set out the key choices and constraints 1 We are grateful to the ESRC-funded Centre for the Microeconomic Analysis of Public Policy at IFS (grant number RES-544-28-5001) for funding this project. Any errors are the responsibility of the authors alone.

2
that the parties face in deciding what they would wish to do, based on the Treasury’s own assessments of the outlook for the public finances. 2. The fiscal consequences of the crisis
2.1 The Treasury’s assessment in Budget 2009 In assessing how big the fiscal tightening might need to be, we need first to look at the scale of the problem it is designed to address. Put simply: as a result of the crisis the Treasury has increased its estimate of the amount it would need to borrow to bridge the gap between its spending and tax revenues when the economy has fully recovered by around 6.4% of national income (or roughly £90 billion a year in today’s terms) between Budget 2008 and Budget 2009. Left unaddressed for too long, an increase in the structural budget deficit of this size would see the burden of government debt and interest payments increase rapidly to unsustainable levels. As we shall see, the tightening proposed by the Government in PreBudget Report 2008 and Budget 2009 is designed to offset this extra structural borrowing from 2017–18 onwards, putting debt on course to return (eventually) to its pre-crisis level. But why has the Treasury increased its estimate of the underlying structural budget deficit so dramatically in the space of just a year? The largest single factor is its belief that from 2010–11 onwards the productive potential of the economy – the amount of goods and services that we can produce without pushing up inflation – is going to be around 5% lower each year than it had assumed in Budget 2008. It also assumes that the stock market, the housing market and prices for goods and services across the economy will be lower each year going forward than it had assumed in Budget 2008. These, and other factors, permanently reduce the amount of tax receipts that the Treasury can hope for and raise the expected level of public spending as a share of national income. The Treasury argues that some of the assumptions that it has promised to use in its public finance forecasts may mean that Budget 2009 overstates the deterioration in the structural budget deficit. For example, the forecasts assume that the impact of any short-term increase in VAT debts as a result of companies’ cash flow problems will persist even after the economy recovers – and presumably after those cash flow problems ease. Similarly, the forecasts are constrained to assume that unemployment rises over the next couple of years in line with the average of independent forecasts, but then does not fall thereafter. The underlying deterioration in the structural budget balance between Budget 2008 and its latest forecasts in Budget 2009 is illustrated in Figure 2.1. This shows what the Treasury would have expected to borrow each year between now and 2017–18, if it had announced no policy changes in either PreBudget Report 2008 or Budget 2009 – in other words if it had announced neither the short-term stimulus nor the projected tightening.

3
Figure 2.1: Deterioration in Treasury borrowing forecasts between Budget 2008 and Budget 2009, excluding impact of new policy measures.
Source: Authors’ calculations based on figures in HM Treasury, Pre-Budget Report 2008 and HM Treasury, Budget 2009.Impact of new policy measures announced or confirmed in those two statements ignored. We start with the Treasury’s forecasts from Budget 2008. These show public sector net borrowing falling from a peak of less than 3% of national income last year (2008–09) to 1.3% of national income in 2012–13. Some of this borrowing was thought by the Treasury to reflect cyclical borrowing – i.e. the normal impact of expected temporary weakness in the economy – with the remainder being structural borrowing. Of the 1.3% of national income Budget 2008 forecast for borrowing in 2012–13 0.1% of national income was projected to represent cyclical borrowing with the remaining 1.2% of national income representing structural borrowing. Therefore we assume that borrowing would have persisted at 1.2% of national income from 2013–14 onwards. On top of this baseline we can add the additional need for borrowing identified by the Treasury a year later that is not explained by the normal impact of an economic downturn of the magnitude estimated by the Treasury. This is marked in Figure 2.1 as “extra structural borrowing” and it amounts to 7.4% of national income in 2010–11, but then falls back to 6.4% of national income. The small part of this extra structural borrowing that is temporary (in other words, the difference between 7.4% and 6.4%) reflects the Treasury’s belief that the public finances will bounce back by more than would normally be expected given their forecasts for economic growth. This is not surprising: indeed it might well be unduly pessimistic to assume that all of the extra borrowing not explained by temporary weakness in the economy will persist, given that the recession has been associated with considerable turmoil in both the financial sector and the housing market. Finally we can add the additional “cyclical” borrowing identified by the Treasury. This reflects the temporary weakness of tax revenues and temporary additions to social security spending while the economy is running below the Treasury’s new estimate of full productive potential. The Treasury predicts that cyclical borrowing in total will peak at 2.8% of

4
national income in 2010–11 and fall to 1.2% of national income in 2013–14. We assume that it will continue to shrink steadily thereafter and will disappear altogether by 2016–17.2 The Treasury’s forecasts published in Budget 2008 implied that, taking into account policies announced up to that point, public sector net borrowing would have peaked at 2.9% of national income in 2008–09, implying that public sector net debt would peak at 39.8% of national income in 2010–11 and then fall – as shown in Figure 2.2. To produce a forecast for the path of debt under Budget 2008 policies beyond 2012–13, we have assumed that the Treasury was right in its assumptions about the long-term growth rate of the economy and the long-term rate of whole economy inflation (and made an assumption about the rate of interest at which the Government can borrow – see note to Figure 2.2). However, as Figure 2.1 shows, the latest Treasury analysis now implies that in the absence of any policy measures in PreBudget Report 2008 and Budget 2009 the Government would have found itself on course to run a budget deficit of almost 8% of national income indefinitely. As we can see in Figure 2.2, and making the same assumptions mentioned above, this additional structural borrowing would see Government debt rising unsustainably, rather than remaining below 40% of national income if we were to extend the forecasts in Budget 2008. Adding the additional cyclical borrowing shown in Figure 2.1 pushes the debt path higher, as does adding the Treasury’s tentative estimate that its bank rescues and other financial interventions will eventually cost taxpayers up to £50 billion (3½% of current national income). But the impact of these two latter factors is modest, relative to the implications of the assumed increase in the structural deficit.
2 Budget 2009 assumes that activity in the economy will still be running 1.2% below full productive potential in the last year of its forecasting horizon in 2013–14. We assume that this spare capacity falls to 0.6% in 2014–15 and is exhausted in 2015–16 with the cyclical deficit then disappearing the following year in line with the Treasury’s usual rule of thumb: see page 18, table 2.K of S. Farrington, J. McDonagh, C. Colebrook and A. Gurney, Public finances and the cycle, Treasury Economic Working Paper 5, November 2008 (http://www.hm-treasury.gov.uk/prebud_pbr08_publicfinances.htm).
5
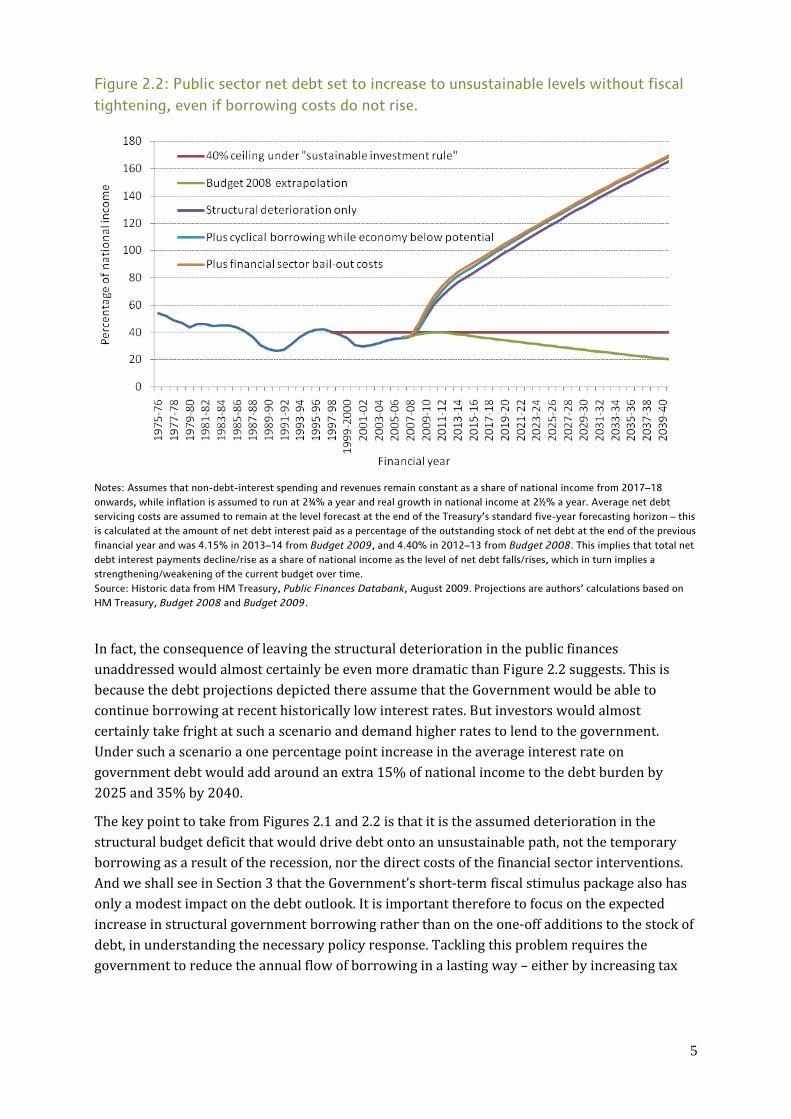
Figure 2.2: Public sector net debt set to increase to unsustainable levels without fiscal tightening, even if borrowing costs do not rise.
Notes: Assumes that non-debt-interest spending and revenues remain constant as a share of national income from 2017–18 onwards, while inflation is assumed to run at 2¾% a year and real growth in national income at 2½% a year. Average net debt servicing costs are assumed to remain at the level forecast at the end of the Treasury’s standard five-year forecasting horizon – this is calculated at the amount of net debt interest paid as a percentage of the outstanding stock of net debt at the end of the previous financial year and was 4.15% in 2013–14 from Budget 2009, and 4.40% in 2012–13 from Budget 2008. This implies that total net debt interest payments decline/rise as a share of national income as the level of net debt falls/rises, which in turn implies a strengthening/weakening of the current budget over time. Source: Historic data from HM Treasury, Public Finances Databank, August 2009. Projections are authors’ calculations based on HM Treasury, Budget 2008 and Budget 2009. In fact, the consequence of leaving the structural deterioration in the public finances unaddressed would almost certainly be even more dramatic than Figure 2.2 suggests. This is because the debt projections depicted there assume that the Government would be able to continue borrowing at recent historically low interest rates. But investors would almost certainly take fright at such a scenario and demand higher rates to lend to the government. Under such a scenario a one percentage point increase in the average interest rate on government debt would add around an extra 15% of national income to the debt burden by 2025 and 35% by 2040. The key point to take from Figures 2.1 and 2.2 is that it is the assumed deterioration in the structural budget deficit that would drive debt onto an unsustainable path, not the temporary borrowing as a result of the recession, nor the direct costs of the financial sector interventions. And we shall see in Section 3 that the Government’s short-term fiscal stimulus package also has only a modest impact on the debt outlook. It is important therefore to focus on the expected increase in structural government borrowing rather than on the one-off additions to the stock of debt, in understanding the necessary policy response. Tackling this problem requires the government to reduce the annual flow of borrowing in a lasting way – either by increasing tax

6
revenues or reducing spending as a share of national income – and not just to seek one-off reductions in the level of debt. 2.2 How might the Treasury’s views change in Pre-Budget Report 2009? The picture we have painted so far is based on the Treasury’s own most recent forecasts, published in Budget 2009 in April. How might its assessment of the fiscal impact of the crisis change when it publishes PreBudget Report 2009 later in the year? The deterioration in the structural budget deficit The Treasury could revise its assessment of the underlying deterioration in the structural budget deficit. As discussed in the previous section between Budget 2008 and Budget 2009 the Treasury increased its estimate of the amount it would need to borrow to bridge the gap between its spending and tax revenues when the economy has fully recovered by around 6.4% of national income (or roughly £90 billion a year in today’s terms). More recently Vince Cable MP, the Liberal Democrat deputy leader and shadow chancellor, has stated he believes “a reasonable assumption is that a correction of around 8 per cent of GDP required”.3 The Treasury has already increased its estimate of the loss of productive potential in the economy from the crisis from 4% of pre-crisis levels in PreBudget Report 2008 to 5% in Budget 2009 and it could refine that judgement again. Previous Treasury analysis suggests that every 1% reduction (increase) in the productive potential of the economy would increase (reduce) the structural budget deficit by 0.7% of national income.4 Conceivably, the Treasury might also revise (either downwards or upwards) its estimate of the likely future trend growth rate of productive potential, which it has so far assumed will not be affected by the crisis. Such a change would have a growing impact on the structural budget deficit over time as the difference between the new and the old estimate of productive potential would gradually increase. The Treasury’s assessment of the underlying deterioration in the structural budget balance will also be affected by the extent to which changes in the level of the stock market and property market between Budget 2009 and PreBudget Report 2009 differ from what has been assumed in drawing up the public finance forecasts. The Treasury assumes that share prices move in line with its projection for the cash value of national income (money GDP). At the time of the Budget the FTSE All-Share Index was at 2,097, while money GDP was forecast to fall slightly (from £1,439 billion in 2008–09 to £1,412 billion in 2009–10). However the FTSE All-Share Index is now around 2,600, almost one quarter higher than its level at the time of the Budget, and therefore represents a sharp increase relative to that assumed in the Treasury’s public finance forecasts. This increase in equity prices will boost revenues from stamp duty on shares, corporation tax, capital gains tax and inheritance tax, with the Treasury estimating that each 1% change in equity prices changes receipts by around £100 million.5 Therefore the increase in the FTSE All-Share Index since Budget 2009 might on its own 3 V. Cable, Tackling the fiscal crisis: A recovery plan for the UK, 15th September 2009, London: Reform (http://www.reform.co.uk/LinkClick.aspx?fileticket=RQ0obqjHA9A%3d&tabid=118). 4 See Farrington, et al. op cit. 5 See Table C2, Page 227, of HM Treasury, Budget 2009.

7
lead the Treasury to reduce its estimate of the structural deficit by just below 0.2% of national income. The Budget also assumed that the number of unemployed people claiming Jobseekers’ Allowance would remain at 2.44 million in the long term, this being the average of independent forecasts made in April for the end of 2010. The latest average forecast (made in August) is for claimant unemployment to stand at 2.16 million at the end of 2010.6 A previous (and now somewhat out-of-date) Government estimate suggested that every 100,000 additional unemployed increased benefit expenditure by around £½ billion.7 Therefore the fact that the average of independent forecasters for the end of 2010 is now 0.28 million below its level at the time of the Budget could reduce the Treasury’s forecast for the structural deficit by about 0.1% of national income. Finally information on receipts, spending and borrowing by the Government in the year-to-date could lead to the Treasury revising its estimate of the structural budget deficit. Over the first four months of this financial year the data suggest that central government receipts have grown less quickly than the Treasury forecast for the year as a whole, whereas central government spending has broadly grown in line with the Budget projection. As a result public sector net borrowing over the first four months of the financial year have been three times higher than the same period last year, whereas the Treasury expects borrowing over the whole of this financial year to be twice last year’s level. This is a greater disparity than could be explained simply by the unexpected weakness of economic activity over the past few months, but there remain good reasons to expect that revenues will perform more strongly over the remainder of this financial year, in particular in the first quarter of 2010, as the temporary cut in the main rate of VAT is scheduled to end on the 31st December 2009.8 This should reverse at least some of the undershoot in revenues relative to the Budget forecast for the year as a whole. To summarise, recent trends in unemployment and equity markets would on their own suggest that the deterioration in the structural budget deficit since Budget 2008 might be slightly smaller than the Treasury thought in Budget 2009. Conversely, the fact that borrowing has increased more quickly so far this year than Budget 2009 predicted for the year as a whole suggests that the deterioration could be slightly larger. On balance, there is no obvious reason to expect the Treasury to take a very different view of the size of the overall structural deficit in PreBudget Report 2009 to that which it took in Budget 2009. The additional cyclical borrowing during the recession The economy shrank more sharply during the first half of the year than the Treasury anticipated, leading many independent forecasters to argue that the Budget 2009 forecasts for economic growth over the next couple of years are now overoptimistic. If the Treasury was to revise its Budget 2009 forecasts for economic growth, this would (assuming its estimate of productive capacity was unchanged) alter its forecasts for the amount of spare capacity in the economy and in turn require changes in its forecasts for the cyclical component of public sector net borrowing. 6 This, and previous vintages, are available at http://www.hm-treasury.gov.uk/data_forecasts_index.htm. 7 Source: Department of Social Security, Departmental Report 1999. 8 For further analysis of these data see R. Crawford, C. Emmerson and G. Tetlow (2009), IFS Analysis of Today’s Public Finance Figures, IFS Public Finance Press Release, August 2009 (http://www.ifs.org.uk/publications/4595).
8
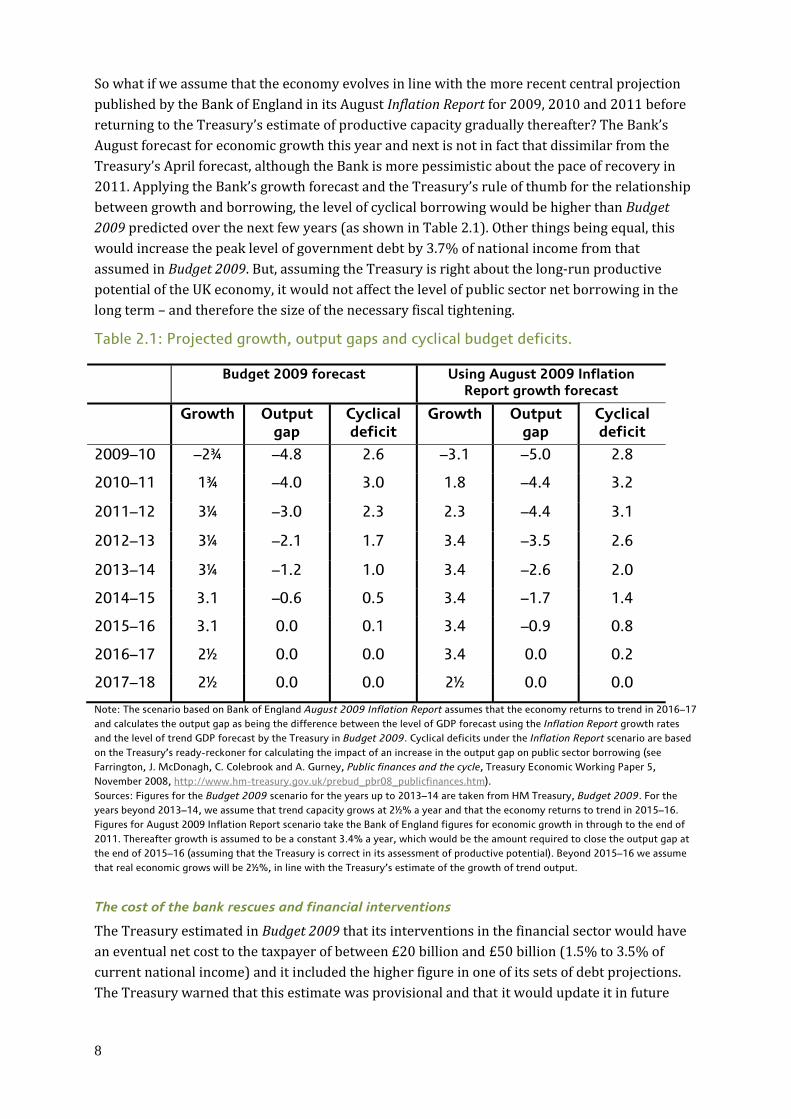
So what if we assume that the economy evolves in line with the more recent central projection published by the Bank of England in its August Inflation Report for 2009, 2010 and 2011 before returning to the Treasury’s estimate of productive capacity gradually thereafter? The Bank’s August forecast for economic growth this year and next is not in fact that dissimilar from the Treasury’s April forecast, although the Bank is more pessimistic about the pace of recovery in 2011. Applying the Bank’s growth forecast and the Treasury’s rule of thumb for the relationship between growth and borrowing, the level of cyclical borrowing would be higher than Budget 2009 predicted over the next few years (as shown in Table 2.1). Other things being equal, this would increase the peak level of government debt by 3.7% of national income from that assumed in Budget 2009. But, assuming the Treasury is right about the long-run productive potential of the UK economy, it would not affect the level of public sector net borrowing in the long term – and therefore the size of the necessary fiscal tightening. Table 2.1: Projected growth, output gaps and cyclical budget deficits.
Note: The scenario based on Bank of England August 2009 Inflation Report assumes that the economy returns to trend in 2016–17 and calculates the output gap as being the difference between the level of GDP forecast using the Inflation Report growth rates and the level of trend GDP forecast by the Treasury in Budget 2009. Cyclical deficits under the Inflation Report scenario are based on the Treasury’s ready-reckoner for calculating the impact of an increase in the output gap on public sector borrowing (see Farrington, J. McDonagh, C. Colebrook and A. Gurney, Public finances and the cycle, Treasury Economic Working Paper 5, November 2008, http://www.hm-treasury.gov.uk/prebud_pbr08_publicfinances.htm). Sources: Figures for the Budget 2009 scenario for the years up to 2013–14 are taken from HM Treasury, Budget 2009. For the years beyond 2013–14, we assume that trend capacity grows at 2½% a year and that the economy returns to trend in 2015–16. Figures for August 2009 Inflation Report scenario take the Bank of England figures for economic growth in through to the end of 2011. Thereafter growth is assumed to be a constant 3.4% a year, which would be the amount required to close the output gap at the end of 2015–16 (assuming that the Treasury is correct in its assessment of productive potential). Beyond 2015–16 we assume that real economic grows will be 2½%, in line with the Treasury’s estimate of the growth of trend output. The cost of the bank rescues and financial interventions The Treasury estimated in Budget 2009 that its interventions in the financial sector would have an eventual net cost to the taxpayer of between £20 billion and £50 billion (1.5% to 3.5% of current national income) and it included the higher figure in one of its sets of debt projections. The Treasury warned that this estimate was provisional and that it would update it in future
Budget 2009 forecast Using August 2009 Inflation Report growth forecast
Growth Output gap
Cyclical deficit
Growth Output gap
Cyclical deficit
2009–10 –2¾ –4.8 2.6 –3.1 –5.0 2.8
2010–11 1¾ –4.0 3.0 1.8 –4.4 3.2
2011–12 3¼ –3.0 2.3 2.3 –4.4 3.1
2012–13 3¼ –2.1 1.7 3.4 –3.5 2.6
2013–14 3¼ –1.2 1.0 3.4 –2.6 2.0
2014–15 3.1 –0.6 0.5 3.4 –1.7 1.4
2015–16 3.1 0.0 0.1 3.4 –0.9 0.8
2016–17 2½ 0.0 0.0 3.4 0.0 0.2
2017–18 2½ 0.0 0.0 2½ 0.0 0.0

9
Budgets and Pre-Budget Reports. Analysis by FitchRatings, published on 31 July 2009,9 estimates that the long-run net cost will be £40 billion. This is within the range of the Treasury’s estimates from Budget 2009 – implying no obvious reason to expect a big revision in PreBudget Report 2009. 2.3 Longer-term spending pressures Some economists have argued that the Government will need to announce further tax increases and spending cuts over the next few years not only to deal with the fiscal consequences of the economic and financial crisis, but also to address long-term upward pressures on public spending from demographic and other factors.10 Figure 2.3 shows the Treasury’s latest long-term projections for spending to 2057–58, based on an assumption of “unchanged policies”. Unfortunately they come from Budget 2008 and therefore predate the financial crisis and the sharp deterioration in the outlook for the public finances. They suggest that public spending would need to increase by around 5% of national income between 2007–08 and 2057–58, mainly due to projected increases in spending on state pensions (due to increasing life expectancy and the baby boomers reaching retirement) and spending on health and long-term care (due to the costs involved in keeping an ageing population healthy). But most of this increase is projected to take place beyond 2017–18. Over the coming ten years age-related spending is expected to increase (in particular on health and education), but largely to be offset by a reduction in other spending, which is driven by falls in non-pension welfare payments that under current policies are typically indexed in line with prices. We assume that over the period between now and 2017–18 the Government therefore confines itself to addressing the fiscal consequences of the crisis rather than trying to “pre-fund” the expected rise in spending over the longer term to any greater extent than it was planning to do prior to the financial crisis erupting.
9 FitchRatings, The fiscal costs of support for the UK financial sector, 31 July 2009. 10 See, for example, Hawksworth, J. (2009), With public debt rising so high, how can we meet the fiscal costs of an ageing population?, London: PriceWaterhouseCoopers (http://www.ukmediacentre.pwc.com/Content/Detail.asp?ReleaseID=3241&NewsAreaID=2 ).

10
Figure 2.3: HM Treasury long-term public spending projections (Budget 2008).
Notes: State pension spending is defined as the sum of the Basic State Pension, State Second Pension, Pension Credit, Winter Fuel Payments, Over 75 TV licences, and Christmas Bonus. Health spending is defined as gross NHS spending. Long-term care excludes long-term care provided within the NHS which is accounted for under Health. Total spending includes gross investment but excludes interest and dividends payments. Source: Table 4.1, HM Treasury, Long-Term Public Finance Report: An Analysis of Fiscal Sustainability, March 2008 (http://www.hm-treasury.gov.uk/d/bud08_longterm_586.pdf).
2.4 Conclusion The Treasury believes that the economic and financial crisis has increased the UK’s underlying structural budget deficit by around 6.4% of national income. Unaddressed, this implies that the Government would have to borrow almost 8% of national income indefinitely. This level of borrowing would put public sector net debt on an unsustainable path. The additional temporary borrowing that will arise automatically during the recession, and the eventual direct costs of the Government’s interventions in the financial sector, would both push the level of debt higher. But unless these additions to the debt burden turn out to be much larger than currently expected, they are of second-order importance in determining its broad trajectory. (As we shall see in the next section, the same is true of the one-off costs of the Government’s short-term fiscal stimulus package). The size of the necessary fiscal tightening is driven primarily by the increase in the structural deficit. There is of course enormous uncertainty around the Treasury’s (and anyone else’s) estimates of the deterioration in the structural budget deficit, the additional borrowing required during the recession and the costs of the financial sector interventions. The Treasury may well revise its estimates of all three in PreBudget Report 2009. But the fact is that we will not know their true magnitude for many years. Unfortunately, the Government cannot wait until then before setting

11
out a policy response and, as the Treasury has itself argued, in the face of uncertainty it is sensible and prudent to build in a safety margin as it is easier to deal with pleasant surprises than unpleasant ones.11 Some developments since April suggest that the increase in the underlying structural budget deficit and the expected increase in Government debt may be slightly larger than the Treasury assumed in Budget 2009 while others suggest that it may be slightly smaller. For the sake of argument, we assume in the rest of this note that the Treasury will stick with its current estimate of the increase in the structural budget deficit and aim for a fiscal tightening sufficient eventually to offset that increase. In the next section we turn to the question of when the tightening should take place. 3. Timing the tightening
3.1 The Government’s current plans and projections The discretionary tax and spending announcements in Budget 2009 and PreBudget Report 2008 increased government borrowing in 2008–09 and 2009–10 to inject more spending power into the economy and then reduce borrowing by steadily increasing amounts each year from 2010–11 to 2017–18. The tightening is projected to reach 6.4% of national income in 2017–18, thereby perfectly offsetting from then on the additional structural budget deficit the Treasury believes the crisis has created. The combined impact of “disease” and “cure” is shown in Figure 3.1. The orange bars show the levels of borrowing forecast in Budget 2008, the purple bars show the increase in the expected structural deficit since Budget 2008, and the green bars show the increase in cyclical borrowing (all as in Figure 2.1). The red bars then show the impact of the discretionary policy measures and projections announced in PreBudget Report 2008 and Budget 2009. The black line shows the total borrowing forecast in Budget 2009 out to 2013–14 and what the forecasts would have looked like if extended to 2017–18 The red bars in Figure 3.1 show the short-term stimulus measures deliberately adding to the underlying increase in borrowing in 2008–09 and 2009–10 and then the tightening measures gradually increasing to offset it thereafter. By 2017–18 the cyclical borrowing has disappeared as the economy returns to full capacity and the policy tightening has almost exactly offset the additional structural borrowing, leaving the Treasury’s implicit forecast for borrowing in that year the same in Budget 2009 as in Budget 2008.
11 HM Treasury, Government learns lessons from the past, Press Release 24th November 1997 (http://www.hm-treasury.gov.uk/press_147_97.htm).

12
Figure 3.1: The impact of discretionary policy changes since Budget 2008.
Note: Increases in borrowing have negative sign. Implementing this set of discretionary measures – and thereby offsetting the underlying increase in borrowing from 2017–18 onwards – would shift the trajectory of public sector debt away from the unsustainable path shown in Figure 2.2. Instead, the Treasury forecast in Budget 2009 that public sector net debt would peak in 2013–14 at 76.2% of national income excluding the losses on financial sector interventions and at 79.0% of national income including the upper bound of the Treasury’s provision estimate of a net direct cost of £50 billion. If we assume (as we did in Figure 2.2) that the Treasury is right in its assumptions about the long-term growth rate of the economy and the long-term rate of whole economy inflation, and that it can continue to borrow at historically low interest rates, then keeping the tightening in place would return debt to pre-crisis levels in the early 2030s (Figure 3.2). The tightening would also put the Government in a position where an increase in the interest rate at which it could borrow would be unlikely in itself to put the public sector debt burden back on an unsustainable trajectory (Our estimates suggest that, if the planned tightening is implemented, an increase in the borrowing costs of more than 3½ percentage points would be required to see debt continuing to rise as a share of national income throughout the first half of this century). A 1 percentage point rise in borrowing costs would now increase debt by 11% of national income in 2025 and 16% in 2040, compared to the increases of 15% and 35% respectively that we described in the previous section in the absence of any tightening.

13
Figure 3.2: Planned fiscal tightening returns debt slowly to pre-crisis levels.
Note: Projected figures for Public Sector Net Debt under all scenarios include the Treasury’s estimate of the cost of unrealised losses from the financial sector interventions, which they estimated in Budget 2009 would amount to up to £50bn. Source: Historic data from HM Treasury, Public Finances Databank, August 2009. Projections are authors’ calculations based on HM Treasury, Budget 2009.
We also show in Figure 3.2 that the debt trajectory is not significantly affected by the size of the temporary fiscal stimulus package in 2008–09 and 2009–10. We show how the debt path would look if: (i) there had been no stimulus at all in those two years and (ii) if it had been twice as large. In each case, it makes only a modest difference to the expected rise in the debt burden and to the number of years before it returns to pre-crisis levels. The Government has not explicitly related the size of the fiscal tightening it proposes to the size of the fiscal problem that the Treasury has identified when talking about its objectives. It conflates the two and refers instead to taking measures that will: • Halve the overall budget deficit by 2013–14; • Put public sector net debt back on a downward path in the medium term; and • Balance the current budget (revenues minus non-investment spending) by 2017–18, “once the global shocks have worked their way through the economy in full”. The timing and pace of the switch from fiscal stimulus to tightening is not yet set in stone. In deciding whether to change the proposed time profile, three questions are likely to be uppermost in the Government’s and in the opposition’s minds: • Should the tightening be accelerated to reduce the risk that investors will take fright and demand higher interest rates to lend to the government? • Should the tightening be delayed to avoid derailing what is expected to be a fragile economic recovery?

14
• What are the political costs and benefits of tightening more or less quickly? We discuss each of these briefly in turn. 3.2 Reasons for a rethink?
The threat of higher government borrowing costs Thankfully, the current upward pressure on public sector borrowing and debt comes at a time when it is relatively cheap for governments to borrow. Figure 3.3 shows that the average nominal interest rate on the outstanding stock of public sector net debt has fallen from over 10% in the early 1980s to a little over 4% today. The Figure also shows that since the turn of the century the average real interest rate (calculated using estimated economy-wide inflation) has been running consistently at levels not seen since the late 1980s. Figure 3.3: Average interest rate on outstanding government debt.
Note: The average effective nominal interest rate is calculated as cash net debt interest paid as a percentage of the cash value of the stock of net debt in the previous financial year. The average effective real interest rate is calculated using the average effective nominal interest rate and GDP deflators. Source: Historic data from HM Treasury, Public Finances Databank, August 2009. Forecasts from HM Treasury, Budget 2009. GDP deflators from HM Treasury, http://www.hm-treasury.gov.uk/d/gdp_deflators.xls.
The Treasury assumed in Budget 2009 that the average nominal interest rate on the government’s debt would remain near current levels over the next five years, even though the stock of debt is forecast roughly to double over that period. This means that public sector debt interest is forecast also to double – from around 1.6% of national income or £23 billion in today’s terms to 3.1% or £44 billion in today’s terms – but even this would only be slightly above the level Labour inherited in 1997 (Figure 3.4).

15
Figure 3.4: Public sector debt interest.
Source: Historic data from HM Treasury, Public Finances Databank, August 2009. Forecasts from HM Treasury, Budget 2009.
The relationship between the stock of government debt and the interest rates at which it can borrow is not as straightforward as one might imagine. Despite the projected rise in debt, there are good reasons to expect that the government’s borrowing costs will remain relatively low. Professor David Miles, now on the Monetary Policy Committee of the Bank of England, Laurence Mutkin and Owen Roberts pointed out in this year’s IFS Green Budget that private sector demand for UK government debt is likely to remain strong, especially from banks and pension funds.12 But there is clearly a danger that investors will demand higher interest rates to lend to the government, out of fear that it will resort to inflation or (in extremis) default to reduce the debt burden. This would increase the burden of its interest payments. If this higher debt burden were financed from additional borrowing there would be further upward pressure on debt, which would further worsen investor sentiment and threaten a vicious spiral. Alternatively, the Government would have to increase the size of the fiscal tightening to keep debt on the previously desired path – implying the need for more tax increases or spending cuts. Fears of such a development have been fuelled in recent months by the Government’s failure to secure enough bids to cover fully a gilt auction in March13 and by a warning from the credit rating agency Standard & Poors on the 21st May 2009 that it might lose its AAA status in the absence of more decisive measures to repair the public finances.14 However Robert Stheeman, 12 D. Miles, L. Mutkin and O. Roberts (2009), ‘Funding Government Borrowing’ in R. Chote, C. Emmerson, D. Miles and J. Shaw (eds),The IFS Green Budget: January 2009, London: Institute for Fiscal Studies (http://www.ifs.org.uk/budgets/gb2009/09chap7.pdf). 13 http://news.bbc.co.uk/1/hi/business/7963815.stm 14 See, for example, The Guardian, Ratings agency downgrades outlook for UK economy, 21st May 2009 (http://www.guardian.co.uk/business/2009/may/21/standard-poors-uk-economic-outlook).

16
the chief executive of the UK’s Debt Management Office, has said in an interview with the BBC that he doesn’t believe such a downgrading would, on its own, lead to a significant increase in the rate of interest on government borrowing.15 In addition two other credit rating agencies (Fitch on 31st July 2009 and Moody’s on 9th September 2009) suggested that it is highly unlikely that the UK would lose its AAA status.16 Another scenario that could lead to an increase in the interest rates demanded on UK Government debt would be contagion from a government debt crisis overseas. This might spark a search by investors for other possible casualties, as we saw in the spread of the Asian financial crisis in the 1990s. One reason to be nervous of investor sentiment is that the UK public finances are expected to deteriorate over the course of the crisis not only in absolute terms, but also relative to other industrial economies. As Figure 3.5 illustrates, the International Monetary Fund (IMF) expects only Ireland and Iceland to experience a larger increase in government debt among 21 advanced industrial countries between 2007 and 2014 (measured on an internationally comparable basis). We would emerge from the crisis with the 7th largest public sector debt out these countries, having entered with the 13th largest. Taking instead the Group of Twenty leading economies, as shown in Figure 3.6, the IMF expects the UK to experience the largest increase in debt between 2007 and 2014, having the 10th largest debt among these countries in 2007 and the 4th largest in 2014.
15 See http://www.bbc.co.uk/blogs/thereporters/robertpeston/2009/07/recovery_risk_for_government_b.html. 16 See FitchRatings, op cit. and, for example, The Telegraph, S&P reserves judgment on UK credit rating despite Moody's verdict, 9th September 2009 (http://www.telegraph.co.uk/finance/financetopics/recession/6163827/SandP-reserves-judgment-on-UK-rating-credit-rating-despite-Moodys-verdict.html).

17
Figure 3.5: IMF forecasts for general government debt among industrial countries.
Source: International Monetary Fund, World Economic Outlook database (April 2009), and M. Horton, M. Kumar, and P. Mauro, The State of Public Finances: A Cross-Country Fiscal Monitor, July 30th 2009, Washington: International Monetary Fund (www.imf.org/external/pubs/ft/spn/2009/spn0921.pdf).

18
Figure 3.6: IMF forecasts for general government debt among the G20 (July 2009).
Source: Appendix Table 5, Page 30 of M. Horton, M. Kumar, and P. Mauro, The State of Public Finances: A Cross-Country Fiscal Monitor, July 30th 2009, Washington: International Monetary Fund (www.imf.org/external/pubs/ft/spn/2009/spn0921.pdf).

19
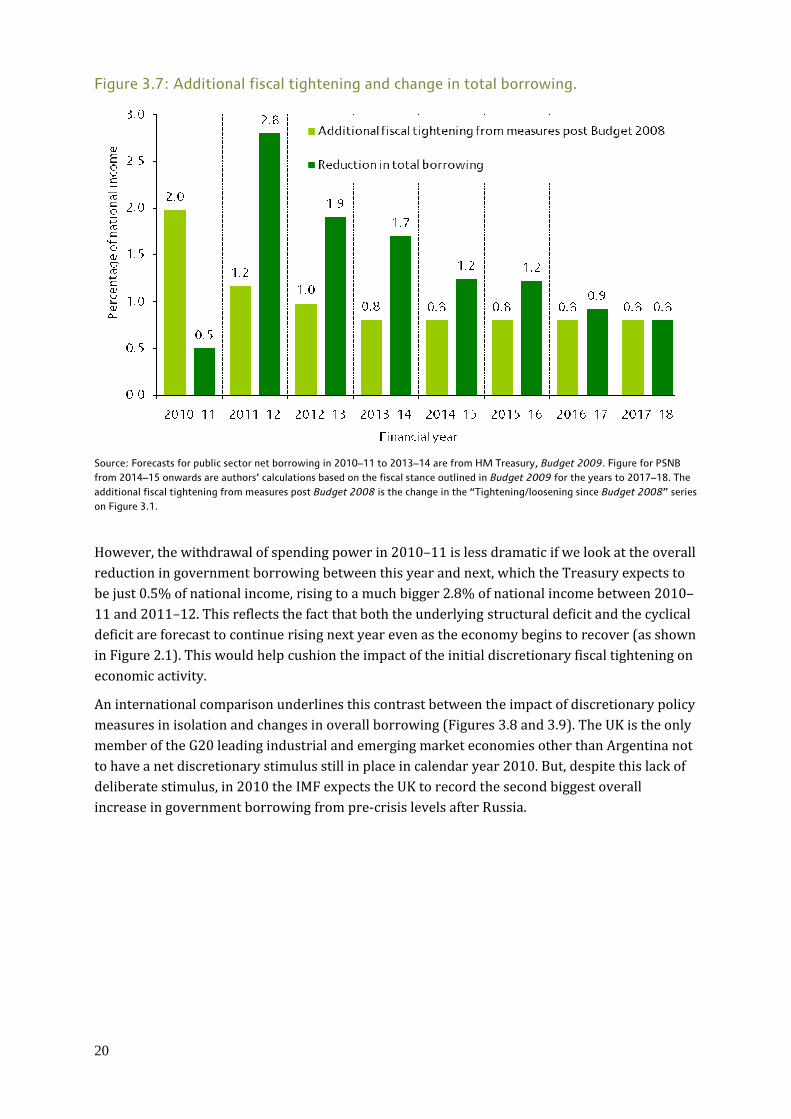
Judging how far borrowing costs could rise is very difficult. One indication might be Ireland’s recent experience, where after a long period in which it was able to issue 10-year bonds at an interest rate around ¼ of a percentage point above that in Germany, this premium increased to 2½ percentage points in March 2009 before falling back to a little over 1 percentage point, perhaps partly due to the large increase in taxes and cuts to spending announced in the Irish emergency budget held on the 7th April 2009.17 Our estimates suggest that a one percentage point increase in the average interest rate on the public sector debt, would lead to the Government having to increase the eventual planned fiscal tightening by about 0.6% of national income (£8 billion a year in today’s terms) to keep debt on course to return to pre-crisis levels by the early 2030s as its Budget 2009 forecasts suggest. The judgement the Government has to make is whether it would be sensible to pursue a more aggressive fiscal tightening over the next few years to help avoid an outcome in which the fiscal pain would ultimately be even greater. In part that judgement will rest on whether it believes the economy could take the medicine. Safeguarding economic recovery Tightening fiscal policy would withdraw spending power from the economy. An important question therefore is whether tightening on the timescale currently proposed by the Government – or more rapidly – would deepen or extend the recession. This would increase the amount that the government had to borrow in the short term and – if it led to any permanent loss of productive potential – in the long term too. Some economists point to the experience of 1937, when a premature policy tightening is blamed for derailing the US economy’s recovery from the Great Depression. Professor Christina Romer, head of President Obama's Council of Economic Advisers, estimates that the ending of a bonus for First World War veterans in 1936 and the introduction of social security taxes in 1937 cut the budget deficit by 2.5% of national income but helped push the US back into recession.18 Could the same happen here? The proposed tightening implied by the measures in PreBudget Report 2008 and Budget 2009 averages an additional 1% of national income a year over the next eight years. But this is front-loaded, with a tightening of almost 2% of national income next year, largely because of the withdrawal of the temporary stimulus in place in 2009–10 (Figure 3.7).
17 For a discussion see, example, http://www.bbc.co.uk/blogs/thereporters/stephanieflanders/2009/04/when_fiscal_stimulus_isnt_stim.html 18 See, for example, The Economist, The Lessons of 1937, June 18th 2009 (http://www.economist.com/businessfinance/displaystory.cfm?story_id=13856176).
20
Figure 3.7: Additional fiscal tightening and change in total borrowing.
Source: Forecasts for public sector net borrowing in 2010–11 to 2013–14 are from HM Treasury, Budget 2009. Figure for PSNB from 2014–15 onwards are authors’ calculations based on the fiscal stance outlined in Budget 2009 for the years to 2017–18. The additional fiscal tightening from measures post Budget 2008 is the change in the “Tightening/loosening since Budget 2008” series on Figure 3.1. However, the withdrawal of spending power in 2010–11 is less dramatic if we look at the overall reduction in government borrowing between this year and next, which the Treasury expects to be just 0.5% of national income, rising to a much bigger 2.8% of national income between 2010–11 and 2011–12. This reflects the fact that both the underlying structural deficit and the cyclical deficit are forecast to continue rising next year even as the economy begins to recover (as shown in Figure 2.1). This would help cushion the impact of the initial discretionary fiscal tightening on economic activity. An international comparison underlines this contrast between the impact of discretionary policy measures in isolation and changes in overall borrowing (Figures 3.8 and 3.9). The UK is the only member of the G20 leading industrial and emerging market economies other than Argentina not to have a net discretionary stimulus still in place in calendar year 2010. But, despite this lack of deliberate stimulus, in 2010 the IMF expects the UK to record the second biggest overall increase in government borrowing from pre-crisis levels after Russia.

21
Figure 3.8: Discretionary fiscal stimulus measures in 2010 (relative to 2007).
Figure 3.9: Change in overall budget balance: 2007 to 2010.
Source: Appendix Table 2, Page 30 of M. Horton, M. Kumar, and P. Mauro, The State of Public Finances: A Cross-Country Fiscal Monitor, July 30th 2009, Washington: International Monetary Fund (www.imf.org/external/pubs/ft/spn/2009/spn0921.pdf).
It is also important not to look at fiscal policy in isolation. As Professor Romer has pointed out, the fiscal tightening in 1937 was accompanied by “an accidental switch to contractionary

22
monetary policy” when the Federal Reserve increased reserve requirements and thereby encouraged commercial banks to reduce their lending. This suggests that a key question is whether the Bank of England could maintain overall spending in the economy at a satisfactory level while the fiscal tightening takes place, by keeping interest rates low and if necessary maintaining for longer, or extending the size of, its recent policy of pumping money into the economy through “quantitative easing”. The Bank has given no indication to date that it believes the current proposed tightening would imperil the recovery. It would certainly help any party contemplating a more aggressive fiscal tightening to have the Bank affirm publicly that it would not expect this to cause undue problems for monetary policy. Ben Broadbent and Adrian Paul of Goldman Sachs have argued that a more aggressive fiscal tightening may well not depress the pace of economic recovery, because the direct withdrawal of spending power through lower public spending and higher taxes would probably be offset by the impact of a weaker exchange rate.19 To the extent to which this is true, further action from the Bank of England might not be necessary. If the proposed pace of fiscal tightening still looked risky, one option would be to state in advance that some of the belt-tightening measures would only be implemented as and when the economy performed sufficiently strongly against independently verifiable benchmarks, such as for growth or unemployment. It would be easier to do this with tax increases or changes in benefit levels than with spending on public services, for which long-term planning would seem more important. This might offer a way to reassure people simultaneously that the Government was serious about repairing the public finances, yet sensitive to the health of the recovery. But it would be far from simple to design. Political considerations The timing and composition of any fiscal tightening will be influenced by political considerations as well as economic ones. The two are of course linked – no political party would wish the electorate to think it was taking undue risks with the health of the recovery or with its own creditworthiness. But there are other tactical considerations too. An incoming Conservative or Liberal Democrat government would presumably have a strong incentive to get the pain of the tightening over as quickly as possible – and preferably within a single term of government. The sooner the action was taken (and pain was felt) after the general election, the easier it might be to blame the previous administration for the need to take it. It might also provide an easier platform on which to seek re-election at the subsequent general election. If Labour was to be re-elected, the political incentives are not so straightforward. A hung parliament would potentially be the most destabilising outcome, as investors – especially overseas ones – might conclude that an unstable minority or coalition government is less likely to be able to implement unpopular tax increases and spending cuts than any single party elected with a clear majority. Indeed, if opinion polls and/or betting markets suggested that a hung parliament was a likely outcome this might put upward pressure on gilt yields and borrowing costs ahead of the election. Similarly investors may already be considering the plans that are 19 Fiscal consolidation and the exchange rate, UK Economics Analyst, Goldman Sachs, 4 September 2009.

23
being put forward by the Conservatives and the Liberal Democrats and weighing them with the likelihood they place on each party forming (all or part of) the next Government. 3.3 Alternative tightening scenarios The discussion in the previous section suggests that this or a future government will face conflicting pressures in deciding the timescale of any fiscal tightening. The Budget 2009 projections assume an eight-year tightening, beginning next year and front-loaded in its impact on spending power in the economy. But a case can be made both for accelerating the tightening (to reassure investors and to get the political pain over more quickly) and delaying it (to give economic recovery more time to take root). We now look at the impact of three alternative tightening scenarios (illustrated in Figure 3.10) on the possible path of government debt:
1. Accelerating the tightening: We assume that the government begins the tightening next year as currently planned, but aims to complete it in four years rather than eight. This implies a tightening of around 2% of national income a year in each of the next four years – in other words sustaining the scale of tightening currently anticipated by the Treasury between 2009–10 and 2010–11. 2. Delaying the tightening: We assume that the government announces additional spending increases and/or tax cuts for 2010–11, so that the net stimulus this year is sustained into next year. Thereafter we assume that the tightening currently projected by the Treasury proceeds as planned over the following eight years. 3. Delaying and then accelerating the tightening: We assume that the government sustains the overall level of stimulus this year into next year (as in Option 2), but then seeks to accomplish the planned tightening over four years rather than eight years (as in Option 1).

24
Figure 3.10: Illustrative options for the timing of fiscal tightening.
Budget 2009 forecast that public sector net debt would peak in 2013–14 at 76.2% of national income excluding the losses on financial sector interventions and at 79.0% of national income including the upper bound of the Treasury’s provision estimate of a net direct cost of £50 billion. Our calculations suggest that it would not return to below 40% of national income until 2032. The path of debt under this and each of the alternative scenarios for fiscal policy set out in Figure 3.10 is shown in Figure 3.11. Under the ‘accelerate’ scenario borrowing is reduced quicker and therefore debt would peak one year earlier in 2012–13 at 74.7% of national income (including the financial sector losses). It would then start to fall at a similar rate to the Budget 2009 scenario and would return to 40% of national income in the late 2020s. Under the ‘delay’ scenario borrowing is reduced less quickly and therefore debt would peak one year later than the Budget 2009 scenario at 84.1% of national income. It would then fall at a similar rate to the Budget 2009 scenario and would pass back below 40% in the mid 2030s. The ‘delay and accelerate’ would fall between the ‘delay’ scenario and the ‘accelerate’ scenario and imply debt falling back below 40% of national income slightly sooner than under the Budget 2009 scenario. Also shown in Figure 3.11 is what would happen were the ‘delay’ scenario to be implemented and if the average interest rate charged on public sector net debt were to rise by one percentage point. This would lead to public sector net debt almost reaching 90% of national income in 2015–16 and then falling less quickly than in the other illustrative scenarios.

25
Figure 3.11: Paths of public sector net debt under different illustrative options for the timing of the fiscal tightening.
Note: Projected figures for Public Sector Net Debt under all scenarios include the Treasury’s estimate of the cost of unrealised losses from the financial sector interventions, which they estimated in Budget 2009 would amount to up to £50bn. Fiscal tightening under each of the scenarios is as shown in Figure 3.10. Source: Historic data from HM Treasury, Public Finances Databank, August 2009. Projections are authors’ calculations based on HM Treasury, Budget 2009.
3.4 Where the opposition parties stand Having opposed the fiscal stimulus package on the grounds that it would be unaffordable and ineffective, the Conservative Party argues that the tightening should be more aggressive than the Government currently plans. However, it has not yet specified a preferred timescale, beyond arguing that the increase in total spending forecast from £671.4 billion in 2009–10 to £701.7 billion in 2010–11 is excessive (see Section 4.2). On 15th September 2009, Vince Cable set out his views on the size of the fiscal problem and the appropriate time frame in which to address it.20 Broadly, he took a more pessimistic view than the Treasury of medium-term economic growth, suggesting that more of the additional borrowing required this year will prove to be permanent rather than temporary. He has therefore suggested that the fiscal tightening should be larger (amounting to 8% of national income, instead of 6.4%), implemented faster (over five years, rather than eight). But, like the Government, and potentially unlike the Conservatives, he believes that “it would be damaging to seek to curb the deficit in recession conditions (since it would be likely to deepen recession)”. Figure 3.12 attempts to incorporate Vince Cable’s view of the fiscal position and appropriate policy response into a long-term forecast for the profile of debt. Four alternative scenarios are shown. First, the green line shows, as in Figure 3.11, the profile for debt assuming that Budget 20 V. Cable, Tackling the fiscal crisis: A recovery plan for the UK, 15th September 2009, London: Reform (http://www.reform.co.uk/LinkClick.aspx?fileticket=RQ0obqjHA9A%3d&tabid=118).

26
2009 is right about the structural fiscal position and that the fiscal tightening it outlined is implemented. Second, the purple line shows a possible path for debt if Vince Cable is right about the size of the structural deficit, but only the Budget 2009 proposed fiscal tightening is implemented. Under this scenario debt would peak at a very similar level to that projected in Budget 2009, but would then fall much less quickly. The third scenario (blue line) supposes that Vince Cable is right about the fiscal position and that the additional (and faster) fiscal tightening that he proposes is implemented. This scenario leads to debt peaking at a slightly higher level in the short-term but then falling slightly more quickly and returning to pre-crisis levels in a similar time-scale as under the Budget 2009 forecasts and plans. The final scenario shown (orange line) supposes that the additional fiscal tightening that Vince Cable proposes is implemented, but that it turns out to be the case that Budget 2009 was in fact right about the size of the structural deficit. Were this scenario to materialise, it is clear that debt would fall quickly as the fiscal tightening would be sufficient for the Exchequer to actually have a surplus of revenues over expenditure each year. Were this scenario to materialise, a future Government would then be able to decide when and how best to loosen fiscal policy in response, although debt would still not reach pre-crisis levels until the early 2020s. Figure 3.12: Paths of public sector net debt under Budget 2009 and Vince Cable’s estimates of the structural budget deficit and the desired policy response.
Note: The “larger structural deficit” lines assume that the structural deficit in 2017–18 is 1.6% of national income larger than the Treasury assumed in Budget 2009. The “additional fiscal tightening” scenario assumes that instead of implementing the fiscal tightening outlined in Budget 2009, the Government fazes in a tightening that cumulates to 8% of national income per year from 2015–16 onwards. Source: Authors’ calculations based on HM Treasury, Budget 2009 and Vince Cable’s view of the structural position of the public finances and the appropriate policy response outlined in V. Cable, Tackling the fiscal crisis: A recovery plan for the UK, 15th September 2009, London: Reform (http://www.reform.co.uk/LinkClick.aspx?fileticket=RQ0obqjHA9A%3d&tabid=118)
3.5 Conclusion The tax and spending measures announced and projected in PreBudget Report 2008 and Budget 2009 would deliver a fiscal tightening equal to 6.4% of national income by 2017–18, relative to
27
the projections set out in Budget 2008. This is sufficient by then to offset the increase in the structural budget deficit that the Treasury believes will result from the current financial crisis. Bearing in mind that the measures also deliver a fiscal loosening of 1.6% this year, relative to a Budget 2008 baseline, the overall tightening from 2009–10 to 2017–18 is around 8% of national income in eight years. The timescale of the tightening is not yet set in stone and reasonable arguments could be made for accelerating and/or delaying it. The argument for acceleration is that this might help persuade investors that the government was serious about restoring the public finances to health and thereby reduce the risk of an increase in government borrowing costs. Indeed investors might already be anticipating that whoever wins the next general election would embark on such a path very soon after forming the next Government. Getting the pain over quickly might also have political attractions. The argument for delay is that this would avoid withdrawing spending power from the economy at a time when the recovery is likely still to be fragile and when many countries still have stimulus packages in place. The most sensible objective would seem to be to get the tightening over as quickly as possible, subject to being confident that the Bank of England could maintain overall spending power in the economy at a satisfactory level by keeping interest rates low and through the use of quantitative easing. It may turn out that the eventual tightening required is larger or smaller than currently anticipated by the Treasury. It might help enhance credibility if the government were to commit itself to reduce the duration of the adjustment if a smaller tightening turns out to be necessary rather than slowing it down and sticking to the same timescale – subject again to the ability of the Bank of England to keep economic recovery on track. In this vein the IMF in its 2009 Article IV Consultation stated that the UK should strengthen its commitment by “Allocating any upside surprises to growth or revenue to reduce deficits more aggressively and limit the accumulation of public debt”.21 It might be appropriate for the Government to go further than this and to commit not only to use any greater-than-expected tax revenues to reduce borrowing and debt, but also to use any lower-than-expected spending on items within Annually Managed Expenditure such as spending on social security benefits or tax credits in the same way. The decision about how quickly to carry out the fiscal tightening might well affect the chosen composition of the tightening. Increases in taxation and easily implementable reductions in welfare payments can be introduced relatively quickly, while cuts in spending on public services and large-scale reforms to welfare policy might take longer to phase in sensibly. The next section discusses the composition of the fiscal tightening.
21 IMF, United Kingdom – 2009 Article IV Consultation Concluding Statement of the Mission, 20th May 2009, (http://www.imf.org/external/np/ms/2009/052009a.htm).
28
4. The composition of the tightening
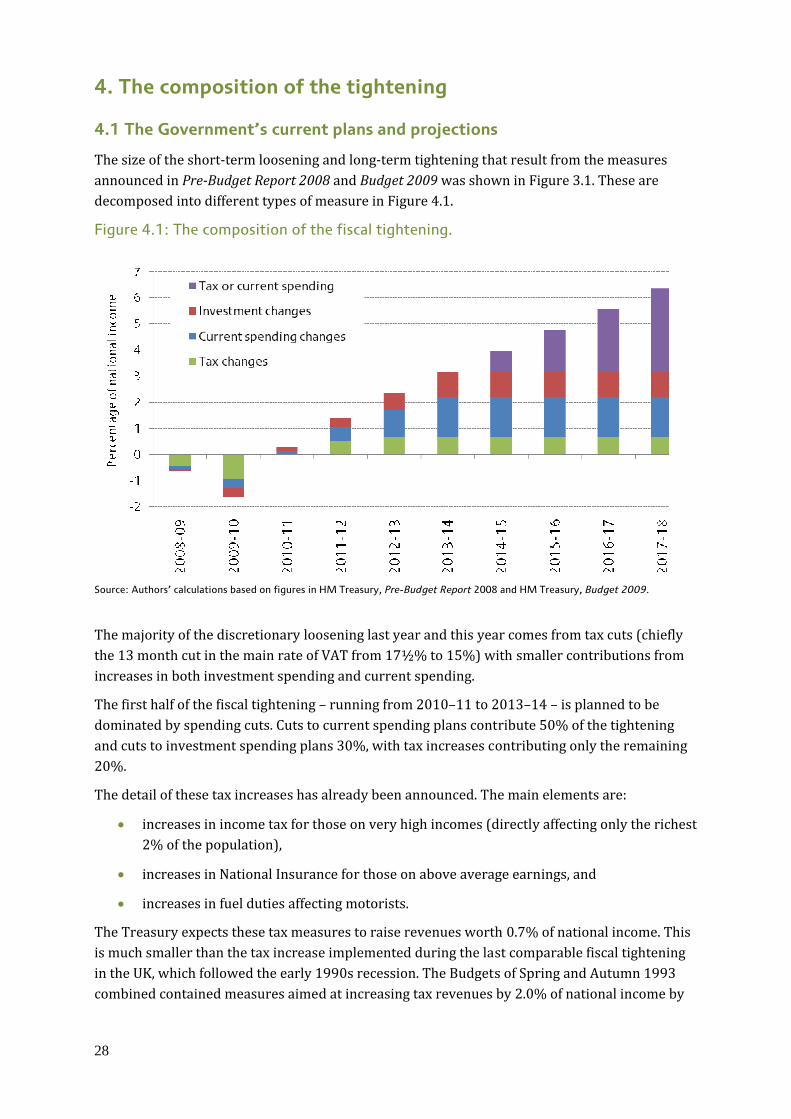
4.1 The Government’s current plans and projections The size of the short-term loosening and long-term tightening that result from the measures announced in PreBudget Report 2008 and Budget 2009 was shown in Figure 3.1. These are decomposed into different types of measure in Figure 4.1. Figure 4.1: The composition of the fiscal tightening.
Source: Authors’ calculations based on figures in HM Treasury, Pre-Budget Report 2008 and HM Treasury, Budget 2009.
The majority of the discretionary loosening last year and this year comes from tax cuts (chiefly the 13 month cut in the main rate of VAT from 17½% to 15%) with smaller contributions from increases in both investment spending and current spending. The first half of the fiscal tightening – running from 2010–11 to 2013–14 – is planned to be dominated by spending cuts. Cuts to current spending plans contribute 50% of the tightening and cuts to investment spending plans 30%, with tax increases contributing only the remaining 20%. The detail of these tax increases has already been announced. The main elements are: • increases in income tax for those on very high incomes (directly affecting only the richest 2% of the population), • increases in National Insurance for those on above average earnings, and • increases in fuel duties affecting motorists. The Treasury expects these tax measures to raise revenues worth 0.7% of national income. This is much smaller than the tax increase implemented during the last comparable fiscal tightening in the UK, which followed the early 1990s recession. The Budgets of Spring and Autumn 1993 combined contained measures aimed at increasing tax revenues by 2.0% of national income by
29
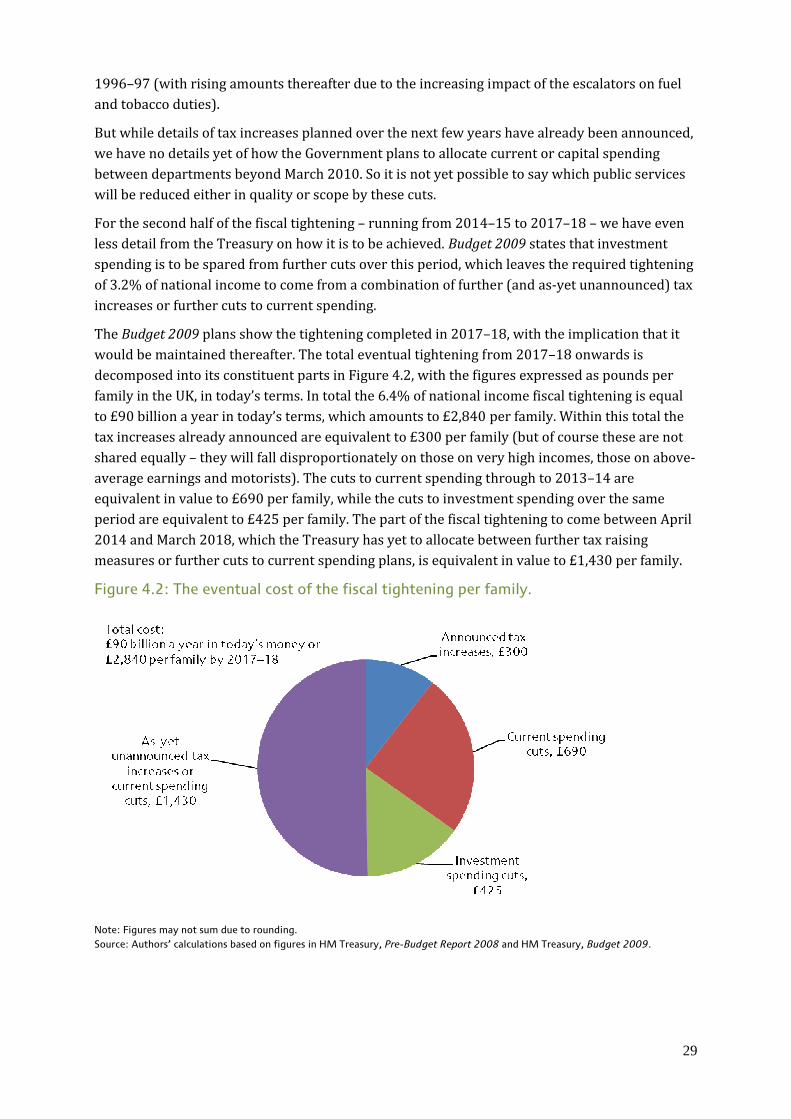
1996–97 (with rising amounts thereafter due to the increasing impact of the escalators on fuel and tobacco duties). But while details of tax increases planned over the next few years have already been announced, we have no details yet of how the Government plans to allocate current or capital spending between departments beyond March 2010. So it is not yet possible to say which public services will be reduced either in quality or scope by these cuts. For the second half of the fiscal tightening – running from 2014–15 to 2017–18 – we have even less detail from the Treasury on how it is to be achieved. Budget 2009 states that investment spending is to be spared from further cuts over this period, which leaves the required tightening of 3.2% of national income to come from a combination of further (and as-yet unannounced) tax increases or further cuts to current spending. The Budget 2009 plans show the tightening completed in 2017–18, with the implication that it would be maintained thereafter. The total eventual tightening from 2017–18 onwards is decomposed into its constituent parts in Figure 4.2, with the figures expressed as pounds per family in the UK, in today’s terms. In total the 6.4% of national income fiscal tightening is equal to £90 billion a year in today’s terms, which amounts to £2,840 per family. Within this total the tax increases already announced are equivalent to £300 per family (but of course these are not shared equally – they will fall disproportionately on those on very high incomes, those on above-average earnings and motorists). The cuts to current spending through to 2013–14 are equivalent in value to £690 per family, while the cuts to investment spending over the same period are equivalent to £425 per family. The part of the fiscal tightening to come between April 2014 and March 2018, which the Treasury has yet to allocate between further tax raising measures or further cuts to current spending plans, is equivalent in value to £1,430 per family. Figure 4.2: The eventual cost of the fiscal tightening per family.
Note: Figures may not sum due to rounding. Source: Authors’ calculations based on figures in HM Treasury, Pre-Budget Report 2008 and HM Treasury, Budget 2009.

30
If the current parliament runs broadly its full course through to May or June next year, the Government will have two or three opportunities to revise and/or add further detail to its fiscal plans before the general election: the Pre-Budget Report later this year, the Budget next spring and a possible Spending Review statement (which would allocate resources by department for 2011–12, 2012–13 and 2013–14). The Government will use the Pre-Budget Report and the Budget to announce new tax measures, to update its spending projections and to make new fiscal forecasts. On past precedent, we would also expect one of these statements to set out firm aggregate spending plans for the next Spending Review period broken down between current and capital spending (as the existing projections do). Furthermore past experience suggests they will also publish figures for how these spending totals will be divided between total Departmental Expenditure Limits (DELs) – the money Whitehall departments have to spend on public services and administration – and total Annually Managed Expenditure (AME) – other areas of spending less amenable to long term planning, such as social security, debt interest and public sector pension payments. The Government has not yet said whether it will publish a full Spending Review this side of the general election, with ministers citing the unusually uncertain economic environment as a reason to keep their options open. They have however accepted that the voters will need to see some more detail of the Government’s spending plans before polling day. This suggests that they may announce spending allocations for some departments but not for others. This would be consistent with behaviour in past reviews, when some settlements have been announced in advance of the release of a comprehensive list. Given the scale of the necessary adjustment, and the fact that economic uncertainty will not have disappeared over next few months, it would seem hard to identify much justification for a decision to delay the Spending Review beyond the election. The reshaping of the state in response to the current crisis may well be the defining feature of the next parliament and it would seem only reasonable for voters to have a detailed (albeit revisable) picture of the parties’ plans to help choose between them. In addition some of the Government’s spending plans – including potentially some areas where spending is to be cut back – could receive cross-party support. Where this was the case public sector managers could begin to plan sooner in the knowledge that plans were unlikely to be affected by the outcome of the general election. In these areas at least this might help to ensure that funds were used most effectively. 4.2 The implications for public spending In this section we examine the implications for public spending of the incomplete plans set out in Budget 2009. Spending in 2010–11 The current Treasury plans are for total public spending to grow in cash terms from £671.4 billion in 2009–10 to £701.7 billion in 2010–11. The Conservatives have argued that this increase is too large.22 However two-thirds of the increase can be attributed to rising social security costs (which are forecast to go up by £6.2 billion) and increasing central government 22 See speech by David Cameron, Cutting the Cost of Politics, 8th September 2009 (http://www.conservatives.com/News/Speeches/2009/09/David_Cameron_Cutting_the_Cost_of_Politics.aspx).

31
interest payments (which are forecast to rise by £15.7 billion). Neither is straightforward for the government to reduce sensibly in the short term. The increase in spending on DELs – the amount Whitehall has to spend on public services and administration – is only £3.2 billion next year (the Government already having cut them by £5 billion in last year’s Pre-Budget Report, thanks to some conveniently identified “efficiency savings” and the bringing forward of some investment spending from 2010–11 into 2009–10). Once you take into account whole-economy inflation, this actually represents a 0.7% cut in real terms. If a new Government was to take office in May or June next year it is unlikely to find it easy to make significant and sensible cuts to public spending within a financial year that is already underway. The next spending review period: 2011–12 to 2013–14 In Budget 2009 the Treasury set out tax and spending plans that would, assuming their economic forecasts turn out to be correct, reduce total public spending by £1.0 billion after economy-wide inflation in 2013–14 compared to 2010–11. The plans set out in Budget 2009 state that current (i.e. non-investment) spending would rise by 0.7% a year in real terms between 2011–12 and 2013–14, while public sector net investment would “move to” 1¼% of national income by 2013–14. The latter is equivalent to an average real cut of just over 17% a year over three years. The government claims that the pain will be eased by £9 billion of new efficiency savings identified in existing departmental spending, which it says can be realised by 2013–14. The plans for current and investment spending imply that total government spending would be cut by 0.1% between 2010–11 and 2013–14, after adjusting for economy-wide inflation. This would be the lowest 3-year growth in total public spending since the period from April 1996 to March 1999 – the period when the incoming Labour government largely stuck to tough spending plans it inherited from the Conservatives. Table 4.1 shows how the real annual growth rates planned for 2011–12 to 2013–14 compare to the growth rates seen in previous periods. Table 4.1: TME, current spending and investment spending.
Average annual percentage real increase
Total managed expenditure
Current expenditure
Public sector net investment
Labour, plans
2011–12 to 2013–14 –0.0 0.7 –17.5
Labour, spending reviews to date:
1999–00 to 2010–11 4.2 3.9 13.6
Labour, inherited Conservative plans
1997–98 to 1998–99 0.0 –0.1 3.0
Conservatives
1979–80 to 1996–97 1.5 1.7 –5.0

32
Source: Historical data and projections to 2010–11 from HM Treasury, Public Finances Databank, July 2009; projections for 2011-12 onwards from HM Treasury, Budget 2009, Table C4.
The real cut in spending of 0.1% over three years is a very tight envelope. Some areas of spending are not (in the short term at least) under the Government’s control, and may necessarily grow faster than this overall average rate. For instance, debt interest payments depend on the stock of government debt and the interest rates on that debt. Internal Treasury forecasts drawn up at the time of Budget 2009 (and leaked subsequently to the Conservative Party) imply that these payments will grow in real terms by an average rate of 11.1% a year over 2011–12 to 2013–14. Taking this increase into account would leave the rest of public spending to be cut by an average of 0.9% a year over this three year period. Other areas of non-departmental spending are also likely to be growing more rapidly than the total spending envelope. Social security spending would, at least on current policy, increase, for example because an ageing population will increase the number of individuals receiving state pensions. The aforementioned internal Treasury forecasts indicate that social security spending will grow at an average annual rate of 1.4% in real terms. Such an increase for social security and tax credit spending would mean the rest of public spending (excluding that on debt interest payments or welfare payments) being cut by an average of 1.7% a year after economy-wide inflation. If delivered this would be the tightest three-year period for this definition of public spending since the three years starting in April 1977 when the UK’s spending plans were being set in accordance with the IMF’s austerity plan. The Treasury’s forecasts suggest that other areas of AME – which include spending by local authorities financed through council tax, payments to the EU and the pensions of retired former public-service employees – will grow by 3.1% a year on average in real terms, meaning that spending on DELs will have to be cut by an annual average of 2.9% a year after economy-wide inflation. This would imply a cumulative reduction of 8.6%, or around £32.9 billion a year, by the third year of the Spending Review period. All this means that the spending settlement for departments over the next spending review period is going to be even tighter than the planned increases for spending as a whole, with significant real cuts likely for most central government departments. A new tool produced by IFS researchers allows users to experiment with their own “Spending Review 2010” settlements. This is aimed at illustrating what the trade-offs between spending on different areas might involve, and how this could be made easier or harder if the overall spending envelope is relaxed or tightened. This can be downloaded from www.ifs.org.uk/ff/diysr.xls. Capital intensive departments are likely to be hardest hit, given that the plan for 2011–12 to 2013–14 is to cut investment spending sharply while current spending grows modestly. Squeezing investment spending much tighter than current spending would seem to fly in the face of the Labour Government’s longstanding insistence that it is important to protect investment, despite short term funding pressures, to support long run productivity.23 Capital-intensive departments such as Transport and Communities & Local Government (who are involved with local housing) are likely to be particularly concerned. Not only do these departments have a high proportion of their DELs accounted for by capital (for example in 23 See for instance: HM Treasury, Planning sustainable public spending: lessons from previous policy experience, November 2000 and HM Treasury, The Government’s fiscal framework, November 2008.
33
2007–08 the Department for Transport’s capital DEL, excluding depreciation, was 48% of its total DEL), but they also account for a significant proportion of total public sector net investment. Of total gross public sector investment in 2008–09, 22% went on transport and 19% went on housing. With public sector net investment being cut so sharply over 2011–12 to 2013–14 these departments will almost certainly be among the hardest hit. Between now and the general election, the political parties will come under growing pressure to identify the relative winners and losers from the looming spending squeeze. The Conservative Party has promised that it will not cut NHS spending in real terms over the course of the next Spending Review period, and that it will remain on course to increase overseas development aid to the United Nations target of 0.7% of Gross National Income by 2013. If these areas are ring-fenced, then the remaining DELs would need to be reduced by 4.9% a year or 14% cumulatively by 2013–14. Spending from 2014–15 onwards As described in Section 4.1, the Treasury is planning a further fiscal tightening of 3.2% of national income over the period from 2014–15 to 2017–18, but it provided no details other than that investment spending is to be protected from this phase of cuts (because the tightening is assumed to come in the form of a reduction in the current – i.e. non-investment – budget deficit). The fiscal year 2014–15 is beyond the Government’s normal planning horizon. It lies beyond the next spending review period, and could even lie beyond the next parliament. It is therefore more than likely that the expected size and composition of the required fiscal consolidation will change long before we get to 2014–15. But what if a future government did wish to reduce the structural current budget deficit by 3.2% of national income over 2014–15 to 2017–18? If this was to be achieved entirely by controlling spending, it would imply average annual real growth of 0.4% a year in total spending over that four-year period. Alternatively the Government could choose to raise more tax revenue instead. If half of the fiscal tightening came from spending and half came from taxes, this would imply average annual real growth in spending of 1.4% over the four years. If all the tightening came from tax increases, and none from spending, then total spending would rise by 2.4% a year on average in real terms, reflecting the Treasury’s view of trend growth in the economy (2½%) reduced slightly by the fact that the Treasury believes the economy will be recovering slightly from temporary weakness (and therefore spending on cyclical spending will grow less quickly). Whichever scenario you look at, public spending seems set for a protracted squeeze compared to the relatively rapid rates of real growth seen under Labour to date. One way to judge the extent of the squeeze on how much central government is spending on public services is by looking at the projected path of DELs as a share of potential national income (thereby avoiding the problem that when the economy is performing below potential, the level of spending is boosted as a share of actual national income). As Figure 4.3 illustrates, current Treasury plans (including those outlined in their leaked internal forecasts for DEL in 2011–12, 2012–13 and 2013–14) show spending by Whitehall on public services and administration being reduced to its lowest level since 2002–03 by the end of the next Spending Review period. If half the fiscal tightening beyond 2013–14 takes the form of further cuts in DELs, then they will be reduced below the level that Labour would have inherited from the Conservatives, had spending been divided between DELs and AME at that time. If all the additional tightening takes the form

34
of further cuts in DELs, then they will be reduced further still. In any event, much of the rise in spending on public services under Labour to date looks set to be reversed when measured as a share of national income. Figure 4.3 Departmental Expenditure Limits as % of potential national income
Source: Authors’ calculations based on HM Treasury, Budget 2009 and internal HM Treasury forecasts of DEL growth over the period 2011–12 to 2013–14.
4.3 Alternative scenarios for the composition of the tightening The previous section described the implications of the incomplete spending plans set out in Budget 2009 on spending on public services. In setting out final spending plans, the Government and the opposition will be conscious that they have a choice between squeezing public services and making people directly financially worse off – either through increases in taxes or through cuts to social security benefits or tax credits. The trade-off between making individuals financially worse off and reducing spending on public services is shown in Figure 4.4 for two different paths for reducing total borrowing over the period from April 2011 to March 2014. First, the blue line shows the trade-off if public borrowing is to be reduced over this period as planned in Budget 2009. As discussed in the previous section, making no further changes to taxes, tax credits or benefit payments24 would require an overall reduction in DELs of 2.9% a year over Spending Review 2010 to deliver the spending plans set out in Budget 2009. Alternatively, a reduction in DELs could be avoided if a combination of increases in tax and cuts to spending on welfare benefits with a combined value equivalent to 2.1% of national income (£930 per family or £29 billion in total a year in today’s terms) were implemented. Real increases in DELs would require a larger amount to be raised from increasing taxes or cutting 24 Apart from our assumption that the Government’s aspiration to increase the Basic State Pension in line with average earnings is put back from April 2012 to April 2015.

35
welfare payments, and measures to cut taxes or increase welfare payments would only be possible if DELs were to be cut back by more than 2.9% a year. Second, the red line shows the trade-off if the government wished to reduce borrowing over this period more sharply, specifically if it wished to accomplish the entire fiscal tightening in four years rather than eight (as in the “accelerate” path for fiscal tightening shown in Figure 3.9). Under this scenario cuts to DELs could only be avoided if a combination of tax increases and cuts to welfare spending were implemented with a value equivalent to £2,325 per family in today’s terms, or £73 billion a year. If any tax increases or cuts to welfare benefits were to be avoided then cuts to DELs averaging 7.8% a year would need to be delivered. Neither of these scenarios seems plausible. If the reduction in DELs were kept to 2.9% a year – the figure that we estimate would be required under current Government policy – then a combination of tax increases and cuts to welfare benefits would need to be implemented with a combined value equivalent to 3.1% of national income (£1,400 per family or £44 billion a year).25 Figure 4.4: Accelerating the fiscal tightening – the trade-off between spending cuts and tax increases, 2011–12 to 2013–14.
Source: Authors’ calculations based on figures in HM Treasury, Budget 2009 and internal HM Treasury forecasts of DEL growth over the period 2011–12 to 2013–14. 4.4 Options for spending cuts In the absence of very large tax increases, whoever wins the next election will need to make significant cuts in public spending to reduce public sector borrowing as quickly as the Treasury currently intends – let alone to do so more rapidly. A range of options 25 The required discretionary tax increase (or benefit cut) that we calculate is needed is smaller than the full additional fiscal tightening that the Treasury is looking to achieve (3.2% of national income) because some savings would automatically be made in debt interest spending if the tightening were to be implemented earlier.

36
exists. Vince Cable MP, the Liberal Democrat deputy leader and shadow chancellor, outlined on 15th September 2009 the most comprehensive set of proposals for spending cuts that we have so far seen from any spokesperson of the three main UK political parties.26 He has pointed to many areas in which he believes there is potential to make savings in public spending. Amongst other things he suggests that spending could be reduced by: (i) freezing the public sector wage bill (though not necessarily the pay of every individual public sector worker), (ii) reducing benefit payments to higher income families with children, (iii) abolishing the Child Trust Fund, (iv) scrapping Identity Cards, (v) reducing the level of central control over devolved spending areas, and (vi) reducing planned purchases of defence equipment and improving procurement procedures. He has also proposed reforming public sector pensions, which though not producing immediate savings in public spending would ultimately be likely to reduce future spending. Mr Cable has also argued that the Government is planning to load too much of the looming spending squeeze on capital rather than current spending. This section briefly discusses some possible spending cuts in areas in which we have expertise, leaving aside other proposals that have been put forward by the main UK parties – such as the abolition of Identity Cards (proposed by the Conservatives and the Liberal Democrats) and the scaling back of the UK’s nuclear deterrent (proposed by the Liberal Democrats). Many other options also exist. Social security benefits and tax credits Both the Conservatives and the Liberal Democrats have suggested that better-off families with children should not be eligible for tax credits. One-way to do this would be to taper the family element of the child tax-credit away at 39% immediately upon the exhaustion of the child element of the child tax credit. This would mean that a family with two children would no longer receive tax credits if their income exceeded about £31,000 per year (assuming the family is not entitled to or does not claim help with registered childcare). Researchers at the IFS estimate that this measure would raise roughly £1.3 billion a year. If the motivation for this reform is a belief that better off families with children should not be eligible for state support then this might also justify tapering away child benefit in the same way. Researchers at the IFS estimate that this would raise around a further £4.5 billion a year, giving a total saving of roughly £6 billion or 0.4% of national income. In the 2006 White Paper Security in Retirement: Towards a New Pensions System27 the government stated (p. 17): “During the next Parliament, we will re-link the uprating of the basic State Pension to average earnings. Our objective, subject to affordability and the fiscal position, is to do this in 2012, but in any event by the end of the Parliament at the latest. We will make a statement on the precise date at the start of the next Parliament.” Restoring the link between the basic state pension and average earnings is projected by the DWP to cost £0.7 billion in 2012–13, £1.4 billion in 2013–14 and continuing to rise thereafter. The Government could decide to push this back, not least as it would have been difficult to imagine a worse fiscal position when the paragraph was drafted in 2006. If, however, the earnings-indexation of the Basic State Pension is deemed integral to the rest of the recent pension reforms – such as the introduction 26 V. Cable, Tackling the fiscal crisis: A recovery plan for the UK, 15th September 2009, London: Reform (http://www.reform.co.uk/LinkClick.aspx?fileticket=RQ0obqjHA9A%3d&tabid=118) 27 Available on DWP website at http://www.dwp.gov.uk/policy/pensions-reform/security-in-retirement/white-paper/.

37
of Personal Accounts that is also planned for 2012 – then the Government might decide that it would be better to cut back on other benefits aimed at pensioners. For example, the abolition of Winter Fuel Payments (to which households containing an individual aged 60 and over are eligible) and Free TV Licences (to which households containing an individual aged 75 and over are eligible) would raise £2.7 billion a year. Across the board reductions in welfare benefits could deliver large spending cuts – although the impact would be to reduce the incomes of many of those on the lowest incomes and with the greatest needs. For example, in 2010–11 the Budget forecasts that total spending on social security benefits and tax credits will be £192.7 billion. If retail price inflation averaged 2½% a year, then a back-of-the-envelope calculation suggests that freezing these benefits in cash terms would save £15 billion a year after three years (roughly 1% of national income). Those who remained dependent on state benefits for their income would be the biggest losers from such a policy. Asset based welfare The recent asset-based welfare policies – the Child Trust Fund and the planned nationwide rollout of the Saving Gateway in 2010 – could also be deemed more marginal areas of public spending.28 With the Child Trust Fund it might be felt that families with children are better served through policies concentrated on increasing their incomes (from which they can choose to save if they want) or on improving the quality of public services they receive than they are through a lump-sum payment at birth that cannot, in normal circumstances, be accessed until the child reaches age 18. The Liberal Democrats have said that they would abolish the Child Trust Fund, which would save around £½ billion a year. With the Saving Gateway, it might be questioned whether lower income individuals should be encouraged to reduce their current spending or whether they might be better served through policies aimed at increasing their incomes. Abolition of the Saving Gateway would save an estimated £130 million in 2012–13 but the savings would fall gradually to just £60 million a year.29 Public-sector pay and pensions The national accounts suggest that total public sector remuneration (pay and employer pension contributions) in 2007 was £170 billion. Therefore every 1% taken off public sector remuneration would lead to a saving of £1.7 billion a year. One way to bring about a reduction in spending on public sector remuneration would be to implement very tight control of wages. However, a better policy would focus on the total pay bill rather than wage levels. This is because it would allow public sector employers to increase some wage levels if they felt this was appropriate and they were able to offset this increase through, for example, reduced staff numbers. It would be more sensible still to focus on total remuneration, including the annual accrual of rights within defined benefit pension arrangements. For example a policy of further reductions 28 See, for example, C. Emmerson, Should the Child Trust Fund be abolished? IFS Observation, September 2009 (http://www.ifs.org.uk/publications/4602). A detailed discussion of the merits of these policies can be found in C. Emmerson and M. Wakefield (2001), The Saving Gateway and the Child Trust Fund: Is asset-based welfare 'well fair'? , Commentary No. 85, London: Institute for Fiscal Studies (http://www.ifs.org.uk/publications/1). 29 Costing from Paragraph 10.2 of HM Revenue and Customs, Explanatory Memorandum To The Saving Gateway Accounts Regulations 2009, (http://www.uk-legislation.hmso.gov.uk/si/si2009/draft/em/ukdsiem_9780111483404_en.pdf).

38
in the generosity of public sector pension arrangements with increases in wages could be preferred by public sector workers and also benefit the taxpayer more (in the long run) than just holding wages down. However such a policy, while potentially sensible, would require a long-sighted Government as it would actually increase rather than reduce spending in the near term. This is because reduced generosity of unfunded public sector pension obligations would not materialise into lower spending until the affected public sector workers drew their pension. For example a sensible reform might involve retaining defined benefit pension arrangements – as the Government can credibly promise to provide such schemes to employees and therefore might be able to use them to attract and retain staff at a lower overall cost to the taxpayer – but with future accrual being made less generous. With unfunded public sector schemes such a reform would only reduce public spending when current public sector workers began to receive their pensions. 4.5 Options for further tax increases This or a future Government has many options if it wishes to accomplish part of the fiscal tightening through further tax increases. The official “Ready Reckoner” lists the amounts that the Treasury believes could be raised from changes in the key rates and allowances, although the actual revenue raised would depend on how people’s behaviour was affected.30 If a government wished to raise revenue quickly and simply, it would likely change the rates or allowances for some of the taxes that already raise large sums, rather than creating new taxes or dramatically increasing the role of existing small taxes. By way of illustration, increasing i) the standard rate of VAT, ii) the basic rate of income tax or iii) the main rates of National Insurance Contributions for employees and the self-employed by 1p would each raise roughly £4½ billion or 0.3% of national income in 2011–12. Increasing the higher 40p income tax rate by 1p would raise roughly £1.4 billion. Freezing the income tax personal allowance in cash terms in 2011–12, 2012–13 and 2013–14 would raise roughly £3.7 billion if retail price inflation evolves as the Treasury has assumed in its Budget 2009 forecasts. If the government wanted to raise significant sums in additional tax revenue (accepting the public unhappiness that is likely to result) then ideally it would take the opportunity to do so in a way that improves the structure of the tax system. For example, economists have long pointed to the inefficiencies inherent in the VAT system. The Government could raise additional revenues and improve the efficiency of the tax system by abolishing the VAT zero-rating of certain goods. Though some vulnerable groups would be likely to be made worse off by this policy in isolation, it could be accompanied by an offsetting increase in other support directed at these groups. Depending on the exact design of the policies, such a course of action could still raise additional revenues whilst, on average, not making vulnerable groups any worse off. For example the main rate of VAT could be extended to children’s clothing with child benefit rates being increased by the average amount that low income families spend on children’s clothes. On average this would ensure that low income families with children were no worse off but would raise revenue as higher income families with children, on average, would be worse off (since they typically spend more than low income families with children on new children’s 30 http://www.hmrc.gov.uk/stats/tax_expenditures/table1-6.pdf

39
clothes). In addition to raising revenue such a reform would simplify the tax system (as it would no longer need to specify and police what counted as children’s clothes) and would remove the current incentive to buy new children’s clothes rather than other goods that are currently subject to a higher rate of VAT. The IFS is currently hosting the Mirrlees Review of the tax system.31 This will suggest fruitful areas for reform and outline how best additional revenue should be raised if required. 4.6 Asset sales Some commentators have mooted using the sale of public sector assets as a substitute for spending cuts or tax increases in bringing about the fiscal tightening. Selling public sector assets is sensible where these are deemed not to be delivering sufficient benefits to justify their retention. But additional asset sales (beyond those already pencilled in by the Treasury in Budget 2009) will only reduce the structural budget deficit to the extent that paying off some additional debt reduces the interest payments the government has to make each year in the future. This implies that asset sales will probably only be able to make a small contribution to filling the fiscal hole that the Treasury has identified. 5. Conclusions Dealing with the fiscal consequences of the recent economic and financial crisis is likely to be one of the defining domestic challenges confronting whichever party wins the next general election – and possibly the general election after that. Notwithstanding the unusual degree of uncertainty that surrounds the economic and fiscal outlook over the next few years, the electorate deserves as full an account as possible of how each party would confront this challenge, so as to make an informed choice between them on polling day. If the Treasury’s analysis in Budget 2009 is correct, the crux of the fiscal problem is that the amount the Government will need to borrow to bridge the gap between its spending and tax revenue once the economy has recovered is around 6.4% of national income (or £90 billion a year in today’s terms) larger than it thought in Budget 2008. Leaving this increase in the structural deficit unaddressed would see public sector net debt rise to unsustainable levels, even if borrowing costs stay low. The costs of the Government’s financial rescues, the temporary increase in borrowing during the recession, and the costs of the temporary fiscal stimulus package all push the peak level of debt higher, but they are of (at best) second-order importance in determining the broad trajectory of the debt burden. In PreBudget Report 2008 and Budget 2009 the Government pencilled in the outlines of a fiscal tightening that would increase gradually to 6.4% of national income, or £90 billion in today’s terms, over eight years, thereby offsetting the increase in the structural budget deficit from 2017–18 onwards. Extending the Treasury’s projections, this would see debt roughly double from pre-crisis levels, to a little under 80% of national income, before declining again to pre-crisis levels by the early 2030s. 31 http://www.ifs.org.uk/mirrleesreview
40
There seems little obvious reason to expect the Treasury to take a very different view of the scale of the problem in PreBudget Report 2009, although Vince Cable for one has argued that it is bigger than the Treasury thinks. But there is now a lively debate over the timescale of the tightening. On the one hand, with the UK one of only two G20 countries planning to move from fiscal stimulus to tightening in calendar year 2010, there are arguments for delaying the tightening to give the economic recovery time to take firmer hold. On the other hand, there are arguments for accelerating the tightening to help reduce the chances that investors increase the interest rates at which they are prepared to lend to the government. Getting the pain over more quickly would also have political attractions, especially if there is a change of government in which the new incumbents feel they can blame their predecessors for the need to take action (and for the pain caused by such action). The best strategy would seem to be to complete the tightening as quickly as possible, subject to the ability of the Bank of England to sustain the recovery at a satisfactory rate through the use of monetary policy. Turning to the composition of the tightening, the Government is currently planning to rely on spending cuts to achieve 80% of the tightening over the first four years – including a very sharp squeeze on public sector capital investment. This implies a very tough set of settlements for the next Spending Review, which will allocate resources to departments over the three years 2011–12, 2012–13 and 2013–14. Plausible assumptions for the growth of debt interest and social security payments point to the tightest squeeze on public services since the spending cuts negotiated with the International Monetary Fund in the late 1970s. And the more some areas of spending are insulated from the squeeze, the harsher the consequences for the remainder. Over the second half of the tightening, the Government has indicated that it would not squeeze capital spending further as a share of national income, leaving the work to be done by further cuts in current spending and as-yet unannounced tax increases. Treasury figures suggest that Labour will have increased central government spending on public services by 5.9% of potential national income between 1998–99 and 2009–10. Current plans imply that almost three-quarters of this increase will be reversed by 2013–14, returning this definition of spending to its level in 2002–03. If at least half of the tightening beyond 2013–14 was to be accomplished through spending cuts, then all Labour’s increase in spending on public services as a share of potential national income would likely be reversed. This or a future government could choose to loosen the squeeze on public services by achieving more of the tightening through tax increases or cuts in the generosity of social security payments. We estimate that to avoid real cuts in DELs over the next Spending Review would require tax increases or benefit cuts worth £29 billion (2.1% of national income) or £930 per family in today’s terms by 2013–14. If an incoming Government chose to achieve the tightening over four years rather than eight then it would need tax increases or benefit cuts averaging £1,400 per family or £44 billion (3.1% of national income) a year to avoid a tighter squeeze on DELs. Alternatively, it would need to cut DELs by 7% a year in real terms to avoid the need for further tax increases or cuts in benefits.