brita case segmentation corrected oct2007€¦ · to order insead case studies please contact one...
TRANSCRIPT

10/2007-5426
BRITA: In Search of a Winning Strategy
This case was prepared by Nina Paavola, Research Associate, under the supervision of Amitava Chattopadhyay, the L’Oréal Chaired Professor of Marketing-Innovation and Creativity at INSEAD, and Douglas C. Milliken, Vice President Brand Development, The Clorox Company, as the basis for class discussion rather than to illustrate either effective or ineffective handling of an administrative situation.
Please note this case is accompanied by 9 videos. For more information, see: www.ecch.com.
Copyright © 2007 INSEAD
N.B. PLEASE NOTE THAT DETAILS OF ORDERING INSEAD CASES ARE FOUND ON THE BACK COVER. COPIES MAY NOT BE MADE WITHOUT PERMISSION.

Copyright © 2007 INSEAD 1 10/2007-5426
Introduction
It was March 2006, and the leaden California sky outside Greg Frank’s office only served to accentuate his anxiety. The newly appointed Vice-president and General Manager for the Brita SBU sat wondering about what strategy to recommend. Top management was concerned about the dip in performance since 1999 and the inability of the team to turn Brita’s fortunes around during the years that had subsequently elapsed. Their concern was heightened by the fact that, as one of the company’s flagship brands Brita was expected to contribute through double-digit top line growth. On his appointment, it had been made clear to Frank that management was reaching the end of its patience; he had been given six months to come up with a clear strategy to turn the brand’s fortunes around. It was now five months since Frank had started working on the problem and the executive committee meeting at which he would have to present the new strategy was just a week away.
Brita’s Background
Brita GmbH started out as a small German company producing household water filters which were sold mainly in health food stores. When a marketing executive for The Clorox Company came across a Brita pitcher in a Californian store in 1987, he thought it was a clever product that could meet a growing consumer need and find a place in every American home.1 Deciding that water filtration could fit in among the company’s wide portfolio of household products, Clorox gained the right to market the Brita product in the US in 1988. Based on the value proposition that it provided great tasting water, Brita grew rapidly over the next ten years to become one of the company’s flagship brands, grossing almost $200 million in revenues each year. Not only was the pitcher itself the front-runner among filtration products, but sales of the replacement filters continued to provide a consistent revenue stream.
Clorox made a big marketing push in the first four years, and although sales of the pitcher grew, they were dwarfed by promotion, distribution, and design costs. The branding team spent quite a bit of time simply explaining the product and why it was important. The “How it works” advertising from 1993, for example, showed how to use the Brita pour-through system (PT). Accompanying a shot of the product, the voiceover gave a step-by-step description of how it functioned: “To operate, turn on the tap. The tap water flows through Brita’s replaceable filter … copper and lead are dramatically reduced, chlorine taste and odor virtually eliminated… But even if you don’t remember how Brita works, you’ll never forget how Brita tastes…” (See accompanying videos). Once the branding team felt that consumers understood the product and how to use it, the advertising moved on to build on the brand’s positioning of “tap water transformed” with a new more emotive advertising campaign, called
1 The Brita brand is a part of the portfolio of brands owned by The Clorox Company, a leading consumer
products company with fiscal year 2005 revenues of $4.39 billion. With 7,600 employees worldwide, the company manufactures products in 25 countries and markets them in more than 100 countries. The company hosts a variety of brands, including household cleaning products such as Pine-Sol, Tilex, and Formula 409; laundry products, such as Clorox Bleach and Oxi Magic; Armor All and STP products in the line of auto care; Kingsford charcoal; Glad bags, wraps and containers; dressings and sauces, and cat litter.

Copyright © 2007 INSEAD 2 10/2007-5426
the “Waterfall” campaign (“There Was A Time”, “Sunrise”, “Where You Live”; see accompanying videos),
As a result of its efforts, by 1999 Brita was available nationally through typical mass channels: supermarkets, drug stores, hardware stores, outlets like Target and Wal-Mart, and club stores like Costco – over 40,000 in total. Brand awareness stood at 70%. An estimated 18% of the 103 million households in the US were using a Brita pitcher. Moreover, more than 80% of customers who bought pitchers were still using them a year after purchase. Word-of-mouth and gift purchases were also taking the brand a long way. Brita had created a home water purification industry worth $350 million at retail, and held a 71% revenue share. Over the years more than 70 competitors had tried to enter the market but failed.
The Clorox Company
The Clorox Company was organized into SBUs and Brita was its own SBU. Frank, as GM of the Brita SBU, had a cross-functional leadership team comprising of VP or director level people in Marketing, Sales, R&D, Product Supply, F&A and Legal reporting to him. Each function had a full team of people who reported to that director or VP. The functional leaders also had a dotted line report into the corporate head of each function, e.g. head of global R&D or Sales. Within each SBU there were multiple brand groups: in Brita’s case, a pour-through brand group, a faucet mount brand group, and a new products group.
Competition
During the 1990s, competition came mainly from other water filtration brands. Culligan, Electrolux, Sunbeam, Kenwood, Corning, Melitta, PUR, Rubbermaid, Teledyne, Omni, and Mr Coffee all had competitive products on the market soon after Brita’s launch. Most were pitched around concerns of safety and health, a topic that was sensitive among consumers, especially after some notable outbreaks of illness related to tap water from municipal water filtration systems.
The competition also rolled out new innovations for home filter use. At the 1998 International Housewares Show in Chicago, PUR introduced a faucet mounted filter (FM) that screwed onto the tap itself. Not only was this an alternative product to the PT filter, but the PUR filter also eliminated certain illness-causing bugs such as cryptosporidium and giardia, benefits that were consistent with its “removal of impurities” positioning. PUR’s activities appeared to pay dividends as it was the only brand that seemed to gain on Brita, the market leader with 65-75% market share.
In 1998, in response to the heightened competitive environment, Clorox put in place a dedicated R&D team to support product development for Brita. From its inception the R&D team focused on the science of removing contaminants such as lead, copper, arsenic and other chemicals of concern to public health. Notwithstanding this initiative, PUR continued to grow and by 1999 had grabbed a double-digit percentage share of the market, although Brita remained the industry star. The same year, while Brita was still contemplating whether to roll out an FM product, Procter and Gamble bought the PUR filter company.

Copyright © 2007 INSEAD 3 10/2007-5426
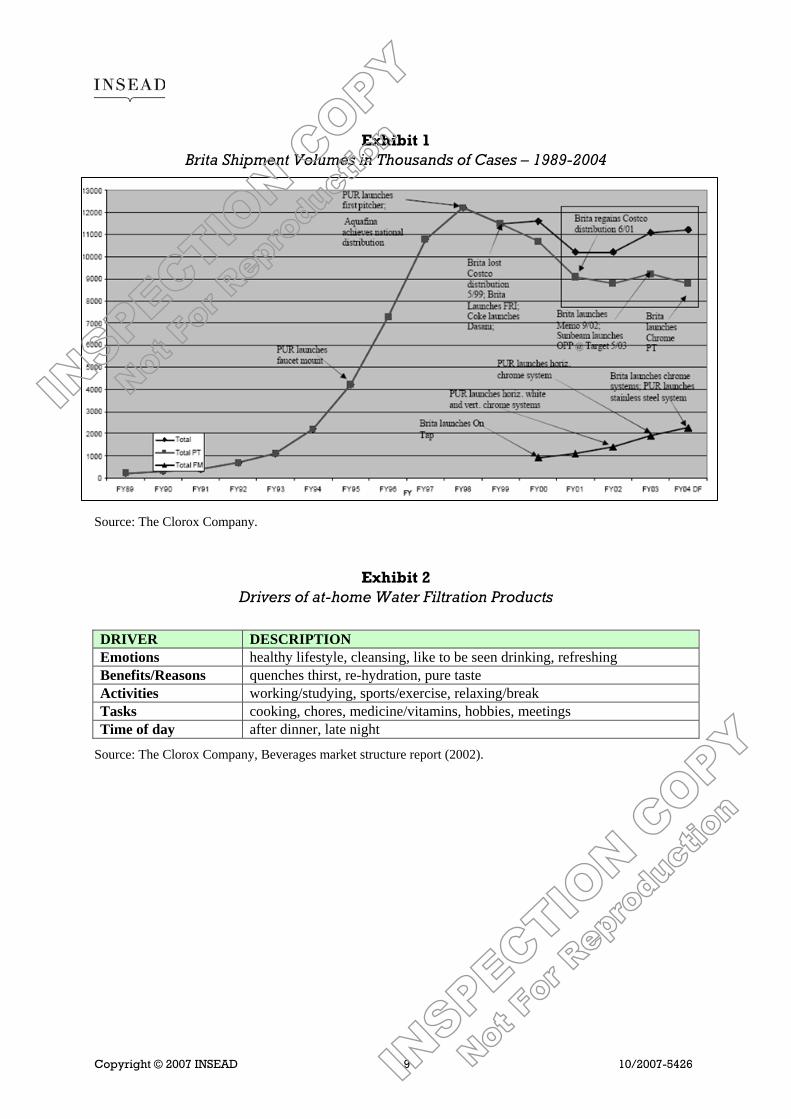
As the decade drew to a close, in addition to growing competition from players like PUR, which had more teeth under its new owners, the business of filtered water also changed, especially the pitcher (PT) category. By 1997, bottled water made up 8% of all liquids that people paid to drink and was the industry’s fastest-growing category. In 1999, for the first time since its launch a decade earlier, Brita’s sales declined, and declined abruptly (see Exhibit 1).
Brita since 1999
Brita finally did join the FM category, somewhat behind the pack, but successfully executed the product launch in 1999, supported by a strong spending plan. But, despite its growth, it only achieved about a 35% share in this category, compared with PUR’s 65%. While business in the filtration category in general was beginning to experience some growth thanks to the FM system, the core pitcher business remained stagnant. As the Brita team struggled to find its feet after the rapid industry shift, it tried several strategies over the years that followed in an attempt to get the brand growing again.
Strategy 1: Where does Water Belong?
Its first strategy was based on the findings of a customer survey focusing on how consumers viewed the beverage category as a whole and what they considered to be substitute products. The research examined the beverage consumption diaries, at-home and away-from-home, of 660 households (more than 1,700 persons on 20,156 drinking occasions), and established a barometer of consumer attitudes of filtration systems, bottled water, and tap water (see Exhibits 2 and 3).
The consultants who analyzed the study results concluded that to compete successfully Brita must become more than “cleaned up tap”: it should quit the water business within which PT systems, FM systems, and tap water all existed. Brita needed to leverage more than the taste and re-hydration benefits common to all types of water (even tap), they insisted; it should not come across as an appliance or a system but a beverage. It should compete with other refreshments from soft drinks to iced tea, and be marketed as a desirable, healthy alternative to other non-water beverages. Within this set of products, they believed, Brita would enjoy a much larger space to source volume and therefore achieve growth.
They suggested that Brita differentiate itself from other “cleaned up tap” by focusing on the emotional drivers of water consumption. People drink water because it is refreshing, cleansing and healthy, and for what it does for outward appearances – they like to be seen drinking it. The positioning based on the “healthy lifestyle” connection could be the same for PT and FM products, as they were overlapping businesses with similar consumers, uses, and reasons for consuming. Such a strategy would strengthen the brand by sending a single message to consumers, regardless of the PT or FM product choice.2 Based on the findings of the report a number of advertisements were drafted around the new brand promise of healthy refreshment (see “Be” and “Thirsty Anthem” on accompanying videos). Ultimately, however, in light of qualitative consumer research, the team decided not to pursue this approach.
2 Source: “Beverages market structure” Henry Rak Consulting Partners.

Copyright © 2007 INSEAD 4 10/2007-5426
Strategy 2: Bottled Water as the Bad Guy
Bottled water consumption grew tremendously during the 1990s, to the extent that it could be found in nearly every home in the US, and was seen by the Brita team as the main cause of the brand’s volume declines. The brand positioning thus needed to change to compete directly against bottled water. The new advertising campaign abandoned the “tap water transformed” positioning seen in the “Waterfall” advertising campaign, as it had become irrelevant in a world of bottled water ubiquity, in favour of “Bottled water taste without the bottle”, as seen in the “Filter Story” advertisement. The new message was that with Brita you had an unlimited supply of great tasting water. Some within Clorox remained skeptical about this direction as they felt that it was difficult to get people who were happy with their choice of bottled water to switch to Brita (see Exhibits 3B and 4 for consumer perceptions). Nevertheless, the strategy had its champions and the ads were aired. But when business did not respond after a short time, the marketing director terminated the campaign.
Strategy 3: Leaky Bucket
A pattern of Brita consumer behavior known as the “leaky bucket” phenomenon was the basis for the next strategy. The team believed that fixing the bucket would fix the brand’s problems – the “leak” being customers who bought the product but eventually stopped using the brand. Typically, they first stopped changing the filter as often as they should and eventually stopped using the brand altogether. Tracker data indicated that PT was likely to be losing strength in both stages of the leaky bucket (see Table 1).
Table 1 Usage of Brita PT System, in Millions of Households
JAS3 02 OND4 02 Currently own Brita PT 30 27 No longer own Brita PT 8 11
Source: Corporate Tracker 2002.
There were several reasons for the leaky bucket; key among them the question in the consumer’s mind about what the filter was doing. Consumers grew tired of the PT filter guessing game – getting no satisfactory answer to questions like “Is it time to change the filter?” and “Is the filter working?” Once the doubt was raised, curtailed usage or an outright lapse in use was usually the outcome. Studies showed that once consumers had lapsed they were unlikely to return to PT. Of the 46% of PT users who were likely to lapse within the first year of using the system, 71% decided not to use a water filtration system and 17% adopted a different filtration system. In terms of reasons for lapsing, 17% did not notice a difference and 14% found it to be too expensive.
At the height of Brita’s PT success in 1998, consumer choice was largely limited to tap water or PT. Subsequent health and convenience trends gave rise to more alternatives to PT than
3 JAS = July, August, and September. 4 OND = October, November, and December

Copyright © 2007 INSEAD 5 10/2007-5426
ever before. Aside from bottled water, FM had seen steady growth behind aesthetically-driven innovation. Refrigerators with in-built water filtration had reached 10 million households and were expected to grow by at least 2 million units per year in 2005 and beyond. The many different sources of filtered water were perceived as similar in quality, i.e., in terms of taste and how well the impurities were removed, and consumers often made a number of trade-offs in their water choices, most using multiple sources.
According to a report by the Beverage Marketing Corporation in May 2003, bottled water was expected to surpass carbonated soft drinks as the most popular commercial beverage in the US in 2004. There were over 400 brands of bottled water, with 20% of brands driving 80% of category volume. The 2002 Beverage Usage Diary reported that approximately 50% of all bottled water was consumed at home. Thus when lined up next to the alternatives, PT systems were often perceived as inconvenient and of less value. PT was even a source of stress in the household, as one Brita PT user noted: “I got tired of being the only person in my family that refilled the pitcher.”
To fix the leaky bucket, Brita sought to boost consumer engagement through innovations that delivered a better balance of convenience and reward, reduced the thinking required to use and maintain it, and provided improved aesthetics. The result was that the brand developed and launched a “smart pitcher” with Memo technology built into the lid (Exhibit 5). By pressing a start button when they inserted a new filter, its remaining life would be counted down with the digital gauge and an indicator would flash when the filter needed replacing. Although designed to engage consumers and remind them to buy new filters, the new pitcher did not have dramatic results for several reasons. Many households did not have smart pitchers and those that did felt that the location of the gauge on the lid (rather than the filter) reduced the indicator’s relevance. By failing to show that filter replacement was related to volume, users did not see the Memo indicator as a reliable cue that the filter needed changing.
Another approach was to incorporate visual indicators to show users when to replace the filter and when the product was working properly. The “Windows” project created filters that allowed consumers to see collected sediment inside. Enhancements to the filter technology also eliminated the need to pre-soak filters. But these new initiatives failed to stem the leak.
Strategy 4: Tap Water Turn-offs
When results failed to materialize, the brand team decided to look back at a strategy used in Brita’s early days – to play on consumer doubt and fears about the impurities in tap water – i.e., to revisit the need for filtration at a time when bottled water was so prevalent. The idea was to remind consumers that tap water contained impurities, and that Brita removed them.
The brand positioning was to “transform the taste of tap”, leveraging the filter’s ability to change water from bad to good tasting. In engineering its advertising, Brita was sensitive not to convey an overly alarmist tone. The “Kid Talk” spot was aired to accomplish the objective of sowing doubt without sounding too negative (see accompanying videos). Once again, however, after a short time on the air, management felt this direction wasn’t right for the brand either.

Copyright © 2007 INSEAD 6 10/2007-5426
Strategy 5: Bottled Water as the Bad Guy, Revisited
As the popularity of bottled water continued to increase, it once again became the target of the Brita team. Arguing that its product was significantly less costly than bottled water, and for some consumers more convenient, Brita began to promote its point of difference as being an easier and cheaper alternative, via the “Simple Solution” spot (see accompanying videos). Unfortunately, this approach also failed to stop the slide.
Consumers
From reviewing the strategies followed since 1999, Greg Frank realized that somewhere along the way Brita had lost sight of its consumers. The team lacked a deep understanding of who the target consumer was and what they wanted. Thus Frank and his team looked back over consumer data from the past and new data compiled in mid-2004.
The safety of drinking water had been a growing concern throughout the 1990s and was likely to stay in the back of consumers’ minds. Notable outbreaks of water contamination, specifically in East Woburn, Massachusetts and Milwaukee, Wisconsin, had occurred when industrial solvents, as well as illness-causing parasites, got through municipal water filtration systems, resulting in cases of serious illness and a number of deaths. As apprehension and unease about tap water spread, consumers became more open to alternatives. By 1997, 55% of the US population was considered to be “water involved” – firmly believing in the importance of water to health and well-being, conscious of their water intake and the quality of the water they drank.
Notwithstanding these outbreaks, most consumer households in the US (70%) believed that their tap water was pretty good, that it tasted okay and cost nothing; 18% were dissatisfied with tap water. Of those who were dissatisfied, the group that was “very dissatisfied” with their tap water was most likely to switch to bottled water. Among the Brita users polled, 53% were satisfied with their tap water while 33% were not. Among filtration system users, Brita use was not correlated with people’s perceptions of tap water quality; Brita users were drawn to the brand because it gave them clear, clean water. Those who did not use the brand were attracted by these same benefits – removal of impurities which gives a great taste; having a drink that is clean, clear and refreshing, i.e., water is healthy.5
An ethnographic study commissioned by Brita showed that awareness of the importance of drinking water (which leads to higher consumption) was enhanced when consumers had to deal with health issues such as weight loss, kidney or bladder infection, pregnancy or complications during pregnancy, a rigorous exercise/training regimen, or being involved with family members who had a disorder like diabetes, obesity, heart condition, etc. Water consumption was also influenced by the experience with tap water, specifically taste. All consumers agreed that they drank more water when it tasted good and less when it did not.
The findings confirmed that all consumers wanted good tasting water, readily available to them and their families. There was a consensus that water is healthy/good for you; you should drink a lot of it; tap water is probably not good for you; bad tasting water is probably not good
5 Source: “Key learning: Brita Branding Project”.

Copyright © 2007 INSEAD 7 10/2007-5426
for you. Respondents with children voiced added considerations regarding what constituted good water – the level of purity and the elements it contained.
In comparing filtration system users versus non-users, the study found that users tended to have a hands-on hobby such as quilting, beading, carpentry, scrap-booking or photography. They typically cooked more and ate at home more often. Users appeared to be happier, more confident and relaxed, and tended to plan more. They were more likely to buy organic food or to be vegetarians than non-users. Non-users seemed to have certain common misconceptions such as the idea that the product required hook-up and perhaps even permission from the landlord to install. They also believed that the system was complicated and very expensive.6 The team also examined quantitative data from sources such as MRI, DDB Lifestyles and the IRI panel (Exhibit 6).
Despite the mass of information, Brita’s strategies over the past five years had all been short term and ineffective, with the result that the management was unhappy. Frank had come to the conclusion that what was needed was a definitive study to identify consumer segments so as to be able to decide which one(s) should be targeted, as the basis of a rescue strategy. The results of the new segmentation study had just come in and the central questions that needed to be addressed were which segment(s) to target and with what value proposition.
The Segmentation Study
The segmentation study was conducted using an Internet-based survey of the TNS-NFO national on-line panel. The final sample contained 2,003 respondents, a nationally representative sample evenly divided by gender that included 1,622 filtration system owners, by design. Respondents were qualified as the joint or primary decision-maker for filtration systems, were in the 18-65 age group and had consumed water at least twice in the past week.
The questionnaire assessed respondents’ general attitudes, attitudes toward consumption of beverages on a range of dimensions (e.g., health, taste, appearance, smell, convenience, price/value, influence of others, availability), detailed information on beverage consumption (e.g., sources, types, brands, at home vs. away, where purchased, amount consumed), consumption of tap water, what influenced purchase of water filtration systems, lifestyle, values and demographics.
The segmentation study identified six segments that are described in Exhibit 7. (Exhibits 8-14 provide detailed information on the segments). As Frank pondered the question of which segment(s) to target and with what value proposition, he recalled a recent conversation with Dave Carlstrom, Director of R&D, who had stressed that it was imperative to decide which benefit to offer as he simply did not have the resources or staff to pursue multiple lines of research.
For instance, if the main consumer promise was impurity removal, it would entail R&D doing very specific work, detecting new impurities and building a filter to remove them. It would imply getting into an arms race with P&G over who removed the most; to win it, R&D would have to be completely committed to the battle. Currently, Brita filters removed 9 inorganic
6 Source: “Brita target ethnographies, debrief 11/10/04, Maria James Consulting.

Copyright © 2007 INSEAD 8 10/2007-5426
impurities while PUR claimed to remove between 11 and 25, depending on the model. In faucet mounted filters, Brita removed 47 impurities while PUR claimed to remove 30.
However, if improved taste was the main benefit, R&D would need to focus more on removing taste violators like chlorine. In addition, they would need to consider things like types of plastics and filtering material to use in the product, to maximize taste. They might even add certain minerals to the water. The R&D team’s ability to quickly develop a deep understanding of what affected taste would be critical to setting out the development efforts for the future. The team would also need to develop an understanding of water nationally, as the water source had implications for taste. All in all, the focus of R&D would be very different from that associated with the promise of impurity removal.
Conclusion
The meeting with the Clorox executive committee was coming up in a week and Frank needed to articulate and support his recommendations. The key questions he had to address were: Who are the target consumers and what drives them to our category? What business are we really in, i.e., how broadly or narrowly should we define the category? What should our brand promise be in order to be differentiated and sustainable? Can our current product deliver on this promise? Do we have the R&D capability to deliver on it? What should our marketing strategy be?
Copyright © 2007 INSEAD 9 10/2007-5426
Exhibit 1 Brita Shipment Volumes in Thousands of Cases – 1989-2004
Source: The Clorox Company.
Exhibit 2 Drivers of at-home Water Filtration Products
DRIVER DESCRIPTION Emotions healthy lifestyle, cleansing, like to be seen drinking, refreshing Benefits/Reasons quenches thirst, re-hydration, pure taste Activities working/studying, sports/exercise, relaxing/break Tasks cooking, chores, medicine/vitamins, hobbies, meetings Time of day after dinner, late night
Source: The Clorox Company, Beverages market structure report (2002).

Copyright © 2007 INSEAD 10 10/2007-5426
Exhibit 3 Consumer Perceptions of Different Water Sources for Home Consumption
A. PT vs. Tap and Fridge
0
1
2
3
4
5
6
7
8
9
10Water Quality
Entry Cost
Ongoing Cost
Transportation
InstallationSpace
Usage Volume
Maintenance Simplicity
Portability
TapPTFridge
Source: The Clorox Company, Project Travolta (2004).

Copyright © 2007 INSEAD 11 10/2007-5426
Exhibit 3 Cont’d Consumer Perceptions of Different Water Sources for Home Consumption
B. PT vs. Bottled Water (BW)
0
1
2
3
4
5
6
7
8
9
10Water Quality
Entry Cost
Ongoing Cost
Transportation
InstallationSpace
Usage Volume
Maintenance Simplicity
Portability
PTBW
Source: The Clorox Company, Project Travolta (2004).
Copyright © 2007 INSEAD 12 10/2007-5426
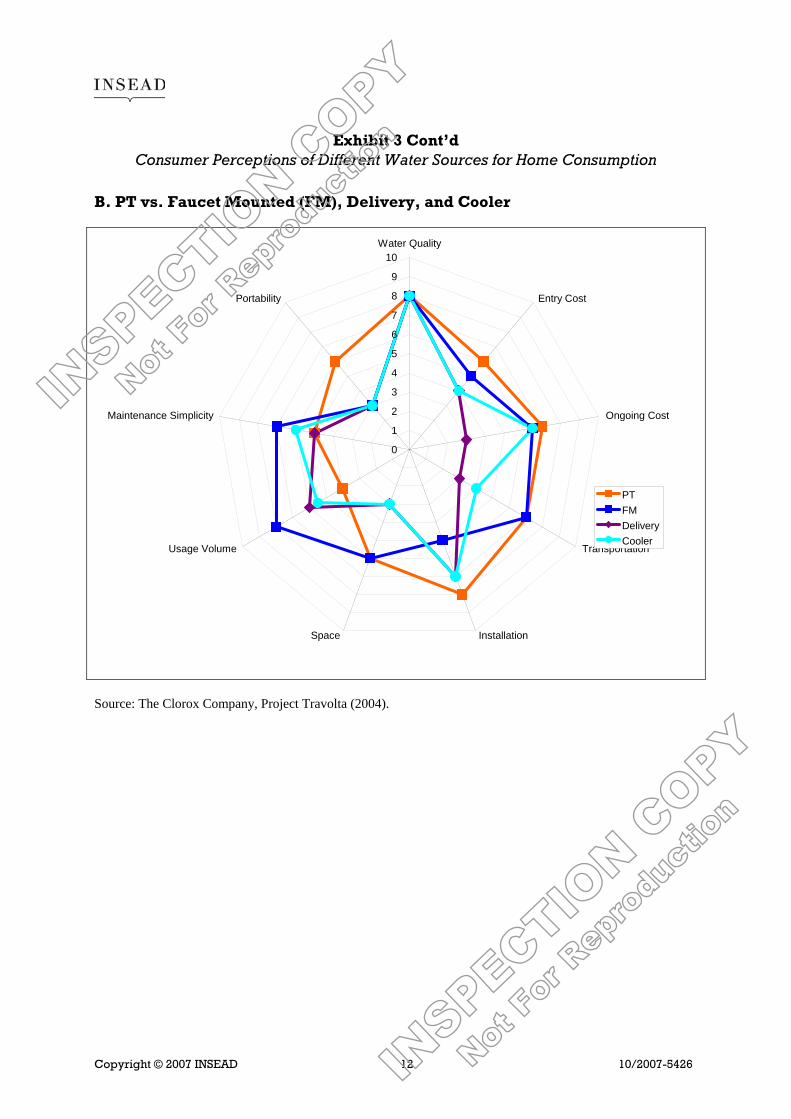
Exhibit 3 Cont’d Consumer Perceptions of Different Water Sources for Home Consumption
B. PT vs. Faucet Mounted (FM), Delivery, and Cooler
Source: The Clorox Company, Project Travolta (2004).
0
1
2
3
4
5
6
7
8
9
10Water Quality
Entry Cost
Ongoing Cost
Transportation
InstallationSpace
Usage Volume
Maintenance Simplicity
Portability
PTFMDeliveryCooler

Copyright © 2007 INSEAD 13 10/2007-5426
Exhibit 4 Perception of Bottled Water vs. Pitcher
Small Bottled Water
Filtering Pitcher
Good Flavour 77* 32 Purity 63 44 Most Affordable 35 23 Easy To use 66 32 Time Consuming 12 37
Source: Corporate equity tracker, OND 2004.
* % of bottled water consumers who associate the attributes with bottled water vs. pitchers.
Exhibit 5 Memo Pitcher
Source: The Clorox Company.
Memo: Filter usage indicator
Indicator

Copyright © 2007 INSEAD 14 10/2007-5426
Exhibit 6 Differences between Water Filtration System (WFS) Owners and Non-Owners
WFS owners WFS non-owners HEALTHY EATING Ate nutrition/energy bars 163 84 Heavy user of vitamins/supplements 132 92 Heavy user of fresh fruit/vegetables 131 92 HEALTHY LIFESTYLE Own air purifier 164 84 Participated in yoga 151 87 Exercise programme at health club 125 94 Participated in aerobics 131 92 DIY/INVOLVED WITH HOME Have a home equity loan 147 88 Own a home fire extinguisher 130 93 Purchased any home improvements 125 94 SMART CHOICES FOR FUTURE Acquired mutual funds P12M 145 89 Own any stock 133 92 Carry life insurance 125 94 TECH SAAVY Rented DVD 135 91 Banked by Internet 133 92
Source: MRI Database 2004, extracted from “Where we will play – Consumer target”.
NOTE: An index of 100 means that this activity is as prevalent within this group as it is within the general population. An index of 150 means that a person in this group is 50% more likely to do this than someone in the general population.

Copyright © 2007 INSEAD 15 10/2007-5426
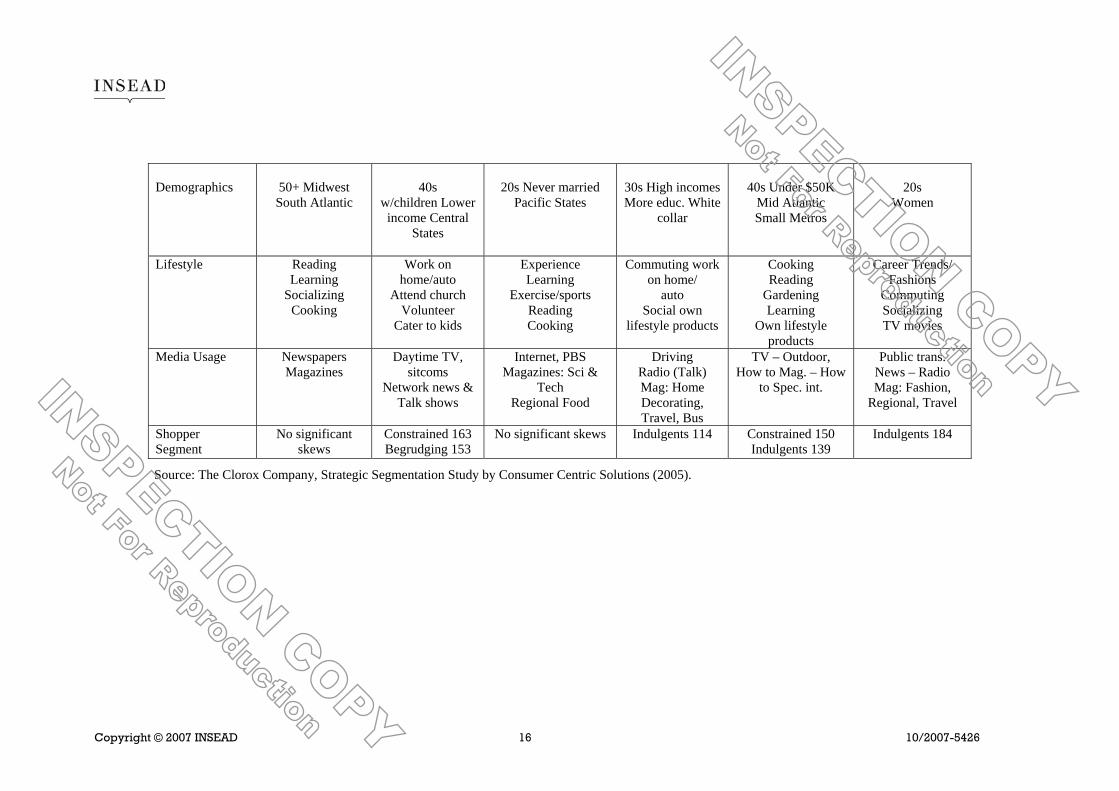
Exhibit 7 Segmentation Profile Summary
Segment Name Tap traditionalists Weary Tap Satisfied Principled Filter Fans Affluent Fridge
Followers Assertive Self
Improvers BW Indulgers
Size 17.2% 14.2% 17.4% 14.2% 10.4% 11.7% Primary source Tap Tap Filtered Filtered Split Bottled Type of Filtration N/A N/A Pitcher Refrigerator Pitcher/Faucet N/A
Sound Bite “I have a clear set of values, and
don’t make a big deal over
something that isn’t broken.”
“So much to do and so little time. With all that is on my mind, water is
the least of my concerns.”
“Some things are important and worth doing right, and that includes where I get
my water.”
“I’m always busy, but maintain a
certain quality of life. Drinking
more water is part of it.”
“I take control of my life and do the things that lead to self enrichment – sometimes with a
certain flare.”
“I am career focused, but in
making sacrifices, I believe in
rewarding myself.”
General Attitudes
Family centered Optimistic
Casual Pragmatic
Over-extended Stressed out
Weary Budget conscious
Adventurous Principled
Health Oriented Frugal
Living well Affecting change
Enjoy social settings
Self-confident Empowered
Creative Diligent
Achievement driven
Self rewarding Quality minded
Attitudes Toward Water
Tap water is free,
natural. Prefer to drink
water
Tap water is just fine.
Drinking other beverages is fine
too
Filtered water is healthier than tap.
Use it for everything
Filtered helps control weight.
Serve it to guests. Have refrig.
system
Drink a lot of water – it keeps me
healthy.
Love bottled water Keep it accessible. Makes life simpler
Tap satisfaction index 220 171 43 81 121 34
Copyright © 2007 INSEAD 16 10/2007-5426
Demographics
50+ Midwest South Atlantic
40s
w/children Lower income Central
States
20s Never married
Pacific States
30s High incomes More educ. White
collar
40s Under $50K
Mid Atlantic Small Metros
20s
Women
Lifestyle Reading Learning
Socializing Cooking
Work on home/auto
Attend church Volunteer
Cater to kids
Experience Learning
Exercise/sports Reading Cooking
Commuting work on home/
auto Social own
lifestyle products
Cooking Reading
Gardening Learning
Own lifestyle products
Career Trends/ Fashions
Commuting Socializing TV movies
Media Usage Newspapers Magazines
Daytime TV, sitcoms
Network news & Talk shows
Internet, PBS Magazines: Sci &
Tech Regional Food
Driving Radio (Talk) Mag: Home Decorating, Travel, Bus
TV – Outdoor, How to Mag. – How
to Spec. int.
Public trans. News – Radio Mag: Fashion,
Regional, Travel
Shopper Segment
No significant skews
Constrained 163 Begrudging 153
No significant skews Indulgents 114 Constrained 150 Indulgents 139
Indulgents 184
Source: The Clorox Company, Strategic Segmentation Study by Consumer Centric Solutions (2005).

Copyright © 2007 INSEAD 17 10/2007-5426
Exhibit 8 Water Consumption (# of 8oz. glasses per day) by Segment
Source: The Clorox Company, Strategic Segmentation Study by Consumer Centric Solutions (2005).

Copyright © 2007 INSEAD 18 10/2007-5426
Exhibit 9 Source of Water Consumed (%HH) by Segment
49
.1
24
.2
25
96
.2
82
.5
55
.8
34
.4
67
.7
95
.5
86
.8
54
.3
60
.8
69
.1
52
.3
56
.5
52
.6
38
.7
47
.3
54
.6 58
99
.7
24
.4
10
.8
17
.8
11
.5
14 3
1.9
37
.3
0
20
40
60
80
100
Total TapTraditionalists
Weary TapStaisfied
Principled FilterFans
Affluent FridgeFollowers
Assertive SelfImprovers
BW Indulgers
Filtered Water Tap Water Individual Bottled Water Bulk Bottled Water
Source: The Clorox Company, Strategic Segmentation Study by Consumer Centric Solutions (2005).

Copyright © 2007 INSEAD 19 10/2007-5426
Exhibit 10 Primary Source of Water (%HH) by Segment
Source: The Clorox Company, Strategic Segmentation Study by Consumer Centric Solutions (2005).

Copyright © 2007 INSEAD 20 10/2007-5426
Exhibit 11 Type of Filtered Water Consumed (%HH) by Segment
Source: The Clorox Company, Strategic Segmentation Study by Consumer Centric Solutions (2005).

Copyright © 2007 INSEAD 21 10/2007-5426
Exhibit 12 Segment Penetration
Principled Filter Fans
Affluent Fridge
Followers
Assertive Self
Improvers
Total Sample 348 284 208
Use Any Filtered Water (FW) at Home 96.0% 82.5% 55.8%
Use FW from Pitcher or Faucet Mount 73.9 9.5 23.1
Use FW from Refrigerator Filter System 15.2 78.9 27.4
Own Pitcher Filtering System 59.6% 6.7% 15.9%
Own Brita 50.9 5.3 9.1
Own PuR 9.5 1.4 1.9
Own Faucet Mount Filtering System 26.2% 3.5% 9.1%
Own Brita 17.5 2.1 6.3
Source: The Clorox Company, Strategic Segmentation Study by Consumer Centric Solutions (2005).

Copyright © 2007 INSEAD 22 10/2007-5426
Exhibit 13 Triggers of the Purchase Process for a Water Filtering System
Principled Filter Fans
Affluent Fridge
Followers
Assertive Self
Improvers Heard about impurities in water supply 34.2 15.9 25.8
Quality of water supply changed 22.0 10.0 19.2
Moving to a new home 21.0 25.6 20.2
Tried filtered water somewhere else 19.2 13.9 22.2
Friends/relatives recommend it 19.0 9.2 14.6
Moving to a new city 9.0 7.0 9.1
Received as a gift 8.1 4.5 5.1
Saw a display in store 7.9 7.8 7.1
Saw advertising 6.8 5.8 11.6
Saw a coupon/sale price 6.8 3.6 4.5
Got pregnant/had a baby 5.6 2.8 4.0
Began new physical activity/began exercising 4.3 1.1 4.0
Got married 4.1 3.6 2.5
Gave up or stopped drinking coffee/soft drinks/juice
3.8 2.2 4.5
Developed health problems 2.9 2.2 4.5
Went on a diet 2.7 3.1 3.5
Doctor/dietician recommended it 2.3 1.7 3.0
Attending school/college/university away from home 1.8 1.1 1.5
Illness of a friend/family member 1.4 2.5 1.0
Source: The Clorox Company, Strategic Segmentation Study by Consumer Centric Solutions (2005).
Copyright © 2007 INSEAD 23 10/2007-5426
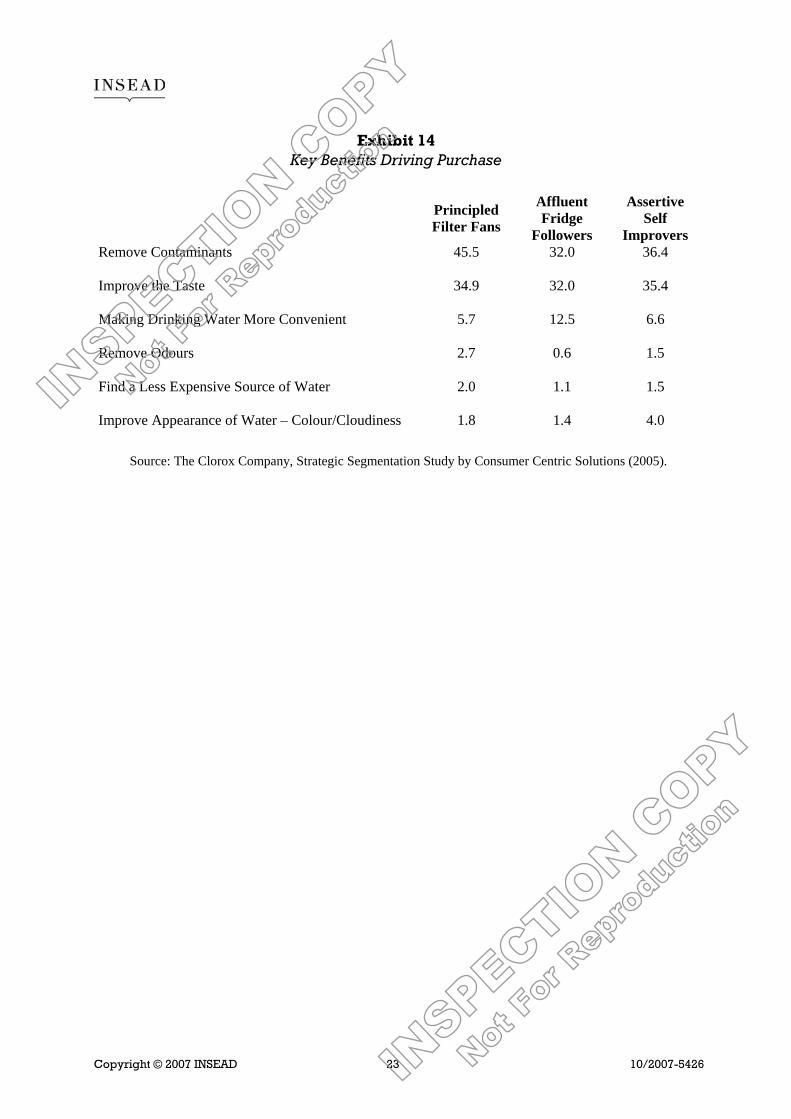
Exhibit 14 Key Benefits Driving Purchase
Principled Filter Fans
Affluent Fridge
Followers
Assertive Self
Improvers Remove Contaminants 45.5 32.0 36.4
Improve the Taste 34.9 32.0 35.4
Making Drinking Water More Convenient 5.7 12.5 6.6
Remove Odours 2.7 0.6 1.5
Find a Less Expensive Source of Water 2.0 1.1 1.5
Improve Appearance of Water – Colour/Cloudiness 1.8 1.4 4.0
Source: The Clorox Company, Strategic Segmentation Study by Consumer Centric Solutions (2005).
To order INSEAD case studies please contact one of the three distributors below:
ecch, UK and USA Centrale des Cas et de Médias Pédagogiques
ecch UK Registered Office: ecch USA Registered Office: www.ecch.com www.ecch.com www.ccip.fr/ccmp/ Tel: +44 (0)1234 750903 Tel: +1 781 239 5884 Tel: 33 (0) 1.49.23.57.25 Fax: +44 (0)1234 751125 Fax: +1 781 239 5885 Fax: 33 (0) 1.49.23.57.41 E-mail: [email protected] E-mail: [email protected] E-mail: [email protected]
Boulevard de Constance, 77305 Fontainebleau Cedex, France. 1 Ayer Rajah Avenue, Singapore 138676 Tel: 33 (0)1 60 72 40 00 Fax: 33 (0)1 60 74 55 00/01 www.insead.edu Tel: 65 6799 5388 Fax: 65 6799 5399 Printed by INSEAD