bringing the sas legacy into the r environment - meetupfiles.meetup.com/1406240/bringing the sas...
TRANSCRIPT
Bringing the SAS Legacy into the R Environment
A Brief Talk for SAS and non-SAS Data Professionals
www.directeffects.net Georgette Asherman, 201 673-4301
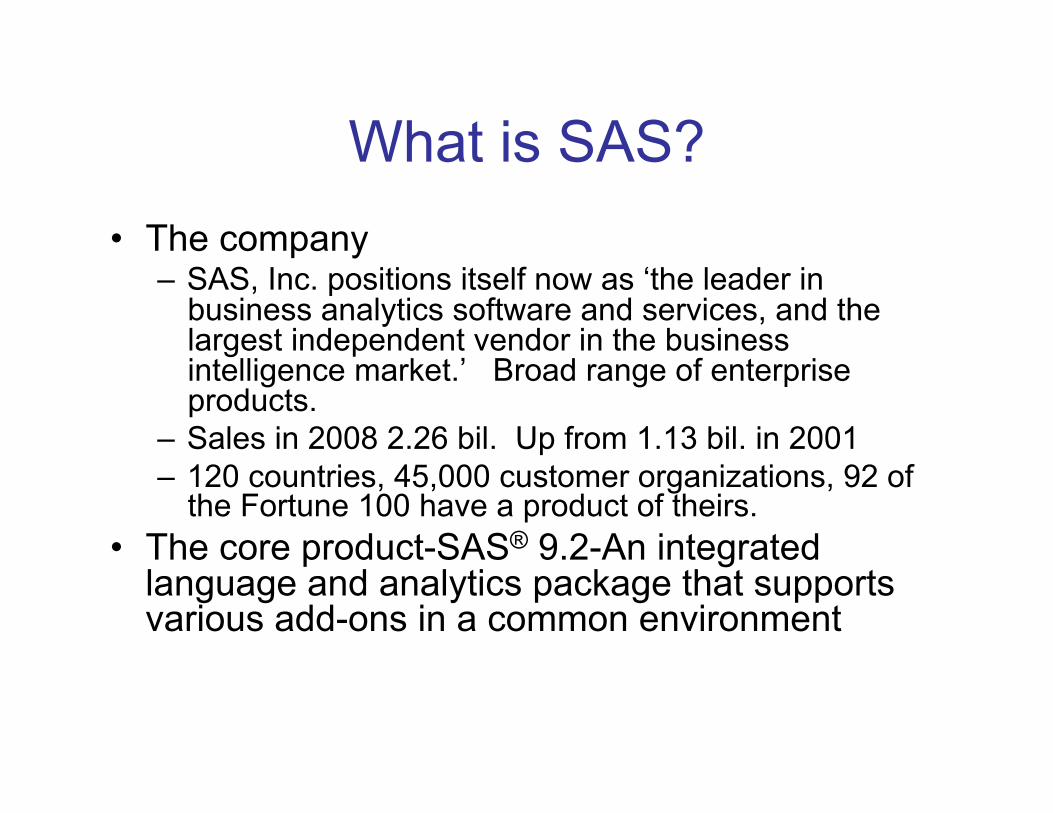
What is SAS? • The company
– SAS, Inc. positions itself now as ‘the leader in business analytics software and services, and the largest independent vendor in the business intelligence market.’ Broad range of enterprise products.
– Sales in 2008 2.26 bil. Up from 1.13 bil. in 2001 – 120 countries, 45,000 customer organizations, 92 of
the Fortune 100 have a product of theirs. • The core product-SAS® 9.2-An integrated
language and analytics package that supports various add-ons in a common environment
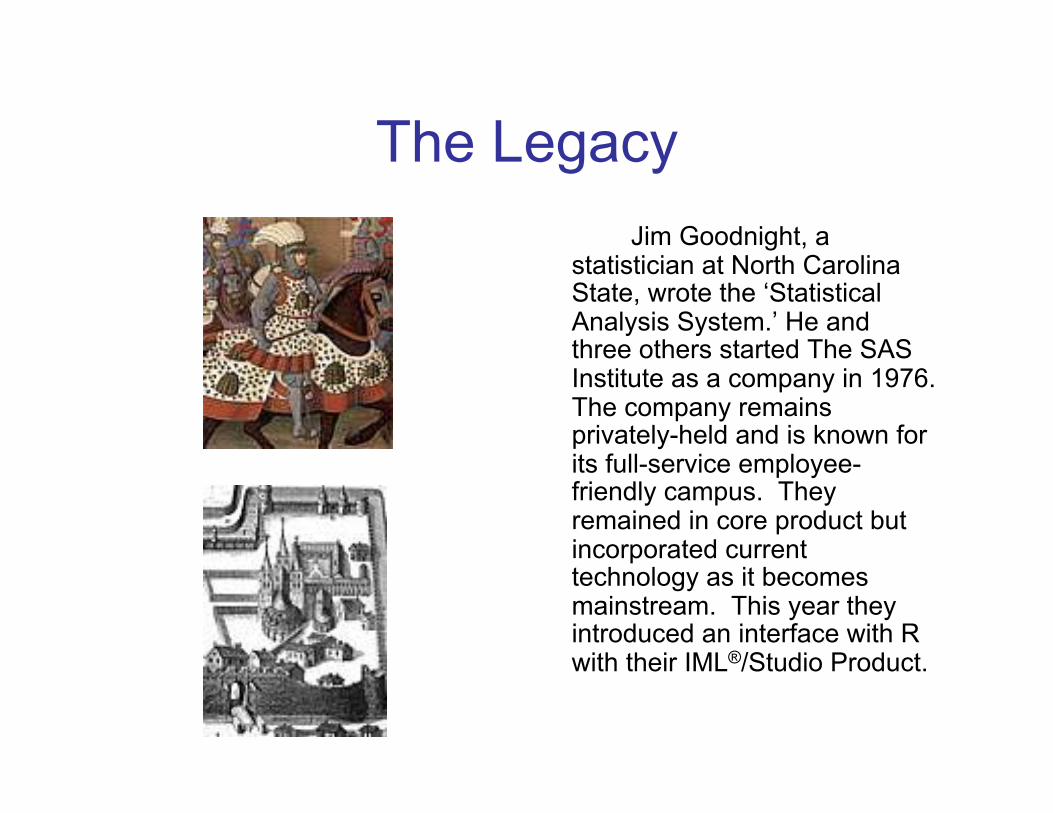
The Legacy Jim Goodnight, a
statistician at North Carolina State, wrote the ‘Statistical Analysis System.’ He and three others started The SAS Institute as a company in 1976. The company remains privately-held and is known for its full-service employee-friendly campus. They remained in core product but incorporated current technology as it becomes mainstream. This year they introduced an interface with R with their IML®/Studio Product.
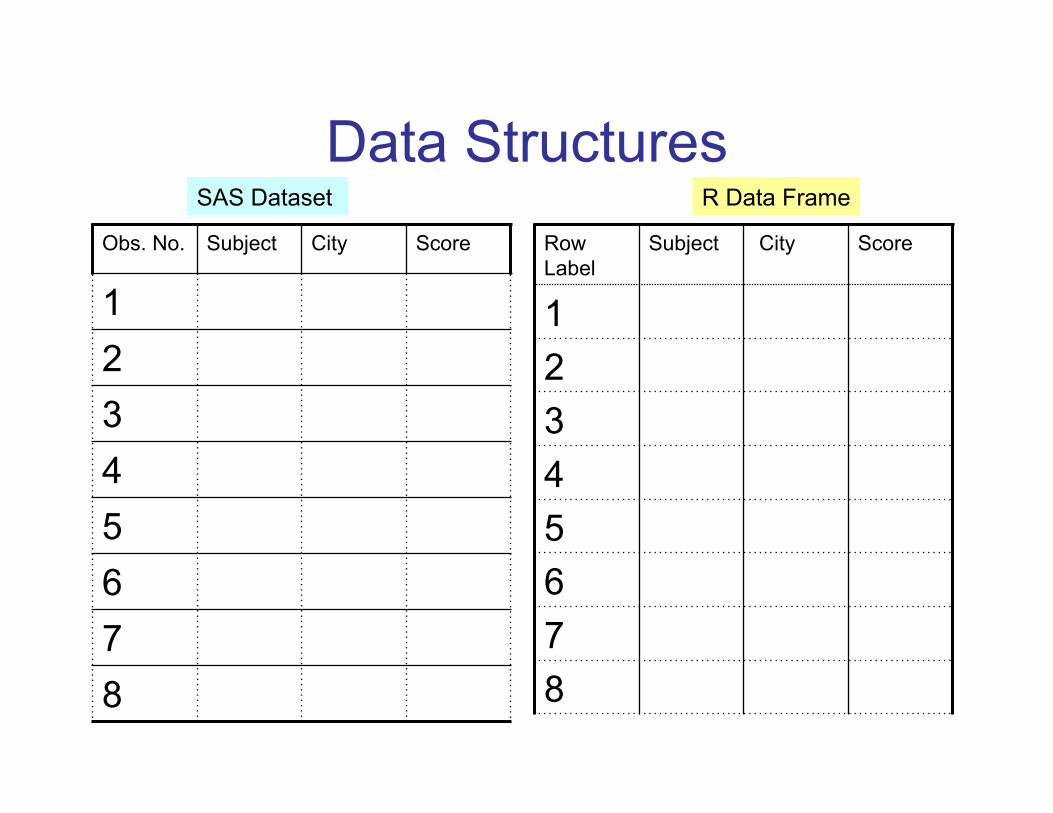
Data Structures Row Label
Subject City Score
1 2 3 4 5 6 7 8
Obs. No. Subject City Score
1 2 3 4 5 6 7 8
R Data Frame SAS Dataset
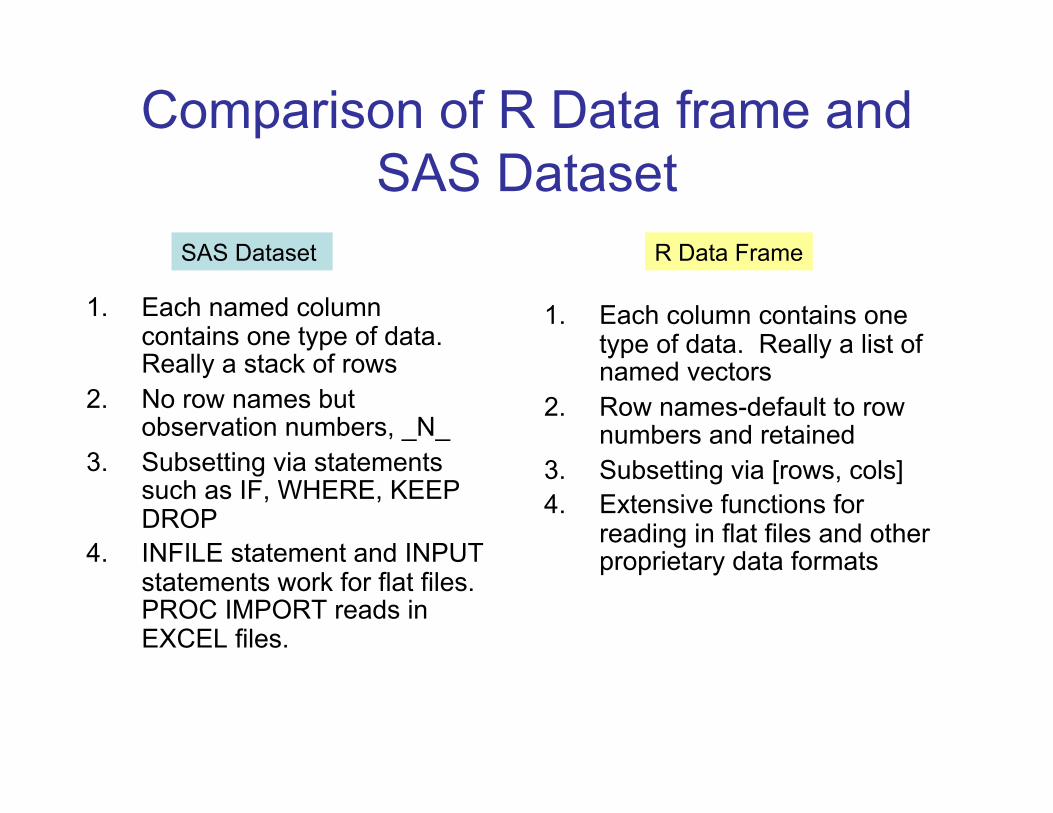
Comparison of R Data frame and SAS Dataset
1. Each column contains one type of data. Really a list of named vectors
2. Row names-default to row numbers and retained
3. Subsetting via [rows, cols] 4. Extensive functions for
reading in flat files and other proprietary data formats
1. Each named column contains one type of data. Really a stack of rows
2. No row names but observation numbers, _N_
3. Subsetting via statements such as IF, WHERE, KEEP DROP
4. INFILE statement and INPUT statements work for flat files. PROC IMPORT reads in EXCEL files.
R Data Frame SAS Dataset
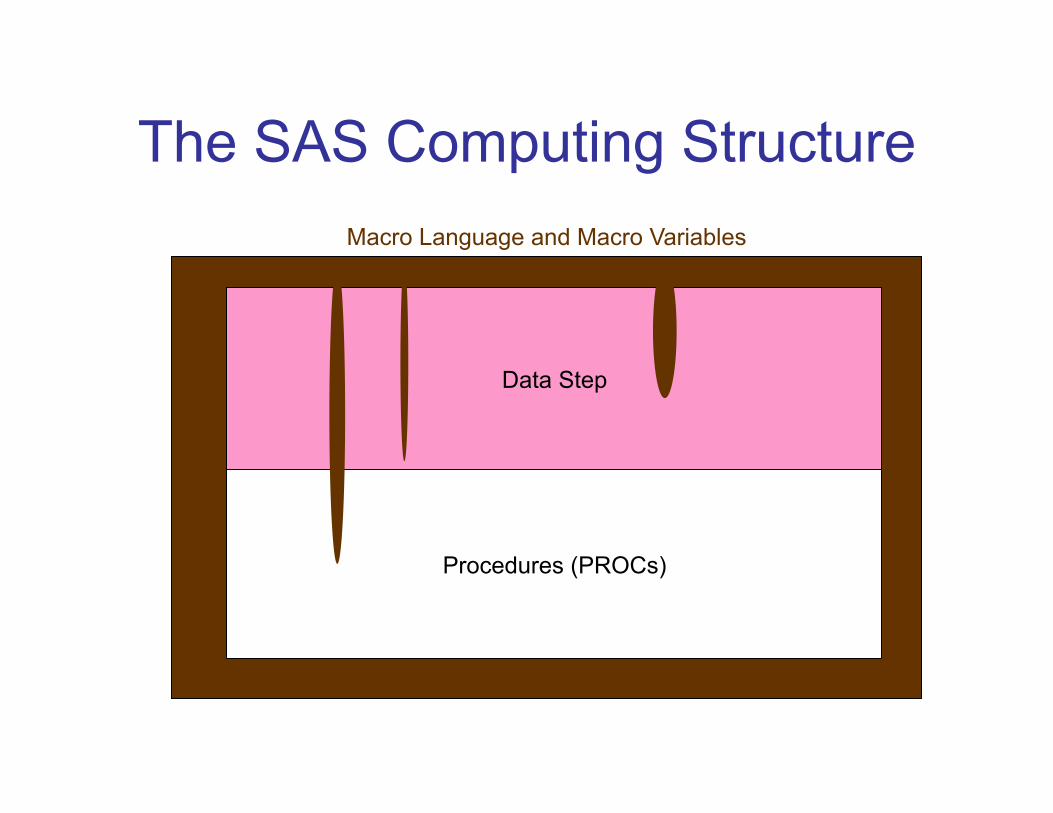
The SAS Computing Structure
Procedures (PROCs)
Data Step
Macro Language and Macro Variables

A SAS Session in Windows
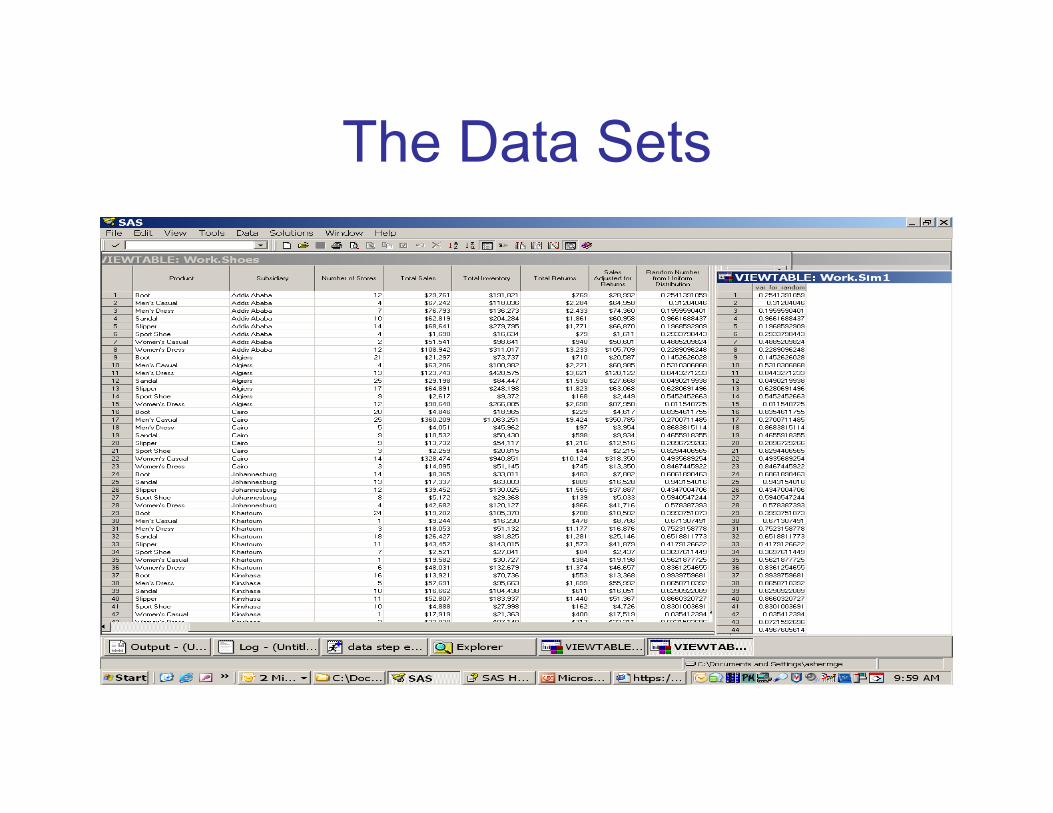
The Data Sets

Why people love SAS load(file = “filesfromSAS.RData”) shoes$netsales<-shoes$sales-shoes$returns set.seed(23) shoes$var.for.random<- runif(nrow(shoes)) #need Hmisc package to add variable
labels str(shoes) #Hmisc also has something more like
PROC CONTENTS
proc contents data =sashelp.shoes; run; data work.shoes; set sashelp.shoes; netsales=sales-returns; var_for_random=ranuni(23); label netsales="Sales Adjusted for Returns" var_for_random="Random Number from Uniform Distribution"; format netsales dollar8.0; run;
Language not case sensitive!
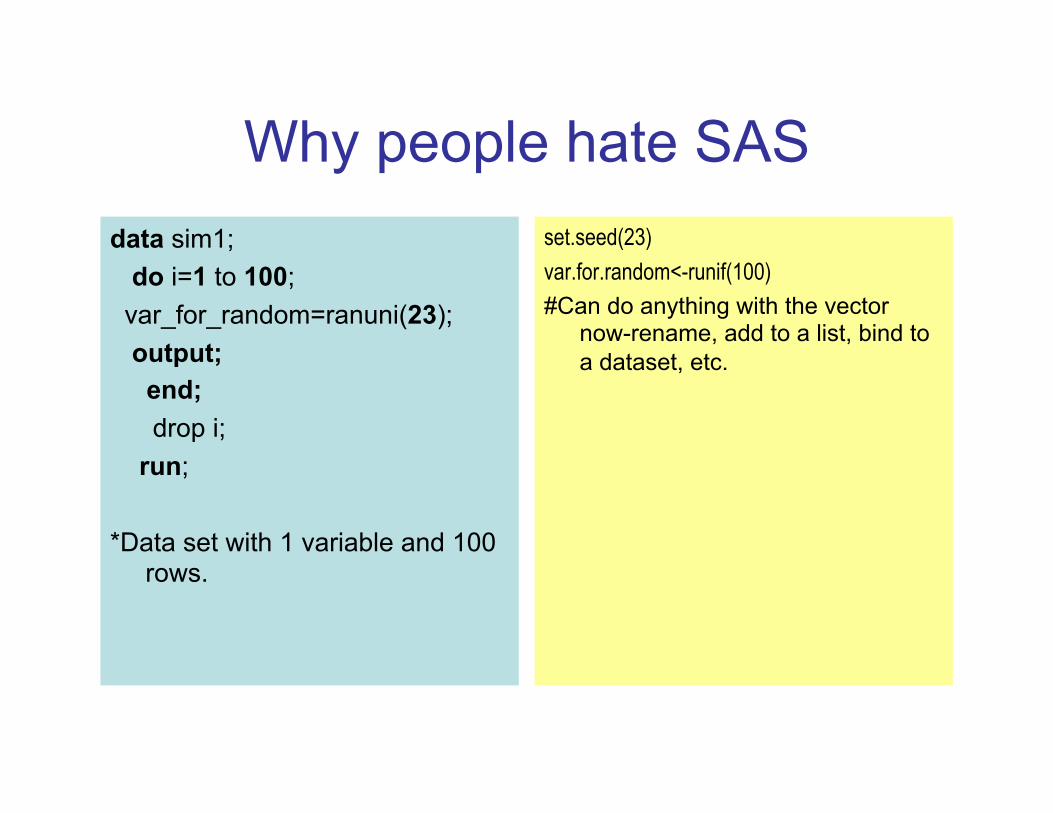
Why people hate SAS data sim1; do i=1 to 100; var_for_random=ranuni(23); output; end;
drop i; run;
*Data set with 1 variable and 100 rows.
set.seed(23) var.for.random<-runif(100) #Can do anything with the vector
now-rename, add to a list, bind to a dataset, etc.

The SAS Concept of Output In Version 8.0, SAS introduced the Output Delivery System (ODS). This new language structure freed users from the default text-based list output. It allows the following:
• Send output to RTF, EXCEL, HTML and PDF formats. • Modify output with template language. • Modify default output and access requested output as
SAS datasets. • Retained OUTPUT statement for older procedures but
new procedures now use ODS statements to make data sets for statistics, residuals and other analysis files.
• New ODS Graphics in Version 9.2.
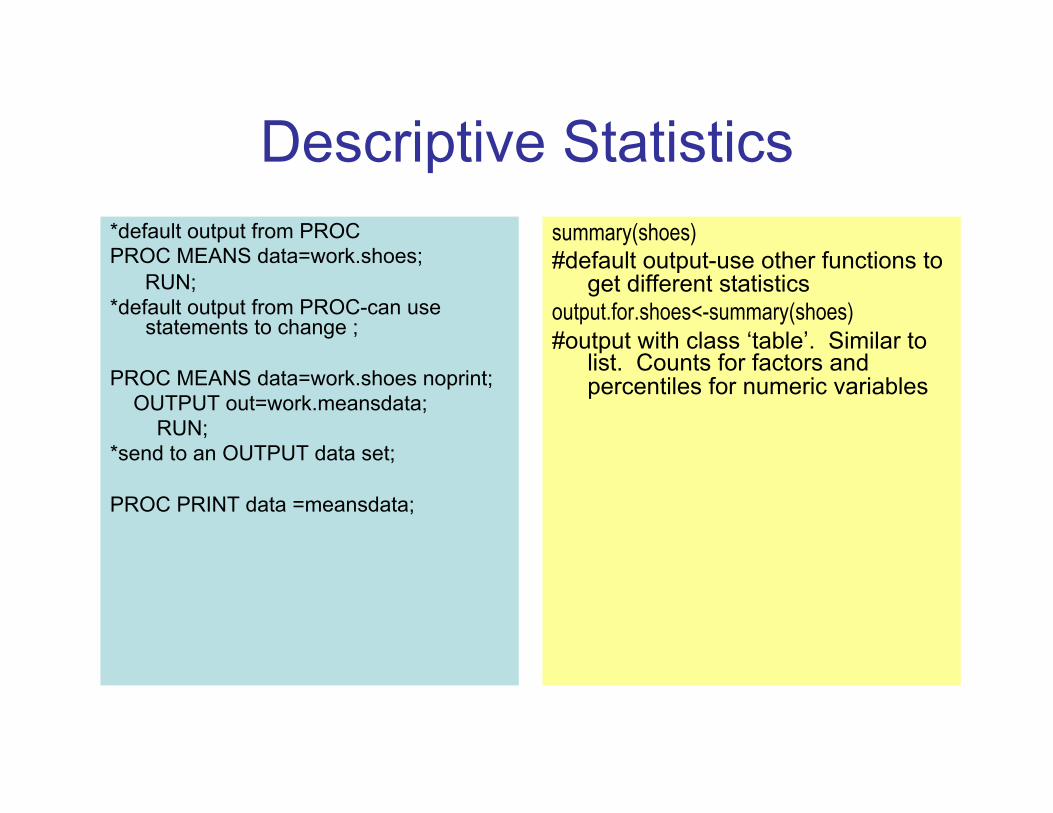
Descriptive Statistics *default output from PROC PROC MEANS data=work.shoes; RUN; *default output from PROC-can use
statements to change ;
PROC MEANS data=work.shoes noprint; OUTPUT out=work.meansdata; RUN; *send to an OUTPUT data set;
PROC PRINT data =meansdata;
summary(shoes) #default output-use other functions to
get different statistics output.for.shoes<-summary(shoes) #output with class ‘table’. Similar to
list. Counts for factors and percentiles for numeric variables
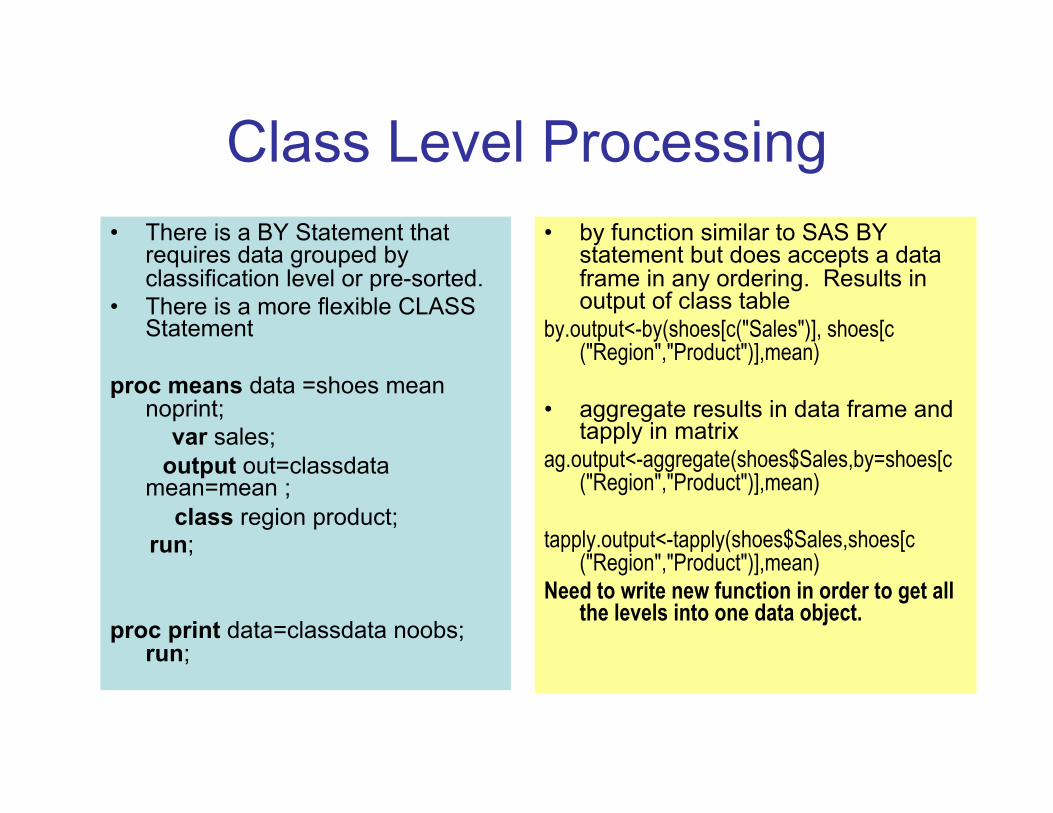
Class Level Processing • There is a BY Statement that
requires data grouped by classification level or pre-sorted.
• There is a more flexible CLASS Statement
proc means data =shoes mean noprint; var sales;
output out=classdata mean=mean ; class region product;
run;
proc print data=classdata noobs; run;
• by function similar to SAS BY statement but does accepts a data frame in any ordering. Results in output of class table
by.output<-by(shoes[c("Sales")], shoes[c("Region","Product")],mean)
• aggregate results in data frame and tapply in matrix
ag.output<-aggregate(shoes$Sales,by=shoes[c("Region","Product")],mean)
tapply.output<-tapply(shoes$Sales,shoes[c("Region","Product")],mean)
Need to write new function in order to get all the levels into one data object.
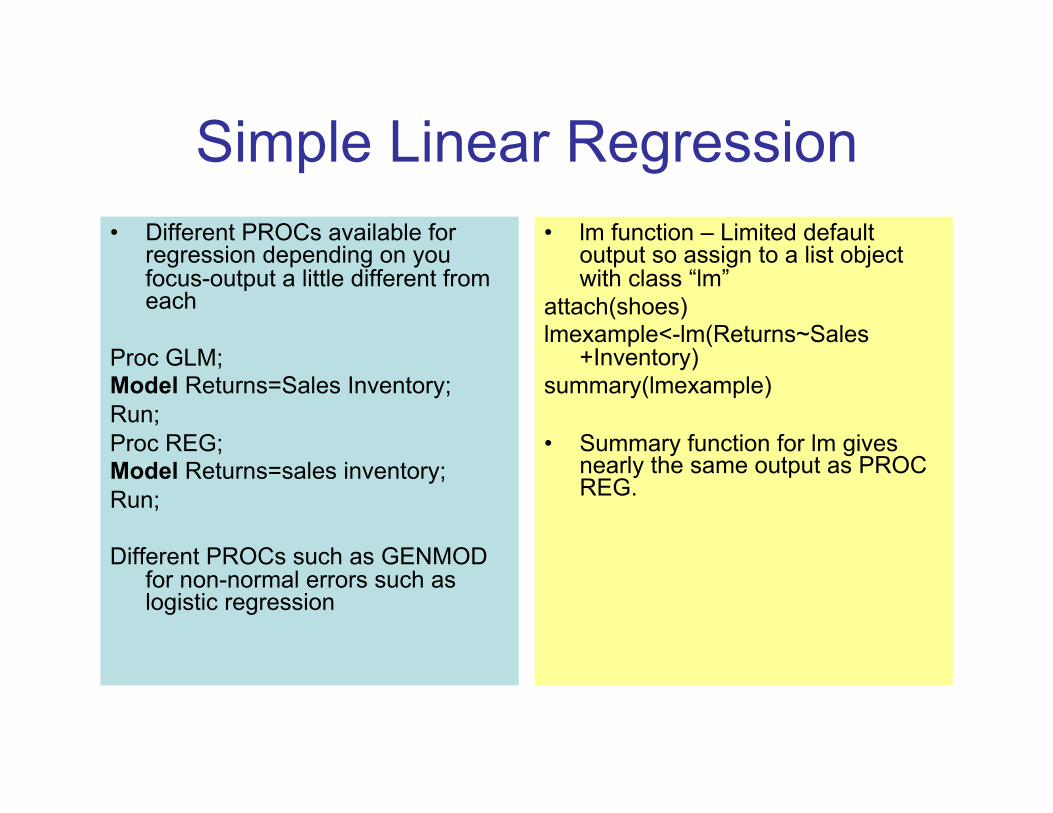
Simple Linear Regression • Different PROCs available for
regression depending on you focus-output a little different from each
Proc GLM; Model Returns=Sales Inventory; Run; Proc REG; Model Returns=sales inventory; Run;
Different PROCs such as GENMOD for non-normal errors such as logistic regression
• lm function – Limited default output so assign to a list object with class “lm”
attach(shoes) lmexample<-lm(Returns~Sales
+Inventory) summary(lmexample)
• Summary function for lm gives nearly the same output as PROC REG.
Recommended Books R For SAS and SPSS Users, Robert A. Muenchen,
Springer Science & Business Media: New York, 2009 Applied Statistics and the SAS Programming
Language, 5th ed. Ronald P. Cody and Jeffrey Smith, Prentice Hall: New York, 2005
The Little SAS Book: A Primer, 4th ed.Lora Delwich and Susan Slaughter, SAS Institute: Cary 2008
Documentation and support available on SAS Website www.support.sas.com SAS and IML are registered trademarks of SAS, Inc. See txt and rtf files for output discussed in this talk.