bringing lessons from the world
DESCRIPTION
Bringing lessons from the world. 23 March 2009 Prof. Andreas Schleicher Head, Indicators and Analysis Division OECD Directorate for Education. This session. 1 . There is nowhere to hide - PowerPoint PPT PresentationTRANSCRIPT

11U
nive
rsity
of M
inne
sota
Mar
ch, 2
2 20
09B
ringi
ng L
esso
ns fr
om th
e W
orld
’s T
op P
erfo
rmer
s to
Min
neso
ta
Bringing lessons from the world
23 March 2009
Prof. Andreas SchleicherHead, Indicators and Analysis Division
OECD Directorate for Education

22U
nive
rsity
of M
inne
sota
Mar
ch, 2
2 20
09B
ringi
ng L
esso
ns fr
om th
e W
orld
’s T
op P
erfo
rmer
s to
Min
neso
taThis session
1. There is nowhere to hide Why the yardstick for educational success is
no longer improvement by national standards but the best performing systems internationally
2. Benchmarking education internationally Where we are – and where we can be
– Where the US and other countries stand in terms of quality and equity of schooling outcomes
– What the best performing countries show can be achieved
3. How we can get there Some policy levers that emerge from
international comparisons

33U
nive
rsity
of M
inne
sota
Mar
ch, 2
2 20
09B
ringi
ng L
esso
ns fr
om th
e W
orld
’s T
op P
erfo
rmer
s to
Min
neso
ta
There is nowhere to hideThe yardstick for success is no longer improvement by national
standards but the best performing education systems

44U
nive
rsity
of M
inne
sota
Mar
ch, 2
2 20
09B
ringi
ng L
esso
ns fr
om th
e W
orld
’s T
op P
erfo
rmer
s to
Min
neso
taA world of change in baseline
qualificationsApproximated by percentage of persons with high school or equivalent qualfications
in the age groups 55-64, 45-55, 45-44 und 25-34 yearsU
nite
d St
ates
Cz
ech
Repu
blic
Es
toni
aG
erm
any
Switz
erla
ndD
enm
ark
Cana
da
Nor
way
Swed
en
Russ
ian
Fede
ratio
n4Au
stria
3Sl
oven
iaIs
rael
Slov
ak R
epub
licN
ew Z
eala
nd
Hun
gary
Fi
nlan
dU
nite
d Ki
ngdo
m3
Net
herla
nds
Luxe
mbo
urg
EU19
ave
rage
OEC
D a
vera
geFr
ance
Aust
ralia
Ic
elan
dBe
lgiu
mPo
land
Irel
and
Kore
aCh
ile2
Gre
ece
Ital
ySp
ain
Turk
ey
Port
ugal
M
exic
oBr
azil2
0
10
20
30
40
50
60
70
80
90
100
1990s 1980s 1970s 1960s
%
1. Excluding ISCED 3C short programmes 2. Year of reference 20043. Including some ISCED 3C short programmes 3. Year of reference 2003.
13
1
1
27

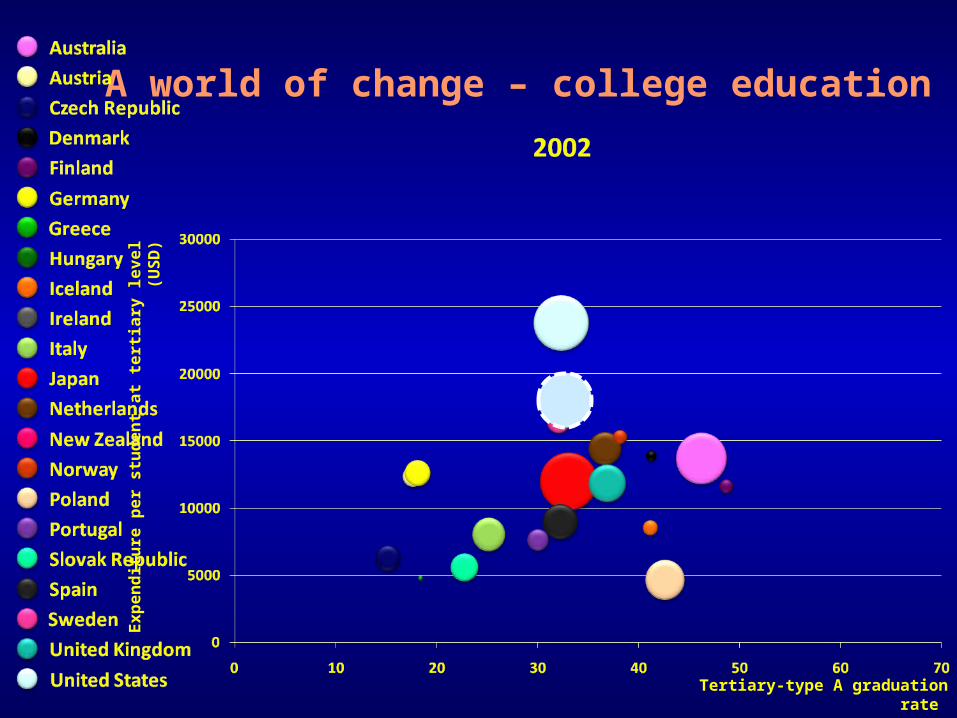
AustraliaAustriaCzech RepublicDenmarkFinlandGermanyGreeceHungaryIcelandIrelandItalyJapanNetherlandsNew ZealandNorwayPolandPortugalSlovak RepublicSpainSwedenUnited KingdomUnited States
Expe
nditu
re p
er st
uden
t at t
ertia
ry le
vel (
USD
)
Tertiary-type A graduation rate
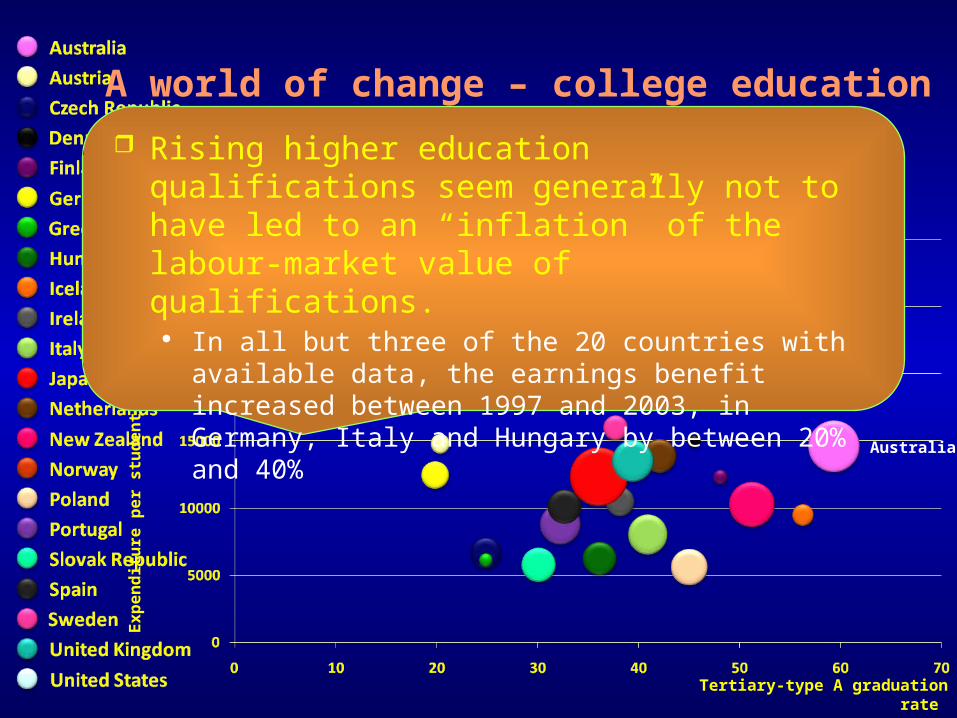
A world of change – college education
Graduate supply
Cost
per
st
uden
t

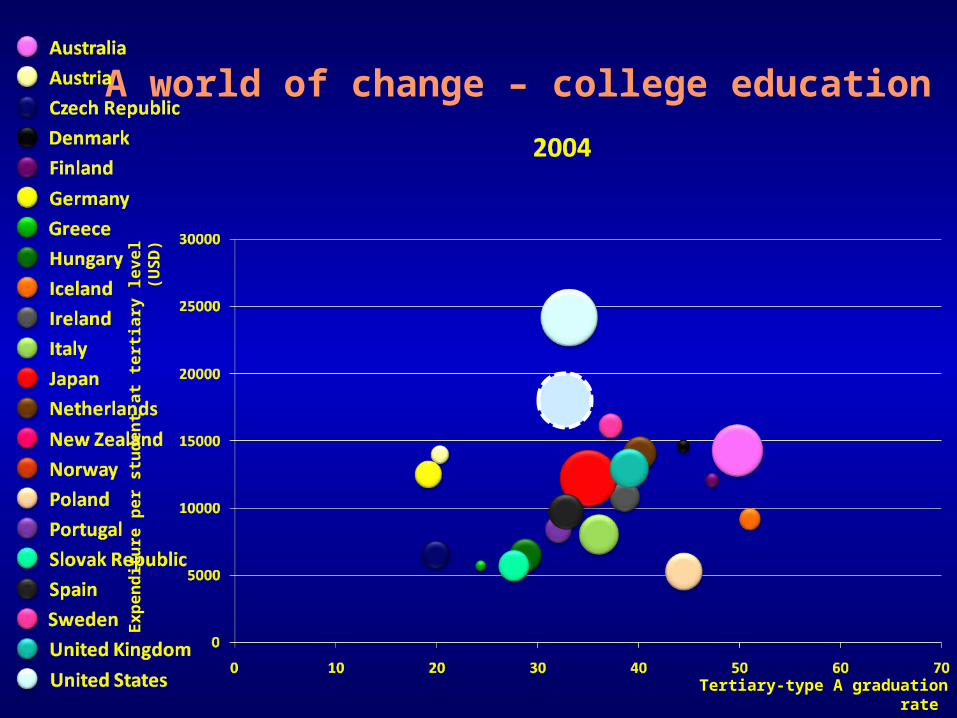
Expe
nditu
re p
er st
uden
t at t
ertia
ry le
vel (
USD
)
Tertiary-type A graduation rate
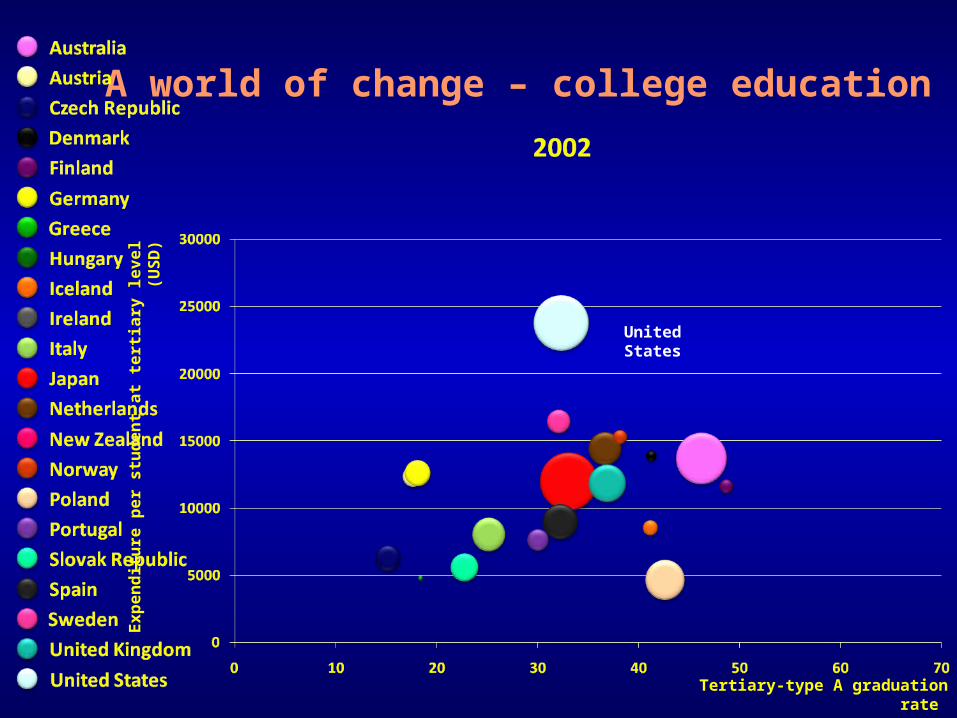
A world of change – college education
United States
Japan
Sweden
Graduate supply
Cost
per
st
uden
t
Germany

Expe
nditu
re p
er st
uden
t at t
ertia
ry le
vel (
USD
)
Tertiary-type A graduation rate
A world of change – college education
Australia
United States (2000)
United States (1995)

Expe
nditu
re p
er st
uden
t at t
ertia
ry le
vel (
USD
)
Tertiary-type A graduation rate
A world of change – college education
Expe
nditu
re p
er st
uden
t at t
ertia
ry le
vel (
USD
)
Tertiary-type A graduation rate
A world of change – college education

Expe
nditu
re p
er st
uden
t at t
ertia
ry le
vel (
USD
)
Tertiary-type A graduation rate
A world of change – college education
Expe
nditu
re p
er st
uden
t at t
ertia
ry le
vel (
USD
)
Tertiary-type A graduation rate
A world of change – college education
Expe
nditu
re p
er st
uden
t at t
ertia
ry le
vel (
USD
)
Tertiary-type A graduation rate
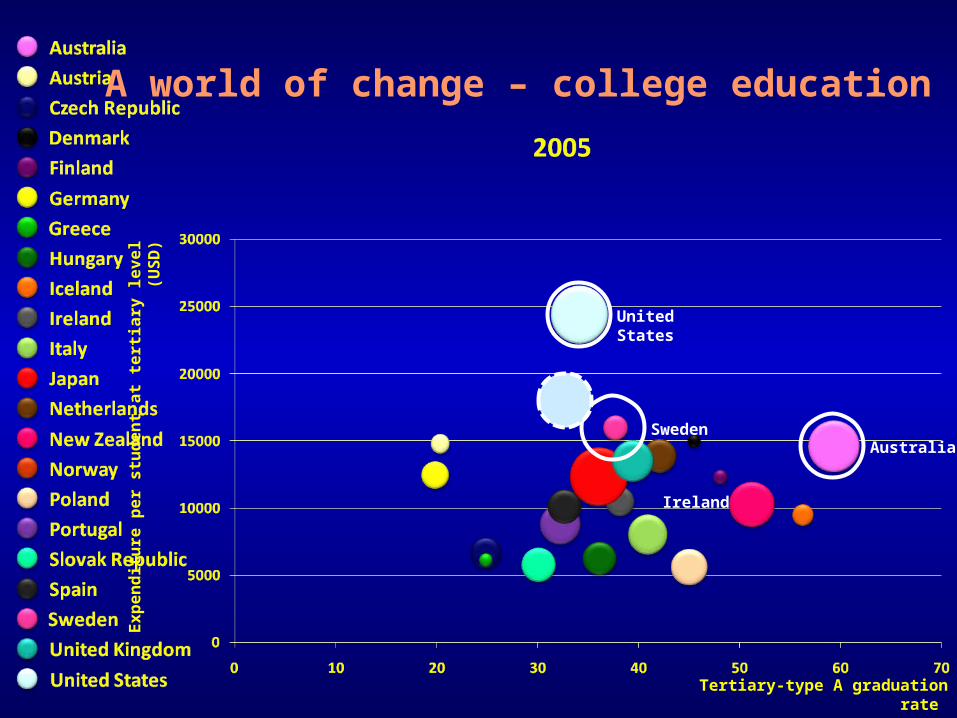
A world of change – college education
United States
Australia
Ireland
Sweden

Expe
nditu
re p
er st
uden
t at t
ertia
ry le
vel (
USD
)
Tertiary-type A graduation rate
A world of change – college education
United States

Expe
nditu
re p
er st
uden
t at t
ertia
ry le
vel (
USD
)
Tertiary-type A graduation rate
A world of change – college education
United States

Expe
nditu
re p
er st
uden
t at t
ertia
ry le
vel (
USD
)
Tertiary-type A graduation rate
A world of change – college education
United States
Expe
nditu
re p
er st
uden
t at t
ertia
ry le
vel (
USD
)
Tertiary-type A graduation rate
A world of change – college education
United States

Expe
nditu
re p
er st
uden
t at t
ertia
ry le
vel (
USD
)
Tertiary-type A graduation rate
A world of change – college education
United States

Expe
nditu
re p
er st
uden
t at t
ertia
ry le
vel (
USD
)
Tertiary-type A graduation rate
A world of change – college education
Expe
nditu
re p
er st
uden
t at t
ertia
ry le
vel (
USD
)
Tertiary-type A graduation rate
A world of change – college education
Australia
United States
Rising higher education qualifications seem generally not to have led to an “inflation” of the labour-market value of qualifications.
In all but three of the 20 countries with available data, the earnings benefit increased between 1997 and 2003, in Germany, Italy and Hungary by between 20% and 40%
2020Co
uncil
, 18
Sept
embe
r 20
08Ed
ucat
ion
at a
Gla
nce
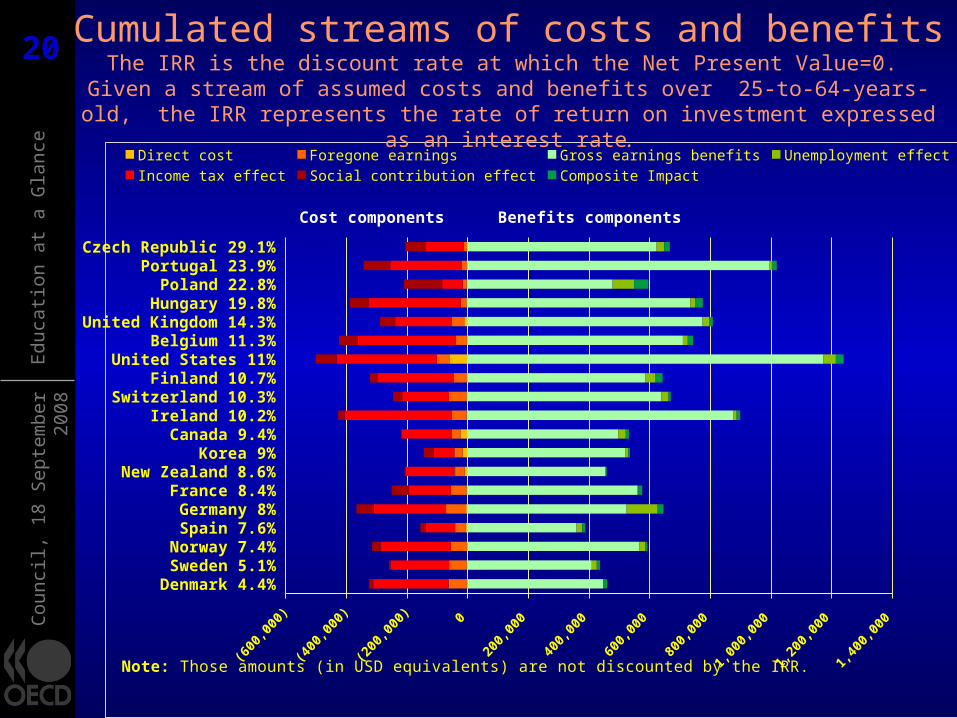
Denmark 4.4%Sweden 5.1%Norway 7.4%
Spain 7.6%Germany 8%France 8.4%
New Zealand 8.6%Korea 9%
Canada 9.4%Ireland 10.2%
Switzerland 10.3%Finland 10.7%
United States 11%Belgium 11.3%
United Kingdom 14.3%Hungary 19.8%
Poland 22.8%Portugal 23.9%
Czech Republic 29.1%
Direct cost Foregone earnings Gross earnings benefits Unemployment effectIncome tax effect Social contribution effect Composite Impact
Cost components Benefits components
Note: Those amounts (in USD equivalents) are not discounted by the IRR.
Cumulated streams of costs and benefits The IRR is the discount rate at which the Net Present Value=0. Given a stream of assumed costs and benefits over 25-to-64-years-old, the IRR represents the rate
of return on investment expressed as an interest rate.
2121U
nive
rsity
of M
inne
sota
Mar
ch, 2
2 20
09B
ringi
ng L
esso
ns fr
om th
e W
orld
’s T
op P
erfo
rmer
s to
Min
neso
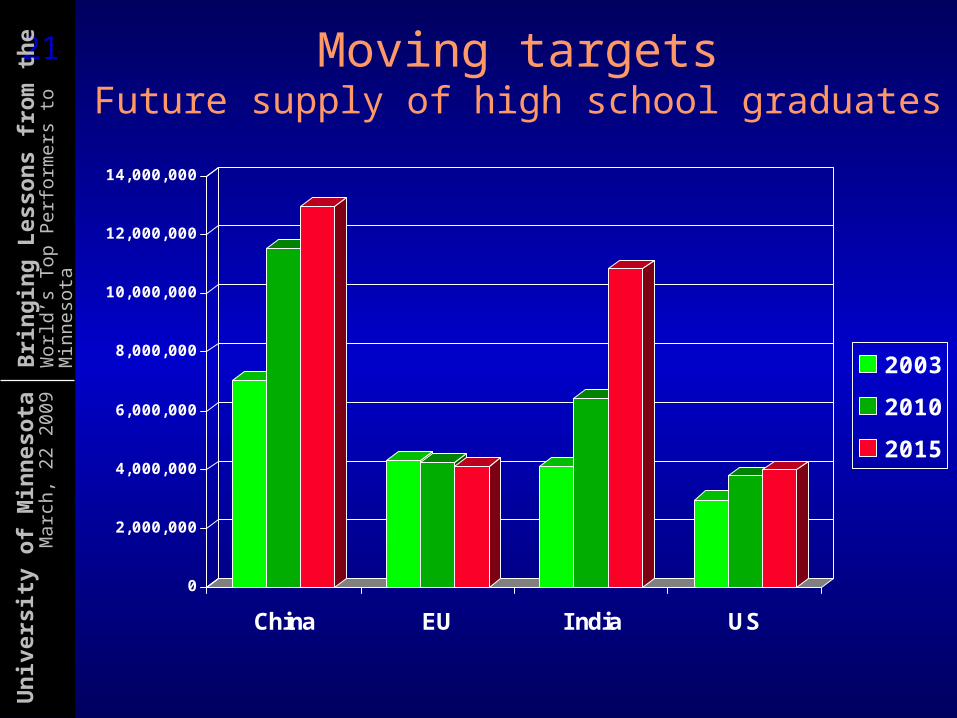
ta Moving targetsFuture supply of high school graduates
0
2,000,000
4,000,000
6,000,000
8,000,000
10,000,000
12,000,000
14,000,000
China EU India US
200320102015

2222U
nive
rsity
of M
inne
sota
Mar
ch, 2
2 20
09B
ringi
ng L
esso
ns fr
om th
e W
orld
’s T
op P
erfo
rmer
s to
Min
neso
ta
0
500,000
1,000,000
1,500,000
2,000,000
2,500,000
3,000,000
3,500,000
4,000,000
4,500,000
5,000,000
China EU India US
200320102015
Future supply of high school graduates
0
2 , 0 0 0 , 0 0 0
4 , 0 0 0 , 0 0 0
6 , 0 0 0 , 0 0 0
8 , 0 0 0 , 0 0 0
10 , 0 0 0 , 0 0 0
12 , 0 0 0 , 0 0 0
14 , 0 0 0 , 0 0 0
China EU India US
200320102015
Future supply of college graduates

2323U
nive
rsity
of M
inne
sota
Mar
ch, 2
2 20
09B
ringi
ng L
esso
ns fr
om th
e W
orld
’s T
op P
erfo
rmer
s to
Min
neso
taHow the demand for skills has changed
Economy-wide measures of routine and non-routine task input (US)
1960 1970 1980 1990 200240
45
50
55
60
65 Routine manual
Nonroutine manual
Routine cognitive
Nonroutine analytic
Nonroutine inter-active
(Levy and Murnane)
Mea
n ta
sk in
put a
s per
cent
iles o
f th
e 19
60 ta
sk d
istrib
utio
n
The dilemma of schools:The skills that are easiest to teach and test are also the ones that are easiest to digitise, automate and outsource

2424U
nive
rsity
of M
inne
sota
Mar
ch, 2
2 20
09B
ringi
ng L
esso
ns fr
om th
e W
orld
’s T
op P
erfo
rmer
s to
Min
neso
ta
Deciding what to assess...
looking back at what students were expected to have learned
…or…looking ahead to how well they can extrapolate from what they have
learned and apply their knowledge and skills in novel settings.
For the PISA assessment of the knowledge and skills of 15-year-olds, OECD governments chose the latter

2525U
nive
rsity
of M
inne
sota
Mar
ch, 2
2 20
09B
ringi
ng L
esso
ns fr
om th
e W
orld
’s T
op P
erfo
rmer
s to
Min
neso
ta
Coverage of world economy 77%81%83%85%86%87%
OECD’s PISA assessment of the knowledge and skills of 15-year-olds
2626U
nive
rsity
of M
inne
sota
Mar
ch, 2
2 20
09B
ringi
ng L
esso
ns fr
om th
e W
orld
’s T
op P
erfo
rmer
s to
Min
neso
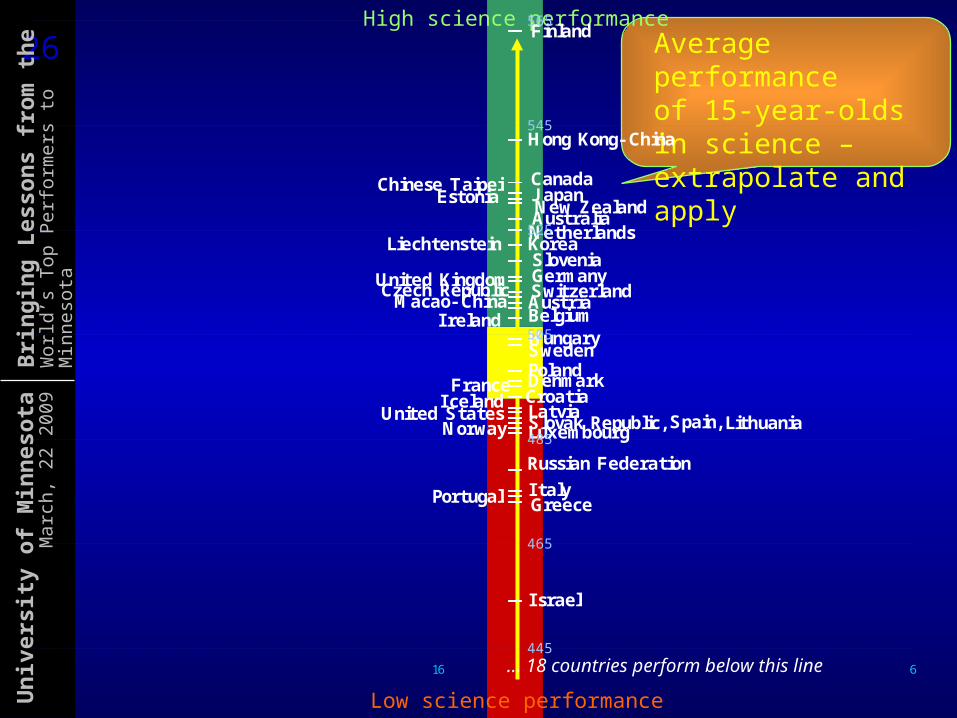
taAverage performanceof 15-year-olds in science – extrapolate and apply
High science performance
Low science performance… 18 countries perform below this line
I srael
I talyPortugal Greece
Russian FederationLuxembourgSlovak Republic,Spain,
Iceland LatviaCroatia
SwedenDenmarkFrancePolandHungary
AustriaBelgiumIrelandCzech Republic SwitzerlandMacao- China
GermanyUnited Kingdom
Korea
J apanAustralia
SloveniaNetherlandsLiechtenstein
New ZealandChinese Taipei
Hong Kong- China
Finland
CanadaEstonia
United States LithuaniaNorway
445
465
485
505
525
545
565
616

2727U
nive
rsity
of M
inne
sota
Mar
ch, 2
2 20
09B
ringi
ng L
esso
ns fr
om th
e W
orld
’s T
op P
erfo
rmer
s to
Min
neso
taIncreased likelihood of postsec. particip. at age 19 associated with reading proficiency at age
15 (Canada)after accounting for school engagement, gender, mother
tongue, place of residence, parental, education and family income (reference group Level 1)
02468
101214161820
Level 2 Level 3 Level 4 Level 5
2828U
nive
rsity
of M
inne
sota
Mar
ch, 2
2 20
09B
ringi
ng L
esso
ns fr
om th
e W
orld
’s T
op P
erfo
rmer
s to
Min
neso
ta
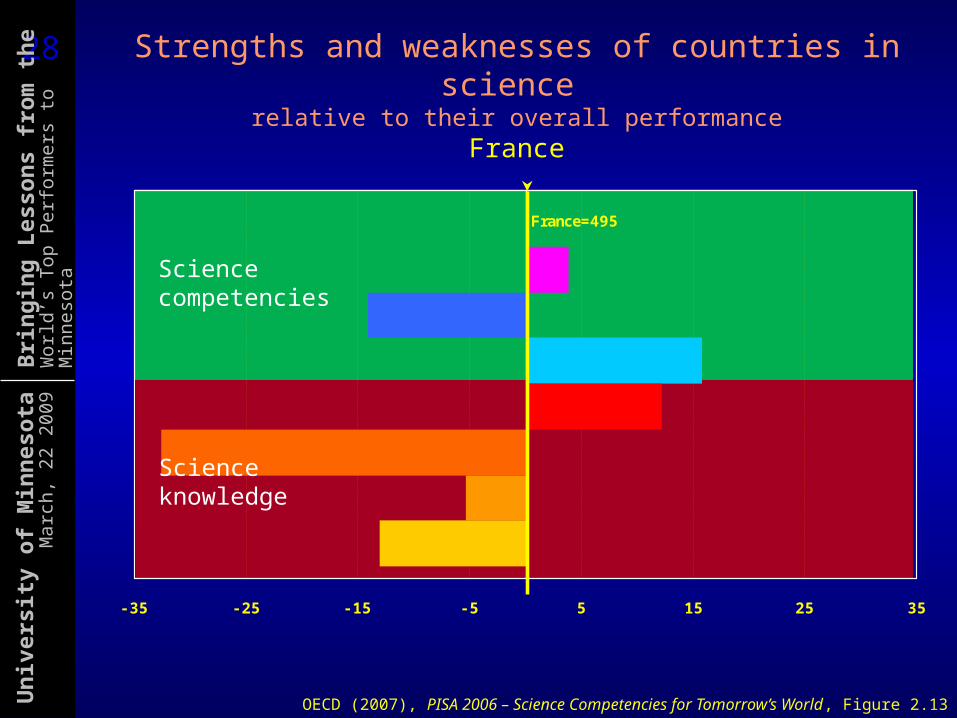
France=495
- 35 - 25 - 15 - 5 5 15 25 35
Overall science score
I dentifying scientific issues
Explaining phenomena scientifically
Using scientific evidence
Knowledge about science
Earth and space
Living systems
Physical systems
Strengths and weaknesses of countries in science relative to their overall performance
France
OECD (2007), PISA 2006 – Science Competencies for Tomorrow’s World, Figure 2.13
Science competencies
Science knowledge

2929U
nive
rsity
of M
inne
sota
Mar
ch, 2
2 20
09B
ringi
ng L
esso
ns fr
om th
e W
orld
’s T
op P
erfo
rmer
s to
Min
neso
ta
France=495 Czech Republic=512
- 35 - 25 - 15 - 5 5 15 25 35
Overall science score
I dentifying scientific issues
Explaining phenomena scientifically
Using scientific evidence
Knowledge about science
Earth and space
Living systems
Physical systems
Strengths and weaknesses of countries in science relative to their overall performance
Czech Republic
OECD (2007), PISA 2006 – Science Competencies for Tomorrow’s World, Figure 2.13
Scientific competencies
Scientific knowledge
20

3030U
nive
rsity
of M
inne
sota
Mar
ch, 2
2 20
09B
ringi
ng L
esso
ns fr
om th
e W
orld
’s T
op P
erfo
rmer
s to
Min
neso
ta
United States=489
- 35 - 25 - 15 - 5 5 15 25 35
Overall science score
I dentifying scientific issues
Explaining phenomena scientifically
Using scientific evidence
Knowledge about science
Earth and space
Living systems
Physical systems
Strengths and weaknesses of countries in science relative to their overall performance
United States
OECD (2007), PISA 2006 – Science Competencies for Tomorrow’s World, Figure 2.13
Science competencies
Science knowledge

3131U
nive
rsity
of M
inne
sota
Mar
ch, 2
2 20
09B
ringi
ng L
esso
ns fr
om th
e W
orld
’s T
op P
erfo
rmer
s to
Min
neso
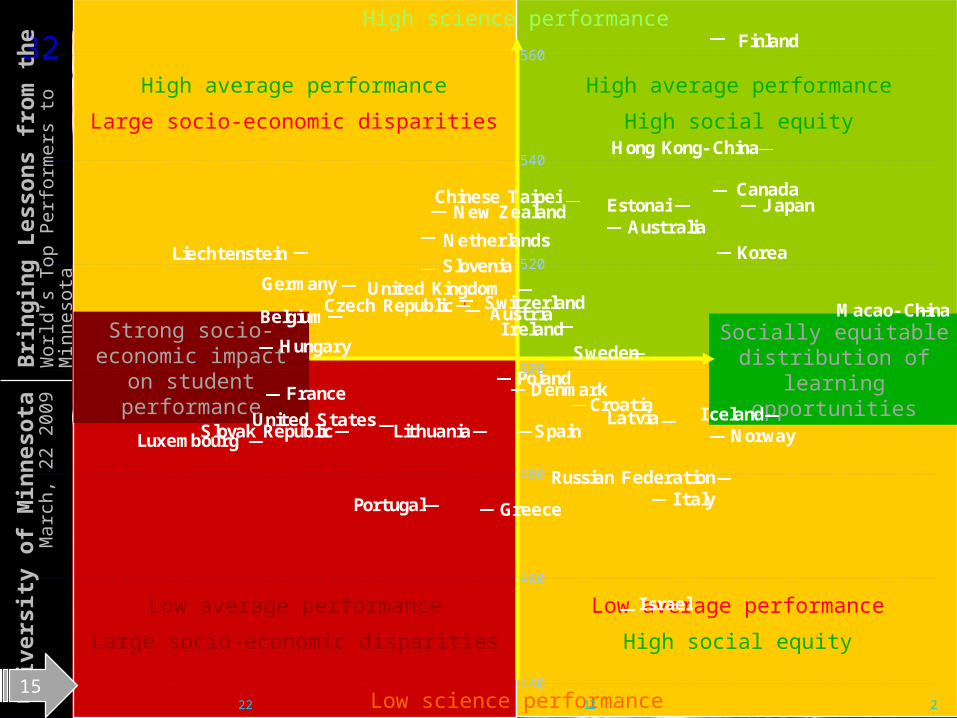
taAverage performanceof 15-year-olds in science – extrapolate and apply
Low average performanceLarge socio-economic disparities
High average performanceLarge socio-economic disparities
Low average performanceHigh social equity
High average performanceHigh social equity
Strong socio-economic impact on
student performance
Socially equitable distribution of
learning opportunities
High science performance
Low science performance
I srael
I talyPortugal Greece
Russian FederationLuxembourgSlovak Republic,Spain,
Iceland LatviaCroatia
SwedenDenmarkFrancePolandHungary
AustriaBelgiumIrelandCzech Republic SwitzerlandMacao- China
GermanyUnited Kingdom
Korea
J apanAustralia
SloveniaNetherlandsLiechtenstein
New ZealandChinese Taipei
Hong Kong- China
Finland
CanadaEstonia
United States LithuaniaNorway
445
465
485
505
525
545
565
616
3232U
nive
rsity
of M
inne
sota
Mar
ch, 2
2 20
09B
ringi
ng L
esso
ns fr
om th
e W
orld
’s T
op P
erfo
rmer
s to
Min
neso
ta Durchschnittliche Schülerleistungen im Bereich Mathematik
Low average performanceLarge socio-economic disparities
High average performanceLarge socio-economic disparities
Low average performanceHigh social equity
High average performanceHigh social equity
Strong socio-economic impact on
student performance
Socially equitable distribution of
learning opportunities
High science performance
Low science performance
I srael
GreecePortugal I talyRussian Federation
LuxembourgSlovak Republic SpainIcelandLatviaCroatia
Sweden
DenmarkFrancePoland
HungaryAustriaBelgium Ireland
Czech Republic Switzerland Macao- ChinaGermany United Kingdom
Korea
J apanAustralia
SloveniaNetherlandsLiechtenstein
New ZealandChinese Taipei
Hong Kong- China
Finland
CanadaEstonai
United States Lithuania Norway
440
460
480
500
520
540
560
2122215

3333U
nive
rsity
of M
inne
sota
Mar
ch, 2
2 20
09B
ringi
ng L
esso
ns fr
om th
e W
orld
’s T
op P
erfo
rmer
s to
Min
neso
ta
-3 -2 -1 0 1 2 3300
500
700
School performance and socio-economic background Germany
Stud
ent p
erfo
rman
ce
AdvantagePISA Index of socio-economic background
Disadvantage
Schools proportional to size
Student performance and students’ socio-economic background within schoolsSchool performance and schools’ socio-economic backgroundStudent performance and students’ socio-economic background

3434U
nive
rsity
of M
inne
sota
Mar
ch, 2
2 20
09B
ringi
ng L
esso
ns fr
om th
e W
orld
’s T
op P
erfo
rmer
s to
Min
neso
taSchool performance and socio-economic background
United StatesSt
uden
t per
form
ance
AdvantagePISA Index of socio-economic background
Disadvantage
Schools proportional to size
Student performance and students’ socio-economic background within schoolsSchool performance and schools’ socio-economic backgroundStudent performance and students’ socio-economic background

3535U
nive
rsity
of M
inne
sota
Mar
ch, 2
2 20
09B
ringi
ng L
esso
ns fr
om th
e W
orld
’s T
op P
erfo
rmer
s to
Min
neso
taSchool performance and socio-economic background
FinlandSt
uden
t per
form
ance
AdvantagePISA Index of socio-economic background
Disadvantage
Schools proportional to size
Student performance and students’ socio-economic background within schoolsSchool performance and schools’ socio-economic backgroundStudent performance and students’ socio-economic background

3636U
nive
rsity
of M
inne
sota
Mar
ch, 2
2 20
09B
ringi
ng L
esso
ns fr
om th
e W
orld
’s T
op P
erfo
rmer
s to
Min
neso
ta
Hong Kon
g-Chin
a
Canad
a
Liech
tenste
in
Eston
ia
New Zea
land
Netherl
ands
German
y
Switz
erlan
d
Austral
ia
Slove
nia
Austria
Belgium
United
King
dom
Swed
en
Luxem
bourg
France
Macao-C
hina
Denmark
United
State
s
Croatia
Russian
Fede
ration
Israe
lSe
rbiaJor
danQata
r300
350
400
450
500
550
600
Native students First-generation students Second-generation students
OECD average = 500
Immigrants and science performance
Native students
Second-generation students
First-generation students
PISA 2006: Science Competencies for Tomorrow’s World, Figure 4.2a.

3737P
ISA
OE
CD
Pro
gram
me
for
Inte
rnat
iona
l Stu
dent
Ass
essm
ent
Brie
fing
of C
ounc
il14
Nov
embe
r 200
7
How to get thereSome policy levers that emerge from
international comparisons

3838U
nive
rsity
of M
inne
sota
Mar
ch, 2
2 20
09B
ringi
ng L
esso
ns fr
om th
e W
orld
’s T
op P
erfo
rmer
s to
Min
neso
ta Some myths US coverage of the sampled population
is more comprehensive than in other countries
US covered 96% of 15-year-olds enrolled (OECD 97%) US covered 86% of all 15-year-olds (OECD 89%) No impact on mean performance
No relationship between size of countries and average performance
No relationship between proportion of immigrants and average performance
Few difference in students’ reported test motivation
Limited impact of national item preferences .

4040U
nive
rsity
of M
inne
sota
Mar
ch, 2
2 20
09B
ringi
ng L
esso
ns fr
om th
e W
orld
’s T
op P
erfo
rmer
s to
Min
neso
ta
High ambitions and universal
standardsRigor, focus and
coherence
Great systems attract great teachers and
provide access to best practice and quality
professional development

4141U
nive
rsity
of M
inne
sota
Mar
ch, 2
2 20
09B
ringi
ng L
esso
ns fr
om th
e W
orld
’s T
op P
erfo
rmer
s to
Min
neso
ta Challenge and support
Weak support
Strong support
Lowchallenge
Highchallenge
Strong performanceSystemic improvement
Poor performanceImprovements idiosyncratic
ConflictDemoralisation
Poor performanceStagnation

4242U
nive
rsity
of M
inne
sota
Mar
ch, 2
2 20
09B
ringi
ng L
esso
ns fr
om th
e W
orld
’s T
op P
erfo
rmer
s to
Min
neso
ta
High ambitions
Access to best practice and quality professional development
Accountability and intervention in
inverse proportion to success
Devolved responsibility,
the school as the centre of action

4343U
nive
rsity
of M
inne
sota
Mar
ch, 2
2 20
09B
ringi
ng L
esso
ns fr
om th
e W
orld
’s T
op P
erfo
rmer
s to
Min
neso
ta
NoYes
0
10
20
30
40
50
60
70
No
Yes0
41
46
63
Standards based external
examinations School autonomyin selecting teachers for hire
PISA score in science
School autonomy, standards-based examinations and science performance
School autonomy in selecting teachers for hire

4444U
nive
rsity
of M
inne
sota
Mar
ch, 2
2 20
09B
ringi
ng L
esso
ns fr
om th
e W
orld
’s T
op P
erfo
rmer
s to
Min
neso
taLocal responsibility and national
prescription
National prescription
Schools leading reform
Schools todayThe industrial
model, detailed prescription of
what schools do
Schools tomorrow?
Building capacity
Finland todayEvery school an effective school
Towards system-wide sustainable reform

4545U
nive
rsity
of M
inne
sota
Mar
ch, 2
2 20
09B
ringi
ng L
esso
ns fr
om th
e W
orld
’s T
op P
erfo
rmer
s to
Min
neso
taPublic and private schools
0 20 40 60 80 100
LuxembourgJ apanI taly
SwitzerlandFinland
DenmarkCzech Republic
SwedenHungaryAustria
PortugalUnited States
NetherlandsSlovak Republic
KoreaI reland
SpainCanadaMexico
New ZealandGermany
OECDUnited Kingdom
Government schoolsGovernment dependent privateGovernment independent private
- 150 - 100 - 50 0 50 100
Observed perf ormance diff erence
Diff erence af ter accounting f or socio-economic background of students and schools
Private schools perform better
Public schools perform better
%Score point difference

4646U
nive
rsity
of M
inne
sota
Mar
ch, 2
2 20
09B
ringi
ng L
esso
ns fr
om th
e W
orld
’s T
op P
erfo
rmer
s to
Min
neso
taPooled international dataset, effects of selected
school/system factors on science performance after accounting for all other factors in the model
OECD (2007), PISA 2006 – Science Competencies from Tomorrow’s World, Table 6.1a
Gross Net30
20
10
0
10
20
30
40
50
60
70
80
90
100
Approx. one school year
Scor
e po
int d
iffer
ence
in s
cienc
e
Schools practicing ability grouping (gross and net)
Academically selective schools (gross and net)
but no system-wide effect
School results posted publicly (gross and net)
One additional hour of science learning at
school (gross and net)
One additional hour of out-of-school lessons
(gross and net)
One additional hour of self-study or homework
(gross and net)
School activities to promote science
learning(gross and net)
Schools with greater autonomy (resources)
(gross and net)
Each additional 10% of public funding(gross only)
Schools with more competing schools
(gross only)
School principal’s perception that lack of
qualified teachers hinders instruction
(gross only)
School principal’s positive evaluation of quality of educational
materials(gross only)
Measured effectEffect after accounting for the socio-economic
background of students, schools and countries

4747U
nive
rsity
of M
inne
sota
Mar
ch, 2
2 20
09B
ringi
ng L
esso
ns fr
om th
e W
orld
’s T
op P
erfo
rmer
s to
Min
neso
ta
Strong ambitions
Access to best practice and quality professional development
Accountability
Devolvedresponsibility,
the school as the centre of action
Integrated educational
opportunities From prescribed
forms of teaching and assessment towards personalised learning

4848U
nive
rsity
of M
inne
sota
Mar
ch, 2
2 20
09B
ringi
ng L
esso
ns fr
om th
e W
orld
’s T
op P
erfo
rmer
s to
Min
neso
ta Durchschnittliche Schülerleistungen im Bereich Mathematik
Low average performanceLarge socio-economic disparities
High average performanceLarge socio-economic disparities
Low average performanceHigh social equity
High average performanceHigh social equity
Strong socio-economic impact on
student performance
Socially equitable distribution of
learning opportunities
High science performance
Low science performanceTurkey
AustraliaJ apan
Finland
CanadaNew Zealand
KoreaCzech Republic United Kingdom
AustriaGermany
Netherlands
SwitzerlandIrelandBelgium
PolandSwedenHungary
IcelandFrance Denmark
United States SpainLuxembourg NorwaySlovak Republic
I talyGreecePortugal
420
440
460
480
500
520
540
560
580
21222
Early selection and institutional differentiation
High degree of stratificationLow degree of stratification
6

4949U
nive
rsity
of M
inne
sota
Mar
ch, 2
2 20
09B
ringi
ng L
esso
ns fr
om th
e W
orld
’s T
op P
erfo
rmer
s to
Min
neso
taMoney matters - but other things do too
0 10000 20000 30000 40000 50000 60000 70000 80000 90000 100000400
425
450
475
500
525
550
575
495
410
488
f(x) = 0.000612701270434401 x + 462.612736410929R² = 0.19035445894851
Scienceperformance
Cumulative expenditure (US$ converted using PPPs)

5050U
nive
rsity
of M
inne
sota
Mar
ch, 2
2 20
09B
ringi
ng L
esso
ns fr
om th
e W
orld
’s T
op P
erfo
rmer
s to
Min
neso
ta
Portu
gal
Spain
Switz
erlan
d
Turk
ey
Belg
ium
Kore
a
Luxe
mbo
urg
Germ
any
Gree
ce
Japa
n
Aust
ralia
Unite
d Ki
ngdo
m
New
Zeala
nd
Fran
ce
Neth
erlan
ds
Denm
ark
Italy
Aust
ria
Czec
h Re
publ
ic
Hung
ary
Norw
ay
Icela
nd
Irelan
d
Mexic
o
Finlan
d
Swed
en
Unite
d St
ates
Polan
d
Slov
ak R
epub
lic
-10
-5
0
5
10
15
Salary as % of GDP/capita Instruction time 1/teaching time 1/class sizePo
rtuga
l
Spain
Switz
erlan
d
Turk
ey
Belg
ium
Kore
a
Luxe
mbo
urg
Germ
any
Gree
ce
Japa
n
Aust
ralia
Unite
d Ki
ngdo
m
New
Zeala
nd
Fran
ce
Neth
erlan
ds
Denm
ark
Italy
Aust
ria
Czec
h Re
publ
ic
Hung
ary
Norw
ay
Icela
nd
Irelan
d
Mexic
o
Finlan
d
Swed
en
Unite
d St
ates
Polan
d
Slov
ak R
epub
lic
-10
-5
0
5
10
15
Difference with OECD average
Spending choices on secondary schoolsContribution of various factors to upper secondary teacher compensation costs
per student as a percentage of GDP per capita (2004)
Percentage points
5151U
nive
rsity
of M
inne
sota
Mar
ch, 2
2 20
09B
ringi
ng L
esso
ns fr
om th
e W
orld
’s T
op P
erfo
rmer
s to
Min
neso
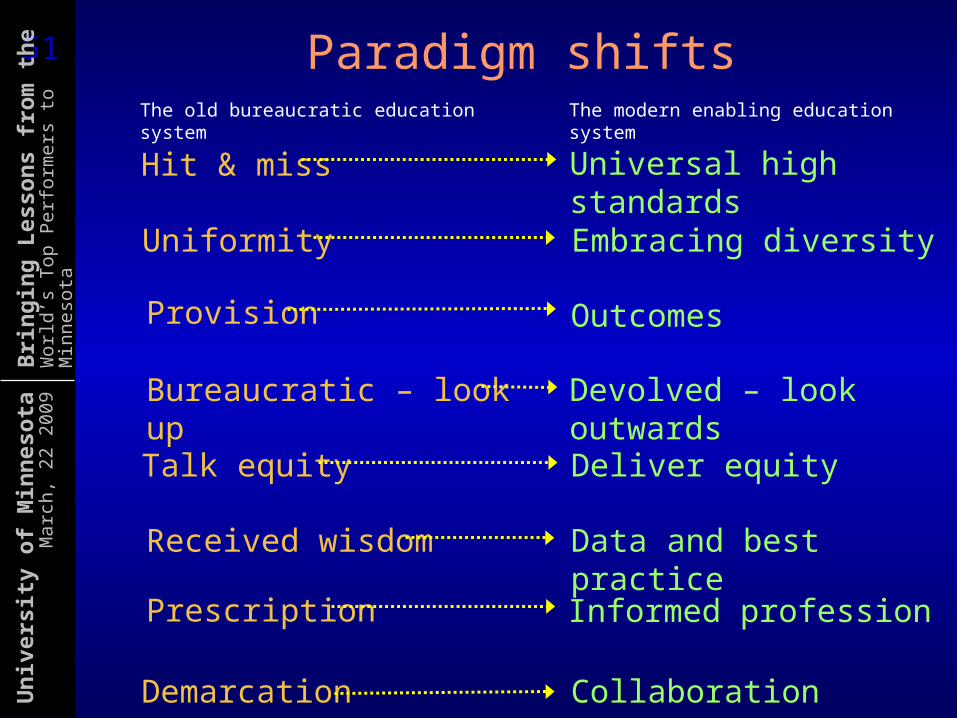
ta Paradigm shifts
Prescription Informed profession
Uniformity Embracing diversity
Demarcation Collaboration
Provision Outcomes
Bureaucratic – look up Devolved – look outwards
Talk equity Deliver equity
Hit & miss Universal high standards
Received wisdom Data and best practice
The old bureaucratic education system The modern enabling education system
5252U
nive
rsity
of M
inne
sota
Mar
ch, 2
2 20
09B
ringi
ng L
esso
ns fr
om th
e W
orld
’s T
op P
erfo
rmer
s to
Min
neso
ta
Towards next generation of global benchmarks
Challenges to the instrumentsChallenges to the approach

5353U
nive
rsity
of M
inne
sota
Mar
ch, 2
2 20
09B
ringi
ng L
esso
ns fr
om th
e W
orld
’s T
op P
erfo
rmer
s to
Min
neso
ta
Low policy value
High policy value
Low feasibility High feasibility
Money pits
Must haves
Low-hanging fruits
Quick wins
Examine individual, institutional and systemic
factors associated with high performance
Establish the relative standing of countries in terms of quality and equity in basic
school subjects
Extending the range of competencies through which quality is assessed (including ICT)
Measuring growth in learning
Bridging gap between formative and summative
assessment .
Monitor educational progress

5454U
nive
rsity
of M
inne
sota
Mar
ch, 2
2 20
09B
ringi
ng L
esso
ns fr
om th
e W
orld
’s T
op P
erfo
rmer
s to
Min
neso
ta Why care? Progress
Concerns about skill barriers to economic growth, productivity growth and rates of technological innovation– One additional year of education equals to between
3 and 6% of GDP– Rising tertiary level qualifications seem generally not
to have led to an “inflation” of the labour-market value of qualifications (in all but three of the 20 countries with available data, the earnings benefit increased between 1997 and 2003, in Germany, Italy and Hungary by between 20% and 40%)
Fairness Concerns about the role of skills in creating
social inequity in economic outcomes– Both average and distribution of skill matter
to long-term growth (high percentages of low skill impede growth)
Value for money Concerns about the demand for, and efficiency
and effectiveness of, investments in public goods

5555U
nive
rsity
of M
inne
sota
Mar
ch, 2
2 20
09B
ringi
ng L
esso
ns fr
om th
e W
orld
’s T
op P
erfo
rmer
s to
Min
neso
ta
0
10
20
30
40
1989
1994
1999
2004
2014
2019
2024
2029
2034
2039
2044
2049
2054
2059
2064
The cost of inactionImproved GDP from achieving the goal of being first in the world by 2000
Note: *K-12 education expenitures are assumed to be constant at the level attained in 2005. These data show that economic benefits from a 1989 reform that raised the U.S. to the highest levels of test performance would cover the cost of K-12 education by 2015
Source:Eric Hanushek
Percent addition to GDP
10-year reform20-year reform30-year reformTotal U.S. K-12 spending
5656U
nive
rsity
of M
inne
sota
Mar
ch, 2
2 20
09B
ringi
ng L
esso
ns fr
om th
e W
orld
’s T
op P
erfo
rmer
s to
Min
neso
ta
5757U
nive
rsity
of M
inne
sota
Mar
ch, 2
2 20
09B
ringi
ng L
esso
ns fr
om th
e W
orld
’s T
op P
erfo
rmer
s to
Min
neso
ta
Thank you !
www.oecd.org; www.pisa.oecd.org– All national and international publications– The complete micro-level database
email: [email protected]
…and remember:Without data, you are just another person with an opinion