brindhan tharmarajah marlene kong (mbbs, fracgp, imph ...€¦ · 19. national health and medical...
TRANSCRIPT

Brindhan Tharmarajah (BMed)1,2, Marlene Kong (MBBS, FRACGP, IMPH)3, Michael Hennessy
(BMedSc, MBBS, MBiomedE, FRANZCO)1 & Ashish Agar (MBBS, PhD, FRANZCO)1
(1) Department of Ophthalmology, Prince of Wales Hospital (2) University of New South Wales
(3) Kirby Institute, UNSW
Image Source: http://www.hollows.org/au/corporate-partners
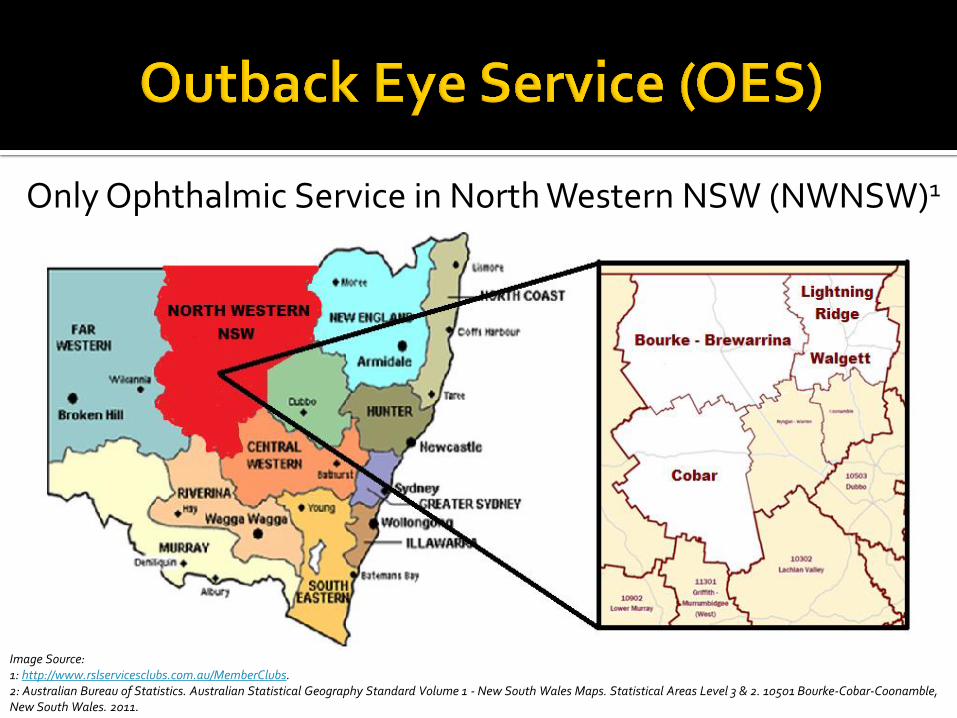
Only Ophthalmic Service in North Western NSW (NWNSW)1
Image Source: 1: http://www.rslservicesclubs.com.au/MemberClubs. 2: Australian Bureau of Statistics. Australian Statistical Geography Standard Volume 1 - New South Wales Maps. Statistical Areas Level 3 & 2. 10501 Bourke-Cobar-Coonamble, New South Wales. 2011.

Past service evaluations – favourable but qualitative vs clinical data1,2
OES’ standards of eye care?
Is the OES meeting the entire eye care needs of
NWNSW?
Where can the OES be improved based on
clinical data?1-4

CSR = Number of cataract operations per million persons per year4
Indigenous & Non-Indigenous CSR
Crude4,5
National CSR (benchmark)
Age-Adjusted & Age-Restricted6,7

OES Service
NWNSW Needs
National management
standards
#Cases of each eye disease
Care Provided
Number of Eye Diseases Treated
If standards not met → reasons identified
1. Cross-sectional Audit of OES’ 2015 Clinical Records
2. l

Age-Adjusted Vs Crude CSR (when compared with National CSR)
Indigenous Non-Indigenous
Total NWNSW

30+ Group6,8 Total
Population
Indigenous/Non-Indigenous Age-Adjusted CSR Relationship

165 Full Time Ophthalmology Days
119 surgeries (107 cataract)
19 Nd:YAG lasers
25 retinal lasers
90 anti-VEGF injections
94 HVFs
Source: http://dogr.io/
Optom – 1485 people 662 spectacles
176 Referrals
269 OCTs
29 clinics, 9 surgery lists, 789 patients, 1637 visits

30% Indigenous, 36% new (increased access)
Hometown: 89% main town 32% travelled for care >Average distance = 198km per year
>Range= 0-4378km! >Transport assistance >Service expansion
Source: https://www.travelwheels.com.au

Indigenous Non-Indigenous
Expected9 Seen Expected10 Seen
Cataract11 113 110 172 251
Macular Degeneration12
54 26 (48%) 115 102 (89%)
Glaucoma12-13 15 11 (73%) 92 61 (66%)
Diabetes11 751 132 (18%) 471 151 (32%)
Diabetic Retinopathy11,14
177 48 (27%) 135 30 (22%)
Vision Threatening DR11,14
65 24 (37%) 41 12 (29%)

Disease Management Standard
Cataract Median wait for public surgery = 12-18 months15
Glaucoma Moderate patients reviewed every 2 years16
Proliferative DR Treated with PRP and/or Anti-VEGF injections17
All No more than 28,000 people per full time ophthalmologist5
OCT given at least 1 month before any injection

1. National CSR = 9300 cataract surgeries per million persons per year 7 2. Annual HVF testing for glaucoma patients18 3. If nil HVF, cup-disc ratio recorded in glaucoma patients & suspects18 4. Advanced glaucoma patients reviewed 3x/ year 16 5. Annual review of diabetic patients (optom. or ophthal.)19
6. Review of early glaucoma patients every 2 years16
7. Wet MD treated with Anti-VEGF injections every 8 weeks20 8. Maximum waiting list time for surgery = 90 or 365 days2 9. Average waiting list time for public cataract surgery = 84 days7 10. Macular oedema treated with Anti-VEGF injections and/or laser 17

Service expansion with minor redistribution1,3,21
Investigation of strategies to reduce missed appointments1
Equipment & maintenance1
Transport assistance1
EMR implementation1
Further auditing1,3
Increased collaboration2
Backed up by Prior Studies

NWNSW population
Crude Age-Adjusted
CSR Extra Surgery Needed (%
Improvement)
CSR Extra Surgery Needed (%
improvement)
Indigenous 4627 26 (104%) 8662 4 (16%) Non-
Indigenous 7144 25 (30%) 5626 43 (52%)
Total NWNSW
6338 51 (48%) 6232 52 (49%)
Age-Restriction had NO effect → Not Necessary
Age-Adjustment & Comparison with National CSR Needed8
National CSR = 9300 per million persons per year (benchmark)5,7

OES is a vital service
OES currently unable to meet total eye care needs of NWNSW → Requires improvements
Cataract surgery access ≠ Total service delivery →CSR tools should not be used alone Audit care + compare age-adjusted local CSRs with
the national CSR to evaluate and improve services

Supervisors: Dr Ashish Agar, Dr Michael Hennessy & Dr Marlene
Kong
OES: Ben Whitham, Ellysa Brennan,
Joanna Barton, Kyriacos Mavrolefteros
Associate Professor Boaz Shulruf
Entire OES team & Prince of Wales
Ophthalmology Department
Image Source: Brindhan Tharmarajah

1. Bansemer A, Beatty D. NSW Remote Eye Service Delivery Options Paper for the Fred Hollows Foundation. 2012. 2. Maher L, Brown A. Eye Health Services for Aboriginal People - A Review within the Greater Western Region of NSW. 2011. 3. Communio. Evaluation of the Outback Eye Service. Prepared for the Department of Health and Ageing. 2007. 4. Maher L, Brown AM, Torvaldsen S, Dawson AJ, Patterson JA, Lawrence G. Eye health services for Aboriginal people in the western region of NSW, 2010. New South Wales
Public Health Bulletin 2012;23(4):81-86. 5. Taylor HR, Stanford E. Provision of Indigenous Eye Health Services. Indigenous Eye Health Unit, Melbourne School of Population Health, The University of Melbourne
2010. 6. Randall DA, Reinten T, Maher L, Lujic S, Stewart J, Keay L, et al. Disparities in cataract surgery between Aboriginal and non-Aboriginal people in New South Wales,
Australia. Clin Experiment Ophthalmol 2014;42(7):629-636. 7. Australian Institute of Health and Welfare. Admitted patient care 2014-15: Australian Hospital Statistics. Health services series no. 68. Cat. no. HSE 172. 2016. 8. Australian Institute of Health and Welfare. Principles on the use of direct age-standardisation in administrative data collections: for measuring the gap between
Indigenous and non-Indigenous Australians. Cat. no. CSI 12. 2011. 9. Australian Bureau of Statistics. Estimated Resident Aboriginal and Torres Strait Islander and Non-Indigenous Population, Statistical Area Level 2 - 30 June 2011. 2013;
Available at: http://www.abs.gov.au/AUSSTATS/[email protected]/DetailsPage/3238.0.55.001June%202011?OpenDocument. Accessed 3/10, 2016. 10. Australian Bureau of Statistics. Population by Age and Sex, Regions of New South Wales. Table 6. Estimated Resident Population by Age, New South Wales, Persons - 30
June 2014. 2015; Available at: http://www.abs.gov.au/AUSSTATS/[email protected]/DetailsPage/3235.02014?OpenDocument. Accessed 3/10, 2016. 11. Australian Bureau of Statistics. Australian Aboriginal and Torres Strait Islander Health Survey: First Results, Australia, 2012-13. Table 5 Long-term conditions by sex by
Indigenous status. 2014; Available at: http://www.abs.gov.au/AUSSTATS/[email protected]/DetailsPage/4727.0.55.0012012-13?OpenDocument. Accessed 3/10, 2016. 12. Australian Bureau of Statistics. National Health Survey: First Results, 2014-15 - Australia. Table 3 Long Term health conditions. 2015; Available at:
http://www.abs.gov.au/AUSSTATS/[email protected]/DetailsPage/4364.0.55.0012014-15?OpenDocument. Accessed 3/10, 2016. 13. Landers J, Henderson T, Craig J. The prevalence of glaucoma in indigenous Australians within Central Australia: the Central Australian Ocular Health Study. Br J
Ophthalmol 2012;96(2):162. 14. Kaidonis G, Mills RA, Landers J, Lake SR, Burdon KP, Craig JE. Review of the prevalence of diabetic retinopathy in Indigenous Australians. Clin Experiment Ophthalmol
2014;42(9):875. 15. Quang Do V, Li R, Ma M, Pooley C, Trinh C, Peattie L, et al. Investigating cataract referral practices used by Australian optometrists. Clinical & experimental optometry
2014;97(4):356. 16. White A, Goldberg I. Guidelines for the collaborative care of glaucoma patients and suspects by ophthalmologists and optometrists in Australia. Clin Experiment
Ophthalmol 2014;42(2):107-17. 17. American Academy of Ophthalmology Retinal/Vitreous Panel. Preferred Practice Pattern Guidelines: Diabetic Retinopathy. American Academy of Ophthalmology 2016. 18. National Health and Medical Research Council. NHMRC Guidelines for the screening, prognosis, diagnosis, management and prevention of glaucoma. 2010 19. National Health and Medical Research Council. Guidelines for the Management of Diabetic Retinopathy. 2008. 20. American Academy of Ophthalmology Retina/Vitreous Panel. Preferred Practice Pattern Guidelines. Age-Related Macular Degeneration. American Academy of
Ophthalmology 2015. 21. Barton J, Vail A, Waddell C, Hager J. The Western NSW Eye Health Partnership Program. 2015.

Questions?
Source: http://www.deadlyvibe.com.au/2013/10/eye-health-focus-helps-remote-communities/
Source: Mememaker.net

2015 OES = representative Refractive Error and Diabetic Patient Review Not Assessed NWNSW = service scope of OES
Expected vs actual disease rates
Self-Reported vs Population Based Rates
2011 Indigenous + 2014 Non-Indigenous = 2015 population Prevalence & Standards = national averages Non-Indigenous ≠ homogenous
Retrospective study

Quantified the Clinical Impact of the OES -> future funding
Identified Improvements -> better eye care for NWNSW
Identified an effective tool to evaluate and improve eye care services
Image Source: http://www.defenceupdate.mdanational.com.au/Articles/angus-turner-outback-vision

DNAs -> Investigate strategies
Future audits
Evaluate patient clinical outcomes
Compare to other services
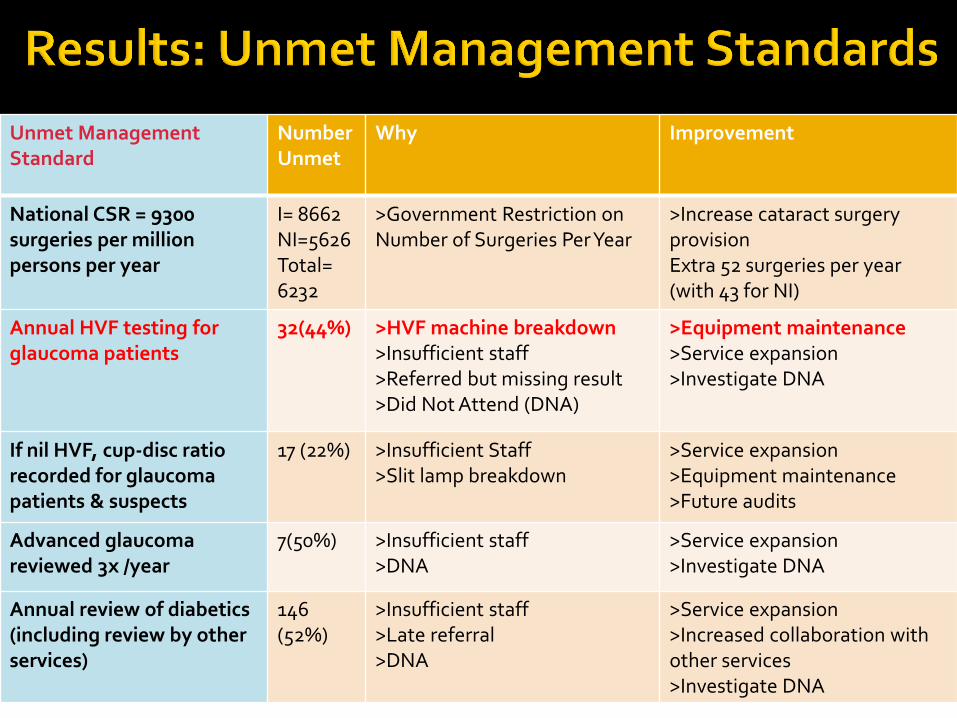
Unmet Management Standard
Number Unmet
Why Improvement
National CSR = 9300 surgeries per million persons per year
I= 8662 NI=5626 Total= 6232
>Government Restriction on Number of Surgeries Per Year
>Increase cataract surgery provision Extra 52 surgeries per year (with 43 for NI)
Annual HVF testing for glaucoma patients
32(44%) >HVF machine breakdown >Insufficient staff >Referred but missing result >Did Not Attend (DNA)
>Equipment maintenance >Service expansion >Investigate DNA
If nil HVF, cup-disc ratio recorded for glaucoma patients & suspects
17 (22%) >Insufficient Staff >Slit lamp breakdown
>Service expansion >Equipment maintenance >Future audits
Advanced glaucoma reviewed 3x /year
7(50%) >Insufficient staff >DNA
>Service expansion >Investigate DNA
Annual review of diabetics (including review by other services)
146 (52%)
>Insufficient staff >Late referral >DNA
>Service expansion >Increased collaboration with other services >Investigate DNA
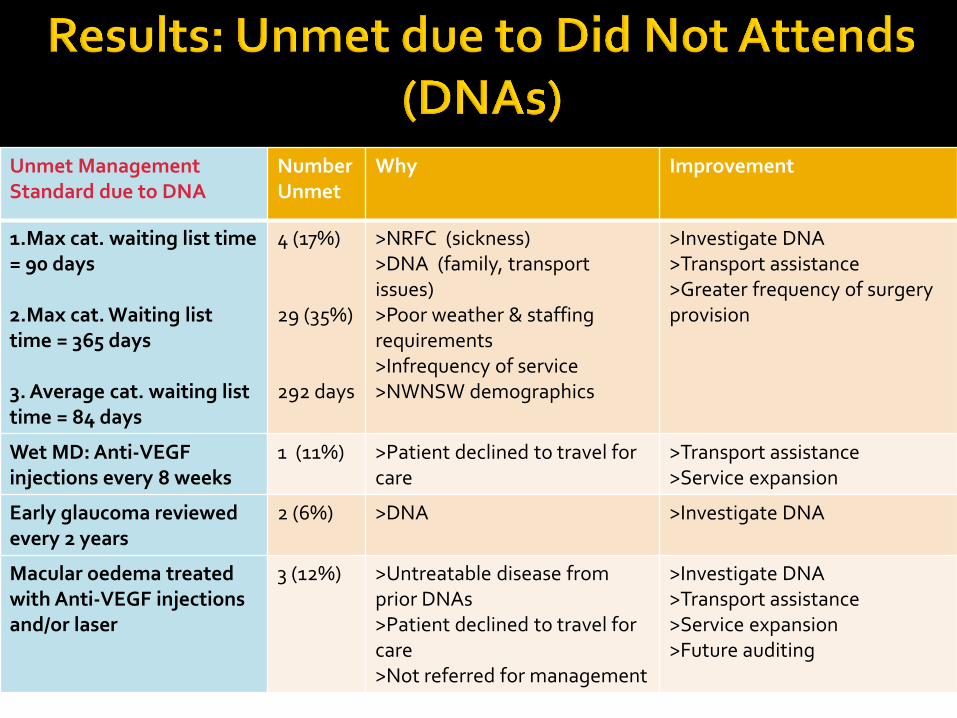
Unmet Management Standard due to DNA
Number Unmet
Why Improvement
1.Max cat. waiting list time = 90 days 2.Max cat. Waiting list time = 365 days 3. Average cat. waiting list time = 84 days
4 (17%) 29 (35%) 292 days
>NRFC (sickness) >DNA (family, transport issues) >Poor weather & staffing requirements >Infrequency of service >NWNSW demographics
>Investigate DNA >Transport assistance >Greater frequency of surgery provision
Wet MD: Anti-VEGF injections every 8 weeks
1 (11%) >Patient declined to travel for care
>Transport assistance >Service expansion
Early glaucoma reviewed every 2 years
2 (6%) >DNA >Investigate DNA
Macular oedema treated with Anti-VEGF injections and/or laser
3 (12%) >Untreatable disease from prior DNAs >Patient declined to travel for care >Not referred for management
>Investigate DNA >Transport assistance >Service expansion >Future auditing

Hometown ≠ service supply -> redistribute care
Hometown: 89% main town 32% travelled for care >Average distance = 198km per year
>Range= 0-4378km! >Transport assistance >Service expansion
Source: https://www.travelwheels.com.au

Population Unrestricted (age-adjusted CSR)
30+ Age Restricted (age-adjusted CSR)
Indigenous 8662 14797
Non-Indigenous 5626 9611
Non-Indigenous Indigenous
64.95% 64.95%
Same Non-Indigenous/Indigenous CSR relationship
->Age Restriction is Not Necessary
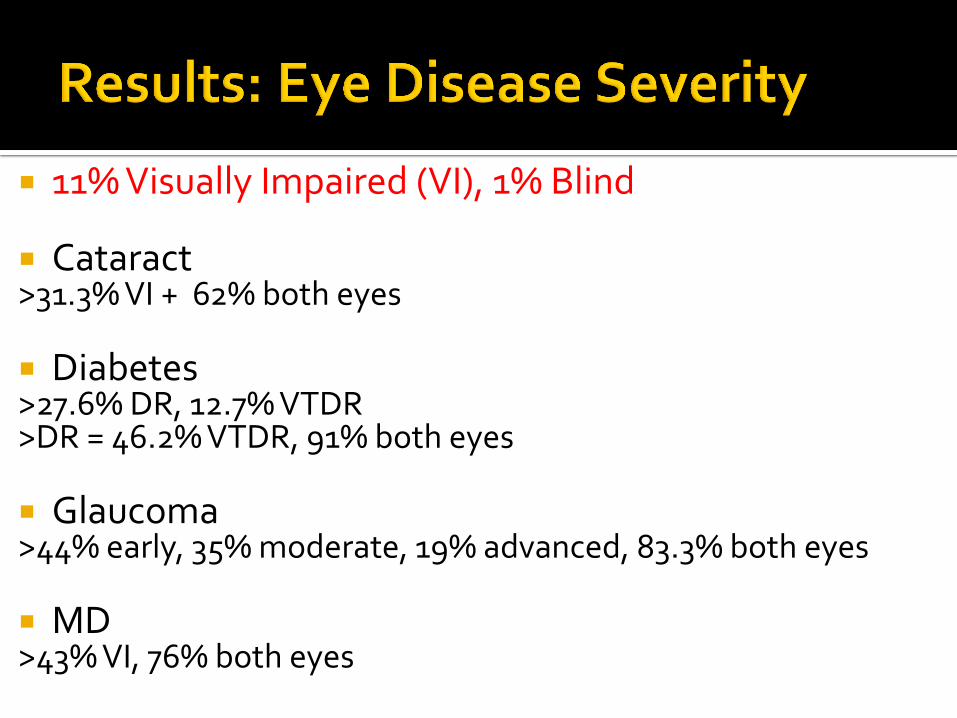
11% Visually Impaired (VI), 1% Blind
Cataract >31.3% VI + 62% both eyes Diabetes >27.6% DR, 12.7% VTDR >DR = 46.2% VTDR, 91% both eyes
Glaucoma >44% early, 35% moderate, 19% advanced, 83.3% both eyes
MD >43% VI, 76% both eyes
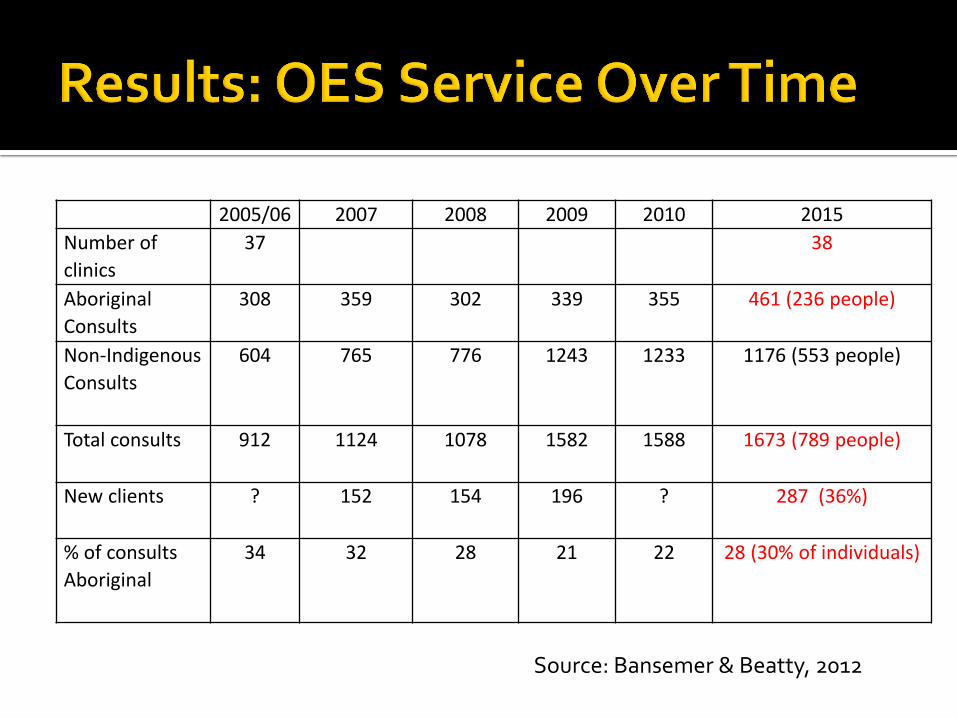
2005/06 2007 2008 2009 2010 2015
Number of
clinics
37 38
Aboriginal
Consults
308 359 302 339 355 461 (236 people)
Non-Indigenous
Consults
604 765 776 1243 1233 1176 (553 people)
Total consults 912 1124 1078 1582 1588 1673 (789 people)
New clients ? 152 154 196 ? 287 (36%)
% of consults
Aboriginal
34 32 28 21 22 28 (30% of individuals)
Source: Bansemer & Beatty, 2012

0
10
20
30
40
50
60
Nu
mb
er
of
Su
rge
rie
s
Age (years)
Age at Surgery
Indigenous
Non-Indigenous
Total
25 Indigenous, 82 Non-Indigenous

0
20000
40000
60000
80000
0-9 10-19 20-29 30-39 40-49 50-59 60-69 70-79 80-89 90+
CS
R
Age (years)
Crude CSR
Crude Indigenous CSR
Crude Non-Indigenous CSR
0
1000
2000
3000
4000
5000
6000
0-9 10-19 20-29 30-39 40-49 50-59 60-69 70-79 80-89 90+
CS
R
Age (years)
Age-Adjusted CSR
Age-AdjustedIndigenous CSR
Age-Adjusted Non-Indigenous CSR

42 patients both eyes (40%) Range 110 days to 10 years Average = 724 days, median = 406 days (13.5 months)
0%
20%
40%
60%
80%
100%
120%
0 200 400 600 800
Cu
mu
lati
ve %
of C
ata
ract
P
ati
en
ts
Days Between 1st and 2nd Cataract Surgery
Wait between 1st & 2nd Cataract Surgery
Cataract Patients

Source: Michael Hennessy

National CSR = benchmark 4,5

30% Indigenous, 36% new
0
20
40
60
80
100
120
140
160
180
200
Nu
mb
er
of
Pa
tie
nts
Age (years)
Age of OES patients
Non-Indigenous
Indigenous

Background The Outback Eye Service (OES) provides outreach ophthalmic care to the Indigenous & Non-Indigenous (I&NI) residents of North
Western NSW (NWNSW). This study gauges whether the OES is meeting the entire eye care needs of NWNSW. Eye care services are currently evaluated by comparing their crude or age-adjusted and age-restricted I&NI cataract surgery rates
(CSR) with the national CSR. This study evaluates these tools to determine the best method to use in future. Method A cross-sectional audit of the OES' 2015 clinical records was performed. The number of eye conditions treated and standards of
eye care delivered by the OES were then compared with the expected prevalence and published ophthalmic management standards of the major eye diseases in NWNSW.
The OES’ crude, age-adjusted and 30+ age-restricted I&NI CSRs were compared with the national CSR. Results In 2015 the OES provided services to 789 individuals over 1637 visits, but saw less than expected diabetic retinopathy, glaucoma
and macular degeneration patients. The OES met most ophthalmic management standards, but was unable to meet benchmarks for CSR, glaucoma visual field testing, glaucoma cup-disc ratio recording and advanced glaucoma and diabetic patient review.
Age-adjustment altered the CSR evaluation while age-restriction did not. Comparison with the national CSR benchmark enabled
the determination of the degree of service enhancement required in individual populations. Conclusion The OES is currently unable to meet the entire ophthalmic care needs of NWNSW. Service expansion with minor redistribution,
regular auditing, investigation of missed appointments, EMR implementation, and increased equipment maintenance, transport assistance and collaboration between health services is required to change this.
An eye care provider’s service can be audited, and their age-adjusted I&NI and total CSRs compared with the national CSR to
evaluate and improve its service.