bright and fast multicoloured voltage reporters via...
TRANSCRIPT

ARTICLE
Received 18 Mar 2014 | Accepted 8 Jul 2014 | Published 13 Aug 2014
Bright and fast multicoloured voltage reportersvia electrochromic FRETPeng Zou1,*, Yongxin Zhao2,*, Adam D. Douglass3, Daniel R. Hochbaum1, Daan Brinks1, Christopher A. Werley1,
D. Jed Harrison2, Robert E. Campbell2 & Adam E. Cohen1,4
Genetically encoded fluorescent reporters of membrane potential promise to reveal aspects
of neural function not detectable by other means. We present a palette of multicoloured
brightly fluorescent genetically encoded voltage indicators with sensitivities from 8–13% DF/F
per 100 mV, and half-maximal response times from 4–7 ms. A fluorescent protein is fused
to an archaerhodopsin-derived voltage sensor. Voltage-induced shifts in the absorption
spectrum of the rhodopsin lead to voltage-dependent nonradiative quenching of the
appended fluorescent protein. Through a library screen, we identify linkers and fluorescent
protein combinations that report neuronal action potentials in cultured rat hippocampal
neurons with a single-trial signal-to-noise ratio from 7 to 9 in a 1 kHz imaging bandwidth at
modest illumination intensity. The freedom to choose a voltage indicator from an array of
colours facilitates multicolour voltage imaging, as well as combination with other optical
reporters and optogenetic actuators.
DOI: 10.1038/ncomms5625
1 Departments of Chemistry and Chemical Biology and Physics, Harvard Stem Cell Institute, Harvard University, Cambridge, Massachusetts 02138, USA.2 Department of Chemistry, University of Alberta, Edmonton, Alberta, Canada T6G 2G2. 3 Department of Neurobiology and Anatomy, University of Utah, SaltLake City, Utah 84132, USA. 4 Howard Hughes Medical Institute, Harvard University, 12 Oxford Street, Cambridge, Massachusetts 02138, USA. * Theseauthors contributed equally to this work. Correspondence and requests for materials should be addressed to R.E.C. (email: [email protected]) orto A.E.C. (email: [email protected]).
NATURE COMMUNICATIONS | 5:4625 | DOI: 10.1038/ncomms5625 | www.nature.com/naturecommunications 1
& 2014 Macmillan Publishers Limited. All rights reserved.

Membrane voltage acts on all transmembrane proteins:the membrane electric field pulls on charged residues,shifting the free energy landscape for charge-displacing
conformational transitions1. This bioelectric modulation is mostfamously observed in voltage-gated ion channels in neuronsand cardiomyocytes, but voltage also affects the activity of Gprotein-coupled receptors and some transmembrane enzymes2.Membrane voltage is dynamically regulated in bacteria3, fungi4,plants5 and many cell types and subcellular organelles in thehuman body, and is dysregulated in states of neuronal, cardiacand metabolic diseases. Thus, there is a need for fast, sensitive,bright and spectrally tunable reporters of membrane voltage.
Recent progress in genetically encoded voltage indicators(GEVIs) has led to several classes of proteins, which robustlyreport action potentials (APs) in cultured neurons. The firstGEVIs were based on fusion of fluorescent proteins totransmembrane voltage-sensing domains6. In some of these,voltage modulates the brightness of a single fluorescentmoiety7–10, while in others, voltage modulates the efficiency ofForster resonance energy transfer (FRET) between a pair offluorescent moieties11,12. In our measurements of greenfluorescent protein (GFP)-based GEVIs, described below, themost sensitive was ArcLight8 (DF/F¼ � 32% per 100 mV), but thisreporter had half-maximal response times at room temperature of90 ms (depolarizing step) and 104 ms (hyperpolarizing step). Wemeasured the recently introduced ASAP1 (ref. 9) reporter to have asensitivity of DF/F¼ � 29% per 100 mV, and a half-maximalresponse of 2 ms at room temperature. These numbers differmodestly from the original reports, likely due to differences in geneexpression protocols and choices of optical filters.
A second class of GEVIs is based on microbial rhodopsinproton pumps3,13,14. In these, the transmembrane voltagemodulates the endogenous near infrared fluorescence of theretinal chromophore. The most recently developed non-pumpingmutants of Archaerhodopsin 3 (Arch), termed QuasArs, havevoltage sensitivities between 30 and 90% per 100 mV (dependingon the mutant), and half-maximal response times between 50 msand 1.1 ms at room temperature13.
GFP-based and rhodopsin-based GEVIs have very differentspectral properties. GFP-based GEVIs are excited by blue light(470–490 nm) and emit green (500–530 nm). QuasArs are excitedby red light (594–640 nm) and emit in the near infrared (peak at715 nm). GFP-based GEVIs are 30–80-fold brighter, and thus aretypically imaged with excitation at B10 W cm� 2, while QuasArsare typically imaged at 300–800 W cm� 2 (ref. 13). In acomparison between ArcLight and QuasAr2 in cultured rathippocampal neurons under their respective standard imagingconditions, QuasAr2 reported single APs with 4.7-fold highersignal-to-noise ratio (SNR) and was 15-fold more photostable13.In organotypic mouse hippocampal slice culture, QuasAr2reported single APs with 4.5-fold higher SNR than ArcLight13.Nonetheless, the low brightness of Arch-based GEVIs present achallenge for widespread use.
The availability of GEVIs spanning the visible spectrum isimportant when combining GEVIs with other optical reporters oroptogenetic actuators. Having GEVIs of colours between GFP andArch would facilitate multiplex voltage imaging, for example, todistinguish activity of excitatory and inhibitory neurons in intacttissue. Furthermore, GEVIs spectrally distinct from GFP could bepaired with other GFP-based reporters such as GCaMP (Ca2þ )(ref. 15), iGluSnFR (glutamate)16, Perceval (ATP)17, Clomeleon(Cl� ) (ref. 18) or Pyronic (pyruvate)19, or with other blue-excited optogenetic actuators. Thus, there is strong motivation todevelop a broad palette of GEVI colours.
We sought to combine the speed and sensitivity of Arch-basedGEVIs with the brightness and spectral range of conventional
fluorescent proteins. Traditionally, FRET is used to measure thephysical distance between a donor and acceptor. However, weand others have also used FRET to measure changes in theabsorption spectrum of a protein via its influence on nonradiativequenching of an attached fluorescent moiety20–22.
Here we use voltage-induced changes in the absorptionspectrum of an Arch mutant to alter the degree of nonradiativequenching of a closely fused fluorescent protein. We call thismechanism electrochromic FRET (eFRET). We demonstrate fastand sensitive voltage sensing in fusions between QuasAr2 and abroad palette of fluorescent proteins: enhanced GFP (EGFP),yellow FP (Citrine), mOrange2, mRuby2. These probes havesensitivities from 8–13% DF/F per 100 mV, and half-maximalresponse times from 4–7 ms, which allows detection of APs incultured rat hippocampal neurons with a single-trial SNR from 7to 9 in a 1 kHz imaging bandwidth at modest illuminationintensity. A recent paper applied a similar strategy to makevoltage sensors based on fusion of fluorescent proteins to amutant of the Leptosphaeria maculans rhodopsin (Mac)23. Whileother GEVIs offer superior SNR on the blue and far red ends ofthe spectrum, the present GEVIs fill in the visible spectrum withemission wavelengths between 530–640 nm. This spectral rangefacilitates multicolour voltage imaging with GEVIs, as well ascombination with other optical reporters and optogeneticactuators1.
ResultsEngineering eFRET GEVIs. Our electrochromic quencher is amutant of Arch, termed QuasAr2 (Fig. 1). The direct retinalfluorescence of QuasAr2 showed voltage sensitivity of 90% DF/Fper 100 mV and a bi-exponential step response with time con-stants of 1.2 ms (68%) and 11.8 ms (32%) (Table 1) at roomtemperature13. It has not been feasible to measure directly thevoltage-dependent absorption spectra of Arch or its mutants onaccount of the small quantity of protein found in the plasmamembrane of a single cell. However, a mechanistic study of Archshowed that membrane voltage modulated fluorescence via avoltage-dependent shift in the acid-base equilibrium of the retinalSchiff base24. Positive membrane voltage favoured the protonated(and fluorescent) state. One can thus mimic the voltage-inducedabsorption changes by changing the pH in a solution of
FP
FPH+
+100 mV
–100 mV
V
V
Wavelength
FP Em.
RetinalAbs.
Wavelength
RetinalAbs.
FP Em.
H+
Figure 1 | Proposed mechanism of voltage-dependent fluorescence in
eFRET GEVIs. Voltage controls the protonation, and thereby the absorption
spectrum, of the Schiff base joining the retinal to the protein scaffold. (a) At
a depolarizing (positive) voltage, the microbial rhodopsin has a protonated
retinal Schiff base, which absorbs strongly with a peak near 600 nm. The
retinal absorption quenches the fluorescence of the appended fluorescent
protein (FP). (b) At hyperpolarizing (negative) voltages, the fluorescence is
not quenched. Spectra shown are cartoons to illustrate mechanism.
ARTICLE NATURE COMMUNICATIONS | DOI: 10.1038/ncomms5625
2 NATURE COMMUNICATIONS | 5:4625 | DOI: 10.1038/ncomms5625 | www.nature.com/naturecommunications
& 2014 Macmillan Publishers Limited. All rights reserved.

solubilized protein. At neutral pH, QuasAr2 had a broadabsorption band peaked at 587 nm. At higher pH, this banddropped and a band at 411 nm appeared, corresponding to thedeprotonated Schiff base (Supplementary Fig. 1).
Based on these spectra, we reasoned that QuasAr2 mightmediate voltage-dependent quenching of an appended fluorescentprotein. The emission spectrum of mOrange2 (ref. 25) has a highdegree of overlap with the absorption spectrum of Arch, so westarted with this fluorophore. To enable efficient FRET, it iscritical to optimize the length of the linker, as rate of FRET isproportional to the reciprocal sixth power of the distance betweenthe donor and acceptor chromophores. We examined the crystalstructures of Arch-2 (a QuasAr2 homologue) (PDB ID 2EI4) (ref.26) and mOrange (an mOrange2 homologue) (PDB ID 2H5O)27,and found that the last 15 carboxy-terminal residues of Arch-2and 15 amino-terminal residues of mOrange are largelyunstructured (Fig. 2a). We reasoned that those unstructuredresidues could be removed without disrupting the function ofeither protein. We created a series of linker libraries bysystematically truncating these resectable regions (Fig. 2b andMethods) and randomizing two residues at the junction.
We then developed a hierarchical screening strategy to identifyvariants with optimal mOrange2 brightness, membrane traffick-ing and voltage response (Fig. 2c and Methods). We used acustomized vector, termed pcDuEx1.0, for gene expression inboth prokaryotic and eukaryotic cells. This vector circumventsthe laborious cloning typically required to switch between aprimary screen in bacteria and a secondary screen in mammaliancells (Methods). Colonies of Escherichia coli were transformedwith linker libraries in pcDuEx1.0. The colonies with the brightestmOrange2 fluorescence were picked for secondary screening inmammalian cells.
For the mammalian cell-based screen, a green GEVI, ArcLightQ239 (ref. 7), was used as an internal reference for bothmembrane trafficking and voltage response (Fig. 2c–g andMethods). The sensitivity of eFRET variants generally increasedas the linker was shortened. The most truncated variants (D31and D32 libraries) had excellent voltage sensitivity, but substan-tially decreased brightness of mOrange2, likely due either to poorfolding or to high basal quenching by the rhodopsin. In librarieswith more than 20 residues truncated, the screen favouredcombinations of Arg, Leu, Ala and Gly for the linker. The variantfrom the D24 library with linker sequence ‘Leu-Arg’ gave the bestoverall performance and was used henceforth. We added atrafficking sequence (TS) and endoplasmic reticulum export
motif (ER2) to improve trafficking to the plasma membrane28,although trafficking remained imperfect.
QuasAr2 absorbs strongly from 500–640 nm, so we reasonedthat eFRET might work for fluorescent proteins with a range ofemission wavelengths. We created a palette of eFRET constructsby replacing mOrange2 with: ECFP29, EGFP29, Citrine30,mRuby2 (ref. 12) and mKate2 (ref. 31). The emission spectra ofthese proteins all overlapped to some degree with the absorptionspectrum of QuasAr2 (Fig. 3). Spectral properties of thesefluorophores are given in Supplementary Table 1.
To test the hypothesized eFRET mechanism, we compared thefluorescence quantum yield of Citrine in the eFRET fusion and ina membrane-targeted construct lacking the QuasAr2 quencher,both expressed in HEK cells. We used two-photon fluorescenceexcitation and time-correlated single-photon counting to deter-mine the electronic excited state lifetime (Methods). The nativeCitrine protein had a lifetime of tbare¼ 3.47 ns, while the eFRETconstruct had a lifetime of tFRET¼ 2.83 ns (Supplementary Fig. 2).This difference in lifetime confirms that an additional non-radiative decay pathway exists in the eFRET constructcompared to the bare Citrine protein, which we ascribe to FRETfrom Citrine to retinal. The FRET efficiency is given byEFRET¼ 1� tFRET/tbare, from which EFRET¼ 0.18. Maximumvoltage sensitivity occurs at EFRET¼ 0.5, implying that furtheroptimization of the position and orientation of the FP mayimprove quenching efficiency and thereby voltage sensitivity.
Voltage responses in HEK cells. We characterized the eFRETGEVIs in HEK cells, imaged at 23 �C. All eFRET GEVIs traffickedefficiently to the plasma membrane (Fig. 4a) and exhibited brightfluorescence when excited at 3 W cm� 2 with appropriateexcitation and emission wavelengths (Supplementary Table 1).Membrane voltage was controlled via whole-cell voltage clamp.Fluorescence traces were extracted from images of cells either bymanually defining a region of interest (ROI) comprising the cellbody, or by using an automated pixel-weighting algorithm14.Both approaches gave similar results. Fluorescence responseswere normalized to fluorescence at a holding potential of� 70 mV (after background subtraction) and are quoted asDF/F. Voltage sensitivity was calculated as [F(30 mV)� F(� 70 mV)]/F(� 70 mV). While rhodopsins require retinalas a cofactor, we found that the culture medium containedsufficient retinal that voltage sensitivity was not enhanced byaddition of exogenous retinal (Supplementary Fig. 3).
Table 1 | Voltage-sensing properties of GEVIs.
Fluorophore HEK Cells Neurons
DF/F per100 mV (%)
Response to hyperpolarizing step Response to depolarizing step DF/F forsingle AP (%)
SNR forsingle AP
sfast(ms) sslow(ms) % fast s1/2 (ms) sfast(ms) sslow(ms) % fast s1/2 (ms)
ECFP �0.8 ND NDEGFP � 7.7 4.3 27 45 7.6 3.0 26 61 3.9 NDCitrine � 13.1 4.8 21 38 7.5 3.1 21 62 3.8 9.7 8.8mOrange2 � 10.0 4.3 26 45 7.5 3.9 27 60 5.1 9.9 9.0mRuby2 �8.7 4.3 27 65 4.7 3.6 20 65 3.8 5.4 7.2mKate2 �4.5 2.8 35 25 9.2 4.0 25 44 6.7 NDArcLight Q239 � 31.6 104 283 61 103 28 271 39 90 8.2 9.2ASAP1 � 28.8 3.0 29 67 3.5 2.3 39 88 1.9 17.8 13.1QuasAr2 90 1.0 16 80 0.9 1.2 12 68 1.4 48 41
AP, action potential; ECFP, enhanced cyan fluorescent protein; EGFP, enhanced green fluorescent protein; SNR, signal-to-noise ratio.Sensitivity, DF/F per 100 mV, was measured for a voltage step from � 70 mV to þ 30 mV. Response times were characterized either by fast and slow time constants from a bi-exponential fit (tfast andtslow) or by t1/2, the time to reach 50% of the steady-state response to a step of membrane voltage of duration at least 2 tslow. Half-response times are shorter for steps that do not reach steady state.Hyperpolarizing step: þ 30 mV to � 70 mV; depolarizing step: � 70 mV to þ 30 mV. All measurements were performed at 23 �C and represent the average of 6–9 cells. Illumination intensities were3 Wcm� 2 for all reporters except for QuasAr2. Illumination intensity was 200 Wcm� 2 for QuasAr2. (ref. 23).
NATURE COMMUNICATIONS | DOI: 10.1038/ncomms5625 ARTICLE
NATURE COMMUNICATIONS | 5:4625 | DOI: 10.1038/ncomms5625 | www.nature.com/naturecommunications 3
& 2014 Macmillan Publishers Limited. All rights reserved.

Fluorescence of all eFRET GEVIs showed approximately lineardependence on applied voltage (Fig. 4b). The most sensitiveconstruct was the Citrine fusion with DF/F¼ � 13.1±1.8% per100 mV (n¼ 6 cells, all statistics are mean±s.e.m.). The EGFP,mOrange2 and mRuby2 constructs showed sensitivities between7.7 and 10.0% per 100 mV (Table 1). The bluest and reddestconstructs, containing ECFP and mKate2, exhibited poor voltagesensitivity, which we attribute to poor spectral overlap withQuasAr2 absorption. The negative slope of dF/dV was consistentwith greater spectral overlap of mOrange2 emission and QuasAr2absorption at depolarizing voltages.
Fast fluorescence response to a change in voltage is essential fordetecting neuronal APs. We applied a square wave of voltage(� 70 mV to þ 30 mV, 5 Hz) and recorded the fluorescence at aframe rate of 1,000 frames per s (Fig. 4c). Fluorescence responseswere approximately fit by a sum of two exponentials, with adominant fast and a smaller slow time constant. The fastest
construct was the mRuby2 GEVI, with tfast¼ 3.6±0.3 ms (65%)and tslow¼ 20±2 ms (35%) for depolarizing membrane potentialstep (n¼ 8 cells). The GFP, Citrine and mOrange2 had half-response times between 3.9 and 7.6 ms (Table 1). Response timeswere similar on rising and falling edges. Response amplitudes to a5 ms step from � 70 to þ 30 mV are given in SupplementaryTable 2.
We made side-by-side comparisons of the performance of theeFRET GEVIs with two GFP-based GEVIs, ArcLight Q239(ref. 7), and ASAP1 (ref. 9), and to direct fluorescence of QuasAr2(Fig. 4d–f). Cell culture, gene expression, electrophysiology,imaging and analysis protocols were identical across constructs(except for changes in illumination wavelength and intensity asnoted). ArcLight showed voltage sensitivity of � 31.6±3.5%DF/F per 100 mV (n¼ 7 cells, Fig. 4e), consistent with previousreports. The step response of ArcLight followed a bi-exponentialdecay with time constants of 28±8 ms (39%) and 271±6 ms
More ordered Less ordered
Resectableregion Unstructured QuasAr residues Unstructured mOrange2 residues
mOrange2 N-term truncationQuasAr C-term truncation
Δ Linker sequence0 T EA P E P SAGADV SA ADRP V VA V SKGE ENNMA I I K E F7 T EA P E P SAGAD – – – – –X X – –MV SKGE ENNMA I I K E F17 T E – – – – – – – – – – – – – –X X – – –V SKGE ENNMA I I K E F21 T E – – – – – – – – – – – – – –X X – – – – – – –E ENNMA I I K E F22 T E – – – – – – – – – – – – – –X X – – – – – – – –ENNMA I I K E F24 T E – – – – – – – – – – – – – –X X – – – – – – – – – –NMA I I K E F31 T – – – – – – – – – – – – – – –X X – – – – – – – – – – – – – – – –E F32 T – – – – – – – – – – – – – – –X X – – – – – – – – – – – – – – – – – F
QuasAr mOrange2
Number of truncated residues0 5 16 20 24 28 32
0
1
2
3
4 QuasAr1.2–mOrange2
Rat
io o
f ΔF
/Fm
Ora
nge2
vs.
Arc
Ligh
t
Arc
Ligh
tQ
uasA
r1.2
–m
Ora
nge2
Resectable region
F
t tV
E
t
FV
EE
10 %
ΔF
/F
2 s
20 %
ΔF
/F
2 s
Figure 2 | Directed evolution of an eFRET GEVI. (a) A model of QuasAr–mOrange2 constructs, represented by the crystal structures of Arch-2 (PDB
ID 2EI4)ref. 26 and mOrange (PDB ID 2H5O)27. The color scale represents the degree of order in the crystal structure, as reported by the B-factor.
Less-ordered regions are presumed more dispensable. (b) Design of linker truncation libraries. QuasAr1.2, the best available variant at the time of the
screen, was used as the electrochromic quencher. (c) Hierarchical screen of truncated linker libraries for eFRET GEVIs. Constructs were first screened in
E. coli for mOrange2 brightness and then screened for membrane trafficking in HEK cells. Voltage sensitivity was then tested via field stimulation in
HeLa cells co-expressing the eFRET GEVI, ArcLight (as an internal control), and Kir2.1 (to lower the resting voltage to �60 mV42). (d) ArcLight
fluorescence of three HeLa cells. Yellow arrow indicates direction of the applied electric field. Scale bar, 25mm. (e) Fluorescence intensity traces of the three
regions shown in d. (f) mOrange2 fluorescence from the same cells shown in d. (g) Response of mOrange2 fluorescence during stimulation as in
e. Fluorescence traces show single-trial measurement of cells imaged at 100 frames per second. (h) Effect of linker length on voltage sensitivity in
QuasAr1.2–mOrange2. For each linker length the most sensitive eFRET GEVI construct was compared with ArcLight measured in the same cells.
Error bars represent s.d. over n¼ 15–20 cells in the ratio DF/F.
ARTICLE NATURE COMMUNICATIONS | DOI: 10.1038/ncomms5625
4 NATURE COMMUNICATIONS | 5:4625 | DOI: 10.1038/ncomms5625 | www.nature.com/naturecommunications
& 2014 Macmillan Publishers Limited. All rights reserved.

(61%) (for a depolarizing voltage step from � 70 mV toþ 30 mV) and a bi-exponential fluorescence rise with timeconstants of 104±21 ms (61%) and 283±40 ms (39%) (forvoltage step from þ 30 mV to � 70 mV) (n¼ 7 cells,Supplementary Fig. 4). These numbers are slower than in theoriginal report on ArcLight7, due to the difference inmeasurement temperature: 23 �C in our measurements versus33–35 �C in the prior report. ASAP1 showed voltage sensitivity of28.8±1.7% per 100 mV and depolarizing voltage step responsetime constants of 2.3±0.1 ms (88%) and 39±3 ms (12%) (n¼ 6cells, Fig. 4e–f; Table 1).
The voltage response of direct retinal fluorescence of QuasAr2was measured in the QuasAr2-mOrange eFRET GEVI. Toachieve comparable levels of QuasAr2 and mOrange2 fluores-cence required 70-fold greater illumination intensity for QuasAr2(640 nm, 200 W cm� 2 versus 532 nm, 3 W cm� 2). Comparedwith the mOrange2 fluorescence, QuasAr2 fluorescence was moresensitive to voltage (DF/F¼ 90±2% per 100 mV, n¼ 6 cells,Fig. 4e–h) and had a somewhat faster response time (doubleexponential fit yielding: t1¼ 1.2 ms, 68%, t2¼ 12 ms, 32%,Fig. 4e–h). The discrepancy in response time between theQuasAr2 and mOrange2 may arise because, in addition to thefast fluorescence-determining transition, QuasAr2 may alsoundergo slower voltage-dependent transitions that change itsabsorption spectrum but not its fluorescence. Alternatively, subtlevoltage-induced conformational shifts could change the relativeposition and orientation of the mOrange2 and the retinal, andthereby change the efficiency of nonradiative quenching.
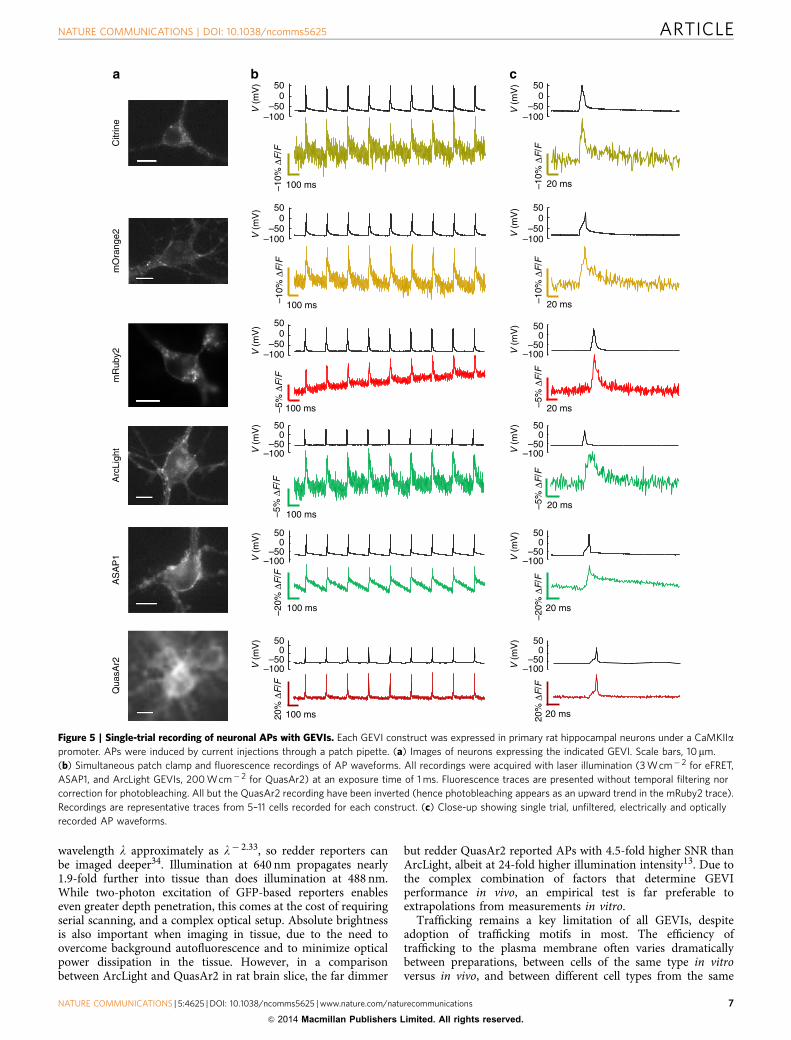
Characterization in neurons. The Citrine, mOrange2 andmRuby2 eFRET GEVIs showed sufficient sensitivity and speed tomerit testing in neurons. We expressed these via transienttransfection in cultured rat hippocampal neurons. Constructsexhibited good trafficking to the plasma membrane (Fig. 5).Injection of current pulses via a patch pipette (500–600 pA,5–10 ms, 5 Hz) induced trains of APs, which induced downwardfluorescence transients of 9.7±1.7% (Citrine), 9.9±1.3%(mOrange2) and 5.4±0.4% (mRuby2) (n¼ 7–11 cells for each,Table 1). Our eFRET constructs also reported spontaneousactivity in cultured neurons (Fig. 6).
Arclight also reported single-trial APs when used at 23 �C, witha downward transient of 8.2±0.7% (n¼ 7 cells), although thisresponse appeared to be dominated by the response to the slow
subthreshold depolarization as opposed to the fast spike. Thus,despite the greater steady-state voltage sensitivity of ArcLightthan the eFRET GEVIs, the slow response of ArcLight acted as alow-pass filter on millisecond-timescale APs, decreasing thefluorescence response7. ASAP1 reported single-trial neuronal APswith downward fluorescence transients of 17.8±3.4% (n¼ 5cells). On account of its greater sensitivity at negative voltages,ASAP1 magnified the subthreshold signal (55% of fluorescenceresponse) relative to the AP spike (45% of fluorescence response).In a similar assay, Mac-based eFRET GEVIs were reportedto resolve single APs with downward transients of 7.2% forMacQ–mOrange2 and 4.8% for MacQ-mCitrine23.
The SNR of fluorescence detection, defined as the ratio of thepeak amplitude to s.d. of fluorescence at the baseline, was8.8±1.0 (Citrine), 9.0±1.2 (mOrange2) and 7.2±0.6 (mRuby2)(1 kHz frame rate, illumination at 3 W cm� 2, 23 �C for all eFRETGEVIs) (n¼ 7–11 cells for each, Table 1). Parallel measurementson ArcLight had a single-trial SNR of 9.2±1.5 and substantiallybroadened the AP waveform (1 kHz frame rate, illumination at3 W cm� 2, 23 �C), while ASAP1 had a single-trial SNR of13.1±2.9. Previous measurements with QuasAr2 reported asingle-trial SNR for AP detection of 41 (300 W cm� 2) and 70(800 W cm� 2) (ref. 13).
DiscussionWith the proliferation of GEVI constructs, it can be difficult toidentify the best construct for a particular experiment. Speed,sensitivity and SNR for single APs for recently reported GEVIsare summarized in Table 1. SNR depends on both voltagesensitivity (DF/F) and overall fluorescence counts (F). In the shotnoise-limited regime, SNR for AP detection scales as DF=
ffiffiffi
Fp
,where DF is the change in fluorescence counts for a single AP.Baseline fluorescence counts, F, can vary considerably betweenexperiments, depending upon illumination intensity and wave-length, protein expression level, sources of background auto-fluorescence, collection efficiency of the objective, choice ofemission filter, quantum efficiency of the detector and selection ofthe ROI. The SNR values reported here provide a comparativeguide for measurements under matched conditions, but will differfor measurements performed under different conditions.
For multicolour voltage imaging, the choice of emission filter iscritical. We used the DF=
ffiffiffi
Fp
noise scaling to estimate the SNRfor each eFRET GEVI for 30 nm-wide detection bands between510–690 nm. We then determined which eFRET GEVI gave themaximum SNR in each band (Supplementary Fig. 5). Thiscalculation suggests that the eFRET GEVIs enable detectionof APs with SNR45 for any 30 nm emission band between510–660 nm. In the GFP spectral band, ASAP1 outperforms theeFRET GEVIs and ArcLight in terms of sensitivity, speed andSNR. In the yellow and orange emission bands, the MacQ-basedeFRET GEVIs23 are somewhat more sensitive, while theQuasAr2-based eFRET GEVIs are somewhat faster. Fordetection of APs in cultured neurons, both types of constructsyield similar SNR. At the far red end of the spectrum, QuasAr2outperforms both ASAP1 and the eFRET GEVIs in terms ofsensitivity, speed, SNR and photostability; but requires intenselaser illumination.
The excitation and emission wavelengths of a GEVI or otheroptical reporter influence performance when imaging in intacttissue. The excitation and emission spectra of flavins, a majorcontributor to brain autofluorescence, overlap strongly with thoseof GFP32,33. Consequently, a rule of thumb is that the signal-to-background ratio for GFP-based reporters is 10-fold lower intissue than in cell culture. Redder reporters have significantly lessbackground in brain tissue. Light scattering in tissue scales with
QuasAr2 ER2FP TS
0.0
0.2
0.4
0.6
0.8
1.0
400 500 600 700 800Wavelength (nm)
ECFP
EGFP
Citrine
mOrange2
mRuby2
mKate2
EmissionAbsorption
QuasAr2
Figure 3 | Spectral overlap of fluorescent proteins with QuasAr2
absorption. (a) eFRET GEVI domain structure. (b) Overlay of the emission
spectra of the fluorescent protein donors with the absorption spectrum of
the QuasAr2 electrochromic quencher.
NATURE COMMUNICATIONS | DOI: 10.1038/ncomms5625 ARTICLE
NATURE COMMUNICATIONS | 5:4625 | DOI: 10.1038/ncomms5625 | www.nature.com/naturecommunications 5
& 2014 Macmillan Publishers Limited. All rights reserved.

% ΔF
/F p
er 1
00 m
V%
ΔF
/F p
er 1
00 m
V
0
2
4
6
8
10
12
14
16
100 200 300Response speed (s–1)
Citrine
EGFP
mRuby2mKate2
mOrange2
0
20
40
60
80
100
10 100 1,000Response speed (s–1)
QuasAr2
ASAP1ArcLight
eFRET GEVIs
mKate2mRuby2EGFPa
b
c
d g
h
e
f
CitrineΔF
/F (
%)
02468
1012
0 80–80 –40 40
Time (ms)
0 80–80 –40 40
Time (ms)
0 80–80 –40 40
Time (ms)
0 80–80 –40 40
Time (ms)
0 80–80 –40 40
Time (ms)
0
10
20
30
mOrange2
–100 –50 0 50 100
Voltage (mV)
–100 –50 0 50 100
Voltage (mV)
–100 –50 0 50 100
Voltage (mV)
–100 –50 0 50 100
Voltage (mV)
–100 –50 0 50 100
Voltage (mV)
–15
–5
5
ΔF/F
(%
) 0
–10
–100 –50 0 50 100
Voltage (mV)
–100 –50 0 50 100
Voltage (mV)
–100 –50 0 50 100
Voltage (mV)
–100 –50 0 50 100
Time (ms) Time (ms) Time (ms)
–100 –50 0 50 100 –100 –50 0 50 100
ΔF/F
(%
)ΔF
/F (
%)
40
20
0
20
ΔF/F
(%
)
ΔF/F
(%
)
ΔF/F
(%
)
ΔF/F
(%
)
400
20
0
20
40
120
80
0
20
40
60
0
10
20
30
QuasAr2ArcLightASAP1
Figure 4 | Voltage sensing with GEVIs in HEK293 cells. Voltage response of eFRET GEVI reporters are shown in (a–c) and voltage responses of
comparison GEVIs are shown in (d–f). (a,d) Fluorescence images of HEK cells expressing GEVI reporters. Scale bars, 10 mm. (b,e) Fluorescence as a
function of membrane voltage, normalized to fluorescence at V¼ � 70 mV. Many eFRET-based GEVIs showed a small amount of hysteresis. Each trace
is a single trial with 100 ms exposures. (c,f) Fluorescence response to a step in membrane voltage from � 70 mV to þ 30 mV. Each trace is averaged over
20–30 trials with 1 ms exposures. All data were acquired with laser illumination (3 Wcm� 2 for eFRET, ASAP1 and ArcLight GEVIs, 200 Wcm� 2 for
QuasAr2). No temporal filtering was applied. Fluorescence traces were corrected for photobleaching. (g) Quantification of eFRET GEVI sensitivity and
speed. Voltage sensitivity of eFRET GEVIs approximately corresponds to the degree of spectral overlap between the emission of the GEVI and the
absorption of QuasAr2. (h) eFRET GEVI sensitivity and speed in the context of other GEVIs. Response speed was defined as the inverse of the time to
reach 50% of steady-state response to a voltage step from � 70 mV to þ 30 mV. Data in (g) and (h) represents an average of n¼6–9 cells for each
construct. Error bars represent s.e.m.
ARTICLE NATURE COMMUNICATIONS | DOI: 10.1038/ncomms5625
6 NATURE COMMUNICATIONS | 5:4625 | DOI: 10.1038/ncomms5625 | www.nature.com/naturecommunications
& 2014 Macmillan Publishers Limited. All rights reserved.
wavelength l approximately as l� 2.33, so redder reporters canbe imaged deeper34. Illumination at 640 nm propagates nearly1.9-fold further into tissue than does illumination at 488 nm.While two-photon excitation of GFP-based reporters enableseven greater depth penetration, this comes at the cost of requiringserial scanning, and a complex optical setup. Absolute brightnessis also important when imaging in tissue, due to the need toovercome background autofluorescence and to minimize opticalpower dissipation in the tissue. However, in a comparisonbetween ArcLight and QuasAr2 in rat brain slice, the far dimmer
but redder QuasAr2 reported APs with 4.5-fold higher SNR thanArcLight, albeit at 24-fold higher illumination intensity13. Due tothe complex combination of factors that determine GEVIperformance in vivo, an empirical test is far preferable toextrapolations from measurements in vitro.
Trafficking remains a key limitation of all GEVIs, despiteadoption of trafficking motifs in most. The efficiency oftrafficking to the plasma membrane often varies dramaticallybetween preparations, between cells of the same type in vitroversus in vivo, and between different cell types from the same
V (
mV
)
–100–50
050
a b c
V (
mV
)
–100–50
050
–100–50
050
100 ms–10%
ΔF
/F
–10%
ΔF
/F
V (
mV
)
–100–50
050
V (
mV
)
–100–50
050
V (
mV
)
–100–50
050
V (
mV
)
–100–50
050
V (
mV
)
–100–50
050
V (
mV
)
–100–50
050
V (
mV
)
–100–50
050
V (
mV
)
–100–50
050
V (
mV
)
100 ms–10%
ΔF
/F
–10%
ΔF
/F
100 ms–5%
ΔF
/F
–5%
ΔF
/F
20 ms
20 ms
20 ms
–20%
ΔF
/F
–20%
ΔF
/F20
% ΔF
/F
20%
ΔF
/F
100 ms 20 ms
–100–50
050
V (
mV
)
100 ms 20 ms
Citr
ine
mO
rang
e2m
Rub
y2A
SA
P1
Arc
Ligh
tQ
uasA
r2
–5%
ΔF
/F
–5%
ΔF
/F
100 ms20 ms
Figure 5 | Single-trial recording of neuronal APs with GEVIs. Each GEVI construct was expressed in primary rat hippocampal neurons under a CaMKIIapromoter. APs were induced by current injections through a patch pipette. (a) Images of neurons expressing the indicated GEVI. Scale bars, 10mm.
(b) Simultaneous patch clamp and fluorescence recordings of AP waveforms. All recordings were acquired with laser illumination (3 Wcm� 2 for eFRET,
ASAP1, and ArcLight GEVIs, 200 Wcm� 2 for QuasAr2) at an exposure time of 1 ms. Fluorescence traces are presented without temporal filtering nor
correction for photobleaching. All but the QuasAr2 recording have been inverted (hence photobleaching appears as an upward trend in the mRuby2 trace).
Recordings are representative traces from 5–11 cells recorded for each construct. (c) Close-up showing single trial, unfiltered, electrically and optically
recorded AP waveforms.
NATURE COMMUNICATIONS | DOI: 10.1038/ncomms5625 ARTICLE
NATURE COMMUNICATIONS | 5:4625 | DOI: 10.1038/ncomms5625 | www.nature.com/naturecommunications 7
& 2014 Macmillan Publishers Limited. All rights reserved.

species. For now, an empirical approach is warranted to identifythe construct best suited to a particular experiment.
The varied F versus V curves for available GEVIs accentuatedifferent aspects of cellular electrophysiology. The more linearGEVIs (eFRET and QuasArs) preserve the waveform of theunderlying voltage dynamics, a useful feature for quantification ofaction potential waveforms. The more sigmoidal GEVIs (ASAP1and ArcLight) emphasize voltage changes in the region ofmaximum slope. For ASAP1 and ArcLight this feature wouldemphasize subthreshold dynamics over APs in population-levelrecordings averaged over many cells. Due to their slightlydifferent voltages of maximum slope, ASAP1 would show greatestsensitivity for hyperpolarizing potentials while ArcLight wouldshow greatest sensitivity for depolarizing potentials (Fig. 4e).ArcLight variants have been demonstrated with maximumsensitivity over a range of voltages7.
Several challenges remain in genetically encoded voltageimaging. Owing to uncontrolled variation in expression level,none of the GEVIs discussed here reports absolute membranevoltage. To achieve absolute accuracy requires a more compleximaging scheme, either ratiometric35 or time-resolved36. Two-photon voltage imaging, which would facilitate imaging in tissue,also remains a challenge. This goal has been achieved withvoltage-sensitive dyes37, but two-photon GEVI imaging has notyet clearly resolved single APs, although some recent worksucceeded in detecting activity-evoked signals38.
Further improvements in the eFRET GEVIs are likely to comefrom optimization of the rhodopsin-based quencher and fromimprovements in the attachment of the fluorescent protein to therhodopsin. A rhodopsin need not show endogenous fluorescenceto serve as an efficient eFRET quencher, and thus manyrhodopsins that are not suitable as direct voltage indicatorsmay still be useful for eFRET. Thousands of microbial rhodopsingenes have been identified in the wild39,40, and among theseimproved quenchers are likely to exist. The estimated FRETefficiency of 18% in the Citrine construct implies that increases involtage sensitivity could be attained by improving energy transfer
from the fluorescent protein to the rhodopsin. This increase inefficiency could come from greater intimacy of contact betweenthe fluorescent protein and the rhodopsin, or from optimizing therelative orientation of the donor and acceptor fluorophores.To achieve these goals, one may insert circularly permutedfluorescent proteins into intracellular loops on the rhodopsin.
With simultaneous multicolour voltage imaging, one couldapply genetic targeting to record voltage simultaneously fromdistinct structures that might otherwise be difficult to distinguish.For instance, wide-field images that lack single-cell resolutioncould still distinguish population-average activity levels inintermingled excitatory and inhibitory neurons. The broadpalette of eFRET GEVIs also facilitates combination with otherGFP-based fluorescent reporters or a wide variety of optogeneticactuators.
MethodsMolecular biology. Synthetic DNA oligonucleotides were purchased fromIntegrated DNA Technologies. PfuUltraII polymerase (Agilent Technologies) orPhusion Polymerase (New England Biolabs) were used for high fidelity PCRamplifications in the buffer supplied by the respective manufacturer. PCR productsand products of restriction digests were purified either with PCR clean up kit(Qiagen) or using preparative agarose gel electrophoresis followed by DNA isola-tion using the Zymoclean gel DNA recovery kit (Zymo Research). Restrictionendonucleases were purchased from New England Biolabs and used according tothe manufacturer’s instructions. Ligations were performed using T4 DNA ligase(Invitrogen) or Gibson Assembly (New England Biolabs). Small-scale isolation ofplasmid DNA was performed by plasmid Miniprep kit (Qiagen). The cDNAsequences for all fusion constructs were confirmed by sequencing (Genewiz).Site-directed mutagenesis was performed with QuikChange kit (AgilentTechnologies).
Construction of linker libraries. A vector for expression in prokaryotic andeukaryotic systems was constructed based on mammalian expression vectorpcDNA3.1 (þ ). To facilitate prokaryotic expression, a customized constitutivepromoter was introduced 50-ttgctttgtgagcggataacaattataatagattca-30 based on thephage early T5 promoter for prokaryotic transcription41. An E. coli ribosomebinding site 50-aggaggaa-30 for prokaryotic translation was also introduced viaQuikChange reactions. The resultant vector, designated pcDuEx1.0, exhibitsmoderate expression of Arch-mOrange2 fusions in E. coli cells and very similarexpression levels in HeLa cells compared with its predecessor. We used pcDuEx1.0as the vector for screening of linker libraries.
We focused on mOrange2 fusions for determining optimized linker length forFRET efficiency. We chose QuasAr1.2 (Arch D95N/D106H, the best available atthe time of the screen) as the Arch body. For construction of QuasAr1.2–mOrange2 D0, we fused QuasAr1.2 to the N terminus of mOrange2 fusion via a5 residue linker (RPVVA) using overlap PCR. The DNA was PCR amplified withthe flanking restriction sites BamHI and XbaI, followed by double digestion andligation into pcDuEx1.0 linearized by digestion with the same two enzymes.
From the template of QuasAr1.2–mOrange2 D0, we constructed linker librariesby systematic truncation of the connecting region between QuasAr1.2 andmOrange2 using Quikchange reactions (Fig. 2). For each library, two randomizedamino-acid residues (nucleotide sequence NNKNNK, where N¼A, G, C, T andK¼G, T) were placed between the C terminus of Arch and the N terminus ofmOrange2, to generate 400 amino-acid combinations (1024 nucleotidecombinations). The libraries were cloned into pcDuEx1.0 via standard procedureof restriction enzyme digestion and ligation.
Hierarchical screen of linker libraries. E. coli (DH10B, Invitrogen) coloniesexpressing the linker library exhibited varied intensities of mOrange2 fluorescence.For each library, the 24 variants with brightest mOrange2 fluorescence were pickedand grown in overnight culture at 37 �C. The plasmid DNA of each variant wasprepared from overnight culture using standard miniprep procedure. For eachvariant, the plasma membrane trafficking was examined in HEK cells (CRL-1573,ATCC) co-expressing ArcLight, which served as internal reference. The fivevariants with the best membrane trafficking were then expressed in HeLa cells fortesting of voltage sensitivity.
HeLa cells (CCL2, ATCC) were grown to 40–60% confluence on home-made35 mm glass-bottom dishes or 24-well glass-bottom plates, and transfected with1 mg of plasmid DNA and 2 ml Turbofect (Thermo Scientific) according to themanufacturer’s instructions. HeLa cells were transfected with plasmids encodingthe QuasAr1.2–mOrange2 variant, ArcLight Q239 (Addgene: 36856) and Kir2.1(Addgene: 32641) in equal weight ratio. Expression of Kir2.1 in HeLa cellsmaintained the resting potential close to � 60 mV, appropriate for a neuronalvoltage indicator42. After 3 h incubation, the media was exchanged to DMEM with10% fetal bovine serum and the cells were incubated for an additional 24 h at 37 �C
–500
50a
b
c
V (
mV
)
–5%
ΔF
/F
–50
500 ms
050
V (
mV
)
–2%
ΔF
/F
–500
50
V (
mV
)
–5%
ΔF
/F
500 ms
500 ms
Figure 6 | Optical recording of spontaneous neuronal firing with eFRET
GEVIs. In neurons synaptically coupled to a spontaneously active circuit,
the (a) Citrine, (b) mOrange and (c) mRuby2 eFRET GEVIs clearly revealed
single APs. Patch clamp voltage recordings are shown above optical
recording traces. All recordings were acquired with laser illumination
(3 Wcm� 2) at an exposure time of 2 ms. Fluorescence traces are
presented without temporal filtering. The optical recordings have been
corrected for photobleaching with a linear fit.
ARTICLE NATURE COMMUNICATIONS | DOI: 10.1038/ncomms5625
8 NATURE COMMUNICATIONS | 5:4625 | DOI: 10.1038/ncomms5625 | www.nature.com/naturecommunications
& 2014 Macmillan Publishers Limited. All rights reserved.

in a CO2 incubator. Immediately before imaging, cells were washed twice withHanks balanced salt solution and then 1 ml of 20 mM HEPES-buffered Hanksbalanced salt solution was added. No retinal was added to the buffer–loading ofretinal into the rhodopsin was presumed to occur from endogenous retinal.
Cell imaging was performed with an inverted Eclipse Ti-E (Nikon) equippedwith a Photometrics QuantEM 512SC camera and a 150 W mercury-xenon lamp(Hamamatsu). A home-made parallel platinum electrode pair with a separationdistance of 0.5 cm was mounted in a custom plastic support and was placed in theimaging dish or well. The waveforms of voltage pulses were generated by a pulsegenerator PG 58A (Gould Advance) and amplified by an Agilent 6824A 40V/25ADC Power Supply (Hewlett Packard). The typical waveform had square wavepulses lasting 20 ms with pulse field strength ranging from 50–60 V cm� 1. ThemOrange2 fluorescence was imaged at 100 Hz frame rate in 4� 4 binning mode for10 s using the following filter set: 545/30 nm (excitation), 620/60 nm (emission) and565 nm (dichroic). For imaging ArcLight, the filter set was: 480/40 nm (excitation),535/40 nm (emission) and 505 nm (dichroic).
The raw fluorescence traces of both mOrange2 and ArcLight were extractedfrom identical regions of interest in cells expressing both constructs, and exportedinto a Microsoft Excel spreadsheet using the microscope software NIS-ElementsAdvanced Research (Nikon). Background subtraction, photobleaching corrections,calculations of average DF/F and calculation of SNR were performed automaticallyin Excel. The average DF/F and SNR of mOrange2 signals was compared with thoseof ArcLight signals from the same cells, and the ratios of DF/F of mOrange2 versusArcLight were reported. At least 20 cells co-expressing mOrange2 fusion andArcLight were analysed for each variant. The best variant with maximum meanratio in each library was determined and sequenced.
pH-dependent absorption spectrum of QuasAr2. E. coli cells transformed with apBAD vector encoding QuasAr2 were grown in 12 ml liquid LB medium with200mg ml� 1 ampicillin overnight. The next day, 12 ml of liquid LB mediumcontaining 50 mM retinal, 200 mg ml� 1 ampicillin and 0.2% L-arabinose was addedinto the culture to induce expression of QuasAr2, followed by additional incuba-tion at 37 �C for 3.5 h. The cell pellets were collected by centrifugation, washed withTris-buffered saline (30 mM Tris, 150 mM NaCl, pH 7.4), and lysed with a tipsonicator for 10 min. The cytoplasmic fraction was discarded after centrifugationand the coloured insoluble fraction was resuspended in a series of modified Tris-buffered saline buffers (30 mM Tris, 150 mM NaCl, adjusted to the pH value of thespectral measurement) containing 1% N-dodecyl-b-D-maltopyranoside (Affyme-trix). The suspension was then centrifuged (17,000 g for 15 min, 4 �C). Absorptionspectra of QuasAr2 in the supernatant in different pH were recorded on a DU-800ultraviolet-visible spectrophotometer (Beckman).
Expression vectors for HEK cells and neurons. We chose lentivirus vectorFCK-Arch-EGFP (Addgene: 22217) as the backbone for all eFRET constructs.This vector features a CaMKIIa promoter and a Woodchuck hepatitis virusposttranscriptional regulatory element after the 30 end of the open reading frame.To enhance membrane trafficking of fusion proteins, we added a TS and ER exportsignal peptide sequence (FCYENEV), derived from the inward rectifier potassiumchannel Kir2.1, as previously described28. QuasAr2-FP fusion constructs weremade by Gibson Assembly: the vector was linearized by double digestion withBamHI and BsrGI, and QuasAr2 and fluorescent protein cDNA segments weregenerated by PCR amplification.
The linker configuration of all eFRET fusion proteins was constructed based onthe optimized linker sequence found by the linker screening. In all eFRET fusionproteins, the N-terminal 2 amino acids of QuasAr2 were changed from DP to VS tofacilitate expression, and the C-terminal 14 amino acids of QuasAr2(APEPSAGADVSAAD) were replaced with a 2-amino-acid linker, Leu-Arg (basedon the optimized linker sequence found in linker library D24), to shorten thedistance between QuasAr2 and fluorescent protein. The N-terminal amino acids inthe fluorescent proteins were also truncated (Supplementary Table 3). Thenucleotide sequences of all constructs are in the Supplementary Note 1.
Two-photon lifetime measurements to determine FRET efficiency.We measured fluorescence lifetime on a home-built beam-scanning two-photonmicroscope with an 80 MHz, 100 fs tunable pulsed laser (SpectraPhysics InsightDeepSee). Pulse compression in the sample plane was performed throughmaximizing the fluorescence intensity of a bead-sample, using the motorized prismcompressor built into the laser. The citrine measurements were performed at1,040 nm excitation wavelength with a time-averaged excitation power of 30 mW,or 0.4 nJ per pulse, focused down to a B500 nm spot with a 1.2 NA waterimmersion objective (Olympus UplanSapo) for a time-averaged intensity of15 MW cm� 2; measurements were performed for linear speeds of the scanned spotvarying between 0 and 30 cm s� 1 without any measurable effect on fluorescencelifetime. Excitation light and fluorescence were separated using a FF775-Di01dichroic mirror and FF01-790/SP-25 Shortpass filter (Both Semrock); fluorescencewas detected using a Hamamatsu R943-02 photomultiplier tube in photoncounting mode, cooled to � 20 �C. The PMT signal was amplified through an SRSPR325 amplifier and discretized with a Hamamatsu Photon counting unit C9744,
before being fed into a Picoharp 300 TCSPC module (Picoquant). The setup wascontrolled by Labview software written in-house.
Simultaneous electrophysiology and fluorescence in HEK cells. HEK293t/17cells (ATCC CRL-11268) were cultured and transfected following standardprotocols. Briefly, cells were grown at 37 �C, 5% CO2, in DMEM supplementedwith 10% fetal bovine serum and penicillin–streptomycin. Plasmids were trans-fected using TransIT-293 reagent (Mirus Bio LLC) following the manufacturer’sinstructions. Twenty-four hours post transfection, cells were re-plated ontoglass-bottom dishes (MatTek) at a density of B10,000 cells cm� 2. Cells wereassayed 40–60 h post transfection.
Despite the presence of saturating retinal in the culture medium, cells weresupplemented with retinal before measurement to remove a possible source ofvariability. Cells were supplemented with retinal by preincubating with 5 mMretinal in growth medium (diluted from 40 mM stock solution in dimethylsulphoxide) in the incubator for 0.5–1 h immediately before imaging. All imagingand electrophysiology were performed in Tyrode’s buffer (containing 125 mMNaCl, 2.5 mM KCl, 3 mM CaCl2, 1 mM MgCl2, 10 mM HEPES, 30 mM glucose, atpH 7.3 and adjusted to 305–310 mOsm with sucrose). A gap junction blocker,2-aminoethoxydiphenyl borate (50 mM, Sigma), was added to eliminate electricalcoupling between cells.
Filamented glass micropipettes (WPI) were pulled to a tip resistance of5–10 MO, and filled with internal solution containing 125 mM potassiumgluconate, 8 mM NaCl, 0.6 mM MgCl2, 0.1 mM CaCl2, 1 mM EGTA, 10 mMHEPES, 4 mM Mg-ATP, 0.4 mM Na-GTP (pH 7.3); adjusted to 295 mOsm withsucrose. Pipettes were positioned with a Sutter MP285 manipulator. Whole-cell,voltage and current clamp recordings were acquired using a patch clamp amplifier(A-M Systems, Model 2400), filtered at 5 kHz with the internal filter and digitizedwith a National Instruments PCIE-6323 acquisition board at 10 kHz.
Simultaneous whole-cell patch clamp recordings and fluorescence recordingswere acquired on a home-built, inverted epifluorescence microscope, describedbelow in the section ‘Imaging Apparatus’.
Neuronal culture and electrophysiology. All procedures involving animals werein accordance with the National Institutes of Health Guide for the care and use oflaboratory animals and were approved by the Institutional Animal Care and UseCommittee at the institution at which they were carried out.
Hippocampal neurons from P0 rat pups were dissected and cultured inneurobasal-based medium (NBActiv4, Brainbits) at a density of 40,000 cm� 2 onglass-bottom dishes (MatTek) pre-coated with poly-D-lysine (Sigma P7205) andmatrigel (BD Biosciences 356234). At 3 days in vitro (DIV), cytarabine was addedto the neuronal culture medium at a final concentration of 2 mM to inhibit glialgrowth43.
Neurons were transfected on DIV 7 with the eFRET plasmid usingLipofectamine 2000 transfection reagent (Life Technologies). Procedures followedmanufacturer’s instructions but reduced the amount of reagent by 50–80% to avoidtoxicity.
Measurements were performed on primary cultures at DIV 10–20. Experimentswere conducted in Tyrode’s solution containing 125 mM NaCl, 2.5 mM KCl,3 mM CaCl2, 1 mM MgCl2, 10 mM HEPES, 30 mM glucose (pH 7.3) and adjustedto 305–310 mOsm with sucrose. Immediately before imaging, neurons wereincubated with 5 mM all-trans retinal in the culture medium for 30 min and thenwashed with Tyrode’s solution. Experiments were performed at 23 �C underambient atmosphere.
Imaging apparatus. Experiments were conducted on a home-built invertedfluorescence microscope equipped with 488 nm, 532 nm, 561 nm, 594 nm and640 nm laser lines and a scientific CMOS camera (Hamamatsu ORCA-Flash 4.0).The power and manufacturer of laser lines are summarized in SupplementaryTable 4. Illumination from lasers were combined using dichroic mirrors, sentthrough an acousto-optic tunable filter (Gooch and Housego 48058-2.5-.55-5W)for intensity modulation, and then expanded and focused onto the back focal planeof a � 60 water immersion objective, numerical aperture 1.20 (Olympus UIS2UPlanSApo � 60/1.20 W). Imaging of fluorescent proteins was performed atillumination intensities of 2–4 W cm� 2. Imaging of QuasAr2-direct fluorescencewas performed at an illumination intensity of 200–400 W cm� 2. SupplementaryTable 5 summarizes the laser lines, dichroic mirrors and emission filters used forfluorescence imaging. For fast data acquisition, a small field of view around the cellof interest was chosen at the centre of the camera to achieve a frame rate of 1,000frames per second.
Data analysis. Data was analysed with home-made software written in MATLAB.Fluorescence intensities from raw movies were extracted using a maximum like-lihood pixel-weighting algorithm described in ref. 14. Briefly, the fluorescence ateach pixel was correlated with the mean fluorescence. Pixels that showed strongercorrelation to the mean were preferentially weighted. This algorithm automaticallyfound the pixels carrying the most information, and de-emphasized backgroundpixels. Alternatively, a ROI comprising the cell body was defined by the user, andfluorescence intensity was calculated from the unweighted mean of pixel values
NATURE COMMUNICATIONS | DOI: 10.1038/ncomms5625 ARTICLE
NATURE COMMUNICATIONS | 5:4625 | DOI: 10.1038/ncomms5625 | www.nature.com/naturecommunications 9
& 2014 Macmillan Publishers Limited. All rights reserved.

within the ROI. With the improved trafficking of the QuasAr2 mutants resultingfrom the TS and ER2 motifs, the ROI approach gave similar results as themaximum likelihood pixel-weighting algorithm.
For eFRET speed analysis, the time constants for the step response werecalculated by fitting a double exponential to the rising and decaying portions of thefluorescence traces. All error ranges represent s.e.m.
References1. Cohen, A. E. & Venkatachalam, V. Bringing bioelectricity to light. Annu. Rev.
Biophys. 43, 11.1–11.22 (2014).2. Bezanilla, F. How membrane proteins sense voltage. Nat. Rev. Mol. Cell Biol.
9, 323–332 (2008).3. Kralj, J. M., Hochbaum, D. R., Douglass, A. D. & Cohen, A. E. Electrical spiking
in Escherichia coli probed with a fluorescent voltage indicating protein. Science333, 345–348 (2011).
4. Slayman, C. L. & Slayman, C. W. Depolarization of the plasma membrane ofNeurospora during active transport of glucose: evidence for a proton-dependent cotransport system. Proc. Natl Acad. Sci. USA 71, 1935–1939 (1974).
5. Mousavi, S. A., Chauvin, A., Pascaud, F., Kellenberger, S. & Farmer, E. E.GLUTAMATE RECEPTOR-LIKE genes mediate leaf-to-leaf wound signalling.Nature 500, 422–426 (2013).
6. Siegel, M. S. & Isacoff, E. Y. A genetically encoded optical probe of membranevoltage. Neuron 19, 735–741 (1997).
7. Jin, L. et al. Single action potentials and subthreshold electrical events imagedin neurons with a fluorescent protein voltage probe. Neuron 75, 779–785(2012).
8. Cao, G. et al. Genetically targeted optical electrophysiology in intact neuralcircuits. Cell 154, 904–913 (2013).
9. St-Pierre, F. et al. High-fidelity optical reporting of neuronal electrical activitywith an ultrafast fluorescent voltage sensor. Nat. Neurosci. 17, 884–889 (2014).
10. Baker, B. J. et al. Genetically encoded fluorescent voltage sensors using thevoltage-sensing domain of Nematostella and Danio phosphatases exhibit fastkinetics. J. Neurosci. Methods 208, 190–196 (2012).
11. Mutoh, H., Akemann, W. & Knopfel, T. Genetically engineered fluorescentvoltage reporters.. ACS Chem. Neuro. 3, 585–592 (2012).
12. Lam, A. J. et al. Improving FRET dynamic range with bright green and redfluorescent proteins. Nat. Methods 9, 1005–1012 (2012).
13. Hochbaum, D. R. et al. All-optical electrophysiology in mammalian neuronsusing engineered microbial rhodopsins. Nat. Methods 11, 825–833 (2014).
14. Kralj, J. M., Douglass, A. D., Hochbaum, D. R., Maclaurin, D. & Cohen, A. E.Optical recording of action potentials in mammalian neurons using a microbialrhodopsin. Nat. Methods 9, 90–95 (2012).
15. Chen, T. et al. Ultrasensitive fluorescent proteins for imaging neuronal activity.Nature 499, 295–300 (2013).
16. Marvin, J. S. et al. An optimized fluorescent probe for visualizing glutamateneurotransmission. Nat. Methods 10, 162–170 (2013).
17. Tantama, M., Martınez-Francois, J. R., Mongeon, R. & Yellen, G. Imagingenergy status in live cells with a fluorescent biosensor of the intracellular ATP-to-ADP ratio. Nat. Commun. 4, 2550 (2013).
18. Kuner, T. & Augustine, G. J. A genetically encoded ratiometric indicator forchloride: capturing chloride transients in cultured hippocampal neurons.Neuron 27, 447–459 (2000).
19. San Martın, A. et al. Imaging mitochondrial flux in single cells with a FRETsensor for pyruvate. PLoS ONE 9, e85780 (2014).
20. Bayraktar, H. et al. Ultrasensitive measurements of microbial rhodopsinphotocycles using photochromic FRET. Photochem. Photobiol. 88, 90–97(2011).
21. Barker, S. L., Kopelman, R., Meyer, T. E. & Cusanovich, M. A. Fiber-optic nitricoxide-selective biosensors and nanosensors. Anal. Chem. 70, 971–976 (1998).
22. Kuznetsova, S. et al. The enzyme mechanism of nitrite reductase studied atsingle-molecule level. Proc. Natl Acad. Sci. USA 105, 3250–3255 (2008).
23. Gong, Y., Wagner, M. J., Li, J. Z. & Schnitzer, M. J. Imaging neural spiking inbrain tissue using FRET-opsin protein voltage sensors. Nat. Commun. 5, 3674(2014).
24. Maclaurin, D., Venkatachalam, V., Lee, H. & Cohen, A. E. Mechanism ofvoltage-sensitive fluorescence in a microbial rhodopsin. Proc. Natl Acad. Sci.USA 110, 5939–5944 (2013).
25. Shaner, N. C. et al. Improving the photostability of bright monomeric orangeand red fluorescent proteins. Nat. Methods 5, 545–551 (2008).
26. Enami, N. et al. Crystal structures of archaerhodopsin-1 and-2: commonstructural motif in archaeal light-driven proton pumps. J. Mol. Biol. 358,675–685 (2006).
27. Shu, X., Shaner, N. C., Yarbrough, C. A., Tsien, R. Y. & Remington, S. J. Novelchromophores and buried charges control colour in mFruits. Biochemistry 45,9639–9647 (2006).
28. Gradinaru, V. et al. Molecular and cellular approaches for diversifying andextending optogenetics. Cell 141, 154–165 (2010).
29. Heim, R. & Tsien, R. Y. Engineering green fluorescent protein for improvedbrightness, longer wavelengths and fluorescence resonance energy transfer.Curr. Biol. 6, 178–182 (1996).
30. Griesbeck, O., Baird, G. S., Campbell, R. E., Zacharias, D. A. & Tsien, R. Y.Reducing the environmental sensitivity of yellow fluorescent protein.Mechanism and applications. J. Biol. Chem. 276, 29188–29194 (2001).
31. Shcherbo, D. et al. Far-red fluorescent tags for protein imaging in living tissues.Biochem. J. 418, 567–574 (2009).
32. Chung, Y. G., Schwartz, J. A. & Sawaya, R. E. Diagnostic potential of laser-induced autofluorescence emission in brain tissue. J. Korean Med. Sci. 12.2,135–142 (1997).
33. Lin, W., Toms, S. A., Motamedi, M., Jansen, E. D. & Mahadevan-Jansen, A.Brain tumor demarcation using optical spectroscopy; an in vitro study.J. Biomed. Opt. 5, 214–220 (2000).
34. Flock, S. T., Jacques, S. L., Wilson, B. C., Star, W. M. & van Gemert, M. J.Optical properties of Intralipid: a phantom medium for light propagationstudies. Lasers Surg. Med. 12, 510–519 (1992).
35. Zhang, J., Davidson, R. M., Wei, M. & Loew, L. M. Membrane electricproperties by combined patch clamp and fluorescence ratio imaging in singleneurons. Biophys. J. 74, 48–53 (1998).
36. Hou, J. H., Venkatachalam, V. & Cohen, A. E. Temporal dynamics of microbialrhodopsin fluorescence reports absolute membrane voltage. Biophys. J. 106,639–648 (2014).
37. Fisher, J. A. et al. Two-photon excitation of potentiometric probes enablesoptical recording of action potentials from mammalian nerve terminals in situ.J. Neurophysiol. 99, 1545–1553 (2008).
38. Akemann, W. et al. Two-photon voltage imaging using a genetically encodedvoltage indicator. Sci. Rep. 3, 2231 (2013).
39. Beja, O., Spudich, E. N., Spudich, J. L., Leclerc, M. & Delong, E. F.Proteorhodopsin phototrophy in the ocean. Nature 411, 786–789 (2001).
40. Spudich, J. L. The multitalented microbial sensory rhodopsins. TrendsMicrobiol. 14, 480–487 (2006).
41. Bujard, H. et al. A T5 promoter-based transcription-translation system for theanalysis of proteins in vitro and in vivo. Meth. Enzymol. 155, 416–433 (1987).
42. Hille, B. in Ion Channels of Excitable Membranes (Sinauer, 2001).43. Chen, G., Harata, N. C. & Tsien, R. W. Paired-pulse depression of unitary
quantal amplitude at single hippocampal synapses. Proc. Natl Acad. Sci. USA101, 1063–1068 (2004).
AcknowledgementsWe thank V. Nathan and N. Smedemark-Margulies for technical assistance, andV. Venkatachalam, S. Farhi and J. Kralj for helpful discussions. We thank A.Y. Ting,F.St Pierre and M.Z. Lin for plasmids and spectral information. P.Z., A.D.D., D.R.H.,D.B., C.A.W. and A.E.C. were supported by the Howard Hughes Medical Institute, theHarvard Center for Brain Science, PECASE award N00014-11-1-0549, US NationalInstitutes of Health grants 1-R01-EB012498-01 and New Innovator grant 1-DP2-OD007428. D.R.H. was supported by an NSF Graduate Fellowship. D.B. was supportedby an NWO-Rubicon Fellowship. R.E.C. was supported by the Natural Sciences andEngineering Research Council of Canada (Discovery Grants) and the Canadian Institutesof Health Research. Y.Z. was supported by a graduate scholarship from the University ofAlberta and Alberta Innovates. R.E.C. holds a Tier II Canada Research Chair.
Author contributionsP.Z., Y.Z., D.R.H., A.D.D., C.A.W., D.B. conducted experiments and analysed data.R.E.C. supervised the screen for linker length optimization. A.E.C. proposed eFRET forvoltage sensing. P.Z., Y.Z., R.E.C. and A.E.C. wrote the paper.
Additional informationSupplementary Information accompanies this paper at http://www.nature.com/naturecommunications
Competing financial interests: AEC is a founder of Q-State Biosciences.
Reprints and permission information is available online at http://npg.nature.com/reprintsandpermissions/
How to cite this article: Zou, P. et al. Bright and fast multicoloured voltage reporters viaelectrochromic FRET. Nat. Commun. 5:4625 doi: 10.1038/ncomms5625 (2014).
ARTICLE NATURE COMMUNICATIONS | DOI: 10.1038/ncomms5625
10 NATURE COMMUNICATIONS | 5:4625 | DOI: 10.1038/ncomms5625 | www.nature.com/naturecommunications
& 2014 Macmillan Publishers Limited. All rights reserved.