bright and dark regions on mars: particle size and
TRANSCRIPT
Bright and dark regions on Mars: Particle size and mineralogical
characteristics based on Thermal Emission Spectrometer data
Steven W. Ruff and Philip R. ChristensenMars Space Flight Facility, Department of Geological Sciences, Arizona State University, Tempe, Arizona, USA
Received 24 August 2001; revised 30 April 2002; accepted 22 May 2002; published 11 December 2002.
[1] Emissivity spectra (1670–200 cm�1) from the Mars Global Surveyor ThermalEmission Spectrometer (MGS-TES) show significant differences between bright and darksurfaces, allowing further investigation of their physical and mineralogical character.TES spectra from bright surfaces (albedo �0.2) typically show lower emissivity at highwavenumbers (>1300 cm�1) than that of dark surfaces (albedo <0.2). The oppositebehavior is evident in the low wavenumbers (<560 cm�1), where bright surfaces havehigher emissivity than dark ones. These trends are consistent with the spectral behavior ofsilicate materials of varying particle size. The short wavelength feature displayed by TESspectra of bright surfaces is a relatively strong absorption that likely is the result of particlesize effects of surface silicate particles �100 mm in size. A dust cover index (DCI) isdeveloped that exploits this short wavelength feature, serving to identify surfaces thatrange from dust-covered to dust-free. As a gauge of surface-obscuring silicate dust thatcan impact spectral measurements, the DCI is more direct than thermal inertia or albedomeasurements. Spectral ratio analysis using emissivity spectra from adjacent bright anddark surfaces is explored as a means of deriving the mineralogy of surface dust. The resultshows that the dust is dominated by silicate minerals with indication of a significantplagioclase feldspar component. INDEX TERMS: 5410 Planetology: Solid Surface Planets:
Composition; 5464 Planetology: Solid Surface Planets: Remote sensing; 5470 Planetology: Solid Surface
Planets: Surface materials and properties; 5494 Planetology: Solid Surface Planets: Instruments and
techniques; 6225 Planetology: Solar System Objects: Mars; KEYWORDS: Mars, dust, infrared, albedo, TES
Citation: Ruff, S. W., and P. R. Christensen, Bright and dark regions on Mars: Particle size and mineralogical characteristics based
on Thermal Emission Spectrometer data, J. Geophys. Res., 107(E12), 5127, doi:10.1029/2001JE001580, 2002.
1. Introduction
[2] Visibly bright and dark regions on Mars have longbeen recognized, first by astronomers and more recently,by investigators using instruments on spacecraft. Theorigin of these features was the subject of considerablecontroversy, with the possible role of vegetation beingdebated into the late 1960s [Salisbury, 1966; Adams andMcCord, 1969; Sagan and Pollack, 1969]. Although thevegetation debate has mostly subsided, global remote-sensing investigations of the physical and mineralogicalnature of bright and dark surface features have continued.The generalized view that has emerged is that classicalbright features are regions covered by a layer of dust[Kieffer et al., 1973, 1977] up to 2 m thick with particlesin the size range of 2–40 mm [Christensen, 1986]. Theclassical dark features are relatively dust-free but are stilldominated by particulate materials ranging from 0.1 mm to1 cm [Christensen and Moore, 1992] rather than bedrock.Compositionally, dark regions appear to be dominated byminerals found in mafic volcanic rocks, specifically, pyrox-ene [e.g., Singer et al., 1979; Mustard et al., 1993; Bell et
al., 1997; Bandfield et al., 2000a; Christensen et al.,2000a] and plagioclase [Bandfield et al., 2000a; Christen-sen et al., 2000a]. The mineralogy of bright-region dust isnot fully resolved but there is some consensus that pala-gonite, an alteration product of mafic volcanic glass, is asignificant component [e.g., Singer, 1982; Bell et al., 1993;Morris et al., 2001].[3] With the advent of the Mars Global Surveyor Ther-
mal Emission Spectrometer (TES) [Christensen et al.,1992, 2001], it is now possible to examine the thermal-infrared (TIR) spectral character (�1670–200 cm�1) ofMars at a combined spatial and spectral sampling (3 � 6km and 10 cm�1, respectively) previously not available. Todate, surface studies using TES spectra have focused ondark regions, where basalt, basaltic andesite, and hematite-rich materials have been identified [Bandfield et al., 2000a;Christensen et al., 2000a, 2000b]. Although a lineardeconvolution method for surface-atmosphere separationis employed in those studies [Smith et al., 2000a], thismethod has limitations for examining the spectral charac-teristics of bright regions. Specifically, the methodexcludes the high wavenumber region of TES spectraand incorporates the assumption that bright regions haveno spectral features. The purpose of this paper is tocontrast the spectral characteristics of bright and dark
JOURNAL OF GEOPHYSICAL RESEARCH, VOL. 107, NO. E12, 5127, doi:10.1029/2001JE001580, 2002
Copyright 2002 by the American Geophysical Union.0148-0227/02/2001JE001580$09.00
10 - 1

regions which are here defined loosely by their broadbandvisible to near IR (0.3–3.0 mm) lambert albedo valueswhere bright is �0.2 and dark is <0.2. The classical brightand dark features of Mars that have been known forcenturies from telescopic observations fit this definitionand provide a logical basis for comparison. We willdemonstrate that: (1) surface spectral information is dis-cernable without surface-atmosphere separation, (2) brightregions have an important and useful absorption feature athigh wavenumbers (>�1300 cm�1), (3) major TIR spectraldifferences between bright and dark regions are due toparticle size effects, and (4) carefully applied ratios ofspectra from bright and dark surfaces produce featuresattributable to surface dust.[4] Because the spectral features of the atmosphere are so
significant, section 2 describes the identification of suchfeatures in TES spectra. In section 3, the spectral differencesbetween bright and dark regions are shown and comparedunder varying atmospheric conditions. The relationshipbetween these spectral differences and the particle sizeand mineralogy of surface materials is described in section4 followed by the development of a dust cover index (DCI)based on high wavenumber emissivity in section 5. Finally,our results will be discussed in section 6 and conclusionsgiven in section 7.
2. Spectral Features of the Atmosphere
[5] Thermal-IR spectra of Mars are dominated by atmos-pheric absorptions. In order to distinguish the spectralfeatures of the surface from those of the atmosphere, it isnecessary first to recognize the multitude of atmosphericfeatures. Figure 1 shows two TES spectra that display the
combined features of atmospheric CO2 gas, dust, watervapor, and water ice. The modeled spectra of individualatmospheric components shown with the same 10 cm�1
sampling as the TES spectra are included.[6] All the TES spectra in this paper are plotted as
apparent emissivity versus wavenumber. The measuredspectrum has been calibrated to radiance and then dividedby a Planck curve at the maximum brightness temperaturecalculated from the radiance spectrum. In this form, primarytemperature effects are removed. For convenience, spectraof the atmospheric components shown in Figure 1 are alsoplotted with units of apparent emissivity rather than themore common use of brightness temperature or opacity[e.g., Smith et al., 2000a].
2.1. Carbon Dioxide Gas
[7] The CO2 spectrum in Figure 1 was supplied by J.Pearl and G. Bjoraker (personal communication), producedwith a line-by-line, layer-by-layer technique based on thework of Kunde and Maguire [1974]. The following con-ditions were applied: the atmospheric temperature profilewas 260 K at surface level (6.1 mbar surface pressure),decreasing 3 K km�1 with altitude to 300 km, where itbecomes isothermal; the surface temperature was 300 K.Several CO2 absorptions are evident throughout the TESspectral range (for detailed studies see works of Maguire[1977], Crisp [1990] and Rothman [1992]). Most dominantis the one centered at 667 cm�1 (15 mm) arising from thefundamental bending mode of gaseous CO2. Although itappears as a single feature in a TES spectrum, additionalCO2 bands related to rotation-vibration coupled modes,CO2 isotopes, and Fermi resonances produce the observedshape [e.g., Goody and Yung, 1989]. The opacity of this
Figure 1. Demonstration of the appearance of atmospheric spectral features in TES spectra and inisolation. The two TES spectra, which are the average of 120 individual spectra from a common locationin Arabia Terra (see Figure 5 for data details), show the dramatic variations that result from differentatmospheric conditions. The spectra of the atmospheric components shown in isolation are modeledresults (see text for details). The letter h indicates a CO2 hot band and the letter i indicates a CO2 isotopeband. All spectra are displayed with 10 cm�1 sampling.
10 - 2 RUFF AND CHRISTENSEN: BRIGHT AND DARK REGIONS ON MARS
feature at its center is so high that surface radiance iscompletely absorbed and thus does not reach an orbitinginstrument. For a typical daytime TES spectrum, the surfaceradiance component only becomes significant at >�780and <�560 cm�1.[8] Outside of the 667 cm�1 CO2 feature is a set of ‘‘hot
bands’’, which are absorptions that arise from vibrationaltransitions originating from above the ground state. Twonotable hot bands are readily apparent on either side of the667 cm�1 feature, one at �544 cm�1 and the other at �790cm�1 (Figure 1). A pair of weak doublets, one centered at�960 cm�1 and the other at �1060 cm�1 also are hot bands[e.g., Maguire, 1977]. These are less discernable in TESspectra because they overlap with the prominent aerosoldust and water-ice absorptions. Hot band absorptions arevery sensitive to temperature, increasing in intensity withincreasing atmospheric temperature.[9] A final set of CO2 features arises from the various
isotopes of oxygen and carbon that can be found in themolecule. Most significant for TES spectra are the weakdoublets centered at �1260 and 1365 cm�1 that are theresult of a Fermi resonance between fundamental modes ofthe 18O12C16O isotope [Young , 1982]. Compared with hotbands, these absorptions are much less sensitive to thetemperature of the atmosphere.
2.2. Aerosol Dust
[10] The atmosphere of Mars is never free from dustalthough seasonal variability is well documented (mostrecently by Clancy et al. [2000] and Smith et al.[2000b]). Because the dust is such a strong absorber, itresults in the next most prominent feature in TES spectrarelative to CO2. Centered at �1075 cm�1 (�9 mm),aerosol dust produces a prominent V-shaped absorptionthat is accentuated by the presence of a CO2 hot band
roughly at the center of the trough [Hanel et al., 1972;Conrath et al., 1973]. The V-shape is relatively symmet-ric but becomes increasingly asymmetric when combinedwith a water-ice absorption. On the low wavenumber sideof the 667 cm�1 CO2 feature, atmospheric dust hasanother absorption centered at �470 cm�1 as shown bythe modeled dust spectrum in Figure 1. This spectrum isfrom the work of Bandfield et al. [2000b] but has beenmodified by dividing out water vapor and CO2 hot bandsusing the spectra shown. Such a modification is notrigorously correct, but gives a qualitative look at the dustspectral shape in the absence of major atmospheric gasabsorptions. The spectral region >1300 cm�1 was notincluded in the work of Bandfield et al. However, it hasbeen shown previously that atmospheric dust is relativelytransparent and spectrally featureless in this region [e.g.,Toon et al., 1977], which is demonstrated further insection 4.
2.3. Water-Ice Clouds
[11] The occurrence of water-ice clouds and hazes ishighly variable in space and time [e.g., Beish and Parker,1990; Bell et al., 1996; Pearl et al., 2001]. Water ice has adeep and relatively broad absorption centered at �825 cm�1
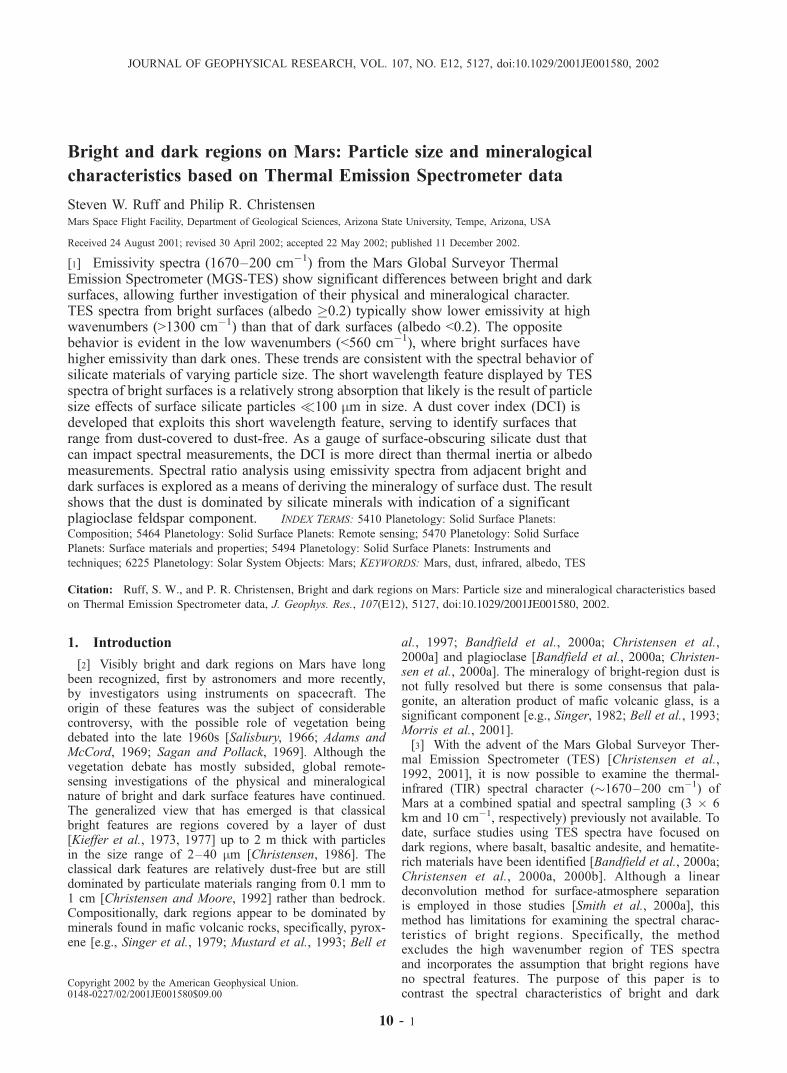
and a narrower absorption at �230 cm�1 [Curran et al.,1973] (Figure 1). Figure 2 shows a series of spectra from thesame geographic location in Arabia Terra from early sum-mer to late fall (Ls, 120�–253�) during which time water-iceclouds give way to atmospheric dust. Dramatic spectralchanges accompany this atmospheric transition, most nota-bly in the 800–1250 cm�1 range.
2.4. Water Vapor
[12] Figure 1 shows a water vapor spectrum modeledusing 10 precipitable microns of water and the same
Figure 2. Spectral changes that accompany the variation of water-ice cloud and aerosol dust opacityover a location in Arabia Terra. The solid line is from a cloudy period with low dust concentration and thedashed line is from a very dusty, effectively cloud-free period. OCK is the TES orbit indicator and ICK isthe incremental observation counter.
RUFF AND CHRISTENSEN: BRIGHT AND DARK REGIONS ON MARS 10 - 3

technique used to model CO2 described in section 2.1.Water-vapor concentration in the Martian atmosphere isvariable in space and time but is in the range of a few toseveral tens of precipitable microns [e.g., Jakosky andFarmer, 1982; Clancy et al., 1996]. The concentration ofMartian water vapor is never sufficient to produce deepabsorption features but numerous shallow, narrow features
exist in the spectral regions >1400 and <500 cm�1. Atwavenumbers >1400 the absorptions are due to the funda-mental bending mode vibration and coupled rotation-vibra-tion modes of the H2O molecule while those at lowwavenumbers (<500) are due to molecular rotations. Inboth cases, many individual absorptions are narrower thanthe 10 cm�1 (or even 5 cm�1) spectral sampling of the TES
Figure 3. Comparison of spectra from adjacent bright and dark surfaces. (a) A dark splotch on thebright floor of an unnamed crater in western Arabia at 11�N, 348�W showing albedo for a segment of aTES ground track from OCK 3461, ICK 1840–1860. (b) The average spectra from 8 dark pixels at A(ICK 1851, det. 1:3, 5, 6 and ICK 1852, det. 2, 3, and 6) and 12 bright pixels at B (ICK 1856–57, alldetectors) show clear differences that are attributable to variations of surface emissivity.
10 - 4 RUFF AND CHRISTENSEN: BRIGHT AND DARK REGIONS ON MARS

instrument. The end result is a sawtooth appearance in thewater-vapor regions of TES spectra (Figure 1).
3. Bright and Dark Region Spectral Differences
[13] TES spectra can yield useful information about theMartian surface even in the absence of surface-atmosphereseparation. A clear demonstration is provided by comparingbright and dark surfaces that are adjacent to one anotherusing spectra from the same orbit. The dark splotches on thebright floors of many craters in western Arabia Terra/OxiaPalus offer an ideal opportunity for examining bright/darkspectral differences at a very local scale. Figure 3a showsone such example where dark material is directly adjacent tobright material on the floor of an unnamed crater in westernArabia. Eight spectra were averaged from the dark surface(average albedo of �0.12) and 12 from the bright surface(average albedo of �0.26) just to the north; the result isshown in Figure 3b. Variations in the atmosphere areassumed to be minor given the close proximity of thesesurfaces both in lateral distance (�30 km apart) and inelevation (�200 m apart). Therefore, the most significantdifferences between the two spectra are due to surfaceemissivity variations. In this example, the dark-surfacespectrum has deeper features than the bright-surface spec-trum in the �1300–780 and �560–200 cm�1 ranges. Thischaracter is reversed for the spectral range >�1300 cm�1,where the bright-surface spectrum has deeper features.Sections 3.1–3.4 demonstrate that these characteristicspersist at a global scale and under a range of atmosphericconditions.
3.1. Regions of Interest
[14] Small portions of three bright regions (Arabia Terra,Tharsis Montes, and Elysium Planitia) and three darkregions (Syrtis Major Planum, Sinus Meridiani, and Acid-
alia Planitia) as shown in Figure 4 were selected for detailedspectral analysis. The TES instrument has viewed �90% ofthe planet from mapping orbit throughout the course of afull Martian year. Therefore observations exist for the sameor nearby regions (<10 km distant) under very differentatmospheric conditions. For this study, spectra from theselected regions of interest were chosen to maximize theextremes of atmospheric dust and water-ice clouds withthe intent of bracketing the possible range of atmosphericspectral variations (excluding dust storms). Additionalselection criteria included a search for the highest surfacetemperatures for a given region, to improve the signal-to-noise ratio (SNR), and dusty/cloudy orbits that spatiallyoverlapped each other as much as possible.[15] To further enhance spectral SNR, 20 ICKs (TES
incremental observation counter) of all six detectors wereaveraged for each region of interest (120 total spectra). Thecenter detector x axis data were used for all spectra to allowaverages to be calculated conveniently. Twenty ICKs inmapping orbit cover a ground swath of �120 km in latitudeand 9 km in longitude. This area is small enough to avoidany major spectral variations on the surface of the regions ofinterest (verified by inspection of each spectrum) but largeenough to produce a high SNR. Complete latitudinal over-lap of the dusty/cloudy orbit pair for each region wasavailable while longitudinal overlap of at least 1/3 of theorbit pair was possible.
3.2. Bright/Dark Differences: Dusty Atmosphere
[16] Figure 5a shows spectra of the six regions of interestviewed through a dusty atmosphere. The prominent, nearlysymmetrical V-shaped atmospheric dust absorption domi-nates the 800–1300 cm�1 range. Any differences betweenbright and dark surfaces from 800 to 1300 cm�1 areobscured by the variation in intensity of the atmosphericdust feature. This is not the case outside of this spectral
Figure 4. Location map of bright and dark regions of interest. TES-derived global lambert albedo isshown with letters indicating the following locations: A, Syrtis Major; B, Sinus Meridiani (hematite-richarea); C, Acidalia; D, Tharsis; E, Arabia; and F, Elysium.
RUFF AND CHRISTENSEN: BRIGHT AND DARK REGIONS ON MARS 10 - 5

Figure 5. Averaged spectra from six bright and dark regions of interest. Figure 5a shows spectra(identified using TES orbit counter and increment counter designations) obtained under very dustyatmospheric conditions while those in Figure 5b had diminished dust but significant water-ice cloudconditions during measurement (arrow indicates feature described in section 3.3). Figure 5c shows thespectra from Figures 5a and 5b combined to allow the direct comparison of emissivity for bothatmospheric conditions. These plots form the basis for comparison of the spectral characteristics ofMartian bright and dark regions.
10 - 6 RUFF AND CHRISTENSEN: BRIGHT AND DARK REGIONS ON MARS

range. At wavenumbers >1300 and <560, the bright anddark surfaces are spectrally separable. The bright-surfacespectra (red shades in Figure 5a) display higher emissivityat low wavenumbers than the dark-surface spectra (blueshades). This behavior is reversed at the high wavenumberend where the bright targets have lower emissivity. Alsonoteworthy is the observation that among the dark-surfacespectra, there is significant variation in emissivity in the<560 cm�1 range, an indication of varying surface miner-alogy. In the >1300 cm�1 range, dark-surface spectra showno significant variation. Among the bright-surface spectrathere is no significant variation in either the high or lowspectral range, an indication that these bright surfaces havesimilar composition and particle size.
3.3. Bright/Dark Differences: Cloudy Atmosphere
[17] In the presence of abundant water-ice clouds, thedepth of the �1075 cm�1 atmospheric dust feature typicallyis significantly reduced and the water-ice feature centered at�825 cm�1 is clearly evident (Figure 5b). Because of thereduced intensity of the atmospheric dust feature it ispossible to see that dark surfaces have lower emissivity thanbright surfaces, at least in the range from 1300 to �1000cm�1. From �1000 to 780 cm�1, dramatic changes inapparent emissivity occur as the concentration of water-iceaerosols varies in time (Figures 5a and 5b). Figure 6demonstrates that cloud features can also vary over smallspatial scales. Nevertheless, evidence of a spectral distinc-tion between bright and dark surfaces is present in the formof an upturn in emissivity centered at�825 cm�1 that createsa flattened local maximum in dark-surface spectra (arrow inFigure 5b). This is not the case with bright surfaces; a localminimum is observed whose low wavenumber side is lost inthe 667 cm�1 CO2 feature. These characteristics are alsoevident in Figure 6.[18] In the low wavenumber range (<560 cm�1) spectra
from bright and dark surfaces display a clear separation ofemissivity, but the combined effects of reduced dust con-centration and increased water-ice and water-vapor con-centration modifies the apparent emissivity from thatobserved in the dusty atmosphere case. Most significantis a downturn in emissivity in the lowest wavenumbersattributable to absorptions from both H2O components. Athigh wavenumbers (>1300 cm�1), water-ice absorptionreduces the apparent emissivity of both bright- and dark-surface spectra, but the emissivity separation between thetwo groups remains.
3.4. Bright/Dark and Dusty/Cloudy Direct Comparison
[19] Because bright and dark surfaces have spectrallydistinct characteristics, it should be possible to map thesedifferences on a global scale using the full TES data set.However, first it must be shown that the emissivity charac-teristics outlined above persist in an absolute sense regard-less of atmospheric conditions. Figure 5c combines thespectra from Figures 5a and 5b. In this way the emissivitycharacteristics of bright and dark surfaces can be examinedunder the full range of atmospheric conditions (excludingdust storms). It is evident from this figure that the high andlow wavenumber separation in the apparent emissivity ofbright and dark surfaces is retained in the presence ofatmospheric variations for portions of the TES spectral
range. In particular, the ranges from 1300 to 1400 cm�1
and from �250 to 400 cm�1 show good separation. Thecauses of these spectral differences is investigated in thefollowing section.
4. Origins of Bright and Dark Region EmissivityCharacteristics
[20] The IR spectral character of geologic materials is afunction of both composition and particle size. In an effortto understand the observed emissivity differences betweenbright and dark regions and to investigate the compositionof bright dust, it is necessary to examine the relationshipbetween emissivity and both particle size and composition.
4.1. Particle Size Effects
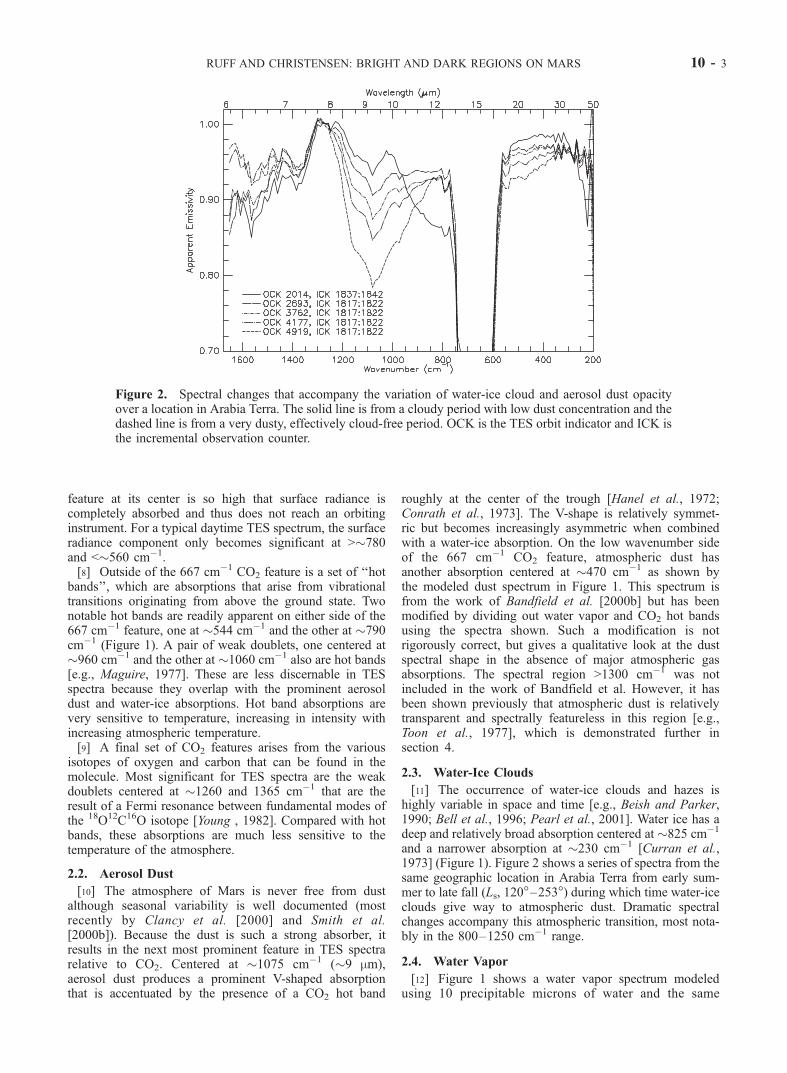
[21] The changes to thermal-IR spectra resulting fromvariations in particle size have long been recognized andmodeled [e.g., Lyon, 1965; Hunt and Vincent, 1968; Conel,1969; Emslie and Aronson, 1973; Salisbury and Wald,1992; Moersch and Christensen, 1995; Wald and Salisbury,1995; Ramsey and Christensen, 1998; Lane, 1999]. Fromsuch studies it has been established that spectral contrast(amplitude of features) decreases in particulate samplescompared with their solid form due to the increase inporosity and accompanying incoherent scattering of lightfrom multiple surface reflections. With decreasing particlesize, the diameter approaches a critical limit below whichnew spectral features arise. Wherever the absorption coef-ficient (k) of the material is very low and the index ofrefraction (n) is close to but greater than unity (a trans-parency region), light can interact with many more particlesto produce an absorption feature. Both single minerals andmineral mixtures display surface scattering and volumescattering or transparency features (Figure 7). The size atwhich particles begin to display transparency features varieswidely depending on composition and wavelength. Forexample, carbonates begin to show such features for par-ticles in the range of 500–710 mm [Lane and Christensen,1998] while silicates do not begin to show them untilparticles are less than �100 mm [e.g., Moersch and Chris-tensen, 1995].[22] The impact of particle size effects on thermal-IR
spectra measured from planetary surfaces has been a focusof concern for decades. The spectral contrast of fundamentalmode absorption features (reststrahlen bands) is reduced forsmall particles making these features more difficult todetect. However, features related to volume scattering havebeen recognized as potentially useful for remote sensing ofplanetary surfaces because of their prominence [Salisbury etal., 1987; Salisbury and Walter, 1989]. Transparency fea-tures (TF in Figure 7) commonly occur in the weaklyabsorbing, intraband regions between the strongly absorb-ing, fundamental mode absorptions [Vincent and Hunt,1968; Conel, 1969; Salisbury and Walter, 1989; Moerschand Christensen, 1995] but are not limited to these regions[Salisbury et al., 1987; Lane, 1999]. Salisbury and Walter[1989] demonstrated that a transparency feature in the 11–13 mm (�910–770 cm�1) spectral region of powderedigneous rocks (�74 mm) is related to composition. How-ever, Mustard and Hays [1997] observed changes in theposition and shape of transparency features with decreasing
RUFF AND CHRISTENSEN: BRIGHT AND DARK REGIONS ON MARS 10 - 7

particle size, which is also evident in the central trans-parency feature of the andesine (An48) in Figure 7a.Although these observations do not rule out the utility oftransparency features for compositional assessment, they doindicate the need for caution when interpreting them.[23] A prominent transparency feature is found at wave
numbers greater than the principal Christiansen feature (theemissivity maximum defined as the location in a spectrumwhere n is near unity and k is low (<0.1) [Conel, 1969]). Insome cases, narrow peaks are superimposed on this feature.These have been attributed to overtones or combinationtones of the fundamental mode vibrations at lower wave-numbers [Salisbury et al., 1987, 1991; Salisbury and
Walter, 1989]. Their visibility in the spectra of fine-partic-ulate materials has been explained as a combination ofsurface scattering and volume scattering effects [Salisburyet al., 1987]. While the value of these overtone andcombination tone features for remote sensing of particulateplanetary surfaces has been advocated, the broad trans-parency feature on which they are superimposed can be auseful indicator for the presence of fine particulates.
4.2. Evidence for Silicate-Related Particle Size Effectsin TES Spectra
[24] The evidence for particle size effects in TES spectrais most apparent when bright and dark regions are compared
Figure 6. Demonstration of the variability of water-ice cloud features (�825 and �230 cm�1) oversmall spatial scales for a dark and bright location. (a) A single TES ICK from Syrtis Major (centered on10.9�N, 289.0�W) showing cloud variability between the six detectors (OCK 1711, ICK 1846). (b) A setof spectra spanning 1.3� of latitude in Elysium Planitia (centered on 31.2�N, 216.0�W); each spectrum isa six-detector average from OCK 2073, ICK 2045, 2048, 2054, and 2058. Note the difference in shape ofthe �825 cm�1 cloud feature for a dark surface (Figure 5a) versus a bright surface (Figure 5b) that resultsfrom surface emissivity.
10 - 8 RUFF AND CHRISTENSEN: BRIGHT AND DARK REGIONS ON MARS
with each other and to laboratory spectra of coarse- andfine-particulate samples. Laboratory spectra from basalticmaterials are well-suited to such a comparison. The work ofChristensen et al. [2000a] and Bandfield et al. [2000a]demonstrates that the spectrum of a Deccan Traps floodbasalt sample (primarily plagioclase and clinopyroxene[Hamilton and Christensen, 2000]) in coarse-particulateform matches well with atmospherically corrected spectraof some dark regions (e.g., Cimmeria Terra and SyrtisMajor). The Deccan spectrum thus serves as an exampleof the emissivity behavior of coarse-particulate materialfrom some dark regions on Mars. Without a generally
recognized mineralogy for bright dust, it is useful to startwith the assumption that the dust is dominated by silicateminerals. The Viking lander and Pathfinder measurementsof soil chemistry clearly support this assumption [e.g.,Morris et al., 2000]. It has been shown recently that thesoil precursor material may be basaltic in composition[McSween and Keil, 2000; Morris et al., 2000]. Thereforea spectrum of the Deccan sample in fine-particulate formserves as a starting point for examining bright-regionspectra. For the sake of the current analysis, little is changedif clays or palagonites are included. Figure 8 shows thespectra of Arabia and Syrtis Major from Figure 5a as
Figure 7. Example of spectral particle size effects for a single mineral and a mineral mixture. Theandesine series (a) is modified from the work of Ramsey and Christensen [1998]. The spectral range waslimited to a low of 400 cm�1 in that work. In Figure 7b, a series of spectra from a Deccan Traps floodbasalt sample in solid to powdered form is shown, courtesy of V. E. Hamilton. All spectra are shown with2 cm�1 sampling.
RUFF AND CHRISTENSEN: BRIGHT AND DARK REGIONS ON MARS 10 - 9

representatives of typical bright and dark regions, respec-tively. Also shown are the spectra of Deccan basalt in coarse(710–1000 mm) and fine-particulate form (<63 mm). Fromthis figure and further analysis of Figure 5, it is possible tosee the evidence of particle size effects in TES spectra.[25] At low wavenumbers (<560 cm�1), bright-region
TES spectra have higher emissivity than dark-region spectra(Figure 8 and Figures 5a and 5b). This characteristic isconsistent with the reduced spectral contrast (higher emis-sivity) observed for the fine-particulate Deccan basalt rela-tive to the coarse form. Atmospheric dust dominates themiddle range (1300–780 cm�1) of TES spectra making itdifficult to assess the difference in surface emissivity ofspectra from different orbits. However, there is clear indi-cation in the spectra of adjacent bright and dark surfacesfrom the same orbit that bright surfaces typically havehigher emissivity than dark surfaces (e.g., Figure 3). Thisbehavior is also evident for TES spectra from cloudyatmospheric periods when dust is minimized (Figure 5b).The higher emissivity shown by bright regions in the middlespectral range is consistent with the reduced spectral con-trast observed for the fine-particulate Deccan basalt.[26] In the >1300 cm�1 range, atmospheric absorptions
due to water vapor and CO2 account for most of the detailedspectral structure. However, bright regions have significantlylower overall emissivity in this range compared with darkregions, suggestive of the high wavenumber transparencyfeature observed in the fine-particulate Deccan basalt.[27] Although the spectral differences between bright and
dark regions are consistent with those shown by Deccanbasalt in fine and coarse form, all silicates produce spectralparticle size effects that are similar to the observed bright/dark region differences. Figure 9 shows laboratory emissiv-ity spectra from the ASU spectral library [Christensen et al.,2000c] and hemispherical reflectance spectra from the JPLASTER library converted to emissivity for three classes ofminerals that are possible components of Martian dust.
When compared with carbonates and sulfates, the particlesize effects of silicates (Figures 9a–9c) are most consistentwith the TES observations. Fine-particulate carbonatesproduce a dramatic set of transparency features in the range<1300 cm�1 compared with their coarse form (Figures 9d–9f ) that does not match the observed bright/dark spectraldifferences. Fine-particulate sulfates (Figures 9g–9i) showa strong, high wavenumber transparency feature like sili-cates but their behavior in the range <�1300 cm–1 is morevariable
4.3. Compositional Details
[28] Sections 4.3.1 and 4.3.2 describe two approaches toextract details from the spectra of bright regions that canserve to refine the mineralogy of surface dust.4.3.1. High Wavenumber Transparency Feature[29] Laboratory spectra of fine-particulate silicate miner-
als and rocks display variations in the high wavenumbertransparency feature (>�1100 cm�1) that are a function ofcomposition [Salisbury et al., 1987, 1991; Salisbury andWalter, 1989]. As an example of these variations, Figure 10shows spectra of three candidate materials for Martiansurface dust. Because the high wavenumber transparencyfeature typically is the most intense absorption in thespectrum of fine-particulate silicates and contains composi-tion-related details, it is potentially useful for analyzing themineralogy of Martian surface dust.[30] TES spectra in the range >1300 cm�1 contain
absorptions due to atmospheric water vapor and CO2
(Figure 2) in addition to the apparent transparency featuredescribed previously. Because water vapor is a trace gas inthe Martian atmosphere, it produces only minor absorp-tions that can be modeled readily. The CO2 absorptioncentered at �1365 cm�1 is due to a stretching mode of theisotopic molecule 16O12C18O. This absorption is not a hotband so its intensity is independent of the absolute temper-ature of the atmosphere, making it easier to model. The
Figure 8. A comparison of laboratory spectra from coarse- and fine-particulate Deccan Traps basaltwith TES spectra of a bright and dark region on Mars. Evidence for particle size effects in the spectra ofMartian bright regions is suggested from this comparison.
10 - 10 RUFF AND CHRISTENSEN: BRIGHT AND DARK REGIONS ON MARS

spectral contribution of atmospheric dust in the range>1300 cm�1 has not yet been modeled for TES spectra.However, a qualitative assessment is possible by examin-ing this spectral region under varying dust-load conditions(Figure 11). It is apparent from Figure 11 that atmosphericdust does not produce significant absorptions at highwavenumbers. Water-ice clouds have an effect in thisspectral region, especially when combined with increasedwater vapor as evidenced by the differences between thedusty and cloudy spectra in Figure 5c. However, manyTES spectra are available that are effectively free of cloudabsorptions.[31] The spectra of Arabia and Syrtis from Figure 5a
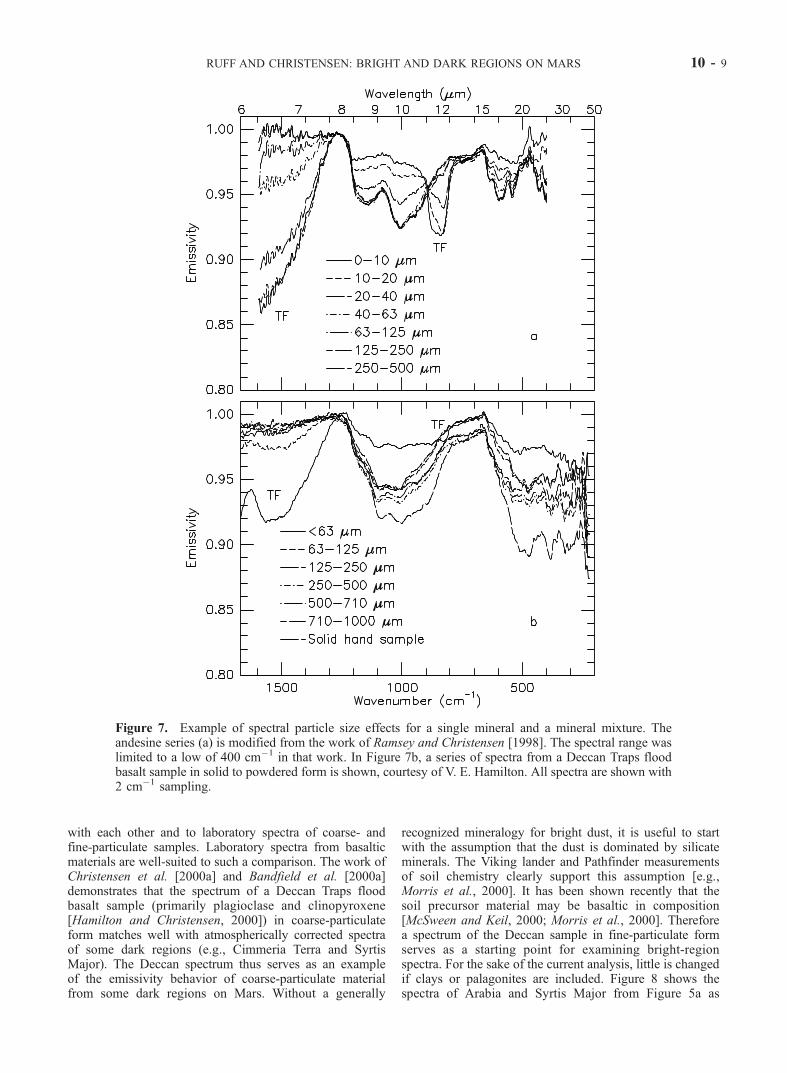
have minimal water-ice cloud absorptions and are repre-sentative of the high wavenumber spectral behavior ofbright and dark regions. Figure 12 shows these spectraalong with a modeled spectrum (J. Pearl and G. Bjoraker,personal communication) of combined water vapor and
CO2 produced using the following generic conditions: 10precipitable microns (pr mm) of water vapor, an atmos-pheric temperature profile starting at 260 K at the surfaceand following a standard lapse rate, and a surface temper-ature of 300 K. Much of the detailed structure of the TESspectra in the range >1300 cm�1 is matched by themodeled spectrum, especially for the Syrtis spectrum.Dividing the modeled atmosphere spectrum from the Mar-tian spectra produces a partial atmospheric correction,allowing a more accurate look at surface emissivity in thehigh wavenumber range (Figure 12b). Although manyremaining sharp features indicate an incomplete removalof water vapor, it is significant that the well-resolvedspectral feature centered at �1365 cm�1 in the bright-region spectrum in Figure 12a is nearly absent. This resultcasts doubt on the sulfate interpretation for this feature byClark and Hoefen [2000]. An analysis by McAfee andKirkland [2000] described the potential for just such a
Figure 9. Emissivity spectra of particle size suites for three classes of minerals that may be present inMartian surface dust. The top row contains spectra from the ASU spectral library in the size range of710–1000 mm for the silicates and sulfates and hand sample specimens for the carbonates. The middleand bottom rows contain spectra reproduced from the ASTER Spectral Library through the courtesy ofthe Jet Propulsion Laboratory, California Institute of Technology, Pasadena, California. Copyright #1999, California Institute of Technology. ALL RIGHTS RESERVED. The ASTER library spectra weremeasured in hemispherical reflection mode and converted to emissivity using E = 1 � R. These spectrado not include the range <�700 cm�1. The middle row covers the particle size range of 125–500 mm andthe bottom row is 0–45 mm. In all cases attention was given to matching samples from the ASU librarywith those from the ASTER library based on chemical and spectral similarities. The ASU library lackedthe carbonate strontianite and the sulfates alunite, glauberite, and jarosite.
RUFF AND CHRISTENSEN: BRIGHT AND DARK REGIONS ON MARS 10 - 11

misinterpretation. Further refinement of the mineralogicalinformation present in the high wavenumber transparencyfeature will be possible using more accurate atmosphericmodeling than presented here and a library of spectra fromfine-particulate materials.4.3.2. Spectral Ratios[32] A ratio of spectra from two different locations can
serve to cancel atmospheric contributions and reveal surfaceemissivity [e.g., Pollack et al., 1990; Moersch et al., 1997;
Hoefen et al., 2000] but it requires certain assumptions andapplies only to restricted conditions. Any ratio spectrumrepresents a combination of spectral features of the twosurfaces from which the spectra were measured. If thespectral character of one of the two surfaces is reasonablywell constrained, the spectral features of the other surfacecan be investigated. To fully evaluate the caveats andassumptions inherent in spectral ratio analysis, the equationpresented by Smith et al. [2000b] that describes observed
Figure 10. Candidate materials for Martian surface dust. These spectra were measured from samplesground and sieved to a size <63 mm; they are shown at the TES spectral resolution of 10 cm�1. Unlike thecoarse particulate form of these materials, the fine particulates display spectral information at highwavenumbers (>1200 cm�1) that is related to composition. Basalt and andesite spectra are courtesy of V.E. Hamilton. For a description of JSC Mars-1, see work by Allen et al. [1998].
Figure 11. A qualitative assessment of the contribution of atmospheric dust to TES spectra in the range>1300 cm�1. Six different spectra (averages using ICK 1835:1854 from the OCK shown) from acommon location in Syrtis Major show varying amounts of atmospheric dust. Little change is evident athigh wavenumbers (>1300 cm�1) in spite of the significant changes over the rest of the spectral range.This suggests that the contribution of atmospheric dust at high wavenumbers is small.
10 - 12 RUFF AND CHRISTENSEN: BRIGHT AND DARK REGIONS ON MARS
radiance as a function of wavenumber Iobs(~v) measured fromorbit is reproduced here.
Iobs ~vð Þ ¼ e ~vð ÞB Tsurf ;~v½ �e�t0 ~vð Þ=m þZ t0
0
B T tð Þ;~v½ �e�t ~vð Þ=mdt ð1Þ
The quantity e(~v) is surface emissivity as a function ofwavenumber, B[Tsurf, ~v] is the Planck function at surfacetemperature Tsurf(K), t0(~v) is the normal column-integratedaerosol opacity, m is the cosine of the emission angle, T(t) isthe atmospheric temperature profile, and the integral iscalculated over the range of t = 0 at the spacecraft to t0at the surface. The first term of the equation (1) describesthe attenuation by the atmosphere of radiation emitted byThe surface. The second term represents the upwelling
emission of the atmosphere. Incident solar radiationreflected back to the spacecraft and scattering by atmos-pheric aerosols are neglected in this equation because oftheir small contribution.[33] In a ratio of two emissivity spectra, the Planck
quantity of the surface component already is removed, thuseliminating one of the variables in equation (1). For con-ditions where atmospheric opacity is low (�0.25) [Smith etal., 2000b] and surface temperature is greater than atmos-pheric temperature, upwelling emission of the atmosphere isassumed to be negligible. These conditions are typical fordaytime TES measurements away from dust storm activity.In this case, a ratio will cancel the spectral contribution of theatmosphere assuming the conditions of the atmosphere arethe same for the two locations from which the spectra aremeasured. This situation is best ensured using locations thatare close to each other both in lateral distance and elevationand only applies to spectra from the same orbit and with thesame emission angle. Because water-ice clouds are variableover small spatial scales, spectra measured during cloudyconditions should not be used in a ratio intended for surfaceanalysis. An example and interpretation of a spectral ratiowith implications for dust mineralogy is given in section 6.
5. A Dust Cover Index Based on Particle SizeEffects
5.1. Index Definition
[34] The apparent particle size effects observed in TESspectra of bright regions serve as an indicator for thepresence of fine particles or dust on the surface. Beginningwith the assumption that bright-region dust is dominated bysilicates, the spectral range best suited to identifying particlesize effects and hence the presence of dust is >�1300 cm�1.This is a range where k is very low and n is close to unity,producing a broad, deep transparency feature in fine-partic-ulate silicates (Figure 9c). For TES spectra, Figure 5c showsthat the 1350–1400 cm�1 range retains a significant emis-sivity separation between bright and dark regions regardlessof atmospheric conditions. Although an isotopic CO2 gasabsorption occurs here, its intensity is relatively invariant aslong as surface temperature is greater than that of theatmosphere, a condition typical for daytime TES observa-tions away from dust storms. This is shown in Figure 13where a series of synthetic Martian atmospheric spectra forCO2 and water vapor have been generated for varioustemperature conditions. For the cases where the surface iswarmer than the atmosphere, the maximum variation inemissivity of the CO2 absorption centered at 1367 cm�1 is0.005. In contrast, the minimum delta emissivity betweenthe bright and dark region spectra of Figure 5c is 0.018 atthis wavenumber. Therefore variations in the depth of theCO2 feature cannot account for the difference in emissivityof these bright and dark region spectra. Instead, the varia-tion must be attributable to surface emissivity. For silicatematerials, variation in particle size is the most likelycontributor to the variation in emissivity in the spectralrange >�1300 cm�1. Absorptions due to atmospheric watervapor are not significant at wavenumbers <�1400. Wetherefore define a dust cover index (DCI) to be equal tothe average emissivity value from 1350 to 1400 cm�1. Thisspectral region is least affected by atmospheric components
Figure 12. Analysis of the contribution of atmosphericwater vapor and CO2 to the spectral character at the highwavenumber end of TES spectra. In Figure 11a, a partialspectrum of H2O and CO2 modeled from generic atmo-spheric conditions (see text) is shown in comparison toaveraged spectra from a dark region (Syrtis Major) and abright region (Arabia). By dividing out the atmospherespectrum, it is possible to see the residual spectral characterof the surface (Figure 11b). Bright regions typically showgreater spectral contrast at high wavenumbers than darkregions.
RUFF AND CHRISTENSEN: BRIGHT AND DARK REGIONS ON MARS 10 - 13

yet is sensitive to the spectral particle size effects ofsilicates. A statistical analysis of this index relative to theglobal data set is given in the next section.
5.2. Global Dust Cover Map
[35] A global map of the DCI is presented in Figure 14.This map was produced using TES mapping-orbit, nadir-pointing, daytime data constrained using the followingquality fields: QUALITY:MAJOR_PHASE_INVERSION0 0, QUALITY:ALGOR_RISK 0 0, QUALITY:HGA_MO-TION 1 1, and QUALITY:PNL_MOTION 1 1. In order tomaximize the SNR, the data used for the map span a rangeof Ls that includes a summer season in both hemispheres(103.6�–287.7�) and incorporate only spectra with bright-ness temperatures �260 K. The temperature constraint hadthe effect of excluding the highest latitudes where surfacetemperatures did not meet the 260 K limit. The data werebinned at eight pixels per degree and any gaps were filledusing a linear interpolation between neighboring binsweighted by distance.[36] The map shows a remarkable spatial coherence that
clearly is related to Martian albedo features at many scales.A scatter plot of albedo and DCI values (Figure 15) has alinear correlation coefficient of �0.85, quantifying theextent of the correlation evident from the map. Also,apparent from the map is the spatial coherence of inter-mediate index values where concentric patterns of colorappear in many places. No obvious artifacts due to atmos-pheric effects are evident. Although water-ice clouds areknown to form in an equatorial belt during part of the year
[Pearl et al., 2001], there is no evidence for them in theglobal map. It is likely that binning of pixels from differentorbits representing various atmospheric conditions hasaveraged out the cloud effect.[37] Using maps of TES albedo and thermal inertia data
binned at the same resolution (Figure 16), it is possible toquantify the extent to which DCI values relate to thepresence or absence of surface dust. Thermal inertia datacan be used to identify surfaces that are completelycovered by dust. It is widely accepted that the lowestthermal inertia regions on the planet must be mantled withdust at least a few centimeters thick. New photogeologicalevidence for this view has been provided by the observa-tion of dust avalanche scars in bright, low thermal inertiaregions [Sullivan et al., 2001]. Based on the laboratorystudies of Presley and Christensen [1997], surfaces with athermal inertia value of 100 Jm�2s1/2K (hereafter abbre-viated IU for inertia units) have particles with diameters of6 mm or less. Therefore it can be expected that regions onMars with a thermal inertia value of 100 IU or less will becovered by fine particulates that display spectral particlesize effects. Dust-free surfaces are best identified by verylow albedo values. Thermal inertia data are not well-suitedto this task because, except for the extremely high valuesassociated with bedrock, intermediate values have a non-unique interpretation and may result from mixtures of dustand coarse particles. Low albedo values however, likelyare only possible in the absence of any significant dustaccumulation. Low albedo regions like Syrtis Major havebeen observed to brighten following dust storms and then
Figure 13. Variations in band depth of atmospheric water vapor and CO2 with changes in surface andatmospheric temperatures. These spectra were modeled using water vapor at a mixing ratio of 137 ppmup to the condensation level, surface pressure of 6.1 mbars, and surface temperatures as shown.Atmospheric temperatures shown indicate the temperature at the 6.1 mbar level with a lapse rate of �3 Kkm�1 up to 30 km. The CO2 isotope band centered at �1365 cm�1 (vertical line) is in the region chosenfor the DCI. However, its depth does not change significantly when the surface is warmer than theatmosphere (bottom three spectra), which is typical for afternoon, nondust-storm conditions on Mars.Therefore any significant variations in emissivity in this spectral location likely are due to surfaceemissivity.
10 - 14 RUFF AND CHRISTENSEN: BRIGHT AND DARK REGIONS ON MARS

darken again over time indicating a process that is activelyremoving dust particles [Christensen, 1988]. Much ofSyrtis and Acidalia as well, have albedo values �0.10as measured by TES. This range of low albedo valuesserves as a proxy for dust-free or minimally dust-coveredsurfaces.[38] Two histograms of the DCI are shown in Figure 17
that were compiled from the global data set for regions onthe planet where thermal inertia is �100 IU and albedo is�0.10 representing dust-covered and dust-free surfaces,respectively. The average DCI value for dust-coveredsurfaces is 0.931 with a standard deviation of 0.009.Dust-free surfaces have an average value of 0.969 with astandard deviation of 0.007. The two histograms are wellseparated out to 2s values (0.949 for dust-covered versus0.955 for dust free), demonstrating the unique spectralcharacter of the two Martian surface types in the range ofthe DCI.
6. Discussion
6.1. Interpretation of DCI Values
[39] The histogram included with the global DCI map(Figure 14) shows a bimodal distribution of the DCI values.Peaks at �0.935 and �0.97 correspond closely to the valuesindicative of dust-covered and dust-free surfaces, respec-tively, as described in section 5. The occurrence of a rangeof intermediate DCI values that appear spatially transitional
on the global map suggests that they may represent surfacesthat are only partially obscured by dust. An alternativeexplanation is that intermediate DCI values represent indu-rated surfaces. In this view, fine particles are cemented toproduce a crusted surface [e.g., Jakosky and Christensen,1986]. Although the thermal IR spectral behavior of suchmaterial is not known, it is likely that a population of loose
Figure 14. Map of the global DCI developed in this work. The average emissivity value in the 1350–1400 cm�1 range is shown, binned at eight pixels per degree with gaps filled by interpolation. The indexis sensitive to the occurrence of silicate spectral particle size effects and thus serves as an indicator for thepresence of silicate dust on the surface. Orange, red, and white colors indicate areas that likely are dustcovered while blue and magenta areas likely are dust-free. The color scale bar is a histogram of the indexvalues.
Figure 15. Scatter plot showing the relationship of the DCI(1350–1400 cm�1 average emissivity) to lambert albedo(0.3–3.0 mm). The linear correlation coefficient is �0.85.
RUFF AND CHRISTENSEN: BRIGHT AND DARK REGIONS ON MARS 10 - 15

fines would still be present and could contribute measurableparticle size effects to the spectrum. These fines could lowerthe 1350–1400 cm�1 emissivity average enough to producean intermediate DCI value.[40] Classification threshold values for dust-covered and
dust-free surfaces can be established using the histograms ofFigure 17. The lack of overlap of the 2s values observed forthe two histograms suggests possible thresholds at 0.949 fordust-covered and 0.955 for dust-free surfaces. However,these values provide only a narrow intermediate range forthe likely cases where surfaces display a range of dust
cover. Therefore the more conservative 1s values of 0.940and 0.962 will be used to represent dust-covered and dust-free surfaces, respectively, and those values that are inter-mediate probably represent surfaces that are partially dustcovered.
6.2. Applications of the DCI
[41] Albedo, thermal inertia, and the DCI all can be usedto characterize the uppermost layer of the Martian surface.Albedo and thermal inertia measurements have skin-depthson the order of a few microns and a few to several
Figure 16. Comparison of the DCI with lambert albedo and thermal inertia. The color scale for the DCImap (a) and albedo (b) has been designed to emphasize the correlation between the two quantities. Thethermal inertia values (Figure 16c) are in units of Jm�2s�1/2K�1. Each quantity is sensitive to a differentskin-depth, supplying complementary but not always the same information concerning the uppermostsurface layer of Mars.
10 - 16 RUFF AND CHRISTENSEN: BRIGHT AND DARK REGIONS ON MARS

centimeters, respectively, while the DCI is sensitive toaccumulations whose thickness is on the order of thepenetration depth of thermal-IR wavelengths, which is afew tens of microns. Figure 16 combines maps of DCI,albedo, and thermal inertia values to facilitate comparisonsof the three data sets. The color scheme used to produce theDCI map (Figure 16a) was chosen to mimic that of albedo(Figure 16b) in order to enhance intercomparison of the twoparameters. The three maps are grossly similar, especiallythe DCI and albedo maps. However, there are places wherethe albedo and thermal inertia maps are more comparable toeach other than to the DCI map. For example, the shape ofthe highest albedo region in Arabia (orange to red colors inFigure 16b) is well matched by the lowest thermal inertiavalues in Arabia (blue to magenta colors in Figure 16c). Asimilar spatial pattern for the DCI is not present, especiallyin northeastern Arabia (Figure 16a). In fact, DCI values donot vary significantly from northeastern Arabia, across thetop of Syrtis, and into western Utopia Planitia while albedoand thermal inertia values do vary. One interpretation forthis observation is that there exists a mantle of dust in theregion that is thick enough and continuous enough toproduce strong spectral particle size effects but withoutfully obscuring, in a thermal inertia sense, the underlyingmaterials. Such a layer could be on the order of a severaltens of microns to a few millimeters thick, a thickness lessthan the skin-depth of thermal inertia measurements butthick enough to produce the observed spectral behavior[Crisp and Bartholomew, 1992; Johnson et al., 2002]. Thesubtle change in albedo across the region may be due to atransition from a thick mantle of dust in central Arabia to amuch thinner but still continuous layer in western Utopia.Much of eastern Elysium displays a similar set of albedo,thermal inertia, and DCI values possibly indicating similarsurface conditions.
[42] At a local scale, the DCI can be used to investigatethe surface character of the ‘‘White Rock’’ feature inPollack Crater (8�S, 25�E). Ruff et al. [2001] presentedthermal inertia and geomorphic evidence that White Rock isnot covered by a mantle of dust. The DCI value alsosupports this conclusion. Using the average spectrum ofWhite Rock material from that work, the DCI value is0.962, which is right at the threshold for dust-free surfaces.There are other similar intracrater deposits in westernArabia that can be examined in this way to establishwhether they represent relatively high albedo material thatis not simply a dust mantle.[43] The DCI also is useful for investigating the physical
character of dark surfaces. Although the general paradigm isthat low albedo regions have surfaces composed of rela-tively coarse, dust-free materials, some evidence has beenpresented that dark dust may also exist on Mars. Using Mars5 photopolarimetry data, Dollfus et al. [1993] suggested thatdark dust is present as a strongly bound coating on coarser,surface particulates in Mare Erythraeum south of VallesMarineris. The average DCI value for this region is 0.970which is inconsistent with the presence of loose dust.However, it is unclear whether the strongly adhering coatingof dust suggested by Dollfus et al. would still producespectral particle size effects, so some ambiguity remains.The particle size of the material forming dark wind streaksin western Arabia/Oxia Palus recently has been revisited byEdgett and Malin [2000] who suggested that they aredeposits of dark silt rather than sand. This suggestion canbe investigated using the DCI. Inspection of the DCI mapfrom this region (Figure 18) reveals that the streaks haveindex values that are too high (�0.96) to indicate asignificant abundance of particles <100 mm in size.Although neither of these analyses rules out the possibilityof a population of low albedo fines on the planet, no low
Figure 17. Histograms of the DCI for dust-covered and dust-free surfaces. Dust-covered surfaces wereidentified as locations on the planet that have a thermal inertia �100 Jm�2s1/2K. At a spatial resolution ofeight TES pixels per degree, 435,778 values were used in this histogram. Dust-free surfaces wereidentified as locations with an albedo �0.10. A total of 52,163 values were used for this histogram andthen normalized to match the height of the histogram for dust-covered surfaces. The DCI spectralparameter clearly distinguishes the two surface types.
RUFF AND CHRISTENSEN: BRIGHT AND DARK REGIONS ON MARS 10 - 17

Figure 18. Analysis of crater dark streaks in western Arabia/Oxia Palus. The upper frame displays theDCI values using the same color scale as in Figure 5. The lower frame is a mosaic of Viking Orbiterimages. Dark streaks show up in blue, indicating that they are not composed of fine-particulate silicates,i.e., they are dominated by particles >100 mm in size.
10 - 18 RUFF AND CHRISTENSEN: BRIGHT AND DARK REGIONS ON MARS

albedo surfaces have yet been found that display the spectraleffects of fine silicate particles.
6.3. Dust Mineralogy Based on Spectral Ratio Analysis
[44] Dark intracrater splotches on the floor of brightcraters are well-suited to the investigation of surface spec-tral character using a ratio, a strategy described by Ruff andChristensen [1999] and used by Johnson et al. [2002].Atmospheric variations are minimized due to the closeproximity, both in distance and elevation, of the brightand dark surfaces. In many cases these surfaces are largeenough that spectra from several TES pixels can be aver-aged together for improved SNR. The intracrater splotchpresented in Figure 3a is used as an example, with thespectra from Figure 3b used to produce a ratio of a dark tobright surface. The result is shown in Figure 19a. Aspectrum of coarse-particulate Deccan flood basalt, which
represents a good candidate spectrum for comparison, isincluded in this figure. The prominent V-shape of atmos-pheric dust is notably absent in the ratio spectrum as aremany of the sharp CO2 and water vapor features, anindication of the quality of the atmospheric cancellation.The ratio spectrum is broadly similar to the Deccan basaltspectrum but there are significant differences. Most obviousis the mismatch in the region >�1300 cm�1 where the ratiospectrum rises above unity. Because emissivity >1.0 is notphysically possible, it indicates a contribution from the
Figure 19. Spectral ratio analysis of bright and darksurfaces. (a) A ratio of the TES spectra from the darksplotch and bright floor of the crater shown in Figure 3. Alaboratory spectrum of Deccan basalt is shown forcomparison. (b) The same ratio of TES spectra from (a)compared with a ratio of laboratory spectra of coarse (500–1000 mm) and fine (<63 mm) particulate Deccan basalt. Thequality of the match to the TES spectral ratio is much betterthan with the coarse Deccan basalt by itself, suggesting thatthe bright-surface material has nonunit emissivity withspectral characteristics similar to fine Deccan basalt.
Figure 20. Comparison of the TES spectral ratio in Figure19 to the following laboratory ratio-spectra: (a) coarse(500–1000 mm) Deccan basalt divided by fine (<63 mm)JSC Mars-1 palagonite; (b) coarse Deccan basalt divided byfine (<63 mm) andesite; and (c) coarse Deccan basaltdivided by fine (<63 mm) harzburgite. None of these ratiosmatches as well as the coarse and fine Deccan basalt ratio ofFigure 19b. Only the plagioclase-rich andesite produces agood match to the peak at �825 cm�1 in the TES spectralratio, an indication that fine-particulate plagioclase may be acomponent of the bright-surface material on the crater floor(see Figure 21).
RUFF AND CHRISTENSEN: BRIGHT AND DARK REGIONS ON MARS 10 - 19

bright-surface spectrum in the denominator. A less obviousyet significant mismatch is the prominent peak centered at�825 cm�1 that likely is a feature of the bright-surfacespectrum, as shown below.[45] Because a ratio spectrum contains the contributions
from two different spectra, it is inappropriate to interpret itas a single spectrum. Instead, it can be compared to aspectrum that is itself a ratio of two spectra. If it is assumedthat the dark surface is composed of coarse-particulatebasaltic material like the Deccan basalt and the brightsurface is the fine-particulate equivalent, then a ratio ofthe spectra of these candidate materials can be comparedwith the dark/bright spectral ratio. The result, shown inFigure 19b, is a remarkably good match between thespectral ratio of laboratory basalt samples and the Martiandark/bright ratio. The U-shape between �1300 and 780cm�1 is well matched, including the prominent peak at�825 cm�1. For the range >1300 cm�1, the match is not asgood, possibly due to incomplete cancellation of atmos-pheric water vapor features, but the increase in emissivityabove unity is the correct trend for a ratio of coarse to fineparticle sizes. Spectral ratio analysis produces similar resultsfor many of the craters in western Arabia Terra that hostdark materials.[46] To test the uniqueness of the coarse and fine Deccan
basalt result, three different candidate spectra of fine-partic-ulate materials were substituted into the denominator of theratio in place of the fine-particulate Deccan basalt spectrum(Figure 20). Substituting the spectrum of JSC Mars-1palagonite [Allen et al., 1998] of Figure 10 does not fullyreproduce the broad, U-shape of the dark/bright ratio or thepeak at �825 cm�1, but matches better the magnitude of theemissivity in the region >1300 cm�1 (Figure 20a). A ratiousing the fine-particulate andesite spectrum [Wyatt et al.,2001] of Figure 10 in the denominator provides a goodmatch to the �825 cm�1 peak but a poor match of the
broad, U-shape (Figure 20b). Substituting into the denom-inator a spectrum of fine-particulate material with a verymafic composition (harzburgite) [Hamilton, 1998] producesa very poor match to the dark/bright ratio (Figure 20c). Onlythe andesite and Deccan basalt spectra produce a goodmatch to the peak at �825 cm�1 in the dark/bright ratiospectrum. It is in this location that fine-particulate plagio-clase minerals have a prominent transparency feature, asdemonstrated by the andesine (An48) spectra of Figure 7a.Both the andesite and Deccan basalt have a significantplagioclase component (53% [Wyatt et al., 2001] and 65%[Hamilton, 1998], respectively). The JSC Mars-1 palagoniteis assumed to have much less plagioclase based on consid-erations of its chemistry [Allen et al., 1998] and parentmaterial [Morris et al., 1993] and the harzburgite has only10% plagioclase [Hamilton, 1998]. The fine-particulateplagioclase transparency feature is evident in the spectrumof <63 mm Deccan basalt as shown in Figure 21. It is alsoapparent from this figure how the spectral ratio of coarse-and fine-particulate Deccan basalt produces a peak centeredat �825 cm�1.[47] Evidence of subtle spectral features in Martian
surface dust also is emerging in the work of Bandfieldand Smith [2001] where previously it was assumed thatsurface dust was spectrally featureless [Christensen et al.,2000a; Smith et al., 2000a]. A distinctive spectral featureat �825 cm�1 appears in the spectra of large brightregions as a result of using multiple emission angleobservations to improve the surface-atmosphere separation(J. Bandfield, personal communication). This new obser-vation thus supports evidence from dark/bright ratio spec-tra that there exists a feature at �825 cm�1 in brightsurface dust. Bandfield also has attributed this feature toplagioclase in fine-particulate form. In an analysis of lunarsoil spectra by Salisbury et al. [1997], a similar conclusionwas reached for the interpretation of a prominent trans-
Figure 21. Evidence of a plagioclase-related transparency feature in the spectrum of fine (<63 mm)Deccan basalt. The feature at �825 cm�1, absent in the coarse Deccan basalt, is likely due to fine-particulate andesine (An30–50). A feature at this location is evident in TES spectra from some Martianbright regions based on spectral ratio analysis (see Figure 19).
10 - 20 RUFF AND CHRISTENSEN: BRIGHT AND DARK REGIONS ON MARS

parency feature found in a similar location in many of thesamples.
7. Conclusions
[48] Direct comparison of thermal-IR spectra from brightand dark regions on Mars leads to the following conclusions.1. Spectral information attributable to surface emissivity
is apparent without performing a surface-atmosphereseparation.2. The following spectral differences are typical of the
behavior of the large, classical bright and dark regions onMars as well as some smaller scale examples: Brightregions show reduced spectral contrast (increased emissiv-ity) in the range <�1300 cm�1 and increased spectralcontrast (decreased emissivity) in the range >�1300 cm�1
when compared with dark regions.3. The spectral differences between bright and dark
regions can be attributed to variations in the particle size ofsurface silicate materials.4. The decrease in emissivity observed in the spectral
range >�1300 cm�1 for bright regions likely is due to atransparency feature found in silicate materials whoseparticle size is <100 mm. This apparent transparency featurecan be exploited to map the presence or absence of silicatedust on the Martian surface. The resulting dust cover index(DCI = 1350–1400 cm�1 average emissivity) serves as agauge of surface-obscuring dust that can impact spectralmeasurements and can be used to address questions aboutthe physical character of the surface independently ofthermal inertia and albedo.5. Initial results show no evidence for dark silicate dust
on Mars but do show that some bright regions (e.g., ‘‘WhiteRock’’) are relatively dust-free.6. Spectral ratio analysis, when carefully applied, can be
used as a means of surface-atmosphere separation to revealdetails of the spectral characteristics of surface materials.Ratios of spectra from bright and dark surfaces that are inclose proximity produce a spectral feature that can beinterpreted as a transparency feature found in fine-particulate plagioclase feldspar or perhaps other mineralswith similar crystallographic structure.
[49] Acknowledgments. The authors wish to thank John Pearl, MikeSmith, and Gordon Bjoraker for their contributions of modeled atmosphericspectra. We appreciate the constructive reviews of the initial manuscript byHugh Kieffer and Vicky Hamilton and those of Paul Lucey and JeffJohnson for the submitted manuscript. This paper benefited from theirinput. The Mars Global Surveyor Project Office and the NASA PlanetaryGeology and Geophysics Program provided support for this work.
ReferencesAdams, J. B., and T. B. McCord, Mars: Interpretation of spectral reflectivityof light and dark regions, J. Geophys. Res., 74, 4851–4856, 1969.
Allen, C. C., K. M. Jager, R. V. Morris, D. J. Lindstrom, M. M. Lindstrom,and J. P. Lockwood, Martian soil simulant available for scientific, educa-tional study, Eos. Trans. AGU, 79, 405–409, 1998.
Bandfield, J. L., and M. D. Smith, Multiple emission angle surface-atmo-sphere separations of MGS Thermal Emission Spectrometer data, in Lu-nar Planet. Sci. XXXII, abstract 1596 [CD-ROM], 2001.
Bandfield, J. L., V. E. Hamilton, and P. R. Christensen, A global view ofMartian volcanic compositions from MGS-TES, Science, 287, 1626–1630, 2000a.
Bandfield, J. L., P. R. Christensen, and M. D. Smith, Spectral data set factoranalysis and end-member recovery: Application to analysis of Martianatmospheric particulates, J. Geophys. Res., 105, 9573–9587, 2000b.
Beish, J. D., and D. C. Parker, Meteorological survey of Mars, 1969–1984,J. Geophys. Res., 95, 14,657–14,675, 1990.
Bell, J. F., III, R. V. Morris, and J. B. Adams, Thermally altered palagonitictephra: A spectral and process analog to the soils and dust of Mars,J. Geophys. Res., 98, 3373–3385, 1993.
Bell, J. F., III, W. M. Calvin, M. E. Ockert-Bell, D. Crisp, J. B. Pollack, andJ. Spencer, Detection and monitoring of H2O and CO2 ice clouds onMars, J. Geophys. Res., 101, 9227–9237, 1996.
Bell, J. F., III, M. J. Wolff, P. B. James, R. T. Clancy, S. W. Lee, and L. J.Martin, Mars surface mineralogy from Hubble Space Telescope imagingduring 1994–1995: Observations, calibration, and initial results, J. Geo-phys. Res., 102, 9109–9123, 1997.
Christensen, P. R., Regional dust deposits on Mars: Physical properties,age, and history, J. Geophys. Res., 91, 3533–3545, 1986.
Christensen, P. R., Global albedo variations on Mars: Implications foractive aeolian transport, deposition, and erosion, J. Geophys. Res., 93,7611–7624, 1988.
Christensen, P. R., and H. J. Moore, The Martian surface layer, in Mars,edited by H. H. Kieffer et al., pp. 686–729, Univ. of Ariz. Press, Tucson,1992.
Christensen, P. R., et al., Thermal Emission Spectrometer experiment: TheMars Observer Mission, J. Geophys. Res., 97, 7719–7734, 1992.
Christensen, P. R., J. L. Bandfield, M. D. Smith, V. E. Hamilton, and R. N.Clark, Identification of a basaltic component on the Martian surface fromThermal Emission Spectrometer data, J. Geophys. Res., 105, 9609–9621,2000a.
Christensen, P. R., et al., Detection of crystalline hematite mineralization onMars by the Thermal Emission Spectrometer: Evidence for near-surfacewater, J. Geophys. Res., 105, 9623–9642, 2000b.
Christensen, P. R., J. L. Bandfield, V. E. Hamilton, D. A. Howard, M. D.Lane, J. L. Piatek, S. W. Ruff, and W. L. Stefanov, A thermal emissionspectral library of rock forming minerals, J. Geophys. Res., 105, 9735–9739, 2000c.
Christensen, P. R., et al., Mars Global Surveyor Thermal Emission Spectro-meter experiment: Investigation description and surface science results,J. Geophys. Res., 106, 23,823–23,871, 2001.
Clancy, R. T., A. W. Grossman, M. J. Wolff, P. B. James, D. J. Rudy, Y. N.Billawala, B. J. Sandor, S. W. Lee, and D. O. Muhleman, Water vaporsaturation at low altitudes around Mars aphelion: A key to Mars climate?,Icarus, 122, 36–62, 1996.
Clancy, R. T., B. J. Sandor, M. J. Wolff, P. R. Christensen, M. D. Smith,J. C. Pearl, B. J. Conrath, and R. J. Wilson, An intercomparison ofground-based millimeter, MGS TES, and Viking atmospheric temperaturemeasurements: Seasonal and interannual variability of temperatures anddust loading in the global Mars atmosphere, J. Geophys. Res., 105,9553–9571, 2000.
Clark, R. N., and T. M. Hoefen, Spectral feature mapping with Mars GlobalSurveyor thermal emission spectra: Mineralogic implications, Bull. Am.Astro. Soc., 32, 1118, 2000.
Conel, J. E., Infrared emissivities of silicates: Experimental results and acloudy atmosphere model of spectral emission from condensed particu-late mediums, J. Geophys. Res., 74, 1614–1634, 1969.
Conrath, B., R. Curran, R. Hanel, V. Kunde, W. Maguire, J. Pearl, J.Pirraglia, and J. Walker, Atmospheric and surface properties of Marsobtained by infrared spectroscopy on Mariner 9, J. Geophys. Res., 78,4267–4278, 1973.
Crisp, D., Infrared radiative transfer in the dust-free Martian atmosphere,J. Geophys. Res., 95, 14,577–14,588, 1990.
Crisp, J., and M. J. Bartholomew, Mid-infrared spectroscopy of Pahala ashpalagonite and implications for remote sensing studies of Mars, J. Geo-phys. Res., 97, 14,691–14,699, 1992.
Curran, R. J., B. J. Conrath, R. A. Hanel, V. G. Kunde, and J. C. Pearl,Mars: Mariner 9 spectroscopic evidence for H2O ice clouds, Science, 182,381–383, 1973.
Dollfus, A., M. Deschamps, and J. R. Zimbelman, Soil texture and granu-lometry at the surface of Mars, J. Geophys. Res., 98, 3413–3429, 1993.
Edgett, K. S., and M. C. Malin, New views of Mars eolian activity, ma-terials, and surface properties: Three vignettes from the Mars GlobalSurveyor Mars Orbiter Camera, J. Geophys. Res., 105, 1623–1650,2000.
Emslie, A. G., and J. R. Aronson, Spectral reflectance and emittance ofparticulate materials, 1, Theory, Appl. Opt., 12, 2563–2572, 1973.
Goody, R. M., and Y. L. Yung, Atmospheric Radiation, 519 pp., OxfordUniv. Press, New York, 1989.
Hamilton, V. E., Thermal Infrared Emission Spectroscopy of the PyroxeneMineral Series and Pyroxene-bearing Lithologies, Ph.D. dissertation, Ar-izona State Univ., Arizona, 1998.
Hamilton, V. E., and P. R. Christensen, Determining the modal mineralogyof mafic and ultramafic igneous rocks using thermal emission spectro-scopy, J. Geophys. Res., 105, 9717–9733, 2000.
RUFF AND CHRISTENSEN: BRIGHT AND DARK REGIONS ON MARS 10 - 21
Hanel, R., et al., Investigation of the Martian environment by infraredspectroscopy on Mariner 9, Icarus, 17, 423–442, 1972.
Hoefen, T. M., R. N. Clark, J. C. Pearl, and M. D. Smith, Unique spectralfeatures in Mars Global Surveyor Thermal Emission Spectra: Implica-tions for surface mineralogy in Nili Fossae, Bull. Am. Astro. Soc., 32,1118, 2000.
Hunt, G. R., and R. K. Vincent, The behavior of spectral features in theinfrared emission from particulate surfaces of various grain sizes,J. Geophys. Res., 73, 6039–6046, 1968.
Jakosky, B. M., and P. R. Christensen, Global duricrust on Mars: Analysisof remote sensing data, J. Geophys. Res., 91, 3547–3560, 1986.
Jakosky, B. M., and C. B. Farmer, The seasonal and global behavior ofwater vapor in the Mars atmosphere: Complete global results of theViking atmospheric water detector experiment, J. Geophys. Res., 87,2999–3019, 1982.
Johnson, J. R., P. R. Christensen, and P. G. Lucey, Dust coatings on basalticrocks and implications for thermal infrared spectroscopy of Mars,J. Geophys. Res., 107(E6), 5035, doi:10.1029/2000JE001405, 2002.
Kieffer, H. H., J. S. C. Chase, E. Miner, G. Munch, and G. Neugebauer,Preliminary report on infrared radiometric measurements from Mariner 9spacecraft, J. Geophys. Res., 78, 4291–4312, 1973.
Kieffer, H. H., T. Z. Martin, A. R. Peterfreund, B. M. Jakosky, E. D. Miner,and F. D. Palluconi, Thermal and albedo mapping of Mars during theViking primary mission, J. Geophys. Res., 82, 4249–4292, 1977.
Kunde, V. G., and W. C. Maguire, Direct integration transmittance model, J.Quant. Spec. Rad. Trans., 14, 803–817, 1974.
Lane, M. D., Infrared optical constants of calcite and their relationship toparticle size effects in thermal emission spectra of granular calcite,J. Geophys. Res., 104, 14,099–14,108, 1999.
Lane, M. D., and P. R. Christensen, Thermal infrared emission spectroscopyof salt minerals predicted for Mars, Icarus, 135, 528–536, 1998.
Lyon, R. J. P., Analysis of rocks by spectral infrared emission (8–25microns), Econ. Geol., 60, 715–736, 1965.
Maguire, W. C., Martian isotopic ratios and upper limits for possible minorconstituents as derived from Mariner 9 infrared spectrometer data, Icarus,32, 85–97, 1977.
McAfee, J. M., and L. E. Kirkland, A model-independent correction ofMars thermal spectra near 7.8 mm for CO16O18 atmospheric absorption,in Lunar Planet. Sci. XXXI, abstract 1967 [CD-ROM], 2000.
McSween, H. Y., Jr., and K. Keil, Mixing relationships in the Martianregolith and the composition of globally homogeneous dust, Geochim.Cosmochim. Acta, 64, 2155–2166, 2000.
Moersch, J. E., and P. R. Christensen, Thermal emission from particulatesurfaces: A comparison of scattering models with measured spectra,J. Geophys. Res., 100, 7465–7477, 1995.
Moersch, J. E., T. Hayward, P. Nicholson, S. W. Squyres, J. V. Cleve, and P.R. Christensen, Identification of a 10 mm silicate absorption feature in theAcidalia region of Mars, Icarus, 126, 183–196, 1997.
Morris, R. V., D. C. Golden, J. F. Bell III, H. V. J. Lauer, and J. B. Adams,Pigmenting agents in Martian soils: Inferences from spectral, Mossbauer,and magnetic properties of nanophase and other iron oxides in Hawaiianpalagonitic soil PN-9, Geochim. Cosmochim. Acta, 57, 4597–4609,1993.
Morris, R. V., et al., Mineralogy, composition, and alteration of Mars Path-finder rocks and soils: Evidence from multispectural, elemental, andmagnetic data on terrestrial analogue, SNC meteorite, and pathfindersamples, J. Geophys. Res., 105, 1757–1817, 2000.
Morris, R. V., D. C. Golden, D. W. Ming, T. D. Shelfer, L. C. Jorgensen,and J. F. Bell III, Phyllosilicate-poor palagonitic dust from Mauna KeaVolcano (Hawaii): A mineralogical analogue for magnetic Martian dust?,J. Geophys. Res., 106, 5057–5083, 2001.
Mustard, J. F., and J. E. Hays, Effects of hyperfine particles on reflectancespectra from 0.3 to 25 mm, Icarus, 145–163, 1997.
Mustard, J. F., S. Erard, J.-P. Bibring, J. W. Head, S. Hurtrez, Y. Langevin,C. M. Pieters, and C. J. Sotin, The surface of Syrtis Major: Compositionof the volcanic substrate and mixing with altered dust and soil, J. Geo-phys. Res., 98, 3387–3400, 1993.
Pearl, J. C., M. D. Smith, B. J. Conrath, J. L. Bandfield, and P. R. Chris-tensen, Observations of Martian ice clouds by the Mars Global SurveyorThermal Emission Spectrometer: The first Martian year, J. Geophys. Res.,106, 12,325–12,338, 2001.
Pollack, J. B., et al., Thermal emission spectra of Mars (5.4–10.5 mm):Evidence for sulfates, carbonates, and hydrates, J. Geophys. Res., 95,14,595–14,627, 1990.
Presley, M. A., and P. R. Christensen, Thermal conductivity measurementsof particulate materials, 2, Results, J. Geophys. Res., 102, 6566–6651,1997.
Ramsey, M. S., and P. R. Christensen, Mineral abundance determination:Quantitative deconvolution of thermal emission spectra, J. Geophys. Res.,103, 577–596, 1998.
Rothman, L. S., R. L. Hawkins, R. B. Watson, and R. R. Gamache, Energylevels, intensities, and linewidths of atmospheric carbon dioxide bands, J.Quant. Spec. Rad. Trans., 48, 537–566, 1992.
Ruff, S. W., and P. R. Christensen, Thermal-infrared spectral characteristicsof Martian albedo features: Clues to composition, in The Fifth Interna-tional Conference on Mars, abstract 6230 [CD-ROM], 1999.
Ruff, S. W., et al., Mars’ ‘‘White Rock’’ lacks evidence of an aqueousorigin: Results from Mars Global Surveyor, J. Geophys. Res., 106,23,921–23,927, 2001.
Sagan, C., and J. B. Pollack, Windblown dust on Mars, Nature, 222, 791–794, 1969.
Salisbury, J. W., The light and dark areas of Mars, Icarus, 5, 291–298,1966.
Salisbury, J. W., and A. Wald, The role of volume scattering in reducingspectral contrast of reststrahlen bands in spectra of powdered minerals,Icarus, 96, 121–128, 1992.
Salisbury, J. W., and L. S. Walter, Thermal infrared (2.5–13.5 mm) spectro-scopic remote sensing of igneous rock types on particulate planetarysurfaces, J. Geophys. Res., 94, 9192–9202, 1989.
Salisbury, J. W., B. Hapke, and J. W. Eastes, Usefulness of weak bands inmidinfrared remote sensing of particulate planetary surfaces, J. Geophys.Res., 92, 702–710, 1987.
Salisbury, J. W., D. M. D’Aria, and E. Jarosewich, Mid-infrared (2.5–13.5um) reflectance spectra of powdered stony meteorites, Icarus, 92, 280–297, 1991.
Salisbury, J. W., A. Basu, and E. M. Fischer, Thermal infrared spectra oflunar soils, Icarus, 130, 125–139, 1997.
Singer, R. B., Spectral evidence for the mineralogy of high-albedo soils anddust on Mars, J. Geophys. Res., 87, 10,159–10,168, 1982.
Singer, R. B., T. B. McCord, R. N. Clark, J. B. Adams, and R. L. Huguenin,Mars surface composition from reflectance spectroscopy: A summary,J. Geophys. Res., 84, 8415–8426, 1979.
Smith, M. D., J. L. Bandfield, and P. R. Christensen, Separation of atmo-spheric and surface spectral features in Mars Global Surveyor ThermalEmission Spectrometer (TES) spectra, J. Geophys. Res., 105, 9589–9607, 2000a.
Smith, M. D., J. C. Pearl, B. J. Conrath, and P. R. Christensen, Mars GlobalSurveyor Thermal Emission Spectrometer (TES) observations of dustopacity during aerobraking and science phasing, J. Geophys. Res., 105,9539–9552, 2000b.
Sullivan, R., P. Thomas, J. Veverka, M. Malin, and K. S. Edgett, Massmovement slope streaks imaged by the Mars Orbiter Camera, J. Geophys.Res., 106, 23,607–23,633, 2001.
Toon, O. B., J. B. Pollack, and C. Sagan, Physical properties of the particlescomprising the Martian dust storm of 1971–1972, Icarus, 30, 663–696,1977.
Vincent, R. K., and G. R. Hunt, Infrared reflectance from mat surfaces,Appl. Opt., 7, 53–59, 1968.
Wald, A. E., and J. W. Salisbury, Thermal infrared directional emissivity ofpowdered quartz, J. Geophys. Res., 100, 24,665–24,675, 1995.
Wyatt, M. B., V. E. Hamilton, H. Y. McSween Jr., P. R. Christensen, and L.A. Taylor, Analysis of terrestrial and Martian volcanic compositionsusing thermal emission spectroscopy, 1, Determination of mineralogy,chemistry, and classification strategies, J. Geophys. Res., 106, 14,711–14,732, 2001.
Young, L. D. G., Transmission of CO2 in the atmosphere of Venus for thespectral region near 7 microns, Icarus, 51, 606–609, 1982.
�����������������������P. R. Christensen and S. W. Ruff, Mars Space Flight Facility, Department
of Geological Sciences, Arizona State University, Box 876305, Tempe, AZ85287-6305, USA. ([email protected])
10 - 22 RUFF AND CHRISTENSEN: BRIGHT AND DARK REGIONS ON MARS