briefing materials for the g7 finance ministries, eu
TRANSCRIPT

Briefing Materials for the G7 Finance Ministries, EU Finance Ministries,
ESM, ECB, and EWG
Correctly Calculating Debt Relief and Debt: A Greece Example
Working Draft v.3.3
1. Greece should not be incentivized to non-market access. 2. Concessional changes to the contractual terms of debt
decrease the balance sheet value of the debt. 3. Greece has extraordinarily unique concessionality.
May 2016
Prepared by JAPONICA PARTNERS

Agenda Overview 1. Greece Should Not be Incentivized to Non-Market Access 2. Western Democracy Government Financial Transparency 3. Net Worth Change Comparison: Select Sovereigns 2011 - 2014/15 4. ESA 2010 on Debt Relief 5. 2008 SNA on Debt Relief 6. International Accounting Standards (IPSAS, IFRS, US GAAP) on Debt 7. 3rd Programme Debt Relief 8. Greece and Peers Debt Metrics 9. IMF DSA 12 May 2016: Analysis 10. IMF Best Practices Yet to be Applied to the Greece Program
Appendices: • USC 2016 Global Leadership Summit: Select Presentations • Correctly Calculating Greece Debt Numbers: Select Readings • MGDD vs ESA/SNA: Rescheduling • Annual Debt Service vs. IMF GFN Comparison: Greece 2016 • IMF Financial Data: 2004 to 2015 (from USC Global Leadership Summit)
2

1. Greece Should Not be Incentivized to Non-market
Access
3
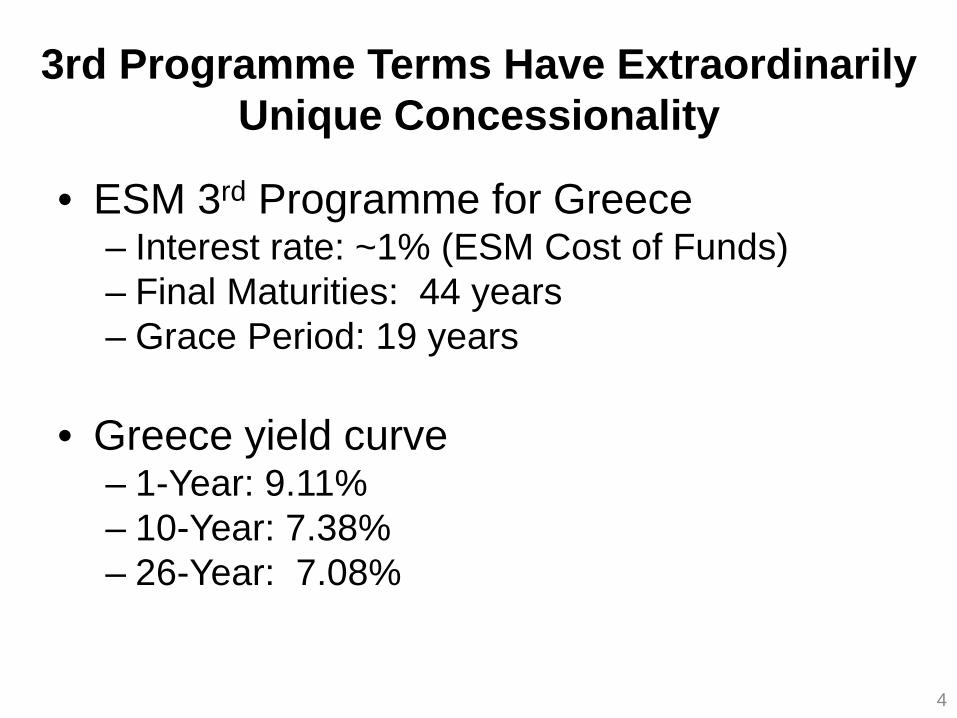
3rd Programme Terms Have Extraordinarily Unique Concessionality
• ESM 3rd Programme for Greece – Interest rate: ~1% (ESM Cost of Funds) – Final Maturities: 44 years – Grace Period: 19 years
• Greece yield curve
– 1-Year: 9.11% – 10-Year: 7.38% – 26-Year: 7.08%
4

Greece Should Not be Incentivized to Non-Market Access
1. “Moreover, Greece deters investors by depicting itself as crushed by a crippling debt mountain and a victim of predatory creditors rather than as a land of opportunity for business.” Reuters (6 Dec 2015)
2. They [Greece government] do not return our calls. The main issue is not the debt, but governance and the political economy. DBRS, USC Summit (30 Apr 2016)
3. Investor presentations so downbeat that attendees sell their GGBs after the meetings. (Spring 2016)
4. Commenting on Greece, “You have to have a positive story and sell a business case.” John Moran, former Secretary-General of Ireland Department of Finance, Reuters (6 Dec 2015)
5. Greece economic advisor to the prime minister promoted for winning battle against finance ministry to gain market access. Euro2day (Nov 2015)
5

Brazil and Argentina Demonstrate Market Benefits of Professional Management Teams
• Brazil: Government appoints “real superstars” to finance team. (FT, May 2016)
• Argentina: Argentina now has the “best economic policy teams” in Latin America. (FT, April 2016) – Within 50 days of legal settlement receive almost
$70 billion in orders and sold $16.5 billion in bonds including 30-year bonds.
6

Designate a World-Class Professional Turnaround Manager (PTM) for Greece
Globally Recognized Impeccable
Integrity
Successful Growth
Turnarounds
Unparalleled Knowledge of
Greece Government Financials
Trust and Confidence of
Sovereign Wealth Funds
Professional Turnaround Manager Qualifications
Skills to Produce Best
Practice Balance Sheet
ASAP
Rating Agency Framework
and successes
Capital Markets Broad
Knowledge
Managed Over 5,000
Employees
100-Day Plan Skills
Pro Bono Compensation
7

2. Western Democracy Government Financial
Transparency
8

What is Western Democracy Government Financial Transparency?
Western democracy government financial transparency is about giving your voting citizens the necessary financial information on a timely basis in order for there to be accountability for government officials financial actions.
9

Goals of Western Democracy Government Financial Transparency
1. Build trust and confidence 2. Better use of taxpayers money 3. Improve government ROA and net worth 4. Combat corruption 5. Global comparability and consistency 6. Accuracy and auditability 7. Citizen friendly
10

Two Universal Principles of Financial Reporting
1. Financial statements and international rules are the cornerstones of good management, transparency, and accountability.
2. Time-value-of-money is the rock upon which finance is based.
11
3. Net Worth Change Comparison: Select Sovereigns 2011 - 2014/15
12

Net Worth Change Comparison: Select Sovereigns 2011 - 2014/15
GreeceBenchmark
Median Australia Canada France IsraelNew
Zealand Swiss UK US1. Net Worth - 2011 -415 -103 -550 -2,149 -1401 81 -40 -986 -14,7852. Net Worth - 2014/15 -231 -309 -612 -2,770 -1727 92 -38 -1,620 -18,2223. Net Worth % Change 44% -23% -200% -11% -29% -23% 14% 5% -64% -23%
4. Net Worth % of GDP - 2011 -200% -7% -33% -104% -150% 39% -6.4% -57% -95%5. Net Worth % of GDP - 2014/15 -131% -19% -31% -130% -158% 38% -5.8% -87% -102%6. NW/GDP % Point Change 69 -7 -12 2 -26 -8 -1 0.6 -30 -6
1. Greece Net Worth increased 44% from 2011 to 2015 compared to Benchmark Median decrease of 23%.
2. Greece Net Worth as a % of GDP increased 60 percentage points compared to Benchmark Median decrease of 7 percentage points.
Notes: Data from respective government financial statements, EC AMECO, Eurostat, and IMF. France and Switzerland Net Worth adjusted for pension commitments. UK Net worth adjusted for undervaluation of infrastructure assets. UK and Canada GDP data is prior year due to 31 March fiscal year end. For back-up on 2015 Greece government working draft balance sheet, see USC Global Leadership Summit slides by Christopher Magarian (Japonica Partners) and Marios Psaltis (PwC). Greece 2011 figures are backwards developed estimates, which is an economics methodology (not a methodology based on international accounting or audit standards). 13

4. ESA 2010 on debt relief
14

ESA 2010: Legal Status and Central Framework in EU
“To ensure that the concepts, methodologies, and accounting rules set out in this volume are strictly applied, it has been decided, following a proposal from the Commission, to give it a solid legal basis. ESA 2010 was thus adopted in the form of a regulation of the European Parliament and the Council dated 21 May, 2013.” Page iii. “The ESA 2010 therefore serves as the central framework of reference for the social and economic statistics of the EU and its Member states.” Page 2.
15

ESA 2010: Debt Rescheduling Chapter 5: Valuation
16
5. 2008 SNA on Debt Relief
17

2008 SNA Statistical Framework Produced by Five NGOs
“It [2008 SNA] has been produced and is released under the auspices of the United Nations, the European Commission, the Organization for Economic Co-operation and Development, the International Monetary Fund, and the World Bank Group.” Forward. “At its fortieth session, the Statistical commission unanimously adopted the 2008 SNA as the international statistical standard for national accounts. We encourage all countries to compile and report their national accounts on the basis of the 2008 SNA as soon as possible.” Signed by BAN Ki-Moon, UN; BARROSO Jose Manuel, EC; GURRIA Angel, OECD; STRAUSS-KAHN Dominique, IMF; and ZOELLICK Robert B, World Bank. Forward.
18

Five Signatories to System of National Accounts (2008 SNA)
19

SNA 2008: Debt Rescheduling
20

6. International Accounting Standards (IPSAS, IFRS,
US GAAP) on Debt
21

IPSAS and IFRS Benchmarks in EU Consolidated Annual Accounts of the European Union 2014: “In accordance with article 143 of the Financial Regulations, the EU prepares its financial statements on the basis of accrual-based accounting rules, that are based on International Public Sector Accounting Standards (IPSAS).” Page 38. Central Government Accounting Standards France 2013 “Therefore, this conceptual framework has been designed with special reference to the following sets of standards: the French Chart of Accounts and the Accounting Regulation Committee regulations in force in France, the Standards being developed by the IFAC Public Sector Committee [IPSAS], and the IASB Standards [IFRS].” Page 11. UK Whole of Government Accounts 2014 “WGA is prepared using International Financial Reporting Standards (IFRS) adapted and/or interpreted for the public sector.” Page 33. European Financial Stability Facility 2014 “The accompanying standalone financial statements are prepared and presented on the accrual basis of accounting and comply with International Financial Reporting Standards (IFRS) as adopted by the European Union.” Page 23.
22

The Leading Stock Exchanges with Companies that Must Use Financial Statements Prepared in Accordance with International Accounting Rules
23
US GAAP/IFRS US GAAP/IFRS IFRS/US GAAP

24
“No material differences” between the standards on the below.
Objective: improves decision-making, increases transparency, strengthens accountability, and facilitates global comparability. 1. Initial Recognition • Fair value of debt is market value (confirming arm’s length) at date of event. • Market price/YTM or most comparable market price/YTM. • If necessary, PV with maximum use of observable/prevailing market YTM.
3. Concessionary Loans and Grants • Fair value measurement. • Recognized existence of non-exchange transaction as a subsidy.
3. Substantial Modification • If PV of cash flows is at least 10% different from PV of original financial liability. • All financial liabilities utilize the same market based principles.
4. Subsequent Measurement: At amortized cost using EIR method accretion.
IPSAS 29 / IFRS 39: Highlights

IFRS 39 Passed by EC Parliament
The EC made the IFRS debt measurement standards mandatory for all companies listed on major stock exchanges in the EU from 2005. Commission Regulation (EC). No.1864/2005 of 15 November 2005.
25

Accounting Failed Attempts History Greece has had seven failed attempts at implementing government
accrual accounting: 1: 1992 – Greek Ministry of Economy pushes for accrual accounting 2: 1998 – Presidential Decree for double-entry accounting systems for public bodies and
institutions. 2003 – Public hospitals in Greece to implement accrual accounting 3: 2005 – Greece law passed for public entities to use IAS (IFRS) 2006 – SEV publicly supports adoption of IPSAS 2008 – EC recommends, unofficially, that Greece implement IPSAS 4: 2009 (March) – Greece self-reports to OECD that it has full accrual based financial
statements 2009 – Greece big four accounting firms plus locals form IPSAS committee 2010 – IPSAS Greece government training of low level employees started (not Minister or MP
level) 2011 – IPSAS Greece government training stopped prior to certification exams 5: 2011/12 – IPSAS Greece projects started 2012 (April) – IPSAS conference in Athens 2013 – IPSAS Greece projects stopped with expiration of funds 2014 (June) – Public tender for computer accrual accounting systems pending 6: 2014 (December) – For the fifth time, Government again promises to adopt IPSAS “next
year” ignoring that implementation could start today 7: 2015 (May) – MoF announces intension to adopt IPSAS, forms committee, but no tangible
results. 26

7. 3rd Programme Debt Relief
27

ESM Third Programme for Greece has €46 Billion in Debt Relief
(€, Billions)
€ 60
€ 43 € 35
€ 23 € 14
€17 Billion Debt Relief
€25 Billion Debt Relief
€37 Billion Debt Relief
€46 Billion Debt Relief
€ 0
€ 10
€ 20
€ 30
€ 40
€ 50
€ 60
€ 70
2014 2015 2016 2017 2018
Balance Sheet Debt Debt Relief
Billion Debt
Billion Debt
Billion Debt
Billion Debt
Billion Debt
28 Note: Estimate as of 31 December 2015.

In 2015, Greece Net Worth Increased €17 Billion from Third Programme Debt Relief on €21.4 Billion of Loans
29
Note: As of 31 December 2015. The €21.4 billion of ESM loans are reported on the balance sheet at initial recognition value (also known informally as present value) which is amortized cost under international accounting rules and increase (accrete) to maturity value (known informally as future face value) each accounting period. The subsequent accretion impact to net worth is reduced by appreciation in the financial assets and debt relief from inflows of ESM funds.
Financial Assets € 0.0 Debt € 16.0
Financial Assets € 5.4 Debt € 4.4
Total Liabilities € 16.0 Total Liabilities € 4.4
Net Worth -€ 16.0 Net Worth € 1.0
Total Assets € 0.0Total Liabilitiesand Net Worth € 0.0 Total Assets € 5.4
Total Liabilitiesand Net Worth € 5.4
Post-Third Programme
Liabilities / Net WorthAssets
Before Third Programme
Assets Liabilities / Net Worth
During 2015, ESM made five concessionary loans to the CCC-rated Greece government for a total of €21.4 billion. The loans have an interest rate equal to AAA/Aa1-rated ESM cost of funds, which is less than 1%, not the yield-to-maturity of 7% to 8% on the longest maturity publicly traded Greece government bond. The loans have maturities out to 2059, 18-year grace periods, and weighted average lives of 32.5 years. Approximately, €16 billion of the proceeds were used to repay maturing debt and €5.4 billion to purchase financial assets of domestic banks, most of which was invested in 8% interest CoCos.

SNDisbursement
DateDisbursement
AmountBalance Sheet
DebtDebtRelief
1 20 Aug 2015 € 13.0 € 2.5 € 10.5
2 24 Nov 2015 € 2.0 € 0.5 € 1.5
3 1 Dec 2015 € 2.7 € 0.6 € 2.1
4 8 Dec 2015 € 2.7 € 0.6 € 2.1
5 23 Dec 2015 € 1.0 € 0.2 € 0.8
Total: € 21.4 € 4.4 € 17.0
% of Total: 20% 80%
2015 Greece Debt Relief of €17.0 Billion (Point of clarification: There is no cost or loss on debt relief for
Greece creditors given ESM intermediary structure.)
Notes: Note: Estimate as of 31 December 2015. Calculated according to international rules; assumes interest rate of 1% and maturity schedule of bank recap funds matching cash disbursements. 30

ESM Third Programme 2015-2025 Impact with €60 Billion in Funding through 2018 (1 of 3)
(€, Billions)
31 Note: Estimate as of 31 December 2015.
SN Data Items 2015 2016 2017 2018 2019 2020 2021 2022 2023 2024 2025
1. ESM Funding € 21.4 € 10.0 € 15.7 € 12.9 € 0.0 € 0.0 € 0.0 € 0.0 € 0.0 € 0.0 € 0.0
2. Change in Net Worth (Cumulative) € 17.0 € 24.7 € 36.8 € 46.3 € 45.6 € 44.8 € 43.9 € 43.0 € 42.0 € 40.9 € 39.7
3. Net Worth as % of GDP 9.7% 14.1% 20.4% 25.2% 24.3% 23.4% 22.5% 21.6% 20.6% 19.7% 18.8%
4. Balance Sheet Debt Impact -€ 11.6 -€ 19.2 -€ 31.2 -€ 40.7 -€ 39.9 -€ 39.0 -€ 38.0 -€ 37.0 -€ 35.9 -€ 34.7 -€ 33.5
5. Balance Sheet Debt Impact as % of GDP -6.6% -11.0% -17.3% -22.1% -21.2% -20.4% -19.5% -18.6% -17.7% -16.8% -15.8%
6. Balance Sheet Net Debt Impact -€ 17.0 -€ 24.7 -€ 36.8 -€ 46.3 -€ 45.6 -€ 44.8 -€ 43.9 -€ 43.0 -€ 42.0 -€ 40.9 -€ 39.7
7. Balance Sheet Net Debt Impact as % of GDP -9.7% -14.1% -20.4% -25.2% -24.3% -23.4% -22.5% -21.6% -20.6% -19.7% -18.8%

ESM Third Programme 2015-2025 Impact with €60 Billion in Funding through 2018 (2 of 3)
(€, Billions)
32
SN Data Items 2015 2016 2017 2018 2019 2020 2021 2022 2023 2024 2025 Notes1. ESM Funding € 21.4 € 10.0 € 15.7 € 12.9 € 0.0 € 0.0 € 0.0 € 0.0 € 0.0 € 0.0 € 0.0 (a)
Balance Sheet Data:2. Initial Balance Sheet Debt Value 4.4 2.4 3.4 2.9 0.0 0.0 0.0 0.0 0.0 0.0 0.0 (b)3. Initial Change in Net Worth from ESM Funding 17.0 7.6 12.3 10.0 0.0 0.0 0.0 0.0 0.0 0.0 0.0 (c)4. Refinanced Debt 16.0 10.0 15.7 12.9 0.0 0.0 0.0 0.0 0.0 0.0 0.0 (d)5. Balance Sheet Debt Impact -11.6 -19.2 -31.2 -40.7 -39.9 -39.0 -38.0 -37.0 -35.9 -34.7 -33.5 (e)6. Balance Sheet Debt Impact as % of GDP -6.6% -11.0% -17.3% -22.1% -21.2% -20.4% -19.5% -18.6% -17.7% -16.8% -15.8%7. Bank Equity 1.3 1.4 1.5 1.5 1.6 1.7 1.8 1.9 2.0 2.1 2.2 (f)8. Bank Co-Cos 4.1 4.1 4.1 4.1 4.1 4.1 4.1 4.1 4.1 4.1 4.1 (g)9. Financial Assets 5.4 5.5 5.5 5.6 5.7 5.8 5.9 5.9 6.0 6.1 6.2 (h)
10. Balance Sheet Net Debt Impact -17.0 -24.7 -36.8 -46.3 -45.6 -44.8 -43.9 -43.0 -42.0 -40.9 -39.7 (i)11. Balance Sheet Net Debt Impact as % of GDP -9.7% -14.1% -20.4% -25.2% -24.3% -23.4% -22.5% -21.6% -20.6% -19.7% -18.8%12. Annual Change in Net Worth € 17.0 € 7.6 € 12.1 € 9.5 -€ 0.7 -€ 0.8 -€ 0.9 -€ 0.9 -€ 1.0 -€ 1.1 -€ 1.1 (j)13. Annual Change in Net Worth as % of GDP 9.7% 4.4% 6.7% 5.2% -0.4% -0.4% -0.4% -0.5% -0.5% -0.5% -0.5%14. Change in Net Worth (Cumulative) € 17.0 € 24.7 € 36.8 € 46.3 € 45.6 € 44.8 € 43.9 € 43.0 € 42.0 € 40.9 € 39.7 (k)15. Change in Net Worth (Cumu.) as % of GDP 9.7% 14.1% 20.4% 25.2% 24.3% 23.4% 22.5% 21.6% 20.6% 19.7% 18.8%
Annual Flows:16. Cumulative Inflows 21.4 31.4 47.1 60.0 60.0 60.0 60.0 60.0 60.0 60.0 60.0 (l)17. Interest Payments 0.00 0.13 0.17 0.26 0.30 0.35 0.40 0.45 0.50 0.54 0.59 (m)18. Interest Income on Cocos 0.00 0.33 0.33 0.33 0.33 0.33 0.33 0.33 0.33 0.33 0.33 (g)19. Net Interest Payments 0.00 -0.20 -0.15 -0.06 -0.02 0.03 0.08 0.12 0.17 0.22 0.26 (n)20. Net Interest Payments as % of GDP 0.00% -0.11% -0.08% -0.04% -0.01% 0.01% 0.04% 0.06% 0.08% 0.11% 0.12%21. Accretion to OCI 0.00 0.22 0.39 0.61 0.85 0.86 0.88 0.90 0.93 0.96 0.99 (o)
22. GDP Growth -- -0.7% 3.5% 2.0% 2.0% 2.0% 2.0% 2.0% 2.0% 2.0% 2.0%23. GDP 175.7 174.4 180.5 184.1 187.8 191.5 195.4 199.3 203.3 207.3 211.5 (p)

ESM Third Programme 2015-2025 Impact with €60 Billion in Funding through 2018 (3 of 3)
Notes: (a) Three year Programme scheduled to conclude in 2018. Total ESM Funding of €60 billion based on interview with
Klaus Regling, ESM Managing Director published in Neue Zürcher Zeitung (Switzerland), 18 March 2016; see: http://www.esm.europa.eu/pdf/2016_03_18_Regling_NZZ_EN.pdf. Post-2015 estimates based on IMF Gross Financing Needs (IMF Preliminary Draft DSA, 26 June 2015) with 2016 adjusted for €9 billion in T-bills to total €60 billion.
(b) Initial recognition value based on IPSAS/IFRS using most comparable yield-to-maturity of GGB due 2042. (c) Difference between disbursement amount and Initial Balance Sheet Debt Value increases net worth through other
comprehensive income (OCI). (d) Estimated amount of annual ESM disbursements used to refinance maturing debt. (e) Impact on year-end balance sheet debt value from cumulative ESM disbursements which is prior year Impact less
current year Initial Change in Net Worth from ESM Funding plus net interest and accretion. (f) Estimated value of common equity purchased with ESM recap funds; assumed to grow at 5% per year. (g) Contingent convertible debt instruments purchased with ESM recap funds; annual coupon of 8% per year, which is
netted against Interest Payments. (h) Value of financial assets purchased with ESM funds. (i) Impact on year-end value of balance sheet debt less Financial Assets from cumulative ESM disbursements. (j) Change in Net Worth plus annual increase in Financial Assets less Net Interest Payments less Accretion to OCI. (k) Change in Net Worth is Initial Change in Net Worth from ESM Funding plus annual increase in Financial Assets
less Net Interest Payments less Accretion. (l) Cumulative total ESM loan disbursements. (m) Interest rate on ESM loans is ESM cost of funds, estimated based on yield curve plus 10.5 basis point margin on
Cumulative Inflows assuming 20% maturity per year refinanced at rolling 5-year rate. (n) Interest Payments plus Cost to Cover Interest Payments less Interest Income on Cocos. (o) Initial recognition value accretes based on initial market yield-to-maturity to future face value over the life of the
debt instrument. OCI is other comprehensive income. (p) 2015-2017 based on EC AMECO database (accessed 20 Jan 2016); subsequent years assume 2% annual growth. 33
8. Greece and Peers Debt Metrics
34

Expert’s Opinion on Greece Balance Sheet Net Debt
• Expert’s Opinion – Revaluation of Greece Financial Liabilities and Discussion on the Implications to the Net Debt Amount of Greece compared to its Peers as of December 31, 2013.
• Verification Statement: “Nothing has come to our attention that causes us to believe that the calculations of Greece financial liabilities as reported to us as of December 31, 2013 have not been, in all material respects conducted reasonably in accordance with IAS 39 and IFRS 13, which are deemed an appropriate approximation of IPSAS 29, applicable for Greece.”
• Number preliminarily updated for December 31, 2015.
35
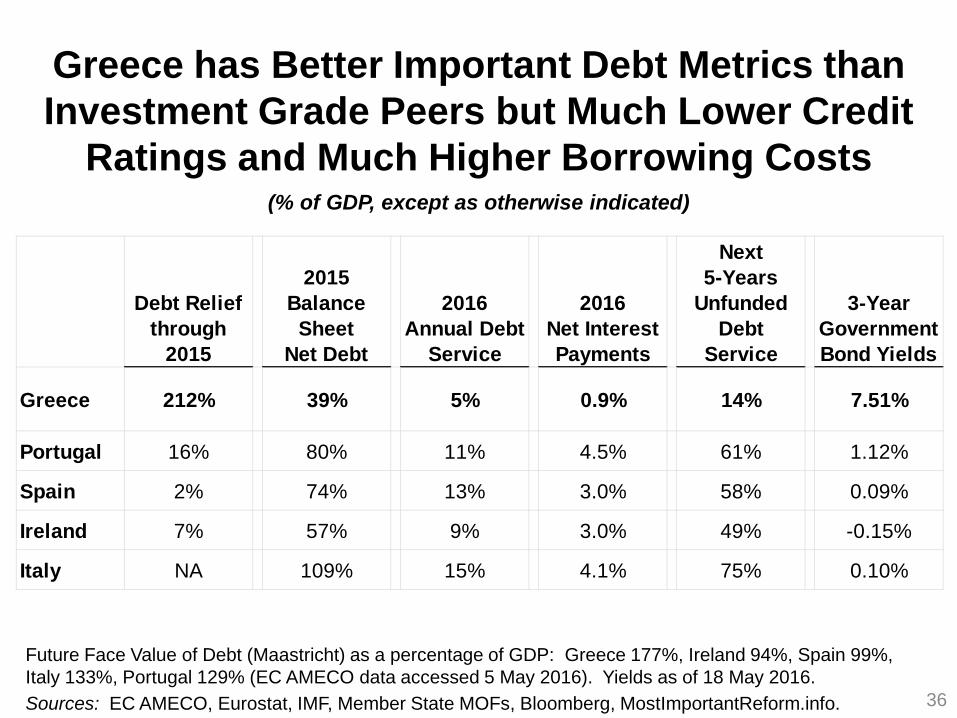
Greece has Better Important Debt Metrics than Investment Grade Peers but Much Lower Credit
Ratings and Much Higher Borrowing Costs
(% of GDP, except as otherwise indicated)
36
Future Face Value of Debt (Maastricht) as a percentage of GDP: Greece 177%, Ireland 94%, Spain 99%, Italy 133%, Portugal 129% (EC AMECO data accessed 5 May 2016). Yields as of 18 May 2016. Sources: EC AMECO, Eurostat, IMF, Member State MOFs, Bloomberg, MostImportantReform.info.
Debt Reliefthrough
2015
2015Balance
SheetNet Debt
2016Annual Debt
Service
2016Net InterestPayments
Next5-Years
UnfundedDebt
Service
3-YearGovernmentBond Yields
Greece 212% 39% 5% 0.9% 14% 7.51%
Portugal 16% 80% 11% 4.5% 61% 1.12%
Spain 2% 74% 13% 3.0% 58% 0.09%
Ireland 7% 57% 9% 3.0% 49% -0.15%
Italy NA 109% 15% 4.1% 75% 0.10%

Greece and Peer Balance Sheet Debt and Net Debt: 2013-2015
37
GREECE 2013 BALANCE SHEET NET DEBT WAS INDEPENDENTLY VERIFIED BY A BIG-FOUR ACCOUNTING FIRM ON 15 AUGUST 2014.
Greece Historical Data:
20132013
Revised 2014 2015Delta % Change
1. Balance Sheet Debt € 124 € 124 € 124 € 118 -€ 6 -5%2. Financial Assets € 91 € 97 € 71 € 50 -€ 47 -48%3. Balance Sheet Net Debt € 33 € 27 € 53 € 68 € 41 155%4. GDP € 182 € 180 € 178 € 173 -€ 7 -4%5. Balance Sheet Debt / GDP 68% 69% 70% 68.4% 0%6. Financial Assets / GDP 50% 54% 40% 29% -25%7. Balance Sheet Net Debt / GDP 18% 15% 30% 39% 25%8. Future Face Value of Debt € 319 € 319 € 317 € 309 -€ 11 -3%9. Future Face Value / GDP 175% 177% 179% 178% 1%
Greece and Peer 2015 Data:
Greece
Greece% of
Peer Avg.Peer
Average Portugal Ireland Spain Italy10. Balance Sheet Debt € 118 € 206 € 192 € 1,070 € 2,17511. Financial Assets € 50 € 63 € 76 € 267 € 39012. Balance Sheet Net Debt € 68 € 144 € 116 € 803 € 1,78613. GDP € 173 € 179 € 205 € 1,079 € 1,63514. Balance Sheet Debt / GDP 68% 62% 110% 115% 94% 99% 133%15. Financial Assets / GDP 29% 96% 30% 35% 37% 25% 24%16. Balance Sheet Net Debt / GDP 39% 49% 80% 80% 57% 74% 109%17. Future Face Value of Debt € 309 € 229 € 204 € 1,088 € 2,17518. Future Face Value / GDP 178% 128% 100% 101% 133%
2013 Revised - 2015
Notes: Estimate as of January 2016.

Progression of Maastricht Gross Debt to Balance Sheet Net Debt through Financial Engineering
(Euros, Billions)
Notes: Simplification for presentation purposes. Estimate as of January 2016. 38
Maastricht IPSAS/IFRS International Accounting Adjustments (Includes Accretion) BalanceDebt OSI #1 OSI #1 OSI #2/PSI #1 OSI #3/PSI #2 OSI #4 Sheet
Type of (Face Value) Loans Loan Modification Extensive Restructuring Modification/Buyback Loans Total Net DebtSN Debt/Asset 31 Dec 2015 May 2010 June 2011 Feb/Mar 2012 December 2012 August 2015 Adjustments 31 Dec 2015 SN1. Modified Securities € 46 € 0 € 0 € 29 € 5 € 0 € 34 € 12 1.2. Modified/Concessionary Loans € 221 € 9 € 5 € 69 € 57 € 17 € 157 € 64 2.3. Non-Revalued Debt € 42 € 0 € 0 € 0 € 0 € 0 € 0 € 42 3.4. Adjustments € 9 € 5 € 98 € 62 € 17 € 191 4.5. Total Gross Debt € 309 € 300 € 295 € 197 € 135 € 118 € 118 5.6. GDP € 173 € 173 6.7. Debt/GDP 178% 68% 7.8. Financial Assets Funded w/ Loans Concessionary Terms and Modifications: Highlights € 7 8.9. Other Financial Assets € 43 9.
10. Total Financial Assets € 50 10.11. Balance Sheet Net Debt € 68 11.12. Balance Sheet Net Debt/GDP 39% 12.
EFSF Loans: Cost-of-funding plus 200-300bps.
Maturities: 30 yrs.
EFSF Loans cut to cost-of-funding. Interest
deferred for 10 yrs. Maturities extended to
maximum 45 yrs.ANFA bonds issued on
extant terms with interest and partial principal
rebate.SMP bonds issued on
extant terms.SMP interest and partial
principal rebate.GGBs start at 2% coupon
with maturities up to30 yrs.
ESM Loans: ESM cost of funds (est. rate <1%). Maturities up to 44
years. Grace periods of 18+ years.
Most Comparable Debt Instrument~400 bps below market
YTMs.Market prices/YTMs
reflects CCC-rated GGB high yield status.
Market prices/YTMs reflects CCC-rated GGB
high yield status.
Market prices/YTMs reflects CCC-rated GGB
high yield status.
Market prices/YTMs reflects CCC-rated GGB
high yield status.
Maastricht Debt - Cumulative Face Value Adjusted € 71 € 71 € 275 € 275 € 296
EU Loans: 3M Euribor plus 300-400 bps. Maturities: 5 yrs.
Grace period: 1.5 yrs.
EU Loans cut to 3M Euribor plus 200-300 bps. Maturities up to
10 yrs. Grace period up to 4.5 yrs.
EU Loans cut to 3M Euribor plus 150bps.
Maturities up to 15 yrs. Grace period up to 10 yrs.
EU Loans cut to 3M Euribor plus 50bps.
Maturities extended to 30 yrs.

Greece Government Working Draft Balance Sheet (31 December 2015; €, billions)
39
SN Balance Sheet Item Amount % of GDP1. Financial Assets € 52 30%2. Non-Financial Assets € 90 51%3. Total Assets € 142 81%
4. Financial Liabilities € 118 67%5. Non-Financial Liabilities € 255 145%6. Total Liabilities € 373 212%
7. Net Worth -€ 231 -131%
Note:GDP € 176
9. IMF DSA 12 May 2016: Analysis
40

IMF May 2016 Leaked Greece DSA Proposed Restructuring Terms
41
Amort.Debt Grace Interest Maturity Interest
Instrument Period Deferral Extension Rate(Min 2040)
1 GLF Increase by 20 years
24 years Extend by 40 yrs
Eliminate 50 bps spread over euribor
2 EFSF Co-Fin Increase by up to 17 years
24 years Extend by up to 24 yrs
Fixed at 1.5% through 2045
3 EFSF Increase by up to 17 years
17 years Extend by up to 24 yrs
Fixed at 1.5% through 2045
4 ESM Increase by up to 6 years
24 years Extend by 20 yrs
Fixed at 1.5% through 2045

IMF May 2016 Leaked Greece DSA Proposed Restructuring Terms:
Impact on Net Worth
42
• Preliminary analysis indicates €20 to €25 billion decrease in Greece government balance sheet debt and increase in net worth.
• Impact on Greek government projected net worth through 2060 in process of preparation.

Select IMF DSA Assumptions May 2016
1. “Market interest rates vary endogenously with the level of debt ratio (about 1 bp change for each 1 ppt change in debt ratio).”
2. The starting market interest rate 5¾% to 6¾%. 3. Privatization proceeds to reduce future face
value of debt per prior DSAs. 4. Primary balance 1.5%. 5. Nominal GDP growth: average 4.0% 2017-2022
and 3.2% thereafter.
43

IMF Greece DSA Assumptions Overlaid on France and Spain
With similar primary balance and interest rates:
• France 2015 debt to GDP would increase from 95.8% to [TBD]% in 2060.
• Spain 2015 debt to GDP would increase from 99.2% to [TBD]% in 2060.
44

10. IMF Best Practices Yet to be Applied to the Greece Program
45
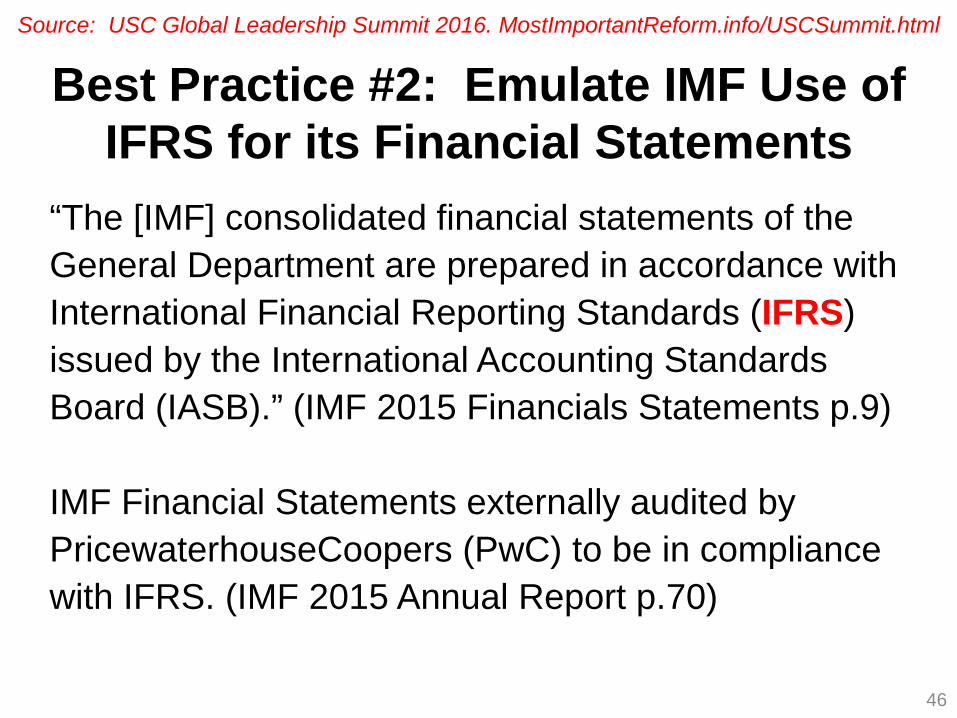
Best Practice #2: Emulate IMF Use of IFRS for its Financial Statements
“The [IMF] consolidated financial statements of the General Department are prepared in accordance with International Financial Reporting Standards (IFRS) issued by the International Accounting Standards Board (IASB).” (IMF 2015 Financials Statements p.9) IMF Financial Statements externally audited by PricewaterhouseCoopers (PwC) to be in compliance with IFRS. (IMF 2015 Annual Report p.70)
46
Source: USC Global Leadership Summit 2016. MostImportantReform.info/USCSummit.html

Best Practice #6: Recognize Present Value of Debt for Measuring Concessional Financing
IMF Staff Guidance Note prepared by the IMF and the World Bank (April 2007):
1. Countries that primarily rely on concessional financing, the net present value (NPV) of debt is needed to be informative as a measure of a country’s effective debt burden. (p.25)
2. This [debt] burden is best measured using the net present value (NPV) of debt to capture the concessionality of outstanding debt. (p.7)
3. NPV debt ratios are summary indicators of the burden represented by the future obligations of a country and thus reflect long-term risks to solvency. (p.7-8)
DSA LIC Framework (5 Nov 2013): Debt stock indicators in the DSF are in present value rather than nominal terms. (p.12) IMF Factsheet (7 Apr 2016): Discusses use of present value of debt. (p.1) 47
Source: USC Global Leadership Summit 2016. MostImportantReform.info/USCSummit.html

Best Practice #7: Having Admitted that Future Face Value of Debt is Not Meaningful, Stop Using
for Primary Balance Targets
“Given the extraordinarily concessional terms that now apply to the bulk of Greece’s debt, the debt/GDP ratio is not a very meaningful proxy for the forward-looking debt burden.” (IMF Greece DSA, 26 June 2015, p.11) The IMF should stop using a future face value of debt to GDP target of 110% by 2022 (IMF Greece DSA, 26 June 2015, p.1 and IMF Greece DSA Update, July 2015, p.1) and requiring a 3.5% primary balance policy target (IMF Greece DSA, 26 June 2015, p.4 and IMF Greece DSA Update, July 2015, p.2).
48
Source: USC Global Leadership Summit 2016. MostImportantReform.info/USCSummit.html

Best Practice #8: Use Net Debt, in Addition to Gross Debt, as an Important Metric
IMF Staff Guidance Note (May 2013): 1. Staff should consider three important
issues including gross versus net debt. (p.8) 2. Complementary analysis based on net debt
presented to show the impact of risk-mitigating factors. (p.8)
3. The use of a standard statistical definition of net debt in line with the Public Sector Debt Statistics Guide is recommended. (p.9)
49
Source: USC Global Leadership Summit 2016. MostImportantReform.info/USCSummit.html

IMF GrossFinancing
Debt Service Needs (GFN)% of GDP % of GDP
Greece 5% 19%
Portugal 11% 20%Ireland 9% 9%Spain 13% 17%Italy 15% 17%Peer Average 12% 14%
Greece % of Peer Average 43% 135%
50 Notes: Debt Service is 2016 estimate based on Bloomberg, EC, and IMF data; Greece adjusted for deferred
interest, SMP/ANFA rebates, and interest savings related to 2016 ESM funding.
Best Practice #9: Correctly Calculate Debt Service and Not Confuse with Gross Financing Needs
• IMF Staff Guidance Note (5 Nov 2013), p.11: “the evolution of debt-service ratios provides an indication of the likelihood and possible timing of liquidity problems.” Debt service defined as principal and interest payments.
• IMF Factsheet (7 Apr 2016) discusses use of debt service.
• Greece 2016 Debt Service, which is interest expense and principal payments less rebates and deferrals, is 43% of peers:
Source: USC Global Leadership Summit 2016. MostImportantReform.info/USCSummit.html

IMF Value Destructive Focus on Liquidity, Not Sustainable Growth
• IMF, as lender of last resort, focuses on daily liquidity. Examples: combine interest and principal payments into single metric, only account for assets that can be used in a liquidity crisis, thus ignoring the transparency and accountability of other financial assets and non financial assets.
• IMF had virtually no role in the recovery of Ireland or Spain. – “Among the Euro Area programs, Ireland was an
exception that received virtually no TA during its Fund-supported program, reflecting its strong institutional capacity.” (IMF, Nov 2015)
51

Appendices
52

USC 2016 Global Leadership Summit: Select Presentations
(Slides and Videos) MostImportantReform.info/USCSummit.html
Select Presentations: 1. IMF Ten Best Practices Yet to be Applied to the
Greece Program. Dimitri Tzanninis 2. Lessons from Greece: The MACC Framework.
George Serafeim 3. Greece Government Working Draft Balance Sheet
and Analysis of Third Programme Debt Relief. Christopher Magarian and Marios Psaltis
4. Bringing Western Democracy Government Financial Transparency to Greece. Paul B. Kazarian
53

Correctly Calculating Greece Debt Numbers: Select Readings
“The Curious Case of the Rules for Calculating Debt Relief: A Technical Note on EU Accounting for Debt, Especially Restructured and Concessional Debt.” Sep 2015. Ball, Ian
“Greece’s Debt Sustainable?” Harvard Business School Case Study. June 2015. Serafeim, George
“Greece’s New Agreement with Europe: This Time Different?” Intereconomics. September/October 2015. Pelagidis, Theodore and Kazarian, Paul B.
“Greece's Bailout Package: Missing IPSAS?” The Accountant. September 2015. Tornero, Carlos
See also: www.MostImportantReform.info 54

MGDD vs ESA: Rescheduling
Chapter 5: Valuation
55
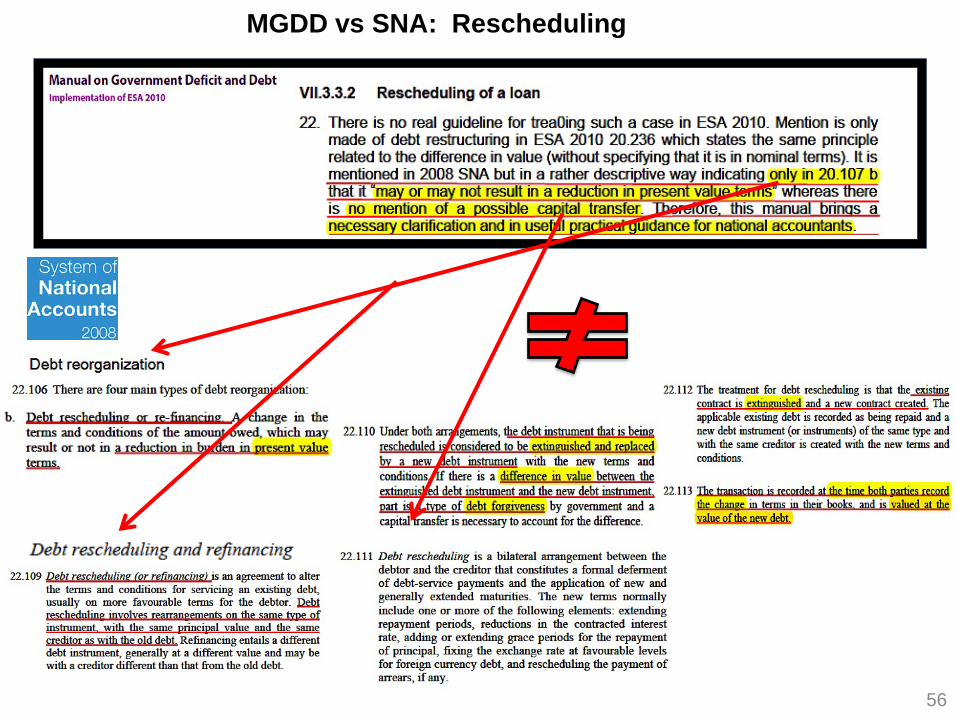
MGDD vs SNA: Rescheduling
56

Annual Debt Service vs. IMF GFN Comparison: Greece 2016
57 Note: As of February 2016 based on IMF Greece DSA dated June 26, 2015.
SN Euros % of GFN Notes1. IMF Gross Financing Needs (GFN) € 34.6 100% SN 2 times SN 20.2. IMF GFN % of GDP 19% Source: IMF Greece DSA (June 26, 2015) Figure 1, p.19.
Annual Debt Service: 3. Interest Payments € 7.1 20% Derived based on IMF Greece DSA (June 26, 2015) Figure 1, p.19 data.4. Bond and Loan Principal Payments € 7.4 21% Source: IMF Greece Fifth Review (June 2014).5. Deferred Interest -€ 1.3 -4% Deferred interest on non-financed EFSF loans at rate of 1.4%.6. SMP/ANFA Rebates -€ 3.5 -10% Estimated rebates of interest and principal on ECB and NCB bond holdings.7. Other -€ 0.8 -2% Estimate incl. interest income, lower principal payments, and third programme/T-bill savings.8. Annual Debt Service € 8.8 25%9. Annual Debt Service % of GDP 5%
IMF GFN: 10. Interest Payments € 7.1 80% Derived based on IMF Greece DSA (June 26, 2015) Figure 1, p.19 data.11. Bond and Loan Principal Payments € 7.4 84% Source: IMF Greece Fifth Review (June 2014).12. T-Bills € 14.8 43% Bloomberg and PMDA bulletin.13. Arrears € 5.3 15% Source: IMF Greece DSA (June 26, 2015) Table 1, p.7. Estimate of 75% of IMF projection.14. Cash Buffer for Deposit Build-up € 1.5 4% IMF email 9 February 2016.15. Net Privatization Proceeds -€ 0.5 -1% IMF email 9 February 2016.16. SMP/ANFA Rebates -€ 1.6 -5% IMF email 9 February 2016 guidance of 0.9% of GDP.17. To Be Reconciled € 0.7 2% In process of reconciling.18. Gross Financing Needs € 34.6 100%
19. Non-Debt Service GFN € 25.8 75% SN 16 less SN 8.
20. GDP € 182 Derived based on IMF Greece DSA (June 26, 2015) Figure 1, p.19 Nominal GDP Growth data and IMF WEO reported 2014 GDP.

YEAR REVENUE EXPENSES
NETOPERATIONAL
INCOME
GREECEPROFIT
CONTRIBUTION
GREECE PROFIT
CONTRIBUTIONAS A % OFNET OP. INCOME
NETOP. INCOMEAS A % OFREVENUE
2008 € 981 € 1,104 (€ 122) € 0 0% -12%
2009 € 973 € 797 € 176 € 0 0% 18%
2010 € 1,184 € 926 € 258 € 70 27% 22%
2011 € 1,747 € 897 € 850 € 385 45% 49%
2012 € 2,724 € 1,000 € 1,723 € 589 34% 63%
2013 € 3,264 € 994 € 2,270 € 813 36% 70%
2014 € 2,765 € 1,058 € 1,707 € 938 55% 62%
2015 € 3,860 € 1,131 € 2,729 € 764 28% 71%Total since 2010 Program: € 9,537 € 3,558 37%
Source: USC Global Leadership Summit 2016. MostImportantReform.info/USCSummit.html
Greece is a Valued Partner to the IMF as Indicated by its Substantial Profit
Contribution During the Past Six Years (€, millions)
58 Notes: IMF fiscal year end is 30 April; Greece profit contribution is calendar year. Conversion rates as of 30 April to conform with IMF fiscal year.

REVENUE NET INCOMEPROFITMARGIN
NET INCOMEPER EMPLOYEE
€ 3.9 € 2.7 71% € 1,024,690
$93.5 $24.4 26% $104,008$76.4 $17.2 23% $74,459$33.8 $6.1 18% $165,761$35.2 $6.1 17% $108,506€ 37.0 -€ 6.8 -18% -€ 67,257
Morgan StanleyDeutsche Bank
BANKIMF
Goldman Sachs
JP MorganCiti Bank
Source: USC Global Leadership Summit 2016. MostImportantReform.info/USCSummit.html
IMF's High Value Add is Illustrated by a Gross Margin that is a Multiple of the World's Leading Investment Banks
59
IMF vs. Major Bank Profit Margin Comparison 2015: (Currency as indicated in billions except per employee.)
Notes: SDR converted to euros as of 30 April 2015 (IMF fiscal year end).

IMF Personnel Expenses and Capital Expenditures 6 Years Post- and Pre-Greece Crisis
(SDRs, Millions)
Fiscal YearPersonnelExpenses
PersonnelExpenses% Change
Property,Plant, andEquipment
PP&E% Change Additions
6 Years Post-Greece Crisis:2010 - 2015 38% 31% 283
2015 473 8% 380 9% 752014 436 5% 350 16% 79
(Restated) 2013 417 6% 303 8% 53(Restated) 2012 393 7% 281 -3% 24
2011 369 7% 289 -0.3% 302010 344 1% 290 -1% 22
6 Years Pre-Greece Crisis:2004 - 2009 1% 10% 128
2009 341 -3% 294 -1% 222008 351 -3% 296 -2% 162007 362 2% 302 -4% 112006 355 3% 313 1% 202005 343 2% 311 16% 592004 337 -9% 267 12% NA
Note: On 4 May 2016, to convert SDR to USD multiply by 1.42, and to convert SDR to Euro multiply by 1.23.
Source: USC Global Leadership Summit 2016. MostImportantReform.info/USCSummit.html
60