briefing brisbane industrial july 2018 -...
TRANSCRIPT
BriefingBrisbane Industrial July 2018
Savills Research Queensland
Highlights After a record 2016, leasing volumes in Brisbane
industrial have softened, resulting in subdued rental growth;
Over 2018, approximately 158,990 square metres of space is due to hit the market, with nearly three-quarters of this space still under construction;
Private investors were the most active purchaser type, accounting for approximately 38% of all reported sales in FY-18, followed closely by ‘Funds’ and ‘Trusts’, jointly accounting for 28.5% of all industrial sales in Brisbane;
Improvements in commodity prices and the positive outlook for exports, has helped stimulate job advertisements for the industrial sector.
Prime Averages (Trade Coast)
Latest 12mo Diff Outlook
Rental – N.F. ($/sq m) 133 n/c Incentives (%) 10.0 n/c Yield – Market (%) 6.38 -25bps IRR (%) 8.25 -25bps Capital Values ($/sq m) 1,925 n/c
Land Values ($/sq m) 475 n/c
July 2018
savills.com.au/research 2
Savills Research | Briefing Notes – Brisbane Industrial
Report ContentsExecutive Summary 2Leasing Activity & Demand 3Rents and Developments 5Sales Activity 6Infrastructure & Outlook 8Precinct Map 9Key Indicators 11
Key Contacts 12
Executive Summary
Major project completions in the mining sector have helped to stimulate economic growth in Queensland, with growth in State Final Demand for the 12 month period rebounding above long term averages. Ongoing mining projects in Queensland are likely to see continued positive effects on the Queensland economy and thus spill over into the industrial sector, aiding leasing demand and increase consumer and business sentiment. Indeed, we are already seeing a notable rise in speculative supply in Brisbane’s industrial market in 2017, as a result of the improving economic conditions and positive sentiment around tenant demand.
Industrial leasing volumes in Brisbane over the 12 months to June 2018 remained subdued, following a period of record high leasing activity in FY-16 and FY-17, translating to largely stagnant growth in rents. Prime net face rents remained stable over FY-18. The Trade Coast precinct leads the other major industrial areas in terms of net rental levels, with net face rents typically ranging from $115 to $150 per square metre per annum, or an average $133 per square metre.
Looking at transaction activity, private investors were the most dominant purchaser type as a group, accounting for 38% of total industrial assets transacted in Brisbane’s industrial market over the 12 months to June 2018. Whilst sales activity over the latest 12 month period has been largely subdued, following record transaction levels in the previous two annual periods, there appears to be a renewal of interest in industrial assets in Brisbane, on the back of positive forward looking indicators; such as record high corporate profits in the mining sector, above average employment growth (especially in engineering jobs) and major project starts in Queensland likely to boost the leasing market and aid largely stagnant rents.
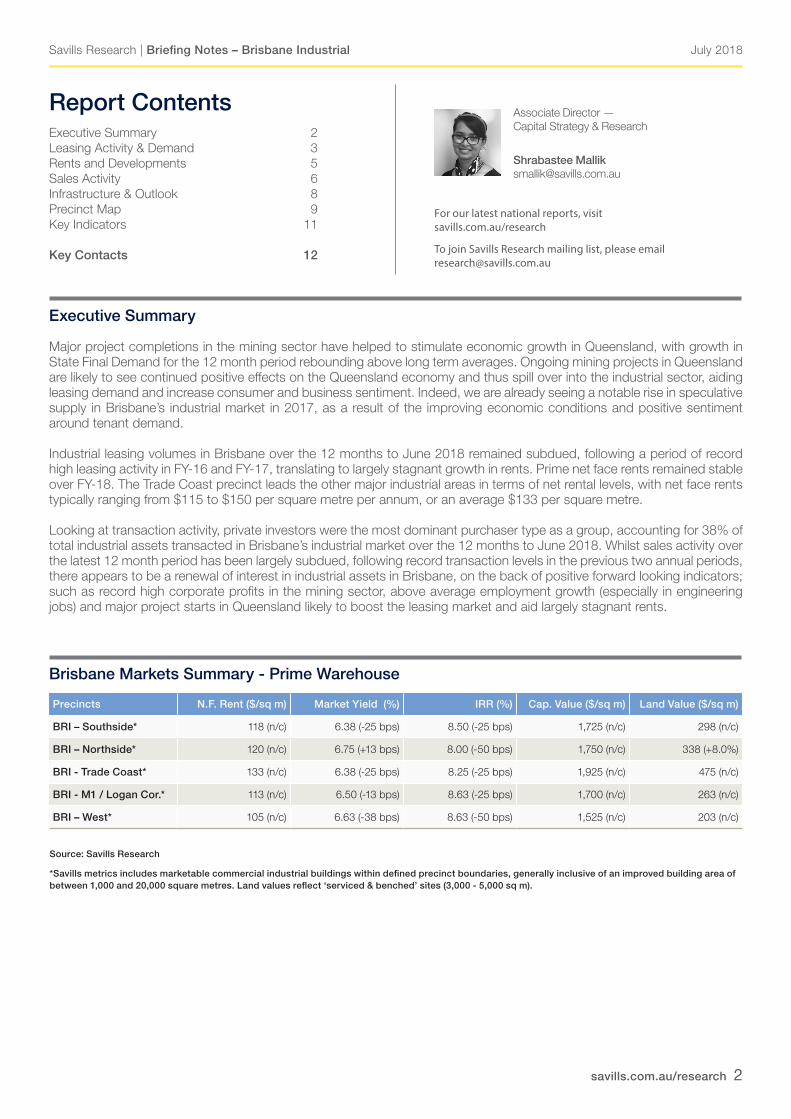
Brisbane Markets Summary - Prime Warehouse
Precincts N.F. Rent ($/sq m) Market Yield (%) IRR (%) Cap. Value ($/sq m) Land Value ($/sq m)
BRI – Southside* 118 (n/c) 6.38 (-25 bps) 8.50 (-25 bps) 1,725 (n/c) 298 (n/c)
BRI – Northside* 120 (n/c) 6.75 (+13 bps) 8.00 (-50 bps) 1,750 (n/c) 338 (+8.0%)
BRI - Trade Coast* 133 (n/c) 6.38 (-25 bps) 8.25 (-25 bps) 1,925 (n/c) 475 (n/c)
BRI - M1 / Logan Cor.* 113 (n/c) 6.50 (-13 bps) 8.63 (-25 bps) 1,700 (n/c) 263 (n/c)
BRI – West* 105 (n/c) 6.63 (-38 bps) 8.63 (-50 bps) 1,525 (n/c) 203 (n/c)
Source: Savills Research
*Savills metrics includes marketable commercial industrial buildings within defined precinct boundaries, generally inclusive of an improved building area of between 1,000 and 20,000 square metres. Land values reflect ‘serviced & benched’ sites (3,000 - 5,000 sq m).
Associate Director — Capital Strategy & Research
Shrabastee [email protected]
For our latest national reports, visit savills.com.au/research
To join Savills Research mailing list, please email [email protected]
July 2018
savills.com.au/research 3
Savills Research | Briefing Notes – Brisbane Industrial
-
100,000
200,000
300,000
400,000
500,000
600,000
700,000
800,000
900,000 BRI-West BRI-Southside BRI-NorthsideBRI-Trade Coast BRI-Non-Metro
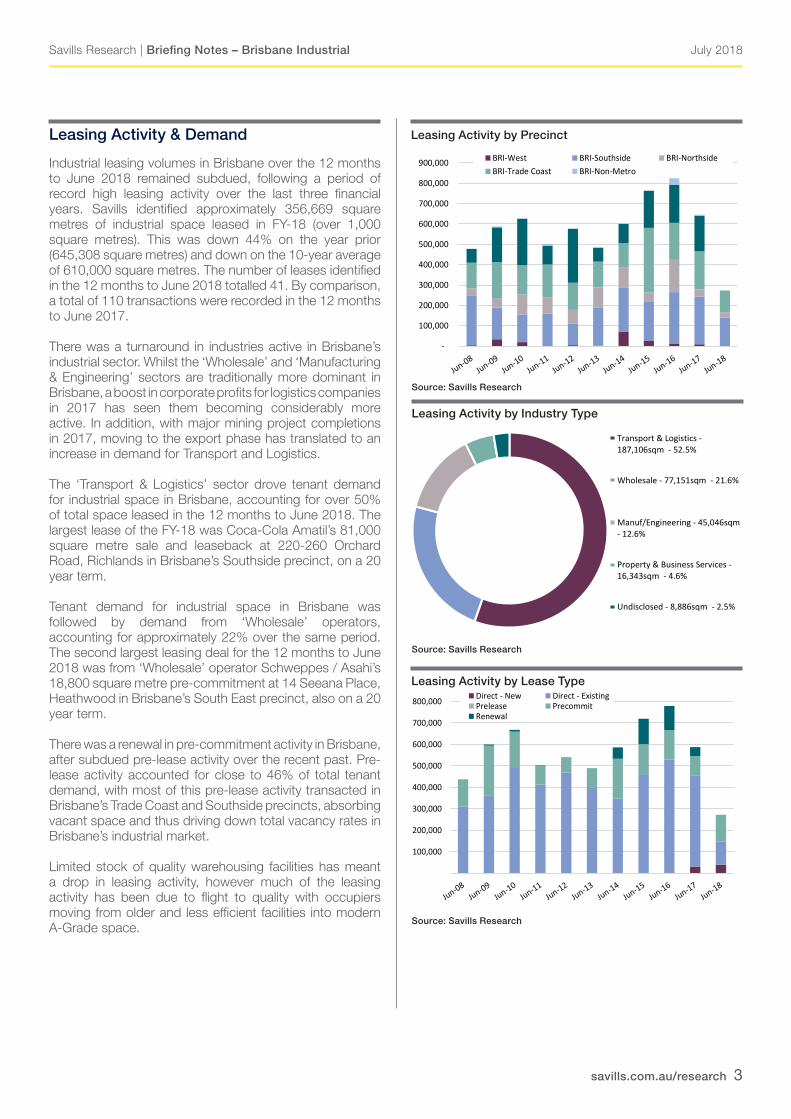
Transport & Logistics -187,106sqm - 52.5%
Wholesale - 77,151sqm - 21.6%
Manuf/Engineering - 45,046sqm- 12.6%
Property & Business Services -16,343sqm - 4.6%
Undisclosed - 8,886sqm - 2.5%
100,000
200,000
300,000
400,000
500,000
600,000
700,000
800,000 Direct - New Direct - ExistingPrelease PrecommitRenewal
Industrial leasing volumes in Brisbane over the 12 months to June 2018 remained subdued, following a period of record high leasing activity over the last three financial years. Savills identified approximately 356,669 square metres of industrial space leased in FY-18 (over 1,000 square metres). This was down 44% on the year prior (645,308 square metres) and down on the 10-year average of 610,000 square metres. The number of leases identified in the 12 months to June 2018 totalled 41. By comparison, a total of 110 transactions were recorded in the 12 months to June 2017.
There was a turnaround in industries active in Brisbane’s industrial sector. Whilst the ‘Wholesale’ and ‘Manufacturing & Engineering’ sectors are traditionally more dominant in Brisbane, a boost in corporate profits for logistics companies in 2017 has seen them becoming considerably more active. In addition, with major mining project completions in 2017, moving to the export phase has translated to an increase in demand for Transport and Logistics.
The ‘Transport & Logistics’ sector drove tenant demand for industrial space in Brisbane, accounting for over 50% of total space leased in the 12 months to June 2018. The largest lease of the FY-18 was Coca-Cola Amatil’s 81,000 square metre sale and leaseback at 220-260 Orchard Road, Richlands in Brisbane’s Southside precinct, on a 20 year term.
Tenant demand for industrial space in Brisbane was followed by demand from ‘Wholesale’ operators, accounting for approximately 22% over the same period. The second largest leasing deal for the 12 months to June 2018 was from ‘Wholesale’ operator Schweppes / Asahi’s 18,800 square metre pre-commitment at 14 Seeana Place, Heathwood in Brisbane’s South East precinct, also on a 20 year term.
There was a renewal in pre-commitment activity in Brisbane, after subdued pre-lease activity over the recent past. Pre-lease activity accounted for close to 46% of total tenant demand, with most of this pre-lease activity transacted in Brisbane’s Trade Coast and Southside precincts, absorbing vacant space and thus driving down total vacancy rates in Brisbane’s industrial market.
Limited stock of quality warehousing facilities has meant a drop in leasing activity, however much of the leasing activity has been due to flight to quality with occupiers moving from older and less efficient facilities into modern A-Grade space.
Source: Savills Research
-
100,000
200,000
300,000
400,000
500,000
600,000
700,000
800,000
900,000 BRI-West BRI-Southside BRI-NorthsideBRI-Trade Coast BRI-Non-Metro
Transport & Logistics -187,106sqm - 52.5%
Wholesale - 77,151sqm - 21.6%
Manuf/Engineering - 45,046sqm- 12.6%
Property & Business Services -16,343sqm - 4.6%
Undisclosed - 8,886sqm - 2.5%
100,000
200,000
300,000
400,000
500,000
600,000
700,000
800,000 Direct - New Direct - ExistingPrelease PrecommitRenewal
Leasing Activity by Lease Type
Source: Savills Research
Leasing Activity by Precinct
Leasing Activity by Industry Type
Source: Savills Research
-
100,000
200,000
300,000
400,000
500,000
600,000
700,000
800,000
900,000 BRI-West BRI-Southside BRI-NorthsideBRI-Trade Coast BRI-Non-Metro
Transport & Logistics -187,106sqm - 52.5%
Wholesale - 77,151sqm - 21.6%
Manuf/Engineering - 45,046sqm- 12.6%
Property & Business Services -16,343sqm - 4.6%
Undisclosed - 8,886sqm - 2.5%
100,000
200,000
300,000
400,000
500,000
600,000
700,000
800,000 Direct - New Direct - ExistingPrelease PrecommitRenewal
Leasing Activity & Demand
July 2018
savills.com.au/research 4
Savills Research | Briefing Notes – Brisbane Industrial
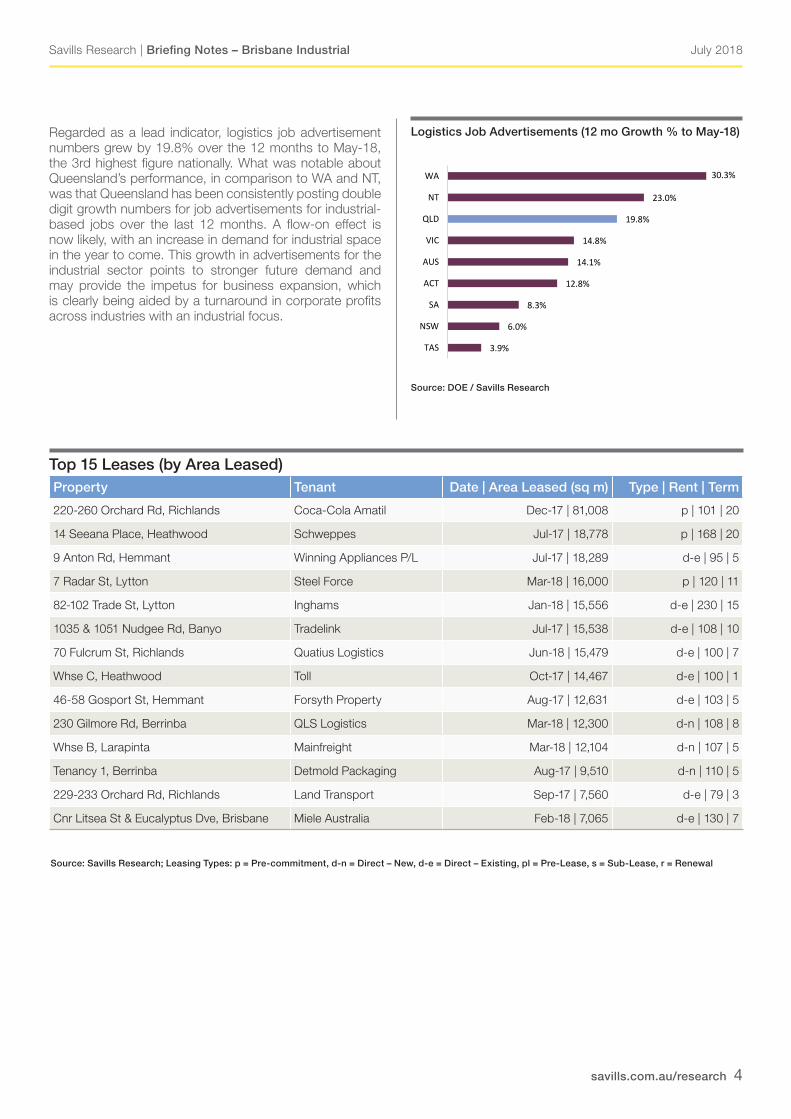
Regarded as a lead indicator, logistics job advertisement numbers grew by 19.8% over the 12 months to May-18, the 3rd highest figure nationally. What was notable about Queensland’s performance, in comparison to WA and NT, was that Queensland has been consistently posting double digit growth numbers for job advertisements for industrial-based jobs over the last 12 months. A flow-on effect is now likely, with an increase in demand for industrial space in the year to come. This growth in advertisements for the industrial sector points to stronger future demand and may provide the impetus for business expansion, which is clearly being aided by a turnaround in corporate profits across industries with an industrial focus.
Top 15 Leases (by Area Leased)Property Tenant Date | Area Leased (sq m) Type | Rent | Term
220-260 Orchard Rd, Richlands Coca-Cola Amatil Dec-17 | 81,008 p | 101 | 20
14 Seeana Place, Heathwood Schweppes Jul-17 | 18,778 p | 168 | 20
9 Anton Rd, Hemmant Winning Appliances P/L Jul-17 | 18,289 d-e | 95 | 5
7 Radar St, Lytton Steel Force Mar-18 | 16,000 p | 120 | 11
82-102 Trade St, Lytton Inghams Jan-18 | 15,556 d-e | 230 | 15
1035 & 1051 Nudgee Rd, Banyo Tradelink Jul-17 | 15,538 d-e | 108 | 10
70 Fulcrum St, Richlands Quatius Logistics Jun-18 | 15,479 d-e | 100 | 7
Whse C, Heathwood Toll Oct-17 | 14,467 d-e | 100 | 1
46-58 Gosport St, Hemmant Forsyth Property Aug-17 | 12,631 d-e | 103 | 5
230 Gilmore Rd, Berrinba QLS Logistics Mar-18 | 12,300 d-n | 108 | 8
Whse B, Larapinta Mainfreight Mar-18 | 12,104 d-n | 107 | 5
Tenancy 1, Berrinba Detmold Packaging Aug-17 | 9,510 d-n | 110 | 5
229-233 Orchard Rd, Richlands Land Transport Sep-17 | 7,560 d-e | 79 | 3
Cnr Litsea St & Eucalyptus Dve, Brisbane Miele Australia Feb-18 | 7,065 d-e | 130 | 7
3.9%
6.0%
8.3%
12.8%
14.1%
14.8%
19.8%
23.0%
30.3%
TAS
NSW
SA
ACT
AUS
VIC
QLD
NT
WA
Source: DOE / Savills Research
Logistics Job Advertisements (12 mo Growth % to May-18)
Source: Savills Research; Leasing Types: p = Pre-commitment, d-n = Direct – New, d-e = Direct – Existing, pl = Pre-Lease, s = Sub-Lease, r = Renewal
July 2018
savills.com.au/research 5
Savills Research | Briefing Notes – Brisbane Industrial
Rents
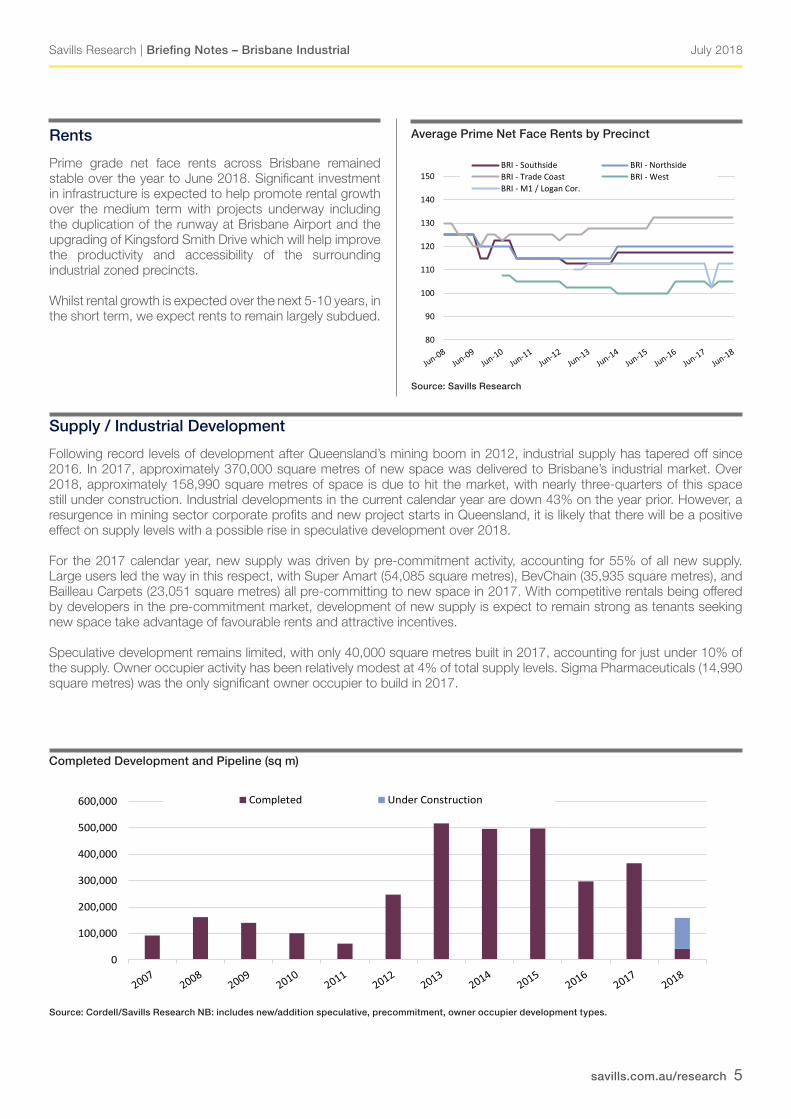
Prime grade net face rents across Brisbane remained stable over the year to June 2018. Significant investment in infrastructure is expected to help promote rental growth over the medium term with projects underway including the duplication of the runway at Brisbane Airport and the upgrading of Kingsford Smith Drive which will help improve the productivity and accessibility of the surrounding industrial zoned precincts.
Whilst rental growth is expected over the next 5-10 years, in the short term, we expect rents to remain largely subdued.
Whilst rental growth is expected over the next 5-10 years, in the short term, we expect rents to remain largely subdued. 80
90
100
110
120
130
140
150BRI - Southside BRI - NorthsideBRI - Trade Coast BRI - WestBRI - M1 / Logan Cor.
0
100,000
200,000
300,000
400,000
500,000
600,000 Completed Under Construction
Average Prime Net Face Rents by Precinct
Source: Savills Research
Following record levels of development after Queensland’s mining boom in 2012, industrial supply has tapered off since 2016. In 2017, approximately 370,000 square metres of new space was delivered to Brisbane’s industrial market. Over 2018, approximately 158,990 square metres of space is due to hit the market, with nearly three-quarters of this space still under construction. Industrial developments in the current calendar year are down 43% on the year prior. However, a resurgence in mining sector corporate profits and new project starts in Queensland, it is likely that there will be a positive effect on supply levels with a possible rise in speculative development over 2018.
For the 2017 calendar year, new supply was driven by pre-commitment activity, accounting for 55% of all new supply. Large users led the way in this respect, with Super Amart (54,085 square metres), BevChain (35,935 square metres), and Bailleau Carpets (23,051 square metres) all pre-committing to new space in 2017. With competitive rentals being offered by developers in the pre-commitment market, development of new supply is expect to remain strong as tenants seeking new space take advantage of favourable rents and attractive incentives.
Speculative development remains limited, with only 40,000 square metres built in 2017, accounting for just under 10% of the supply. Owner occupier activity has been relatively modest at 4% of total supply levels. Sigma Pharmaceuticals (14,990 square metres) was the only significant owner occupier to build in 2017.
Supply / Industrial Development
Whilst rental growth is expected over the next 5-10 years, in the short term, we expect rents to remain largely subdued. 80
90
100
110
120
130
140
150BRI - Southside BRI - NorthsideBRI - Trade Coast BRI - WestBRI - M1 / Logan Cor.
0
100,000
200,000
300,000
400,000
500,000
600,000 Completed Under Construction
Completed Development and Pipeline (sq m)
Source: Cordell/Savills Research NB: includes new/addition speculative, precommitment, owner occupier development types.
July 2018
savills.com.au/research 6
Savills Research | Briefing Notes – Brisbane Industrial
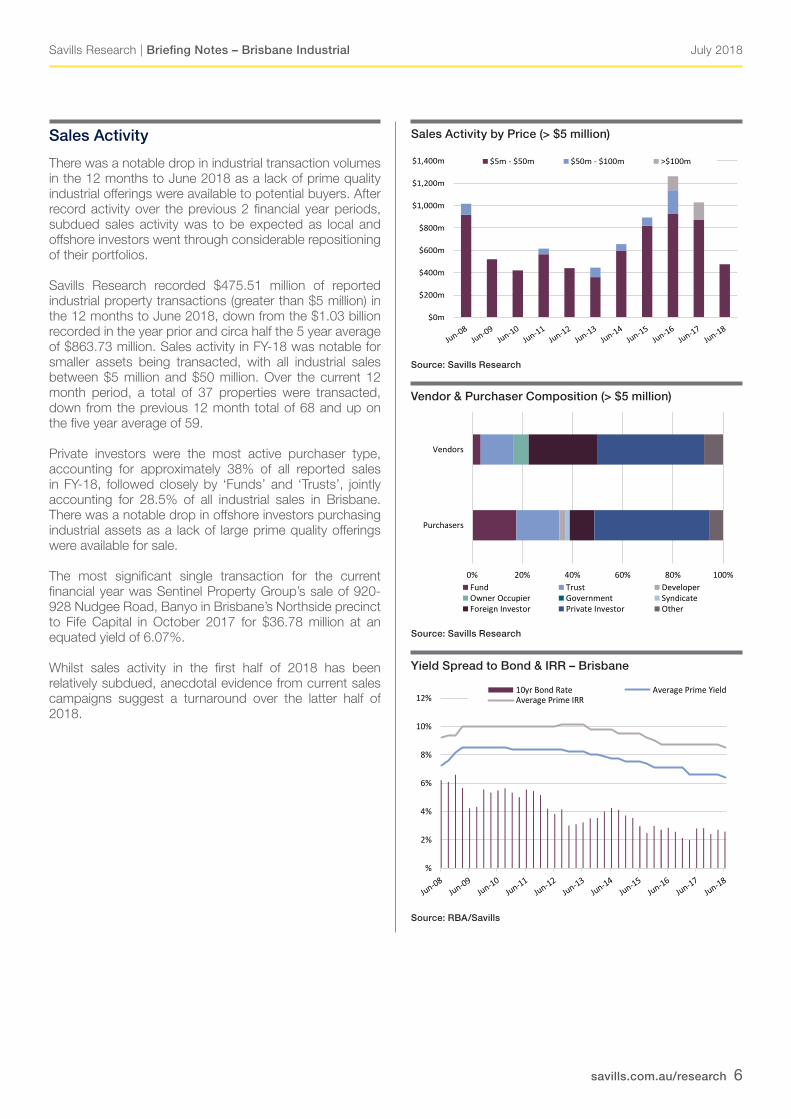
There was a notable drop in industrial transaction volumes in the 12 months to June 2018 as a lack of prime quality industrial offerings were available to potential buyers. After record activity over the previous 2 financial year periods, subdued sales activity was to be expected as local and offshore investors went through considerable repositioning of their portfolios.
Savills Research recorded $475.51 million of reported industrial property transactions (greater than $5 million) in the 12 months to June 2018, down from the $1.03 billion recorded in the year prior and circa half the 5 year average of $863.73 million. Sales activity in FY-18 was notable for smaller assets being transacted, with all industrial sales between $5 million and $50 million. Over the current 12 month period, a total of 37 properties were transacted, down from the previous 12 month total of 68 and up on the five year average of 59.
Private investors were the most active purchaser type, accounting for approximately 38% of all reported sales in FY-18, followed closely by ‘Funds’ and ‘Trusts’, jointly accounting for 28.5% of all industrial sales in Brisbane. There was a notable drop in offshore investors purchasing industrial assets as a lack of large prime quality offerings were available for sale.
The most significant single transaction for the current financial year was Sentinel Property Group’s sale of 920-928 Nudgee Road, Banyo in Brisbane’s Northside precinct to Fife Capital in October 2017 for $36.78 million at an equated yield of 6.07%.
Whilst sales activity in the first half of 2018 has been relatively subdued, anecdotal evidence from current sales campaigns suggest a turnaround over the latter half of 2018.
$0m
$200m
$400m
$600m
$800m
$1,000m
$1,200m
$1,400m $5m - $50m $50m - $100m >$100m
0% 20% 40% 60% 80% 100%
Purchasers
Vendors
Fund Trust DeveloperOwner Occupier Government SyndicateForeign Investor Private Investor Other
%
2%
4%
6%
8%
10%
12%10yr Bond Rate Average Prime YieldAverage Prime IRR
Source: Savills Research
Yield Spread to Bond & IRR – Brisbane
$0m
$200m
$400m
$600m
$800m
$1,000m
$1,200m
$1,400m $5m - $50m $50m - $100m >$100m
0% 20% 40% 60% 80% 100%
Purchasers
Vendors
Fund Trust DeveloperOwner Occupier Government SyndicateForeign Investor Private Investor Other
%
2%
4%
6%
8%
10%
12%10yr Bond Rate Average Prime YieldAverage Prime IRR
$0m
$200m
$400m
$600m
$800m
$1,000m
$1,200m
$1,400m $5m - $50m $50m - $100m >$100m
0% 20% 40% 60% 80% 100%
Purchasers
Vendors
Fund Trust DeveloperOwner Occupier Government SyndicateForeign Investor Private Investor Other
%
2%
4%
6%
8%
10%
12%10yr Bond Rate Average Prime YieldAverage Prime IRR
Sales Activity by Price (> $5 million)
Source: Savills Research
Vendor & Purchaser Composition (> $5 million)
Source: RBA/Savills
Sales Activity
July 2018
savills.com.au/research 7
Savills Research | Briefing Notes – Brisbane Industrial
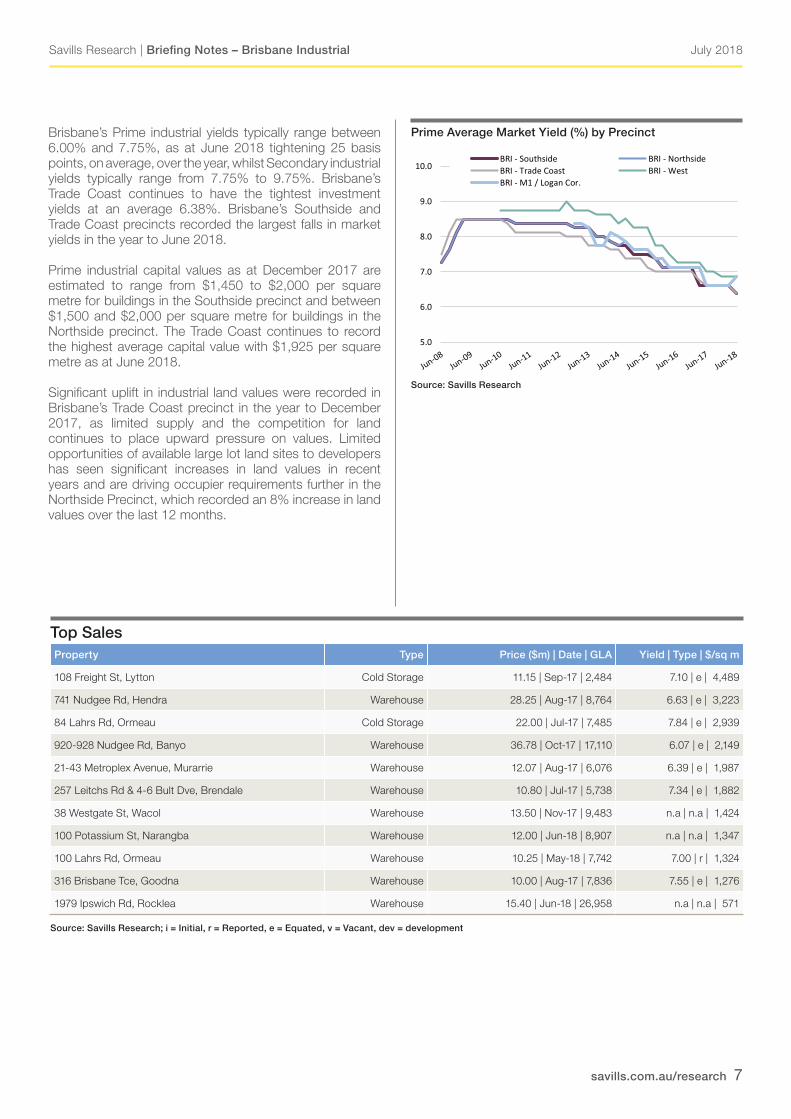
Brisbane’s Prime industrial yields typically range between 6.00% and 7.75%, as at June 2018 tightening 25 basis points, on average, over the year, whilst Secondary industrial yields typically range from 7.75% to 9.75%. Brisbane’s Trade Coast continues to have the tightest investment yields at an average 6.38%. Brisbane’s Southside and Trade Coast precincts recorded the largest falls in market yields in the year to June 2018.
Prime industrial capital values as at December 2017 are estimated to range from $1,450 to $2,000 per square metre for buildings in the Southside precinct and between $1,500 and $2,000 per square metre for buildings in the Northside precinct. The Trade Coast continues to record the highest average capital value with $1,925 per square metre as at June 2018.
Significant uplift in industrial land values were recorded in Brisbane’s Trade Coast precinct in the year to December 2017, as limited supply and the competition for land continues to place upward pressure on values. Limited opportunities of available large lot land sites to developers has seen significant increases in land values in recent years and are driving occupier requirements further in the Northside Precinct, which recorded an 8% increase in land values over the last 12 months.
Source: Savills Research
Prime Average Market Yield (%) by Precinct
Property Type Price ($m) | Date | GLA Yield | Type | $/sq m
108 Freight St, Lytton Cold Storage 11.15 | Sep-17 | 2,484 7.10 | e | 4,489
741 Nudgee Rd, Hendra Warehouse 28.25 | Aug-17 | 8,764 6.63 | e | 3,223
84 Lahrs Rd, Ormeau Cold Storage 22.00 | Jul-17 | 7,485 7.84 | e | 2,939
920-928 Nudgee Rd, Banyo Warehouse 36.78 | Oct-17 | 17,110 6.07 | e | 2,149
21-43 Metroplex Avenue, Murarrie Warehouse 12.07 | Aug-17 | 6,076 6.39 | e | 1,987
257 Leitchs Rd & 4-6 Bult Dve, Brendale Warehouse 10.80 | Jul-17 | 5,738 7.34 | e | 1,882
38 Westgate St, Wacol Warehouse 13.50 | Nov-17 | 9,483 n.a | n.a | 1,424
100 Potassium St, Narangba Warehouse 12.00 | Jun-18 | 8,907 n.a | n.a | 1,347
100 Lahrs Rd, Ormeau Warehouse 10.25 | May-18 | 7,742 7.00 | r | 1,324
316 Brisbane Tce, Goodna Warehouse 10.00 | Aug-17 | 7,836 7.55 | e | 1,276
1979 Ipswich Rd, Rocklea Warehouse 15.40 | Jun-18 | 26,958 n.a | n.a | 571
Top Sales
Source: Savills Research; i = Initial, r = Reported, e = Equated, v = Vacant, dev = development
5.0
6.0
7.0
8.0
9.0
10.0BRI - Southside BRI - NorthsideBRI - Trade Coast BRI - WestBRI - M1 / Logan Cor.
July 2018
savills.com.au/research 8
Savills Research | Briefing Notes – Brisbane Industrial
The Kingsford Smith Drive Upgrade connects Brisbane CBD to the Port of Brisbane and Australia Trade Coast. The project will involve the widening of Kingsford Smith Drive from four to six lanes between Theodore Street at Eagle Farm and Cooksley Street at Hamilton and road improvement works between Cooksley Street and Breakfast Creek Road at Albion. It will also include cycling and pedestrian facilities and public transport options. The project is to be completed over five stages with the initial works on the $650 million project commencing in mid-2016. The project is anticipated to be completed in 2019.
Benefiting Brisbane’s South Eastern precinct, upgrades to major Logan Motor are underway, the $512 million Logan Enhancement Project includes widening sections of the Logan and Gateway Extension motorways, improving key congestion hot spots (Logan Motorway/Mt Lindesay Highway/Beaudesert Road interchange and the Wembley Road/Logan Motorway interchange) and constructing new south-facing on and off-ramps on the Gateway Extension Motorway at Compton Road.
Project Est. Cost Status Completion
Logan Enhancement Project $512m U/C 2019
Kingsford Smith Drive Upgrade $650m U/C 2019
Gateway North Upgrade $1.14bn U/C 2018
Inland Rail $9.3bn Planning 2025
Key Infrastructure Project Summary - Brisbane
Inland Rail is a proposed 1,700 kilometre rail freight route between Melbourne and Brisbane via regional Victoria, New South Wales and Queensland. It is to be constructed by Australian Rail Track Corporation Ltd (ARTC). The development of the rail route will include 700 kilometres of existing track, upgrade of 400 kilometres of track and construction of 600 kilometres of track. The Australian Government, through the Australian Rail Track Corporation (ARTC), is delivering the multi-billion dollar infrastructure project in partnership with the private sector. The Government has committed $8.4 billion, on top of the previously funded $900 million. Works will commence in 2017, and based on the 10-year delivery schedule developed in 2015, the first train is expected to operate in 2024-25.
Outlook
While infrastructure projects have remained in the planning stage for some time now, 2017 saw the start of some significant projects get underway – creating employment opportunities and increased demand in construction and thus the industrial sector. The approval of the Logan Enhancement Project will mean safer and greater efficiency of one of Southeast Queensland’s major arterial road networks; and the beginning of the Queens Wharf project is set to provide a much needed boost to both business and consumer confidence.
Major infrastructure projects will also benefit industrial precincts, such as the duplication of Kingsford Smith Drive which will greatly improve traffic flow, providing more efficient access to Brisbane Airport and the Trade Coast industrial precinct.
Institutional industrial land owners are recognising the recent lift in leasing demand – particularly in well located locations close to major arterial roads, which is seeing speculative developments coming back to the forefront. Demand for such developments is evident from the low leasing periods seen over 2017 – 7 months average time on market, with 30% fully leased prior to completion.
While both leasing and sales activity were down compared to the previous year, it is expected that 2018 will continue the trend of strengthening tenant and buyer demand, as indicated by industrial job advertisement growth in Queensland now the third highest nationally.
Source: QLD-Department of Infrastructure, Local Government and Planning
Infrastructure
July 2018
savills.com.au/research 9
Savills Research | Briefing Notes – Brisbane Industrial
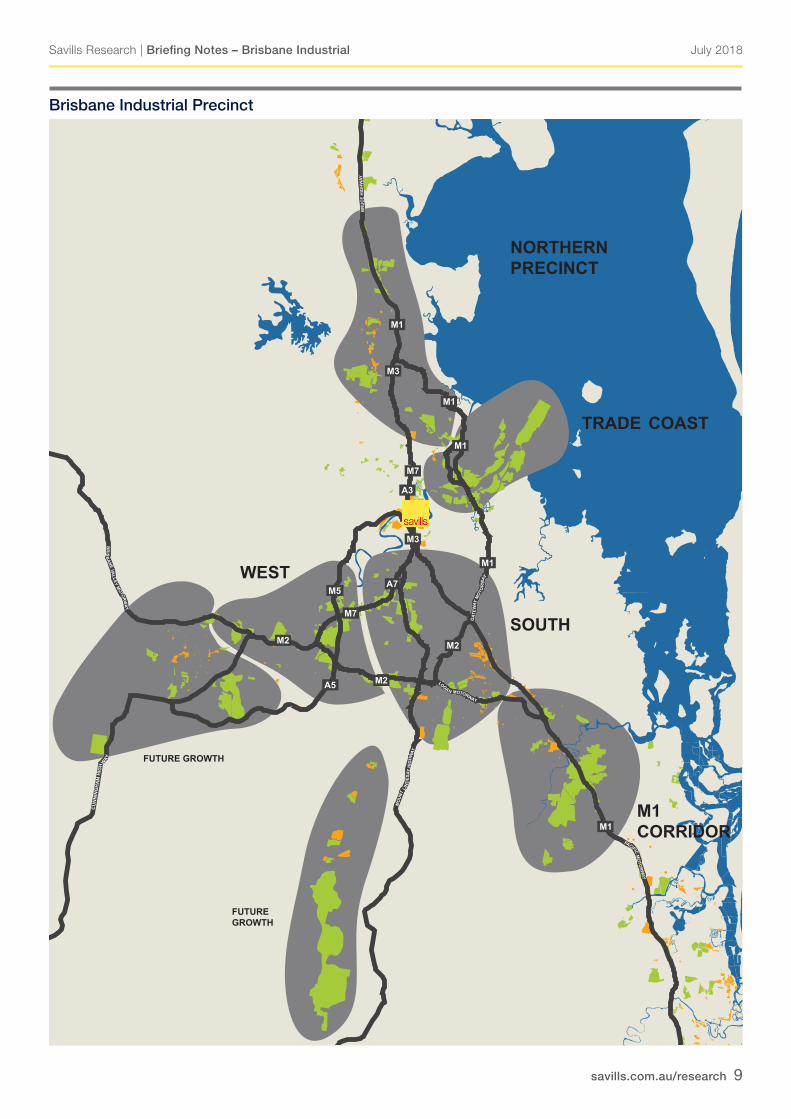
Brisbane Industrial Precinct
PACIFIC MO
TORW
AY
MO
UNT
LIN
DES
AY H
IGHW
AY
M1 CORRIDOR
NORTHERNPRECINCT
SOUTH
TRADE COAST
FUTUREGROWTH
FUTURE GROWTH
WEST
GAT
EWAY
MOT
OR
WAY
BR
ISBANE
VALLEY M
OTORWA
Y
CUNN
ING
HAM
HIG
H WAY
LOGAN MOTORWAY
BR
UC
E H
IGH
WAY
M2
M2
M7
A7
A5
M5
M3
M7
A3
M3
M1
M1
M2
M1
M1
M1
M1

July 2018
savills.com.au/research 10
Savills Research | Briefing Notes – Brisbane Industrial
July 2018
savills.com.au/research 11
Savills Research | Briefing Notes – Brisbane Industrial
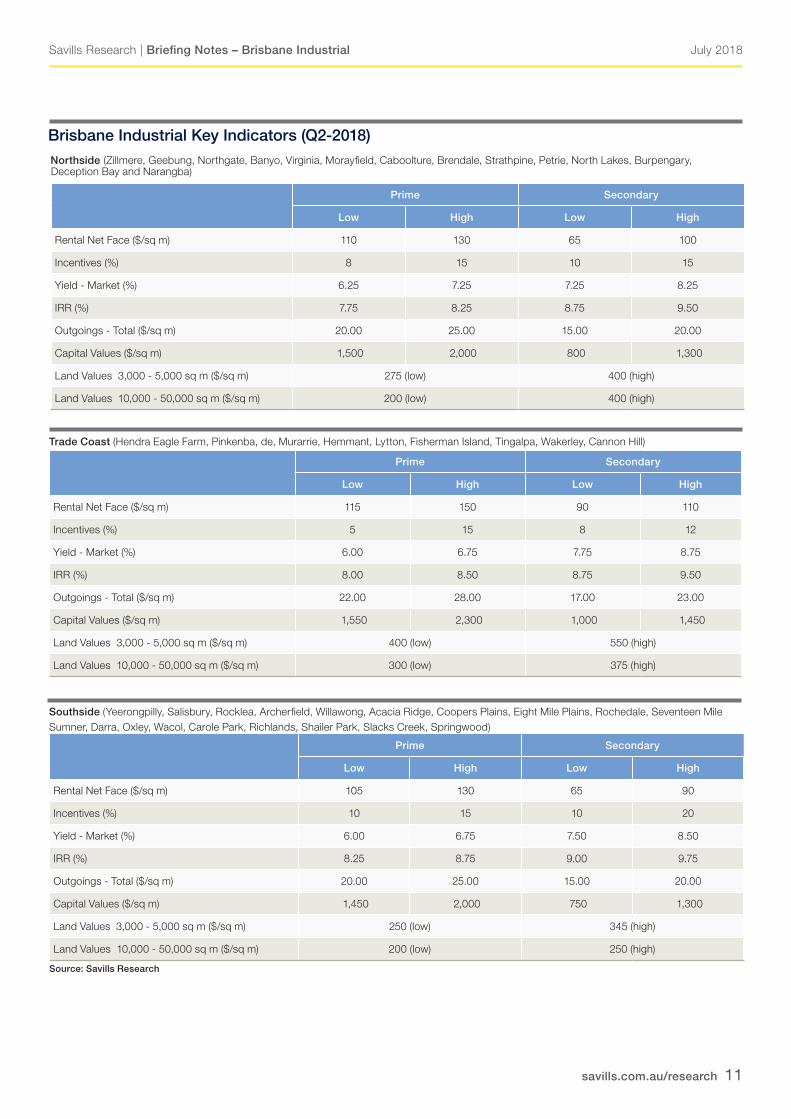
Brisbane Industrial Key Indicators (Q2-2018) Northside (Zillmere, Geebung, Northgate, Banyo, Virginia, Morayfield, Caboolture, Brendale, Strathpine, Petrie, North Lakes, Burpengary, Deception Bay and Narangba)
Prime Secondary
Low High Low High
Rental Net Face ($/sq m) 110 130 65 100
Incentives (%) 8 15 10 15
Yield - Market (%) 6.25 7.25 7.25 8.25
IRR (%) 7.75 8.25 8.75 9.50
Outgoings - Total ($/sq m) 20.00 25.00 15.00 20.00
Capital Values ($/sq m) 1,500 2,000 800 1,300
Land Values 3,000 - 5,000 sq m ($/sq m) 275 (low) 400 (high)
Land Values 10,000 - 50,000 sq m ($/sq m) 200 (low) 400 (high)
Trade Coast (Hendra Eagle Farm, Pinkenba, de, Murarrie, Hemmant, Lytton, Fisherman Island, Tingalpa, Wakerley, Cannon Hill)
Prime Secondary
Low High Low High
Rental Net Face ($/sq m) 115 150 90 110
Incentives (%) 5 15 8 12
Yield - Market (%) 6.00 6.75 7.75 8.75
IRR (%) 8.00 8.50 8.75 9.50
Outgoings - Total ($/sq m) 22.00 28.00 17.00 23.00
Capital Values ($/sq m) 1,550 2,300 1,000 1,450
Land Values 3,000 - 5,000 sq m ($/sq m) 400 (low) 550 (high)
Land Values 10,000 - 50,000 sq m ($/sq m) 300 (low) 375 (high)
Prime Secondary
Low High Low High
Rental Net Face ($/sq m) 105 130 65 90
Incentives (%) 10 15 10 20
Yield - Market (%) 6.00 6.75 7.50 8.50
IRR (%) 8.25 8.75 9.00 9.75
Outgoings - Total ($/sq m) 20.00 25.00 15.00 20.00
Capital Values ($/sq m) 1,450 2,000 750 1,300
Land Values 3,000 - 5,000 sq m ($/sq m) 250 (low) 345 (high)
Land Values 10,000 - 50,000 sq m ($/sq m) 200 (low) 250 (high)
Southside (Yeerongpilly, Salisbury, Rocklea, Archerfield, Willawong, Acacia Ridge, Coopers Plains, Eight Mile Plains, Rochedale, Seventeen Mile Sumner, Darra, Oxley, Wacol, Carole Park, Richlands, Shailer Park, Slacks Creek, Springwood)
Source: Savills Research
July 2018
savills.com.au/research 12
Savills Research | Briefing Notes – Brisbane Industrial
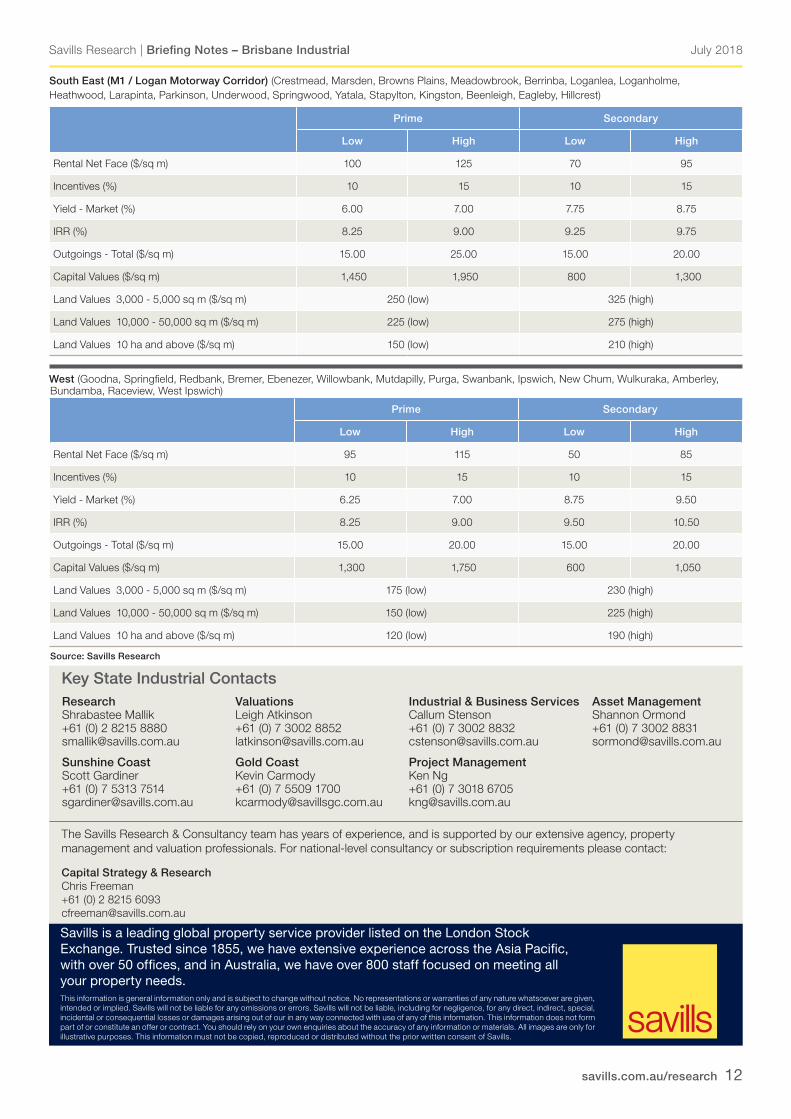
South East (M1 / Logan Motorway Corridor) (Crestmead, Marsden, Browns Plains, Meadowbrook, Berrinba, Loganlea, Loganholme, Heathwood, Larapinta, Parkinson, Underwood, Springwood, Yatala, Stapylton, Kingston, Beenleigh, Eagleby, Hillcrest)
Prime Secondary
Low High Low High
Rental Net Face ($/sq m) 100 125 70 95
Incentives (%) 10 15 10 15
Yield - Market (%) 6.00 7.00 7.75 8.75
IRR (%) 8.25 9.00 9.25 9.75
Outgoings - Total ($/sq m) 15.00 25.00 15.00 20.00
Capital Values ($/sq m) 1,450 1,950 800 1,300
Land Values 3,000 - 5,000 sq m ($/sq m) 250 (low) 325 (high)
Land Values 10,000 - 50,000 sq m ($/sq m) 225 (low) 275 (high)
Land Values 10 ha and above ($/sq m) 150 (low) 210 (high)
West (Goodna, Springfield, Redbank, Bremer, Ebenezer, Willowbank, Mutdapilly, Purga, Swanbank, Ipswich, New Chum, Wulkuraka, Amberley, Bundamba, Raceview, West Ipswich)
Prime Secondary
Low High Low High
Rental Net Face ($/sq m) 95 115 50 85
Incentives (%) 10 15 10 15
Yield - Market (%) 6.25 7.00 8.75 9.50
IRR (%) 8.25 9.00 9.50 10.50
Outgoings - Total ($/sq m) 15.00 20.00 15.00 20.00
Capital Values ($/sq m) 1,300 1,750 600 1,050
Land Values 3,000 - 5,000 sq m ($/sq m) 175 (low) 230 (high)
Land Values 10,000 - 50,000 sq m ($/sq m) 150 (low) 225 (high)
Land Values 10 ha and above ($/sq m) 120 (low) 190 (high)
Source: Savills Research
Research Shrabastee Mallik +61 (0) 2 8215 8880 [email protected]
Sunshine Coast Scott Gardiner +61 (0) 7 5313 7514 [email protected]
Valuations Leigh Atkinson +61 (0) 7 3002 8852 [email protected]
Gold Coast Kevin Carmody +61 (0) 7 5509 1700 [email protected]
Industrial & Business Services Callum Stenson +61 (0) 7 3002 8832 [email protected]
Project Management Ken Ng +61 (0) 7 3018 6705 [email protected]
Asset Management Shannon Ormond +61 (0) 7 3002 8831 [email protected]
The Savills Research & Consultancy team has years of experience, and is supported by our extensive agency, property management and valuation professionals. For national-level consultancy or subscription requirements please contact:
Capital Strategy & Research Chris Freeman +61 (0) 2 8215 6093 [email protected]
This information is general information only and is subject to change without notice. No representations or warranties of any nature whatsoever are given, intended or implied. Savills will not be liable for any omissions or errors. Savills will not be liable, including for negligence, for any direct, indirect, special, incidental or consequential losses or damages arising out of our in any way connected with use of any of this information. This information does not form part of or constitute an offer or contract. You should rely on your own enquiries about the accuracy of any information or materials. All images are only for illustrative purposes. This information must not be copied, reproduced or distributed without the prior written consent of Savills.
Savills is a leading global property service provider listed on the London Stock Exchange. Trusted since 1855, we have extensive experience across the Asia Pacific, with over 50 offices, and in Australia, we have over 800 staff focused on meeting all your property needs.
Key State Industrial Contacts