bridging your expectations - stefanutti stocks
TRANSCRIPT

Bridging your expectationsAnnual Report for the year ended 28 February 2011
Definitions
“Apollo” Apollo E&I Construction (Pty) Limited, an
electrical and instrumentation company
purchased on 1 June 2010 and forming part of
the Mechanical, Electrical & Power business unit
“B-BBEE” Broad-based black economic empowerment
“Companies Act” or
“2008 Companies Act”
“1973 Companies Act”
Companies Act No 71 of 2008
Companies Act No 61 of 1973
“DIFR” Disabling Injury Frequency Rate
“EPCM” Engineer, procure, construct and manage
“GRI” Global Reporting Initiative
“IASB” International Accounting Standards Board
“IFRS” International Financial Reporting Standards
“JSE” JSE Limited
“King III Report” or
“King III”
King Report on Corporate Governance for
South Africa 2009
“Listings Requirements” Listings Requirements of the JSE
“LTIFR” Lost-time Injury Frequency Rate
“RGF” The operations of RGF Power Projects CC,
purchased on 12 April 2010 and forming part of
the Mechanical, Electrical & Power business unit
“SENS” Stock Exchange News Service
“Stefanutti Stocks”
or “the company”
Stefanutti Stocks Holdings Limited
“Stocks” Stefanutti Stocks (Pty) Limited (formerly Stocks
Limited)
“the board” The board of directors of Stefanutti Stocks
Holdings Limited
“the current year” The year ending 28 February 2012
“the group” Stefanutti Stocks Holdings Limited, its
subsidiaries and associates
“the previous or prior year” The year ended 28 February 2010
“the year” or “the year
under review”
The year ended 28 February 2011
“WACC” Weighted Average Cost of Capital
“WERM” Waste Energy Recovery and Management
(Pty) Limited, purchased on 3 August 2009
and forming part of the Mining Services
business unit
Key long-term goals
To become one of the leading construction groups
in South Africa
To become the preferred construction partner for
clients, government(s), joint venture partners, employees and prospective employees
and investors
To establish an unquestionable track record
of industry excellence
To establish a sustainable business presence in target
local and international markets
To sustain earnings growth, and at the same time,
maintain a sound financial position
To implement key non-financial objectives to
support the group’s growth strategy
Stefanutti Stocks / Annual Report 2011 / 1
Gro
up
at a
gla
nce
Man
ag
em
en
t revie
wO
pera
tion
al re
vie
wG
overn
an
ce
an
d
su
sta
inab
ilityF
inan
cia
l sta
tem
en
tsS
takeh
old
ers
’ info
rmatio
n
Contents
Directorate 6Executive committee 8Chairman’s report 10Chief Executive Officer’s report 12Chief Financial Officer’s report 16
Definitions IFCCompany profile 1Financial highlights 2Group overview 3Our milestones and achievements 4Key operations 4Vision, Mission, Values 5
Key disciplines 18Structures 18Roads & Earthworks 22Mining Services 26Mechanical, Electrical & Power 30Building 34
Corporate governance 39Remuneration and Nominations Committee report 49Sustainability 50Value added statement 67
Annual financial statements 68Directors’ responsibilities and approval 68Audit, Governance and Risk Committee report 69Declaration by Company Secretary 71Independent auditor’s report 72Directors’ report 73Statements of financial position 78Statements of comprehensive income 79Statements of changes in equity 80Statements of cash flows 82Accounting policies 83Notes to the annual financial statements 101Analysis of shareholders 148
Shareholders’ diary 149Notice of Annual General Meeting 150Form of proxy 155Notes to the form of proxy 156GRI index 157Corporate information IBC
The annual report covers the South African operations of Stefanutti Stocks and its business units for the financial reporting year ended 28 February 2011. Reporting on corporate responsibility issues is included in this report insofar as policy and governance is concerned in line with the King III Report and the GRI. Comments and queries can be addressed to [email protected].
Company profileListed on the JSE main board in the ‘Construction and
Materials – Heavy Construction’ sector, Stefanutti Stocks is
one of South Africa’s leading engineering and construction
groups with an annual turnover of R 7 billion. Offering highly
diversified services across the spectrum of engineering and
construction disciplines, the group has the capability to
deliver a range of projects of any scale.
Stefanutti Stocks boasts a Grade 9 rating from the
South African Construction Industry Development Board
(CIDB), ensuring unlimited tender capability.
The group operates across the private and public sectors
with clients spanning governments, parastatals and local
authorities, major mining houses, industry, large corporate
groups, financial institutions and property developers.
Stefanutti Stocks has a global workforce of 11 651 with
8 585 employees in South Africa, 2 727 across Africa
and 339 in the Middle East. Operating across four business
units, consistency and quality of performance are the key
thread of a common brand and strategy. The key disciplines
comprise: Structures, Roads & Earthworks, Mining
Services, Mechanical, Electrical & Power and Building.
With its headquarters in Kempton Park, Gauteng, Stefanutti
Stocks is active in South Africa and across sub-Saharan
Africa including Angola, Botswana, Malawi, Mozambique,
Sierra Leone, Swaziland and Zambia as well as in the
Middle East. Currently 23% of group turnover and 31% of
group operating profit is derived from operations outside
South Africa.
Strategic intentStefanutti Stocks strives to remain flexible, employing a
dynamic strategy to enable the group to adapt to the fast
changing and challenging business environment. Organic
growth, partnerships and acquisitions will be pursued as
and when appropriate, within and outside South Africa.
Stefanutti Stocks / Annual Report 2011 / 2
www.stefanuttistocks.comfor the year ended 28 February 2011
Financial highlights
Financial highlights
2011
R’000
2010
R’000
2009
R’000
2008
R’000
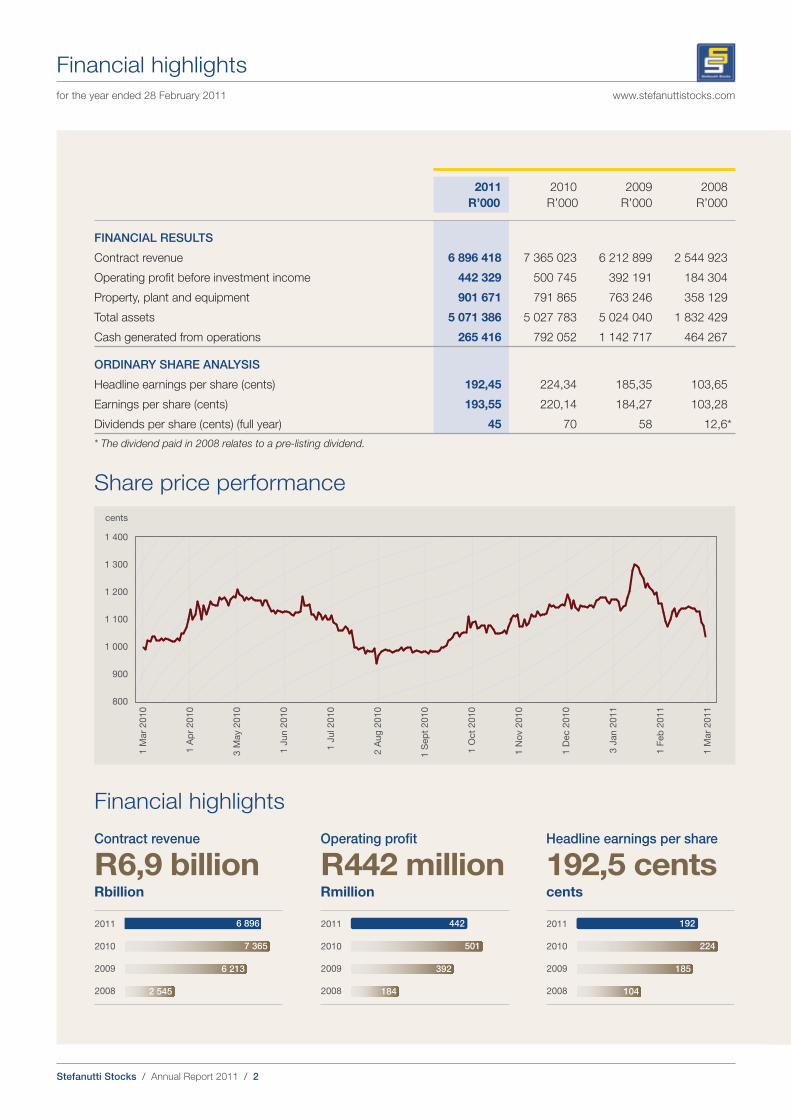
FINANCIAL RESULTS
Contract revenue 6 896 418 7 365 023 6 212 899 2 544 923
Operating profit before investment income 442 329 500 745 392 191 184 304
Property, plant and equipment 901 671 791 865 763 246 358 129
Total assets 5 071 386 5 027 783 5 024 040 1 832 429
Cash generated from operations 265 416 792 052 1 142 717 464 267
ORDINARY SHARE ANALYSIS
Headline earnings per share (cents) 192,45 224,34 185,35 103,65
Earnings per share (cents) 193,55 220,14 184,27 103,28
Dividends per share (cents) (full year) 45 70 58 12,6*
* The dividend paid in 2008 relates to a pre-listing dividend.
Share price performance
1 400
1 300
1 200
1 100
1 000
900
800
cents
1 M
ar
2010
1 A
pr
2010
3 M
ay 2
010
1 J
un 2
010
1 J
ul 2010
2 A
ug
2010
1 S
ep
t 2010
1 O
ct
2010
1 N
ov 2
010
1 D
ec 2
010
3 J
an 2
011
1 F
eb
2011
1 M
ar
2011
Contract revenue
R 6,9 billionRbillion
2011
2010
2009
2008
6 896
7 365
6 213
2 545
Operating profit
R 442 millionRmillion
2011
2010
2009
2008
442
501
392
184
Headline earnings per share
192,5 centscents
2011
2010
2009
2008
192
224
185
104

Stefanutti Stocks / Annual Report 2011 / 3
Gro
up
at a
gla
nce
Man
ag
em
en
t revie
wO
pera
tion
al re
vie
wG
overn
an
ce
an
d
su
sta
inab
ilityF
inan
cia
l sta
tem
en
tsS
takeh
old
ers
’ info
rmatio
n
Group overview
Structures
Business unit capabilities
Construction of➾ Mining infrastructure➾ Transport infrastructure and bridges➾ Fossil and renewable energy power
plants➾ Petrochemical plants and related
infrastructure➾ Bulk materials handling
infrastructure ➾ Marine infrastructure, ports and
harbours
➾ Heavy industrial plants and structures➾ Geotechnical construction, piling and lateral support➾ Effluent and water treatment plants➾ Structural rehabilitation, concrete repair and
waterproofing➾ Pipelines for water and other products and materials➾ Dams
Roads & Earthworks
Business unit capabilities
➾ Roads➾ Earthworks➾ Mining surface infrastructure➾ Industrial infrastructure plants➾ Township infrastructure➾ Transport infrastructure
Mining Services
Business unit capabilities
➾ Design, construction and operation of waste residue disposal and recovery facilities
➾ Hydraulic mining and dredging ➾ Bulk materials handling ➾ Coal discard and fines disposal and
recovery
➾ Open-pit contract mining➾ Drilling and blasting➾ Crushing and screening➾ Rehabilitation and closure
Building
Business unit capabilities
South Africa and Southern Africa➾ Healthcare facilities➾ Transport nodes➾ Retail and parkades➾ High rise residential➾ Housing➾ Office accommodation➾ Educational institutions➾ Stadia➾ Hotels and leisure
Middle East➾ Construction➾ Interior fit-out➾ Refurbishment➾ Electro-mechanical installations
Mechanical, Electrical & Power (MEP)
Business unit capabilities
➾ High voltage overhead line construction (11kV to 765kV)
➾ High voltage substation construction (11kV to 132kV)
➾ Fibre optic installation
Surface and underground➾ Supply, fabrication and erection of steel and platework➾ Electrical installation➾ Supply and installation of piping➾ Instrumentation and control installation
Stefanutti Stocks / Annual Report 2011 / 4
www.stefanuttistocks.com
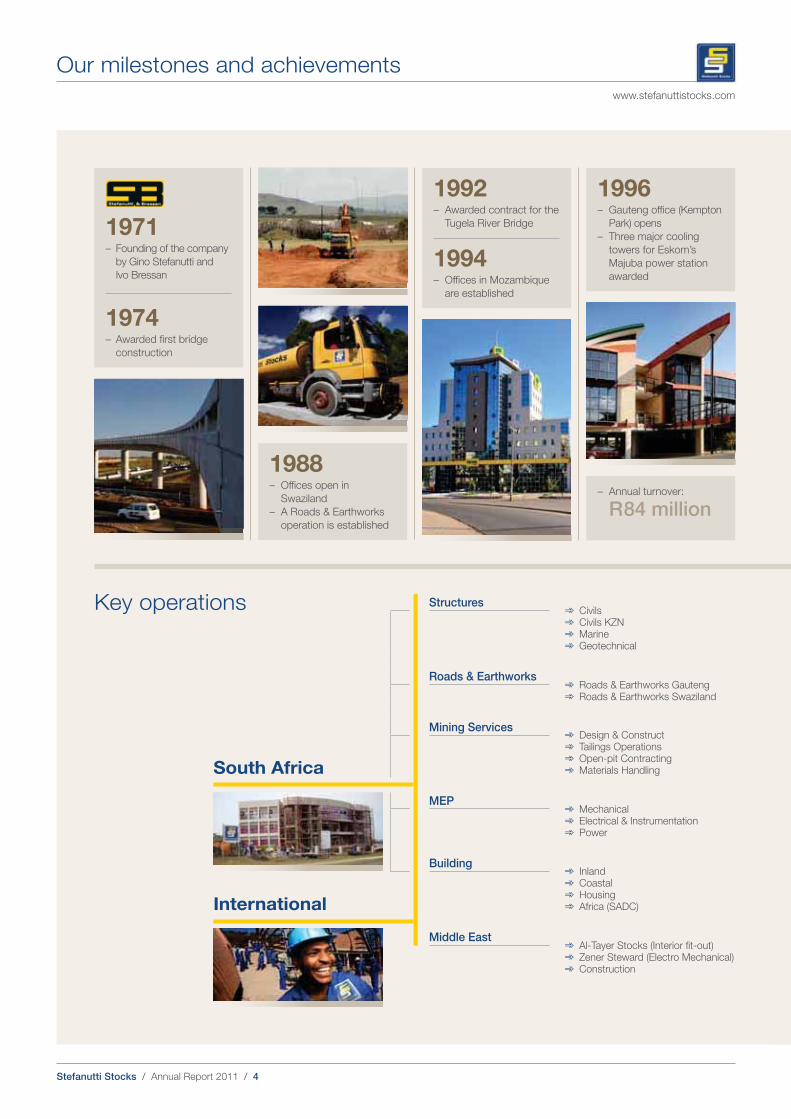
Our milestones and achievements
1971– Founding of the company
by Gino Stefanutti and
Ivo Bressan
1974– Awarded first bridge
construction
1988– Offices open in
Swaziland
– A Roads & Earthworks
operation is established
Structures➾ Civils➾ Civils KZN➾ Marine➾ Geotechnical
Roads & Earthworks➾ Roads & Earthworks Gauteng➾ Roads & Earthworks Swaziland
South Africa
Mining Services➾ Design & Construct➾ Tailings Operations➾ Open-pit Contracting➾ Materials Handling
MEP➾ Mechanical➾ Electrical & Instrumentation➾ Power
Building➾ Inland➾ Coastal➾ Housing➾ Africa (SADC)International
Middle East➾ Al-Tayer Stocks (Interior fit-out)➾ Zener Steward (Electro Mechanical)➾ Construction
Key operations
1992– Awarded contract for the
Tugela River Bridge
1994– Offices in Mozambique
are established
1996– Gauteng office (Kempton
Park) opens
– Three major cooling
towers for Eskom’s
Majuba power station
awarded
– Annual turnover:
R 84 million
Stefanutti Stocks / Annual Report 2011 / 5
Gro
up
at a
gla
nce
Man
ag
em
en
t revie
wO
pera
tion
al re
vie
wG
overn
an
ce
an
d
su
sta
inab
ilityF
inan
cia
l sta
tem
en
tsS
takeh
old
ers
’ info
rmatio
n
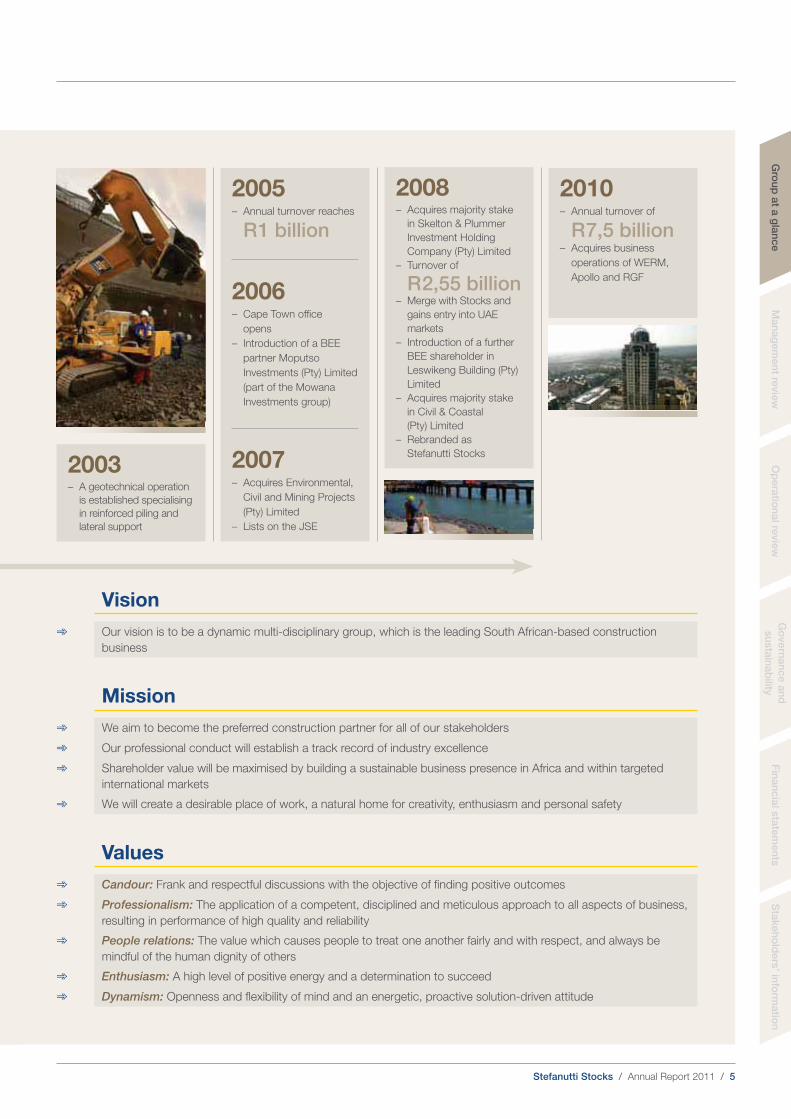
2008– Acquires majority stake
in Skelton & Plummer
Investment Holding
Company (Pty) Limited
– Turnover of
R 2,55 billion– Merge with Stocks and
gains entry into UAE
markets
– Introduction of a further
BEE shareholder in
Leswikeng Building (Pty)
Limited
– Acquires majority stake
in Civil & Coastal
(Pty) Limited
– Rebranded as
Stefanutti Stocks
2005– Annual turnover reaches
R 1 billion
2006– Cape Town office
opens
– Introduction of a BEE
partner Moputso
Investments (Pty) Limited
(part of the Mowana
Investments group)
2007– Acquires Environmental,
Civil and Mining Projects
(Pty) Limited
– Lists on the JSE
2010– Annual turnover of
R 7,5 billion– Acquires business
operations of WERM,
Apollo and RGF
Vision
➾ Our vision is to be a dynamic multi-disciplinary group, which is the leading South African-based construction
business
Mission
➾ We aim to become the preferred construction partner for all of our stakeholders
➾ Our professional conduct will establish a track record of industry excellence
➾ Shareholder value will be maximised by building a sustainable business presence in Africa and within targeted
international markets
➾ We will create a desirable place of work, a natural home for creativity, enthusiasm and personal safety
Values
➾ Candour: Frank and respectful discussions with the objective of finding positive outcomes
➾ Professionalism: The application of a competent, disciplined and meticulous approach to all aspects of business,
resulting in performance of high quality and reliability
➾ People relations: The value which causes people to treat one another fairly and with respect, and always be
mindful of the human dignity of others
➾ Enthusiasm: A high level of positive energy and a determination to succeed
➾ Dynamism: Openness and flexibility of mind and an energetic, proactive solution-driven attitude
2003– A geotechnical operation
is established specialising
in reinforced piling and
lateral support

Stefanutti Stocks / Annual Report 2011 / 6
www.stefanuttistocks.com
Directorate
Gino Stefanutti Kevin EborallBridgman Sithole Joseph Fizelle Herman Mashaba
Non-executive directors Biagino (Gino) Stefanutti (63)
Chairman and co-founder
National Diploma Civil Engineering
Appointed: April 1996
Gino has over 40 years’ experience in the
engineering and construction industry.
He co-founded Stefanutti Stocks as
Stefanutti & Bressan (Pty) Limited in 1971.
Bridgman Sithole (47)
Appointed: July 2007
Bridgman is currently executive chairman of
Mowana Investments (Pty) Limited, a black
empowerment investment holding company
invested in Stefanutti Stocks. Prior to joining
Mowana Investments in 2005, Bridgman had
been an executive director for Strategy &
Business Development at Business Connexion.
He has also held various senior positions within
the ANC, provincial governments and Absa
Bank Limited. Bridgman currently serves on the
boards of numerous private companies.
Joseph Fizelle (40)
Alternate to Bridgman Sithole
BCom, HDipPrAcc, CA (Ireland) Fellow of the
Irish Institute of Chartered Accountants
Appointed: July 2007
Joseph is an executive director of Mowana
Investments (Pty) Limited, a black
empowerment investment holding company
invested in Stefanutti Stocks. Prior to joining
Mowana Investments in 2004, Joseph was
employed in corporate finance at JP Morgan
and Standard Bank for a period of six years
and before that at PricewaterhouseCoopers.
He currently serves on the boards of numerous
private companies.
Independent non-executive directors Herman Mashaba (51)
Appointed: July 2008
Herman founded the cosmetics company Black
Like Me Products in 1984. He served as
non-executive chairman of Stocks Limited from
2005 until the merger with Stefanutti & Bressan
Holdings Limited in 2008. Following the merger
he was appointed as a non-executive director.
Herman is deputy non-executive chairman of
Growthpoint Properties Limited and is also the
chairman of the Institute of Directors in South
Africa and the executive chairman of his
investment company, Lephatsi Investments
(Pty) Limited.
Kevin Eborall (66)
Nat Dip Prod Eng (Industrial Eng)
Appointed: July 2007
Kevin graduated as an Industrial Engineer
in 1965. He has held senior management
positions at Dorbyl, ICL and Fraser Alexander.
Kevin has served on the boards of various
private and public companies and continues to
hold a number of directorships both in South
Africa and Australia. In addition Kevin provides
consulting services to companies in the mining
services and industrial sectors. He is the
chairman of Skygistics, an international satellite
communications company.
Nomhle Canca (45)
BA (Political Science), BA (Economics)
Appointed: July 2007
Nomhle has over 21 years’ experience in the
financial services industry, having started her
career as a stockbroker in Atlanta (USA) and
later registered with the New York Stock
Exchange. She is the co-founder of Women
Investment Portfolio Holdings (Wiphold) and
Women’s Development Bank (WDB). She is
currently group chief executive officer of One
Stone Capital. She has held various
directorships at private and parastatal
companies.
Nomhle Canca

Stefanutti Stocks / Annual Report 2011 / 7
Op
era
tion
al re
vie
wG
overn
an
ce
an
d
su
sta
inab
ilityF
inan
cia
l sta
tem
en
tsS
takeh
old
ers
’ info
rmatio
n
Mafika Mkwanazi (57)
Lead Independent Director
BSc (Maths), BSc (Electrical Engineering)
Appointed: July 2007
Mafika is currently the non-executive chairman
of Hulamin Limited and sits on the board of
SABS. He has previously worked in senior
positions at South African Breweries, Bristol
Myers (Pty) Limited as a production manager
for the consumer division and BMW as an
engine plant manager. Mafika has served on
the boards of various companies including
Nedbank Limited, Transnet (where he is serving
as non-executive chairman since 13 December
2010), Western Areas Limited, Industrial
Development Corporation, Letseng Diamonds
and Metrorail.
Executive directors Willem (Willie) Meyburgh (57)
Chief Executive Officer
National Diploma Civil Engineering, BCom
Appointed: April 1996
Willie has over 35 years’ experience in the
construction industry. With several large
projects under his belt, he has gained vast
experience across the full spectrum of
construction activities. Prior to joining Stefanutti
& Bressan Civils (Pty) Limited as managing
director in 1996 he held a number of executive
management positions for leading construction
companies in South Africa. Willie was
appointed to his present position of Chief
Executive Officer when the group listed in 2007.
Dermot Quinn (59)
Chief Financial Officer
BScEcon, CA(SA)
Appointed: November 2005
Dermot qualified as a chartered accountant in
1984 with audit firm Arthur Young. He joined
the group in 1992, after having spent five years
with Grovewalk Holdings Limited as chief
financial officer. He was appointed as Chief
Financial Officer of Stefanutti & Bressan (Pty)
Limited in 2000 and on the restructuring of the
group in 2005, was appointed to the group
board in the same capacity.
Stephen Pell (53)
Chief Operating Officer
BSc Building Management
Appointed: July 2008
Prior to joining Stocks in 2006, Stephen gained
extensive experience in the construction
markets in South Africa, Africa and the Middle
East particularly in the disciplines of building,
industrial civils and roads & earthworks. He
previously held the position of director of
Murray & Roberts Limited and managing
director of Murray & Roberts Construction. In
July 2007 he was appointed as Chief Executive
Officer of Stocks Limited. Following the merger
with Stefanutti & Bressan Holdings Limited in
2008 he was appointed an executive director
and later in 2010 was appointed Chief
Operating Officer of Stefanutti Stocks.
Schalk Ackerman (52)
BEng (Civil)
Appointed: March 2010
Schalk has over 30 years’ experience in the
civil engineering construction industry. Prior to
joining Stefanutti & Bressan Civils (Pty) Limited
as managing director in July 2007, he was
managing director of the Civil Engineering
business unit and an EXCO member of the
Grinaker-LTA group. He was promoted to
the position of managing director of the
Structures business unit in September 2008
and became an executive director of Stefanutti
Stocks in March 2010.
Schalk AckermanWillie MeyburghMafika Mkwanazi Dermot Quinn Stephen Pell
Gro
up
at a
gla
nce
Man
ag
em
en
t revie
w

Stefanutti Stocks / Annual Report 2011 / 8
www.stefanuttistocks.com
Executive Committee (EXCO)
Schalk Ackerman
Stephen Pell Dermot Quinn
Siphiwe Nzimande
Willie Meyburgh
Willie Meyburgh (57)
See Directorate for CV on page 7
Schalk Ackerman (52)
See Directorate for CV on page 7
Stephen Pell (53)
See Directorate for CV on page 7
Dermot Quinn (59)
See Directorate for CV on page 7
Siphiwe Nzimande (53)
Group Business Development Director
BCompt, Hons, MBA
Appointed: March 2011
Siphiwe has held various executive positions
in both the public and private sectors
including commercial director at Murray &
Roberts Construction, chief operations
officer at the Gauteng Shared Service
Centre and commercial executive for
Eskom’s Generation Group. He previously
served for three years as chief executive
officer of Business Against Crime South
Africa. Siphiwe joined Stefanutti Stocks in
June 2010 and was appointed to EXCO in
March 2011.
Stefanutti Stocks / Annual Report 2011 / 9
Op
era
tion
al re
vie
wG
overn
an
ce
an
d
su
sta
inab
ilityF
inan
cia
l sta
tem
en
tsS
takeh
old
ers
’ info
rmatio
n
national negotiations on behalf of the civil
engineering industry. He is non-executive
chairman of a non-profit training company
(CEITS) which was established by the South
African Federation for Civil Engineering
Contractors (SAFCEC) to provide industry
training. In the group Elardus focuses on
human resources, health and safety and
black economic empowerment.
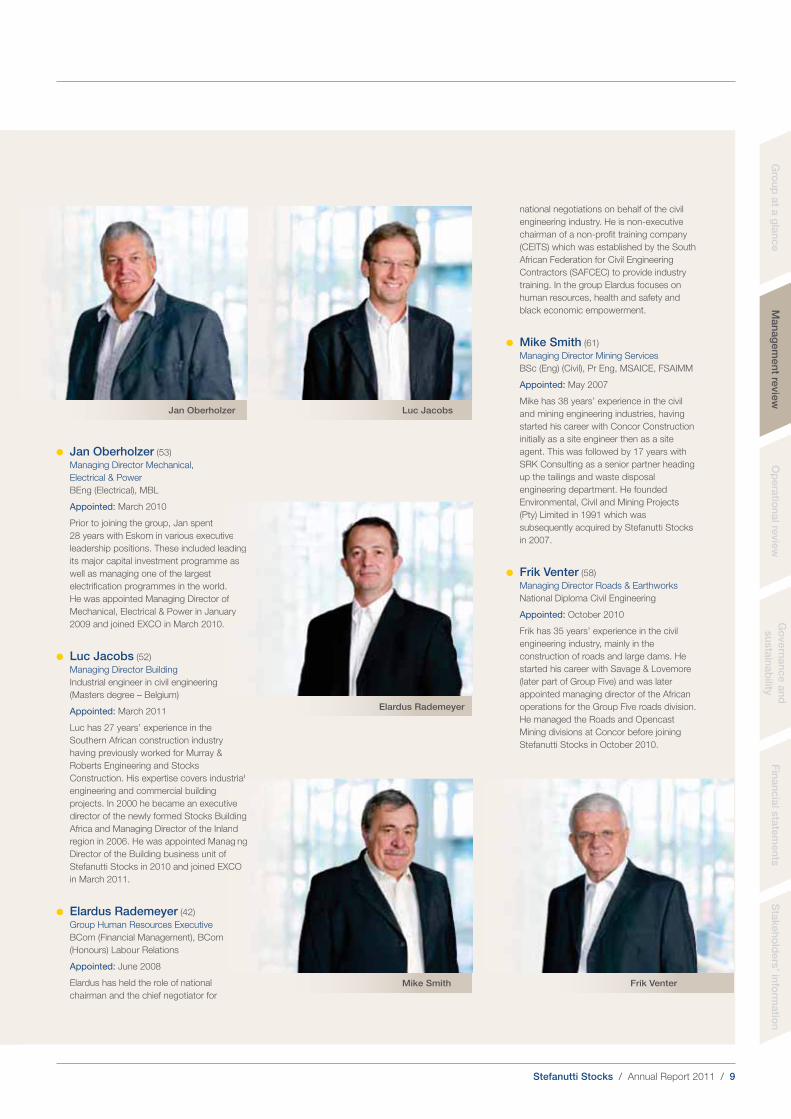
Mike Smith (61)
Managing Director Mining Services
BSc (Eng) (Civil), Pr Eng, MSAICE, FSAIMM
Appointed: May 2007
Mike has 38 years’ experience in the civil
and mining engineering industries, having
started his career with Concor Construction
initially as a site engineer then as a site
agent. This was followed by 17 years with
SRK Consulting as a senior partner heading
up the tailings and waste disposal
engineering department. He founded
Environmental, Civil and Mining Projects
(Pty) Limited in 1991 which was
subsequently acquired by Stefanutti Stocks
in 2007.
Frik Venter (58)
Managing Director Roads & Earthworks
National Diploma Civil Engineering
Appointed: October 2010
Frik has 35 years’ experience in the civil
engineering industry, mainly in the
construction of roads and large dams. He
started his career with Savage & Lovemore
(later part of Group Five) and was later
appointed managing director of the African
operations for the Group Five roads division.
He managed the Roads and Opencast
Mining divisions at Concor before joining
Stefanutti Stocks in October 2010.
Jan Oberholzer (53)
Managing Director Mechanical,
Electrical & Power
BEng (Electrical), MBL
Appointed: March 2010
Prior to joining the group, Jan spent
28 years with Eskom in various executive
leadership positions. These included leading
its major capital investment programme as
well as managing one of the largest
electrification programmes in the world.
He was appointed Managing Director of
Mechanical, Electrical & Power in January
2009 and joined EXCO in March 2010.
Luc Jacobs (52)
Managing Director Building
Industrial engineer in civil engineering
(Masters degree – Belgium)
Appointed: March 2011
Luc has 27 years’ experience in the
Southern African construction industry
having previously worked for Murray &
Roberts Engineering and Stocks
Construction. His expertise covers industrial
engineering and commercial building
projects. In 2000 he became an executive
director of the newly formed Stocks Building
Africa and Managing Director of the Inland
region in 2006. He was appointed Managing
Director of the Building business unit of
Stefanutti Stocks in 2010 and joined EXCO
in March 2011.
Elardus Rademeyer (42)
Group Human Resources Executive
BCom (Financial Management), BCom
(Honours) Labour Relations
Appointed: June 2008
Elardus has held the role of national
chairman and the chief negotiator for
Gro
up
at a
gla
nce
Man
ag
em
en
t revie
w
Jan Oberholzer Luc Jacobs
tivee
eadidinn
e asaass
d.
of
uarry y
.
Elardus Rademeyer
sttrriaialal
vve
lddinngg
nd
agginngg
XCCOO
Mike Smith Frik Venter
gggg
Stefanutti Stocks / Annual Report 2011 / 10
www.stefanuttistocks.comwww.stefanuttistocks.com
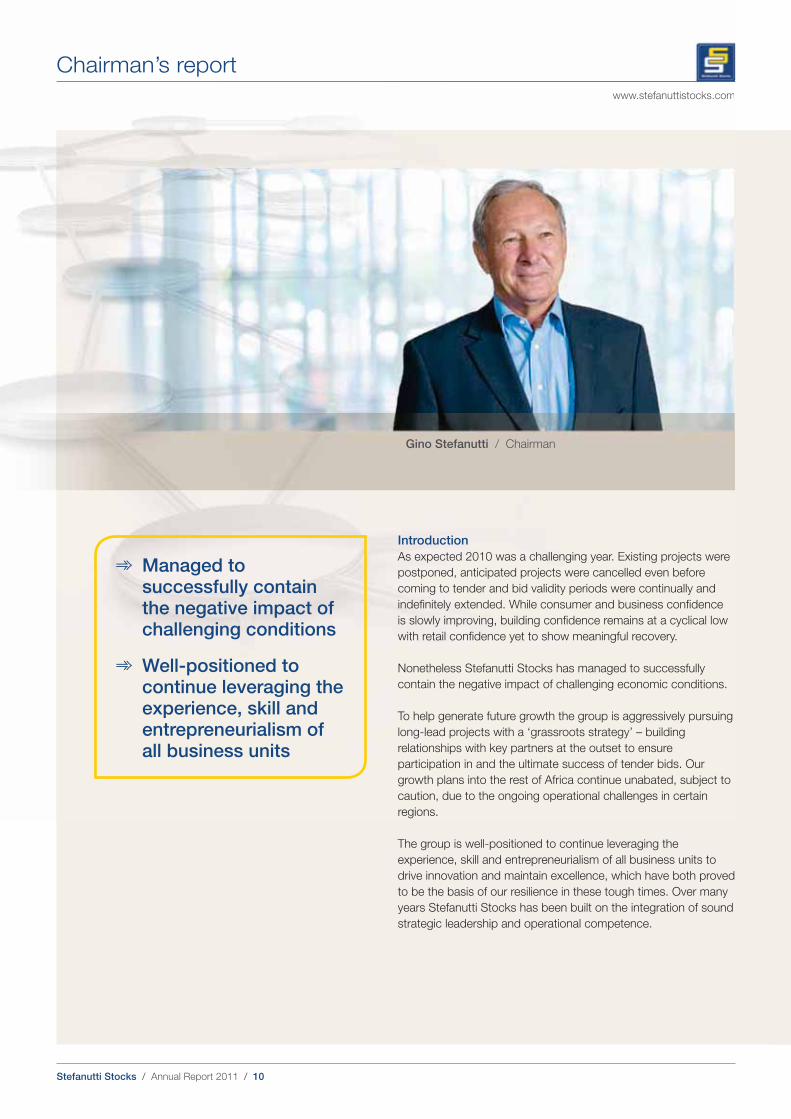
Chairman’s report
Gino Stefanutti / Chairman
Introduction
As expected 2010 was a challenging year. Existing projects were
postponed, anticipated projects were cancelled even before
coming to tender and bid validity periods were continually and
indefinitely extended. While consumer and business confidence
is slowly improving, building confidence remains at a cyclical low
with retail confidence yet to show meaningful recovery.
Nonetheless Stefanutti Stocks has managed to successfully
contain the negative impact of challenging economic conditions.
To help generate future growth the group is aggressively pursuing
long-lead projects with a ‘grassroots strategy’ – building
relationships with key partners at the outset to ensure
participation in and the ultimate success of tender bids. Our
growth plans into the rest of Africa continue unabated, subject to
caution, due to the ongoing operational challenges in certain
regions.
The group is well-positioned to continue leveraging the
experience, skill and entrepreneurialism of all business units to
drive innovation and maintain excellence, which have both proved
to be the basis of our resilience in these tough times. Over many
years Stefanutti Stocks has been built on the integration of sound
strategic leadership and operational competence.
➾ Managed to successfully contain the negative impact of challenging conditions
➾ Well-positioned to continue leveraging the experience, skill and entrepreneurialism of all business units
Stefanutti Stocks / Annual Report 2011 / 11
Op
era
tion
al re
vie
wG
overn
an
ce
an
d
su
sta
inab
ilityF
inan
cia
l sta
tem
en
tsS
takeh
old
ers
’ info
rmatio
nG
rou
p a
t a g
lan
ce
Man
ag
em
en
t revie
w
Corporate governance
During 2010 we made strides in terms of improving and
honing corporate governance policies and procedures,
particularly in bringing them in line with the King III Report
(see ‘Corporate Governance’ for further detail).
The group is aware of the risk of anti-competitive
behaviour to the sustainability of its operations, including
those which may arise as a result of joint ventures and
public-private partnerships (PPPs). We have in place an
initiative to create awareness through training across the
group of what comprises anti-competitive practice and
how best to avoid this.
Business environment
Slow economic recovery has been particularly evident in
the construction sector. There has been a considerable
drop in private sector investment as a result of funding
constraints and other difficulties, and a slowdown in major
public sector infrastructure development for similar
reasons. Furthermore, government procurement
deficiencies have deteriorated considerably over the last
year, leading to increasingly poorly specified tenders,
project postponements and cancellations. As a result
under-spending and mismanagement of capital budgets
persists. Resolving this issue is one of the fundamental
necessities to the future health of the industry.
The downturn in the international economy has resulted
in excess domestic capacity and as a consequence
construction companies have refocused their attention
on Southern Africa, which has in turn led to intensified
competition and margin squeeze. On the upside, interest
rates are at a 30-year low and inflation seems to be well
contained at low levels. We are also starting to see some
parastatals bringing work to the market.
B-BBEE
Stefanutti Stocks is actively striving to improve its BEE
rating to Level 3. During the year a group BEE Forum was
launched to focus on improving the group’s performance
in all aspects of the scorecard.
Further detail of the strategy in this regard is set out in
‘Sustainability’.
Directorate
As part of the continuous growth process, Stephen Pell
was appointed as Chief Operating Officer with effect from
1 August 2010. Willie Meyburgh will retain his current
position as Chief Executive Officer with Stephen’s
appointment enabling him to focus more intensely on the
overall group strategy including growth plans, market
position, geographical spread and investor relations,
among other areas. Stephen will take responsibility for the
operations of Stefanutti Stocks with a specific focus on the
strengthening and roll-out of the group brand.
Appreciation
I thank Willie Meyburgh, Stephen Pell, Dermot Quinn,
Schalk Ackerman, the management teams and all
Stefanutti Stocks employees for their efforts and unflagging
diligence in a demanding year. I also thank my colleagues
on the board for their wise counsel that helped immensely
in board deliberations.
Gino Stefanutti
Chairman
18 July 2011
Stefanutti Stocks / Annual Report 2011 / 12
www.stefanuttistocks.comwww.stefanuttistocks.com
Chief Executive Officer’s report
Willie Meyburgh / Chief Executive Officer
Introduction
At the start of our financial year South Africa was gearing up to
host the FIFA World Cup™ in June 2010, with most local
construction companies benefiting from this prestigious event.
However, all signs pointed to the fact that with World Cup-related
projects concluded, the South African construction market would
inevitably lose immunity to the negative impact of the 2008 global
financial crisis.
Despite the slump in the market I am pleased to report that
Stefanutti Stocks delivered a commendable performance for the
year against a backdrop of continued difficult trading conditions
in a construction sector defined by intensifying competition and
tight margins. Furthermore, the group successfully sustained its
order book, which at year-end stood at R 6,4 billion.
We also have a good medium-term project pipeline which
encompasses a number of significant contract awards across
all our business units. It is encouraging that even in this market,
Stefanutti Stocks was awarded some contracts while not the
lowest bidder on the tender list in terms of price, as well as
having some projects awarded by negotiations.
The Structures business unit produced a commendable result
with improved margins despite revenue remaining stable year-on-
year. The Building business unit delivered a solid performance.
While Roads & Earthworks’ overall performance was satisfactory,
it nonetheless continued to produce double digit margins. Mining
Services, which includes Mining, Mechanical, Electrical & Power,
demonstrated revenue growth although it was negatively affected
➾ Despite difficult trading conditions in the construction sector, the group delivered a commendable performance
➾ We have sustained our order book and have a good medium-term project pipeline
➾ Our multi-disciplinary group structure, diversified client base and good geographical spread minimise any over-exposure to one sector
Stefanutti Stocks / Annual Report 2011 / 13
Op
era
tion
al re
vie
wG
overn
an
ce
an
d
su
sta
inab
ilityF
inan
cia
l sta
tem
en
tsS
takeh
old
ers
’ info
rmatio
n
by divisional start-up costs and two loss-making projects,
impacting margins.
Stefanutti Stocks remains defensive in that the group is
well diversified both geographically and by discipline,
which mitigates the effects of segment- and region-specific
downturns. This multi-disciplinary capability has
established Stefanutti Stocks as a highly competitive
contractor on large civils and building projects coming to
market. We continue to define and refine strategy to drive
growth in the group’s other business units to elevate them
to a similar position of prominence in their markets of
operation and enable them to take on larger and more
challenging projects.
Established operations in Africa, specifically in Botswana,
Mozambique, Swaziland and Zambia, successfully grew
the top line during the year, capitalising on our long-
established presence in those countries. The group also
achieved expansion milestones into other parts of Africa,
establishing an office in Angola and successfully securing
two projects in Sierra Leone – a promising growth region
in light of an upturn in the commodity sector.
Although market conditions in the Middle East remain
challenging the group intends focusing on promising
pockets of growth in the region, for instance Qatar
following the award to the country of the 2022 FIFA World
Cup™ and the ambitious expansion and development
plans as a result.
Financial overview
Revenue of R 7,0 billion declined by 6,3% from the
previous year (February 2010: R 7,5 billion). Operating profit
before investment income decreased by 11,7% to R 442
million (February 2010: R 501 million), while profit for the
year after tax reduced by 14,4% to R 333 million (February
2010: R 389 million). Earnings per share of 193,6 cents
(February 2010: 220,1 cents) and headline earnings per
share of 192,5 cents (February 2010: 224,3 cents)
decreased by 12,1% and 14,2%, respectively.
The board declared a total dividend for the year of
45,0 cents (February 2010: 70,0 cents).
Further detail in respect of the annual financial results is set
out in the Chief Financial Officer’s report and in the attached
annual financial statements and accompanying notes.
Strategy
We are cognisant that a successful strategy for sustainable
growth requires dynamic flexibility under the current
economic volatility, global market uncertainty and fast-
paced development. With this in mind we have
devised a comprehensive multi-faceted strategy for
the year ahead.
Stefanutti Stocks will maintain the existing decentralised
management structure vis-à-vis the business units, in
terms of which operational control resides in the underlying
businesses for quick, skilled decision making and delivery.
This obviously remains subject to overall consistent
harmonisation across the group through common strategy
and branding with a continuous drive to offer the group’s
multi-disciplinary capability as a complete package to our
clients.
With Africa promising opportunities for growth despite the
challenges of operating in certain regions, cross-border
expansion will remain a focus going forward. However,
Africa’s growing popularity among most major domestic
construction companies will result in increased competition
and associated tighter margins over time. Stefanutti Stocks
will therefore continue to target work on the continent by
aligning ourselves with our current clients’ expansion plans
and increasing our footprint in countries where we already
have a presence.
Optimisation of resources is another key goal for the year
ahead. To this end the group will continue to focus on
strengthening the individual skills and expertise of all
business units while maintaining an overall customer-
centric approach and superior service delivery. Plant and
equipment form an integral part of growth for the group as
a whole and the continued focus will be on ensuring
maximum usage through a blend of new equipment and a
well maintained existing fleet.
Further specific strategic focus areas in the year ahead will
include:
➾ developing standardised processes and practices
using the concept of ‘centres of excellence’ to lead by
example;
➾ harnessing the strength of strong intra-group and client
relationships and teamwork;
➾ creating strong interdependent networks within the
group so that the ‘whole will be greater than the sum
of the parts’; and
➾ centralising administrative business support services
for maximum cost and operational efficiencies.
Health and safety
We remain committed to continually enhancing health and
safety processes and procedures to ensure our exemplary
health and safety record is maintained. We again received
a number of awards in this area during the year and our
Gro
up
at a
gla
nce
Man
ag
em
en
t revie
w
Stefanutti Stocks / Annual Report 2011 / 14
www.stefanuttistocks.com
Chief Executive Officer’s report continued
solid health and safety performance across the group is
viewed as a market differentiator. The group’s DIFR at
year-end was 0,22.
Sustainability
The annual report is viewed by the board of directors as
the group’s formal communication with all stakeholders
(including investors, private and public sector customers,
suppliers, staff, government and the general community
within which Stefanutti Stocks operates).
We believe it both affirms and reflects our confidence in
Stefanutti Stocks’ strong track record of sustainability,
taking into account all aspects of operations. We are highly
cognisant that our success will continue to demand the
ongoing inter-relation of strategic and operational priorities
in concept and practice. The annual report is an open and
transparent account of these priorities and the financial,
environmental and social impact of their implementation.
A Sustainability Committee was established during the
year to ensure we commence reporting in terms of
the GRI guidelines. A formal ‘gap analysis’ has been
commissioned based on the prior 2010 annual report
and the GRI reporting requirements.
We are confident that this and subsequent reports will
continue to demonstrate our commitment to the
economic, social and environmental health of the group
and South Africa at large. We accept that on a global scale
our actions may affect minimal change, but we remain
undaunted and will retain our adherence to sustainable
business practices that will directly affect the areas in
which we operate.
The investigation by the Competition Commission into
anti-competitive behaviour by companies within the
construction sector is currently ongoing. Stefanutti Stocks
is co-operating fully with all relevant government agencies,
and has submitted the requisite documentation and awaits
formal feedback in this regard.
Outlook and prospects
Although the South African economy is forecast to grow at
an average of 3% in 2011, trading conditions are expected
to remain tough with increased competition and fewer
major contracts coming to tender in the foreseeable future.
On the upside, gradually increasing levels of business and
consumer confidence are encouraging. Stefanutti Stocks
has a healthy and diversified client base over both the
public and private sectors, minimising any dangerous
over-exposure to one sector.
Growth opportunities are expected to be driven by public
sector demand for infrastructure development in the areas
of water, electricity, roads, harbours, rail and petrochemical
in both South Africa and Africa, provided that efficiency
challenges such as procurement and payment bottlenecks
can be successfully resolved.
In this vein government has committed R 1 trillion to
infrastructure spend over the next number of years, a
promising figure. However, no significant roll-out of this
programme is expected in the first half of the current
financial year.
In the short-term the Trans Caledon Tunnel Authority
(TCTA) water distribution projects have commenced with
Stefanutti Stocks already securing the Komati pipeline in
the Mpumalanga province. Further growth opportunities
from this sector are expected and the group is
accordingly planning capacity expansion to ensure
service capability.
Over the longer term large-scale public sector investment
in roads should provide ongoing work and capital
expenditure on low-cost housing, water and sanitation
provision and social infrastructure such as schools and
hospitals, could also be substantial. In addition Eskom has
secured funding and is now on track to complete the
Kusile power station and other critical projects as well as
maintain the roll-out of the current expansion plan.
Stefanutti Stocks / Annual Report 2011 / 15
Op
era
tion
al re
vie
wG
overn
an
ce
an
d
su
sta
inab
ilityF
inan
cia
l sta
tem
en
tsS
takeh
old
ers
’ info
rmatio
n
Private sector investment prospects are expected to
improve in the short term – with the year-on-year increase
in the number of building plans passed providing evidence
of this.
The resources industry is starting to show some early signs
of resurgence, reflected in mining houses conducting more
feasibility studies with stronger signs of investment in
increased output. However, this market’s recovery will
remain heavily dependent on the global economic situation
which inevitably impacts on commodity prices, as does
local politics.
Sub-Saharan Africa offers considerable opportunities with
an estimated annual spend of USD93 billion (approximately
15% of the region’s GDP) required to meet only existing
and moderate expansion to 2015. Of this amount
approximately USD60 billion comprises capital expenditure
on new infrastructure while the remainder is required for
maintenance and operation.
In the Middle East there are early signs indicating the start
of recovery. There is a slowly increasing number of tenders
in the marketplace and positive developments such as the
recent award to Qatar of the 2022 FIFA World Cup™.
Stefanutti Stocks has identified a number of opportunities
and is preparing to take advantage of an upturn in the
market. Focus on skills, cost control and optimal utilisation
of resources remains a focus in achieving our objectives.
Post balance sheet events
In line with Stefanutti Stocks’ ongoing growth strategy and
subsequent to the financial year-end, we have identified
the pipeline construction market to be a growth sector
within the South African economy. In order to be well
positioned within the sector and capitalise on the
infrastructure spend, Stefanutti Stocks has taken a
strategic decision to acquire the 100% interest in Cycad
Pipelines (Pty) Limited and its related operations.
Appreciation
Stefanutti Stocks’ performance can be attributed to the
invaluable contribution and commitment of all our staff
members. Without them and the support of their families,
Stefanutti Stocks would not have been able to achieve its
successes nor would it be in a position to continue to build
on our common goals going forward. I also thank the
EXCO members and the non-executive directors for their
valuable input and guidance. Finally I extend my thanks to
all our customers, suppliers, service providers and
shareholders for their continued support.
Willie Meyburgh
Chief Executive Officer
18 July 2011
Gro
up
at a
gla
nce
Man
ag
em
en
t revie
w
Stefanutti Stocks / Annual Report 2011 / 16
www.stefanuttistocks.comwww.stefanuttistocks.com
Chief Financial Officer’s report
Dermot Quinn / Chief Financial Officer
Highlights➾ Commendable performance in difficult market conditions
➾ Strong financial position maintained
➾ Financial discipline – cost and cash management – remains
a focal point in overall group strategy
Financial performanceRevenue of R 7,0 billion was marginally down by 6,3% on the
previous year, accompanied by an 11,7% reduction in operating
profit to R 442 million.
Operating margin also decreased slightly from 6,8% to 6,4%
while headline earnings per share of 192,5 cents reflected a
decline of 14,2% on the previous year.
Business units
Structures in particular had an effective year, achieving both an
increased operating profit and operating margin on the same
revenue as the previous year.
Building produced another sound set of results, while Roads &
Earthworks, although generating a solid operating margin, was
impacted by delays in contract awards and cancellations leading
to a drop in both revenue and operating profit.
Mining Services entered into the more competitive market of
sizeable contracts, albeit with reduced margins. This reflected in
an encouraging increase in revenue. However, the operating profit
was lower as the business unit was further adversely affected by
two problem contracts.
Revenue
R 7,0 billion
Operating profit
R 442 million
Cash on hand
R 1,1 billion

Stefanutti Stocks / Annual Report 2011 / 17
Op
era
tion
al re
vie
wG
overn
an
ce
an
d
su
sta
inab
ilityF
inan
cia
l sta
tem
en
tsS
takeh
old
ers
’ info
rmatio
n
Shares in issue
Although the actual number of shares in issue remained
constant throughout the year, the weighted average shares
in issue reduced mainly due to the accounting treatment
and timing of the repurchases of company shares, treated
as treasury shares.
Cash
At year-end group cash stood at a robust R 1,1 billion,
slightly down on the previous year. Approximately 25% of
this cash is held offshore. With the reduced interest rates
currently available locally and internationally combined with
the strengthening of the South African Rand, this had an
adverse impact on the group’s net investment income and
year-end reported cash on hand.
The tight trading conditions have placed demands on cash
flows in all our markets. In contrast to prior years, receipt of
payments in advance and excess billings have now nearly
disappeared entirely and working capital remains under
pressure. As a result, cash generated from operations has
reduced significantly by 67%. This area of the business is
subject to continual management assessment, especially in
the light of the group’s future growth plans.
Capex
The interest-bearing debt in the group stood at a
conservative 14% at year-end and has been raised for
plant and equipment under instalment sales, as well as
some bond finance over owned properties. However, net
gearing after cash on hand remains at nil.
In order to meet the forecast organic and geographic
growth, the group at an early stage identified the necessity
to build the required capacity in the business units.
As a result, capital expenditure for the past year was
R 292 million including R 50 million on owned properties.
All capital expenditure is closely monitored within the
group, with all significant amounts requiring specific
approvals at executive level notwithstanding prior
budgetary approval at the commencement of each
financial year. In line with the stated objective of capacity
building, the board has approved capital expenditure of
R 309 million for the current year, of which R 120 million
has already been committed.
An IFRS requirement is that the carrying value of all long-
term assets including goodwill and intangibles be reviewed
annually. No impairment was required for property, plant,
equipment and goodwill. Intangibles are amortised in
accordance with IAS 38: Intangible Assets, based on the
value ascribed to the asset and its useful life.
Acquisitions
During the year the group acquired the business operation
of RGF for R 5,9 million as well as 100% shareholding in
Apollo for R 19,7 million. Arising out of these acquisitions
goodwill increased by R 13,2 million. In addition, the
group acquired the remaining minority interests in
S&B Construcoes (Moc) Lda.
RestructureWith effect from 1 March 2010 the South African business
operations were restructured, in terms of which the
operations previously held in subsidiary companies
commenced operations as divisions of Stefanutti Stocks
(Pty) Limited.
Consequently some of the subsidiaries are in the process of
being deregistered. As part of the restructuring process, a
dividend in specie was declared from these subsidiary
companies to the holding company, resulting in a dividend
received of R 157,6 million. The investments held in these
subsidiaries have then been impaired due to the companies
no longer trading and the resultant zero net asset values of
these companies after the dividend declaration. The
impairment of the investments amounted to R 157,6 million.
Both of the above transactions are reflected in the holding
company’s statement of comprehensive income. However,
the net effect on the group financial statements is nil, as all
entries are reversed on consolidation.
Outlook At year-end the order book stood at R 6,4 billion, up on the
R 6,2 billion at the end of the previous year. Significantly,
however, the order book at the end of May 2011 stood at
R 8,2 billion, evidence of the group’s future growth
prospects.
Post balance sheet events Subsequent to financial year-end the group has concluded
agreements to acquire 100% interest in Cycad Pipelines
(Pty) Limited for a total purchase consideration of
R 306 million. The transaction is subject to completion
of conditions precedent.
DividendIn light of the anticipated growth – organic, acquisitive and
geographical, the board decided to adopt a prudent
dividend policy and declared a total dividend of 45,0 cents
per share (February 2010: 70,0 cents per share). This total
dividend payment equates to a dividend cover of four
times normalised headline earnings.
Dermot Quinn
Chief Financial Officer
18 July 2011
Gro
up
at a
gla
nce
Man
ag
em
en
t revie
w
Stefanutti Stocks / Annual Report 2011 / 18
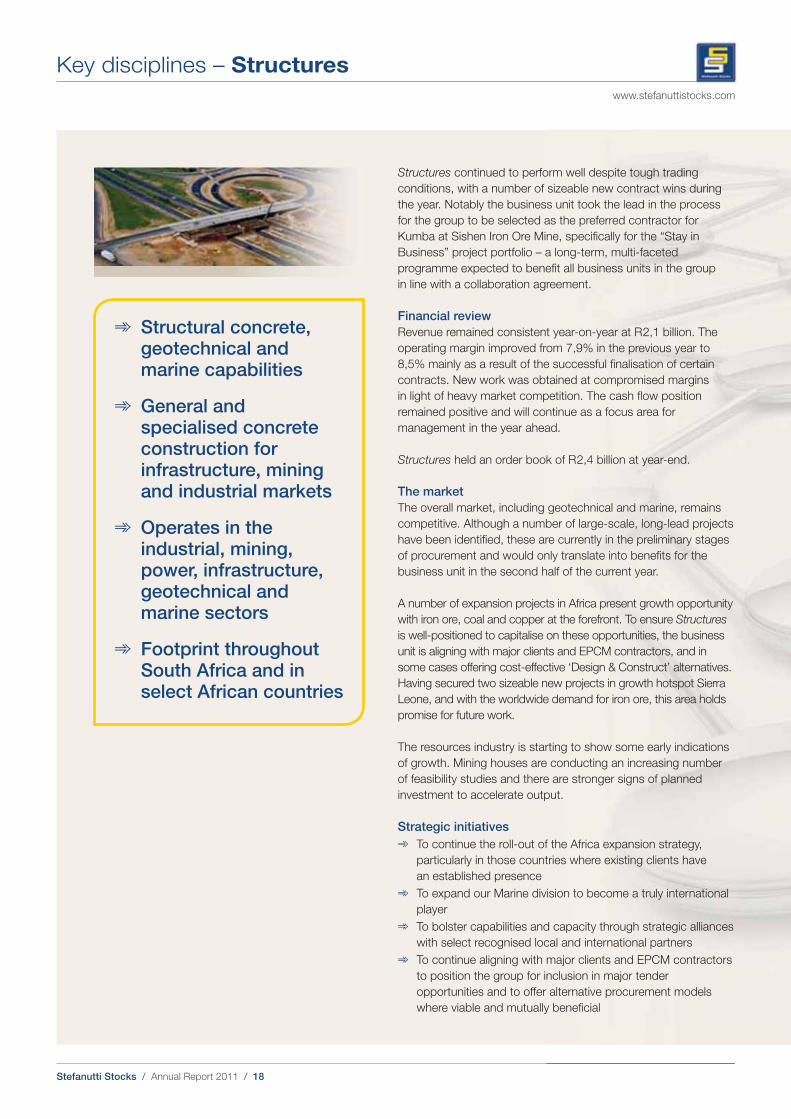
➾ Structural concrete, geotechnical and marine capabilities
➾ General and specialised concrete construction for infrastructure, mining and industrial markets
➾ Operates in the industrial, mining, power, infrastructure, geotechnical and marine sectors
➾ Footprint throughout South Africa and in select African countries
www.stefanuttistocks.com
Key disciplines – Structures
Structures continued to perform well despite tough trading
conditions, with a number of sizeable new contract wins during
the year. Notably the business unit took the lead in the process
for the group to be selected as the preferred contractor for
Kumba at Sishen Iron Ore Mine, specifically for the “Stay in
Business” project portfolio – a long-term, multi-faceted
programme expected to benefit all business units in the group
in line with a collaboration agreement.
Financial review
Revenue remained consistent year-on-year at R 2,1 billion. The
operating margin improved from 7,9% in the previous year to
8,5% mainly as a result of the successful finalisation of certain
contracts. New work was obtained at compromised margins
in light of heavy market competition. The cash flow position
remained positive and will continue as a focus area for
management in the year ahead.
Structures held an order book of R 2,4 billion at year-end.
The market
The overall market, including geotechnical and marine, remains
competitive. Although a number of large-scale, long-lead projects
have been identified, these are currently in the preliminary stages
of procurement and would only translate into benefits for the
business unit in the second half of the current year.
A number of expansion projects in Africa present growth opportunity
with iron ore, coal and copper at the forefront. To ensure Structures
is well-positioned to capitalise on these opportunities, the business
unit is aligning with major clients and EPCM contractors, and in
some cases offering cost-effective ‘Design & Construct’ alternatives.
Having secured two sizeable new projects in growth hotspot Sierra
Leone, and with the worldwide demand for iron ore, this area holds
promise for future work.
The resources industry is starting to show some early indications
of growth. Mining houses are conducting an increasing number
of feasibility studies and there are stronger signs of planned
investment to accelerate output.
Strategic initiatives
➾ To continue the roll-out of the Africa expansion strategy,
particularly in those countries where existing clients have
an established presence
➾ To expand our Marine division to become a truly international
player
➾ To bolster capabilities and capacity through strategic alliances
with select recognised local and international partners
➾ To continue aligning with major clients and EPCM contractors
to position the group for inclusion in major tender
opportunities and to offer alternative procurement models
where viable and mutually beneficial
Stefanutti Stocks / Annual Report 2011 / 19
Man
ag
em
en
t revie
wO
pera
tion
al re
vie
wG
overn
an
ce
an
d
su
sta
inab
ilityF
inan
cia
l sta
tem
en
tsS
takeh
old
ers
’ info
rmatio
n
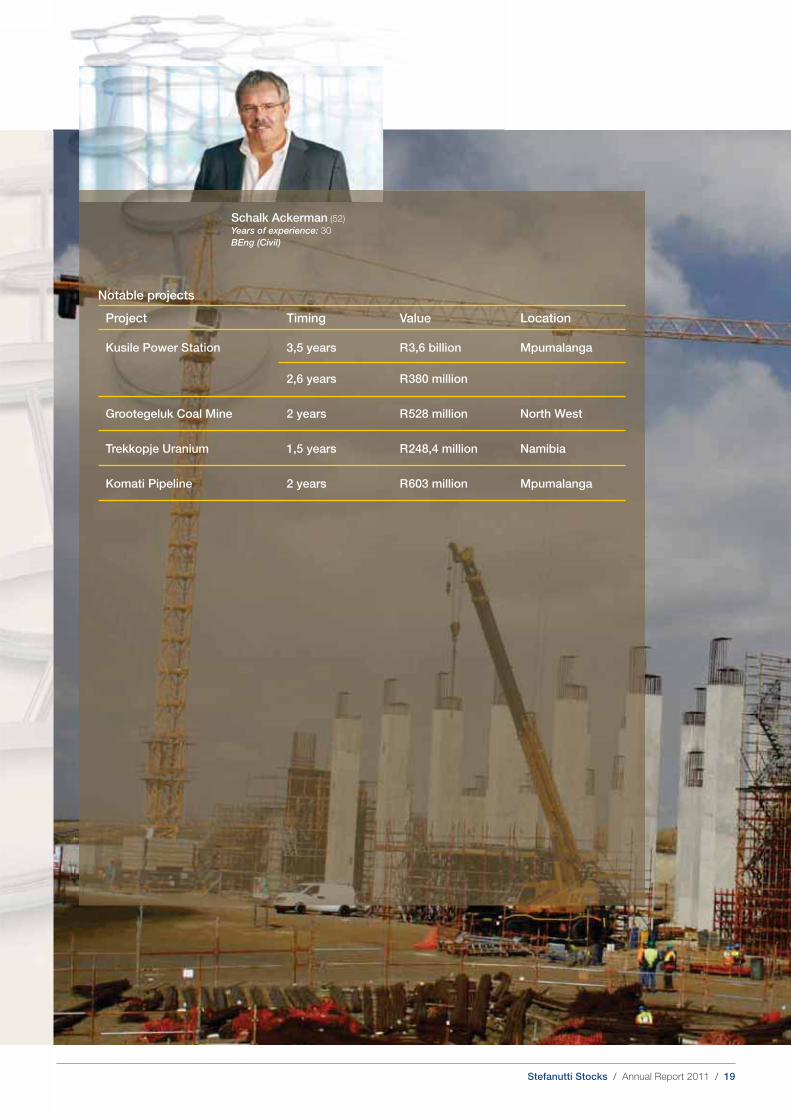
Schalk Ackerman (52)
Years of experience: 30
BEng (Civil)
Notable projects
Project Timing Value Location
Kusile Power Station 3,5 years R 3,6 billion Mpumalanga
2,6 years R 380 million
Grootegeluk Coal Mine 2 years R 528 million North West
Trekkopje Uranium 1,5 years R 248,4 million Namibia
Komati Pipeline 2 years R 603 million Mpumalanga
Stefanutti Stocks / Annual Report 2011 / 20
Sta
keh
old
ers
’ info
rmatio
nF
inan
cia
l sta
tem
en
tsG
overn
an
ce
an
d
su
sta
inab
ilityG
rou
p a
t a g
lan
ce
Man
ag
em
en
t revie
wO
pera
tion
al re
vie
w

Stefanutti Stocks / Annual Report 2011 / 21
“Structures reemmains the main business driver of Stteeffanutti Stocks.
During thee yyeeaarr focus was on eennttrreencchhiingg thhee bbuussinesss uunnit as a
reccooggnniised, undisputed leaddeerr iinn its markeett..”
Stephen PeelllChief Operating Officcerer
Stefanutti Stocks / Annual Report 2011 / 22
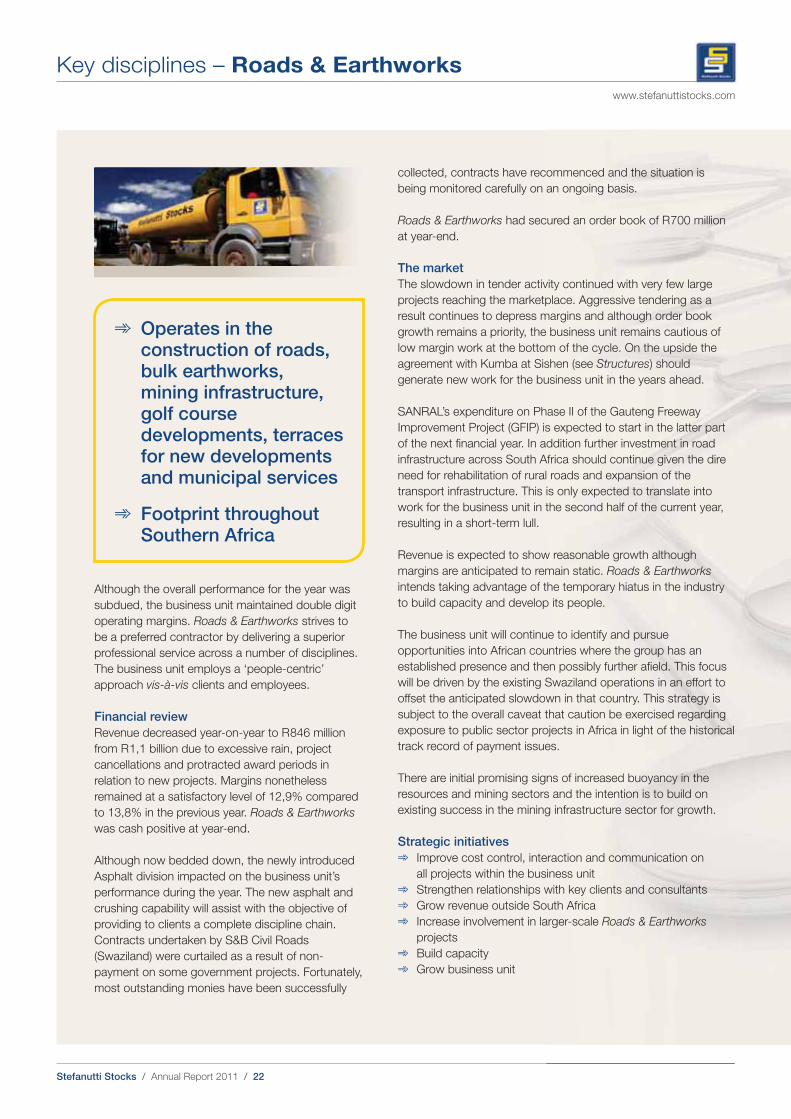
Although the overall performance for the year was
subdued, the business unit maintained double digit
operating margins. Roads & Earthworks strives to
be a preferred contractor by delivering a superior
professional service across a number of disciplines.
The business unit employs a ‘people-centric’
approach vis-à-vis clients and employees.
Financial review
Revenue decreased year-on-year to R 846 million
from R 1,1 billion due to excessive rain, project
cancellations and protracted award periods in
relation to new projects. Margins nonetheless
remained at a satisfactory level of 12,9% compared
to 13,8% in the previous year. Roads & Earthworks
was cash positive at year-end.
Although now bedded down, the newly introduced
Asphalt division impacted on the business unit’s
performance during the year. The new asphalt and
crushing capability will assist with the objective of
providing to clients a complete discipline chain.
Contracts undertaken by S&B Civil Roads
(Swaziland) were curtailed as a result of non-
payment on some government projects. Fortunately,
most outstanding monies have been successfully
➾ Operates in the construction of roads, bulk earthworks, mining infrastructure, golf course developments, terraces for new developments and municipal services
➾ Footprint throughout Southern Africa
www.stefanuttistocks.com
Key disciplines – Roads & Earthworks
collected, contracts have recommenced and the situation is
being monitored carefully on an ongoing basis.
Roads & Earthworks had secured an order book of R 700 million
at year-end.
The market
The slowdown in tender activity continued with very few large
projects reaching the marketplace. Aggressive tendering as a
result continues to depress margins and although order book
growth remains a priority, the business unit remains cautious of
low margin work at the bottom of the cycle. On the upside the
agreement with Kumba at Sishen (see Structures) should
generate new work for the business unit in the years ahead.
SANRAL’s expenditure on Phase II of the Gauteng Freeway
Improvement Project (GFIP) is expected to start in the latter part
of the next financial year. In addition further investment in road
infrastructure across South Africa should continue given the dire
need for rehabilitation of rural roads and expansion of the
transport infrastructure. This is only expected to translate into
work for the business unit in the second half of the current year,
resulting in a short-term lull.
Revenue is expected to show reasonable growth although
margins are anticipated to remain static. Roads & Earthworks
intends taking advantage of the temporary hiatus in the industry
to build capacity and develop its people.
The business unit will continue to identify and pursue
opportunities into African countries where the group has an
established presence and then possibly further afield. This focus
will be driven by the existing Swaziland operations in an effort to
offset the anticipated slowdown in that country. This strategy is
subject to the overall caveat that caution be exercised regarding
exposure to public sector projects in Africa in light of the historical
track record of payment issues.
There are initial promising signs of increased buoyancy in the
resources and mining sectors and the intention is to build on
existing success in the mining infrastructure sector for growth.
Strategic initiatives
➾ Improve cost control, interaction and communication on
all projects within the business unit
➾ Strengthen relationships with key clients and consultants
➾ Grow revenue outside South Africa
➾ Increase involvement in larger-scale Roads & Earthworks
projects
➾ Build capacity
➾ Grow business unit

Stefanutti Stocks / Annual Report 2011 / 23
Man
ag
em
en
t revie
wO
pera
tion
al re
vie
wG
overn
an
ce
an
d
su
sta
inab
ilityF
inan
cia
l sta
tem
en
tsS
takeh
old
ers
’ info
rmatio
n
Frik Venter (58)
Years of experience: 35
National Diploma
Civil Engineering
Notable projects
Project Timing Value Location
Hopetown 3 years R 300 million Douglas
Kumba 3 years R 150 million Sishen
DFA fibre optic ducts 1 year R 150 million Johannesburg
and Karoo
Sikhuphe Airport 6 months R 45 million Swaziland
SANRAL – National Road 17 2 years R 400 million Bethal, Davel
Camden, Piet
Retief
Kusile Earthworks 3,5 years R 353 million Ogies
Optimum Coal – water
reclamation
2 years R 221 million Middelburg

Stefanutti Stocks / Annual Report 2011 / 24
Go
vern
an
ce
an
d
su
sta
inab
ilityF
inan
cia
l sta
tem
en
tsS
takeh
old
ers
’ info
rmatio
nG
rou
p a
t a g
lan
ce
Man
ag
em
en
t revie
wO
pera
tion
al re
vie
w
Stefanutti Stocks / Annual Report 2011 / 25
“TThhee ggrroouupp greattllyy aacckknnoowwlleeddges the ccoonnttrriibbution made by Derryycck White, who
retired in February 201111. He has been succeededd by Frik Venter.
TTThhhee leadership transition waass seamless and tthhee bbuussiinneess unit is set to ccoonnttiinue benefiting
fromm FFrriikk’’ss wweealltthh of knnoowwlleedgge, wwhhiich will enable us too ttaakkee Roads & Earthworkkss ttoo the
next leveell..”
Stephen PeelllChief Operating Officcerer

Stefanutti Stocks / Annual Report 2011 / 26
➾ Four diversified divisions: Design & Construct; Tailings Operations; Materials Handling; and Contract Mining
➾ Specialises in the design, construction and operation of mine residue disposal and recovery facilities, materials handling and contract mining
➾ Footprint throughout South Africa and select Southern African countries
➾ Results of the Mechanical, Electrical & Power business unit are reported as a consolidated segment with Mining Services
www.stefanuttistocks.com
Key disciplines – Mining Services
Although trading conditions remained stable, performance was
defined by competitive tendering with low margins and two
problem contracts. The business unit’s diversified but integrated
offerings position Mining Services to capitalise on more buoyant
sectors of the market.
Financial review
Notwithstanding an increase in the business unit’s revenue from
R 474 million to R 702 million, the operating margin suffered a
reduction from 11,8% in the previous year to 6,1%. Given the
capital intensive nature of Mining Services’ core business, and
the decline in margins, cash flow remained under pressure.
At year-end the order book stood at R 600 million.
The market
The business unit provides a multi-disciplinary suite of mining
services to the South African mining industry and is capable of
targeting healthier sectors during cyclical volatility.
The business unit expects an improved performance in the year
ahead, albeit one still characterised by low margins and
competitive tendering.
Design & Construct division
The division is able to offer specialist design and project
management skills as well as to provide a full turnkey solution. A
number of major projects were successfully completed, notably
the Khumani Iron Ore Paste Tailings project, which was delivered
on time and on budget.
Tailings Operations division
Although the year had been marked for consolidation, the division
continued to make good inroads into the market with a number
of new contracts secured and existing projects retained at
improved margins.
Materials Handling division
The new division was successfully integrated into the business
unit during the year. It is now well-positioned to secure coal
slurry/discard handling projects.
Contract Mining division
This division offers the largest growth potential for the business
unit. During the year performance was negatively impacted by the
termination of a project where the client was unable to secure a
take-off agreement. On the upside the division has successfully
secured the Mashala Ferreira Mine open-cast coal project for
28 months (Continental Coal) and a 36-month hard rock mining
contract in Phalaborwa (Foskor).
Strategic initiatives
➾ To gain a foothold in Southern Africa beyond South African
borders
Stefanutti Stocks / Annual Report 2011 / 27
Gro
up
at a
gla
nce
Man
ag
em
en
t revie
wO
pera
tion
al re
vie
wG
overn
an
ce
an
d
su
sta
inab
ilityF
inan
cia
l sta
tem
en
tsS
takeh
old
ers
’ info
rmatio
n
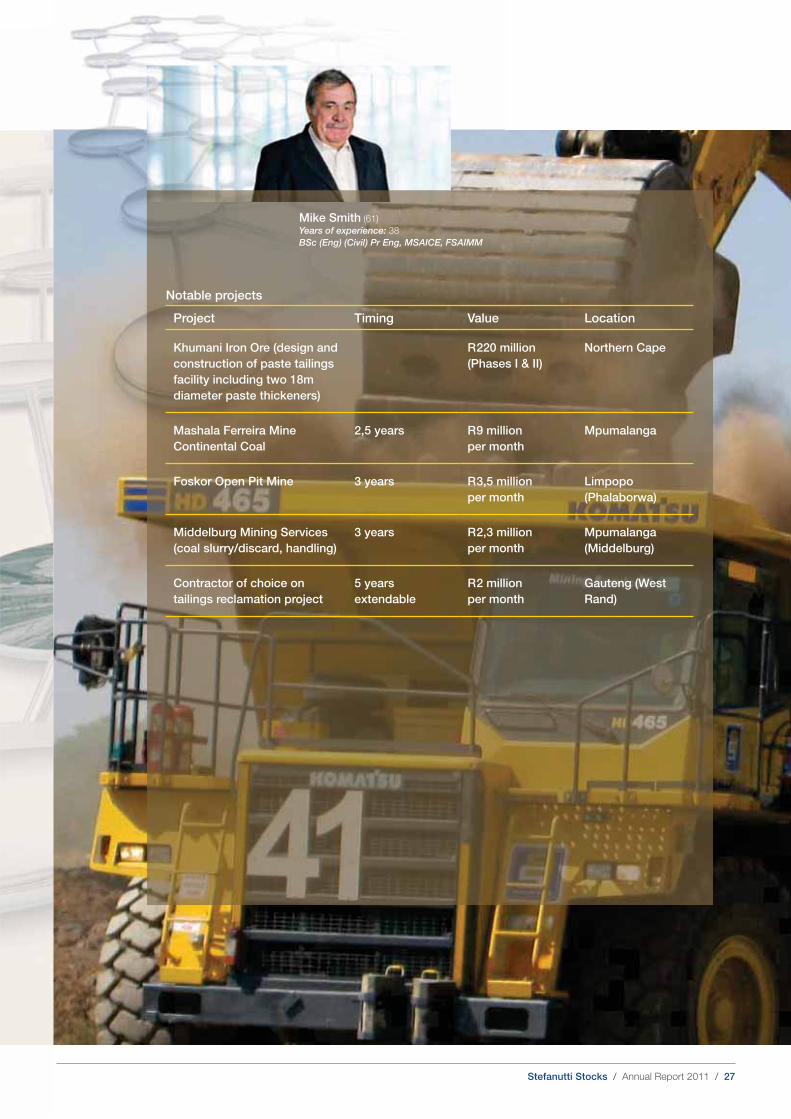
Notable projects
Project Timing Value Location
Khumani Iron Ore (design and
construction of paste tailings
facility including two 18m
diameter paste thickeners)
R 220 million
(Phases I & II)
Northern Cape
Mashala Ferreira Mine
Continental Coal
2,5 years R 9 million
per month
Mpumalanga
Foskor Open Pit Mine 3 years R 3,5 million
per month
Limpopo
(Phalaborwa)
Middelburg Mining Services
(coal slurry/discard, handling)
3 years R 2,3 million
per month
Mpumalanga
(Middelburg)
Contractor of choice on
tailings reclamation project
5 years
extendable
R 2 million
per month
Gauteng (West
Rand)
Mike Smith (61)
Years of experience: 38
BSc (Eng) (Civil) Pr Eng, MSAICE, FSAIMM
Stefanutti Stocks / Annual Report 2011 / 28
Go
vern
an
ce
an
d
su
sta
inab
ilityF
inan
cia
l sta
tem
en
tsS
takeh
old
ers
’ info
rmatio
nG
rou
p a
t a g
lan
ce
Man
ag
em
en
t revie
wO
pera
tion
al re
vie
w

Stefanutti Stocks / Annual Report 2011 / 29
“Miningg SSeerrvviicceess experiencedd aa ddiifffificult year, bbuutt remains operationalllyy sound. Focus
goooing ahead will centre on bbuilding critical maaassss to achieve a sizeable mmaarket presence
iinn ttthhee materials handling and ccoontract mining disciplines. The hhiigghh level of capital
eexxppeennddiitturree rreqquiirreedd iinn thesee sseectors, coommppounded by the toughh mmaarrket coonnditions, remains a challengee.. ”
Stephen PeelllChief Operating Officcerer
Stefanutti Stocks / Annual Report 2011 / 30
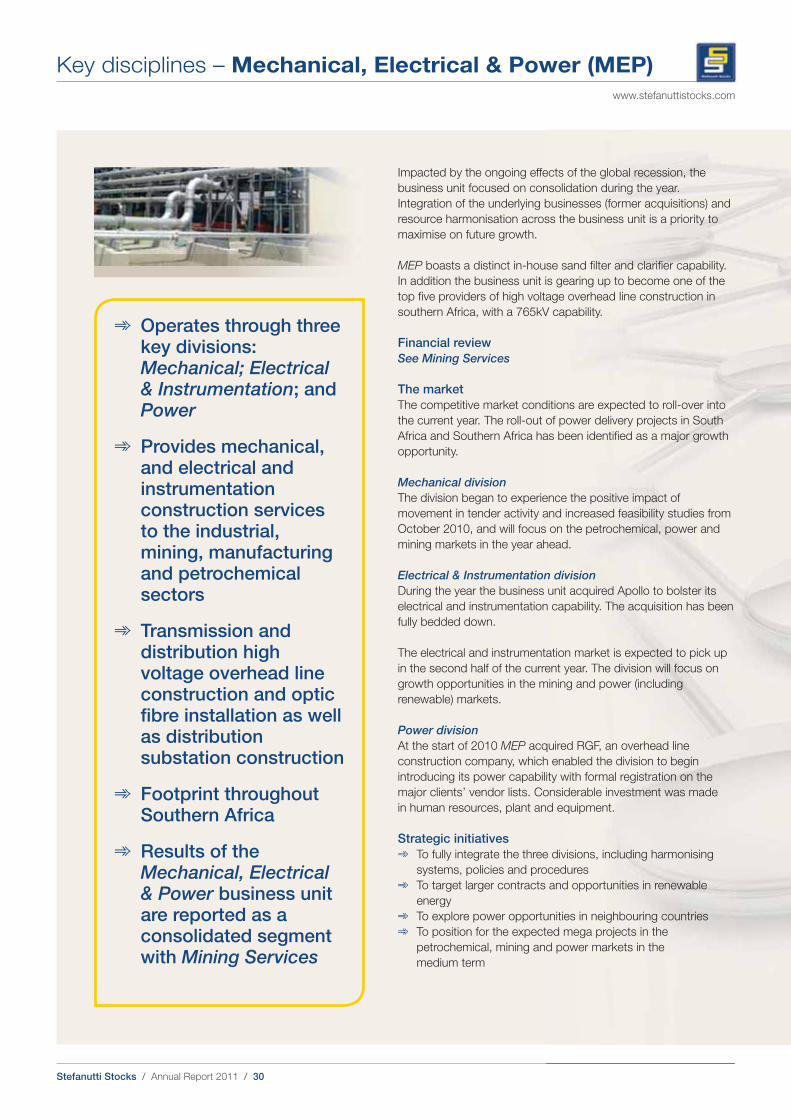
➾ Operates through three key divisions: Mechanical; Electrical & Instrumentation; and Power
➾ Provides mechanical, and electrical and instrumentation construction services to the industrial, mining, manufacturing and petrochemical sectors
➾ Transmission and distribution high voltage overhead line construction and optic fibre installation as well as distribution substation construction
➾ Footprint throughout Southern Africa
➾ Results of the Mechanical, Electrical & Power business unit are reported as a consolidated segment with Mining Services
www.stefanuttistocks.com
Key disciplines – Mechanical, Electrical & Power (MEP)
Impacted by the ongoing effects of the global recession, the
business unit focused on consolidation during the year.
Integration of the underlying businesses (former acquisitions) and
resource harmonisation across the business unit is a priority to
maximise on future growth.
MEP boasts a distinct in-house sand filter and clarifier capability.
In addition the business unit is gearing up to become one of the
top five providers of high voltage overhead line construction in
southern Africa, with a 765kV capability.
Financial review
See Mining Services
The market
The competitive market conditions are expected to roll-over into
the current year. The roll-out of power delivery projects in South
Africa and Southern Africa has been identified as a major growth
opportunity.
Mechanical division
The division began to experience the positive impact of
movement in tender activity and increased feasibility studies from
October 2010, and will focus on the petrochemical, power and
mining markets in the year ahead.
Electrical & Instrumentation division
During the year the business unit acquired Apollo to bolster its
electrical and instrumentation capability. The acquisition has been
fully bedded down.
The electrical and instrumentation market is expected to pick up
in the second half of the current year. The division will focus on
growth opportunities in the mining and power (including
renewable) markets.
Power division
At the start of 2010 MEP acquired RGF, an overhead line
construction company, which enabled the division to begin
introducing its power capability with formal registration on the
major clients’ vendor lists. Considerable investment was made
in human resources, plant and equipment.
Strategic initiatives
➾ To fully integrate the three divisions, including harmonising
systems, policies and procedures
➾ To target larger contracts and opportunities in renewable
energy
➾ To explore power opportunities in neighbouring countries
➾ To position for the expected mega projects in the
petrochemical, mining and power markets in the
medium term
Stefanutti Stocks / Annual Report 2011 / 31
Man
ag
em
en
t revie
wO
pera
tion
al re
vie
wG
overn
an
ce
an
d
su
sta
inab
ilityF
inan
cia
l sta
tem
en
tsS
takeh
old
ers
’ info
rmatio
n
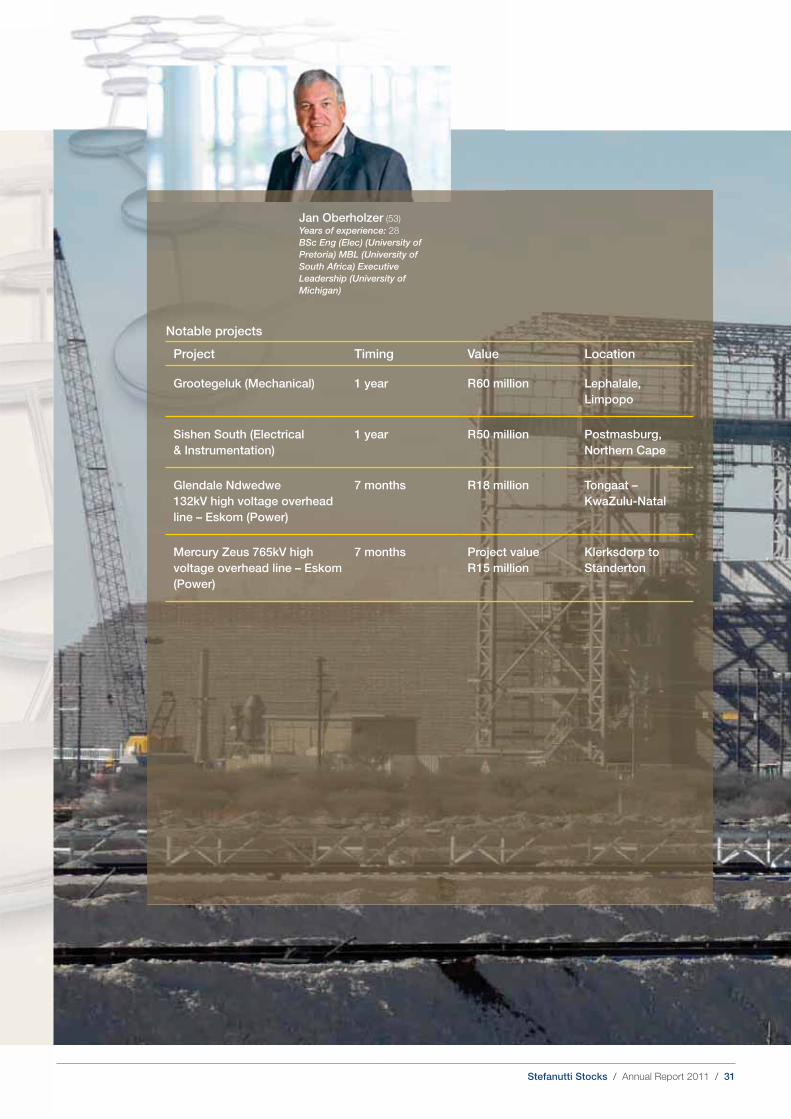
Jan Oberholzer (53)
Years of experience: 28
BSc Eng (Elec) (University of
Pretoria) MBL (University of
South Africa) Executive
Leadership (University of
Michigan)
Notable projects
Project Timing Value Location
Grootegeluk (Mechanical) 1 year R 60 million Lephalale,
Limpopo
Sishen South (Electrical
& Instrumentation)
1 year R 50 million Postmasburg,
Northern Cape
Glendale Ndwedwe
132kV high voltage overhead
line – Eskom (Power)
7 months R 18 million Tongaat –
KwaZulu-Natal
Mercury Zeus 765kV high
voltage overhead line – Eskom
(Power)
7 months Project value
R 15 million
Klerksdorp to
Standerton
Stefanutti Stocks / Annual Report 2011 / 32
Go
vern
an
ce
an
d
su
sta
inab
ilityF
inan
cia
l sta
tem
en
tsS
takeh
old
ers
’ info
rmatio
nG
rou
p a
t a g
lan
ce
Man
ag
em
en
t revie
wO
pera
tion
al re
vie
w

Stefanutti Stocks / Annual Report 2011 / 33
““TThhee rroolll-out of mining and ppower projects acrrrooss South Africa and Africcaa is presenting
exccciiitting prospects for this bussiiness unit. The iiinnittial set-up year has been cchallenging but
tthhe hard work is nnooww sstarting to yield bbeenneefifittss. TThhee MMeecchhaanniiccal,, EElleeccttrical &
Instrumenttaattiioonn divisions are lookingg aahheead to a positive futuree..”
Stephen PeelllChief Operating Officcerer
Stefanutti Stocks / Annual Report 2011 / 34
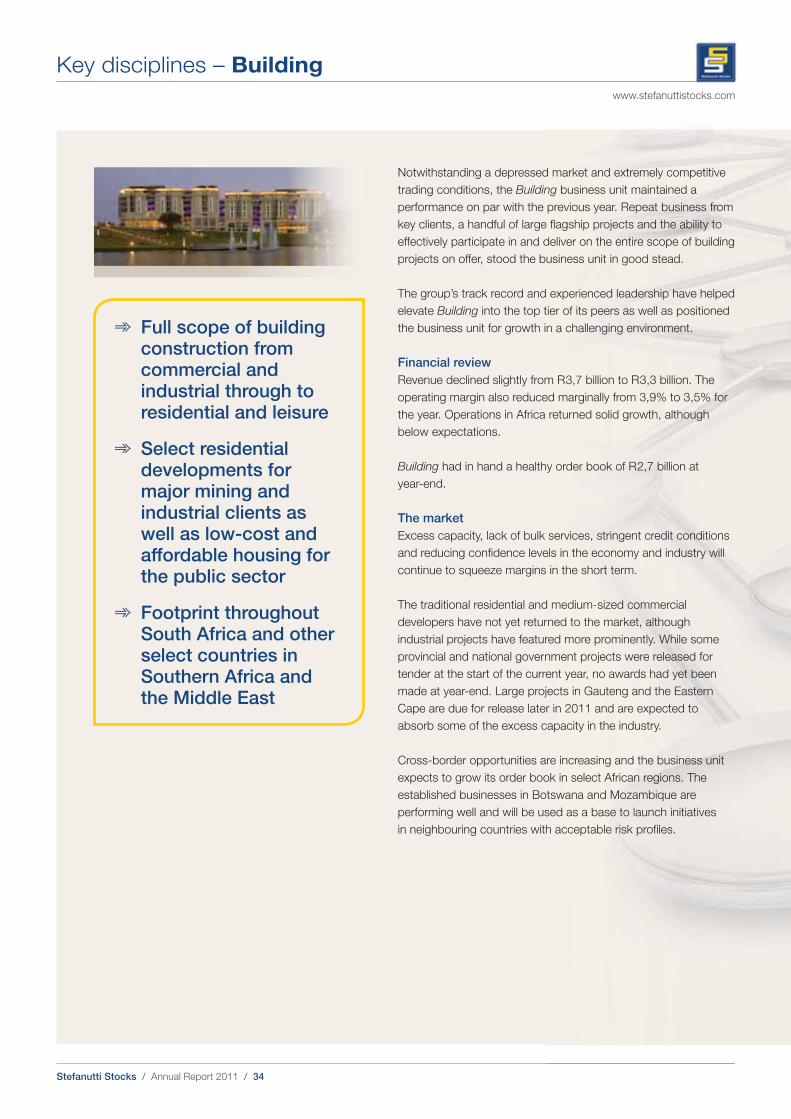
➾ Full scope of building construction from commercial and industrial through to residential and leisure
➾ Select residential developments for major mining and industrial clients as well as low-cost and affordable housing for the public sector
➾ Footprint throughout South Africa and other select countries in Southern Africa and the Middle East
www.stefanuttistocks.com
Key disciplines – Building
Notwithstanding a depressed market and extremely competitive
trading conditions, the Building business unit maintained a
performance on par with the previous year. Repeat business from
key clients, a handful of large flagship projects and the ability to
effectively participate in and deliver on the entire scope of building
projects on offer, stood the business unit in good stead.
The group’s track record and experienced leadership have helped
elevate Building into the top tier of its peers as well as positioned
the business unit for growth in a challenging environment.
Financial review
Revenue declined slightly from R 3,7 billion to R 3,3 billion. The
operating margin also reduced marginally from 3,9% to 3,5% for
the year. Operations in Africa returned solid growth, although
below expectations.
Building had in hand a healthy order book of R 2,7 billion at
year-end.
The market
Excess capacity, lack of bulk services, stringent credit conditions
and reducing confidence levels in the economy and industry will
continue to squeeze margins in the short term.
The traditional residential and medium-sized commercial
developers have not yet returned to the market, although
industrial projects have featured more prominently. While some
provincial and national government projects were released for
tender at the start of the current year, no awards had yet been
made at year-end. Large projects in Gauteng and the Eastern
Cape are due for release later in 2011 and are expected to
absorb some of the excess capacity in the industry.
Cross-border opportunities are increasing and the business unit
expects to grow its order book in select African regions. The
established businesses in Botswana and Mozambique are
performing well and will be used as a base to launch initiatives
in neighbouring countries with acceptable risk profiles.
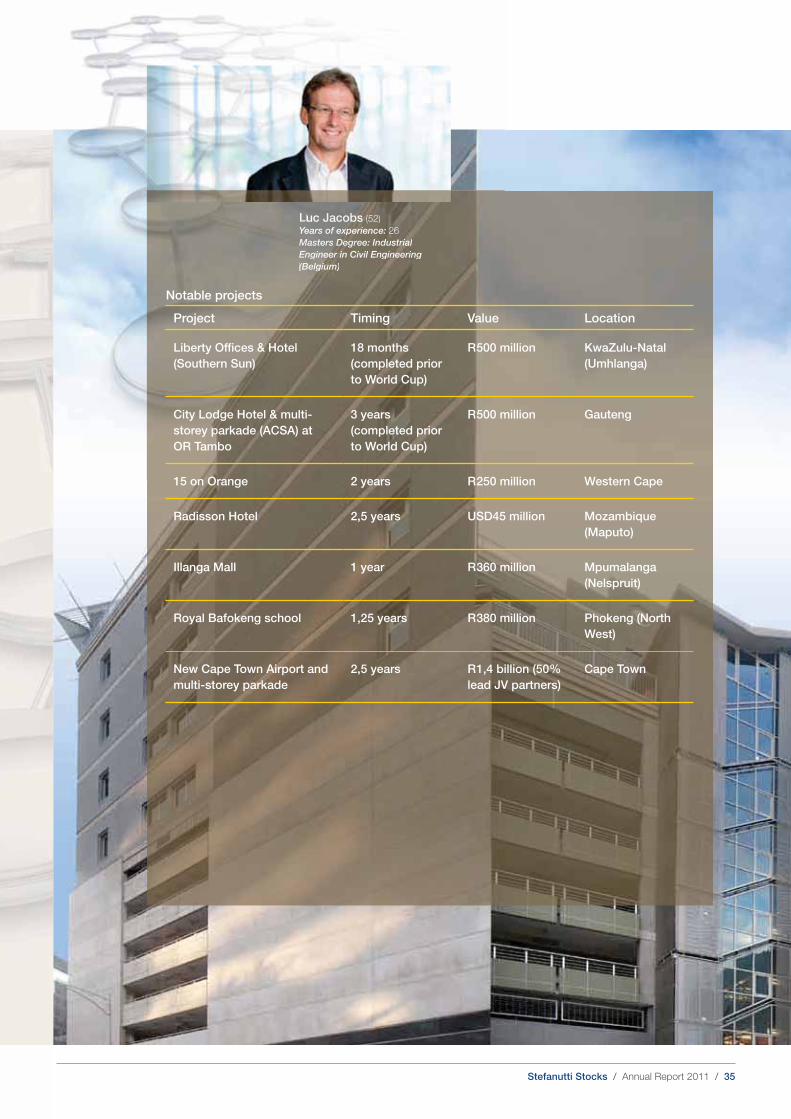
Stefanutti Stocks / Annual Report 2011 / 35
Man
ag
em
en
t revie
wO
pera
tion
al re
vie
wG
overn
an
ce
an
d
su
sta
inab
ilityF
inan
cia
l sta
tem
en
tsS
takeh
old
ers
’ info
rmatio
n
Luc Jacobs (52)
Years of experience: 26
Masters Degree: Industrial
Engineer in Civil Engineering
(Belgium)
Luc Jacobs (52)
Years of experience: 26
Masters Degree: Industrial
Engn ineer in Civil Engineering
(Beeeelgilll um)
Notable projects
Project Timing Value Location
Liberty Offices & Hotel
(Southern Sun)
18 months
(completed prior
to World Cup)
R 500 million KwaZulu-Natal
(Umhlanga)
City Lodge Hotel & multi-
storey parkade (ACSA) at
OR Tambo
3 years
(completed prior
to World Cup)
R 500 million Gauteng
15 on Orange 2 years R 250 million Western Cape
Radisson Hotel 2,5 years USD45 million Mozambique
(Maputo)
Illanga Mall 1 year R 360 million Mpumalanga
(Nelspruit)
Royal Bafokeng school 1,25 years R 380 million Phokeng (North
West)
New Cape Town Airport and
multi-storey parkade
2,5 years R 1,4 billion (50%
lead JV partners)
Cape Town

Stefanutti Stocks / Annual Report 2011 / 36
Go
vern
an
ce
an
d
su
sta
inab
ilityF
inan
cia
l sta
tem
en
tsS
takeh
old
ers
’ info
rmatio
nG
rou
p a
t a g
lan
ce
Man
ag
em
en
t revie
wO
pera
tion
al re
vie
w

Stefanutti Stocks / Annual Report 2011 / 37
““DDuring the year the busiinness unit has become one of the mmajor building
cccoontractors in the industry.. CConsiderablepprrogress has been achievedd in becoming aa pprreeffeerred contraccttoorr. WWee bbeelliieeve Qatar
will offffeerr tthhee ggrroouupp aa ffuurrtthheerr ooppppoortunniittyy to re-estabblliisshh the Middle East as a viiaabbllee
market. ””
Stephen PellChief Operating Officer
Stefanutti Stocks / Annual Report 2011 / 38
www.stefanuttistocks.com
Key disciplines – Building
www.stefanuttistocks.com
InternationalThe market
Both Al Tayer Stocks and Zener Steward endured a suppressed
market during the year. Although there appears to be a slight
improvement in the market, any real improvement will only be
felt in late 2011 or early 2012.
Plans are well-advanced for our operations to be sponsored in
Qatar, which would be a major step forward in establishing a
general construction business in the Middle East.
Looking ahead Qatar is expected to provide the most significant
opportunities for growth in the region, while Abu Dhabi should
see some improvement.
Strategic initiatives
➾ To strengthen existing partnerships
➾ To maintain the Free Zone trading licence
➾ To identify marine and roads & earthworks opportunities
Strategic initiatives
➾ Bolster and continue proactive, client-focused
leadership and management strategy
➾ Develop systems, structures and capacity to
support focused growth in Africa within a
risk-aware environment
➾ Develop core capabilities in support of major
projects and alternative procurement initiatives
➾ Grow and support the key client base,
leveraging the group’s multi-disciplinary capacity
and geographical footprint
Stefanutti Stocks / Annual Report 2011 / 39
Fin
an
cia
l sta
tem
en
tsS
takeh
old
ers
’ info
rmatio
nG
overn
an
ce
an
d
su
sta
inab
ility
Corporate governance
Approach to corporate governance and statement
of compliance
The King III Report took effect for financial years
commencing on or after 1 March 2010 and accordingly it
has been applied to Stefanutti Stocks in respect of the
year. Stefanutti Stocks welcomes the principles introduced
in King III and is committed to implementing the
recommendations contained therein to the extent deemed
appropriate and making sound business sense.
The board is satisfied that the group has, to a large extent,
applied the fundamental principles recommended by King
III during the year, and has identified particular areas with
elements marked for improvement including:
➾ ethical leadership and corporate citizenship;
➾ sustainability in terms of economic, social and
environmental performance;
➾ risk management;
➾ IT governance;
➾ monitoring of the group’s compliance with applicable
laws and regulations; and
➾ integrated reporting.
During the year the group established a King III Steering
Committee. The committee, comprising various functional
heads, co-ordinates and tracks progress made in terms of
applying the principles of King III and provides feedback to
the Audit, Governance and Risk Committee and the board.
The directors appreciate the integration of the group’s
strategy, risk and sustainability into its daily operations and
endeavours to ensure that all three components form part
of all strategic decisions, audits and assessments.
In line with the ‘apply or explain’ approach in the King III
Report, the directors will continue to state the extent to
which the company applies good corporate governance
principles to create and sustain value for stakeholders over
the short, medium and long term. The board does not
consider this a static responsibility and this process will
therefore be continually monitored to ensure ongoing
compliance in line with developments in corporate
governance in South Africa and internationally.
During the year a number of critical developments in group
corporate governance were achieved including:
➾ King III gap analysis;
➾ formation of Sustainability Committee (a sub-
committee of the Audit, Governance and Risk
Committee);
➾ ongoing improvements to board standards, procedures
and board packs;
➾ enhancements in the risk management processes and
reporting; and
➾ implementation of a formal compliance monitoring and
reporting process.
The board
The board remains responsible and accountable for the
performance and affairs of the group and has full control
over all the companies in the group. The directors exercise
sound judgement and leadership with integrity based on
principles of fairness, accountability and responsibility.
In line with the King III Report the board comprises a
majority of non-executive directors (six), four of whom are
classified as independent. A specific focus of the
independent King III Report gap analysis during the year
was the composition and independence of the board.
The independence of the directors was assessed and
confirmed by the Remuneration and Nominations
Committee based on the independence requirements set
out in the King III Report.
The board currently comprises:
➾ Executive directors: Chief Executive Officer Willie
Meyburgh, Chief Financial Officer Dermot Quinn, Chief
Operating Officer Stephen Pell and Schalk Ackerman
who are responsible for the day-to-day operations of
the group.
➾ Non-executive directors: Gino Stefanutti (Chairman)
and Bridgman Sithole (with alternate Joseph Fizelle)
represent significant shareholders at board level. The
board is satisfied that the benefits of the Chairman’s
experience (extending over 40 years and having been
involved in co-founding the group), knowledge of the
company and extensive industry expertise outweigh
the advantages of appointing an independent non-
executive chairman. The appointment of a Lead
Independent Director assures compliance with the
King III Report.
Gro
up
at a
gla
nce
Man
ag
em
en
t revie
wO
pera
tion
al re
vie
w
Stefanutti Stocks / Annual Report 2011 / 40
www.stefanuttistocks.com
➾ Independent non-executive directors: Mafika
Mkwanazi (Lead Independent Director), Kevin Eborall,
Herman Mashaba and Nomhle Canca are regarded as
independent and are neither significant shareholders in,
nor suppliers to Stefanutti Stocks.
The name and a brief curriculum vitae of each director is
set out on pages 6 and 7 of the annual report.
The board composition is reviewed annually, even in the
absence of an independent review such as the King III
Report gap analysis during the year, and any gaps in terms
of skills and experience are identified and addressed
accordingly. The board is aware of the need to increase
the number of independent directors and is involved in
an ongoing process to identify appropriately qualified
candidates.
The responsibilities of the Chairman and Chief Executive
Officer, and likewise the responsibility of executive and
non-executive directors, are strictly separated to ensure
that no director can exercise unrestricted powers of decision
making. The Chairman provides leadership and guidance to
the board and encourages proper deliberation on all matters
requiring the board’s attention while obtaining input from
other directors. The practice of appointing the Chairman on
an annual basis will be introduced in 2011 in accordance
with the recommendations of King III. The Chief Executive
Officer and other executive directors are responsible for
implementing strategy and operational decisions in respect
of operational issues. Non-executive directors contribute
their independent and objective knowledge and experience
to board deliberations. All non-executive directors are
sufficiently qualified to contribute industry skill and
expertise.
In line with recommendations of King III ongoing training for
directors is being addressed and enhanced. Non-executive
directors have unrestricted access to management at any
time, and further have access to the external auditors. All
directors are entitled, at the group’s expense, to seek
independent professional advice on any matters pertaining
to the group where they deem this to be necessary.
Board Charter
The Board Charter, which is being reviewed to incorporate
improvements recommended by the King III Report and
the Companies Act, codifies the board’s composition,
appointment, authorities, responsibilities and processes
and sets out the fiduciary duty and role of each director to
the company. The board’s responsibilities outlined in the
charter include:
➾ monitoring key risk areas, performance indicators and
management;
➾ reviewing the performance of the Chief Executive
Officer;
➾ reviewing the group’s financial results and procedures,
policies and codes of conduct;
➾ implementing the group’s plans and strategies;
➾ approving financial and non-financial objectives; and
➾ ensuring ethical behaviour and compliance with laws
and regulations.
To assist the board in discharging its collective
responsibilities, certain board responsibilities have been
delegated to the Audit, Governance and Risk Committee,
Remuneration and Nominations Committee, B-BBEE
Transformation Committee, Mergers, Acquisitions and
Disposals Committee (M&A Committee) and the newly
formed Sustainability Committee (a sub-committee of
the Audit, Governance and Risk Committee). The board
recognises that it is ultimately accountable and responsible
for the performance and affairs of the company and that
the use of delegated authorities to board committees in no
way absolves the board and its directors of the obligation
to carry out their duties and responsibilities.
In accordance with the Articles of Association, one-third
of the directors of the company are required to retire
by rotation at every Annual General Meeting and their
reappointment is subject to shareholders’ approval. In
addition, the appointment of all new directors are subject
to confirmation by shareholders at the Annual General
Meeting at the first opportunity after their initial
appointment. At the upcoming Annual General Meeting
KR Eborall, H Mashaba and B Stefanutti will retire by
rotation and being eligible, will offer themselves for
re-election.
Corporate governance continued
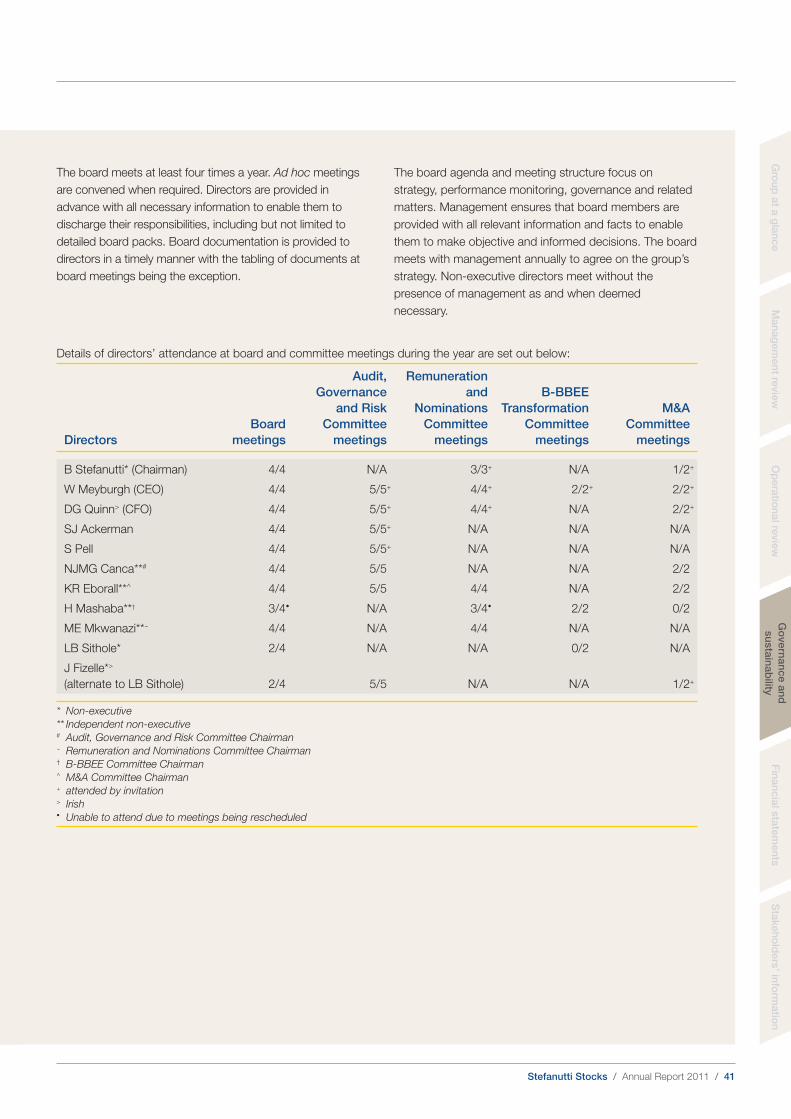
Stefanutti Stocks / Annual Report 2011 / 41
Fin
an
cia
l sta
tem
en
tsS
takeh
old
ers
’ info
rmatio
n
The board agenda and meeting structure focus on
strategy, performance monitoring, governance and related
matters. Management ensures that board members are
provided with all relevant information and facts to enable
them to make objective and informed decisions. The board
meets with management annually to agree on the group’s
strategy. Non-executive directors meet without the
presence of management as and when deemed
necessary.
The board meets at least four times a year. Ad hoc meetings
are convened when required. Directors are provided in
advance with all necessary information to enable them to
discharge their responsibilities, including but not limited to
detailed board packs. Board documentation is provided to
directors in a timely manner with the tabling of documents at
board meetings being the exception.
Details of directors’ attendance at board and committee meetings during the year are set out below:
Directors
Board
meetings
Audit,
Governance
and Risk
Committee
meetings
Remuneration
and
Nominations
Committee
meetings
B-BBEE
Transformation
Committee
meetings
M&A
Committee
meetings
B Stefanutti* (Chairman) 4/4 N/A 3/3+ N/A 1/2+
W Meyburgh (CEO) 4/4 5/5+ 4/4+ 2/2+ 2/2+
DG Quinn> (CFO) 4/4 5/5+ 4/4+ N/A 2/2+
SJ Ackerman 4/4 5/5+ N/A N/A N/A
S Pell 4/4 5/5+ N/A N/A N/A
NJMG Canca**# 4/4 5/5 N/A N/A 2/2
KR Eborall**^ 4/4 5/5 4/4 N/A 2/2
H Mashaba**† 3/4 N/A 3/4 2/2 0/2
ME Mkwanazi**~ 4/4 N/A 4/4 N/A N/A
LB Sithole* 2/4 N/A N/A 0/2 N/A
J Fizelle*>
(alternate to LB Sithole) 2/4 5/5 N/A N/A 1/2+
* Non-executive
** Independent non-executive# Audit, Governance and Risk Committee Chairman~ Remuneration and Nominations Committee Chairman† B-BBEE Committee Chairman^ M&A Committee Chairman+ attended by invitation> Irish
Unable to attend due to meetings being rescheduled
Go
vern
an
ce
an
d
su
sta
inab
ilityG
rou
p a
t a g
lan
ce
Man
ag
em
en
t revie
wO
pera
tion
al re
vie
w

Stefanutti Stocks / Annual Report 2011 / 42
www.stefanuttistocks.com
Board processes
Company Secretary
William Somerville has been Company Secretary since
May 2009. William is a qualified chartered secretary with
extensive experience in the company secretarial and
corporate governance arenas. He holds an ACIS, ACMA
and a Diploma in Corporate Law.
All directors have access to the Company Secretary,
who provides guidance to the board as a whole and to
individual directors with regards to how their responsibilities
should be discharged. He also oversees the induction of
new directors and ongoing training of directors and assists
the Chairman and Chief Executive Officer in setting the
annual board plan and board agendas, as well as in
formulating governance and board-related issues.
Regulatory and legislative compliance
The Audit, Governance and Risk Committee monitors the
group’s compliance with the recommendations as set out
in the King III Report, JSE Listings Requirements, the
Companies Act, the Corporate Laws Amendments Act
and other applicable legislation. PricewaterhouseCoopers
has been appointed to assess compliance with laws, rules
codes and standards.
The Company Secretary further liaises closely with the
group’s sponsor (Bridge Capital) where appropriate in
regard to compliance with the JSE Listings Requirements.
Share dealings and disclosures of interest
Directors are required to declare to the board their
shareholdings, additional directorships, potential conflicts
of interest and any dealings in securities of the company.
In addition, all directors and management with access
to financial information and any other price-sensitive
information are prohibited from dealing in the securities of
the company during ‘closed periods’ as defined by the
JSE. This is governed by the company’s share dealing
policy, which is reviewed by the board annually and also
contains “clearance to deal” provisions. An appropriate
communication is sent to all directors and affected staff
twice (at year-end and at interim period-end), alerting them
that the company is entering a closed period.
New appointments
New board appointments are proposed and vetted by the
Remuneration and Nominations Committee taking into
account a blend of skills, experience and diversity. The
committee is responsible for making recommendations for
final board approval in a formal and transparent process.
A formal induction programme is in place which now
includes introductions to key senior management, site
visits, an overview of group operations and guidelines on
corporate governance. In addition new directors are
provided with copies of the latest interim financial results
announcements, annual financial statements, board packs
and upcoming board meeting agendas as well as an
overview of the company’s accounting systems.
Board and committee effectiveness evaluation
The board periodically conducts an evaluation of its
effectiveness reviewing its mix of skills, the effectiveness
of the sub-committees and related corporate governance
matters. During the year, the Chairman conducted
one-on-one sessions with each individual director to
identify any areas of concern. A questionnaire-based
collective board and committee evaluation was also
conducted. No critical issues were identified and the
overall outcome was positive.
The Company Secretary provides ongoing development
for board members in the form of site visits and
presentations on specific technical topics.
There is no formal board mentorship programme in place
as it is not deemed necessary at this stage.
Succession planning
The formal succession plan for the Chief Executive Officer,
Chairman, board of directors and senior management is
reviewed annually by the Remuneration and Nominations
Committee. In addition the committee regularly reviews the
group’s succession strategy and makes recommendations
to the board.
Corporate governance continued
Stefanutti Stocks / Annual Report 2011 / 43
Fin
an
cia
l sta
tem
en
tsS
takeh
old
ers
’ info
rmatio
n
Board committees
All committees have satisfied their responsibilities during
the year in compliance with their formal charters. There is
transparency and full disclosure from these committees to
the board. Committee chairmen provide the board with
a verbal report on recent committee activities and the
minutes of committee meetings are available to the board.
In addition, the chairmen of the committees or a
nominated committee member attend the company’s
Annual General Meeting to answer any questions from
stakeholders pertaining to the relevant matters handled
by their respective committees. Committee effectiveness
evaluations are conducted annually. Findings and
recommendations are presented to the board, which
tables an action list to address any areas marked for
improvement. The charters of the Audit, Governance and
Risk Committee and the Remuneration and Nominations
Committee will be updated during the 2012 financial year
to accommodate the recommendations of the King III
Report and the Companies Act.
The Audit, Governance and Risk Committee report is set
out on page 69.
The Remuneration and Nominations Committee report is
set out on page 49.
Executive Committee (EXCO)
EXCO consists of executive directors Willie Meyburgh,
Schalk Ackerman, Stephen Pell and Dermot Quinn as well
as senior management: Luc Jacobs, Siphiwe Nzimande,
Jan Oberholzer, Elardus Rademeyer, Mike Smith and
Frik Venter. It meets monthly to assist the Chief Executive
Officer in the management of group operations and
finances. The committee reports directly to the Chief
Executive Officer, who in turn reports to the board.
B-BBEE Transformation Committee
The board believes that transformation is a business
imperative for the company. The committee assists and
advises the board on all B-BBEE related matters,
transformation and corporate social investment. It is
chaired by independent non-executive director Herman
Mashaba and also includes non-executive director
Bridgman Sithole. The committee operates under a written
charter approved by the board.
The committee’s role, duties and achievements over the
past year included:
➾ monitoring the company’s compliance with relevant
industry B-BBEE Codes of Good Practice;
➾ ensuring management embraces the principles of
transformation on an enterprise-wide basis across
all facets of the company’s activities;
➾ developing and implementing an appropriate
transformation strategy;
➾ regularly reviewing policies, plans and processes aimed
at facilitating transformation across the company; and
➾ reviewing the integrated annual reporting to
stakeholders on aspects of transformation.
Mergers, Acquisitions and Disposals Committee
The committee is chaired by independent non-executive
director Kevin Eborall and further comprises Nomhle
Canca and Herman Mashaba. The board has mandated
the committee to review and approve mergers,
acquisitions and disposals, subject to specific limits.
Meetings are held when required. Attendance at the
meetings is set out in the table on page 41.
Sustainability Committee
The committee was formed during the year as a sub-
committee of the Audit, Governance and Risk Committee.
It is chaired by independent non-executive director
Nomhle Canca. The main purpose of the committee is to
assist and advise the Audit, Governance and Risk
Committee and the board with regards to sustainability
matters and disclosure thereof.
Go
vern
an
ce
an
d
su
sta
inab
ilityG
rou
p a
t a g
lan
ce
Man
ag
em
en
t revie
wO
pera
tion
al re
vie
w
Stefanutti Stocks / Annual Report 2011 / 44
www.stefanuttistocks.com
Audit, Governance and Risk Committee
Refer to the Audit, Governance and Risk Committee report
on page 69.
External audit
The external auditors are responsible for reporting on
whether the annual financial statements are fairly presented
in compliance with IFRS. The preparation of the annual
financial statements remains the responsibility of the
directors. The Audit, Governance and Risk Committee
evaluates the independence and effectiveness of the
external auditors and considers whether any non-audit
services rendered by such auditors substantively impair
their independence. In this regard, a non-audit services
policy is in place, which is reviewed annually by the Audit,
Governance and Risk Committee.
Internal audit
The Group Internal Audit Manager heads the formal
internal audit function. This is guided by an Internal
Audit Charter which sets out the function’s purpose,
independence, ethics, duties, responsibilities and scope.
The internal audit function establishes appropriate policies
and procedures to guide the internal audit and is tasked
with evaluating the group’s exposure to risk while also
evaluating the adequacy and effectiveness of controls
and risk management processes. Internal audit further
assesses Stefanutti Stocks’ corporate governance.
The function ensures that the internal audit resources are
appropriate and sufficient for the group and that the team
has the appropriate professional qualifications and skills to
maintain the internal audit competence.
The Group Internal Audit Manager reports to the Chief
Executive Officer on an administrative basis and to the
Audit, Governance and Risk Committee on a functional
basis. The Group Internal Audit Manager has unhindered
access to the Chief Executive Officer, Chairman of the
Audit, Governance and Risk Committee and the Chairman
of the board.
The internal audit plan is overseen by the Audit,
Governance and Risk Committee and is based on the
key risks identified by executive management.
During the year a comprehensive review commenced,
including feedback from management, external auditors
and other stakeholders. Any exceptions noted were
adequately elucidated by management in most instances.
Where the explanation was deemed insufficient the
exceptions were further investigated and/or corrective
action taken.
At any time the Audit, Governance and Risk Committee is
entitled to appoint an independent internal review, the
results of which will be reported to the Chief Executive
Officer and the committee chairman. In addition an
external review of the internal audit function is conducted
every four years by the Institute of Internal Auditors or
another suitably qualified independent party.
Internal control
The importance of internal control systems and
management of risks are clearly communicated to all
employees so that they have a clear understanding of their
roles and obligations in this regard. Overall the board
remains responsible for the management of the internal
control systems with the assistance of the Audit,
Governance and Risk Committee. These systems of
internal control are designed to provide reasonable but not
absolute assurance as to the integrity and reliability of the
annual financial statements, to safeguard and maintain
accountability of the group’s assets and to identify and
minimise significant fraud, potential liability, loss and
material misstatement while complying with applicable
statutory laws and regulations.
There are inherent limitations to the effectiveness of any
system of internal control, including the possibility of
human error and the circumvention or overriding of
controls. The system is therefore designed to manage
rather than eliminate risk of failure and opportunity risk.
Nothing has come to the attention of the board to indicate
that there has been a material breakdown in the internal
systems of control during the year.
Corporate governance continued
Stefanutti Stocks / Annual Report 2011 / 45
Fin
an
cia
l sta
tem
en
tsS
takeh
old
ers
’ info
rmatio
n
Risk management
The board is responsible for the governance of risk and
approves the Risk Management Framework, policies and
guidelines for the group. In addition the Audit, Governance
and Risk Committee is responsible for monitoring risk
management. In the context of the group’s business, ‘risk’
is deemed to be the impact of uncertainty on the group in
terms of financial loss, and/or reputational harm, and/or
the consequences of not complying with applicable
legislation.
The group’s philosophy is to be ‘Risk Aware’ and not ‘Risk
Averse’ and recognise potential opportunities flowing from
selected risks. This is informed by the principle that the
act of being in business is to be exposed to prudent
uncertainty, and hence risk, for the purpose of leveraging
opportunities and deriving benefit from such uncertainty.
Management is responsible for identifying and mitigating
risks, and in the event of occurrence of non-beneficial
risks, to manage the consequences so as to limit the
impact on all areas of the business.
The board sets and regularly updates the group’s risk
appetite. This is defined as the tolerance levels for and
consequential limits of risks. Such levels and limits are
assessed and set in context such as, for example, health
and safety, project value, project scope, new markets,
mergers and acquisitions. The risk appetite is evidenced
through the approved business plans and budgets,
delegations of authority and other explicit/specific
decisions and/or criteria.
The various levels of management in the group are
delegated the responsibility for the design, implementation
and monitoring of the risk management plans and to
ensure their suitability to all areas of the business.
During the year the group reviewed its risk management
policy to further enhance its effectiveness and align it with
the principles of the King III Report. The overall risk
management is effected through three focused but
integrated approaches – risk management, legal
compliance assessment and internal audit. The key
components of the group’s opportunity and risk
management process are:
➾ governance of risk by the group’s board in terms of
the King III Report;
➾ implementation of a group risk management framework
and policies and guidelines;
➾ regular assessment of risks and recording of these
in updated risk registers;
➾ implementation of risk management plans;
➾ ongoing monitoring of risk management;
➾ reporting on key risks, materialised risks and actions
managing these; and
➾ obtaining assurance, through internal audit procedures,
that the systems of internal control and risk
management are effective.
The approach has been further enhanced by re-
emphasising the categorisation of risks into those strategic
risks that impact at group level (and hence materially may
impact the shareholders), those risks that may affect the
business units and general operational risks.
The overall risk management approach is to ensure that
risk management is embedded in all activities and
processes carried out in the group and that it is the
responsibility of all, irrespective of designation, and takes
place across the organisation irrespective of physical
location.
Go
vern
an
ce
an
d
su
sta
inab
ilityG
rou
p a
t a g
lan
ce
Man
ag
em
en
t revie
wO
pera
tion
al re
vie
w
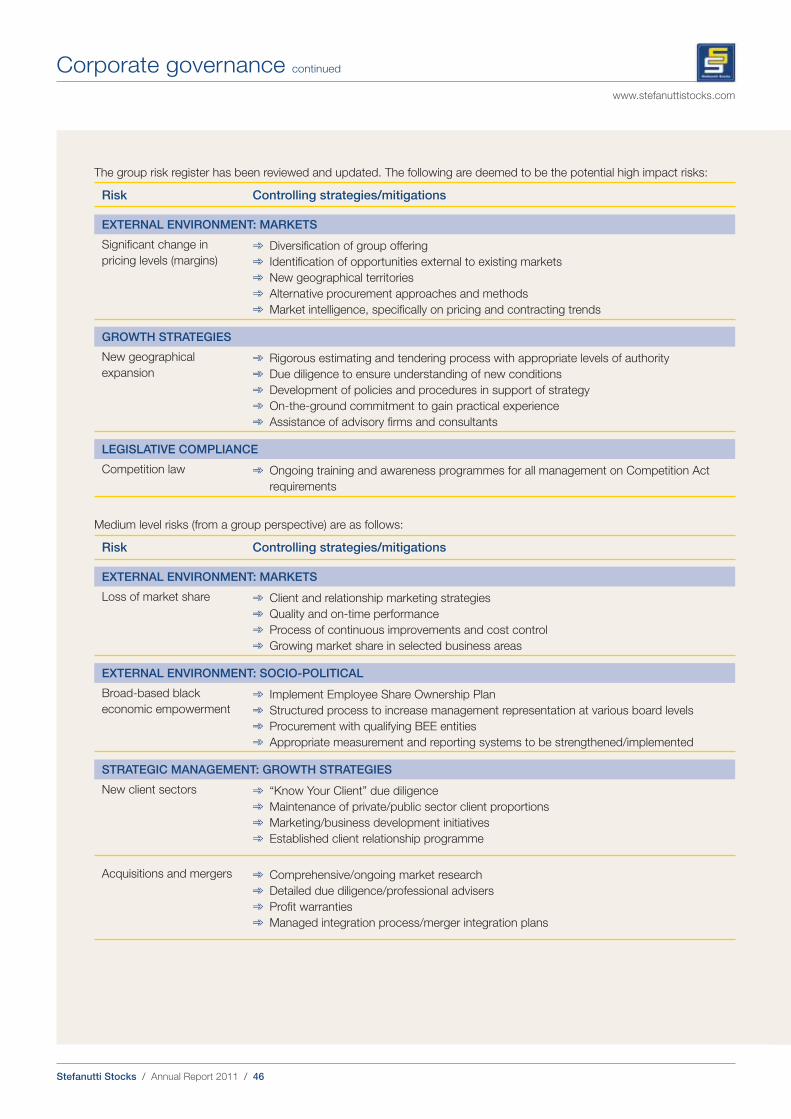
Stefanutti Stocks / Annual Report 2011 / 46
www.stefanuttistocks.com
The group risk register has been reviewed and updated. The following are deemed to be the potential high impact risks:
Risk Controlling strategies/mitigations
EXTERNAL ENVIRONMENT: MARKETS
Significant change in
pricing levels (margins)
➾ Diversification of group offering
➾ Identification of opportunities external to existing markets
➾ New geographical territories
➾ Alternative procurement approaches and methods
➾ Market intelligence, specifically on pricing and contracting trends
GROWTH STRATEGIES
New geographical
expansion
➾ Rigorous estimating and tendering process with appropriate levels of authority
➾ Due diligence to ensure understanding of new conditions
➾ Development of policies and procedures in support of strategy
➾ On-the-ground commitment to gain practical experience
➾ Assistance of advisory firms and consultants
LEGISLATIVE COMPLIANCE
Competition law ➾ Ongoing training and awareness programmes for all management on Competition Act
requirements
Medium level risks (from a group perspective) are as follows:
Risk Controlling strategies/mitigations
EXTERNAL ENVIRONMENT: MARKETS
Loss of market share ➾ Client and relationship marketing strategies
➾ Quality and on-time performance
➾ Process of continuous improvements and cost control
➾ Growing market share in selected business areas
EXTERNAL ENVIRONMENT: SOCIO-POLITICAL
Broad-based black
economic empowerment
➾ Implement Employee Share Ownership Plan
➾ Structured process to increase management representation at various board levels
➾ Procurement with qualifying BEE entities
➾ Appropriate measurement and reporting systems to be strengthened/implemented
STRATEGIC MANAGEMENT: GROWTH STRATEGIES
New client sectors ➾ “Know Your Client” due diligence
➾ Maintenance of private/public sector client proportions
➾ Marketing/business development initiatives
➾ Established client relationship programme
Acquisitions and mergers ➾ Comprehensive/ongoing market research
➾ Detailed due diligence/professional advisers
➾ Profit warranties
➾ Managed integration process/merger integration plans
Corporate governance continued
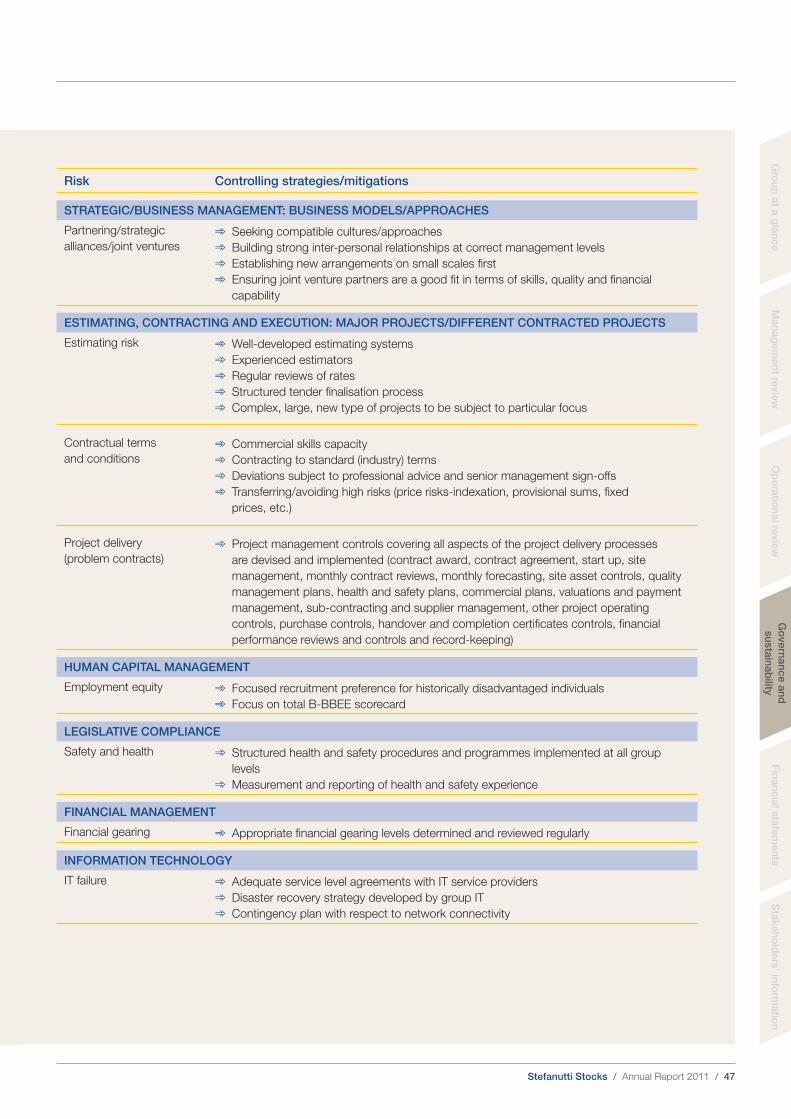
Stefanutti Stocks / Annual Report 2011 / 47
Fin
an
cia
l sta
tem
en
tsS
takeh
old
ers
’ info
rmatio
n
Risk Controlling strategies/mitigations
STRATEGIC/BUSINESS MANAGEMENT: BUSINESS MODELS/APPROACHES
Partnering/strategic
alliances/joint ventures
➾ Seeking compatible cultures/approaches
➾ Building strong inter-personal relationships at correct management levels
➾ Establishing new arrangements on small scales first
➾ Ensuring joint venture partners are a good fit in terms of skills, quality and financial
capability
ESTIMATING, CONTRACTING AND EXECUTION: MAJOR PROJECTS/DIFFERENT CONTRACTED PROJECTS
Estimating risk ➾ Well-developed estimating systems
➾ Experienced estimators
➾ Regular reviews of rates
➾ Structured tender finalisation process
➾ Complex, large, new type of projects to be subject to particular focus
Contractual terms
and conditions
➾ Commercial skills capacity
➾ Contracting to standard (industry) terms
➾ Deviations subject to professional advice and senior management sign-offs
➾ Transferring/avoiding high risks (price risks-indexation, provisional sums, fixed
prices, etc.)
Project delivery
(problem contracts)
➾ Project management controls covering all aspects of the project delivery processes
are devised and implemented (contract award, contract agreement, start up, site
management, monthly contract reviews, monthly forecasting, site asset controls, quality
management plans, health and safety plans, commercial plans, valuations and payment
management, sub-contracting and supplier management, other project operating
controls, purchase controls, handover and completion certificates controls, financial
performance reviews and controls and record-keeping)
HUMAN CAPITAL MANAGEMENT
Employment equity ➾ Focused recruitment preference for historically disadvantaged individuals
➾ Focus on total B-BBEE scorecard
LEGISLATIVE COMPLIANCE
Safety and health ➾ Structured health and safety procedures and programmes implemented at all group
levels
➾ Measurement and reporting of health and safety experience
FINANCIAL MANAGEMENT
Financial gearing ➾ Appropriate financial gearing levels determined and reviewed regularly
INFORMATION TECHNOLOGY
IT failure ➾ Adequate service level agreements with IT service providers
➾ Disaster recovery strategy developed by group IT
➾ Contingency plan with respect to network connectivity
Go
vern
an
ce
an
d
su
sta
inab
ilityG
rou
p a
t a g
lan
ce
Man
ag
em
en
t revie
wO
pera
tion
al re
vie
w
Stefanutti Stocks / Annual Report 2011 / 48
www.stefanuttistocks.com
Insurance
Considering the inherent and inevitable risks for a large
multi-disciplinary group, management deemed it prudent
to transfer certain risks to reputable insurance
organisations.
In line with sound risk management the group looks to its
insurers for protection against losses which could be, for
the most part, catastrophic in nature. Stefanutti Stocks
maintains comprehensive insurance cover for such losses.
Code of Ethics (the Code)
A formal Code, which was updated in October 2010, is
in place setting out standards of integrity and ethics in
dealings with suppliers, customers, business partners,
stakeholders, government and society at large. Every
employee of Stefanutti Stocks is expected to subscribe
to the Code, which requires all to act with honesty and
integrity in all dealings with stakeholders and to interact
with fairness, dignity and respect to create and protect
a credible and well-reputed business and working
environment free from harassment and discrimination.
During the year competition law compliance training was
presented to 85 employees including directors and senior
management across all business units.
In addition a number of the group’s engineers are
members of The Engineering Council of South Africa or
The South African Council for Project and Construction
Management Professions and comply with their strict
codes of professional conduct and ethics.
IT governance
During the year a formal group IT Steering Committee
was established and group IT policies, procedures and
guidelines are being reviewed and properly documented.
In addition to the group IT Steering Committee, a formal
Desktop Support Forum and a formal Application Support
Forum, which meets monthly, has been established.
Siphiwe Nzimande has been appointed to oversee
day-to-day management of group IT, reporting to the
board and EXCO. A Chief Information Officer (CIO)/General
Manager for Information Technology Services will be
appointed in the current year to oversee all IT information
systems and infrastructure.
Initiatives during the year aimed at minimising IT risk,
increasing operational efficiency and/or further ensuring
adequate IT governance included:
➾ optimisation of the WAN infrastructure project which
involved the formalisation, streamlining and
documentation of the group network, server and
services that make up the network infrastructure;
➾ virtualisation of servers at the hosting site, which
included the installation of hardware and software. This
project vastly improved readiness to handle disasters
and recovery of information and data;
➾ vulnerability and penetration testing conducted by an
independent service provider to give assurance to the
board and IT management that the:
– network infrastructure is secure;
– risks to the network infrastructure are understood
and mitigated; and
– security posture of the network infrastructure is
improved/continually improved/of a sufficient
standard; and
➾ a review by an independent service provider to uncover
weaknesses and give assurance to the board and
IT management that governance, controls, policies and
procedures are in place.
The implementation of strategic initiatives aimed at
significantly improving the security and reliability of the
network are in progress, following the independent internal
audits and tests performed by the independent service
providers during the year. Going forward Stefanutti Stocks
will conduct similar independent audits and tests at least
every two years.
Corporate governance continued
Stefanutti Stocks / Annual Report 2011 / 49
Fin
an
cia
l sta
tem
en
tsS
takeh
old
ers
’ info
rmatio
n
The committee comprises Lead Independent Director
Mafika Mkwanazi and independent non-executive directors
Kevin Eborall and Herman Mashaba. In addition the Chief
Executive Officer, Chief Financial Officer, Group Human
Resources Executive and board Chairman attend meetings
by invitation but are excluded from deliberations in respect
of their own remuneration. The Company Secretary is the
secretary of the committee.
A formal charter, which is reviewed annually, sets out the
committee’s composition, role and responsibilities. In the
current year the charter will be updated in terms of the
King III Report and the Companies Act.
The charter sets out the committee’s role and
responsibilities including:
➾ assessing the composition of the board and any gaps
in this regard;
➾ identifying and recommending nominees to the board
(before nomination appropriate background checks
are performed on proposed new directors);
➾ recommending to the board the basic salaries,
benefits, annual bonuses, performance-based
incentives, share-based incentives, pensions and other
benefits paid to the directors;
➾ annually reviewing directors’ independence and those
directors standing for re-election at the Annual General
Meeting;
➾ assessing executive remuneration; and
➾ determining short- and long-term incentive pay
structures for group executives.
Responsibility for senior management appointments has
been assigned to the Chief Executive Officer. The Chief
Executive Officer provides feedback to the committee and
the board in this regard.
The committee met four times during the year. Attendance
at committee meetings is set out on page 41.
Remuneration philosophy
Underpinned by the belief that employees’ remuneration
packages remain an effective tool to incentivise and
retain key personnel, the group benchmarks executive
remuneration against industry norms, while individual and
group performance targets are also taken into account.
The group does not rely solely on market surveys but also
takes applicants’ remuneration expectations and the
remuneration policies of joint venture partners into
consideration. Annual bonuses are aligned with group
performance and share schemes align executives’
interests with those of shareholders. The group has a
remuneration policy which includes basic pay, incentive
bonuses and a separate policy dealing with share
schemes. The group does not have a defined benefit plan
obligation.
The King III recommendation that shareholders should
pass a non-binding advisory vote on the company’s yearly
remuneration policy is not deemed appropriate at this
stage but will be considered annually.
All permanent salaried employees of Stefanutti Stocks
compulsorily belong to the group pension and medical aid.
Membership of SAFRICAN (funeral policy outside the
pension fund) is also compulsory in South Africa.
Stefanutti Stocks Umbrella Pension Fund includes life
cover, spouse life cover, permanent health insurance
(disability), dread disease cover for the member only, family
protector (including funeral benefit), an education benefit
and a health premium waiver if the employee is also a
member of Momentum Health Medical Aid.
All new salaried employees compulsorily join Momentum
Health Medical Aid unless a dependant on their spouses’
medical aid.
Hourly paid employees enjoy benefits relevant and
applicable to industry and/or collective agreements.
Membership of SAFRICAN is also compulsory for Limited
Duration Contract (LDC) employees.
Non-executive directors are remunerated with a per
meeting fee, which is presented for approval by
shareholders at the Annual General Meeting (see Notice of
Annual General Meeting incorporated in this annual report).
Directors’ emoluments are set out in the Directors’ report.
ME Mkwanazi
Remuneration and Nominations Committee Chairman
18 July 2011
Johannesburg
Remuneration and Nominations Committee report
Go
vern
an
ce
an
d
su
sta
inab
ilityG
rou
p a
t a g
lan
ce
Man
ag
em
en
t revie
wO
pera
tion
al re
vie
w
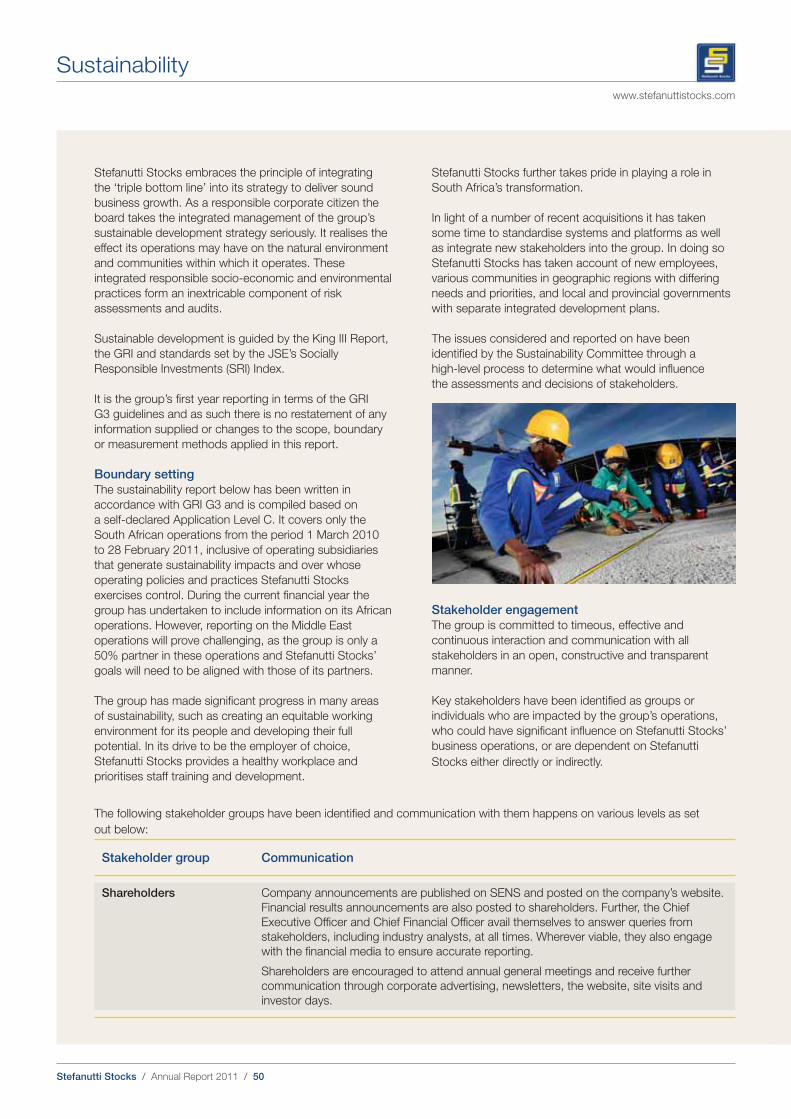
Stefanutti Stocks / Annual Report 2011 / 50
www.stefanuttistocks.com
Stefanutti Stocks embraces the principle of integrating
the ‘triple bottom line’ into its strategy to deliver sound
business growth. As a responsible corporate citizen the
board takes the integrated management of the group’s
sustainable development strategy seriously. It realises the
effect its operations may have on the natural environment
and communities within which it operates. These
integrated responsible socio-economic and environmental
practices form an inextricable component of risk
assessments and audits.
Sustainable development is guided by the King III Report,
the GRI and standards set by the JSE’s Socially
Responsible Investments (SRI) Index.
It is the group’s first year reporting in terms of the GRI
G3 guidelines and as such there is no restatement of any
information supplied or changes to the scope, boundary
or measurement methods applied in this report.
Boundary setting The sustainability report below has been written in
accordance with GRI G3 and is compiled based on
a self-declared Application Level C. It covers only the
South African operations from the period 1 March 2010
to 28 February 2011, inclusive of operating subsidiaries
that generate sustainability impacts and over whose
operating policies and practices Stefanutti Stocks
exercises control. During the current financial year the
group has undertaken to include information on its African
operations. However, reporting on the Middle East
operations will prove challenging, as the group is only a
50% partner in these operations and Stefanutti Stocks’
goals will need to be aligned with those of its partners.
The group has made significant progress in many areas
of sustainability, such as creating an equitable working
environment for its people and developing their full
potential. In its drive to be the employer of choice,
Stefanutti Stocks provides a healthy workplace and
prioritises staff training and development.
The following stakeholder groups have been identified and communication with them happens on various levels as set
out below:
Stakeholder group Communication
Shareholders Company announcements are published on SENS and posted on the company’s website.
Financial results announcements are also posted to shareholders. Further, the Chief
Executive Officer and Chief Financial Officer avail themselves to answer queries from
stakeholders, including industry analysts, at all times. Wherever viable, they also engage
with the financial media to ensure accurate reporting.
Shareholders are encouraged to attend annual general meetings and receive further
communication through corporate advertising, newsletters, the website, site visits and
investor days.
Stefanutti Stocks further takes pride in playing a role in
South Africa’s transformation.
In light of a number of recent acquisitions it has taken
some time to standardise systems and platforms as well
as integrate new stakeholders into the group. In doing so
Stefanutti Stocks has taken account of new employees,
various communities in geographic regions with differing
needs and priorities, and local and provincial governments
with separate integrated development plans.
The issues considered and reported on have been
identified by the Sustainability Committee through a
high-level process to determine what would influence
the assessments and decisions of stakeholders.
Stakeholder engagementThe group is committed to timeous, effective and
continuous interaction and communication with all
stakeholders in an open, constructive and transparent
manner.
Key stakeholders have been identified as groups or
individuals who are impacted by the group’s operations,
who could have significant influence on Stefanutti Stocks’
business operations, or are dependent on Stefanutti
Stocks either directly or indirectly.
Sustainability
Stefanutti Stocks / Annual Report 2011 / 51
Fin
an
cia
l sta
tem
en
tsS
takeh
old
ers
’ info
rmatio
nG
rou
p a
t a g
lan
ce
Man
ag
em
en
t revie
wO
pera
tion
al re
vie
wG
overn
an
ce
an
d
su
sta
inab
ility
Stakeholder group Communication
Employees A culture of open communication is encouraged through employee representative
committees, pension fund trustee meetings, training sessions, performance reviews, e-mail
announcements and regular departmental and general staff meetings. In addition, notice
boards, the group’s newsletters News for Now and Benchmark and the website are used
to communicate with staff. Employees are also invited to send any questions/suggestions
to: [email protected].
The National Union of Mineworkers (NUM) and the Building, Construction and Allied
Workers Union (BCAWU) are currently the representative trade unions in the group.
Further, workers are also represented by United Chemical Industries Mining Electrical State
Health and Aligned Workers (UCIMESHAWU), El Shadai Worker’s Union of South Africa,
Association of Mine Workers and Construction Union (AMCU). There was no internal
labour unrest experienced during the year.
Structures specifically implemented a cellphone telephonic communication package. Using
this system, employees are able to send reminders, queries and other information via SMS
to the various Human Resources departments. The system has proven to be successful
and will be rolled out to all other business units.
Regular toolbox talks and bi-weekly staff meetings are held on all sites to communicate
any new information and handle day-to-day queries and questions. Site visits for
employees are arranged by the Human Resources department.
Communities Liaison meetings, telephone calls with community leaders, formal functions
Customers Project meetings, formal functions, e-mail updates, telephone calls, letters, personal visits
Suppliers Project meetings, formal functions, e-mail updates, telephone calls, letters, personal visits
➾ The South African Federation of Civil Engineering
Contractors (SAFCEC)
➾ The Geotechnical Division of SAICE
Our employees
Headcounts
Stefanutti Stocks aims to be the sector’s employer of
choice. To ensure its diverse, skilled and experienced
workforce is enabled to act with professionalism and
competency at all times, the group has measures in place
to ensure the right people are assigned to the right roles.
These include identifying individual development,
promoting equal opportunities and performance-based
advancement.
In addition, wherever viable the group procures labour from
local communities in areas in which it operates to ensure
the local population benefit.
Within South Africa, the group employs a total of
8 585 people of whom 2 017 are salaried employees.
Industry associations
Employees of Stefanutti Stocks have the right to freedom
of association and to actively participate in various national
and industry-level bargaining fora.
The group is a member of the following industry
associations:
➾ Gauteng Voluntary Bargaining Council and Builders
Union Bargaining Council
➾ Master Builders South Africa (MBSA)
➾ The Association of South African Quantity Surveyors
(ASAQS)
➾ The Building Industrial Federation of South Africa
(BIFSA)
➾ The Construction Education and Training Authority
(CETA)
➾ The Engineering Council of South Africa (ECSA)
➾ The South African Institute of Civil Engineering (SAICE)
➾ The South African Council for Project and Construction
Management Professions (SACPCMP)
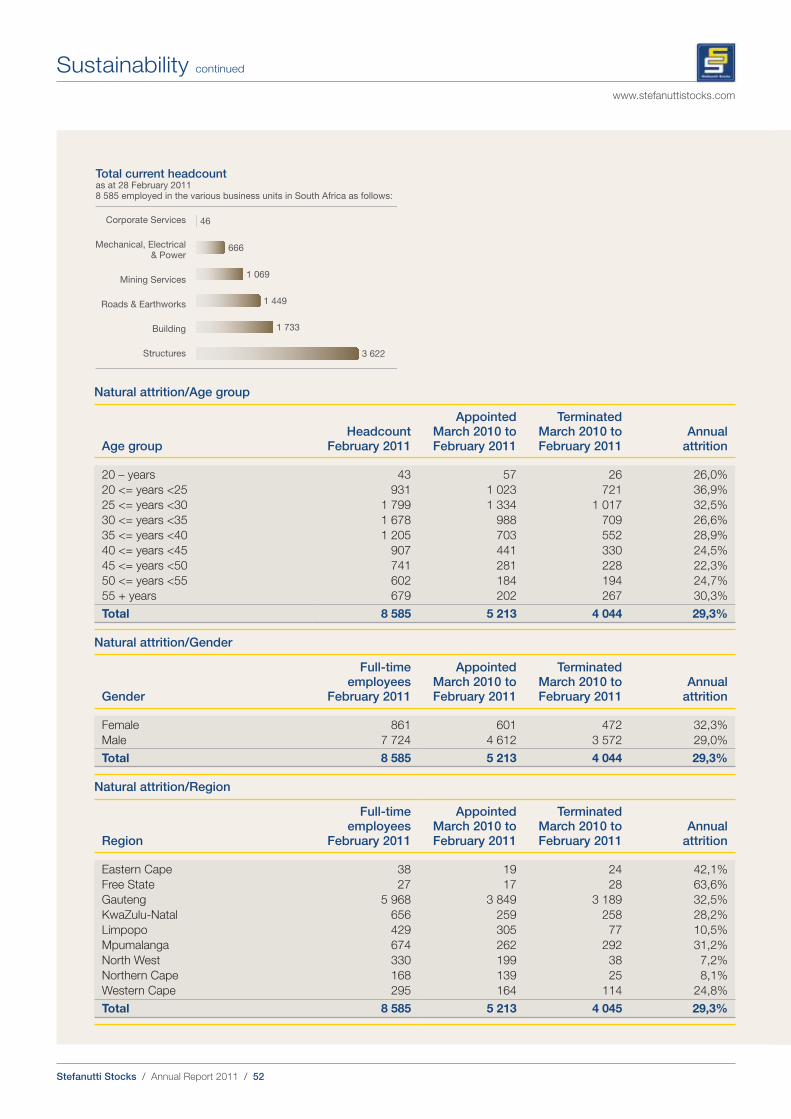
Stefanutti Stocks / Annual Report 2011 / 52
www.stefanuttistocks.com
Total current headcountas at 28 February 2011 8 585 employed in the various business units in South Africa as follows:
Corporate Services
Mechanical, Electrical& Power
Mining Services
Roads & Earthworks
Building
Structures
46
666
1 069
1 449
1 733
3 622
Natural attrition/Age group
Age groupHeadcount
February 2011
Appointed March 2010 to February 2011
Terminated March 2010 to February 2011
Annual attrition
20 – years 43 57 26 26,0%
20 <= years <25 931 1 023 721 36,9%
25 <= years <30 1 799 1 334 1 017 32,5%
30 <= years <35 1 678 988 709 26,6%
35 <= years <40 1 205 703 552 28,9%
40 <= years <45 907 441 330 24,5%
45 <= years <50 741 281 228 22,3%
50 <= years <55 602 184 194 24,7%
55 + years 679 202 267 30,3%
Total 8 585 5 213 4 044 29,3%
Natural attrition/Gender
Gender
Full-timeemployees
February 2011
Appointed March 2010 to February 2011
Terminated March 2010 to February 2011
Annual attrition
Female 861 601 472 32,3%
Male 7 724 4 612 3 572 29,0%
Total 8 585 5 213 4 044 29,3%
Natural attrition/Region
Region
Full-timeemployees
February 2011
Appointed March 2010 to February 2011
Terminated March 2010 to February 2011
Annual attrition
Eastern Cape 38 19 24 42,1%
Free State 27 17 28 63,6%
Gauteng 5 968 3 849 3 189 32,5%
KwaZulu-Natal 656 259 258 28,2%
Limpopo 429 305 77 10,5%
Mpumalanga 674 262 292 31,2%
North West 330 199 38 7,2%
Northern Cape 168 139 25 8,1%
Western Cape 295 164 114 24,8%
Total 8 585 5 213 4 045 29,3%
Sustainability continued
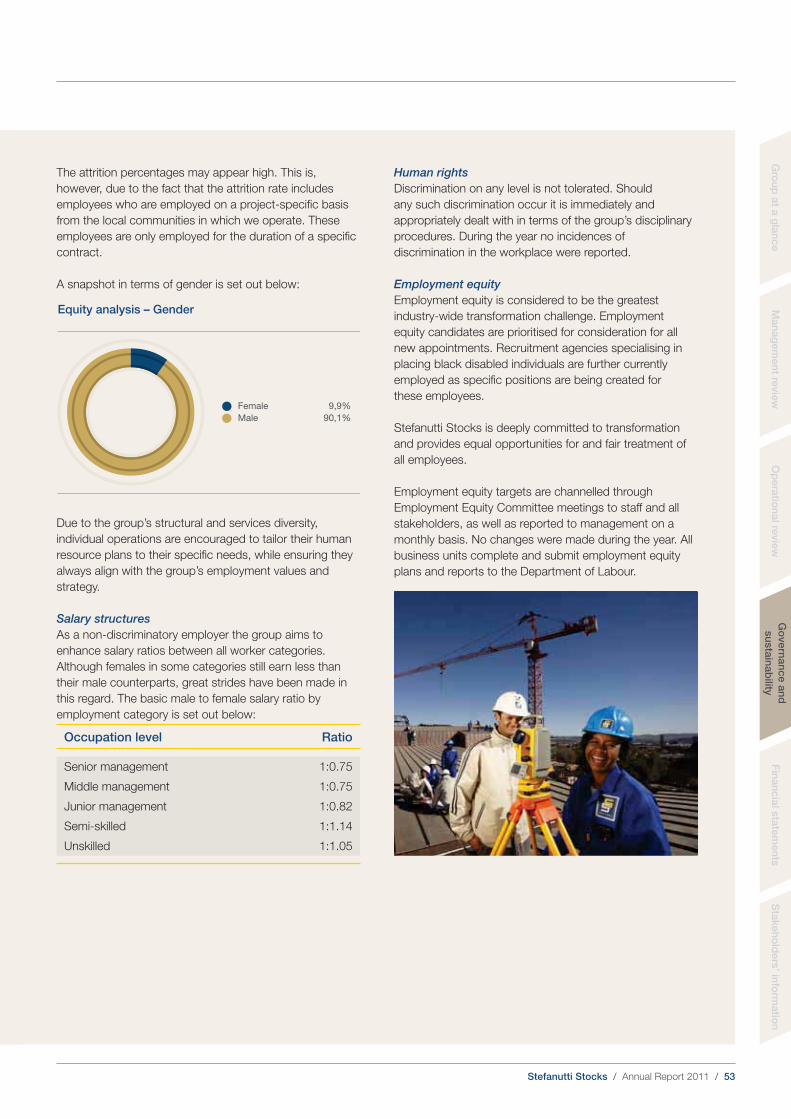
Stefanutti Stocks / Annual Report 2011 / 53
Fin
an
cia
l sta
tem
en
tsS
takeh
old
ers
’ info
rmatio
n
The attrition percentages may appear high. This is,
however, due to the fact that the attrition rate includes
employees who are employed on a project-specific basis
from the local communities in which we operate. These
employees are only employed for the duration of a specific
contract.
A snapshot in terms of gender is set out below:
Equity analysis – Gender
Female 9,9%
Male 90,1%
Due to the group’s structural and services diversity,
individual operations are encouraged to tailor their human
resource plans to their specific needs, while ensuring they
always align with the group’s employment values and
strategy.
Salary structures
As a non-discriminatory employer the group aims to
enhance salary ratios between all worker categories.
Although females in some categories still earn less than
their male counterparts, great strides have been made in
this regard. The basic male to female salary ratio by
employment category is set out below:
Occupation level Ratio
Senior management 1:0.75
Middle management 1:0.75
Junior management 1:0.82
Semi-skilled 1:1.14
Unskilled 1:1.05
Human rights
Discrimination on any level is not tolerated. Should
any such discrimination occur it is immediately and
appropriately dealt with in terms of the group’s disciplinary
procedures. During the year no incidences of
discrimination in the workplace were reported.
Employment equity
Employment equity is considered to be the greatest
industry-wide transformation challenge. Employment
equity candidates are prioritised for consideration for all
new appointments. Recruitment agencies specialising in
placing black disabled individuals are further currently
employed as specific positions are being created for
these employees.
Stefanutti Stocks is deeply committed to transformation
and provides equal opportunities for and fair treatment of
all employees.
Employment equity targets are channelled through
Employment Equity Committee meetings to staff and all
stakeholders, as well as reported to management on a
monthly basis. No changes were made during the year. All
business units complete and submit employment equity
plans and reports to the Department of Labour.
Gro
up
at a
gla
nce
Man
ag
em
en
t revie
wO
pera
tion
al re
vie
wG
overn
an
ce
an
d
su
sta
inab
ility
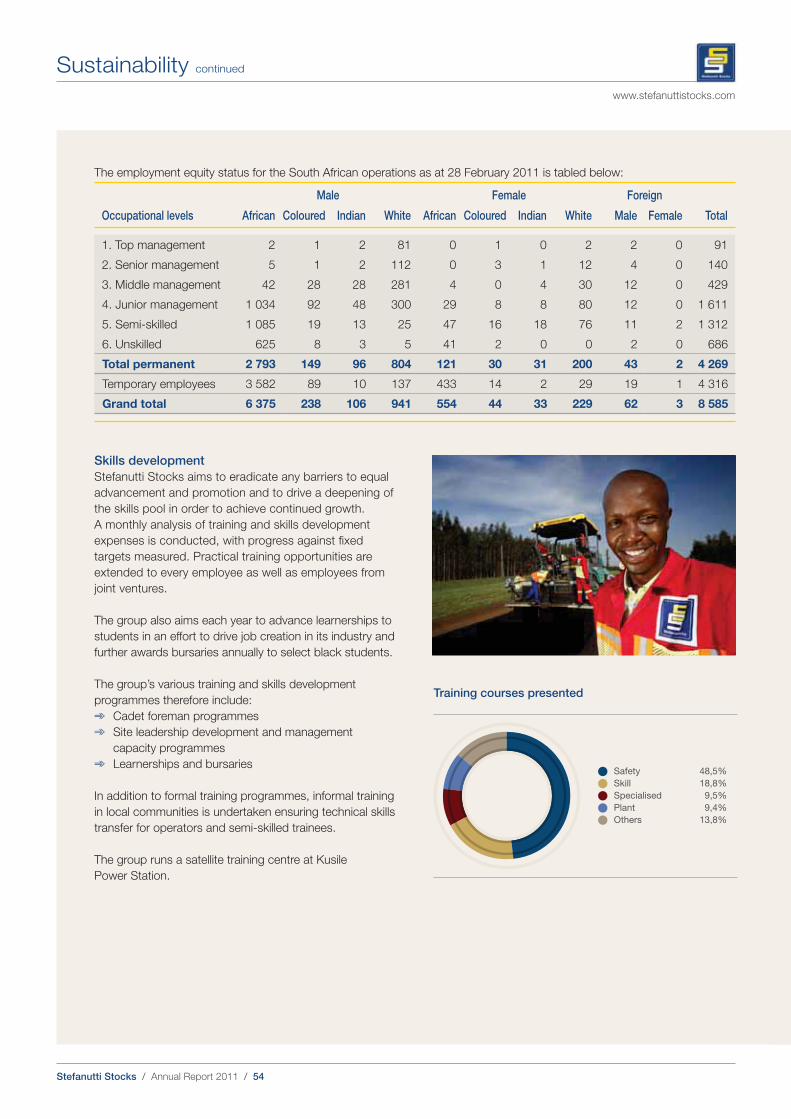
Stefanutti Stocks / Annual Report 2011 / 54
www.stefanuttistocks.com
The employment equity status for the South African operations as at 28 February 2011 is tabled below:
Male Female Foreign
TotalOccupational levels African Coloured Indian White African Coloured Indian White Male Female
1. Top management 2 1 2 81 0 1 0 2 2 0 91
2. Senior management 5 1 2 112 0 3 1 12 4 0 140
3. Middle management 42 28 28 281 4 0 4 30 12 0 429
4. Junior management 1 034 92 48 300 29 8 8 80 12 0 1 611
5. Semi-skilled 1 085 19 13 25 47 16 18 76 11 2 1 312
6. Unskilled 625 8 3 5 41 2 0 0 2 0 686
Total permanent 2 793 149 96 804 121 30 31 200 43 2 4 269
Temporary employees 3 582 89 10 137 433 14 2 29 19 1 4 316
Grand total 6 375 238 106 941 554 44 33 229 62 3 8 585
Sustainability continued
Skills development
Stefanutti Stocks aims to eradicate any barriers to equal
advancement and promotion and to drive a deepening of
the skills pool in order to achieve continued growth.
A monthly analysis of training and skills development
expenses is conducted, with progress against fixed
targets measured. Practical training opportunities are
extended to every employee as well as employees from
joint ventures.
The group also aims each year to advance learnerships to
students in an effort to drive job creation in its industry and
further awards bursaries annually to select black students.
The group’s various training and skills development
programmes therefore include:
➾ Cadet foreman programmes
➾ Site leadership development and management
capacity programmes
➾ Learnerships and bursaries
In addition to formal training programmes, informal training
in local communities is undertaken ensuring technical skills
transfer for operators and semi-skilled trainees.
The group runs a satellite training centre at Kusile
Power Station.
Training courses presented
Safety 48,5%
Skill 18,8%
Specialised 9,5%
Plant 9,4%
Others 13,8%
Stefanutti Stocks / Annual Report 2011 / 55
Fin
an
cia
l sta
tem
en
tsS
takeh
old
ers
’ info
rmatio
n
Total training spend on employees for the year amounted
to R 7,3 million. A total of 8 322 employees attended
training, of which 6 661 (80,04%) were black. This is a total
of 76 348 training hours at an average of 7,6 hours per
employee.
Training costs
2010/2011
2009/2010
R7 362 025
R7 055 582
Cadet foreman programmes
The cadet foreman programme has been successfully
rolled out to all business units. It provides specialised
education for learners who have passed Grade 12. While
addressing the shortage of middle managers in the
industry, the course also empowers learners in other fields.
During the year a total of 28 cadet foremen enrolled in the
programme, of whom 21 were black.
In the Building business unit, five cadet foremen were
promoted to junior foremen.
Site leadership development and management
capacity programmes
Building leadership as well as organisational capability and
capacity is crucial to Stefanutti Stocks’ sustainability. The
site leadership development and management capacity
programmes ensure capacity building targets are reached.
Members are identified on site and then placed on either
one or both programmes.
A total of 131 employees are enrolled in these
programmes, of whom 22,4% in the site leadership
development programmes and 36,1% in the management
capacity programmes are black.
Profile candidate star
Nomthetho Nxiweni
Age: 29
Occupation:
Site Engineer
Nomthetho started her studies in January 2007 and
obtained her National Diploma in Civil Engineering at
the University of Johannesburg in October 2010.
During her studies she achieved seven distinctions
and held leadership positions such as member of
the residence house committee and class
representative.
She started with Stefanutti Stocks doing her P1 and
P2 practical (part of the practical training which
needs to be completed to achieve the Diploma) at
the beginning of March 2010 on the Burnstone
Project, where her dynamic personality shone.
After completing her studies she was permanently
appointed as a Site Engineer and is now based at
the KEP Sishen Project in the Northern Cape.
Gro
up
at a
gla
nce
Man
ag
em
en
t revie
wO
pera
tion
al re
vie
wG
overn
an
ce
an
d
su
sta
inab
ility
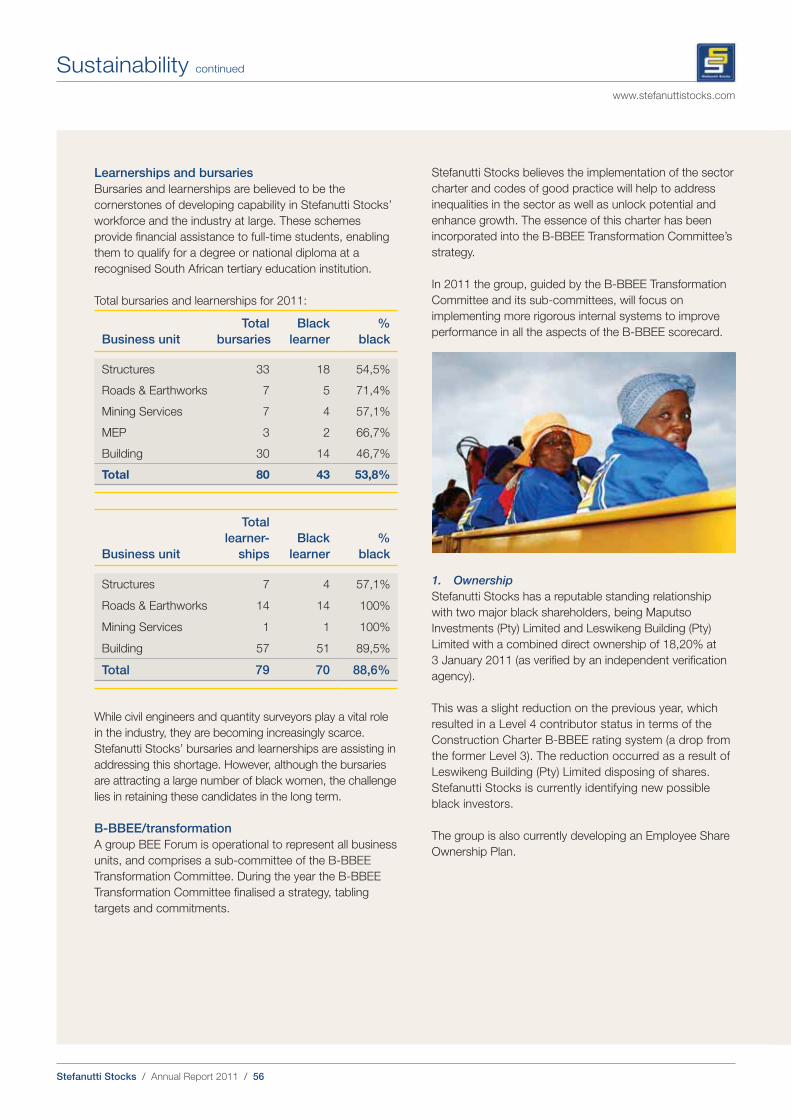
Stefanutti Stocks / Annual Report 2011 / 56
www.stefanuttistocks.com
Learnerships and bursaries
Bursaries and learnerships are believed to be the
cornerstones of developing capability in Stefanutti Stocks’
workforce and the industry at large. These schemes
provide financial assistance to full-time students, enabling
them to qualify for a degree or national diploma at a
recognised South African tertiary education institution.
Total bursaries and learnerships for 2011:
Business unit
Total
bursaries
Black
learner
%
black
Structures 33 18 54,5%
Roads & Earthworks 7 5 71,4%
Mining Services 7 4 57,1%
MEP 3 2 66,7%
Building 30 14 46,7%
Total 80 43 53,8%
Business unit
Total
learner-
ships
Black
learner
%
black
Structures 7 4 57,1%
Roads & Earthworks 14 14 100%
Mining Services 1 1 100%
Building 57 51 89,5%
Total 79 70 88,6%
While civil engineers and quantity surveyors play a vital role
in the industry, they are becoming increasingly scarce.
Stefanutti Stocks’ bursaries and learnerships are assisting in
addressing this shortage. However, although the bursaries
are attracting a large number of black women, the challenge
lies in retaining these candidates in the long term.
B-BBEE/transformation
A group BEE Forum is operational to represent all business
units, and comprises a sub-committee of the B-BBEE
Transformation Committee. During the year the B-BBEE
Transformation Committee finalised a strategy, tabling
targets and commitments.
Stefanutti Stocks believes the implementation of the sector
charter and codes of good practice will help to address
inequalities in the sector as well as unlock potential and
enhance growth. The essence of this charter has been
incorporated into the B-BBEE Transformation Committee’s
strategy.
In 2011 the group, guided by the B-BBEE Transformation
Committee and its sub-committees, will focus on
implementing more rigorous internal systems to improve
performance in all the aspects of the B-BBEE scorecard.
1. Ownership
Stefanutti Stocks has a reputable standing relationship
with two major black shareholders, being Maputso
Investments (Pty) Limited and Leswikeng Building (Pty)
Limited with a combined direct ownership of 18,20% at
3 January 2011 (as verified by an independent verification
agency).
This was a slight reduction on the previous year, which
resulted in a Level 4 contributor status in terms of the
Construction Charter B-BBEE rating system (a drop from
the former Level 3). The reduction occurred as a result of
Leswikeng Building (Pty) Limited disposing of shares.
Stefanutti Stocks is currently identifying new possible
black investors.
The group is also currently developing an Employee Share
Ownership Plan.
Sustainability continued
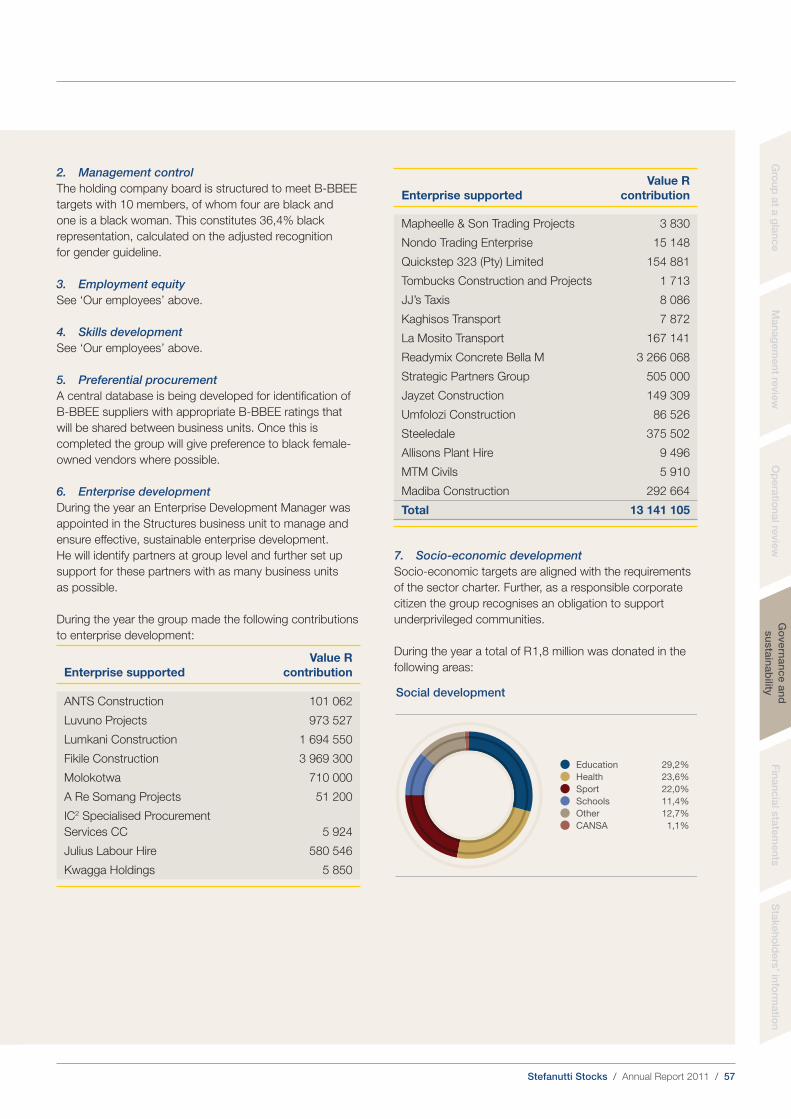
Stefanutti Stocks / Annual Report 2011 / 57
Fin
an
cia
l sta
tem
en
tsS
takeh
old
ers
’ info
rmatio
n
2. Management control
The holding company board is structured to meet B-BBEE
targets with 10 members, of whom four are black and
one is a black woman. This constitutes 36,4% black
representation, calculated on the adjusted recognition
for gender guideline.
3. Employment equity
See ‘Our employees’ above.
4. Skills development
See ‘Our employees’ above.
5. Preferential procurement
A central database is being developed for identification of
B-BBEE suppliers with appropriate B-BBEE ratings that
will be shared between business units. Once this is
completed the group will give preference to black female-
owned vendors where possible.
6. Enterprise development
During the year an Enterprise Development Manager was
appointed in the Structures business unit to manage and
ensure effective, sustainable enterprise development.
He will identify partners at group level and further set up
support for these partners with as many business units
as possible.
During the year the group made the following contributions
to enterprise development:
Enterprise supported
Value R
contribution
ANTS Construction 101 062
Luvuno Projects 973 527
Lumkani Construction 1 694 550
Fikile Construction 3 969 300
Molokotwa 710 000
A Re Somang Projects 51 200
IC2 Specialised Procurement
Services CC 5 924
Julius Labour Hire 580 546
Kwagga Holdings 5 850
Enterprise supported
Value R
contribution
Mapheelle & Son Trading Projects 3 830
Nondo Trading Enterprise 15 148
Quickstep 323 (Pty) Limited 154 881
Tombucks Construction and Projects 1 713
JJ’s Taxis 8 086
Kaghisos Transport 7 872
La Mosito Transport 167 141
Readymix Concrete Bella M 3 266 068
Strategic Partners Group 505 000
Jayzet Construction 149 309
Umfolozi Construction 86 526
Steeledale 375 502
Allisons Plant Hire 9 496
MTM Civils 5 910
Madiba Construction 292 664
Total 13 141 105
7. Socio-economic development
Socio-economic targets are aligned with the requirements
of the sector charter. Further, as a responsible corporate
citizen the group recognises an obligation to support
underprivileged communities.
During the year a total of R 1,8 million was donated in the
following areas:
Social development
Education 29,2%
Health 23,6%
Sport 22,0%
Schools 11,4%
Other 12,7%
CANSA 1,1%
Gro
up
at a
gla
nce
Man
ag
em
en
t revie
wO
pera
tion
al re
vie
wG
overn
an
ce
an
d
su
sta
inab
ility
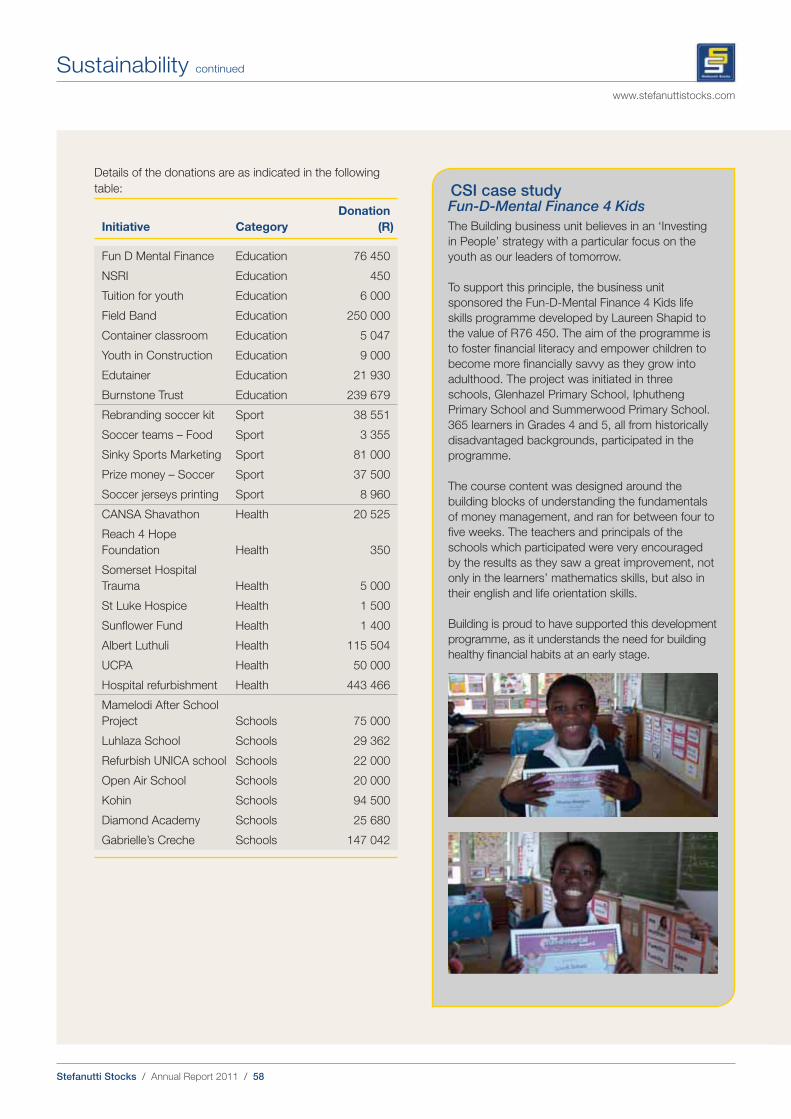
Stefanutti Stocks / Annual Report 2011 / 58
www.stefanuttistocks.com
CSI case studyFun-D-Mental Finance 4 Kids
The Building business unit believes in an ‘Investing
in People’ strategy with a particular focus on the
youth as our leaders of tomorrow.
To support this principle, the business unit
sponsored the Fun-D-Mental Finance 4 Kids life
skills programme developed by Laureen Shapid to
the value of R 76 450. The aim of the programme is
to foster financial literacy and empower children to
become more financially savvy as they grow into
adulthood. The project was initiated in three
schools, Glenhazel Primary School, Iphutheng
Primary School and Summerwood Primary School.
365 learners in Grades 4 and 5, all from historically
disadvantaged backgrounds, participated in the
programme.
The course content was designed around the
building blocks of understanding the fundamentals
of money management, and ran for between four to
five weeks. The teachers and principals of the
schools which participated were very encouraged
by the results as they saw a great improvement, not
only in the learners’ mathematics skills, but also in
their english and life orientation skills.
Building is proud to have supported this development
programme, as it understands the need for building
healthy financial habits at an early stage.
Details of the donations are as indicated in the following
table:
Initiative Category
Donation
(R)
Fun D Mental Finance Education 76 450
NSRI Education 450
Tuition for youth Education 6 000
Field Band Education 250 000
Container classroom Education 5 047
Youth in Construction Education 9 000
Edutainer Education 21 930
Burnstone Trust Education 239 679
Rebranding soccer kit Sport 38 551
Soccer teams – Food Sport 3 355
Sinky Sports Marketing Sport 81 000
Prize money – Soccer Sport 37 500
Soccer jerseys printing Sport 8 960
CANSA Shavathon Health 20 525
Reach 4 Hope
Foundation Health 350
Somerset Hospital
Trauma Health 5 000
St Luke Hospice Health 1 500
Sunflower Fund Health 1 400
Albert Luthuli Health 115 504
UCPA Health 50 000
Hospital refurbishment Health 443 466
Mamelodi After School
Project Schools 75 000
Luhlaza School Schools 29 362
Refurbish UNICA school Schools 22 000
Open Air School Schools 20 000
Kohin Schools 94 500
Diamond Academy Schools 25 680
Gabrielle’s Creche Schools 147 042
Sustainability continued

Stefanutti Stocks / Annual Report 2011 / 59
Fin
an
cia
l sta
tem
en
tsS
takeh
old
ers
’ info
rmatio
n
CSI case studyMamelodi After-School Programme
Stefanutti Stocks Civils contributed R 75 000 to the
Mamelodi After-School Programme during the year.
This University of Pretoria initiative is based at the
Mamelodi Campus. The programme was
established in response to challenges concerning
the national mathematics and science results. Its
objective is to resolve low academic results by
tackling both learner and teacher skills.
The programme has set specific and measurable
targets, including increasing the maths and science
results of 170 Grade 12 learners. It provides learners
with the necessary learning aids and also
implements practical teaching opportunities for
10 student–teachers.
“We have supported this initiative over a number of
years,” says Werner Jerling, managing director of
Civils. “It is proving very successful with the pilot
project showing an average improvement of 15%
in learners’ results in 2008.”
CSI case studyField Band Foundation
Over the past number of years the Building business
unit has contributed R 250 000 annually to the Field
Band Foundation. The foundation was founded by
businessman Bertie Lubner and patrons include
Judge Edwin Cameron, Judge Richard Goldstone,
Jennifer Oppenheimer, Hugh Masekela and Bruce
Fordyce.
The Field Band Foundation’s main purpose is to
create opportunities for the development of life skills
through the media of music and dance. HIV/AIDS
education is at the centre of the life skills
programme.
Now approaching its 15th anniversary, the Field
Band Foundation offers bursaries and exchange
programmes with Norway, Flanders, the Netherlands
and the USA.
One of the group’s non-executive directors, Herman
Mashaba, is the chairman of the Field Band
Foundation while Building financial director, Willie
Erasmus, also serves on the Foundation’s board.
Gro
up
at a
gla
nce
Man
ag
em
en
t revie
wO
pera
tion
al re
vie
wG
overn
an
ce
an
d
su
sta
inab
ility
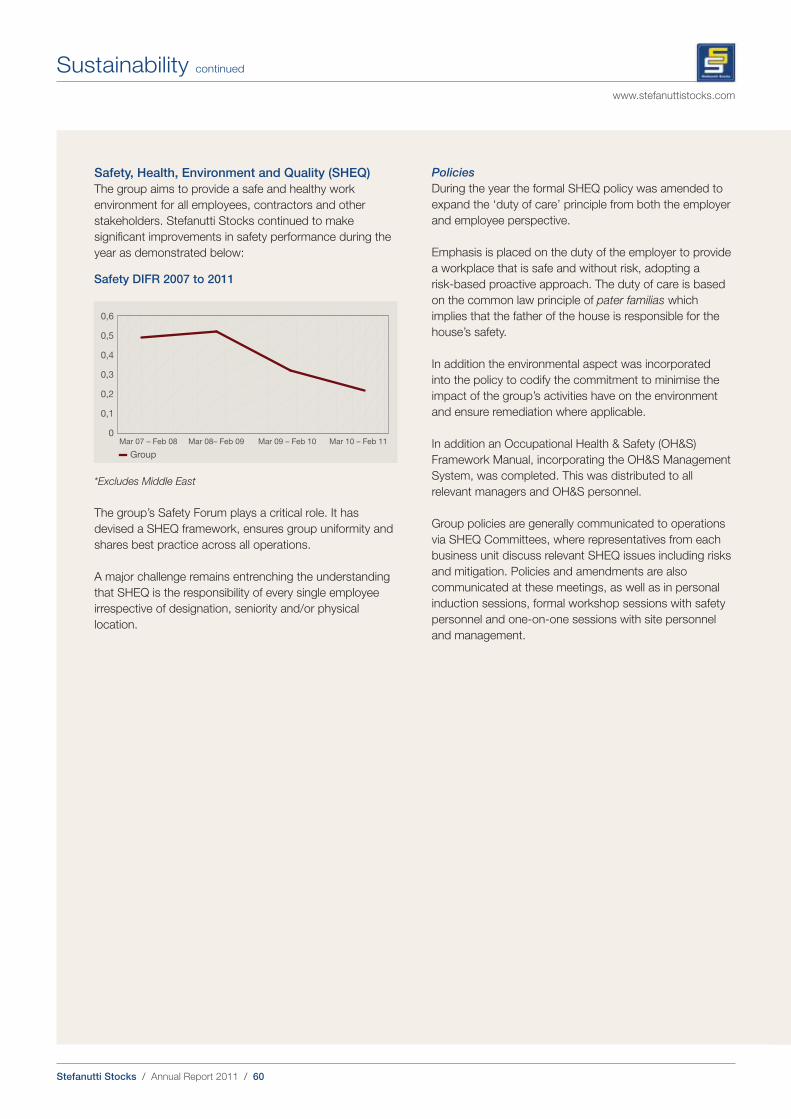
Stefanutti Stocks / Annual Report 2011 / 60
www.stefanuttistocks.com
Safety, Health, Environment and Quality (SHEQ)
The group aims to provide a safe and healthy work
environment for all employees, contractors and other
stakeholders. Stefanutti Stocks continued to make
significant improvements in safety performance during the
year as demonstrated below:
Safety DIFR 2007 to 2011
0,6
0,5
0,4
0,3
0,2
0,1
0Mar 07 – Feb 08 Mar 08– Feb 09 Mar 09 – Feb 10 Mar 10 – Feb 11
— Group
*Excludes Middle East
The group’s Safety Forum plays a critical role. It has
devised a SHEQ framework, ensures group uniformity and
shares best practice across all operations.
A major challenge remains entrenching the understanding
that SHEQ is the responsibility of every single employee
irrespective of designation, seniority and/or physical
location.
Policies
During the year the formal SHEQ policy was amended to
expand the ‘duty of care’ principle from both the employer
and employee perspective.
Emphasis is placed on the duty of the employer to provide
a workplace that is safe and without risk, adopting a
risk-based proactive approach. The duty of care is based
on the common law principle of pater familias which
implies that the father of the house is responsible for the
house’s safety.
In addition the environmental aspect was incorporated
into the policy to codify the commitment to minimise the
impact of the group’s activities have on the environment
and ensure remediation where applicable.
In addition an Occupational Health & Safety (OH&S)
Framework Manual, incorporating the OH&S Management
System, was completed. This was distributed to all
relevant managers and OH&S personnel.
Group policies are generally communicated to operations
via SHEQ Committees, where representatives from each
business unit discuss relevant SHEQ issues including risks
and mitigation. Policies and amendments are also
communicated at these meetings, as well as in personal
induction sessions, formal workshop sessions with safety
personnel and one-on-one sessions with site personnel
and management.
Sustainability continued

Stefanutti Stocks / Annual Report 2011 / 61
Fin
an
cia
l sta
tem
en
tsS
takeh
old
ers
’ info
rmatio
n
Case studySafety first
Stefanutti Stocks Civils is currently onsite at the
Thubelisha Colliery in Mpumalanga. This division of
the Structures business unit is working on the civil
contract for Sandvik to supply conveyors and a coal
handling surge facility to Sasol.
“Sasol has some of the most stringent safety
guidelines in the industry,” says Mike Stevenson,
contracts director. “For this project we partnered
with Sandvik to introduce a fresh safety campaign
called ‘Your Safety First’, targeting the key concerns
of site safety in a way that invites our employees to
engage with these areas.”
The campaign components include:
1. The message – Your Safety First. Think Safe.
Work Safe. Be Safe. If you don’t you have too
much to lose.
2. Accessible safety mentors – Madala (the wiser,
older character) and Bafana (young and eager to
learn) are portrayed in different scenarios on
posters across the site.
3. A link to the 2010 Soccer World Cup and
branded give-aways.
“Compliance is non-negotiable, so we are talking
about more than just the rules here. Our safety
campaign carries the message that our people
matter and their safety counts,” comments
Stevenson. “We aim to embed a sense of self-
preservation in our workforce, rather than just
demanding blind compliance with the rules.”
ISO accreditation
ISO accreditation is integral to the group’s sustainability,
especially in respect of SHEQ. During the year the
following milestones were achieved:
Business
unit Detail
Date
obtained
Structures ISO 9001:2008 Apr 2010
Roads &
Earthworks
ISO 19001 Jan 2010
Mining
Services
In progress – scheduled
March 2011
MEP In progress – under Review
with Dekra
Building ISO 9001 Dec 2009
Structures has implemented a QMS Systems Manual
(2010) for ISO 9001:2008 accreditation, which will be
revised for improvement in the current year in order for
accreditation to be reaffirmed.
Safety training
Stefanutti Stocks concentrates on effective safety training
in order to achieve its SHEQ objectives. Employees from
the various business units attended the following training
sessions during the year:
➾ Accident/incident reporting
➾ Basic fire fighting
➾ Compensation for Occupational Injuries and
Disease Act
➾ Environmental law for managers
➾ Environmental management
➾ Excavations
➾ First Aid – level 1
➾ First Aid – level 2
➾ Fire fighting
➾ Fire marshal
➾ Fall protection
➾ Fall arrest
➾ Fatal alert
➾ Fire prevention
➾ Hazardous chemicals
➾ Hazardous substances
➾ Health awareness training
➾ H&S representative
Gro
up
at a
gla
nce
Man
ag
em
en
t revie
wO
pera
tion
al re
vie
wG
overn
an
ce
an
d
su
sta
inab
ility
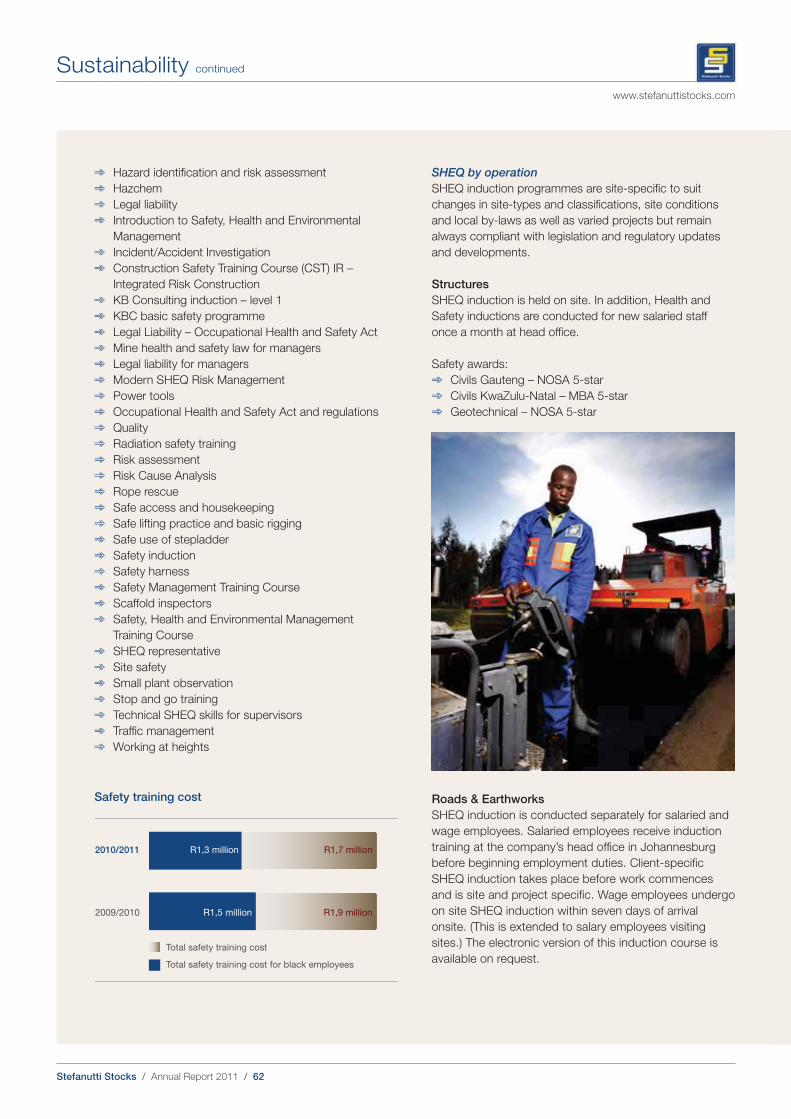
Stefanutti Stocks / Annual Report 2011 / 62
www.stefanuttistocks.com
➾ Hazard identification and risk assessment
➾ Hazchem
➾ Legal liability
➾ Introduction to Safety, Health and Environmental
Management
➾ Incident/Accident Investigation
➾ Construction Safety Training Course (CST) IR –
Integrated Risk Construction
➾ KB Consulting induction – level 1
➾ KBC basic safety programme
➾ Legal Liability – Occupational Health and Safety Act
➾ Mine health and safety law for managers
➾ Legal liability for managers
➾ Modern SHEQ Risk Management
➾ Power tools
➾ Occupational Health and Safety Act and regulations
➾ Quality
➾ Radiation safety training
➾ Risk assessment
➾ Risk Cause Analysis
➾ Rope rescue
➾ Safe access and housekeeping
➾ Safe lifting practice and basic rigging
➾ Safe use of stepladder
➾ Safety induction
➾ Safety harness
➾ Safety Management Training Course
➾ Scaffold inspectors
➾ Safety, Health and Environmental Management
Training Course
➾ SHEQ representative
➾ Site safety
➾ Small plant observation
➾ Stop and go training
➾ Technical SHEQ skills for supervisors
➾ Traffic management
➾ Working at heights
Safety training cost
2010/2011
2009/2010
Total safety training cost
Total safety training cost for black employees
R1,5 million R1,9 million
R1,7 millionR1,3 million
SHEQ by operation
SHEQ induction programmes are site-specific to suit
changes in site-types and classifications, site conditions
and local by-laws as well as varied projects but remain
always compliant with legislation and regulatory updates
and developments.
Structures
SHEQ induction is held on site. In addition, Health and
Safety inductions are conducted for new salaried staff
once a month at head office.
Safety awards:
➾ Civils Gauteng – NOSA 5-star
➾ Civils KwaZulu-Natal – MBA 5-star
➾ Geotechnical – NOSA 5-star
Roads & Earthworks
SHEQ induction is conducted separately for salaried and
wage employees. Salaried employees receive induction
training at the company’s head office in Johannesburg
before beginning employment duties. Client-specific
SHEQ induction takes place before work commences
and is site and project specific. Wage employees undergo
on site SHEQ induction within seven days of arrival
onsite. (This is extended to salary employees visiting
sites.) The electronic version of this induction course is
available on request.
Sustainability continued

Stefanutti Stocks / Annual Report 2011 / 63
Fin
an
cia
l sta
tem
en
tsS
takeh
old
ers
’ info
rmatio
n
Safety awards:
➾ NOSA 5-star
➾ NOSA SHE Integrated Platinum 4-star
Mining Services
SHEQ induction is held on site. In addition, Health and
Safety inductions are conducted for new salaried staff
once a month at head office.
Safety awards:
➾ SHE Innovation – DEKRA 2010
Mechanical, Electrical & Power (MEP)
The SHEQ induction programme is communicated to all
employees prior to commencing work. This induction is
valid for 12 months. Employees exceeding 14 days
absence from the workplace are required to be re-
inducted.
Safety awards:
➾ Electrical and instrumentation – NOSA 5-star
The MEP SHEQ management system is currently under
review with DEKRA for OHSAS 18001 compliance and
certification.
Building
KwaZulu-Natal Building received the Platinum Award from
the Federated Employers Mutual Assurance for achieving
one million man-hours without a disabling injury and
maintaining a low accident frequency rate.
Safety awards:
➾ KwaZulu-Natal – MBSA 5-star
➾ Gauteng – MBSA 5-star
➾ Cape – MBSA 5-star
➾ Inland – Merit Award 5-star
Safety audits
The group conducts regular safety audits as well as
monthly internal audits on site.
The Structures business unit used external consultants at
the Thubilish Bunker Project R 116 to complete a third-
party audit. All operations were found to be compliant with
current legislation. Geotechnical conducted a NOSA audit
in November 2010 and maintained its 5-star NOSA
grading.
At Mining Services’ Kumba Sishen site, a legal compliance
audit was conducted by external consultants and the site
was found to be compliant with current legislation.
Three legal compliance audits were conducted by external
consultants for MEP in October and November 2010 and
all operations were found to be compliant with current
legislation.
During an independent audit by the Gauteng Master
Builders Association, Building Inland received a Merit
Award as 11 sites had all achieved 5-star ratings.
Legal compliance audits were conducted during the year
by external consultants for the Building KwaZulu-Natal,
Cape and Gauteng divisions. No major adverse findings
were concluded and all divisions were found to be
complying with current legislation.
At Roads & Earthworks two NOSA audits were conducted
and the business unit received a NOSA 5-star grading in
June 2010 and a NOSA 4-star Platinum in September
2010.
Gro
up
at a
gla
nce
Man
ag
em
en
t revie
wO
pera
tion
al re
vie
wG
overn
an
ce
an
d
su
sta
inab
ility
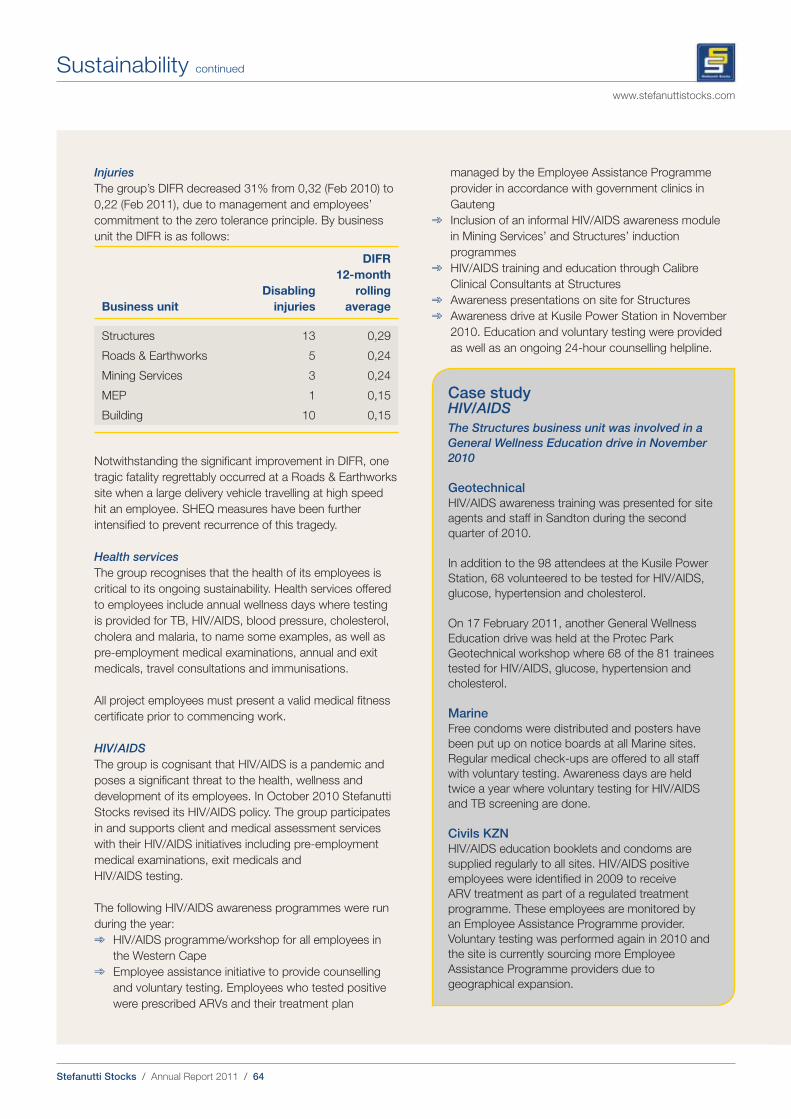
Stefanutti Stocks / Annual Report 2011 / 64
www.stefanuttistocks.com
Injuries
The group’s DIFR decreased 31% from 0,32 (Feb 2010) to
0,22 (Feb 2011), due to management and employees’
commitment to the zero tolerance principle. By business
unit the DIFR is as follows:
Business unit
Disabling
injuries
DIFR
12-month
rolling
average
Structures 13 0,29
Roads & Earthworks 5 0,24
Mining Services 3 0,24
MEP 1 0,15
Building 10 0,15
Notwithstanding the significant improvement in DIFR, one
tragic fatality regrettably occurred at a Roads & Earthworks
site when a large delivery vehicle travelling at high speed
hit an employee. SHEQ measures have been further
intensified to prevent recurrence of this tragedy.
Health services
The group recognises that the health of its employees is
critical to its ongoing sustainability. Health services offered
to employees include annual wellness days where testing
is provided for TB, HIV/AIDS, blood pressure, cholesterol,
cholera and malaria, to name some examples, as well as
pre-employment medical examinations, annual and exit
medicals, travel consultations and immunisations.
All project employees must present a valid medical fitness
certificate prior to commencing work.
HIV/AIDS
The group is cognisant that HIV/AIDS is a pandemic and
poses a significant threat to the health, wellness and
development of its employees. In October 2010 Stefanutti
Stocks revised its HIV/AIDS policy. The group participates
in and supports client and medical assessment services
with their HIV/AIDS initiatives including pre-employment
medical examinations, exit medicals and
HIV/AIDS testing.
The following HIV/AIDS awareness programmes were run
during the year:
➾ HIV/AIDS programme/workshop for all employees in
the Western Cape
➾ Employee assistance initiative to provide counselling
and voluntary testing. Employees who tested positive
were prescribed ARVs and their treatment plan
managed by the Employee Assistance Programme
provider in accordance with government clinics in
Gauteng
➾ Inclusion of an informal HIV/AIDS awareness module
in Mining Services’ and Structures’ induction
programmes
➾ HIV/AIDS training and education through Calibre
Clinical Consultants at Structures
➾ Awareness presentations on site for Structures
➾ Awareness drive at Kusile Power Station in November
2010. Education and voluntary testing were provided
as well as an ongoing 24-hour counselling helpline.
Case studyHIV/AIDS
The Structures business unit was involved in a
General Wellness Education drive in November
2010
GeotechnicalHIV/AIDS awareness training was presented for site
agents and staff in Sandton during the second
quarter of 2010.
In addition to the 98 attendees at the Kusile Power
Station, 68 volunteered to be tested for HIV/AIDS,
glucose, hypertension and cholesterol.
On 17 February 2011, another General Wellness
Education drive was held at the Protec Park
Geotechnical workshop where 68 of the 81 trainees
tested for HIV/AIDS, glucose, hypertension and
cholesterol.
MarineFree condoms were distributed and posters have
been put up on notice boards at all Marine sites.
Regular medical check-ups are offered to all staff
with voluntary testing. Awareness days are held
twice a year where voluntary testing for HIV/AIDS
and TB screening are done.
Civils KZNHIV/AIDS education booklets and condoms are
supplied regularly to all sites. HIV/AIDS positive
employees were identified in 2009 to receive
ARV treatment as part of a regulated treatment
programme. These employees are monitored by
an Employee Assistance Programme provider.
Voluntary testing was performed again in 2010 and
the site is currently sourcing more Employee
Assistance Programme providers due to
geographical expansion.
Sustainability continued

Stefanutti Stocks / Annual Report 2011 / 65
Fin
an
cia
l sta
tem
en
tsS
takeh
old
ers
’ info
rmatio
n
Our environment
Training and awareness
Heightened awareness of the environment and the
environmental impact of the industry’s activities has
prompted the group to focus on sustainability as it relates
specifically to the environment.
At the MEP operations, informal environmental awareness
training is presented as part of the induction process and
also forms part of the client induction programmes.
Environmental awareness is further communicated as
a topic at daily toolbox talks.
During the year Structures operations presented a number
of environmental training courses including:
➾ Hazardous chemical storage and management;
➾ ISO 14001 – modern environmental management;
➾ ISO 14001 – internal auditors; and
➾ Environmental initiative – Unit Standard 114218.
Environmental initiatives
The group reinforced its commitment to environmental
conservation by installing a motion-activated light switch
system at the revamped and enlarged head office. This
aids the group’s daily electricity usage. In addition, paper
recycling bins have been placed throughout the premises.
The Safety Forum is responsible for all strategies and
innovations to improve on all previous efforts in relation to
the environment. Its environmental objectives include:
➾ monitoring water and electricity usage to develop
conservation targets;
➾ measuring and evaluating the group’s carbon footprint;
➾ monitoring and measuring air emission and waste
management in accordance with permit requirements;
➾ monitoring surface and groundwater releases and
measuring water spillages; and
➾ measuring waste generation and disposal.
Stefanutti Stocks received no significant fines during the
year for environmental non-compliance or endangerment.
However, the group received a minor number of non-
monetary sanctions for non-compliance with environmental
laws and regulations. Processes including supervision and
awareness campaigns have been put in place to ensure no
future recurrence.
Gro
up
at a
gla
nce
Man
ag
em
en
t revie
wO
pera
tion
al re
vie
wG
overn
an
ce
an
d
su
sta
inab
ility
Case studySHEQ awareness campaign
At the start of 2010 the Roads and Earthworks
business unit introduced an innovative approach by
using cartoon characters on its campaign posters
and banners. This went some way to achieving the
objective of improving knowledge in critical SHEQ
aspects, and was well received by employees and
clients. A total of nine topics were selected and
posters and banners were displayed at all sites. Not
only was employees’ knowledge improved but the
information was accessible to the local communities
as well as to contracting partners. The awareness
campaign resulted in a reduction in injuries, a safer
workplace and a decrease in environmental
incidents. It will continue during 2012.
1. Vegetation on steep
slopes binds the soil.
2. Well managed
plantation areas have
little soil erosion.
3. Vegetation filters run-
off water into rivers and
dams.
4. Well managed wetlands
filter water which
supports wild life.
5. Roots of indigenous
plants bind the soil on
river banks limiting soil
erosion.
6. Well managed
farmlands experience
limited soil erosion.
7. Well managed grazing
by livestock conserves
natural resources.
8. Trees sited correctly
offer shelter to animals,
crops and homesteads.
9. Well managed waste
treatment facilities limit
environmental pollution.
10. Well managed mining
operations result in less
pollution and resource
conservation.
11. Correctly managed
domestic drains limit
environmental pollution.
12. Unpolluted rivers are
safer to use and support
river life.
13. Unpolluted estuaries
support bio-diversity and
are favourable for
recreational activities.
Better behaviour and
management lead to:
�
Prevention of pollution
and erosion
�
Clearing of alien plants
�
Improvement of the
environment
�
Improvement in the
quality of life
�
Continued sustainability
Indigenous plants in their
home environment:
�
Support indigenous
animals and insects
�
Contribute to bio-
diversity
�
Limits soil erosion by
binding soil and roots
Invasive plants can be
controlled:
�
Pull them out by hand
�
Cut them close to the
ground
�
Spray them with
herbicides
�
Control them
biologically by importing
natural enemy insects
Environmentally
friendly
practices
�
�
Save our environment!
Remember guys, the future of our environment depends on us.
Let’s all do the right thing!
1. Sparse vegetation on
steep slopes causes soil
erosion.
2. Poorly managed
plantation areas are
prone to soil erosion.
3. Lack of vegetation
causes soil and silt to
flow into rivers and
dams.
4. If wetlands are poorly
managed, wild life is not
supported due to lack of
water filtration.
5. Poorly managed
farmlands are prone to
soil erosion.
6. Invasive alien plants
take over indigenous
plants leaving river
banks prone to soil
erosion.
7. Poorly managed
grazing by livestock can
result in overgrazing and
soil erosion.
8. Poorly sited trees use
excessive water and
drain the ground water
supply.
9. Poorly managed waste
treatment facilities cause
environmental pollution.
10. Poorly managed
mining operations result
in loss of resources and
pollution.
11. Badly managed
domestic drains cause
pollution of the
environment.
12. Pollution of rivers
and dams makes them
unsafe and lifeless.
13. Pollution of estuaries
leaves them unable to
support bio-diversity and
has a negative influence
on recreational activities.
Poor behaviour and
management lead to:
�
Uncontrolled pollution
and erosion
Invasion by alien plants
�
Destruction of the
environment
�
Degradation of the
quality of life
�
Lack of sustainability
Invasive alien plants in
our environment:
�
Take over indigenous
vegetation
�
Threaten bio-diversity
�
Cause soil and water
loss
�
Grow faster than
indigenous vegetation
�
Produce large
quantities of seed
1
1
2
2
3
3
4
6
7
9
8
11
12
13
10
5
4
7
8
9
10
11
12
13
5
6
Practices that
can damage the
environment
�
�
Im afraid this is what happens
when we become negligent
about our environment.
This is a perfect example of
how we benefit by caring
for our environment!
What a mess,
what happened
here?
Wow, this is
fantastic!
I would
love to live
here!
Stefanutti Stocks / Annual Report 2011 / 66
www.stefanuttistocks.com
Safety risks
Various site-specific environmental risks and mitigation
strategies were identified during the year.
In the Roads & Earthworks operations, the following risks
were identified:
Risk Mitigation strategy
Commencement of
construction activities by
extracting water from a
natural resource without a
permit
Environmental
management standards
developed and
implemented
Inadequate containment
of bulk storage facilities
Rebuilding of containment
facilities where identified
Disposal of cement bags
in an unlawful manner,
contaminating the
environment
Met with the relevant
authorities and remediated
the contaminated area
Accolades
Industry accolades included:
Project Category Award
Pick n Pay Bluff Alterations,
additions under
R 20 million
Highest
commendation
Liberty Life
offices
Commercial
buildings above
R 40 million
1st place
Spar distribution
and warehouse
Industrial
buildings above
R 40 million
1st place
The group received further recognition in the
following areas:
➾ Maintained NOSA 5-star status with higher
percentage than previous year (92,46%)
➾ Maintained T1 certificate with Sasol
➾ Received Environmental Awareness Award, best
Lay Down Area for all Contractors and Certificate
for High Safety Standard at Sishen South
➾ Three million man-hours lost-time injury-free for
the entire project at DMO Project
➾ Ten million man-hours lost-time injury-free for the
entire Kumba Sishen South Project
➾ Received award for best contractor on the
Grootegeluk Medupi Expansion Project
➾ BRPM Styldrift Merenski Phase report done to
600 days without a disabling injury
➾ 4,3 million disabling injury-free hours for
31-month rolling period measured on the
following projects: Amandelbult 75-210,
Goedgevonden, Retrofit Isamills, Douglas
Middelburg Optimisation Project, Komati Rail,
Sishen Reservoirs, Vele Coal of Africa, BRPM
Styldrift, Thubilisha Bridge, Thubilisha Bunker,
Komati Substation, DMO Water structures,
Grootegeluk Medupi Expansion Project – ROM &
Discards Area, Grootegeluk Medupi Expansion
Project – Wet/Dry Plant and ROM Feed Silos
and Thubilisha Portal.
Sustainability continued
Stefanutti Stocks / Annual Report 2011 / 67
Fin
an
cia
l sta
tem
en
tsS
takeh
old
ers
’ info
rmatio
n
Economic contribution
Value added is the measure of wealth the group creates through its operations by adding value to the cost of raw materials,
products and services purchased. The table below shows total wealth created and how it was shared between stakeholders
who contributed to its creation. It also shows the amount retained and reinvested in the group for the replacement of assets
and further development of people and operations.
2011
%
2011
R’000
2010
%
2010
R’000
CONTRACT REVENUE 6 896 418 7 365 023
Less: Costs of materials, services and sub-contractors (4 583 907) (5 160 974)
Value added by operations 97,3 2 312 511 96,2 2 204 049
Investment income 2,6 61 591 3,7 85 518
Share of profit/(loss) from associate companies 0,1 2 712 0,1 973
Total value add 100 2 376 814 100,0 2 290 540
Distributed as follows:
EMPLOYEES
Short-term and post-employment benefit costs 66,6 1 581 248 60,4 1 383 040
Share-based payment and forfeitable share plan costs 0,8 19 843 0,8 18 175
PROVIDERS OF EQUITY
Dividend paid to shareholders 4,7 111 987 7,0 159 418
PROVIDERS OF FINANCE
Interest and finance charges 1,1 25 270 1,1 25 288
Operating lease rentals 0,4 9 450 0,4 8 555
GOVERNMENT
Taxation 6,2 148 351 7,5 172 703
TOTAL VALUE DISTRIBUTED 79,8 1 896 149 77,2 1 767 179
REINVESTED IN THE GROUP 20,2 480 665 22,8 523 361
Reserves available to ordinary shareholders 14,0 333 011 16,8 384 774
Depreciation 6,2 147 654 6,0 138 587
100,0 2 376 814 100,0 2 290 540
VALUE ADDED RATIOS
Number of employees in South Africa 8 585 8 262
Contract revenue per employee (Rand) 803 891
Value created per employee (Rand) 277 277
The group did not receive any financial assistance from government during the year.
for the year ended 28 February 2011
Value added statement
Gro
up
at a
gla
nce
Man
ag
em
en
t revie
wO
pera
tion
al re
vie
wG
overn
an
ce
an
d
su
sta
inab
ility
Stefanutti Stocks / Annual Report 2011 / 68
www.stefanuttistocks.com
Directors’ responsibilities and approval
STATEMENT OF RESPONSIBILITY
The directors are required by the South African Companies Act to maintain adequate accounting records and are responsible
for the content and integrity of the annual financial statements and group annual financial statements and related information
included in this report. It is their responsibility to ensure that the annual financial statements present fairly the state of affairs
of the company and the group as at the end of the financial year and the results of their operations and cash flows for the
year then ended, in conformity with International Financial Reporting Standards. The external auditors are engaged to
express an independent opinion on the annual financial statements.
The external auditors are responsible for independently reviewing and reporting on the company’s and group’s annual
financial statements. The annual financial statements have been examined by the group’s external auditors and their report
is presented on page 72.
The annual financial statements and group annual financial statements are prepared in accordance with International
Financial Reporting Standards and are based on appropriate accounting policies consistently applied and supported by
reasonable and prudent judgements and estimates.
The directors acknowledge that they are ultimately responsible for the system of internal financial controls established for
the company and the group, and place considerable importance on maintaining a strong control environment. To enable the
directors to meet these responsibilities, the board sets standards for internal control aimed at reducing the risk of error or
loss in a cost-effective manner. The standards include the proper delegation of responsibilities within a clearly defined
framework, effective accounting procedures and adequate segregation of duties to ensure an acceptable level of risk.
These controls are monitored throughout the company and the group.
The focus of risk management in the company and the group is on identifying, assessing, managing and monitoring all
known forms of risk across the company and the group. While operating risk cannot be fully eliminated, the company and
the group endeavour to minimise risk by ensuring that appropriate infrastructure, controls, systems and ethical behaviour
are applied and managed within predetermined procedures and constraints.
The directors are of the opinion, based on the information and explanations given by management, that the system of
internal control provides reasonable assurance that the financial records may be relied upon for the preparation of the
annual financial statements and group annual financial statements. However, any system of internal control can provide
only reasonable, and not absolute assurance against material misstatement or loss.
The directors have reviewed the company’s and the subsidiaries’ cash flow forecasts for the year ending 28 February 2012
and, in the light of this review and current financial position, are satisfied that the company and group have access to
adequate resources to continue in operational existence for the foreseeable future. Therefore, the annual financial statements
and group annual financial statements have been prepared on the going concern basis.
APPROVAL
The annual financial statements and group annual financial statements, which appear on pages 73 to 147, were approved by
the board of directors on 18 July 2011 and are signed on their behalf:
W Meyburgh DG Quinn
Chief Executive Officer Chief Financial Officer
18 July 2011
Johannesburg
Stefanutti Stocks / Annual Report 2011 / 69
Gro
up
at a
gla
nce
Man
ag
em
en
t revie
wO
pera
tion
al re
vie
wG
overn
an
ce
an
d
su
sta
inab
ilityF
inan
cia
l sta
tem
en
tsS
takeh
old
ers
’ info
rmatio
n
Audit, Governance and Risk Committee report
The information below constitutes the report of the Audit, Governance and Risk Committee in respect of the financial year of
the company under review.
The Audit, Governance and Risk Committee is chaired by independent non-executive director Nomhle Canca, who has over
20 years’ experience in financial services, and further comprises independent non-executive director Kevin Eborall and
Joseph Fizelle, alternate to non-executive director Bridgman Sithole. The board has satisfied itself that the members are
suitably skilled and qualified to fulfil their duties. It is cognisant of the need to appoint a further independent director to meet
the requirements of the King III Report, the Companies Act, and the JSE Listings Requirements.
Chief Executive Officer Willie Meyburgh, Chief Financial Officer Dermot Quinn, Chief Operating Officer Stephen Pell, Group
Internal Audit Manager Gerrit Joubert, Group Risk Manager Dirk Els and executive director Schalk Ackerman, as well as the
external auditors, attend by invitation and management or independent third parties are invited to attend as appropriate. The
Company Secretary is the secretary of the committee.
At least twice a year, the committee meets in private with the external auditors. Such private discussions provide an
opportunity for committee members to communicate candidly without management present.
In line with the King III Report, the committee meets a minimum of twice per year with additional special meetings convened
as required. During the year the committee met five times. Attendance is set out on page 41.
The committee is governed by a charter which is reviewed annually. It will be reviewed in 2011 to take account of King III and
the Companies Act. The charter tasks the committee with assisting the board in evaluating the company’s risk, developing
and maintaining systems of internal control, maintaining accounting records and monitoring compliance with the King III
Report and the JSE Listings Requirements.
Further responsibilities of the committee outlined in the charter include:
monitoring compliance with codes of conduct and the ethical conduct of the company;
evaluating the independence and effectiveness of the external auditors as well as their performance and recommending
their appointment;
reviewing the annual financial statements and interim report;
reviewing, together with the external auditors, the conformity of the audited financial statements and related schedules
with IFRS and the company’s accounting policies;
reviewing the external audit plan and fees payable to the external auditors;
reviewing external audit findings and reports;
approving any non-audit services performed by the external auditors and the policy in this regard;
reviewing internal audit policies, plans, reports and findings;
monitoring compliance with applicable laws and regulations;
assessing the key risk areas facing the group and recommending risk mitigation measures; and
advising and updating the board on issues ranging from accounting standards to published financial information.
The committee is integral to the group’s risk management process. Both the Group Risk Manager and Group Internal Audit
Manager report directly to the committee and all risk identification, measurement and management is addressed through
these channels. A Risk Management Plan, Risk Register and Risk Policy were presented to and considered by the
committee during the year. The Audit, Governance and Risk Committee further reviewed the findings of an external review
and assurance exercise.
Stefanutti Stocks / Annual Report 2011 / 70
www.stefanuttistocks.com
Audit, Governance and Risk Committee report continued
In line with recommendations of the King III Report the Audit, Governance and Risk Committee supports the compilation of an
integrated annual report. The committee reviews the detailed annual report including the non-financial information and in turn
recommends it to the board. The Sustainability Committee, which is a sub-committee of the Audit, Governance and Risk
Committee, is focusing on bringing the annual report in line with recommended integrated reporting. King III recommends that
JSE-listed companies with financial years commencing after 1 March 2010 produce an integrated annual report which enables
stakeholders to evaluate an organisation’s performance and to make an informed assessment about its ability to create value.
The company has made progress in this regard, assisted by the Sustainability Committee. This will receive ongoing attention
during the 2012 financial year.
The committee has considered the independence of the external auditors, Mazars, and is of the view that the external
auditors are independent of the company. The committee has nominated, subject to the endorsement of the board and the
approval of shareholders, the reappointment of Mazars and Mark Snow as the independent registered audit firm and the
individual registered auditor of the company, respectively.
The committee has further considered and is satisfied with the expertise and experience of the company’s Chief Financial
Officer, Dermot Quinn. An effectiveness review of the finance function will be conducted during 2011.
To ensure the efficacy and independence of the Audit, Governance and Risk Committee a self-evaluation questionnaire is
intended to be initiated during the first half of 2011.
The committee has reviewed and recommended to the board the entire annual report.
The Audit, Governance and Risk Committee has recommended the financial statements for approval by the board.
NJMG Canca
Audit, Governance and Risk Committee Chairperson
18 July 2011
Johannesburg

Stefanutti Stocks / Annual Report 2011 / 71
Gro
up
at a
gla
nce
Man
ag
em
en
t revie
wO
pera
tion
al re
vie
wG
overn
an
ce
an
d
su
sta
inab
ilityF
inan
cia
l sta
tem
en
tsS
takeh
old
ers
’ info
rmatio
n
I declare that, to the best of my knowledge, the company has lodged with the Registrar of Companies all such returns as are
required of a public company in terms of the South African Companies Act, and that all such returns are true, correct and
up-to-date.
W Somerville
Company Secretary
18 July 2011
Johannesburg
Declaration by Company Secretary
Stefanutti Stocks / Annual Report 2011 / 72
www.stefanuttistocks.com
Independent auditor’s report
We have audited the group annual financial statements and annual financial statements of Stefanutti Stocks Holdings
Limited, which comprise the consolidated and separate statements of financial position as at 28 February 2011, and the
consolidated and separate statements of comprehensive income, changes in equity and cash flows for the year then ended,
and a summary of significant accounting policies and other explanatory notes, and the directors’ report, as set out on
pages 73 to 147.
DIRECTORS’ RESPONSIBILITY FOR THE FINANCIAL STATEMENTS
The company’s directors are responsible for the preparation and fair presentation of these financial statements in accordance
with International Financial Reporting Standards, and in the manner required by the Companies Act of South Africa. This
responsibility includes: designing, implementing and maintaining internal control relevant to the preparation and fair
presentation of financial statements that are free from material misstatement, whether due to fraud or error; selecting and
applying appropriate accounting policies; and making accounting estimates that are reasonable in the circumstances.
AUDITOR’S RESPONSIBILITY
Our responsibility is to express an opinion on these financial statements based on our audit. We conducted our audit in
accordance with International Standards on Auditing. Those standards require that we comply with ethical requirements
and plan and perform the audit to obtain reasonable assurance whether the financial statements are free from material
misstatement.
An audit involves performing procedures to obtain audit evidence about the amounts and disclosures in the financial
statements. The procedures selected depend on the auditor’s judgement, including the assessment of the risks of material
misstatement of the financial statements, whether due to fraud or error. In making those risk assessments, the auditor
considers internal control relevant to the entity’s preparation and fair presentation of the financial statements in order to
design audit procedures that are appropriate in the circumstances, but not for the purpose of expressing an opinion on the
effectiveness of the entity’s internal control. An audit also includes evaluating the appropriateness of accounting policies used
and the reasonableness of accounting estimates made by management, as well as evaluating the overall presentation of the
financial statements.
We believe that the audit evidence we have obtained is sufficient and appropriate to provide a basis for our audit opinion.
OPINION
In our opinion, these financial statements present fairly, in all material respects, the consolidated and separate financial
position of Stefanutti Stocks Holdings Limited as at 28 February 2011, and its consolidated and separate financial
performance and consolidated and separate cash flows for the year then ended in accordance with International Financial
Reporting Standards, and in the manner required by the Companies Act of South Africa.
MAZARS
Partner: Mark Snow
Registered Auditor
18 July 2011
Johannesburg
Stefanutti Stocks / Annual Report 2011 / 73
Gro
up
at a
gla
nce
Man
ag
em
en
t revie
wO
pera
tion
al re
vie
wG
overn
an
ce
an
d
su
sta
inab
ilityF
inan
cia
l sta
tem
en
tsS
takeh
old
ers
’ info
rmatio
n
Directors’ report
The directors present their report for the year ended 28 February 2011. This report forms part of the audited annual financial
statements and group audited annual financial statements.
BUSINESS AND OPERATIONS
The group’s business and operations, and the results thereof, are clearly reflected in the annual financial statements. Save for
disclosures in this report, no material fact or circumstance has occurred between the accounting date and the date of this
report.
Stefanutti Stocks is a holding company. Its multi-disciplinary subsidiaries are involved in concrete structures, rehabilitation
and marine construction, piling and geotechnical services, roads and earthworks, mine residue disposal facilities (mainly
tailings dams), open-pit contract mining, building works and mechanical, electrical and power line transmission and
distribution construction. In addition the group has established skills to participate in projects on a public-private partnership
(PPP) basis. These operations are formally structured into the following key disciplines: Structures, Roads & Earthworks,
Mining Services, Mechanical, Electrical & Power and Building (incorporating International).
FINANCIAL RESULTS
The results of the company, its subsidiaries, joint ventures and associates for the year ended 28 February 2011 are fully
disclosed in the annual financial statements and accompanying notes.
DIVIDEND
In line with the dividend policy the board declared an interim dividend of 20,0 cents on 10 November 2010 and a final
dividend of 25 cents per share on 24 May 2011, equating to a total dividend for the year of 45 cents (2010: 70 cents).
Secondary tax on companies of R 4,7 million will be payable on the dividend declared in May 2011.
SHARE CAPITAL
The total authorised ordinary share capital at year-end was R 1 000 consisting of 400 000 000 ordinary shares of
0,00025 cent each (with no change from the previous year).
The total issued ordinary share capital at year-end was R 470, consisting of 188 080 746 ordinary shares of 0,00025 cent
each (2010: 188 080 746 ordinary shares of 0,00025 cent each).
Refer to note 16 in the annual financial statements for further details of the employee share incentive schemes.
PROPERTY, PLANT AND EQUIPMENT
No major changes occurred during the year regarding the use and/or policies of property, plant and equipment.
BORROWINGS
The borrowings during the year have not exceeded those authorised by the Articles of Association.
DIRECTORS
The directors of the company at the date of this report are as follows:
B Stefanutti (Chairman)*
W Meyburgh (Chief Executive Officer)
D Quinn+ (Chief Financial Officer)
S Pell (Chief Operating Officer)
S Ackerman (appointed 1 March 2010)
N Canca*^
K Eborall*^
H Mashaba*^
M Mkwanazi*^ (Lead Independent Director)
B Sithole*
J Fizelle*+ (alternate to B Sithole)
* Non-executive ^ Independent + Irish
Stefanutti Stocks / Annual Report 2011 / 74
www.stefanuttistocks.com
Directors’ report continued
At the upcoming Annual General Meeting K Eborall, H Mashaba and B Stefanutti will retire by rotation and being eligible, will
stand for re-election.
DIRECTORS’ AND OFFICERS’ INTEREST IN CONTRACTS
No material contracts in which directors have an interest were entered into during the year other than the transactions
detailed in note 28 to the annual financial statements.
DIRECTORS’ EMOLUMENTS
The remuneration of directors for the year ended 28 February 2011 was as follows:
Basic
Incentive
bonus
Other
benefits Pension
Fees
paid to
non-executive
directors Total
R’000 R’000 R’000 R’000 R’000 R’000
B Stefanutti (Chairman) 294 2 579 — — 1 920 4 793
W Meyburgh (Chief Executive
Officer) 2 948 2 874 851 337 — 7 010
D Quinn (Chief Financial Officer) 1 921 1 821 658 228 — 4 628
S Pell (Chief Operating Officer) 2 278 1 585 692 223 — 4 778
S Ackerman 2 343 1 973 5 203 146 — 9 665
N Canca — — — — 350 350
K Eborall — — — — 350 350
H Mashaba — — — — 235 235
M Mkwanazi — — — — 648 648
B Sithole — — — — 108 108
J Fizelle — — — — 292 292
9 784 10 832 7 404 934 3 903 32 857
The remuneration of directors for the year ended 28 February 2010 was as follows:
Basic
Incentive
bonus
Other
benefits Pension
Fees
paid to
non-executive
directors Total
R’000 R’000 R’000 R’000 R’000 R’000
B Stefanutti (Chairman) 2 720 6 642 194 281 — 9 837
W Meyburgh (Chief Executive
Officer) 2 551 6 113 239 315 — 9 218
D Quinn (Chief Financial Officer) 1 674 3 598 268 213 — 5 753
S Pell (Chief Operating Officer) 1 627 2 739 314 197 — 4 877
N Canca — — — — 284 284
K Eborall — — — — 727 727
H Mashaba — — — — 302 302
M Mkwanazi — — — — 302 302
B Sithole — — — — 227 227
8 572 19 092 1 015 1 006 1 842 31 527
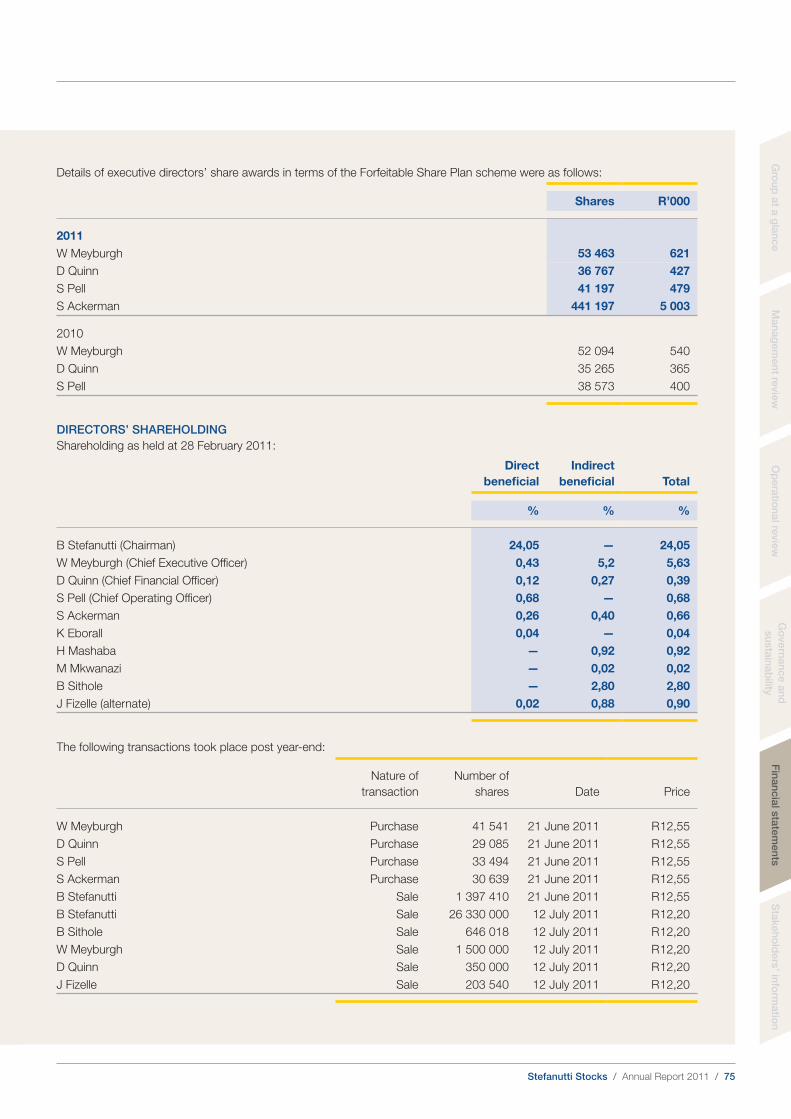
Stefanutti Stocks / Annual Report 2011 / 75
Gro
up
at a
gla
nce
Man
ag
em
en
t revie
wO
pera
tion
al re
vie
wG
overn
an
ce
an
d
su
sta
inab
ilityF
inan
cia
l sta
tem
en
tsS
takeh
old
ers
’ info
rmatio
n
Details of executive directors’ share awards in terms of the Forfeitable Share Plan scheme were as follows:
Shares R’000
2011
W Meyburgh 53 463 621
D Quinn 36 767 427
S Pell 41 197 479
S Ackerman 441 197 5 003
2010
W Meyburgh 52 094 540
D Quinn 35 265 365
S Pell 38 573 400
DIRECTORS’ SHAREHOLDING
Shareholding as held at 28 February 2011:
Direct
beneficial
Indirect
beneficial Total
% % %
B Stefanutti (Chairman) 24,05 — 24,05
W Meyburgh (Chief Executive Officer) 0,43 5,2 5,63
D Quinn (Chief Financial Officer) 0,12 0,27 0,39
S Pell (Chief Operating Officer) 0,68 — 0,68
S Ackerman 0,26 0,40 0,66
K Eborall 0,04 — 0,04
H Mashaba — 0,92 0,92
M Mkwanazi — 0,02 0,02
B Sithole — 2,80 2,80
J Fizelle (alternate) 0,02 0,88 0,90
The following transactions took place post year-end:
Nature of
transaction
Number of
shares Date Price
W Meyburgh Purchase 41 541 21 June 2011 R 12,55
D Quinn Purchase 29 085 21 June 2011 R 12,55
S Pell Purchase 33 494 21 June 2011 R 12,55
S Ackerman Purchase 30 639 21 June 2011 R 12,55
B Stefanutti Sale 1 397 410 21 June 2011 R 12,55
B Stefanutti Sale 26 330 000 12 July 2011 R 12,20
B Sithole Sale 646 018 12 July 2011 R 12,20
W Meyburgh Sale 1 500 000 12 July 2011 R 12,20
D Quinn Sale 350 000 12 July 2011 R 12,20
J Fizelle Sale 203 540 12 July 2011 R 12,20
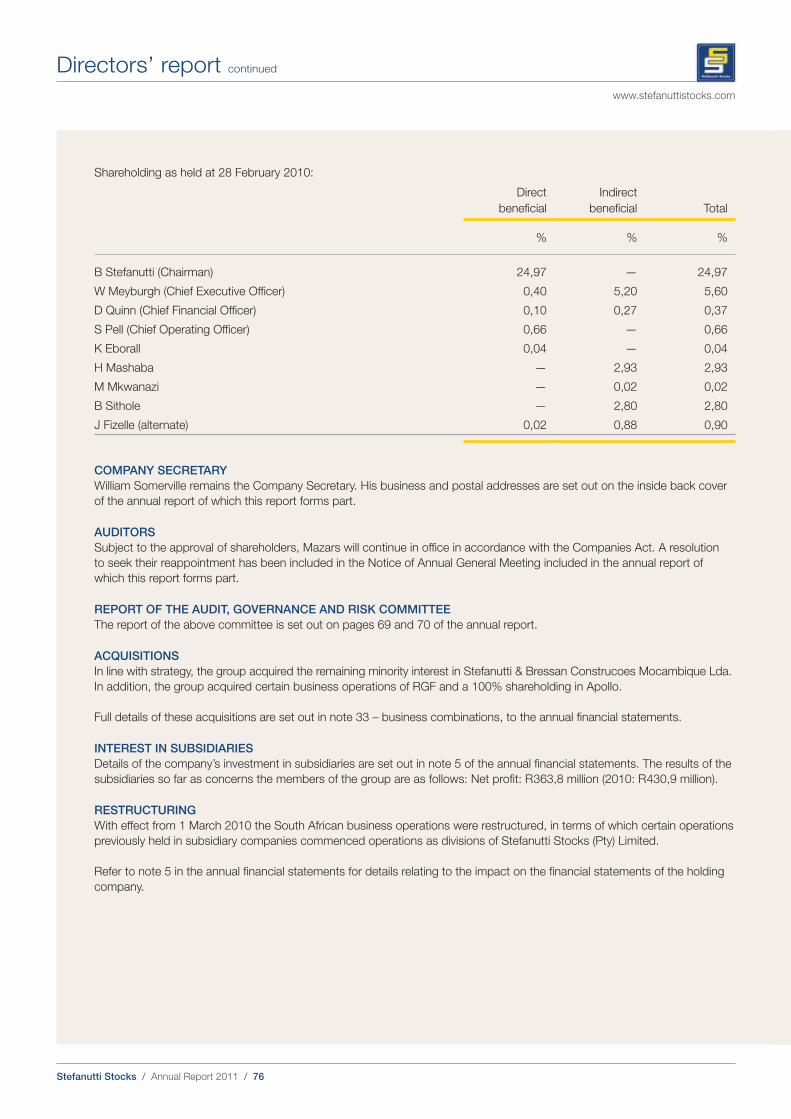
Stefanutti Stocks / Annual Report 2011 / 76
www.stefanuttistocks.com
Shareholding as held at 28 February 2010:
Direct
beneficial
Indirect
beneficial Total
% % %
B Stefanutti (Chairman) 24,97 — 24,97
W Meyburgh (Chief Executive Officer) 0,40 5,20 5,60
D Quinn (Chief Financial Officer) 0,10 0,27 0,37
S Pell (Chief Operating Officer) 0,66 — 0,66
K Eborall 0,04 — 0,04
H Mashaba — 2,93 2,93
M Mkwanazi — 0,02 0,02
B Sithole — 2,80 2,80
J Fizelle (alternate) 0,02 0,88 0,90
COMPANY SECRETARY
William Somerville remains the Company Secretary. His business and postal addresses are set out on the inside back cover
of the annual report of which this report forms part.
AUDITORS
Subject to the approval of shareholders, Mazars will continue in office in accordance with the Companies Act. A resolution
to seek their reappointment has been included in the Notice of Annual General Meeting included in the annual report of
which this report forms part.
REPORT OF THE AUDIT, GOVERNANCE AND RISK COMMITTEE
The report of the above committee is set out on pages 69 and 70 of the annual report.
ACQUISITIONS
In line with strategy, the group acquired the remaining minority interest in Stefanutti & Bressan Construcoes Mocambique Lda.
In addition, the group acquired certain business operations of RGF and a 100% shareholding in Apollo.
Full details of these acquisitions are set out in note 33 – business combinations, to the annual financial statements.
INTEREST IN SUBSIDIARIES
Details of the company’s investment in subsidiaries are set out in note 5 of the annual financial statements. The results of the
subsidiaries so far as concerns the members of the group are as follows: Net profit: R 363,8 million (2010: R 430,9 million).
RESTRUCTURING
With effect from 1 March 2010 the South African business operations were restructured, in terms of which certain operations
previously held in subsidiary companies commenced operations as divisions of Stefanutti Stocks (Pty) Limited.
Refer to note 5 in the annual financial statements for details relating to the impact on the financial statements of the holding
company.
Directors’ report continued
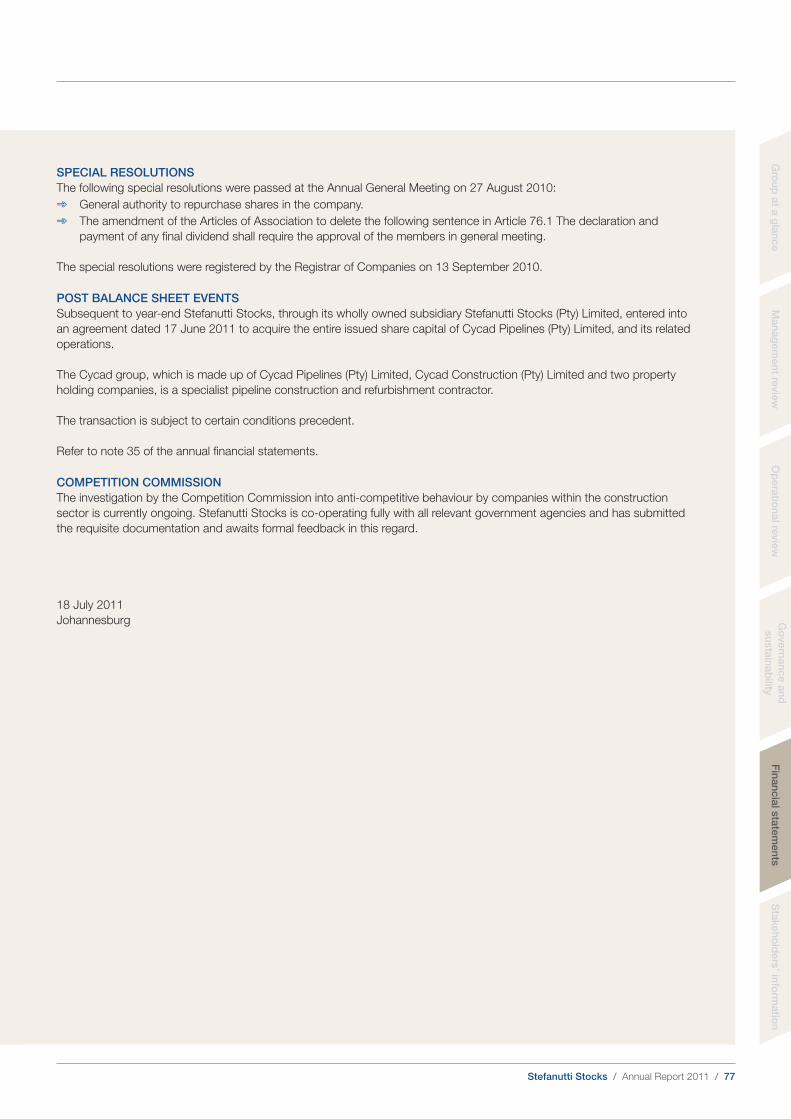
Stefanutti Stocks / Annual Report 2011 / 77
Gro
up
at a
gla
nce
Man
ag
em
en
t revie
wO
pera
tion
al re
vie
wG
overn
an
ce
an
d
su
sta
inab
ilityF
inan
cia
l sta
tem
en
tsS
takeh
old
ers
’ info
rmatio
n
SPECIAL RESOLUTIONS
The following special resolutions were passed at the Annual General Meeting on 27 August 2010:
General authority to repurchase shares in the company.
The amendment of the Articles of Association to delete the following sentence in Article 76.1 The declaration and
payment of any final dividend shall require the approval of the members in general meeting.
The special resolutions were registered by the Registrar of Companies on 13 September 2010.
POST BALANCE SHEET EVENTS
Subsequent to year-end Stefanutti Stocks, through its wholly owned subsidiary Stefanutti Stocks (Pty) Limited, entered into
an agreement dated 17 June 2011 to acquire the entire issued share capital of Cycad Pipelines (Pty) Limited, and its related
operations.
The Cycad group, which is made up of Cycad Pipelines (Pty) Limited, Cycad Construction (Pty) Limited and two property
holding companies, is a specialist pipeline construction and refurbishment contractor.
The transaction is subject to certain conditions precedent.
Refer to note 35 of the annual financial statements.
COMPETITION COMMISSION
The investigation by the Competition Commission into anti-competitive behaviour by companies within the construction
sector is currently ongoing. Stefanutti Stocks is co-operating fully with all relevant government agencies and has submitted
the requisite documentation and awaits formal feedback in this regard.
18 July 2011
Johannesburg
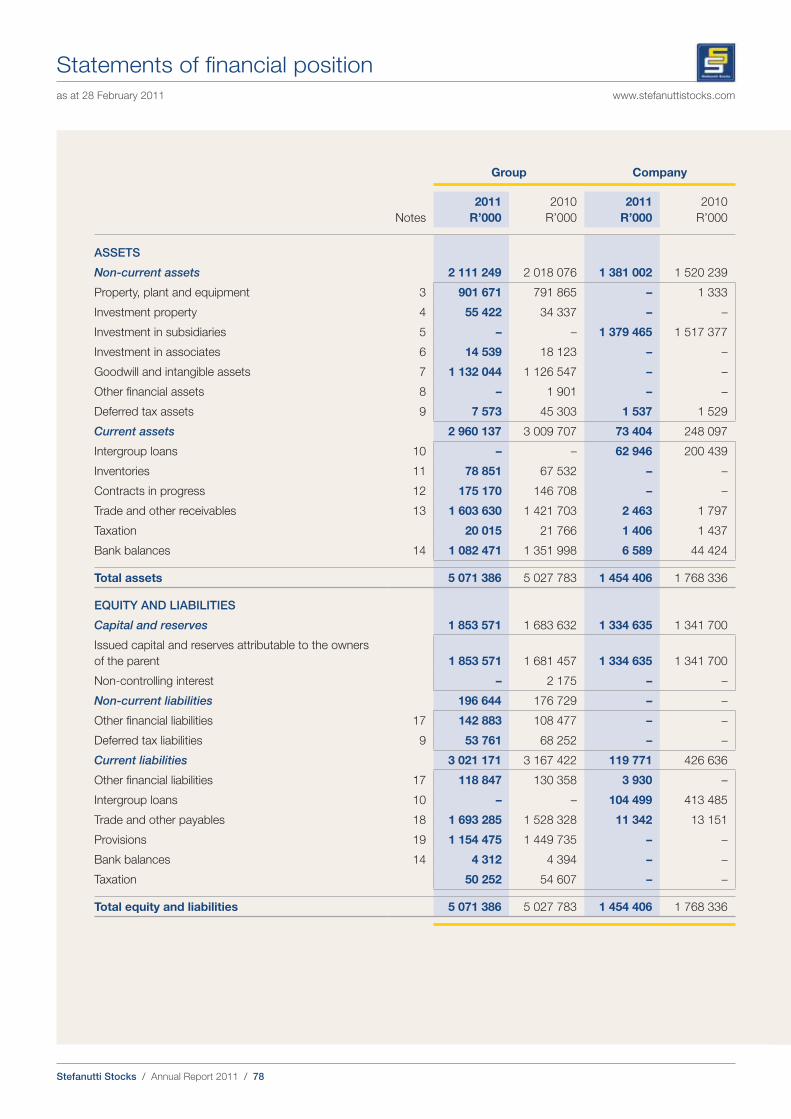
Stefanutti Stocks / Annual Report 2011 / 78
www.stefanuttistocks.comas at 28 February 2011
Statements of financial position
Group Company
Notes
2011
R’000
2010
R’000
2011
R’000
2010
R’000
ASSETS
Non-current assets 2 111 249 2 018 076 1 381 002 1 520 239
Property, plant and equipment 3 901 671 791 865 – 1 333
Investment property 4 55 422 34 337 – –
Investment in subsidiaries 5 – – 1 379 465 1 517 377
Investment in associates 6 14 539 18 123 – –
Goodwill and intangible assets 7 1 132 044 1 126 547 – –
Other financial assets 8 – 1 901 – –
Deferred tax assets 9 7 573 45 303 1 537 1 529
Current assets 2 960 137 3 009 707 73 404 248 097
Intergroup loans 10 – – 62 946 200 439
Inventories 11 78 851 67 532 – –
Contracts in progress 12 175 170 146 708 – –
Trade and other receivables 13 1 603 630 1 421 703 2 463 1 797
Taxation 20 015 21 766 1 406 1 437
Bank balances 14 1 082 471 1 351 998 6 589 44 424
Total assets 5 071 386 5 027 783 1 454 406 1 768 336
EQUITY AND LIABILITIES
Capital and reserves 1 853 571 1 683 632 1 334 635 1 341 700
Issued capital and reserves attributable to the owners
of the parent 1 853 571 1 681 457 1 334 635 1 341 700
Non-controlling interest – 2 175 – –
Non-current liabilities 196 644 176 729 – –
Other financial liabilities 17 142 883 108 477 – –
Deferred tax liabilities 9 53 761 68 252 – –
Current liabilities 3 021 171 3 167 422 119 771 426 636
Other financial liabilities 17 118 847 130 358 3 930 –
Intergroup loans 10 – – 104 499 413 485
Trade and other payables 18 1 693 285 1 528 328 11 342 13 151
Provisions 19 1 154 475 1 449 735 – –
Bank balances 14 4 312 4 394 – –
Taxation 50 252 54 607 – –
Total equity and liabilities 5 071 386 5 027 783 1 454 406 1 768 336
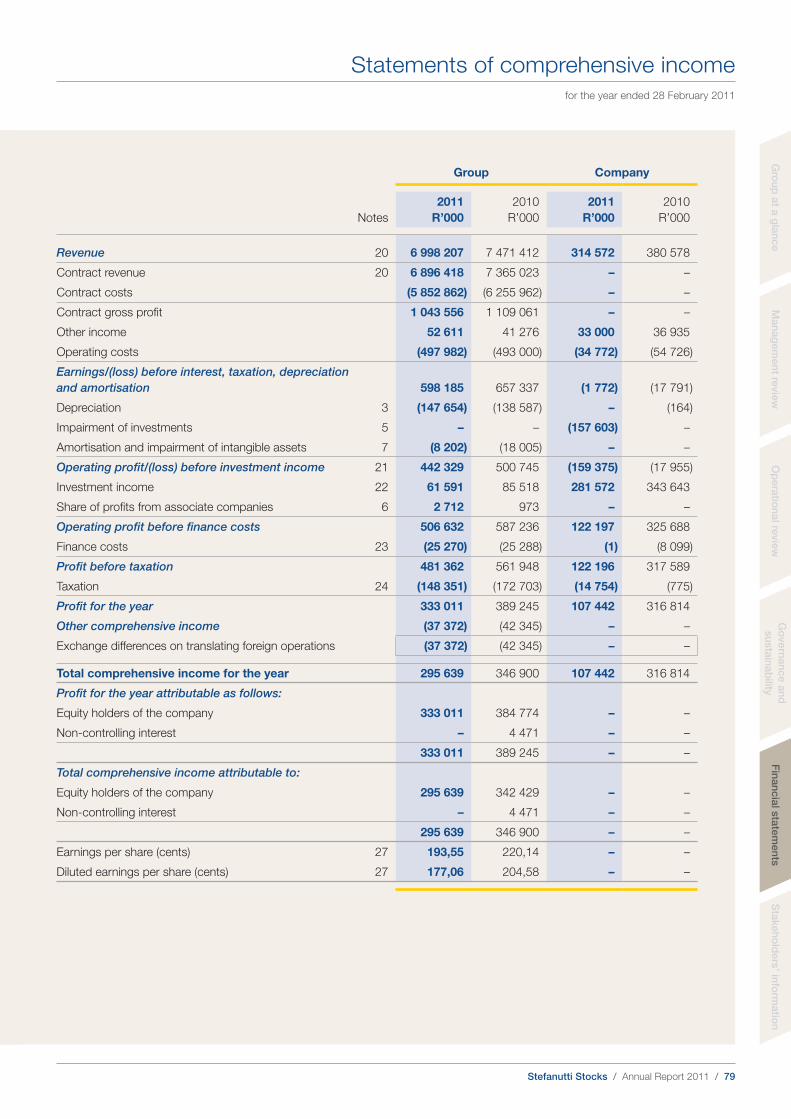
Stefanutti Stocks / Annual Report 2011 / 79
for the year ended 28 February 2011
Gro
up
at a
gla
nce
Man
ag
em
en
t revie
wO
pera
tion
al re
vie
wG
overn
an
ce
an
d
su
sta
inab
ilityF
inan
cia
l sta
tem
en
tsS
takeh
old
ers
’ info
rmatio
n
Statements of comprehensive income
Group Company
Notes
2011
R’000
2010
R’000
2011
R’000
2010
R’000
Revenue 20 6 998 207 7 471 412 314 572 380 578
Contract revenue 20 6 896 418 7 365 023 – –
Contract costs (5 852 862) (6 255 962) – –
Contract gross profit 1 043 556 1 109 061 – –
Other income 52 611 41 276 33 000 36 935
Operating costs (497 982) (493 000) (34 772) (54 726)
Earnings/(loss) before interest, taxation, depreciation
and amortisation 598 185 657 337 (1 772) (17 791)
Depreciation 3 (147 654) (138 587) – (164)
Impairment of investments 5 – – (157 603) –
Amortisation and impairment of intangible assets 7 (8 202) (18 005) – –
Operating profit/(loss) before investment income 21 442 329 500 745 (159 375) (17 955)
Investment income 22 61 591 85 518 281 572 343 643
Share of profits from associate companies 6 2 712 973 – –
Operating profit before finance costs 506 632 587 236 122 197 325 688
Finance costs 23 (25 270) (25 288) (1) (8 099)
Profit before taxation 481 362 561 948 122 196 317 589
Taxation 24 (148 351) (172 703) (14 754) (775)
Profit for the year 333 011 389 245 107 442 316 814
Other comprehensive income (37 372) (42 345) – –
Exchange differences on translating foreign operations (37 372) (42 345) – –
Total comprehensive income for the year 295 639 346 900 107 442 316 814
Profit for the year attributable as follows:
Equity holders of the company 333 011 384 774 – –
Non-controlling interest – 4 471 – –
333 011 389 245 – –
Total comprehensive income attributable to:
Equity holders of the company 295 639 342 429 – –
Non-controlling interest – 4 471 – –
295 639 346 900 – –
Earnings per share (cents) 27 193,55 220,14 – –
Diluted earnings per share (cents) 27 177,06 204,58 – –
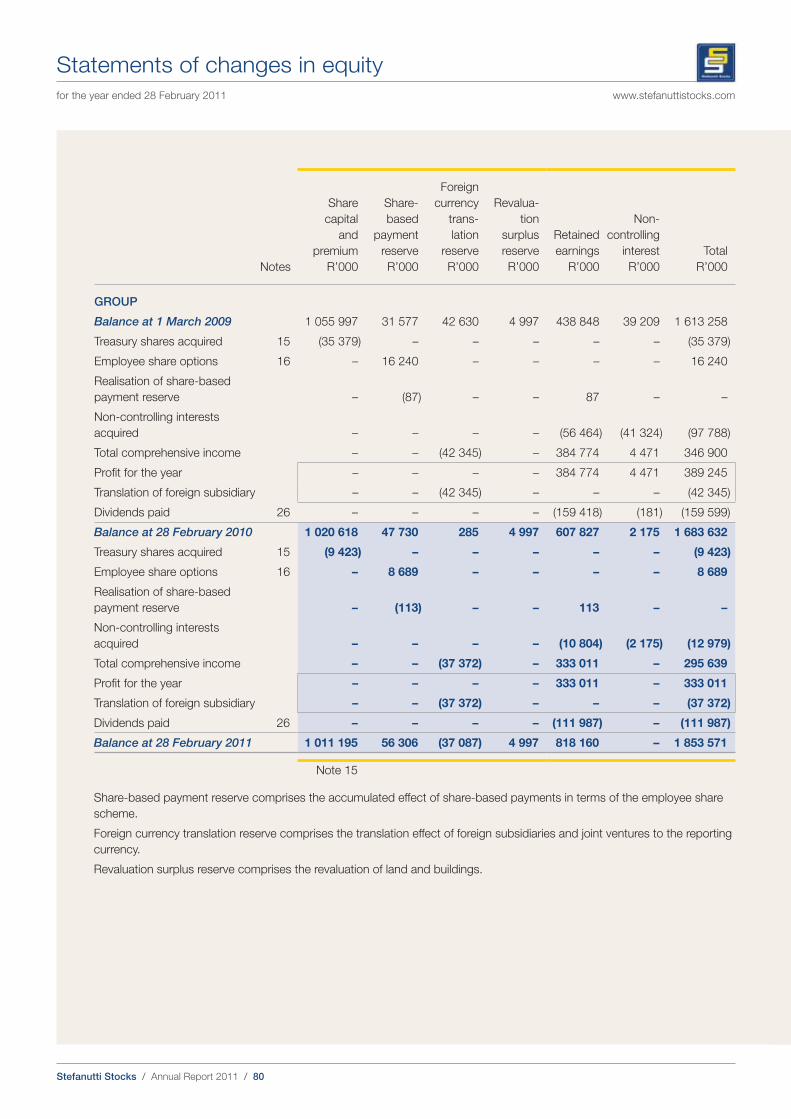
Stefanutti Stocks / Annual Report 2011 / 80
for the year ended 28 February 2011 www.stefanuttistocks.com
Statements of changes in equity
Notes
Share
capital
and
premium
R’000
Share-
based
payment
reserve
R’000
Foreign
currency
trans-
lation
reserve
R’000
Revalua-
tion
surplus
reserve
R’000
Retained
earnings
R’000
Non-
controlling
interest
R’000
Total
R’000
GROUP
Balance at 1 March 2009 1 055 997 31 577 42 630 4 997 438 848 39 209 1 613 258
Treasury shares acquired 15 (35 379) – – – – – (35 379)
Employee share options 16 – 16 240 – – – – 16 240
Realisation of share-based
payment reserve – (87) – – 87 – –
Non-controlling interests
acquired – – – – (56 464) (41 324) (97 788)
Total comprehensive income – – (42 345) – 384 774 4 471 346 900
Profit for the year – – – – 384 774 4 471 389 245
Translation of foreign subsidiary – – (42 345) – – – (42 345)
Dividends paid 26 – – – – (159 418) (181) (159 599)
Balance at 28 February 2010 1 020 618 47 730 285 4 997 607 827 2 175 1 683 632
Treasury shares acquired 15 (9 423) – – – – – (9 423)
Employee share options 16 – 8 689 – – – – 8 689
Realisation of share-based
payment reserve – (113) – – 113 – –
Non-controlling interests
acquired – – – – (10 804) (2 175) (12 979)
Total comprehensive income – – (37 372) – 333 011 – 295 639
Profit for the year – – – – 333 011 – 333 011
Translation of foreign subsidiary – – (37 372) – – – (37 372)
Dividends paid 26 – – – – (111 987) – (111 987)
Balance at 28 February 2011 1 011 195 56 306 (37 087) 4 997 818 160 – 1 853 571
Note 15
Share-based payment reserve comprises the accumulated effect of share-based payments in terms of the employee share
scheme.
Foreign currency translation reserve comprises the translation effect of foreign subsidiaries and joint ventures to the reporting
currency.
Revaluation surplus reserve comprises the revaluation of land and buildings.
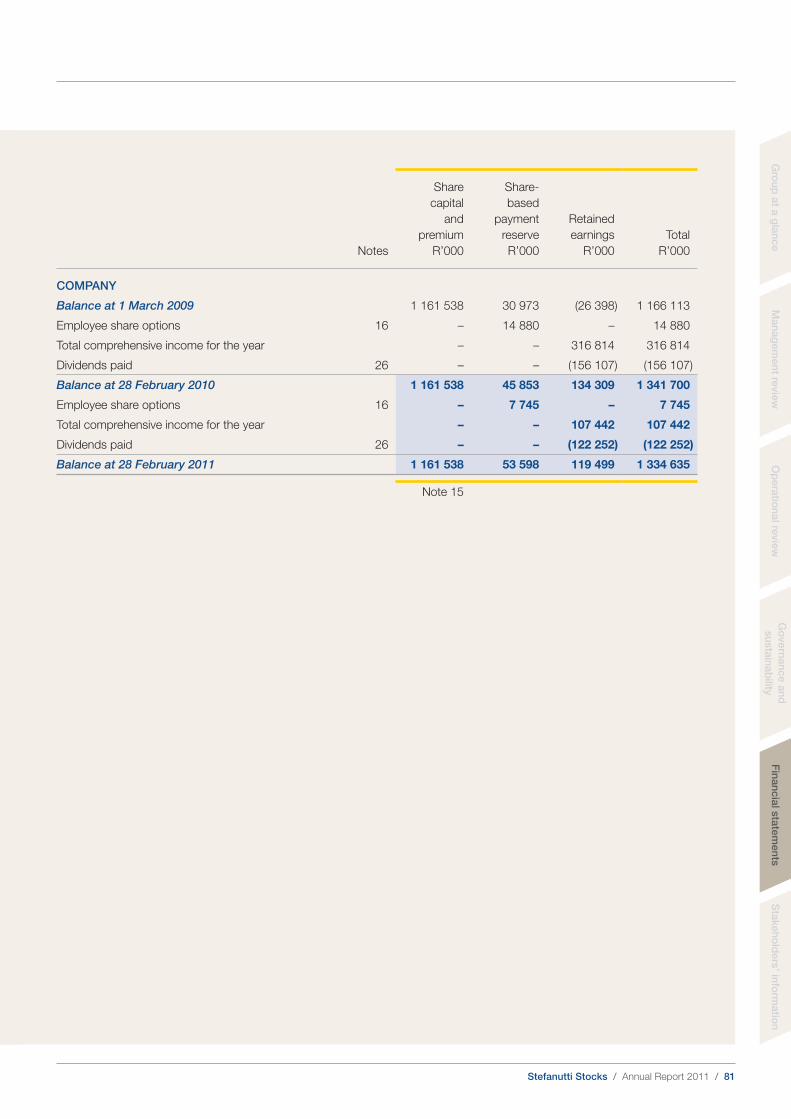
Stefanutti Stocks / Annual Report 2011 / 81
Gro
up
at a
gla
nce
Man
ag
em
en
t revie
wO
pera
tion
al re
vie
wG
overn
an
ce
an
d
su
sta
inab
ilityF
inan
cia
l sta
tem
en
tsS
takeh
old
ers
’ info
rmatio
n
Notes
Share
capital
and
premium
R’000
Share-
based
payment
reserve
R’000
Retained
earnings
R’000
Total
R’000
COMPANY
Balance at 1 March 2009 1 161 538 30 973 (26 398) 1 166 113
Employee share options 16 – 14 880 – 14 880
Total comprehensive income for the year – – 316 814 316 814
Dividends paid 26 – – (156 107) (156 107)
Balance at 28 February 2010 1 161 538 45 853 134 309 1 341 700
Employee share options 16 – 7 745 – 7 745
Total comprehensive income for the year – – 107 442 107 442
Dividends paid 26 – – (122 252) (122 252)
Balance at 28 February 2011 1 161 538 53 598 119 499 1 334 635
Note 15

Stefanutti Stocks / Annual Report 2011 / 82
for the year ended 28 February 2011 www.stefanuttistocks.com
Statements of cash flows
Group Company
Notes
2011
R’000
2010
R’000
2011
R’000
2010
R’000
Cash flows from operating activities 64 905 481 007 148 086 180 138
Cash receipts from customers 6 816 280 7 487 123 313 906 379 617
Cash paid to suppliers and employees (6 550 864) (6 695 071) (310 539) (378 871)
Cash generated from operations 25.1 265 416 792 052 3 367 746
Interest received 22 61 393 83 838 1 732 8 243
Finance costs 23 (25 270) (25 288) (1) (8 099)
Dividends paid 25.2 (111 856) (159 409) (122 121) (156 098)
Dividends received 6 & 22 3 024 1 680 279 840 335 400
Taxation paid 25.3 (115 577) (192 930) (2 506) –
Secondary tax on companies and withholding tax paid 25.4 (12 225) (18 936) (12 225) (54)
Cash flows from investing activities (300 940) (326 673) (14 428) (143 924)
Expenditure to maintain operating capacity
Property, plant and equipment acquired 3 (69 452) (48 742) – (1 432)
Proceeds on disposals of property, plant and
equipment 28 870 32 516 1 333 –
Repayment of associate loan 3 654 – – –
Expenditure for expansion
Property, plant and equipment acquired 3 (201 165) (131 486) – –
Development of investment property 4 (21 085) (34 337) – –
Proceeds on other financial assets/(acquired) 8 1 901 (1 901) – –
Net cash for acquisition of subsidiaries and non-
controlling interests 25.5 (43 663) (142 644) (15 761) (142 492)
Net cash for further investment in associates – (79) – –
Cash flows from financing activities 1 542 (92 611) (171 493) (2 850)
Repurchase of shares (9 423) (35 379) – –
Proceeds from long- and short-term financing 140 072 120 013 – –
Repayment of long- and short-term loans (129 107) (177 245) – –
Proceeds from intergroup loans 10 – – 137 493 44 186
Intergroup loans granted 10 – – (308 986) (47 036)
(Decrease)/increase in cash and cash equivalents (234 493) 61 723 (37 835) 33 364
Cash and cash equivalents at the beginning
of the year 1 347 604 1 333 877 44 424 11 060
Effect of exchange rate changes on cash and
cash equivalents (34 952) (47 996) – –
Cash and cash equivalents at the end of the year 14 1 078 159 1 347 604 6 589 44 424

Stefanutti Stocks / Annual Report 2011 / 83
for the year ended 28 February 2011
Gro
up
at a
gla
nce
Man
ag
em
en
t revie
wO
pera
tion
al re
vie
wG
overn
an
ce
an
d
su
sta
inab
ilityF
inan
cia
l sta
tem
en
tsS
takeh
old
ers
’ info
rmatio
n
The principal accounting policies adopted in the preparation of these consolidated annual financial statements are set
out below:
1. PRESENTATION OF FINANCIAL STATEMENTS
The consolidated financial statements include those of the holding company, its subsidiaries, joint ventures and
associates.
The annual financial statements and group annual financial statements have been prepared in accordance with
International Financial Reporting Standards (IFRS) and the Companies Act of South Africa.
The annual financial statements have been prepared using a combination of the historical cost and fair value basis of
accounting. Those categories to which the fair value basis of accounting has been applied are indicated in the individual
accounting policy notes below.
In the current year, the group has adopted all of the new and revised Standards and Interpretations issued by the IASB
and the International Financial Reporting Interpretations Committee (IFRIC) of the IASB that are relevant to its operations
and effective for the year ended 28 February 2011.
The principal accounting policies are set out below. The accounting policies are consistent with the previous year
except for where new policies have been adopted. Refer to note 2.
1.1 Significant judgements and estimates
In the process of applying the group’s accounting policies, the directors have made the following judgements
that have an effect on the amounts recognised in the annual financial statements:
Allowance for doubtful debts
Debtor accounts are written off when they are delinquent. An allowance is raised on accounts based on
management’s assessment of the likelihood of collecting receivables outstanding.
Allowance for slow-moving, damaged and obsolete inventory
An allowance account is used to write inventory down to the lower of cost or net realisable value. Management
has made estimates of the selling price and direct cost to sell on certain inventory items.
Options granted
Management used a variant of the binomial pricing model to determine the value of the options at issue date.
Additional details regarding the estimates are included in the note relating to share-based payments.
Impairment testing
Management used the value-in-use method to determine the recoverable amount of goodwill and intangible
assets as there is no active market in identifying assets that may have been impaired. Additional disclosure of
these estimates is included in the note relating to goodwill and intangible assets.
Provisions
Provisions were raised and management determined an estimate based on the information available. Additional
disclosures of these estimates of provisions are included in the note relating to provisions.
1.2 Investments in subsidiaries
Group annual financial statements
The group annual financial statements comprise the consolidated annual financial statements of the company, its
subsidiaries and results of associates and jointly controlled operations. The annual financial statements of the
subsidiaries are prepared for the same reporting period as the parent company, using consistent accounting
policies.
Accounting policies
Stefanutti Stocks / Annual Report 2011 / 84
for the year ended 28 February 2011 www.stefanuttistocks.com
1. PRESENTATION OF FINANCIAL STATEMENTS (continued)
1.2 Investments in subsidiaries (continued)
Group annual financial statements (continued)
All intergroup balances, transactions, income and expenses are eliminated in full in the consolidated annual
financial statements.
Subsidiaries are consolidated from the date of acquisition, which is the date on which the group obtains control
of the subsidiary, and continue to be consolidated until the date that control ceases.
Subsidiaries, which are those entities in which the group has an interest of more than one half of the voting rights
or otherwise has the power to govern the financial and operating policies, are consolidated. The results of the
subsidiaries acquired or disposed of during the year are included in the consolidated statement of
comprehensive income from the effective date of acquisition and up to the effective date of disposal.
Non-controlling interest included on the statement of financial position represent the portion of profit or loss and
net assets in subsidiaries not held by the group. Non-controlling interest is presented separately in the statement
of comprehensive income and within equity in the statement of financial position.
Company annual financial statements
Investments in subsidiaries in the company’s separate annual financial statements are initially recognised at cost.
The cost of an investment in a subsidiary is the aggregate of the fair value, at the date of exchange, of assets
acquired, liabilities incurred or assumed and shares issued.
Investments in subsidiaries are subsequently measured at cost less any accumulated impairment.
1.3 Investments in joint ventures
The group has interests in certain jointly controlled operations, and recognise the following with respect to these
interests in its annual financial statements:
a) The assets that it controls and the liabilities that it incurs;
b) The expenses that it incurs and its share of the income that it earns from the sale of goods or services by the
joint venture.
Results of joint ventures are included when two or more joint venture parties combine their operations, resources
and expertise in order to manufacture/build a joint particular product. The joint venture is derecognised when the
combined operations cease.
1.4 Investments in associates
Group annual financial statements
Investments in associates are accounted for using the equity method. Associates are entities in which the group
has significant influence and which is neither a subsidiary nor a joint venture.
Under the equity method, the investments are initially recognised at cost and the carrying amount is increased or
decreased to recognise the group’s share of the profits or losses of the associates after their acquisition dates.
An impairment is recognised when there is any objective evidence that the investment in associate is impaired.
The use of the equity method is discontinued from the date on which the group ceases to have significant
influence over an associate.
Company annual financial statements
Investments in associates in the company’s separate annual financial statements are initially recorded at cost.
Investments in associates are subsequently measured at cost less any accumulated impairment. An impairment is
recognised when the recoverable amount of the investment is lower than the carrying amount of the investment.
Accounting policies continued
Stefanutti Stocks / Annual Report 2011 / 85
Gro
up
at a
gla
nce
Man
ag
em
en
t revie
wO
pera
tion
al re
vie
wG
overn
an
ce
an
d
su
sta
inab
ilityF
inan
cia
l sta
tem
en
tsS
takeh
old
ers
’ info
rmatio
n
1. PRESENTATION OF FINANCIAL STATEMENTS (continued)
1.5 Property, plant and equipment
Property, plant and equipment is initially recognised at cost. The cost of property, plant and equipment includes
amounts incurred initially to acquire or construct an item of property, plant and equipment. Amounts incurred
subsequently to add to, or replace part of the asset, are also recognised at cost. Replacement costs include the
cost of major inspections. If the replacement cost is recognised in the carrying amount of an item of property,
plant and equipment, the carrying amount of the replaced part is derecognised. Depreciation is written off over
the useful life of the item. Day-to-day servicing costs, such as labour and consumables, are expensed in the
statement of comprehensive income.
Property, plant and equipment, other than land and buildings, is subsequently measured at cost less
accumulated depreciation and any accumulated impairment losses. Land and buildings are carried at a revalued
amount, being the fair value of the property at the date of revaluation, less any accumulated impairment losses
subsequent to the date of the revaluation. The residual value exceeds the carrying value, therefore no
depreciation is recognised.
Any increase in the assets’ carrying amounts, as a result of a revaluation, is credited directly to other
comprehensive income in the revaluation surplus. The increase is recognised in the statement of comprehensive
income to the extent that it reverses a revaluation decrease of the same asset previously recognised in the
statement of comprehensive income.
Any decrease in the assets’ carrying amounts, as a result of a revaluation, is recognised in the statement of
comprehensive income in the year in which it arises. However, the decrease is debited directly against the
revaluation surplus in other comprehensive income to the extent that it reverses any revaluation previously
credited to this reserve for a specific asset.
Depreciation is provided on property, plant and equipment to write down the cost, less residual value, on the
straight-line basis over their estimated useful lives as follows:
Building 50 years
Plant and equipment 5 – 10 years
Transport and motor vehicles 5 years
Furniture, fittings, office and computer equipment 3 – 8 years
Leasehold improvements 4 years
Aircraft 5 000 hours flying time
Land is not depreciated as it is deemed to have an indefinite useful life.
Where a part of an item of property, plant and equipment is significant in relation to the cost of the item, that part
is depreciated separately. The depreciation charge is recognised as an expense in the statement of
comprehensive income.
The residual values, useful lives and depreciation methods applied to property, plant and equipment are
reviewed, and adjusted if necessary, at each year-end. These changes are accounted for as a change in
estimate.
An item of property, plant and equipment is derecognised upon disposal or where no future economic benefits
are expected from its use or disposal. The gain or loss arising from the derecognition of an item of property, plant
and equipment is included in the statement of comprehensive income and is calculated as the difference
between the net disposal proceeds, if any, and the carrying amount of the item at the date of derecognition.
When a decision is made to sell an item of property, plant and equipment during the year, and it meets the
requirements of IFRS 5 Non-current Assets Held for Sale and Discontinued Operations, the asset is carried
at the lower of its carrying amount or fair value less costs to sell, and depreciation on that asset ceases. Any
impairment is recognised directly in the statement of comprehensive income.
Stefanutti Stocks / Annual Report 2011 / 86
for the year ended 28 February 2011 www.stefanuttistocks.com
1. PRESENTATION OF FINANCIAL STATEMENTS (continued)
1.6 Investment property
Investment property is any land, building or part thereof that is either owned or leased by the group under a
finance lease for the purpose of earning rentals or for capital appreciation, or both, rather than for use in the
production or supply of goods or services, for administrative purposes, or sale in the ordinary course of business.
This classification is performed on a property-by-property basis.
Investment property is measured at cost including all transaction costs, subsequently measured at fair value.
Investment property is derecognised when it has either been disposed of or when the investment property is
permanently withdrawn from use and no future economic benefit is expected from its disposal.
Any gain or loss on the derecognition of an investment property is recognised in profit or loss in the year of
derecognition.
1.7 Goodwill and intangible assets
Goodwill
Goodwill arises from business combinations and is initially measured at cost. Cost represents the excess of the
purchase consideration over the fair value of the group’s share of the identifiable assets, liabilities and contingent
liabilities acquired at the date of acquisition. Subsequently, goodwill is measured at cost less any accumulated
impairment losses.
Where the fair value of the group’s share of the identifiable assets, liabilities and contingent liabilities acquired
in a business combination is greater than the cost of the combination, the difference is recognised in profit
immediately.
Goodwill is reviewed for impairment at each year-end or more frequently if events or changes in circumstances
indicate that the carrying amount may be impaired.
At the acquisition date, goodwill is allocated to each of the cash-generating units expected to benefit from the
synergies of a combination. Impairment is determined by assessing the recoverable amount of the cash-
generating unit to which goodwill relates. The recoverable amount is determined as the value in use of each
cash-generating unit by estimating the expected future cash flows in each unit and choosing a suitable discount
rate in order to calculate the present value of those cash flows.
Where the recoverable amount of the cash-generating unit is less than the carrying amount of the unit, an
impairment loss is recognised in the statement of comprehensive income beginning with the write-off of the
goodwill allocated to such cash-generating unit. Where the goodwill is insufficient to cover the amount of the
impairment adjustment, the remaining assets in the cash-generating unit are impaired on a pro rata basis.
Where goodwill forms part of a cash-generating unit and that unit is disposed of, the goodwill is included in the
carrying amount of the operation when determining the gain or loss on disposal of that operation.
Where goodwill forms part of a cash-generating unit and part of the operation within that unit is disposed of, the
goodwill associated with the disposed operation is determined on the basis of the relative value of the operation
disposed of and the portion of the cash-generating unit retained. This goodwill is included in the carrying amount
of the operation when determining the gain or loss on disposal of that operation.
An impairment loss recognised for goodwill is not subsequently reversed.
Accounting policies continued
Stefanutti Stocks / Annual Report 2011 / 87
Gro
up
at a
gla
nce
Man
ag
em
en
t revie
wO
pera
tion
al re
vie
wG
overn
an
ce
an
d
su
sta
inab
ilityF
inan
cia
l sta
tem
en
tsS
takeh
old
ers
’ info
rmatio
n
1. PRESENTATION OF FINANCIAL STATEMENTS (continued)
1.7 Goodwill and intangible assets (continued)
Intangible assets
Intangible assets are initially recognised at cost.
The cost of an intangible asset includes its purchase price and any directly attributable cost of preparing the
asset for its intended use.
Where an intangible asset is acquired in a business combination, the cost of that intangible asset is its fair value
at the acquisition date.
Amortisation is provided for all intangible assets on a straight-line basis so as to write down the cost of the
intangible assets, less their residual values, on the straight-line basis over their useful lives as determined when
the purchase price allocation is done.
Useful lives of intangible assets are as follows:
Contract- and customer-related intangible assets 1 – 3 years
Trade names-related intangible assets 1 – 10 years
Technology-related intangible assets 1 – 3 years
The amortisation charge is recognised as an expense in the statement of comprehensive income. The
amortisation period and amortisation method applied to an intangible asset with a finite useful life is reviewed,
and adjusted if necessary, on an annual basis. These changes are accounted for as a change in estimate.
Intangible assets are derecognised upon disposal or when no future economic benefits are expected from its use
or disposal. The gain or loss arising from the derecognition of an intangible asset is included in the statement of
comprehensive income and is calculated as the difference between the net disposal proceeds, if any, and the
carrying amount of the asset at the date of derecognition.
1.8 Impairment of assets
The group assesses at each reporting date whether there is any indication that an asset may be impaired. If any
such indication exists, the group estimates the recoverable amount of the asset.
Irrespective of whether there is any indication of impairment, the group also tests goodwill acquired in a business
combination for impairment at each year-end by comparing its carrying amount with its recoverable amount.
In assessing value in use, the estimated future cash flows are discounted to their present value using a pre-tax
discount rate that reflects current market assessment of the time value of money and the risks specific to the
asset. If the recoverable amount of an asset is less than its carrying amount, the carrying amount of the asset is
reduced to its recoverable amount. That reduction is an impairment loss.
An impairment loss is recognised for cash-generating units if the recoverable amount of the unit is less than the
carrying amount of the unit. The impairment loss is allocated to reduce the carrying amount of the assets of
the unit by first reducing the goodwill allocated to the cash-generating unit (if any) and then to the other assets
of the unit, pro rata on the basis of the carrying amount of each asset in the unit.
Intangible assets are tested for impairment, when there is an indication thereof, by determining the recoverable
amount of the assets either individually or at the cash-generating unit level. Where this assessment is performed
at the cash-generating unit level, the impairment is determined by assessing the recoverable amount of the
cash-generating unit to which the intangible asset relates. In such instances, the recoverable amount is
determined as the value in use of the cash-generating unit by estimating the expected future cash flows in the
unit and choosing a suitable discount rate in order to calculate the present value of those cash flows.
Stefanutti Stocks / Annual Report 2011 / 88
for the year ended 28 February 2011 www.stefanuttistocks.com
1. PRESENTATION OF FINANCIAL STATEMENTS (continued)
1.8 Impairment of assets (continued)
Where the recoverable amount is less than the carrying amount of the asset or the cash-generating unit, an
impairment loss is recognised in the statement of comprehensive income.
The group assesses at each reporting date whether there is any indication that an impairment loss recognised in
prior periods for assets may no longer exist or may have decreased. If any such indication exists, the recoverable
amounts of those assets are estimated. The increased carrying amount of an asset attributable to a reversal of
an impairment loss may not exceed the carrying amount that would have been determined had no impairment
loss been recognised for the asset in prior years.
In general, a reversal of an impairment loss of assets carried at cost less accumulated depreciation or
amortisation other than goodwill is recognised immediately in the statement of comprehensive income. Any
reversal of an impairment loss of a revalued asset is either treated as a revaluation increase, or as a reversal
of an impairment loss in the statement of comprehensive income.
1.9 Financial instruments
Initial recognition for financial assets and financial liabilities
The group classifies financial instruments, or their component parts, on initial recognition as a financial asset,
a financial liability or an equity instrument in accordance with the substance of the contractual arrangement.
Financial assets, financial liabilities and equity instruments are recognised on the group’s statement of financial
position when the group becomes party to the contractual provisions of the instrument. Financial assets and
financial liabilities are initially recognised at fair value plus direct transaction cost.
Loans to/(from) group companies: Loans and receivables/other financial liabilities
These include current accounts as well as loans to/(from) holding companies, subsidiaries, joint ventures and
associates.
Loans payable, where there are no determinable terms of repayment are included in current liabilities and are
considered repayable on demand.
Loans to/(from) group companies are subsequently measured at amortised cost less any impairment.
Trade and other receivables: Loans and receivables
Trade and other receivables are subsequently measured at amortised cost using the effective interest rate
method less any impairment. This results in interest income being recognised in the statement of comprehensive
income over the period of the deferral.
Trade and other payables: Other financial liabilities
Trade and other payables are subsequently measured at amortised cost.
Bank overdrafts: Other financial liabilities
Bank overdrafts are subsequently measured at amortised cost using the effective interest rate method.
Cash and cash equivalents: Loans and receivables
Cash and cash equivalents comprise cash on hand and other short-term deposits. Cash and cash equivalents
are short, highly liquid investments that are readily convertible to a known amount of cash and are subject to an
insignificant risk of changes in value. These are subsequently recorded at amortised cost.
For the purpose of the cash flow, the net amount of the statement of financial position of bank balances are
used.
Accounting policies continued
Stefanutti Stocks / Annual Report 2011 / 89
Gro
up
at a
gla
nce
Man
ag
em
en
t revie
wO
pera
tion
al re
vie
wG
overn
an
ce
an
d
su
sta
inab
ilityF
inan
cia
l sta
tem
en
tsS
takeh
old
ers
’ info
rmatio
n
1. PRESENTATION OF FINANCIAL STATEMENTS (continued)
1.9 Financial instruments (continued)
Other financial assets: Held to maturity
These items are financial assets with fixed or determinable payments and fixed maturities and are classified as
held to maturity when the group has a contractual right or the positive intention and ability to hold to maturity.
These investments are subsequently measured at amortised cost. Gains and losses are recognised in profit or
loss when the investments are derecognised or impaired.
Other financial liabilities: Loans and borrowings
After initial recognition, interest-bearing loans and borrowings are subsequently measured at amortised cost
using the effective interest rate method. Gains and losses are recognised in profit/(loss) when the liabilities are
derecognised as well as through the effective interest rate method.
Amortised cost
Amortised cost is calculated by taking into account any discount or premium on acquisition and fee or costs that
are an integral part of the effective interest rate method. The effective interest rate amortisation is included in
finance cost in profit/(loss).
Derecognition of financial assets and liabilities
Financial liabilities are derecognised when the obligation under the liability is discharged or cancelled or expires.
Financial assets are derecognised when all the risks and rewards of ownership of the financial asset have been
transferred.
Impairment of financial instruments
Loans to/(from) group companies: Loans and receivables/other financial liabilities
On loans receivable, an impairment loss is recognised in the statement of comprehensive income when there is
objective evidence that the loan receivable is impaired. Significant financial difficulties, probability that the
company will enter bankruptcy or financial reorganisation, and default or delinquency in payments are considered
objective evidence of impairment.
The impairment is measured as the difference between the carrying amount and the recoverable amount. If the
recoverable amount is lower than the carrying amount, the impairment will be recognised. The recoverable
amount is the fair value of the loans/receivables based on estimated future cash flows discounted to their present
value using the pre-tax discount rate that reflects current market assessments of the time value of money and
risks specific to the financial instrument.
Impairment losses are reversed in subsequent periods when an increase in the loans’ recoverable amount can be
related objectively to an event occurring after the impairment was recognised, subject to the restriction that the
carrying amount of the loan at the date the impairment is reversed does not exceed what the amortised cost
would have been had the impairment not been recognised.
Gains and losses are recognised in profit or loss when loans and receivables are derecognised or impaired,
as well as through the amortisation process.
Trade and other receivables: Loans and receivables
An estimate of any impairment is made to an allowance account on individual receivables. Allowances for
estimated irrecoverable amounts are recognised in profit and loss when there is objective evidence that the
collection of the full amount under the original terms of the invoice is no longer probable. Objective evidence
would include indicators such as probable insolvency or significant difficulties in the debtor. An allowance
recognised is measured as the difference between the asset’s carrying amount and the present value of the
estimated future cash flows discounted at the effective interest rate computed at initial recognition. Impaired
debts are derecognised when they are assessed as uncollectible.
If the amount of the impairment decreases and the decrease can be related objectively to an event occurring
after the impairment was recognised, the reversal for the previously recognised impairment is recognised within
profit and loss.
Stefanutti Stocks / Annual Report 2011 / 90
for the year ended 28 February 2011 www.stefanuttistocks.com
1. PRESENTATION OF FINANCIAL STATEMENTS (continued)
1.10 Share capital
Share capital issued by the company is recorded as the proceeds received, net of issue costs.
Treasury shares
When shares held in the group through subsidiary companies reduce the group’s share capital, those equity
instruments, held at cost (treasury shares) are presented as a deduction against the group’s equity. No gain or
loss is recognised in the statement of comprehensive income. The share capital is reduced for the par value of
the shares and the balance against the share premium.
Subsidiary companies include share incentive trusts set up for the benefit of the group’s employees. Such trusts
are consolidated in the group results because the group effectively controls the trust through the specific
mechanisms that were established when the trust was formed.
1.11 Taxation
Current tax
Current and deferred taxes are recognised as income or an expense and included in the statement of
comprehensive income. The current tax payable is based on taxable profit. Taxable profit differs from profit
reported in the statement of comprehensive income where there are items of income or expense that are taxable
or deductible in other years and it also excludes items that are not taxable or deductible under existing tax
legislation.
Secondary taxation on companies is provided in respect of declared dividends, net of dividends received or
receivable, and is recognised as a taxation charge in the statement of comprehensive income in the year the
related dividend is declared.
Current tax for current and prior periods is, to the extent unpaid, recognised as a tax payable in the statement of
financial position. If the amount already paid in respect of current and prior periods exceeds the amount due for
those periods, the excess is recognised as a tax receivable in the statement of financial position.
Current tax liabilities and current tax assets are measured at the amount expected to be paid to/(recovered from)
the tax authorities, using the tax rates and tax laws that have been enacted or substantively enacted at the
reporting date.
Deferred tax assets and liabilities
A deferred tax liability is recognised for all taxable temporary differences, except to the extent that the deferred
tax liability arises from the initial recognition of goodwill, or the initial recognition of an asset or liability in a
transaction that is not a business combination and that, at the time of the transaction, affects neither accounting
profit/(accounting loss) nor taxable profit/(tax loss).
A deferred tax asset is recognised for all deductible temporary differences to the extent that it is probable that
taxable profit will be available against which the deductible temporary difference can be utilised. A deferred tax
asset is not recognised when it arises from the initial recognition of an asset or liability in a transaction that, at the
time of the transaction, affects neither accounting profit/(accounting loss) nor taxable profit/(tax loss) and is not a
business combination.
A deferred tax asset is recognised for all taxable temporary differences associated with investments in
subsidiaries, associates and interests in joint ventures, except to the extent that the group is able to control the
timing of the reversal of the temporary difference and it is probable that the temporary difference will not reverse
in the foreseeable future.
Accounting policies continued
Stefanutti Stocks / Annual Report 2011 / 91
Gro
up
at a
gla
nce
Man
ag
em
en
t revie
wO
pera
tion
al re
vie
wG
overn
an
ce
an
d
su
sta
inab
ilityF
inan
cia
l sta
tem
en
tsS
takeh
old
ers
’ info
rmatio
n
1. PRESENTATION OF FINANCIAL STATEMENTS (continued)
1.11 Taxation (continued)
Deferred tax assets and liabilities (continued)
A deferred tax asset is recognised for the carry forward of unused tax losses (and unused secondary taxation on
companies’ credits) to the extent that it is probable that future taxable profit will be available against which the
used tax losses and secondary taxation on companies’ credits can be utilised.
Deferred tax assets and liabilities are measured at the tax rates that are expected to apply to the period when
the asset is realised or the liability is settled, based on tax rates (and tax laws) that have been enacted or
substantively enacted at the reporting date. The measurement of deferred tax assets and liabilities reflect the tax
consequences that would follow from the manner in which the company expects to recover or settle the carrying
amounts of its assets and liabilities at the reporting date.
The carrying amount of deferred tax assets in the statement of financial position are reviewed annually and
reduced to the extent that it is no longer probable that sufficient taxable profits will be available to allow all or
part of the asset to be recovered.
Deferred tax assets and liabilities are offset for presentation in the statement of financial position where the
company has a legally enforceable right to do so and the income taxes relate to the same tax authority.
Deferred tax assets and deferred tax liabilities arising in the group annual financial statements from different
subsidiaries are not offset because there is no allowance in South African tax law that allows income tax from
different entities to be offset.
Value added taxation
A value added taxation liability is recognised in the statement of financial position where the amount of output
exceeds the input and a value added taxation asset is recognised when the input exceeds the output value.
1.12 Leases
Leases of assets where the group assumes substantially all the benefits and risks of ownership are classified as
finance leases. Leases of assets under which all the risks and benefits of ownership are effectively retained by the
lessor are classified as operating leases. When an arrangement is or contains a lease, that lease is recognised in
terms of the lease policy below.
Finance leases – Lessee
Assets leased under a finance lease are recognised as assets and liabilities in the statement of financial position
at amounts equal to the fair value of the leased asset or, if lower, the present value on the minimum lease
payments. The corresponding liability to the lessor is included in the statement of financial position as a finance
lease obligation. Subsequent measurement is at amortised cost. Assets held under finance leases are
depreciated over their expected useful lives on the same basis as owned assets or, where shorter, the terms
of the lease.
Income from leases is disclosed within other income in the statement of comprehensive income.
1.13 Inventories
Inventories are stated at the lower of cost and net realisable value. Cost is determined on a weighted average
basis and comprises the cost to purchase, cost of conversion and other costs incurred in bringing the inventories
to their present location and condition.
Net realisable value is the estimated selling price in the ordinary course of business, less estimated costs of
completing and the estimated costs necessary to make the sale.
Stefanutti Stocks / Annual Report 2011 / 92
for the year ended 28 February 2011 www.stefanuttistocks.com
1. PRESENTATION OF FINANCIAL STATEMENTS (continued)
1.13 Inventories (continued)
The amount of any write-down of inventories to net realisable value and all losses of inventories are recognised
as an expense in the period the write-down or loss occurs. The amount of any reversal of any write-down of
inventories, arising from an increase in net realisable value, is recognised as a reduction in the amount of
inventories recognised as an expense in the period in which the reversal occurs.
1.14 Construction contracts
A construction contract is a contract specifically negotiated for the construction of an asset or a combination of
assets that are closely interrelated or interdependent in terms of their design, technology and functions, or their
ultimate purpose of use.
A group of contracts are treated as a single construction contract when the groups of contracts are negotiated
as a single package, the contracts are so interrelated that they are in effect part of a single project with an overall
profit margin and the contracts are performed concurrently or in a continuous sequence.
An agreement for the construction of real estate is a construction contract when the buyer is able to specify the
major structural elements of the design of the real estate before construction begins and/or specify major
structural changes once construction is in progress. Revenue in such cases is determined in accordance with
the percentage of completion of the contract. In all other contracts revenue is recognised on delivery of the
constructed assets. If the entity is not required to provide materials, but only to construct the real estate, the
supply is the rendering of services, and revenue is recognised on the percentage of completion basis.
When the outcome of a construction contract cannot be estimated reliably, contract revenue is recognised to the
extent of contract costs incurred where it is probable those costs will be recovered. Contract costs on these
contracts are recognised when incurred.
When the outcome of a construction contract can be estimated reliably, contract revenue is recognised by using
the percentage of completion method as set out in note 1.18. Costs are recognised in net profit as incurred.
However, costs incurred in the year in connection with future activity on a contract are excluded and shown as
contracts in progress. When it is probable that total contract costs will exceed total contract revenue, the
expected loss is recognised as an expense immediately.
Where recognised revenue using the percentage of completion method exceeds billed work, the balance is also
shown under contracts in progress. Where billed work exceeds recognised revenue using the percentage of
completion method, the balance is shown as contracting provisions.
1.15 Employee benefits
Short-term employee benefits
The cost of short-term employee benefits is recognised in the period in which the service is rendered and is not
discounted.
The expected cost of accrued leave is recognised as an expense as the employees render service that increases
their entitlement or, in the case of non-accumulating leave, when the absence occurs. Accrued leave is
measured as the amount that the company expects to pay as a result of unused entitlement that has
accumulated to the employees at the reporting date.
The expected cost of bonus payments is recognised as an expense when there is a legal or constructive
obligation to make such payments as a result of past performance.
Accounting policies continued
Stefanutti Stocks / Annual Report 2011 / 93
Gro
up
at a
gla
nce
Man
ag
em
en
t revie
wO
pera
tion
al re
vie
wG
overn
an
ce
an
d
su
sta
inab
ilityF
inan
cia
l sta
tem
en
tsS
takeh
old
ers
’ info
rmatio
n
1. PRESENTATION OF FINANCIAL STATEMENTS (continued)
1.15 Employee benefits (continued)
Post-employment benefits
Payments to a defined contribution retirement plan are charged as an expense as the related service is rendered.
The group requires monthly paid employees to partake in a group retirement fund and hourly paid employees in
the relevant industry funds. These funds are managed by various portfolio managers and are governed by the
Pension Funds Act.
1.16 Share-based payments
Goods or services received or acquired in a share-based payment transaction where the group settles the
consideration for those goods or services by issuing shares are classified as equity-settled share-based
payments. These include share-based payment transactions where employees (including the directors) receive
remuneration for services rendered to the company in the form of shares or share options, as well as share-
based payment transactions where employees (including the directors) receive share options in the group share
incentive scheme as a result of their employment within the group.
Goods or services received or acquired in a share-based payment transaction are recognised when the goods
are received or as the services are rendered. A corresponding increase in equity is recognised if the goods or
services were received in an equity-settled share-based payment transaction. When the goods or services are
received or acquired in a share-based payment transaction do not qualify for recognition as assets, they are
recognised as expenses in the statement of comprehensive income. Transactions with employees (including
directors) are recognised as employee costs in the statement of comprehensive income.
For share-based payment transactions with employees (including directors), the fair value of the transaction is
measured as the fair value of the share options granted at the grant date.
The fair value of share options is determined using a binomial model, such as the Black-Scholes model, taking
into account the terms and conditions upon which the share options were granted. The fair value of the units
issued is based on the strike price at grant date.
If the share-based payments granted do not vest until the employee completes a specified period of service or
achieves specified performance conditions, the group accounts for those services as they are rendered by the
employee during the vesting period. The fair value that is accounted for over the vesting period is determined on
the grant date of the share-based payment. The cumulative expense that is recognised at each reporting date
reflects the extent to which the vesting conditions have expired or been met and the group’s best estimate of the
number of share options that will ultimately vest.
1.17 Provisions and contingencies
Provisions are recognised when the group has a present obligation as a result of a past event, it is probable that
an outflow of resources embodying economic benefits will be required to settle the obligation and a reliable
estimate can be made of the obligation.
The amount of a provision is the present value of the best estimate of the expenditure required to settle the
obligation. The amount of the provision is discounted using a pre-tax discount rate when the effect of the
expected future cash outflow related to the provision is not expected to occur soon after the reporting date and
the effect of discounting is material. Provisions are reviewed annually to reflect current best estimates of the
expenditure required to settle the obligations.
The group raises a provision for warranties calculated at the best estimate of the costs of warranty claims. The
group uses past history to estimate the volume of claims and expected costs of repairs under the warranty
clause in the contract.
Stefanutti Stocks / Annual Report 2011 / 94
for the year ended 28 February 2011 www.stefanuttistocks.com
1. PRESENTATION OF FINANCIAL STATEMENTS (continued)
1.17 Provisions and contingencies (continued)
Contingent assets and contingent liabilities are disclosed in the notes to the annual financial statements when the
fair value cannot be measured reliably.
Contingent liabilities acquired in a business combination are recognised in the financial statements when their fair
value can be measured reliably. Subsequently, any contingent liabilities that are recognised separately in the
financial statements are measured at the higher of the amount that would be recognised as a provision and the
amount initially recognised less cumulative amortisation.
1.18 Revenue
Revenue from construction contracts is recognised in accordance with the accounting policy for construction
contracts and receivables.
Revenues relating to contracts are accounted for using the percentage-of-completion method and are measured
at the fair value of the consideration received or receivable and include variations and claims. The stage of
completion is measured by reference to the survey of work performed. When the survey of work performed
cannot be determined reliably, revenue is recognised only to the extent of the expenses recognised that are
recoverable.
Revenue from the rendering of services is recognised when:
a) the amount of revenue can be measured reliably;
b) it is probable that the economic benefits associated with the transaction will flow to the entity;
c) the costs incurred can be measured reliably; and/or
d) the costs incurred for the transaction and the costs to complete the transaction can be measured reliably.
Revenue from rental agreements is recognised in accordance with the accounting policy for operating leases.
Interest is recognised on a time proportion basis using the effective interest rate method.
Dividend revenue is recognised in the statement of comprehensive income when the group’s right to receive
payment has been established. This normally coincides with the declaration of the dividend.
1.19 Borrowing costs
Borrowing costs that are directly attributable to the acquisition, construction or production of a qualifying asset
are capitalised as part of the cost of that asset until such time as the asset is ready for its intended use. The
amount of borrowing costs eligible for capitalisation is determined as the aggregate of actual borrowing costs on
funds specifically borrowed for the purpose of obtaining a qualifying asset (less any temporary investment of
those borrowings) and the weighted average of the borrowing costs applicable to the entity on funds generally
borrowed for the purpose of obtaining a qualifying asset. The borrowing costs capitalised may not exceed the
total borrowing costs incurred.
The capitalisation of borrowing costs commences when expenditures for the asset have occurred, when
borrowing costs have been incurred, and the activities that are necessary to prepare the asset for its intended
use or sale are in progress.
The capitalisation of borrowing costs is suspended during extended periods in which active development is
interrupted and the capitalisation of borrowing costs finally ceases when substantially all the activities necessary
to prepare the qualifying asset for its intended use or sale are complete.
All other borrowing costs arising on the borrowing of funds are recognised as an expense in the statement of
comprehensive income, in the finance costs line item, in the period in which they are incurred.
Borrowing costs incurred on the investment property are expensed in terms of the transitional provisions of
IAS 23.
Accounting policies continued
Stefanutti Stocks / Annual Report 2011 / 95
Gro
up
at a
gla
nce
Man
ag
em
en
t revie
wO
pera
tion
al re
vie
wG
overn
an
ce
an
d
su
sta
inab
ilityF
inan
cia
l sta
tem
en
tsS
takeh
old
ers
’ info
rmatio
n
1. PRESENTATION OF FINANCIAL STATEMENTS (continued)
1.20 Dividends
Dividends declared by the company to holders of the company’s shares are recognised in the statement of
changes in equity. Dividends that have not been declared at the reporting date are not accounted for in the
current period. Such dividends are disclosed where the declaration occurred after the reporting date, but before
these annual financial statements are approved for issue.
1.21 Translation of foreign currencies
The functional currency of the company is South African Rand.
In the group annual financial statements, the results and financial position of a foreign operation are translated
into Rand using the following procedures:
Assets and liabilities for each statement of financial position presented are translated at the closing rate at
the date of that statement of financial position.
Income and expenses for each statement of comprehensive income are translated at exchange rates at the
dates of the transactions or, where exchange differences did not fluctuate significantly, at the average
exchange rates for the period.
All resulting exchange differences are recognised as a separate component of equity and included in the
foreign currency translation reserve.
Exchange differences arising on a monetary item that forms part of a net investment in a foreign operation are
recognised initially in the foreign currency translation reserve in the group annual financial statements and
recognised in the statement of comprehensive income on disposal of the net investment. These exchange
differences are recognised in the statement of comprehensive income in the group’s annual financial statements.
1.22 Segmental reporting
IFRS 8 requires an entity to adopt a ‘management approach’ to reporting the financial performance of its
segments. Segment reporting is done per business unit level, as determined by the Executive Committee.
2. NEW ACCOUNTING PRONOUNCEMENTS ADOPTED
2.1 Standards and Interpretations effective and adopted in the current year
In the current year, the group has adopted the following Standards and Interpretations that are effective for the
current financial year and that are relevant to its operations:
Amendment to IFRS 2 Share-based Payments
On 18 June 2009, the IASB issued amendments to IFRS 2 Share-based Payments (IFRS 2). These amendments
are effective for annual periods beginning on or after 1 January 2010. These amendments clarify the scope of
IFRS 2, as well as the accounting for group cash-settled share-based payment transactions in the separate
financial statements of an entity receiving the goods or services when another group entity or shareholder has
the obligation to settle the award. Guidance in this area previously provided in IFRIC 8 Scope of IFRS 2 and
IFRIC 11 Group and Treasury Share Transactions has been incorporated into the amended IFRS 2.
Amendments to IFRS 2 do not affect the group results.
Stefanutti Stocks / Annual Report 2011 / 96
for the year ended 28 February 2011 www.stefanuttistocks.com
2. NEW ACCOUNTING PRONOUNCEMENTS ADOPTED (continued)
2.1 Standards and Interpretations effective and adopted in the current year (continued)
Amendment to IFRS 3 Business Combinations
The major changes to IFRS 3 Business Combinations are as follows:
The non-controlling interest of a business combination is measured, either at its proportionate interest in the
net identifiable assets or at fair value.
The requirement to measure at fair value every asset and liability at each step of a step acquisition for the
purpose of calculating a portion of goodwill has been removed. Instead, goodwill is measured as the
difference at the acquisition date between the fair value of any investment in the business held before the
acquisition, the consideration transferred and the net assets acquired.
Acquisition-related costs are generally recognised as expenses, and not included in goodwill.
Contingent consideration must be recognised and measured at fair value at the acquisition date.
Subsequent changes in fair value are recognised in accordance with other IFRS, usually in profit or loss,
rather than by adjusting goodwill.
The amendment is effective for periods beginning on or after 1 July 2009.
Adoption of the Standard resulted in disclosure changes, and the recognition of transaction costs as an expense
instead of as part of the cost of the business combination in the current year.
Amendment to IFRS 5 Non-current Assets Held for Sale and Discontinued Operations
Disclosures for non-current assets (or disposal groups) classified as held-for-sale or discontinued operations are
specified in IFRS. The disclosure requirements of other IFRS are applicable to those assets (or disposal groups)
only if they specifically require disclosures in respect of non-current assets (or disposal groups) classified as
held-for-sale or discontinued operations, or they relate to items not within the measurement scope of IFRS 5.
The amendment is effective for periods beginning on or after 1 January 2010.
The amendment did not have an impact on the group’s annual financial statements.
Amendment to IFRS 8 Operating Segments
The amendment is set to state that segment information with respect to total assets are required only if such
information is regularly reported to the chief operating decision maker.
The amendment is effective for periods beginning on or after 1 January 2010.
The amendment did not have an impact on the group’s annual financial statements as assets are reported to the
chief operating decision maker.
Amendment to IAS 1 Presentation of Financial Statements
The amendment clarifies that the classification of the liability component of a convertible instrument as current or
non-current is not affected by terms that could, at the option of the holder of the instrument, result in settlement
of the liability by the issue of equity instruments.
The amendment is effective for periods beginning on or after 1 January 2010.
The amendment did not impact the group’s annual financial statements.
Accounting policies continued
Stefanutti Stocks / Annual Report 2011 / 97
Gro
up
at a
gla
nce
Man
ag
em
en
t revie
wO
pera
tion
al re
vie
wG
overn
an
ce
an
d
su
sta
inab
ilityF
inan
cia
l sta
tem
en
tsS
takeh
old
ers
’ info
rmatio
n
2. NEW ACCOUNTING PRONOUNCEMENTS ADOPTED (continued)
2.1 Standards and Interpretations effective and adopted in the current year (continued)
Amendment to IAS 7 Statement of Cash Flows
IAS 7 is amended to state explicitly that only expenditures that result in the recognition of an asset can be
classified as a cash flow from investing activities.
The amendment is effective for periods beginning on or after 1 January 2010.
The amendment did not impact the group’s annual financial statements.
Amendment to IAS 17 Leases
The standard is amended to delete guidance stating that a lease of land with an indefinite economic life normally
is classified as an operating lease, unless at the end of the lease term title is expected to pass to the lessee.
Under the amendments, a land lease with a lease term of several decades or longer may be classified as a
finance lease, even if at the end of the lease term title will not pass to the lessee, because in such arrangements
substantially all risks and rewards are transferred to the lessee and the present value of the residual value of the
leased asset is considered negligible.
The amendment also states that when a lease includes both land and building elements, an entity should
determine the classification of each element based on paragraphs 7 to 13 of IAS 17, taking into account the
fact that the land normally has an indefinite economic life.
The amendment is effective for periods beginning on or after 1 January 2010.
The amendment did not impact the group’s annual financial statements.
Amendments to IAS 27 Consolidated and Separate Financial Statements
IAS 27 (revised) requires the effects of all transactions with non-controlling interest to be recorded in equity
if there is no change in control. They will no longer result in goodwill or gains and losses. The standard also
specifies the accounting when control is lost. Any remaining interest in the entity is remeasured at fair value
and a gain or loss is recognised in profit or loss.
The amendment is effective for periods beginning on or after 1 July 2009.
The amendment did not impact the group’s annual financial statements, as the group always accounted for
non-controlling interests’ transactions using the equity method.
Amendments to IAS 28 Investments in Associates
This amendment deals with consequential amendments from changes to business combinations, required
disclosures when investments in associates are accounted for at fair value through profit or loss and impairment
of investment in associates.
The amendment is effective for annual periods beginning on or after 1 July 2009.
The amendment did not impact the group’s annual financial statements as associates are equity accounted.
Amendments to IAS 31 Interest in Joint Ventures
This amendment deals with consequential amendments from changes to business combinations and required
disclosures when interests in jointly controlled entities are accounted for at fair value through profit or loss.
The amendment is effective for periods beginning on or after 1 July 2009.
The amendment did not impact the group’s annual financial statements.
Stefanutti Stocks / Annual Report 2011 / 98
for the year ended 28 February 2011 www.stefanuttistocks.com
2. NEW ACCOUNTING PRONOUNCEMENTS ADOPTED (continued)
2.1 Standards and Interpretations effective and adopted in the current year (continued)
Amendments to IAS 36 Impairment of Assets
IAS 36 is amended to state that the largest unit to which goodwill should be allocated is the operating segment
level as defined in IFRS 8 before applying the aggregation criteria of IFRS 8.
The effective date of the amendment is for years beginning on or after 1 January 2010.
The amendment did not have an impact on the group’s annual financial statements.
Amendments to IAS 38 Intangible Assets
The amendment includes clarifying the requirements under IFRS 3 (2008) regarding accounting for intangible
assets required in a business combination. The amendment also clarifies the description of the valuation
techniques commonly used by entities when measuring fair value of intangible assets acquired in a business
combination that are not traded in active markets.
This amendment is effective for annual periods beginning on or after 1 July 2009.
The amendment did not impact the group’s annual financial statements.
Amendments to IAS 39 Financial Instruments: Recognition and Measurement
The amendment deals with treating loan prepayment penalties as closely related embedded derivatives, scope
exemption for business combination contracts, cash flow hedge accounting and hedging using internal
contracts. It further deals with the clarification of two hedge accounting issues; surrounding inflation in a financial
hedge item and a one-sided risk in a hedge item, as well as embedded derivatives when reclassifying financial
instruments.
The effective date of the amendment is for years beginning on or after 1 July 2009 and 1 January 2010.
The amendment did not impact on the group’s annual financial statements.
Accounting policies continued
Stefanutti Stocks / Annual Report 2011 / 99
for the year ended 28 February 2011
Gro
up
at a
gla
nce
Man
ag
em
en
t revie
wO
pera
tion
al re
vie
wG
overn
an
ce
an
d
su
sta
inab
ilityF
inan
cia
l sta
tem
en
tsS
takeh
old
ers
’ info
rmatio
n
2. NEW ACCOUNTING PRONOUNCEMENTS ADOPTED (continued)
2.2 Standards and Interpretations issued and not yet effective
The group has chosen not to early adopt the following Standards and Interpretations, which have been published
and are mandatory for the group’s accounting periods beginning on or after 1 March 2011 or later periods.
Management is currently assessing the impact of these amendments and new Interpretations.
Accounting Standard/Interpretation Type
Effective date
Annual periods
beginning on
or after
IFRS 3 Business Combinations Amendment 1 January 2011
Amendments to transition requirements for contingent
consideration from a business combination that occurred before
the effective date of the revised IFRS.
Clarification on the measurement of non-controlling interests.
Additional guidance provided on unrelated and voluntarily replaced
share-based payment awards.
IFRS 7 Financial Instruments: Disclosures Amendment 1 January 2011
Amendment clarifies the intended interaction between qualitative
and quantitative disclosures of the nature and extent of risks
arising from financial instruments and removed some disclosure
items which were seen to be superfluous or misleading.
Amendments require additional disclosure on transfer transactions
of financial assets, including the possible effects of any residual
risks that the transferring entity retains. The amendments also
require additional disclosures if a disproportionate amount of
transfer transactions are undertaken around the end of a reporting
period.
Amendment 1 July 2011
IFRS 9 Financial Instruments New 1 January 2013
New standard that forms the first part of a three-part project to
replace IAS 39 Financial Instruments: Recognition and
Measurement.
IAS 1 Presentation of Financial Statements Amendment 1 January 2011
Clarification on the presentation of statement of changes in equity.
IAS 12 Income Taxes Amendment 1 January 2012
A rebuttable presumption introduced that an investment property
will be recovered in its entirety through sale.
Stefanutti Stocks / Annual Report 2011 / 100
for the year ended 28 February 2011 www.stefanuttistocks.com
Accounting policies continued
2. NEW ACCOUNTING PRONOUNCEMENTS ADOPTED (continued)
2.2 Standards and Interpretations effective and adopted in the current year (continued)
Accounting Standard/Interpretation Type
Effective date
Annual periods
beginning on
or after
IAS 21 The Effects of Changes in Foreign Exchange Rates Amendment 1 July 2010
The amendment clarifies the transition rules in respect of the
disposal or partial disposal of an interest in a foreign operation.
IAS 24 Related Party Disclosures Amendment 1 January 2011
Simplification of the disclosure requirements for government-
related entities.
Clarification of the definition of a related party.
IAS 27 Consolidated and Separate Financial Statements Amendment 1 July 2010
Transition requirements for amendments arising as a result of
IAS 27 Consolidated and Separate Financial Statements.
IAS 28 Investments in Associates Amendment 1 July 2010
Clarification on the transition rules in respect of the disposal or
partial disposal of an interest in a foreign operation.
IAS 31 Interest in Joint Ventures Amendment 1 July 2010
The amendment clarifies the transition rules in respect of the
disposal or partial disposal of an interest in a foreign operation.
IAS 34 Interim Financial Reporting Amendment 1 January 2011
Clarification of disclosure requirements around significant events
and transactions including financial instruments.

Stefanutti Stocks / Annual Report 2011 / 101
for the year ended 28 February 2011
Gro
up
at a
gla
nce
Man
ag
em
en
t revie
wO
pera
tion
al re
vie
wG
overn
an
ce
an
d
su
sta
inab
ilityF
inan
cia
l sta
tem
en
tsS
takeh
old
ers
’ info
rmatio
n
Notes to the annual financial statements
Group Company
Cost/
valuation
R’000
Accu-
mulated
depre-
ciation
R’000
Carrying
value
R’000
Cost/
valuation
R’000
Accu-
mulated
depre-
ciation
R’000
Carrying
value
R’000
3. PROPERTY, PLANT AND EQUIPMENT
2011
Owned and leased assets
Land 43 692 – 43 692 – – –
Buildings 182 207 – 182 207 – – –
Aircraft 600 – 600 – – –
Transport and motor vehicles 98 494 (48 142) 50 352 – – –
Plant and equipment 985 547 (379 495) 606 052 – – –
Furniture, fittings, office and computer
equipment 51 304 (37 290) 14 014 – – –
Leasehold improvements 5 429 (675) 4 754 – – –
1 367 273 (465 602) 901 671 – – –
2010
Owned and leased assets
Land 41 113 – 41 113 – – –
Buildings 129 638 – 129 638 – – –
Aircraft 600 – 600 – – –
Transport and motor vehicles 89 915 (35 489) 54 426 – – –
Plant and equipment 764 732 (224 987) 539 745 – – –
Furniture, fittings, office and computer
equipment 40 174 (22 326) 17 848 1 499 (166) 1 333
Leasehold improvements 8 495 – 8 495 – – –
1 074 667 (282 802) 791 865 1 499 (166) 1 333
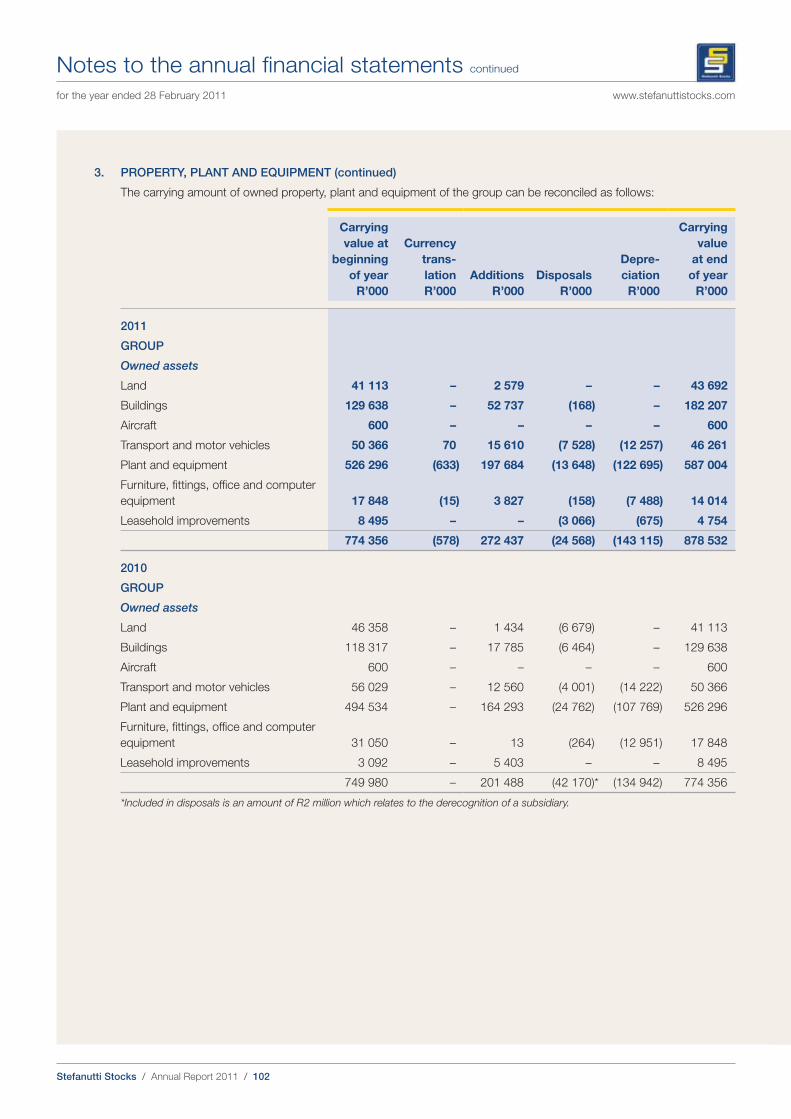
Stefanutti Stocks / Annual Report 2011 / 102
for the year ended 28 February 2011 www.stefanuttistocks.com
Notes to the annual financial statements continued
3. PROPERTY, PLANT AND EQUIPMENT (continued)
The carrying amount of owned property, plant and equipment of the group can be reconciled as follows:
Carrying
value at
beginning
of year
R’000
Currency
trans-
lation
R’000
Additions
R’000
Disposals
R’000
Depre-
ciation
R’000
Carrying
value
at end
of year
R’000
2011
GROUP
Owned assets
Land 41 113 – 2 579 – – 43 692
Buildings 129 638 – 52 737 (168) – 182 207
Aircraft 600 – – – – 600
Transport and motor vehicles 50 366 70 15 610 (7 528) (12 257) 46 261
Plant and equipment 526 296 (633) 197 684 (13 648) (122 695) 587 004
Furniture, fittings, office and computer
equipment 17 848 (15) 3 827 (158) (7 488) 14 014
Leasehold improvements 8 495 – – (3 066) (675) 4 754
774 356 (578) 272 437 (24 568) (143 115) 878 532
2010
GROUP
Owned assets
Land 46 358 – 1 434 (6 679) – 41 113
Buildings 118 317 – 17 785 (6 464) – 129 638
Aircraft 600 – – – – 600
Transport and motor vehicles 56 029 – 12 560 (4 001) (14 222) 50 366
Plant and equipment 494 534 – 164 293 (24 762) (107 769) 526 296
Furniture, fittings, office and computer
equipment 31 050 – 13 (264) (12 951) 17 848
Leasehold improvements 3 092 – 5 403 – – 8 495
749 980 – 201 488 (42 170)* (134 942) 774 356
*Included in disposals is an amount of R 2 million which relates to the derecognition of a subsidiary.
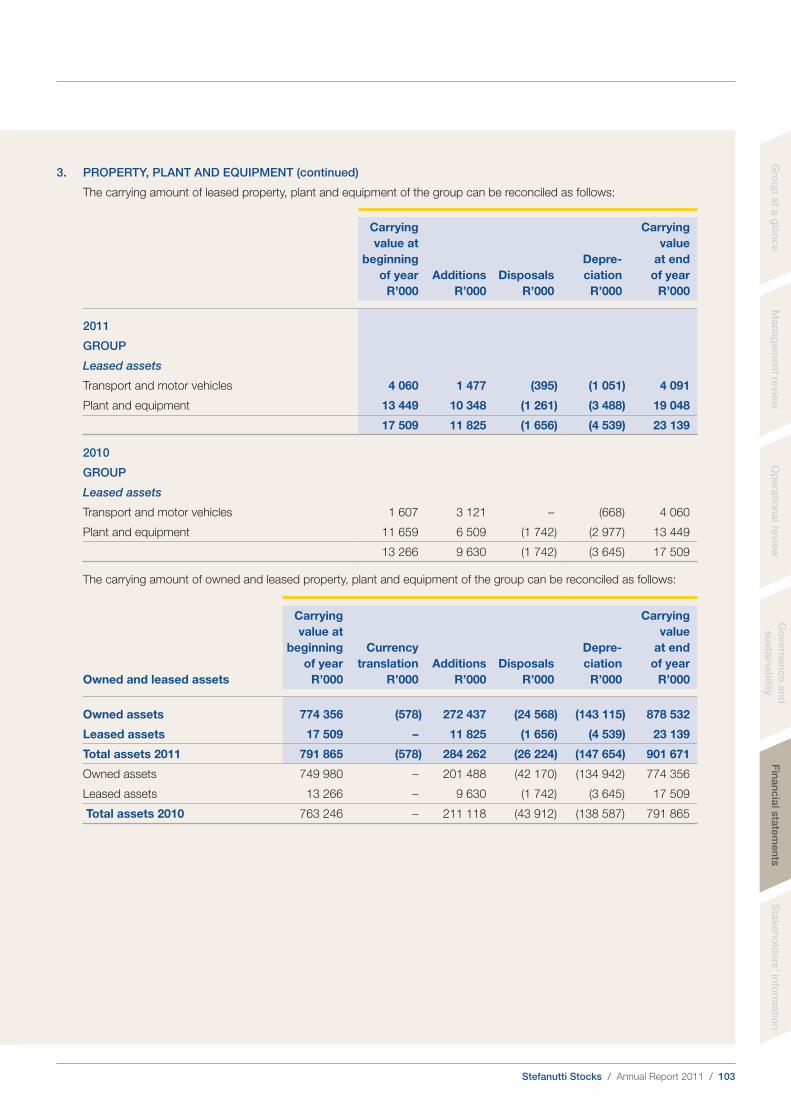
Stefanutti Stocks / Annual Report 2011 / 103
Gro
up
at a
gla
nce
Man
ag
em
en
t revie
wO
pera
tion
al re
vie
wG
overn
an
ce
an
d
su
sta
inab
ilityF
inan
cia
l sta
tem
en
tsS
takeh
old
ers
’ info
rmatio
n
3. PROPERTY, PLANT AND EQUIPMENT (continued)
The carrying amount of leased property, plant and equipment of the group can be reconciled as follows:
Carrying
value at
beginning
of year
R’000
Additions
R’000
Disposals
R’000
Depre-
ciation
R’000
Carrying
value
at end
of year
R’000
2011
GROUP
Leased assets
Transport and motor vehicles 4 060 1 477 (395) (1 051) 4 091
Plant and equipment 13 449 10 348 (1 261) (3 488) 19 048
17 509 11 825 (1 656) (4 539) 23 139
2010
GROUP
Leased assets
Transport and motor vehicles 1 607 3 121 – (668) 4 060
Plant and equipment 11 659 6 509 (1 742) (2 977) 13 449
13 266 9 630 (1 742) (3 645) 17 509
The carrying amount of owned and leased property, plant and equipment of the group can be reconciled as follows:
Owned and leased assets
Carrying
value at
beginning
of year
R’000
Currency
translation
R’000
Additions
R’000
Disposals
R’000
Depre-
ciation
R’000
Carrying
value
at end
of year
R’000
Owned assets 774 356 (578) 272 437 (24 568) (143 115) 878 532
Leased assets 17 509 – 11 825 (1 656) (4 539) 23 139
Total assets 2011 791 865 (578) 284 262 (26 224) (147 654) 901 671
Owned assets 749 980 – 201 488 (42 170) (134 942) 774 356
Leased assets 13 266 – 9 630 (1 742) (3 645) 17 509
Total assets 2010 763 246 – 211 118 (43 912) (138 587) 791 865
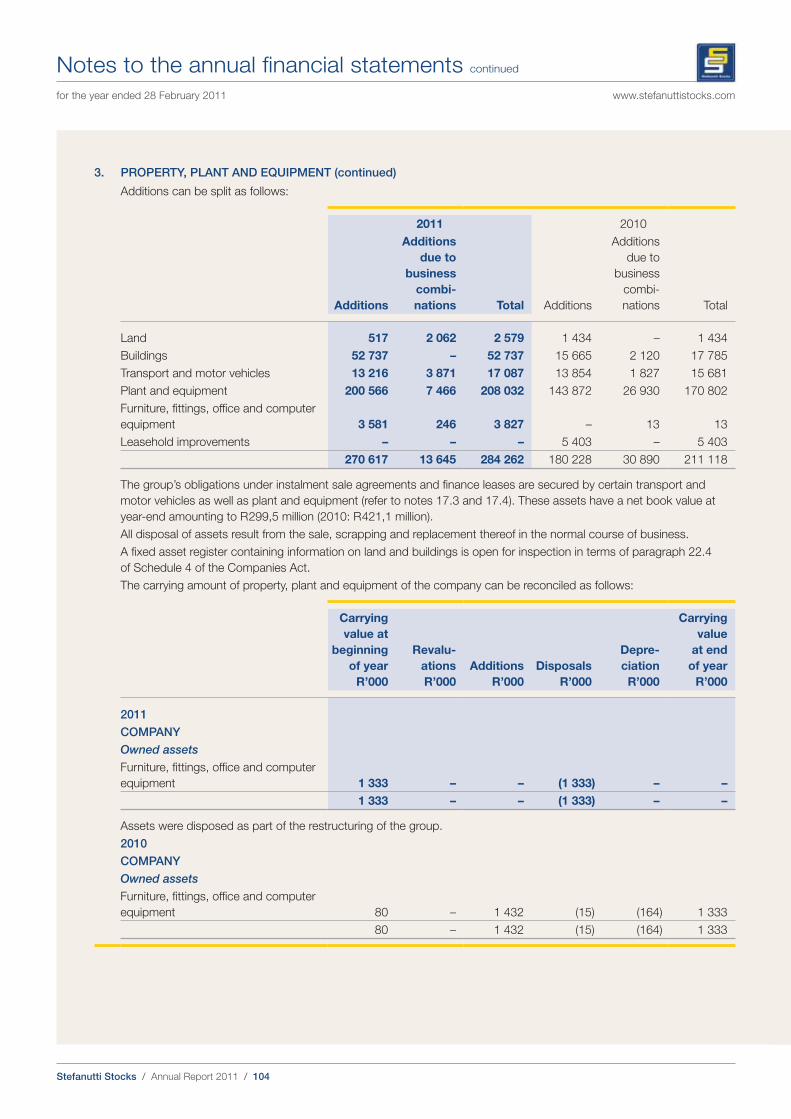
Stefanutti Stocks / Annual Report 2011 / 104
Notes to the annual financial statements continued
for the year ended 28 February 2011 www.stefanuttistocks.com
3. PROPERTY, PLANT AND EQUIPMENT (continued)
Additions can be split as follows:
2011 2010
Additions
Additions
due to
business
combi-
nations Total Additions
Additions
due to
business
combi-
nations Total
Land 517 2 062 2 579 1 434 – 1 434
Buildings 52 737 – 52 737 15 665 2 120 17 785
Transport and motor vehicles 13 216 3 871 17 087 13 854 1 827 15 681
Plant and equipment 200 566 7 466 208 032 143 872 26 930 170 802
Furniture, fittings, office and computer
equipment 3 581 246 3 827 – 13 13
Leasehold improvements – – – 5 403 – 5 403
270 617 13 645 284 262 180 228 30 890 211 118
The group’s obligations under instalment sale agreements and finance leases are secured by certain transport and
motor vehicles as well as plant and equipment (refer to notes 17.3 and 17.4). These assets have a net book value at
year-end amounting to R 299,5 million (2010: R 421,1 million).
All disposal of assets result from the sale, scrapping and replacement thereof in the normal course of business.
A fixed asset register containing information on land and buildings is open for inspection in terms of paragraph 22.4
of Schedule 4 of the Companies Act.
The carrying amount of property, plant and equipment of the company can be reconciled as follows:
Carrying
value at
beginning
of year
R’000
Revalu-
ations
R’000
Additions
R’000
Disposals
R’000
Depre-
ciation
R’000
Carrying
value
at end
of year
R’000
2011
COMPANY
Owned assets
Furniture, fittings, office and computer
equipment 1 333 – – (1 333) – –
1 333 – – (1 333) – –
Assets were disposed as part of the restructuring of the group.
2010
COMPANY
Owned assets
Furniture, fittings, office and computer
equipment 80 – 1 432 (15) (164) 1 333
80 – 1 432 (15) (164) 1 333

Stefanutti Stocks / Annual Report 2011 / 105
Gro
up
at a
gla
nce
Man
ag
em
en
t revie
wO
pera
tion
al re
vie
wG
overn
an
ce
an
d
su
sta
inab
ilityF
inan
cia
l sta
tem
en
tsS
takeh
old
ers
’ info
rmatio
n
Group Company
2011
R’000
2010
R’000
2011
R’000
2010
R’000
4. INVESTMENT PROPERTY
Carrying value at the beginning of the year 34 337 – – –
Additions at cost 21 085 34 337 – –
Carrying value at year-end 55 422 34 337 – –
Details of the property under construction are as follows:
PWC Office Park, Thabo Mbeki Drive, Lusaka, Zambia.
5. INVESTMENT IN SUBSIDIARIES
SubsidiariesProportion
held directly
Company
Cost
Name of company
Country of
incorporation
2011
%
2010
%
2011
R’000
2010
R’000
Stefanutti Stocks International Holdings (Pty) Limited South Africa 100 100 9 437 9 437
Stefanutti Stocks Building KZN (Pty) Limited South Africa 100 100 – 13 947
Stefanutti Stocks Civils KZN (Pty) Limited South Africa 100 100 83 700 83 700
Stefanutti Stocks Building Gauteng (Pty) Limited South Africa 100 100 – 2 780
Stefanutti Stocks Civils Gauteng (Pty) Limited South Africa 100 100 37 243 37 243
Stefanutti Stocks Earthworks (Pty) Limited South Africa 100 100 28 400 28 400
Stefanutti Stocks Geotechnical (Pty) Limited South Africa 100 100 – 9 158
Stefanutti Stocks Building W Cape (Pty) Limited South Africa 100 100 – 1 725
Pegasus Properties (Pty) Limited South Africa 70 70 * *
Environmental, Civil & Mining Projects (Pty) Limited South Africa 100 100 – 76 611
Stefanutti Stocks Material Handling (Pty) Limited South Africa 100 100 * *
Civil & Coastal Construction (Pty) Limited South Africa 100 100 65 233 79 753
Skelton & Plummer Investment Holding Company
(Pty) Limited South Africa 100 100 48 187 87 049
Stefanutti Stocks Protec Park (Pty) Limited South Africa 100 100 – *
Stefanutti Stocks Workshops (Pty) Limited South Africa 100 100 – *
Stefanutti Stocks Investments (Pty) Limited South Africa 100 100 * *
Stefanutti Stocks (Pty) Limited South Africa 100 100 1 087 574 1 087 574
Apollo E&I Construction (Pty) Limited South Africa 100 – 19 691 –
1 379 465 1 517 377
*Amount below R 1 000.
With effect from 1 March 2010, the South African business operations were restructured, in terms of which certain
operations previously held in subsidiary companies commenced operations as divisions of Stefanutti Stocks (Pty)
Limited.
As part of the restructuring process, a dividend in specie was declared from these subsidiary companies to the
holding company, resulting in a dividend received of R 157,6 million. The investments held in these subsidiaries were
then impaired due to the resulting zero net asset values of these companies. The impairment of R 157,6 million was
offset against the cost of the investments.
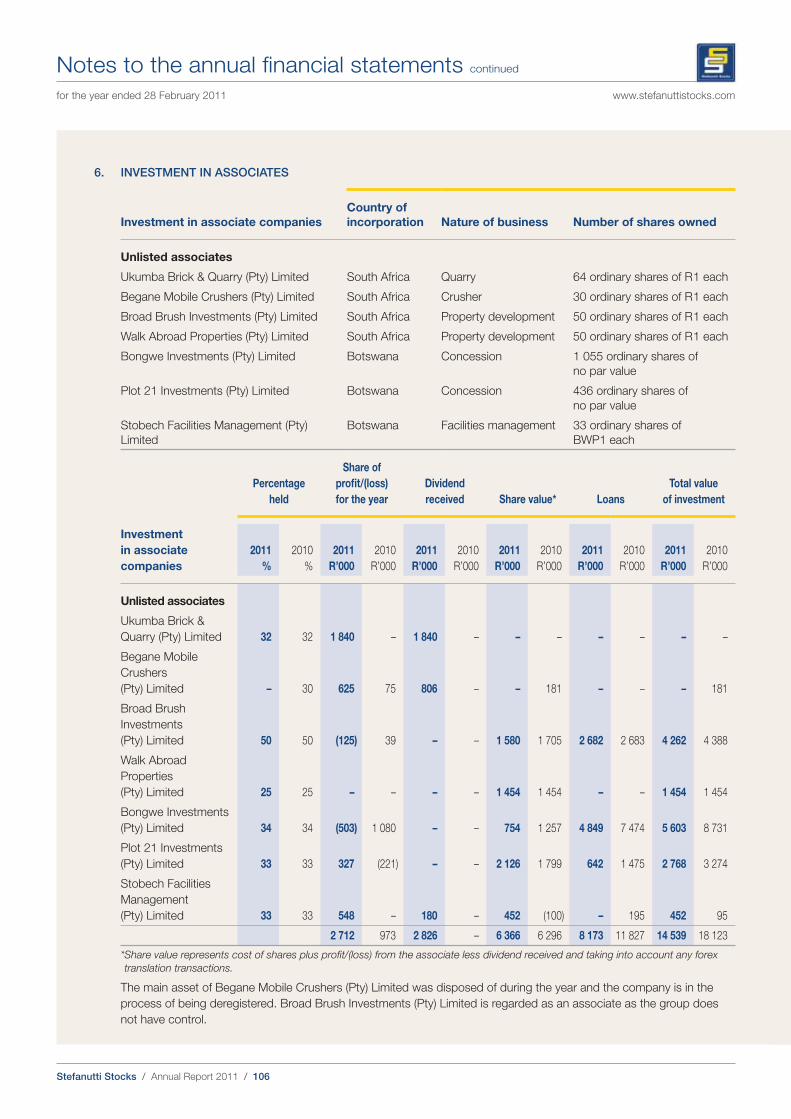
Stefanutti Stocks / Annual Report 2011 / 106
Notes to the annual financial statements continued
for the year ended 28 February 2011 www.stefanuttistocks.com
6. INVESTMENT IN ASSOCIATES
Investment in associate companies
Country of
incorporation Nature of business Number of shares owned
Unlisted associates
Ukumba Brick & Quarry (Pty) Limited South Africa Quarry 64 ordinary shares of R 1 each
Begane Mobile Crushers (Pty) Limited South Africa Crusher 30 ordinary shares of R 1 each
Broad Brush Investments (Pty) Limited South Africa Property development 50 ordinary shares of R 1 each
Walk Abroad Properties (Pty) Limited South Africa Property development 50 ordinary shares of R 1 each
Bongwe Investments (Pty) Limited Botswana Concession 1 055 ordinary shares of
no par value
Plot 21 Investments (Pty) Limited Botswana Concession 436 ordinary shares of
no par value
Stobech Facilities Management (Pty)
Limited
Botswana Facilities management 33 ordinary shares of
BWP1 each
Percentage
held
Share of
profit/(loss)
for the year
Dividend
received Share value* Loans
Total value
of investment
Investment
in associate
companies
2011
%
2010
%
2011
R’000
2010
R’000
2011
R’000
2010
R’000
2011
R’000
2010
R’000
2011
R’000
2010
R’000
2011
R’000
2010
R’000
Unlisted associates
Ukumba Brick &
Quarry (Pty) Limited 32 32 1 840 – 1 840 – – – – – – –
Begane Mobile
Crushers
(Pty) Limited – 30 625 75 806 – – 181 – – – 181
Broad Brush
Investments
(Pty) Limited 50 50 (125) 39 – – 1 580 1 705 2 682 2 683 4 262 4 388
Walk Abroad
Properties
(Pty) Limited 25 25 – – – – 1 454 1 454 – – 1 454 1 454
Bongwe Investments
(Pty) Limited 34 34 (503) 1 080 – – 754 1 257 4 849 7 474 5 603 8 731
Plot 21 Investments
(Pty) Limited 33 33 327 (221) – – 2 126 1 799 642 1 475 2 768 3 274
Stobech Facilities
Management
(Pty) Limited 33 33 548 – 180 – 452 (100) – 195 452 95
2 712 973 2 826 – 6 366 6 296 8 173 11 827 14 539 18 123
* Share value represents cost of shares plus profit/(loss) from the associate less dividend received and taking into account any forex
translation transactions.
The main asset of Begane Mobile Crushers (Pty) Limited was disposed of during the year and the company is in the
process of being deregistered. Broad Brush Investments (Pty) Limited is regarded as an associate as the group does
not have control.
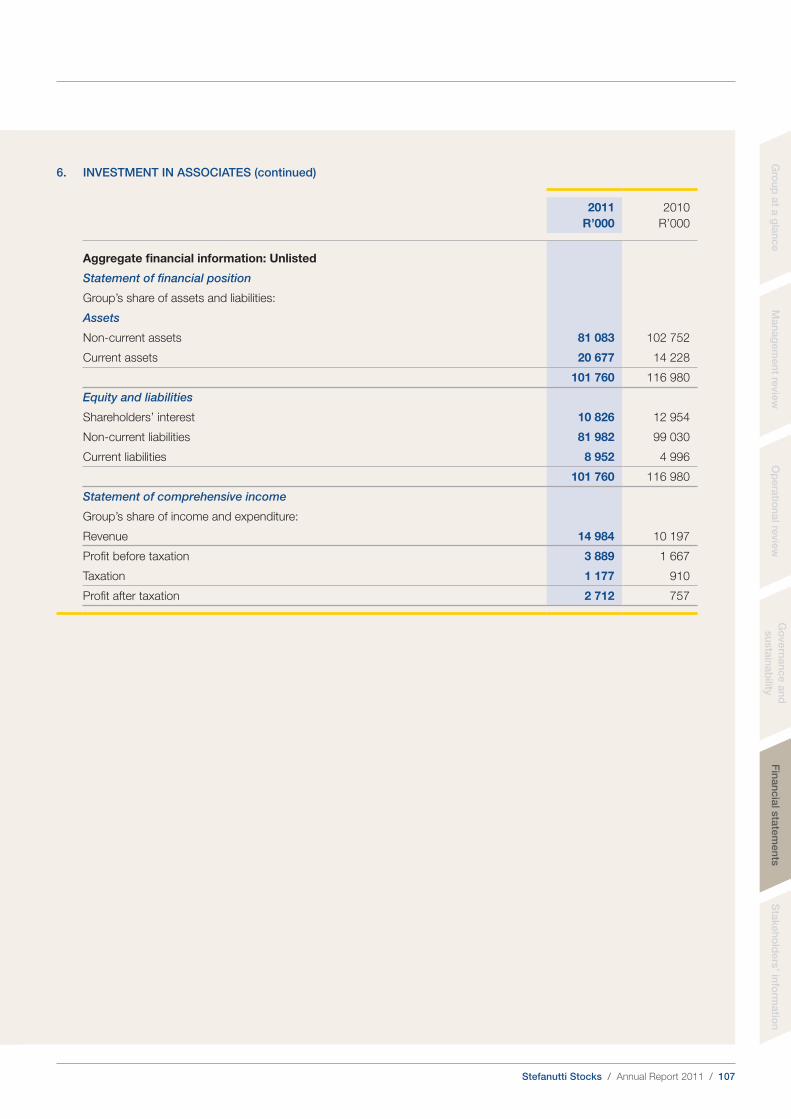
Stefanutti Stocks / Annual Report 2011 / 107
Gro
up
at a
gla
nce
Man
ag
em
en
t revie
wO
pera
tion
al re
vie
wG
overn
an
ce
an
d
su
sta
inab
ilityF
inan
cia
l sta
tem
en
tsS
takeh
old
ers
’ info
rmatio
n
6. INVESTMENT IN ASSOCIATES (continued)
2011
R’000
2010
R’000
Aggregate financial information: Unlisted
Statement of financial position
Group’s share of assets and liabilities:
Assets
Non-current assets 81 083 102 752
Current assets 20 677 14 228
101 760 116 980
Equity and liabilities
Shareholders’ interest 10 826 12 954
Non-current liabilities 81 982 99 030
Current liabilities 8 952 4 996
101 760 116 980
Statement of comprehensive income
Group’s share of income and expenditure:
Revenue 14 984 10 197
Profit before taxation 3 889 1 667
Taxation 1 177 910
Profit after taxation 2 712 757
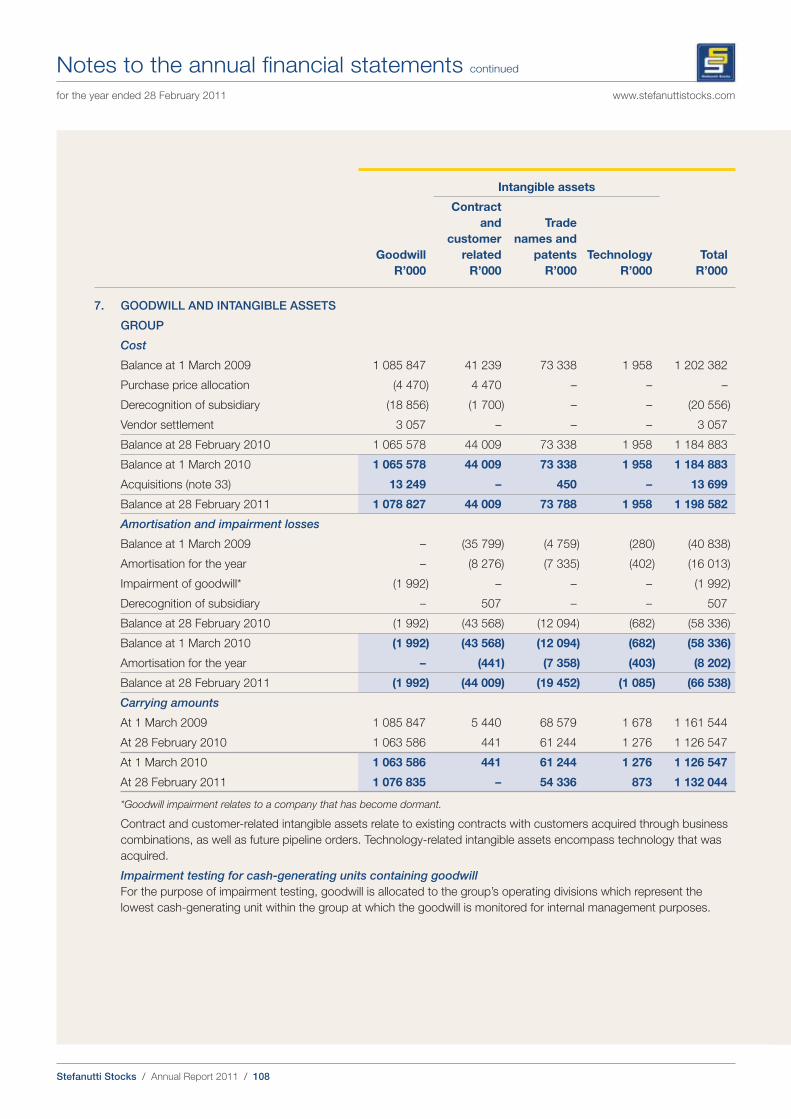
Stefanutti Stocks / Annual Report 2011 / 108
Notes to the annual financial statements continued
for the year ended 28 February 2011 www.stefanuttistocks.com
Intangible assets
Goodwill
R’000
Contract
and
customer
related
R’000
Trade
names and
patents
R’000
Technology
R’000
Total
R’000
7. GOODWILL AND INTANGIBLE ASSETS
GROUP
Cost
Balance at 1 March 2009 1 085 847 41 239 73 338 1 958 1 202 382
Purchase price allocation (4 470) 4 470 – – –
Derecognition of subsidiary (18 856) (1 700) – – (20 556)
Vendor settlement 3 057 – – – 3 057
Balance at 28 February 2010 1 065 578 44 009 73 338 1 958 1 184 883
Balance at 1 March 2010 1 065 578 44 009 73 338 1 958 1 184 883
Acquisitions (note 33) 13 249 – 450 – 13 699
Balance at 28 February 2011 1 078 827 44 009 73 788 1 958 1 198 582
Amortisation and impairment losses
Balance at 1 March 2009 – (35 799) (4 759) (280) (40 838)
Amortisation for the year – (8 276) (7 335) (402) (16 013)
Impairment of goodwill* (1 992) – – – (1 992)
Derecognition of subsidiary – 507 – – 507
Balance at 28 February 2010 (1 992) (43 568) (12 094) (682) (58 336)
Balance at 1 March 2010 (1 992) (43 568) (12 094) (682) (58 336)
Amortisation for the year – (441) (7 358) (403) (8 202)
Balance at 28 February 2011 (1 992) (44 009) (19 452) (1 085) (66 538)
Carrying amounts
At 1 March 2009 1 085 847 5 440 68 579 1 678 1 161 544
At 28 February 2010 1 063 586 441 61 244 1 276 1 126 547
At 1 March 2010 1 063 586 441 61 244 1 276 1 126 547
At 28 February 2011 1 076 835 – 54 336 873 1 132 044
*Goodwill impairment relates to a company that has become dormant.
Contract and customer-related intangible assets relate to existing contracts with customers acquired through business
combinations, as well as future pipeline orders. Technology-related intangible assets encompass technology that was
acquired.
Impairment testing for cash-generating units containing goodwill
For the purpose of impairment testing, goodwill is allocated to the group’s operating divisions which represent the
lowest cash-generating unit within the group at which the goodwill is monitored for internal management purposes.
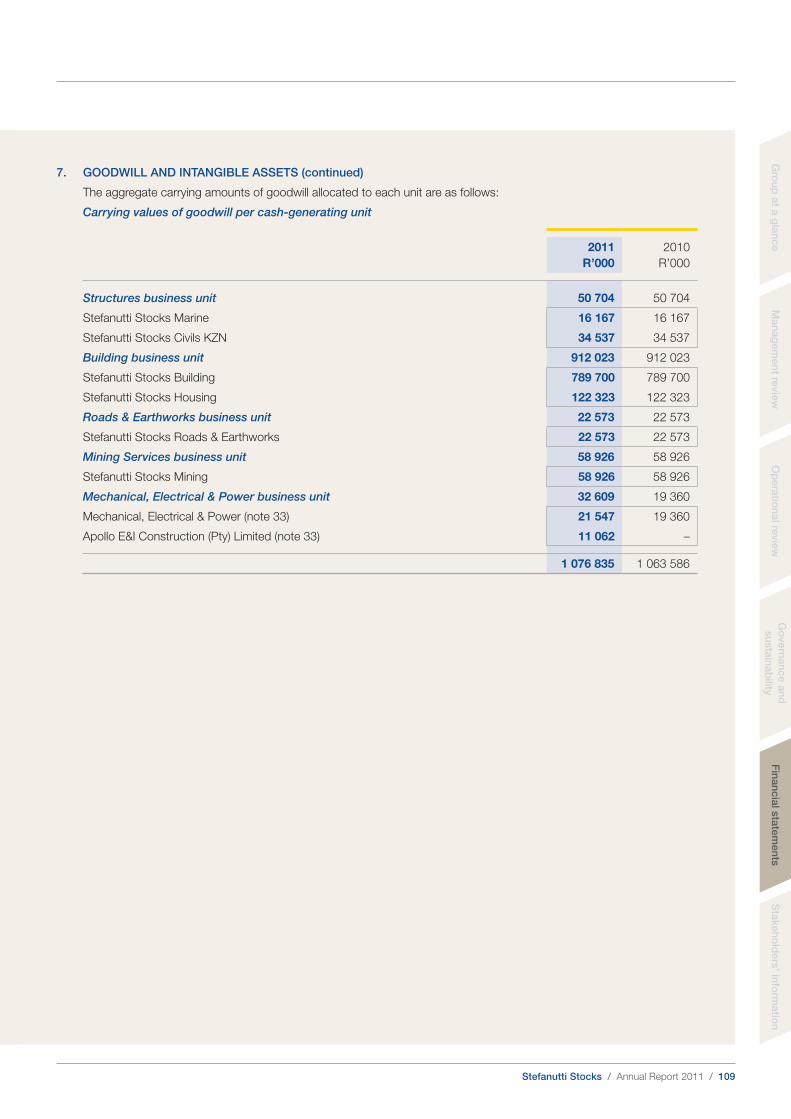
Stefanutti Stocks / Annual Report 2011 / 109
Gro
up
at a
gla
nce
Man
ag
em
en
t revie
wO
pera
tion
al re
vie
wG
overn
an
ce
an
d
su
sta
inab
ilityF
inan
cia
l sta
tem
en
tsS
takeh
old
ers
’ info
rmatio
n
7. GOODWILL AND INTANGIBLE ASSETS (continued)
The aggregate carrying amounts of goodwill allocated to each unit are as follows:
Carrying values of goodwill per cash-generating unit
2011
R’000
2010
R’000
Structures business unit 50 704 50 704
Stefanutti Stocks Marine 16 167 16 167
Stefanutti Stocks Civils KZN 34 537 34 537
Building business unit 912 023 912 023
Stefanutti Stocks Building 789 700 789 700
Stefanutti Stocks Housing 122 323 122 323
Roads & Earthworks business unit 22 573 22 573
Stefanutti Stocks Roads & Earthworks 22 573 22 573
Mining Services business unit 58 926 58 926
Stefanutti Stocks Mining 58 926 58 926
Mechanical, Electrical & Power business unit 32 609 19 360
Mechanical, Electrical & Power (note 33) 21 547 19 360
Apollo E&I Construction (Pty) Limited (note 33) 11 062 –
1 076 835 1 063 586

Stefanutti Stocks / Annual Report 2011 / 110
Notes to the annual financial statements continued
for the year ended 28 February 2011 www.stefanuttistocks.com
7. GOODWILL AND INTANGIBLE ASSETS (continued)
The recoverable amount of each unit mentioned above was based on its value in use. The recoverable amount of
the unit was determined to be higher than its carrying amount and no impairment loss was recognised for any cash-
generating unit in the current year.
The value in use of the different business units was determined by discounting the future cash flow generated from the
continuing use of the unit and was based on the following key assumptions:
Constant growth rate
in % (a)
Average anticipated annual
revenue growth in % (b) WACC
2011 2010 2011 2010 2011 2010
Structures business unit
Stefanutti Stocks Marine 3 3 23,2 16,6 11,8 13,1
Stefanutti Stocks Civils KZN 3 3 19,6 7,6 12,6 13,9
Building business unit
Stefanutti Stocks Building 3 3 18,3 16,8 12,1 13,7
Stefanutti Stocks Housing 3 3 18,3 34,2 12,7 14,1
Roads & Earthworks
business unit
Stefanutti Stocks Roads &
Earthworks 3 3 17,5 22,1 11,6 13,5
Mining Services
business unit
Stefanutti Stocks Mining
Services 3 8 12,2 34,9 10,2 13,3
Mechanical, Electrical &
Power business unit
Mechanical, Electrical
& Power 3 3 39,4 39,2 11,8 14,3
Apollo E&I Construction
(Pty) Limited 3 – 28,6 – 12,6 –
Cash flows were projected based on actual operating results and four-year forecasts. Cash flows beyond this were
extrapolated using a constant growth rate of (a) percent, which does not exceed the long-term average growth rate for
the industry.
Revenue forecasts were used as the basis for determining the value assigned to each cash-generating unit. The
anticipated annual revenue growth included in the cash flow projections was an average of (b) percent for the years
2012 to 2015.
The values assigned to the key assumptions represent management’s assessment of the businesses and are based on
both external sources and internal sources.
A sensitivity analysis has been performed adjusting both the growth rate and WACC by 1%. This analysis did not result
in any material impact on the valuation of goodwill.
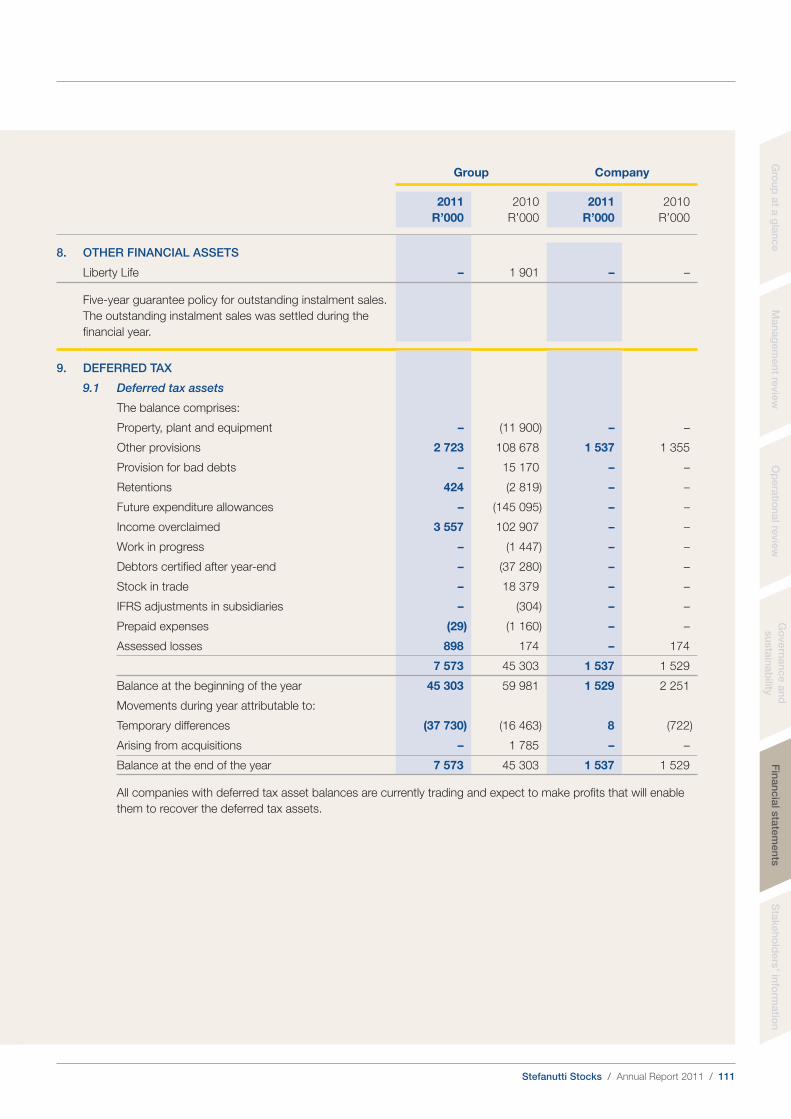
Stefanutti Stocks / Annual Report 2011 / 111
Gro
up
at a
gla
nce
Man
ag
em
en
t revie
wO
pera
tion
al re
vie
wG
overn
an
ce
an
d
su
sta
inab
ilityF
inan
cia
l sta
tem
en
tsS
takeh
old
ers
’ info
rmatio
n
Group Company
2011
R’000
2010
R’000
2011
R’000
2010
R’000
8. OTHER FINANCIAL ASSETS
Liberty Life – 1 901 – –
Five-year guarantee policy for outstanding instalment sales.
The outstanding instalment sales was settled during the
financial year.
9. DEFERRED TAX
9.1 Deferred tax assets
The balance comprises:
Property, plant and equipment – (11 900) – –
Other provisions 2 723 108 678 1 537 1 355
Provision for bad debts – 15 170 – –
Retentions 424 (2 819) – –
Future expenditure allowances – (145 095) – –
Income overclaimed 3 557 102 907 – –
Work in progress – (1 447) – –
Debtors certified after year-end – (37 280) – –
Stock in trade – 18 379 – –
IFRS adjustments in subsidiaries – (304) – –
Prepaid expenses (29) (1 160) – –
Assessed losses 898 174 – 174
7 573 45 303 1 537 1 529
Balance at the beginning of the year 45 303 59 981 1 529 2 251
Movements during year attributable to:
Temporary differences (37 730) (16 463) 8 (722)
Arising from acquisitions – 1 785 – –
Balance at the end of the year 7 573 45 303 1 537 1 529
All companies with deferred tax asset balances are currently trading and expect to make profits that will enable
them to recover the deferred tax assets.
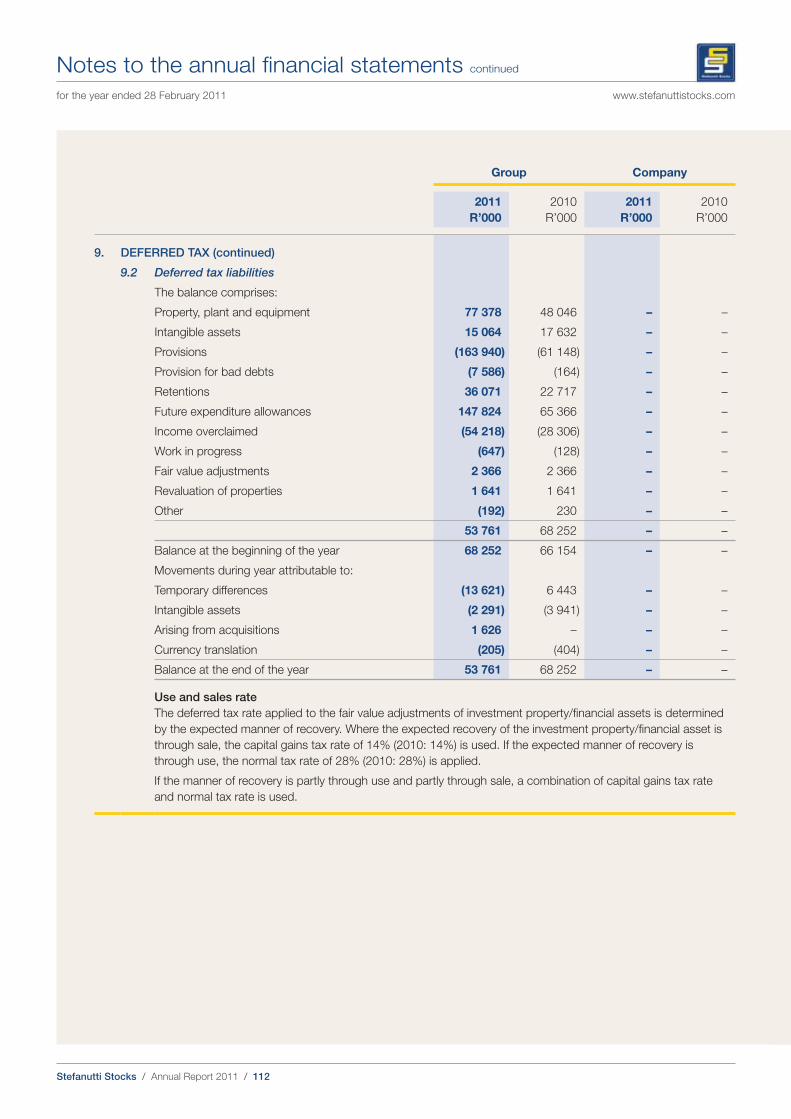
Stefanutti Stocks / Annual Report 2011 / 112
Notes to the annual financial statements continued
for the year ended 28 February 2011 www.stefanuttistocks.com
Group Company
2011
R’000
2010
R’000
2011
R’000
2010
R’000
9. DEFERRED TAX (continued)
9.2 Deferred tax liabilities
The balance comprises:
Property, plant and equipment 77 378 48 046 – –
Intangible assets 15 064 17 632 – –
Provisions (163 940) (61 148) – –
Provision for bad debts (7 586) (164) – –
Retentions 36 071 22 717 – –
Future expenditure allowances 147 824 65 366 – –
Income overclaimed (54 218) (28 306) – –
Work in progress (647) (128) – –
Fair value adjustments 2 366 2 366 – –
Revaluation of properties 1 641 1 641 – –
Other (192) 230 – –
53 761 68 252 – –
Balance at the beginning of the year 68 252 66 154 – –
Movements during year attributable to:
Temporary differences (13 621) 6 443 – –
Intangible assets (2 291) (3 941) – –
Arising from acquisitions 1 626 – – –
Currency translation (205) (404) – –
Balance at the end of the year 53 761 68 252 – –
Use and sales rate
The deferred tax rate applied to the fair value adjustments of investment property/financial assets is determined
by the expected manner of recovery. Where the expected recovery of the investment property/financial asset is
through sale, the capital gains tax rate of 14% (2010: 14%) is used. If the expected manner of recovery is
through use, the normal tax rate of 28% (2010: 28%) is applied.
If the manner of recovery is partly through use and partly through sale, a combination of capital gains tax rate
and normal tax rate is used.
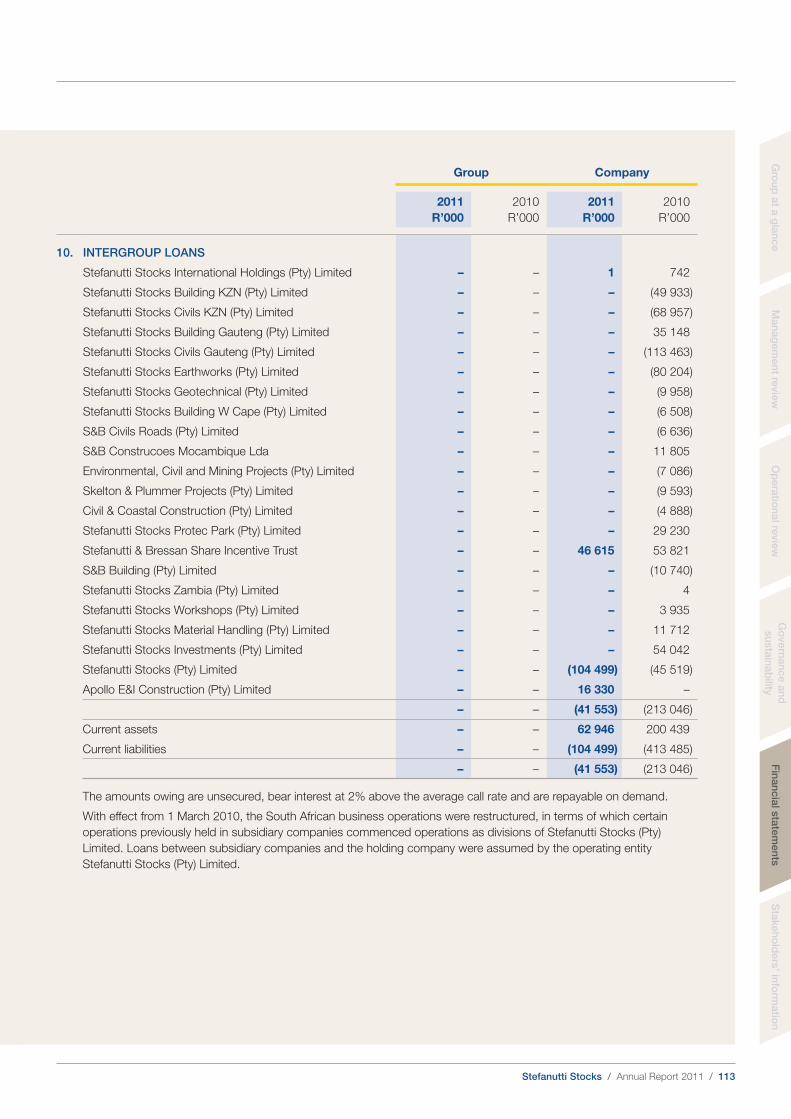
Stefanutti Stocks / Annual Report 2011 / 113
Gro
up
at a
gla
nce
Man
ag
em
en
t revie
wO
pera
tion
al re
vie
wG
overn
an
ce
an
d
su
sta
inab
ilityF
inan
cia
l sta
tem
en
tsS
takeh
old
ers
’ info
rmatio
n
Group Company
2011
R’000
2010
R’000
2011
R’000
2010
R’000
10. INTERGROUP LOANS
Stefanutti Stocks International Holdings (Pty) Limited – – 1 742
Stefanutti Stocks Building KZN (Pty) Limited – – – (49 933)
Stefanutti Stocks Civils KZN (Pty) Limited – – – (68 957)
Stefanutti Stocks Building Gauteng (Pty) Limited – – – 35 148
Stefanutti Stocks Civils Gauteng (Pty) Limited – – – (113 463)
Stefanutti Stocks Earthworks (Pty) Limited – – – (80 204)
Stefanutti Stocks Geotechnical (Pty) Limited – – – (9 958)
Stefanutti Stocks Building W Cape (Pty) Limited – – – (6 508)
S&B Civils Roads (Pty) Limited – – – (6 636)
S&B Construcoes Mocambique Lda – – – 11 805
Environmental, Civil and Mining Projects (Pty) Limited – – – (7 086)
Skelton & Plummer Projects (Pty) Limited – – – (9 593)
Civil & Coastal Construction (Pty) Limited – – – (4 888)
Stefanutti Stocks Protec Park (Pty) Limited – – – 29 230
Stefanutti & Bressan Share Incentive Trust – – 46 615 53 821
S&B Building (Pty) Limited – – – (10 740)
Stefanutti Stocks Zambia (Pty) Limited – – – 4
Stefanutti Stocks Workshops (Pty) Limited – – – 3 935
Stefanutti Stocks Material Handling (Pty) Limited – – – 11 712
Stefanutti Stocks Investments (Pty) Limited – – – 54 042
Stefanutti Stocks (Pty) Limited – – (104 499) (45 519)
Apollo E&I Construction (Pty) Limited – – 16 330 –
– – (41 553) (213 046)
Current assets – – 62 946 200 439
Current liabilities – – (104 499) (413 485)
– – (41 553) (213 046)
The amounts owing are unsecured, bear interest at 2% above the average call rate and are repayable on demand.
With effect from 1 March 2010, the South African business operations were restructured, in terms of which certain
operations previously held in subsidiary companies commenced operations as divisions of Stefanutti Stocks (Pty)
Limited. Loans between subsidiary companies and the holding company were assumed by the operating entity
Stefanutti Stocks (Pty) Limited.
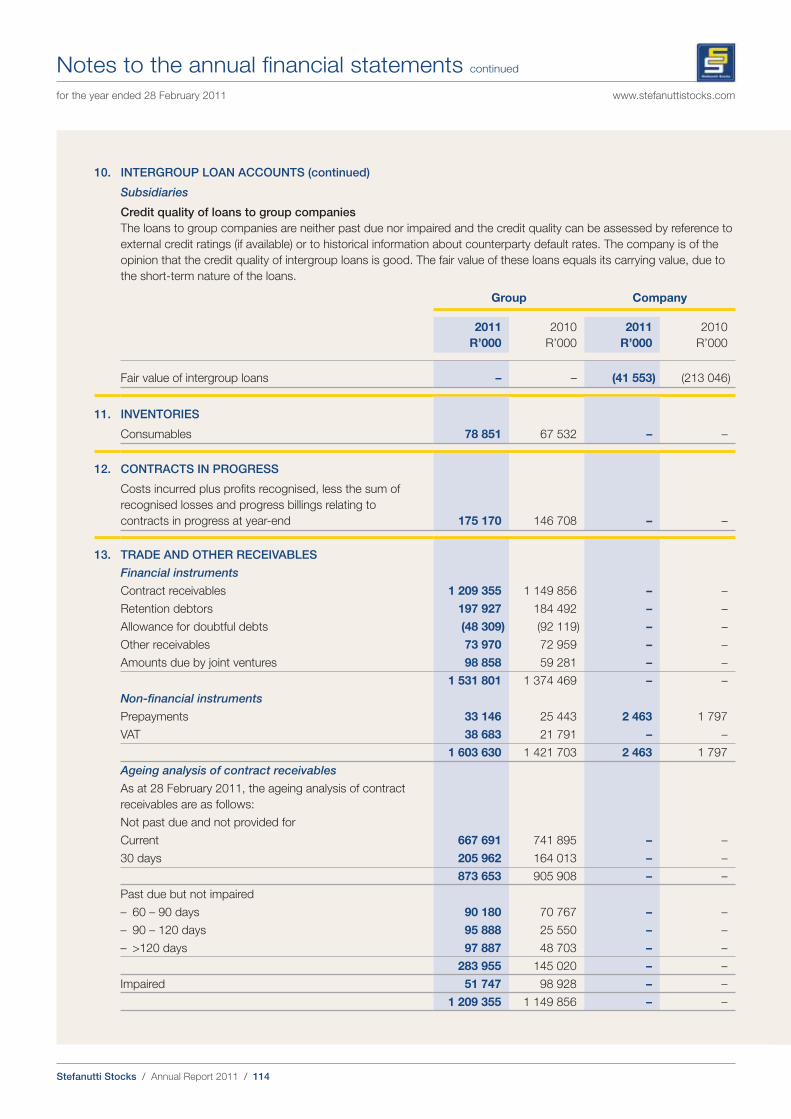
Stefanutti Stocks / Annual Report 2011 / 114
Notes to the annual financial statements continued
for the year ended 28 February 2011 www.stefanuttistocks.com
10. INTERGROUP LOAN ACCOUNTS (continued)
Subsidiaries
Credit quality of loans to group companies
The loans to group companies are neither past due nor impaired and the credit quality can be assessed by reference to
external credit ratings (if available) or to historical information about counterparty default rates. The company is of the
opinion that the credit quality of intergroup loans is good. The fair value of these loans equals its carrying value, due to
the short-term nature of the loans.
Group Company
2011
R’000
2010
R’000
2011
R’000
2010
R’000
Fair value of intergroup loans – – (41 553) (213 046)
11. INVENTORIES
Consumables 78 851 67 532 – –
12. CONTRACTS IN PROGRESS
Costs incurred plus profits recognised, less the sum of
recognised losses and progress billings relating to
contracts in progress at year-end 175 170 146 708 – –
13. TRADE AND OTHER RECEIVABLES
Financial instruments
Contract receivables 1 209 355 1 149 856 – –
Retention debtors 197 927 184 492 – –
Allowance for doubtful debts (48 309) (92 119) – –
Other receivables 73 970 72 959 – –
Amounts due by joint ventures 98 858 59 281 – –
1 531 801 1 374 469 – –
Non-financial instruments
Prepayments 33 146 25 443 2 463 1 797
VAT 38 683 21 791 – –
1 603 630 1 421 703 2 463 1 797
Ageing analysis of contract receivables
As at 28 February 2011, the ageing analysis of contract
receivables are as follows:
Not past due and not provided for
Current 667 691 741 895 – –
30 days 205 962 164 013 – –
873 653 905 908 – –
Past due but not impaired
– 60 – 90 days 90 180 70 767 – –
– 90 – 120 days 95 888 25 550 – –
– >120 days 97 887 48 703 – –
283 955 145 020 – –
Impaired 51 747 98 928 – –
1 209 355 1 149 856 – –
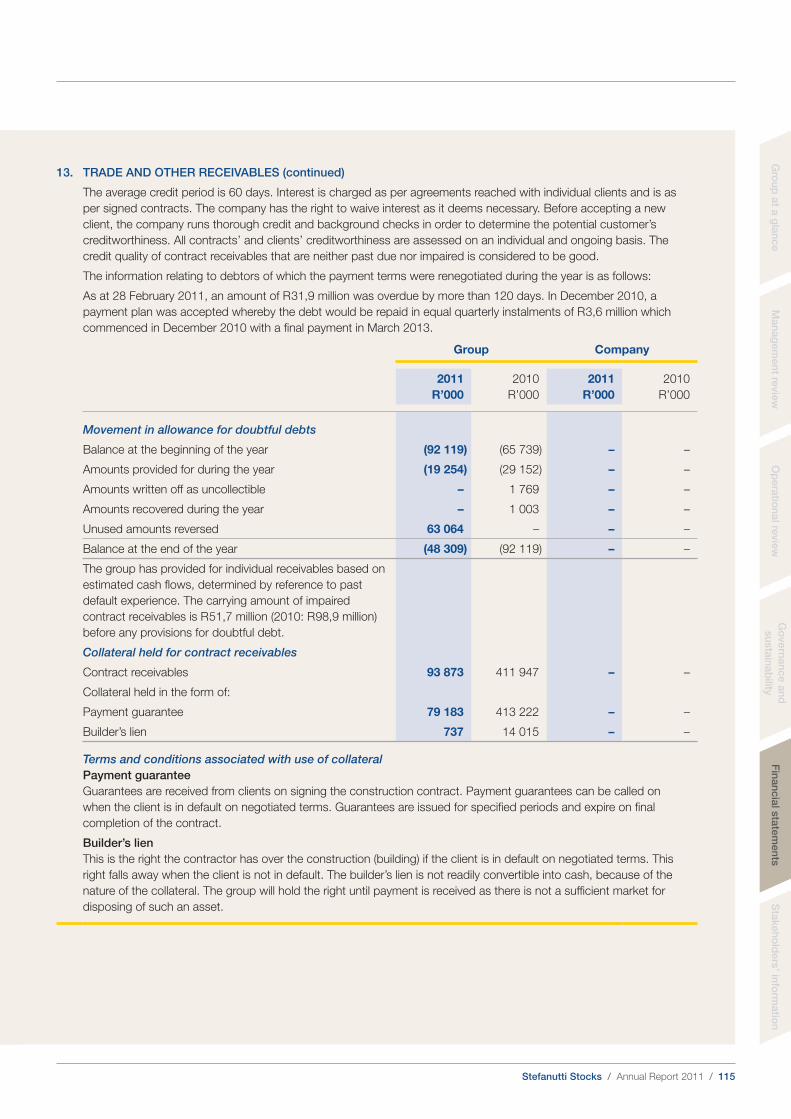
Stefanutti Stocks / Annual Report 2011 / 115
Gro
up
at a
gla
nce
Man
ag
em
en
t revie
wO
pera
tion
al re
vie
wG
overn
an
ce
an
d
su
sta
inab
ilityF
inan
cia
l sta
tem
en
tsS
takeh
old
ers
’ info
rmatio
n
13. TRADE AND OTHER RECEIVABLES (continued)
The average credit period is 60 days. Interest is charged as per agreements reached with individual clients and is as
per signed contracts. The company has the right to waive interest as it deems necessary. Before accepting a new
client, the company runs thorough credit and background checks in order to determine the potential customer’s
creditworthiness. All contracts’ and clients’ creditworthiness are assessed on an individual and ongoing basis. The
credit quality of contract receivables that are neither past due nor impaired is considered to be good.
The information relating to debtors of which the payment terms were renegotiated during the year is as follows:
As at 28 February 2011, an amount of R 31,9 million was overdue by more than 120 days. In December 2010, a
payment plan was accepted whereby the debt would be repaid in equal quarterly instalments of R 3,6 million which
commenced in December 2010 with a final payment in March 2013.
Group Company
2011
R’000
2010
R’000
2011
R’000
2010
R’000
Movement in allowance for doubtful debts
Balance at the beginning of the year (92 119) (65 739) – –
Amounts provided for during the year (19 254) (29 152) – –
Amounts written off as uncollectible – 1 769 – –
Amounts recovered during the year – 1 003 – –
Unused amounts reversed 63 064 – – –
Balance at the end of the year (48 309) (92 119) – –
The group has provided for individual receivables based on
estimated cash flows, determined by reference to past
default experience. The carrying amount of impaired
contract receivables is R 51,7 million (2010: R 98,9 million)
before any provisions for doubtful debt.
Collateral held for contract receivables
Contract receivables 93 873 411 947 – –
Collateral held in the form of:
Payment guarantee 79 183 413 222 – –
Builder’s lien 737 14 015 – –
Terms and conditions associated with use of collateral
Payment guarantee
Guarantees are received from clients on signing the construction contract. Payment guarantees can be called on
when the client is in default on negotiated terms. Guarantees are issued for specified periods and expire on final
completion of the contract.
Builder’s lien
This is the right the contractor has over the construction (building) if the client is in default on negotiated terms. This
right falls away when the client is not in default. The builder’s lien is not readily convertible into cash, because of the
nature of the collateral. The group will hold the right until payment is received as there is not a sufficient market for
disposing of such an asset.
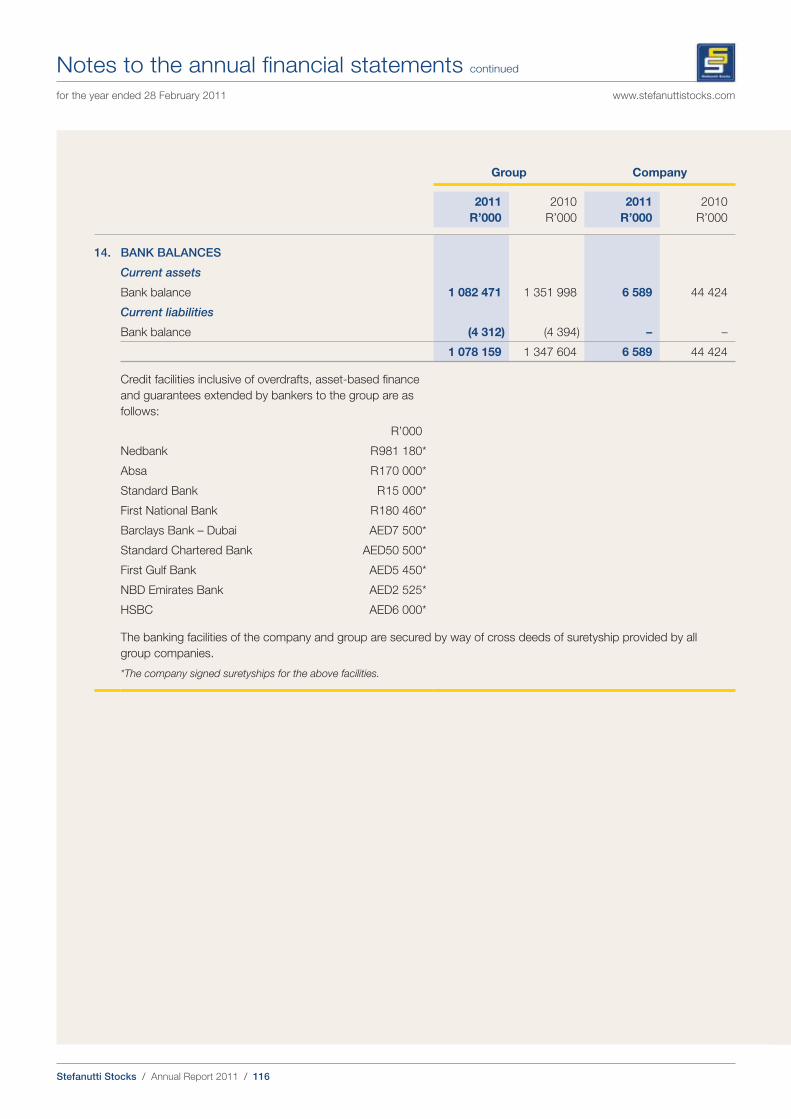
Stefanutti Stocks / Annual Report 2011 / 116
Notes to the annual financial statements continued
for the year ended 28 February 2011 www.stefanuttistocks.com
Group Company
2011
R’000
2010
R’000
2011
R’000
2010
R’000
14. BANK BALANCES
Current assets
Bank balance 1 082 471 1 351 998 6 589 44 424
Current liabilities
Bank balance (4 312) (4 394) – –
1 078 159 1 347 604 6 589 44 424
Credit facilities inclusive of overdrafts, asset-based finance
and guarantees extended by bankers to the group are as
follows:
R’000
Nedbank R 981 180*
Absa R 170 000*
Standard Bank R 15 000*
First National Bank R 180 460*
Barclays Bank – Dubai AED7 500*
Standard Chartered Bank AED50 500*
First Gulf Bank AED5 450*
NBD Emirates Bank AED2 525*
HSBC AED6 000*
The banking facilities of the company and group are secured by way of cross deeds of suretyship provided by all
group companies.
*The company signed suretyships for the above facilities.
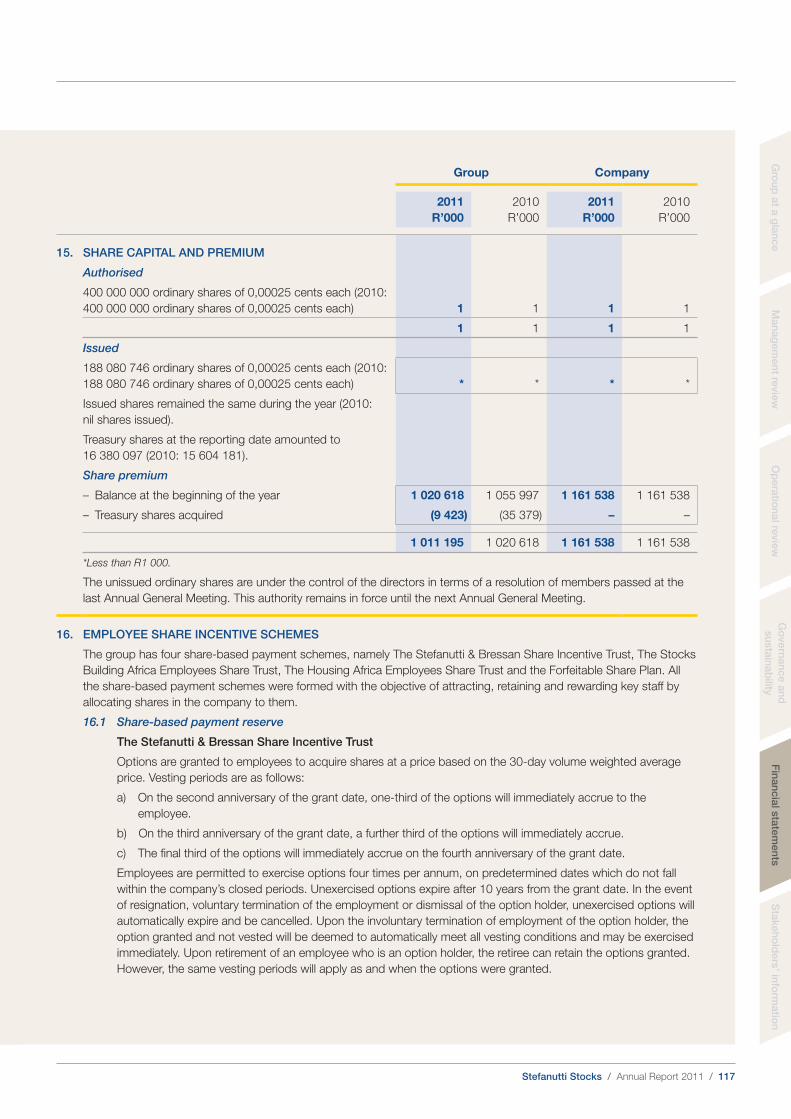
Stefanutti Stocks / Annual Report 2011 / 117
Gro
up
at a
gla
nce
Man
ag
em
en
t revie
wO
pera
tion
al re
vie
wG
overn
an
ce
an
d
su
sta
inab
ilityF
inan
cia
l sta
tem
en
tsS
takeh
old
ers
’ info
rmatio
n
Group Company
2011
R’000
2010
R’000
2011
R’000
2010
R’000
15. SHARE CAPITAL AND PREMIUM
Authorised
400 000 000 ordinary shares of 0,00025 cents each (2010:
400 000 000 ordinary shares of 0,00025 cents each) 1 1 1 1
1 1 1 1
Issued
188 080 746 ordinary shares of 0,00025 cents each (2010:
188 080 746 ordinary shares of 0,00025 cents each) * * * *
Issued shares remained the same during the year (2010:
nil shares issued).
Treasury shares at the reporting date amounted to
16 380 097 (2010: 15 604 181).
Share premium
– Balance at the beginning of the year 1 020 618 1 055 997 1 161 538 1 161 538
– Treasury shares acquired (9 423) (35 379) – –
1 011 195 1 020 618 1 161 538 1 161 538
*Less than R 1 000.
The unissued ordinary shares are under the control of the directors in terms of a resolution of members passed at the
last Annual General Meeting. This authority remains in force until the next Annual General Meeting.
16. EMPLOYEE SHARE INCENTIVE SCHEMES
The group has four share-based payment schemes, namely The Stefanutti & Bressan Share Incentive Trust, The Stocks
Building Africa Employees Share Trust, The Housing Africa Employees Share Trust and the Forfeitable Share Plan. All
the share-based payment schemes were formed with the objective of attracting, retaining and rewarding key staff by
allocating shares in the company to them.
16.1 Share-based payment reserve
The Stefanutti & Bressan Share Incentive Trust
Options are granted to employees to acquire shares at a price based on the 30-day volume weighted average
price. Vesting periods are as follows:
a) On the second anniversary of the grant date, one-third of the options will immediately accrue to the
employee.
b) On the third anniversary of the grant date, a further third of the options will immediately accrue.
c) The final third of the options will immediately accrue on the fourth anniversary of the grant date.
Employees are permitted to exercise options four times per annum, on predetermined dates which do not fall
within the company’s closed periods. Unexercised options expire after 10 years from the grant date. In the event
of resignation, voluntary termination of the employment or dismissal of the option holder, unexercised options will
automatically expire and be cancelled. Upon the involuntary termination of employment of the option holder, the
option granted and not vested will be deemed to automatically meet all vesting conditions and may be exercised
immediately. Upon retirement of an employee who is an option holder, the retiree can retain the options granted.
However, the same vesting periods will apply as and when the options were granted.
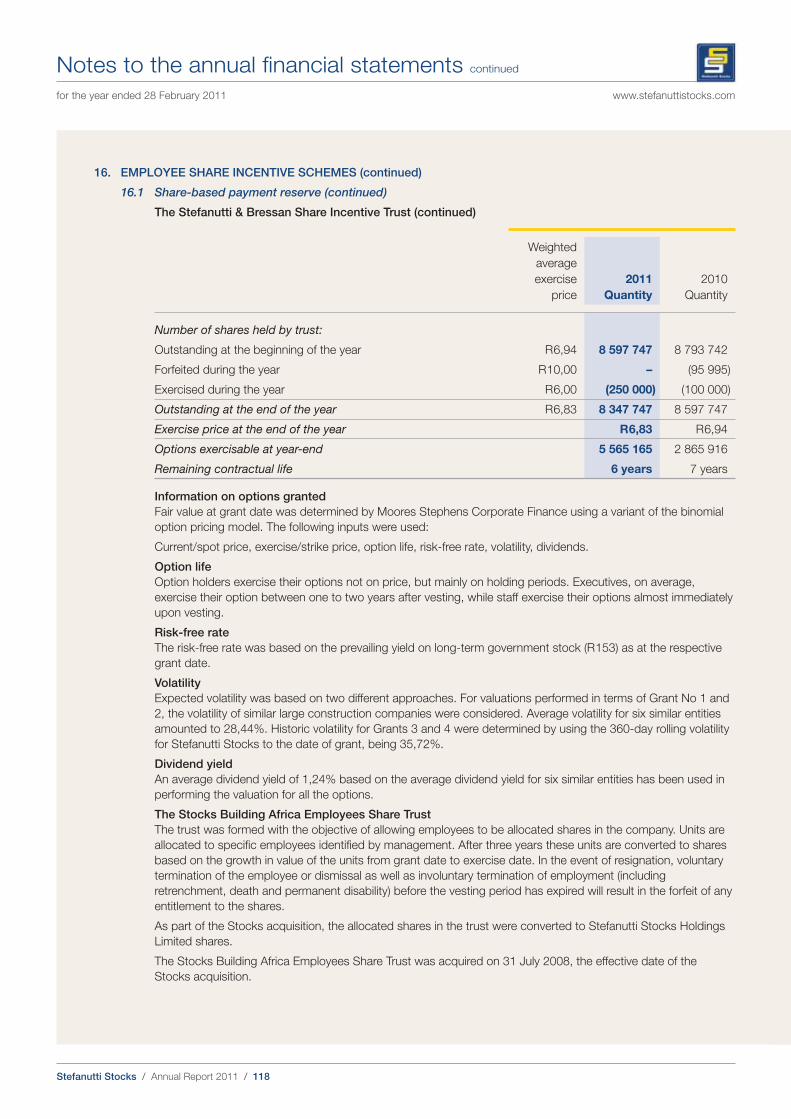
Stefanutti Stocks / Annual Report 2011 / 118
Notes to the annual financial statements continued
for the year ended 28 February 2011 www.stefanuttistocks.com
16. EMPLOYEE SHARE INCENTIVE SCHEMES (continued)
16.1 Share-based payment reserve (continued)
The Stefanutti & Bressan Share Incentive Trust (continued)
Weighted
average
exercise
price
2011
Quantity
2010
Quantity
Number of shares held by trust:
Outstanding at the beginning of the year R 6,94 8 597 747 8 793 742
Forfeited during the year R 10,00 – (95 995)
Exercised during the year R 6,00 (250 000) (100 000)
Outstanding at the end of the year R 6,83 8 347 747 8 597 747
Exercise price at the end of the year R 6,83 R 6,94
Options exercisable at year-end 5 565 165 2 865 916
Remaining contractual life 6 years 7 years
Information on options granted
Fair value at grant date was determined by Moores Stephens Corporate Finance using a variant of the binomial
option pricing model. The following inputs were used:
Current/spot price, exercise/strike price, option life, risk-free rate, volatility, dividends.
Option life
Option holders exercise their options not on price, but mainly on holding periods. Executives, on average,
exercise their option between one to two years after vesting, while staff exercise their options almost immediately
upon vesting.
Risk-free rate
The risk-free rate was based on the prevailing yield on long-term government stock (R 153) as at the respective
grant date.
Volatility
Expected volatility was based on two different approaches. For valuations performed in terms of Grant No 1 and
2, the volatility of similar large construction companies were considered. Average volatility for six similar entities
amounted to 28,44%. Historic volatility for Grants 3 and 4 were determined by using the 360-day rolling volatility
for Stefanutti Stocks to the date of grant, being 35,72%.
Dividend yield
An average dividend yield of 1,24% based on the average dividend yield for six similar entities has been used in
performing the valuation for all the options.
The Stocks Building Africa Employees Share Trust
The trust was formed with the objective of allowing employees to be allocated shares in the company. Units are
allocated to specific employees identified by management. After three years these units are converted to shares
based on the growth in value of the units from grant date to exercise date. In the event of resignation, voluntary
termination of the employee or dismissal as well as involuntary termination of employment (including
retrenchment, death and permanent disability) before the vesting period has expired will result in the forfeit of any
entitlement to the shares.
As part of the Stocks acquisition, the allocated shares in the trust were converted to Stefanutti Stocks Holdings
Limited shares.
The Stocks Building Africa Employees Share Trust was acquired on 31 July 2008, the effective date of the
Stocks acquisition.
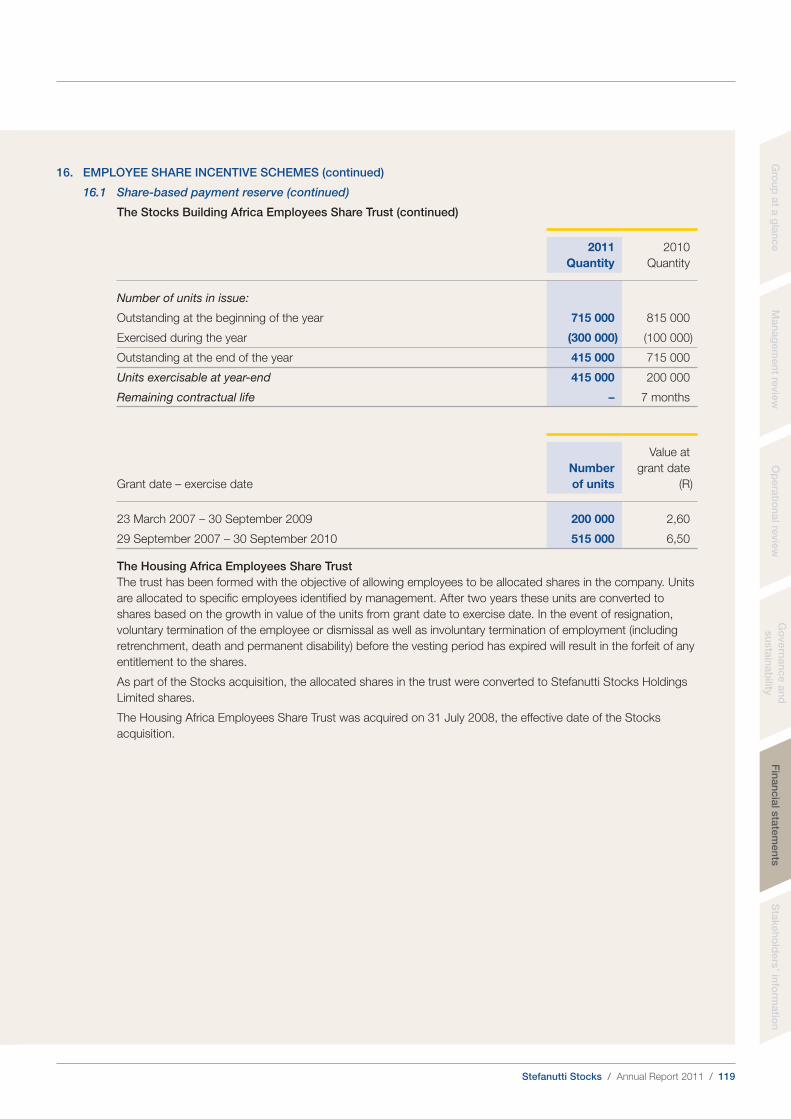
Stefanutti Stocks / Annual Report 2011 / 119
Gro
up
at a
gla
nce
Man
ag
em
en
t revie
wO
pera
tion
al re
vie
wG
overn
an
ce
an
d
su
sta
inab
ilityF
inan
cia
l sta
tem
en
tsS
takeh
old
ers
’ info
rmatio
n
16. EMPLOYEE SHARE INCENTIVE SCHEMES (continued)
16.1 Share-based payment reserve (continued)
The Stocks Building Africa Employees Share Trust (continued)
2011
Quantity
2010
Quantity
Number of units in issue:
Outstanding at the beginning of the year 715 000 815 000
Exercised during the year (300 000) (100 000)
Outstanding at the end of the year 415 000 715 000
Units exercisable at year-end 415 000 200 000
Remaining contractual life – 7 months
Grant date – exercise date
Number
of units
Value at
grant date
(R)
23 March 2007 – 30 September 2009 200 000 2,60
29 September 2007 – 30 September 2010 515 000 6,50
The Housing Africa Employees Share Trust
The trust has been formed with the objective of allowing employees to be allocated shares in the company. Units
are allocated to specific employees identified by management. After two years these units are converted to
shares based on the growth in value of the units from grant date to exercise date. In the event of resignation,
voluntary termination of the employee or dismissal as well as involuntary termination of employment (including
retrenchment, death and permanent disability) before the vesting period has expired will result in the forfeit of any
entitlement to the shares.
As part of the Stocks acquisition, the allocated shares in the trust were converted to Stefanutti Stocks Holdings
Limited shares.
The Housing Africa Employees Share Trust was acquired on 31 July 2008, the effective date of the Stocks
acquisition.
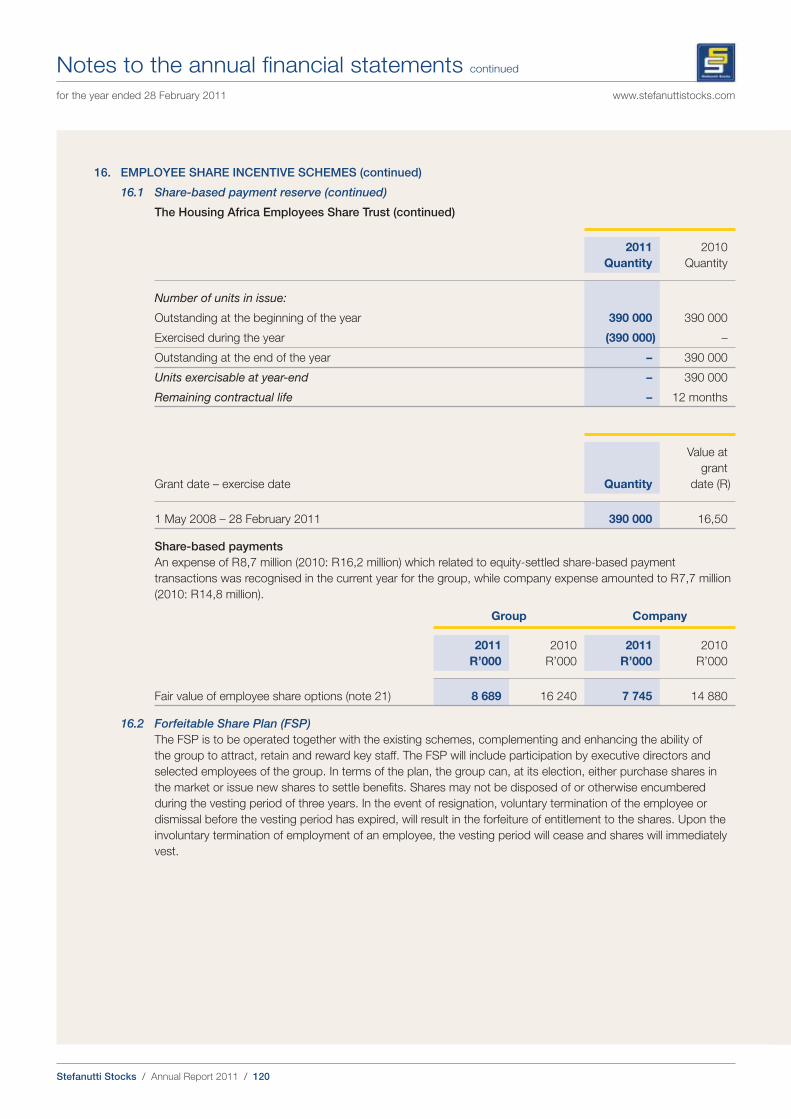
Stefanutti Stocks / Annual Report 2011 / 120
Notes to the annual financial statements continued
for the year ended 28 February 2011 www.stefanuttistocks.com
16. EMPLOYEE SHARE INCENTIVE SCHEMES (continued)
16.1 Share-based payment reserve (continued)
The Housing Africa Employees Share Trust (continued)
2011
Quantity
2010
Quantity
Number of units in issue:
Outstanding at the beginning of the year 390 000 390 000
Exercised during the year (390 000) –
Outstanding at the end of the year – 390 000
Units exercisable at year-end – 390 000
Remaining contractual life – 12 months
Grant date – exercise date Quantity
Value at
grant
date (R)
1 May 2008 – 28 February 2011 390 000 16,50
Share-based payments
An expense of R 8,7 million (2010: R 16,2 million) which related to equity-settled share-based payment
transactions was recognised in the current year for the group, while company expense amounted to R 7,7 million
(2010: R 14,8 million).
Group Company
2011
R’000
2010
R’000
2011
R’000
2010
R’000
Fair value of employee share options (note 21) 8 689 16 240 7 745 14 880
16.2 Forfeitable Share Plan (FSP)
The FSP is to be operated together with the existing schemes, complementing and enhancing the ability of
the group to attract, retain and reward key staff. The FSP will include participation by executive directors and
selected employees of the group. In terms of the plan, the group can, at its election, either purchase shares in
the market or issue new shares to settle benefits. Shares may not be disposed of or otherwise encumbered
during the vesting period of three years. In the event of resignation, voluntary termination of the employee or
dismissal before the vesting period has expired, will result in the forfeiture of entitlement to the shares. Upon the
involuntary termination of employment of an employee, the vesting period will cease and shares will immediately
vest.

Stefanutti Stocks / Annual Report 2011 / 121
Gro
up
at a
gla
nce
Man
ag
em
en
t revie
wO
pera
tion
al re
vie
wG
overn
an
ce
an
d
su
sta
inab
ilityF
inan
cia
l sta
tem
en
tsS
takeh
old
ers
’ info
rmatio
n
16. EMPLOYEE SHARE INCENTIVE SCHEMES (continued)
16.2 Forfeitable Share Plan (FSP) (continued)
Number of shares:
2011
Quantity
2010
Quantity
Outstanding at the beginning of the year 1 490 763 –
Awarded during the year 1 735 633 1 490 763
Forfeited during the year (164 047) –
Outstanding at the end of the year 3 062 349 1 490 763
Grant price R 11,62 R 10,37
Fair value at grant date (R’000) 20 164 15 459
Forfeitable Share Plan costs
An expense of R 11,2 million (2010: R 1,9 million) which related to Forfeitable Share Plan costs was recognised
in the current year.
Group Company
2011
R’000
2010
R’000
2011
R’000
2010
R’000
Fair value of Forfeitable Share Plan costs (note 21) 11 154 1 935 944 160
17. OTHER FINANCIAL LIABILITIES
17.1 Long-term loans – Interest-bearing
Nedbank 14 907 7 848 – –
Less: Current portion (1 070) (997) – –
Loan is secured and bears interest at 10% (2010:
12,25%). The loan is repayable in monthly
instalments of R 197 000 (2010: R 165 818).
Secured by a mortgage bond on Erf 2470 in the
township of Terenure Extension 42, Kempton Park,
Gauteng.
Nedbank 6 494 – – –
Less: Current portion (1 630) – – –
Loan is secured and bears interest at 8% (2010:
12,25%). The loan is repayable in monthly
instalments of R 157 000.
Secured by a mortgage bond on Erf 2470 in the
township of Terenure Extension 42, Kempton Park,
Gauteng.
Nedbank 5 718 5 750 – –
Less: Current portion (5 718) – – –
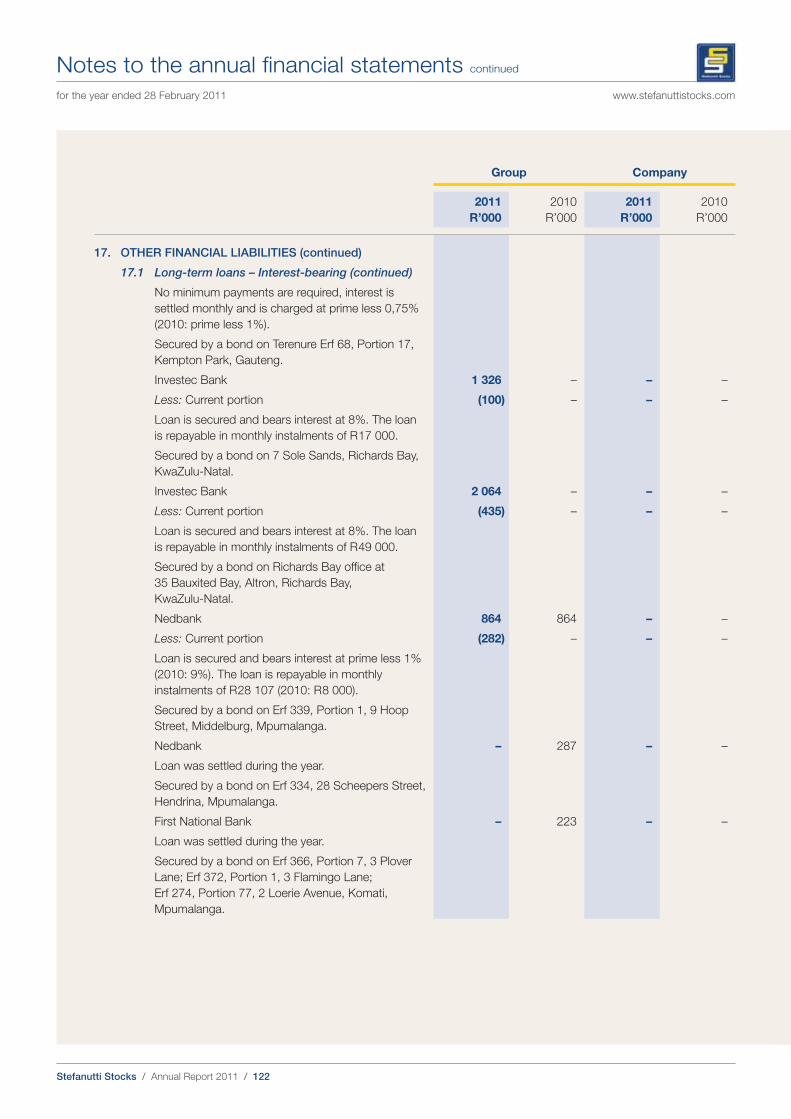
Stefanutti Stocks / Annual Report 2011 / 122
Notes to the annual financial statements continued
for the year ended 28 February 2011 www.stefanuttistocks.com
Group Company
2011
R’000
2010
R’000
2011
R’000
2010
R’000
17. OTHER FINANCIAL LIABILITIES (continued)
17.1 Long-term loans – Interest-bearing (continued)
No minimum payments are required, interest is
settled monthly and is charged at prime less 0,75%
(2010: prime less 1%).
Secured by a bond on Terenure Erf 68, Portion 17,
Kempton Park, Gauteng.
Investec Bank 1 326 – – –
Less: Current portion (100) – – –
Loan is secured and bears interest at 8%. The loan
is repayable in monthly instalments of R 17 000.
Secured by a bond on 7 Sole Sands, Richards Bay,
KwaZulu-Natal.
Investec Bank 2 064 – – –
Less: Current portion (435) – – –
Loan is secured and bears interest at 8%. The loan
is repayable in monthly instalments of R 49 000.
Secured by a bond on Richards Bay office at
35 Bauxited Bay, Altron, Richards Bay,
KwaZulu-Natal.
Nedbank 864 864 – –
Less: Current portion (282) – – –
Loan is secured and bears interest at prime less 1%
(2010: 9%). The loan is repayable in monthly
instalments of R 28 107 (2010: R 8 000).
Secured by a bond on Erf 339, Portion 1, 9 Hoop
Street, Middelburg, Mpumalanga.
Nedbank – 287 – –
Loan was settled during the year.
Secured by a bond on Erf 334, 28 Scheepers Street,
Hendrina, Mpumalanga.
First National Bank – 223 – –
Loan was settled during the year.
Secured by a bond on Erf 366, Portion 7, 3 Plover
Lane; Erf 372, Portion 1, 3 Flamingo Lane;
Erf 274, Portion 77, 2 Loerie Avenue, Komati,
Mpumalanga.
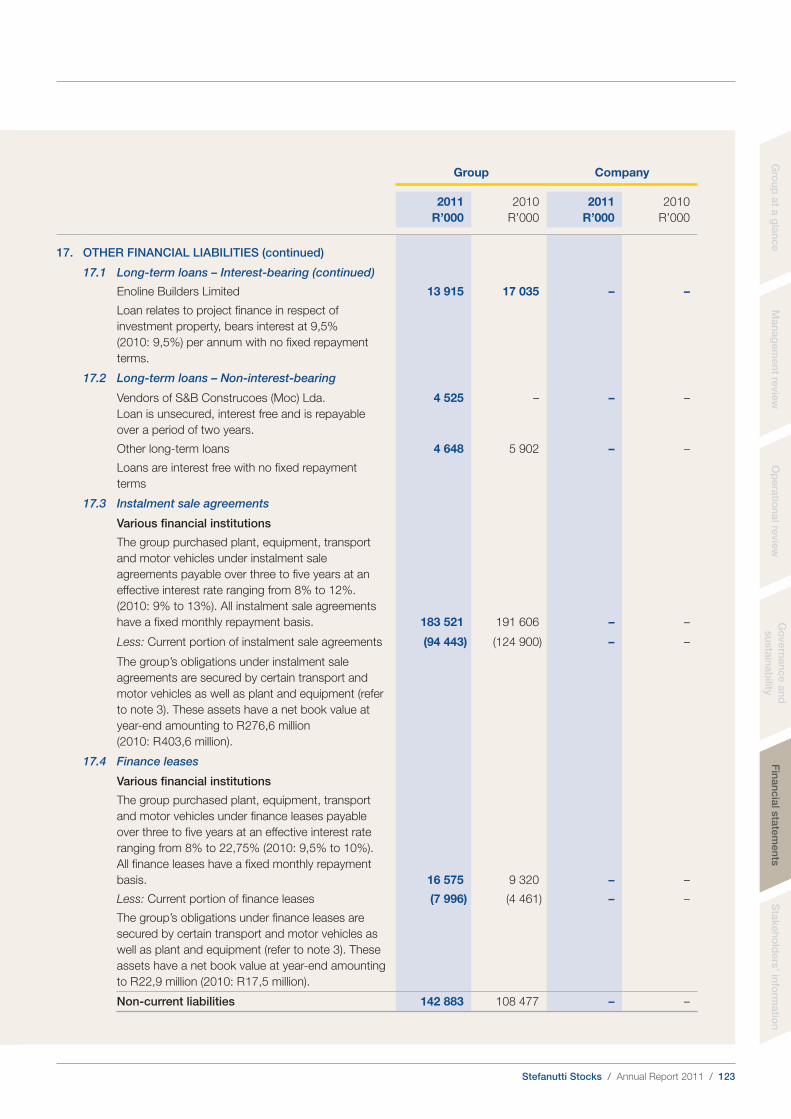
Stefanutti Stocks / Annual Report 2011 / 123
Gro
up
at a
gla
nce
Man
ag
em
en
t revie
wO
pera
tion
al re
vie
wG
overn
an
ce
an
d
su
sta
inab
ilityF
inan
cia
l sta
tem
en
tsS
takeh
old
ers
’ info
rmatio
n
Group Company
2011
R’000
2010
R’000
2011
R’000
2010
R’000
17. OTHER FINANCIAL LIABILITIES (continued)
17.1 Long-term loans – Interest-bearing (continued)
Enoline Builders Limited 13 915 17 035 – –
Loan relates to project finance in respect of
investment property, bears interest at 9,5%
(2010: 9,5%) per annum with no fixed repayment
terms.
17.2 Long-term loans – Non-interest-bearing
Vendors of S&B Construcoes (Moc) Lda.
Loan is unsecured, interest free and is repayable
over a period of two years.
4 525 – – –
Other long-term loans 4 648 5 902 – –
Loans are interest free with no fixed repayment
terms
17.3 Instalment sale agreements
Various financial institutions
The group purchased plant, equipment, transport
and motor vehicles under instalment sale
agreements payable over three to five years at an
effective interest rate ranging from 8% to 12%.
(2010: 9% to 13%). All instalment sale agreements
have a fixed monthly repayment basis. 183 521 191 606 – –
Less: Current portion of instalment sale agreements (94 443) (124 900) – –
The group’s obligations under instalment sale
agreements are secured by certain transport and
motor vehicles as well as plant and equipment (refer
to note 3). These assets have a net book value at
year-end amounting to R 276,6 million
(2010: R 403,6 million).
17.4 Finance leases
Various financial institutions
The group purchased plant, equipment, transport
and motor vehicles under finance leases payable
over three to five years at an effective interest rate
ranging from 8% to 22,75% (2010: 9,5% to 10%).
All finance leases have a fixed monthly repayment
basis. 16 575 9 320 – –
Less: Current portion of finance leases (7 996) (4 461) – –
The group’s obligations under finance leases are
secured by certain transport and motor vehicles as
well as plant and equipment (refer to note 3). These
assets have a net book value at year-end amounting
to R 22,9 million (2010: R 17,5 million).
Non-current liabilities 142 883 108 477 – –
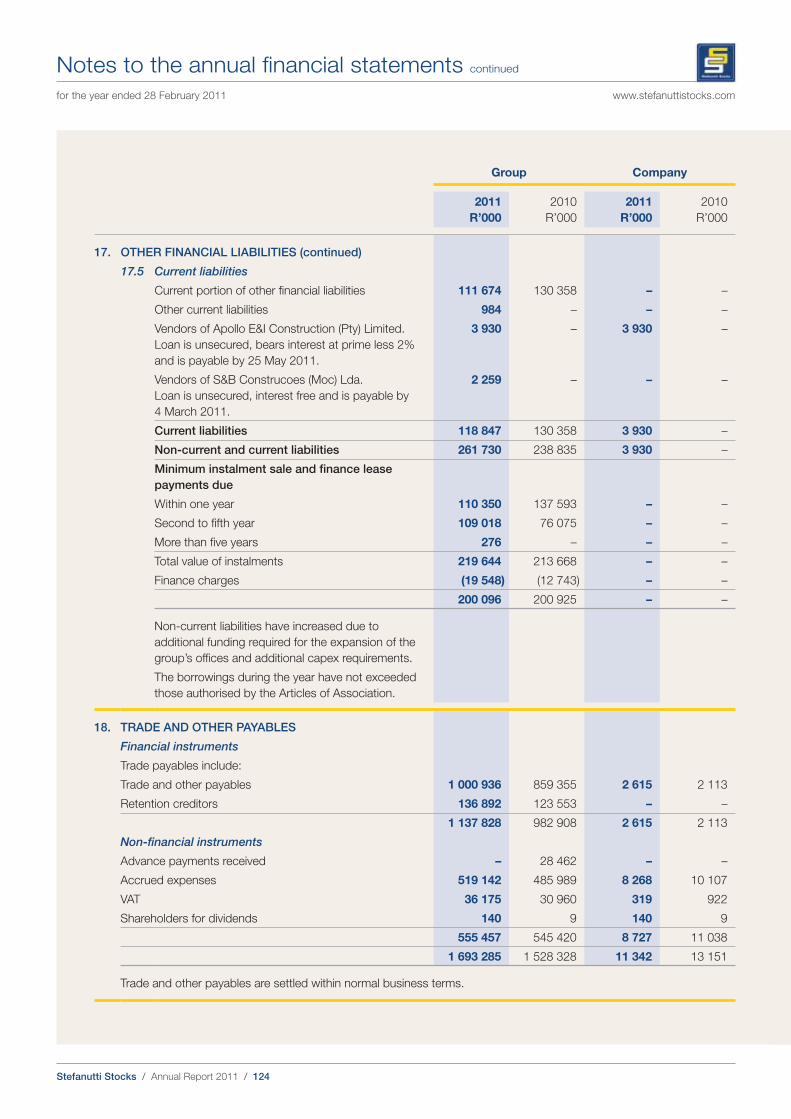
Stefanutti Stocks / Annual Report 2011 / 124
Notes to the annual financial statements continued
for the year ended 28 February 2011 www.stefanuttistocks.com
Group Company
2011
R’000
2010
R’000
2011
R’000
2010
R’000
17. OTHER FINANCIAL LIABILITIES (continued)
17.5 Current liabilities
Current portion of other financial liabilities 111 674 130 358 – –
Other current liabilities 984 – – –
Vendors of Apollo E&I Construction (Pty) Limited.
Loan is unsecured, bears interest at prime less 2%
and is payable by 25 May 2011.
3 930 – 3 930 –
Vendors of S&B Construcoes (Moc) Lda.
Loan is unsecured, interest free and is payable by
4 March 2011.
2 259 – – –
Current liabilities 118 847 130 358 3 930 –
Non-current and current liabilities 261 730 238 835 3 930 –
Minimum instalment sale and finance lease
payments due
Within one year 110 350 137 593 – –
Second to fifth year 109 018 76 075 – –
More than five years 276 – – –
Total value of instalments 219 644 213 668 – –
Finance charges (19 548) (12 743) – –
200 096 200 925 – –
Non-current liabilities have increased due to
additional funding required for the expansion of the
group’s offices and additional capex requirements.
The borrowings during the year have not exceeded
those authorised by the Articles of Association.
18. TRADE AND OTHER PAYABLES
Financial instruments
Trade payables include:
Trade and other payables 1 000 936 859 355 2 615 2 113
Retention creditors 136 892 123 553 – –
1 137 828 982 908 2 615 2 113
Non-financial instruments
Advance payments received – 28 462 – –
Accrued expenses 519 142 485 989 8 268 10 107
VAT 36 175 30 960 319 922
Shareholders for dividends 140 9 140 9
555 457 545 420 8 727 11 038
1 693 285 1 528 328 11 342 13 151
Trade and other payables are settled within normal business terms.
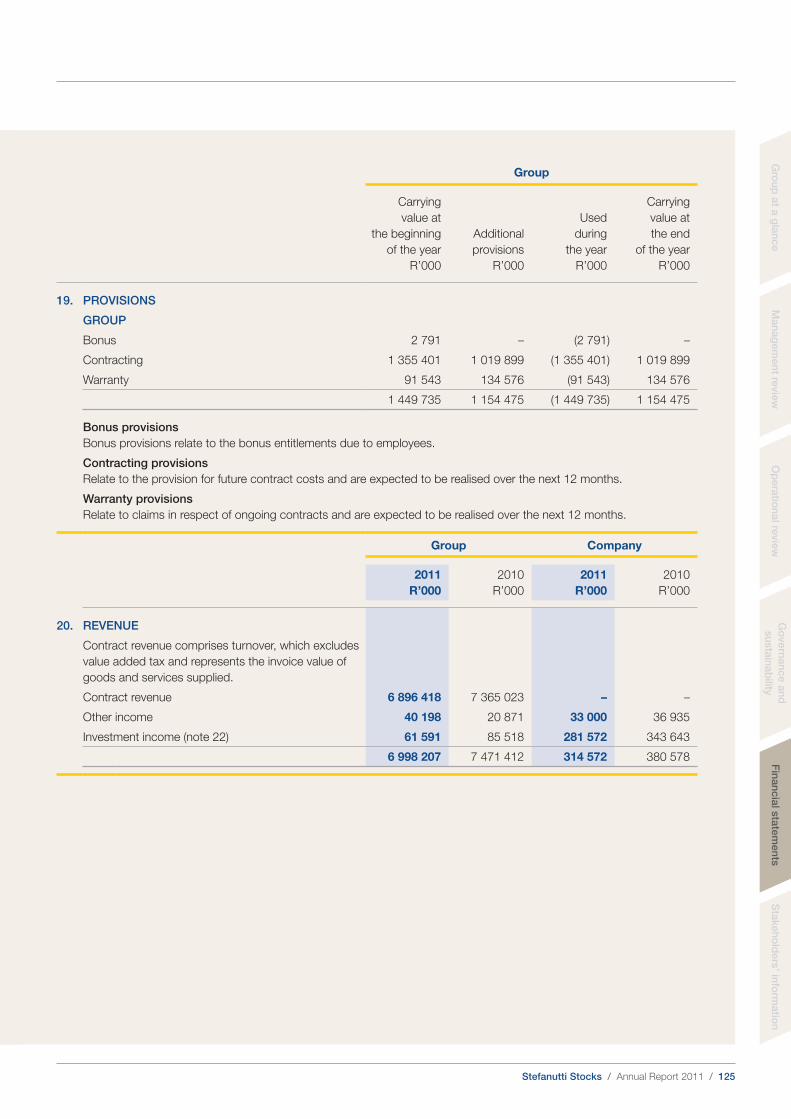
Stefanutti Stocks / Annual Report 2011 / 125
Gro
up
at a
gla
nce
Man
ag
em
en
t revie
wO
pera
tion
al re
vie
wG
overn
an
ce
an
d
su
sta
inab
ilityF
inan
cia
l sta
tem
en
tsS
takeh
old
ers
’ info
rmatio
n
Group
Carrying
value at
the beginning
of the year
R’000
Additional
provisions
R’000
Used
during
the year
R’000
Carrying
value at
the end
of the year
R’000
19. PROVISIONS
GROUP
Bonus 2 791 – (2 791) –
Contracting 1 355 401 1 019 899 (1 355 401) 1 019 899
Warranty 91 543 134 576 (91 543) 134 576
1 449 735 1 154 475 (1 449 735) 1 154 475
Bonus provisions
Bonus provisions relate to the bonus entitlements due to employees.
Contracting provisions
Relate to the provision for future contract costs and are expected to be realised over the next 12 months.
Warranty provisions
Relate to claims in respect of ongoing contracts and are expected to be realised over the next 12 months.
Group Company
2011
R’000
2010
R’000
2011
R’000
2010
R’000
20. REVENUE
Contract revenue comprises turnover, which excludes
value added tax and represents the invoice value of
goods and services supplied.
Contract revenue 6 896 418 7 365 023 – –
Other income 40 198 20 871 33 000 36 935
Investment income (note 22) 61 591 85 518 281 572 343 643
6 998 207 7 471 412 314 572 380 578
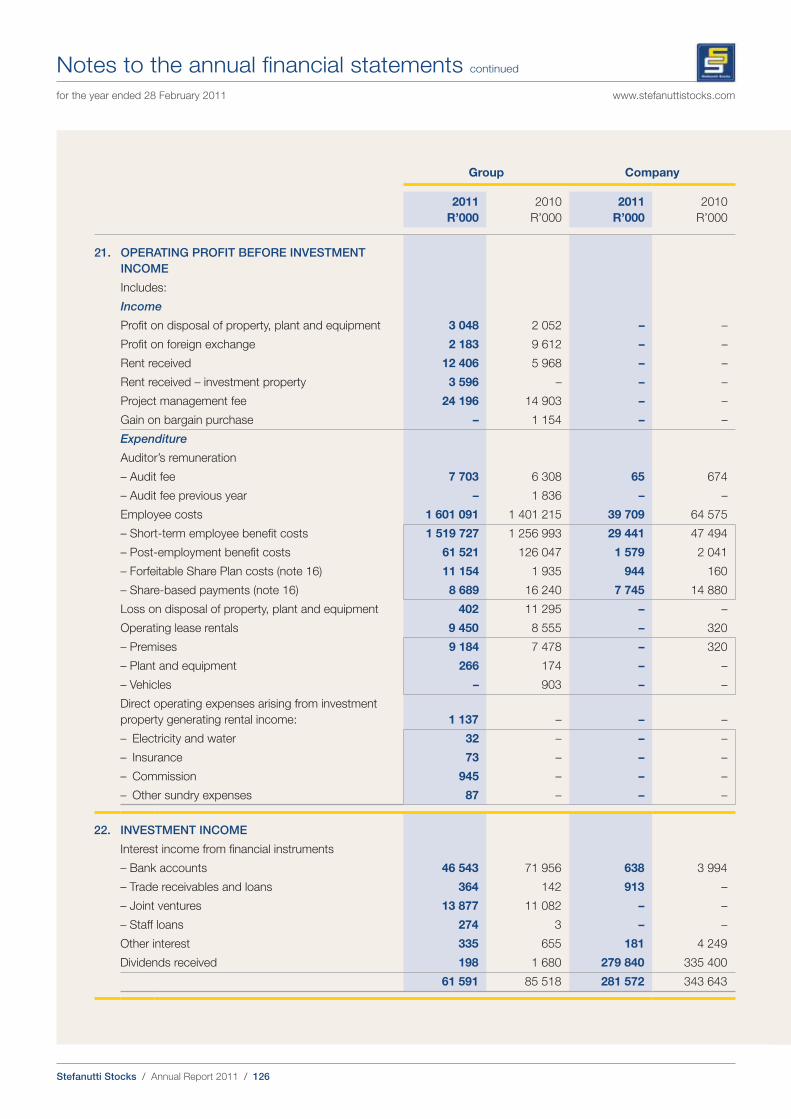
Stefanutti Stocks / Annual Report 2011 / 126
Notes to the annual financial statements continued
for the year ended 28 February 2011 www.stefanuttistocks.com
Group Company
2011
R’000
2010
R’000
2011
R’000
2010
R’000
21. OPERATING PROFIT BEFORE INVESTMENT
INCOME
Includes:
Income
Profit on disposal of property, plant and equipment 3 048 2 052 – –
Profit on foreign exchange 2 183 9 612 – –
Rent received 12 406 5 968 – –
Rent received – investment property 3 596 – – –
Project management fee 24 196 14 903 – –
Gain on bargain purchase – 1 154 – –
Expenditure
Auditor’s remuneration
– Audit fee 7 703 6 308 65 674
– Audit fee previous year – 1 836 – –
Employee costs 1 601 091 1 401 215 39 709 64 575
– Short-term employee benefit costs 1 519 727 1 256 993 29 441 47 494
– Post-employment benefit costs 61 521 126 047 1 579 2 041
– Forfeitable Share Plan costs (note 16) 11 154 1 935 944 160
– Share-based payments (note 16) 8 689 16 240 7 745 14 880
Loss on disposal of property, plant and equipment 402 11 295 – –
Operating lease rentals 9 450 8 555 – 320
– Premises 9 184 7 478 – 320
– Plant and equipment 266 174 – –
– Vehicles – 903 – –
Direct operating expenses arising from investment
property generating rental income: 1 137 – – –
– Electricity and water 32 – – –
– Insurance 73 – – –
– Commission 945 – – –
– Other sundry expenses 87 – – –
22. INVESTMENT INCOME
Interest income from financial instruments
– Bank accounts 46 543 71 956 638 3 994
– Trade receivables and loans 364 142 913 –
– Joint ventures 13 877 11 082 – –
– Staff loans 274 3 – –
Other interest 335 655 181 4 249
Dividends received 198 1 680 279 840 335 400
61 591 85 518 281 572 343 643
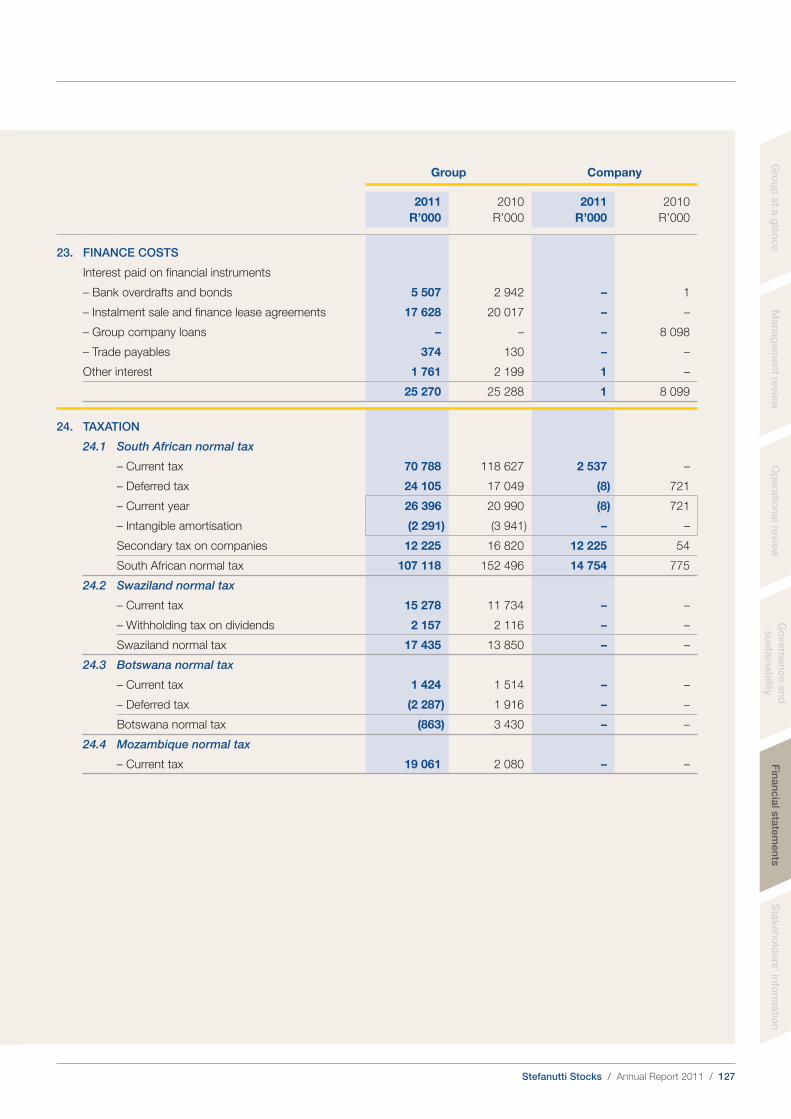
Stefanutti Stocks / Annual Report 2011 / 127
Gro
up
at a
gla
nce
Man
ag
em
en
t revie
wO
pera
tion
al re
vie
wG
overn
an
ce
an
d
su
sta
inab
ilityF
inan
cia
l sta
tem
en
tsS
takeh
old
ers
’ info
rmatio
n
Group Company
2011
R’000
2010
R’000
2011
R’000
2010
R’000
23. FINANCE COSTS
Interest paid on financial instruments
– Bank overdrafts and bonds 5 507 2 942 – 1
– Instalment sale and finance lease agreements 17 628 20 017 – –
– Group company loans – – – 8 098
– Trade payables 374 130 – –
Other interest 1 761 2 199 1 –
25 270 25 288 1 8 099
24. TAXATION
24.1 South African normal tax
– Current tax 70 788 118 627 2 537 –
– Deferred tax 24 105 17 049 (8) 721
– Current year 26 396 20 990 (8) 721
– Intangible amortisation (2 291) (3 941) – –
Secondary tax on companies 12 225 16 820 12 225 54
South African normal tax 107 118 152 496 14 754 775
24.2 Swaziland normal tax
– Current tax 15 278 11 734 – –
– Withholding tax on dividends 2 157 2 116 – –
Swaziland normal tax 17 435 13 850 – –
24.3 Botswana normal tax
– Current tax 1 424 1 514 – –
– Deferred tax (2 287) 1 916 – –
Botswana normal tax (863) 3 430 – –
24.4 Mozambique normal tax
– Current tax 19 061 2 080 – –
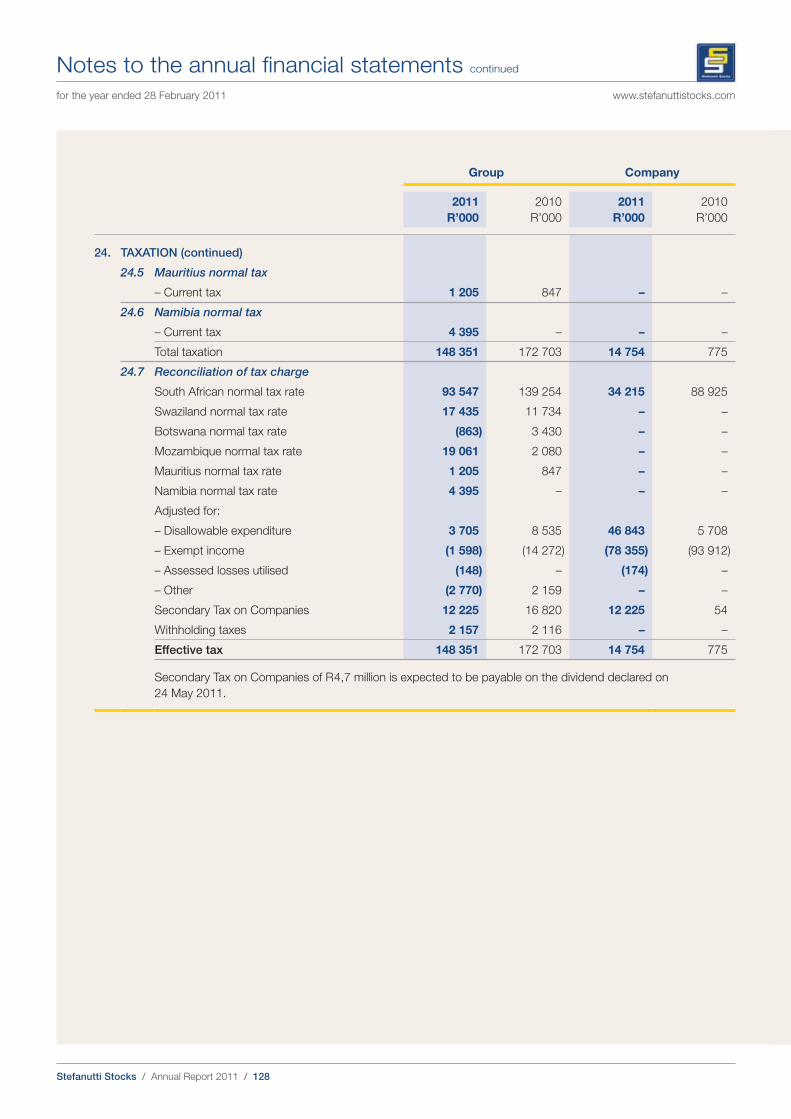
Stefanutti Stocks / Annual Report 2011 / 128
Notes to the annual financial statements continued
for the year ended 28 February 2011 www.stefanuttistocks.com
Group Company
2011
R’000
2010
R’000
2011
R’000
2010
R’000
24. TAXATION (continued)
24.5 Mauritius normal tax
– Current tax 1 205 847 – –
24.6 Namibia normal tax
– Current tax 4 395 – – –
Total taxation 148 351 172 703 14 754 775
24.7 Reconciliation of tax charge
South African normal tax rate 93 547 139 254 34 215 88 925
Swaziland normal tax rate 17 435 11 734 – –
Botswana normal tax rate (863) 3 430 – –
Mozambique normal tax rate 19 061 2 080 – –
Mauritius normal tax rate 1 205 847 – –
Namibia normal tax rate 4 395 – – –
Adjusted for:
– Disallowable expenditure 3 705 8 535 46 843 5 708
– Exempt income (1 598) (14 272) (78 355) (93 912)
– Assessed losses utilised (148) – (174) –
– Other (2 770) 2 159 – –
Secondary Tax on Companies 12 225 16 820 12 225 54
Withholding taxes 2 157 2 116 – –
Effective tax 148 351 172 703 14 754 775
Secondary Tax on Companies of R 4,7 million is expected to be payable on the dividend declared on
24 May 2011.
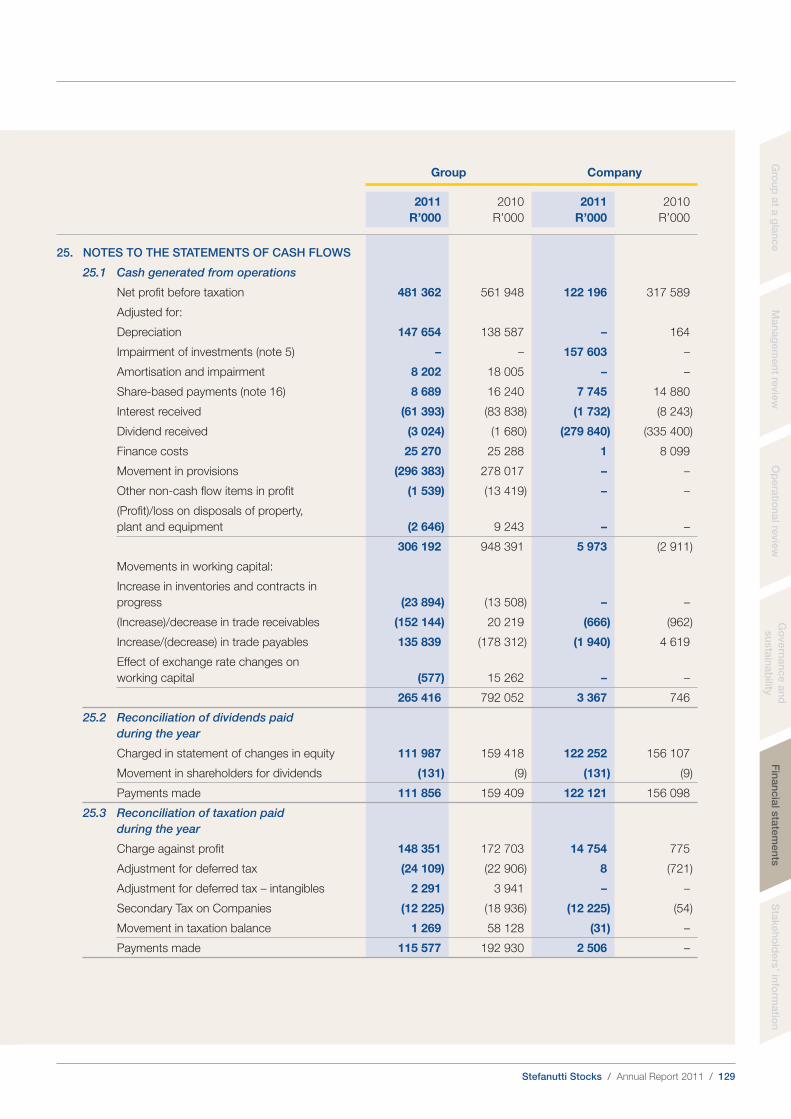
Stefanutti Stocks / Annual Report 2011 / 129
Gro
up
at a
gla
nce
Man
ag
em
en
t revie
wO
pera
tion
al re
vie
wG
overn
an
ce
an
d
su
sta
inab
ilityF
inan
cia
l sta
tem
en
tsS
takeh
old
ers
’ info
rmatio
n
Group Company
2011
R’000
2010
R’000
2011
R’000
2010
R’000
25. NOTES TO THE STATEMENTS OF CASH FLOWS
25.1 Cash generated from operations
Net profit before taxation 481 362 561 948 122 196 317 589
Adjusted for:
Depreciation 147 654 138 587 – 164
Impairment of investments (note 5) – – 157 603 –
Amortisation and impairment 8 202 18 005 – –
Share-based payments (note 16) 8 689 16 240 7 745 14 880
Interest received (61 393) (83 838) (1 732) (8 243)
Dividend received (3 024) (1 680) (279 840) (335 400)
Finance costs 25 270 25 288 1 8 099
Movement in provisions (296 383) 278 017 – –
Other non-cash flow items in profit (1 539) (13 419) – –
(Profit)/loss on disposals of property,
plant and equipment (2 646) 9 243 – –
306 192 948 391 5 973 (2 911)
Movements in working capital:
Increase in inventories and contracts in
progress (23 894) (13 508) – –
(Increase)/decrease in trade receivables (152 144) 20 219 (666) (962)
Increase/(decrease) in trade payables 135 839 (178 312) (1 940) 4 619
Effect of exchange rate changes on
working capital (577) 15 262 – –
265 416 792 052 3 367 746
25.2 Reconciliation of dividends paid
during the year
Charged in statement of changes in equity 111 987 159 418 122 252 156 107
Movement in shareholders for dividends (131) (9) (131) (9)
Payments made 111 856 159 409 122 121 156 098
25.3 Reconciliation of taxation paid
during the year
Charge against profit 148 351 172 703 14 754 775
Adjustment for deferred tax (24 109) (22 906) 8 (721)
Adjustment for deferred tax – intangibles 2 291 3 941 – –
Secondary Tax on Companies (12 225) (18 936) (12 225) (54)
Movement in taxation balance 1 269 58 128 (31) –
Payments made 115 577 192 930 2 506 –
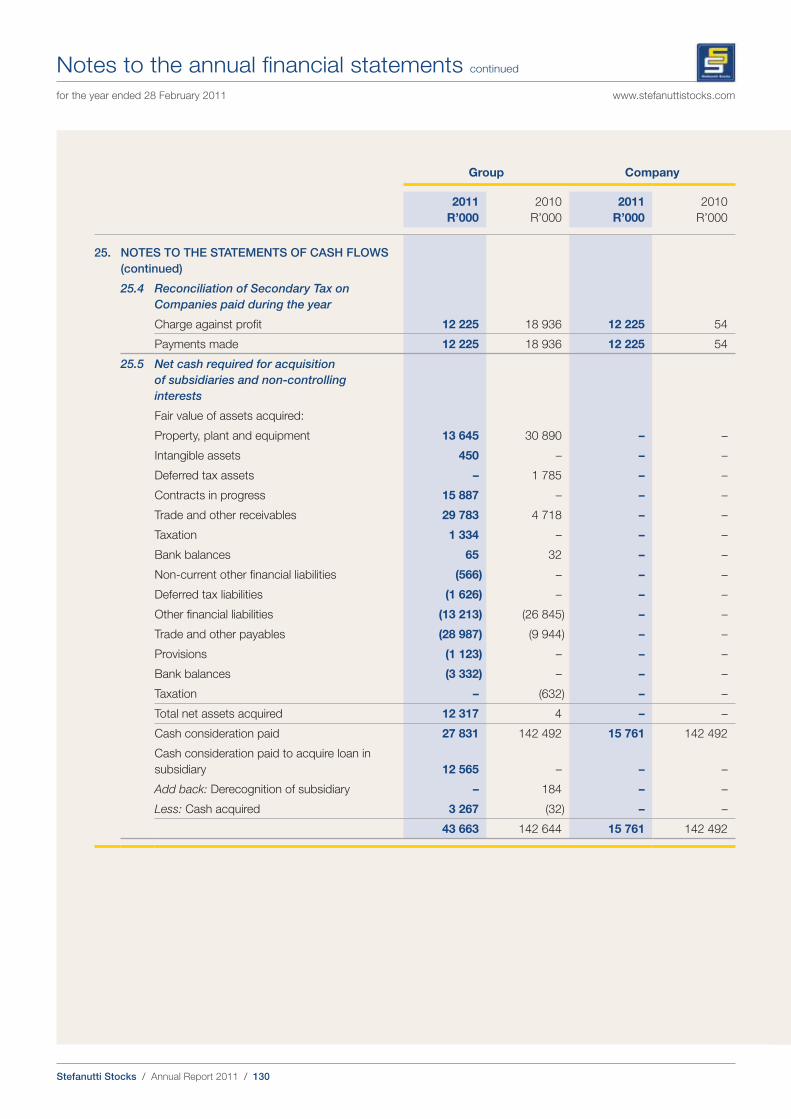
Stefanutti Stocks / Annual Report 2011 / 130
Notes to the annual financial statements continued
for the year ended 28 February 2011 www.stefanuttistocks.com
Group Company
2011
R’000
2010
R’000
2011
R’000
2010
R’000
25. NOTES TO THE STATEMENTS OF CASH FLOWS
(continued)
25.4 Reconciliation of Secondary Tax on
Companies paid during the year
Charge against profit 12 225 18 936 12 225 54
Payments made 12 225 18 936 12 225 54
25.5 Net cash required for acquisition
of subsidiaries and non-controlling
interests
Fair value of assets acquired:
Property, plant and equipment 13 645 30 890 – –
Intangible assets 450 – – –
Deferred tax assets – 1 785 – –
Contracts in progress 15 887 – – –
Trade and other receivables 29 783 4 718 – –
Taxation 1 334 – – –
Bank balances 65 32 – –
Non-current other financial liabilities (566) – – –
Deferred tax liabilities (1 626) – – –
Other financial liabilities (13 213) (26 845) – –
Trade and other payables (28 987) (9 944) – –
Provisions (1 123) – – –
Bank balances (3 332) – – –
Taxation – (632) – –
Total net assets acquired 12 317 4 – –
Cash consideration paid 27 831 142 492 15 761 142 492
Cash consideration paid to acquire loan in
subsidiary 12 565 – – –
Add back: Derecognition of subsidiary – 184 – –
Less: Cash acquired 3 267 (32) – –
43 663 142 644 15 761 142 492
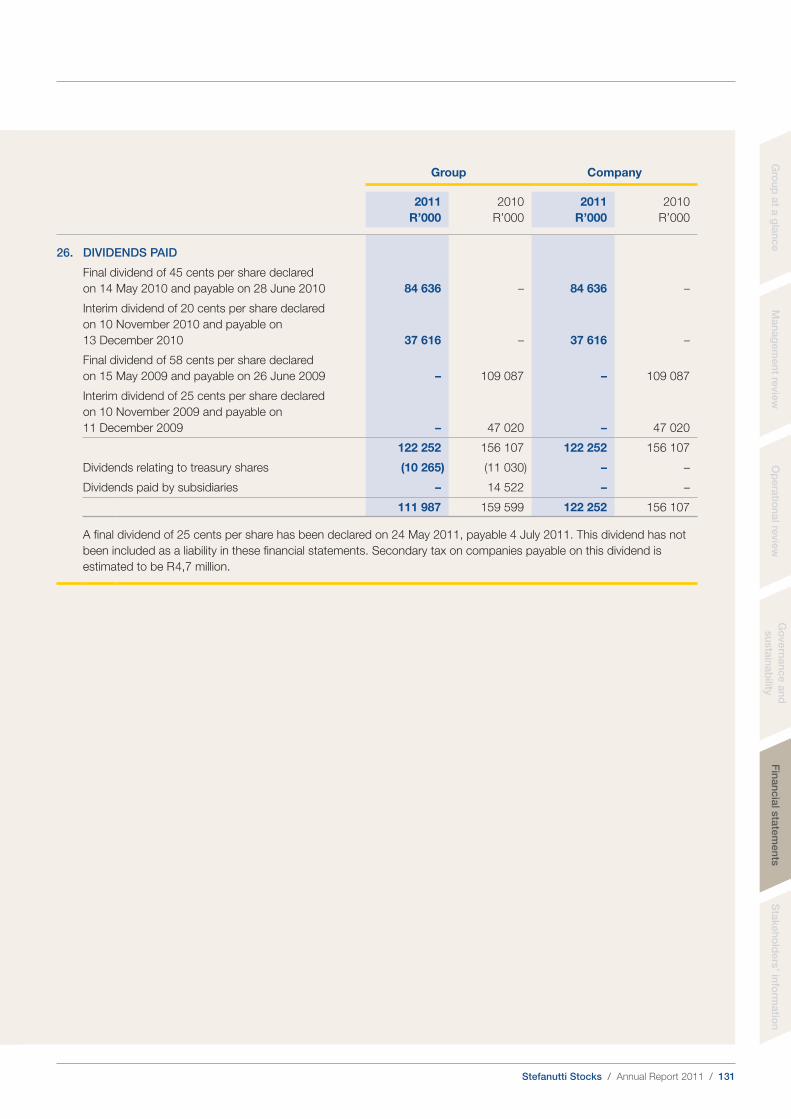
Stefanutti Stocks / Annual Report 2011 / 131
Gro
up
at a
gla
nce
Man
ag
em
en
t revie
wO
pera
tion
al re
vie
wG
overn
an
ce
an
d
su
sta
inab
ilityF
inan
cia
l sta
tem
en
tsS
takeh
old
ers
’ info
rmatio
n
Group Company
2011
R’000
2010
R’000
2011
R’000
2010
R’000
26. DIVIDENDS PAID
Final dividend of 45 cents per share declared
on 14 May 2010 and payable on 28 June 2010 84 636 – 84 636 –
Interim dividend of 20 cents per share declared
on 10 November 2010 and payable on
13 December 2010 37 616 – 37 616 –
Final dividend of 58 cents per share declared
on 15 May 2009 and payable on 26 June 2009 – 109 087 – 109 087
Interim dividend of 25 cents per share declared
on 10 November 2009 and payable on
11 December 2009 – 47 020 – 47 020
122 252 156 107 122 252 156 107
Dividends relating to treasury shares (10 265) (11 030) – –
Dividends paid by subsidiaries – 14 522 – –
111 987 159 599 122 252 156 107
A final dividend of 25 cents per share has been declared on 24 May 2011, payable 4 July 2011. This dividend has not
been included as a liability in these financial statements. Secondary tax on companies payable on this dividend is
estimated to be R 4,7 million.
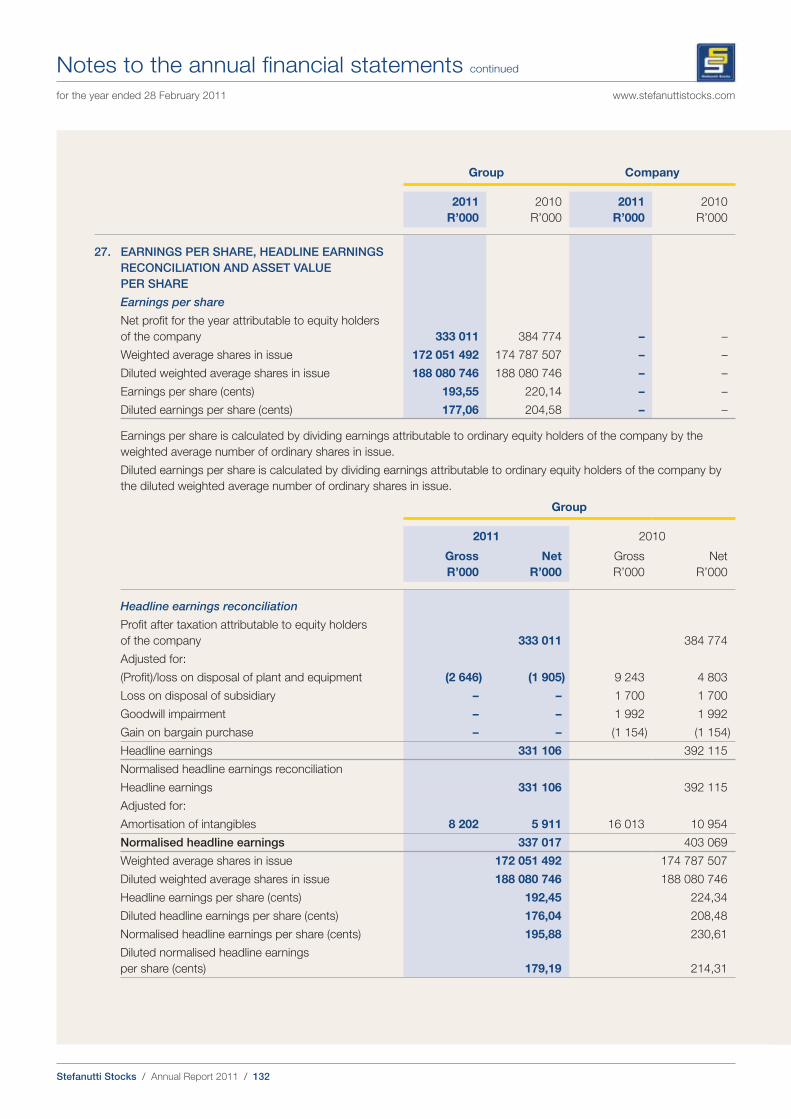
Stefanutti Stocks / Annual Report 2011 / 132
Notes to the annual financial statements continued
for the year ended 28 February 2011 www.stefanuttistocks.com
Group Company
2011
R’000
2010
R’000
2011
R’000
2010
R’000
27. EARNINGS PER SHARE, HEADLINE EARNINGS
RECONCILIATION AND ASSET VALUE
PER SHARE
Earnings per share
Net profit for the year attributable to equity holders
of the company 333 011 384 774 – –
Weighted average shares in issue 172 051 492 174 787 507 – –
Diluted weighted average shares in issue 188 080 746 188 080 746 – –
Earnings per share (cents) 193,55 220,14 – –
Diluted earnings per share (cents) 177,06 204,58 – –
Earnings per share is calculated by dividing earnings attributable to ordinary equity holders of the company by the
weighted average number of ordinary shares in issue.
Diluted earnings per share is calculated by dividing earnings attributable to ordinary equity holders of the company by
the diluted weighted average number of ordinary shares in issue.
Group
2011 2010
Gross
R’000
Net
R’000
Gross
R’000
Net
R’000
Headline earnings reconciliation
Profit after taxation attributable to equity holders
of the company 333 011 384 774
Adjusted for:
(Profit)/loss on disposal of plant and equipment (2 646) (1 905) 9 243 4 803
Loss on disposal of subsidiary – – 1 700 1 700
Goodwill impairment – – 1 992 1 992
Gain on bargain purchase – – (1 154) (1 154)
Headline earnings 331 106 392 115
Normalised headline earnings reconciliation
Headline earnings 331 106 392 115
Adjusted for:
Amortisation of intangibles 8 202 5 911 16 013 10 954
Normalised headline earnings 337 017 403 069
Weighted average shares in issue 172 051 492 174 787 507
Diluted weighted average shares in issue 188 080 746 188 080 746
Headline earnings per share (cents) 192,45 224,34
Diluted headline earnings per share (cents) 176,04 208,48
Normalised headline earnings per share (cents) 195,88 230,61
Diluted normalised headline earnings
per share (cents) 179,19 214,31
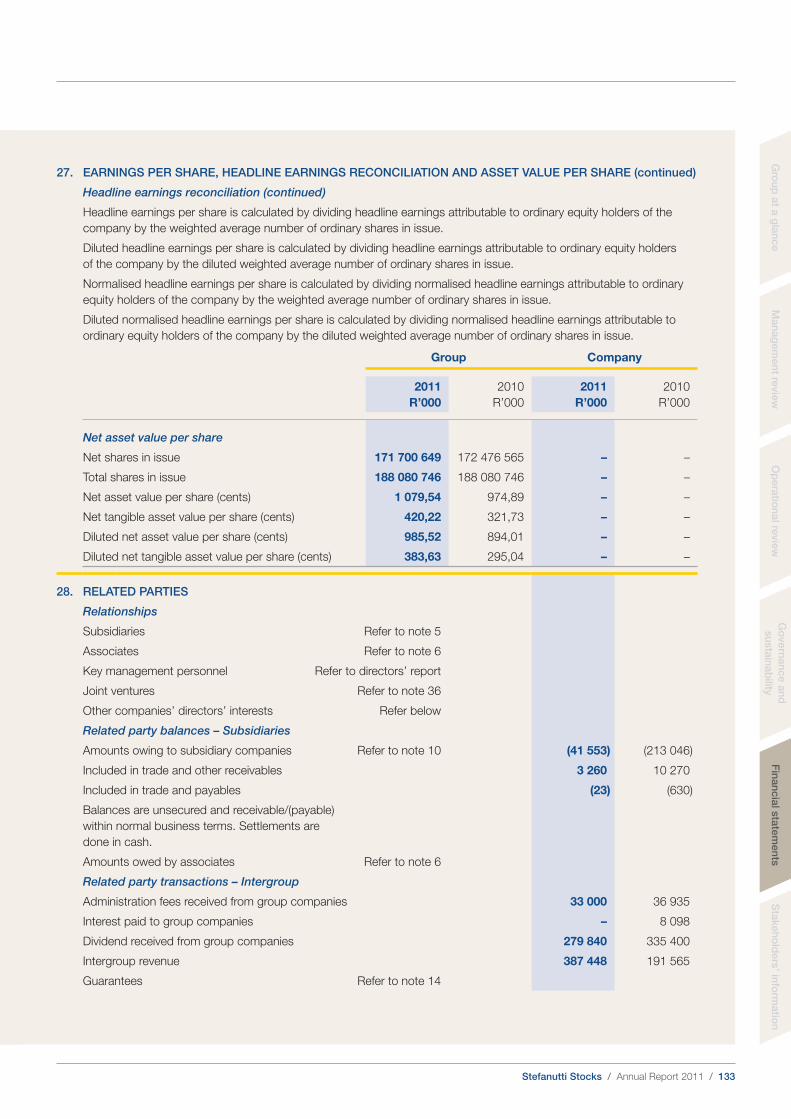
Stefanutti Stocks / Annual Report 2011 / 133
Gro
up
at a
gla
nce
Man
ag
em
en
t revie
wO
pera
tion
al re
vie
wG
overn
an
ce
an
d
su
sta
inab
ilityF
inan
cia
l sta
tem
en
tsS
takeh
old
ers
’ info
rmatio
n
27. EARNINGS PER SHARE, HEADLINE EARNINGS RECONCILIATION AND ASSET VALUE PER SHARE (continued)
Headline earnings reconciliation (continued)
Headline earnings per share is calculated by dividing headline earnings attributable to ordinary equity holders of the
company by the weighted average number of ordinary shares in issue.
Diluted headline earnings per share is calculated by dividing headline earnings attributable to ordinary equity holders
of the company by the diluted weighted average number of ordinary shares in issue.
Normalised headline earnings per share is calculated by dividing normalised headline earnings attributable to ordinary
equity holders of the company by the weighted average number of ordinary shares in issue.
Diluted normalised headline earnings per share is calculated by dividing normalised headline earnings attributable to
ordinary equity holders of the company by the diluted weighted average number of ordinary shares in issue.
Group Company
2011
R’000
2010
R’000
2011
R’000
2010
R’000
Net asset value per share
Net shares in issue 171 700 649 172 476 565 – –
Total shares in issue 188 080 746 188 080 746 – –
Net asset value per share (cents) 1 079,54 974,89 – –
Net tangible asset value per share (cents) 420,22 321,73 – –
Diluted net asset value per share (cents) 985,52 894,01 – –
Diluted net tangible asset value per share (cents) 383,63 295,04 – –
28. RELATED PARTIES
Relationships
Subsidiaries Refer to note 5
Associates Refer to note 6
Key management personnel Refer to directors’ report
Joint ventures Refer to note 36
Other companies’ directors’ interests Refer below
Related party balances – Subsidiaries
Amounts owing to subsidiary companies Refer to note 10 (41 553) (213 046)
Included in trade and other receivables 3 260 10 270
Included in trade and payables (23) (630)
Balances are unsecured and receivable/(payable)
within normal business terms. Settlements are
done in cash.
Amounts owed by associates Refer to note 6
Related party transactions – Intergroup
Administration fees received from group companies 33 000 36 935
Interest paid to group companies – 8 098
Dividend received from group companies 279 840 335 400
Intergroup revenue 387 448 191 565
Guarantees Refer to note 14
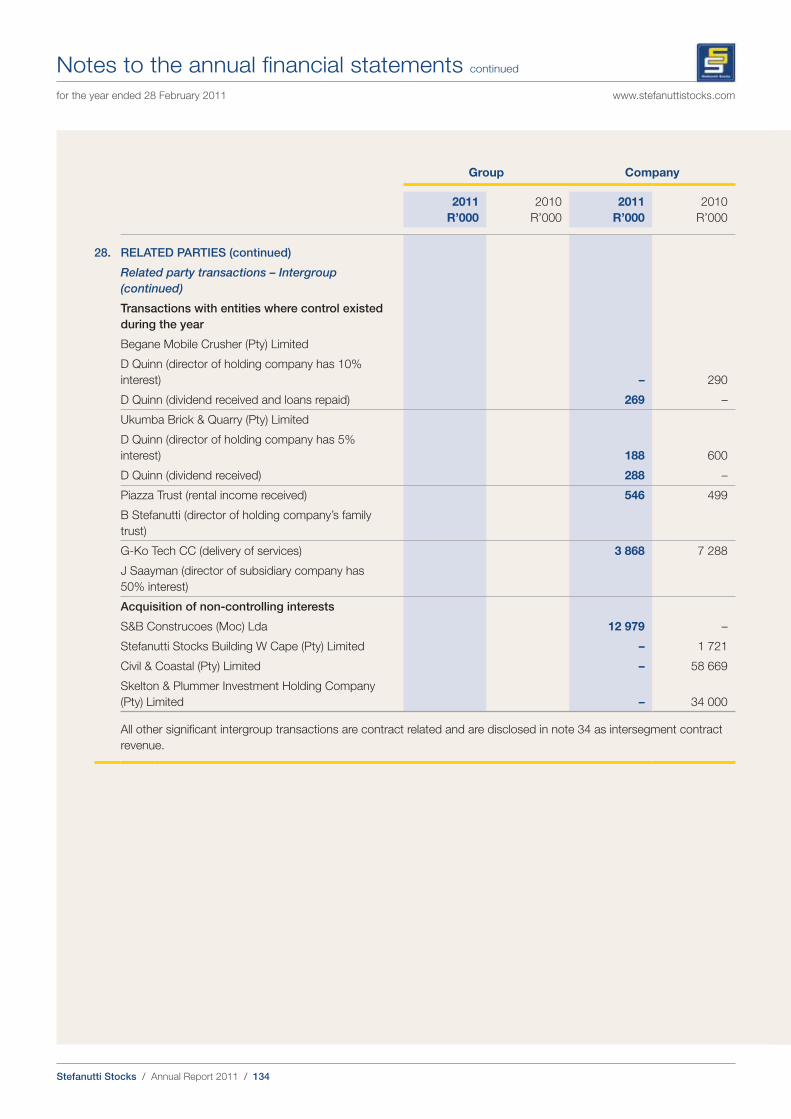
Stefanutti Stocks / Annual Report 2011 / 134
Notes to the annual financial statements continued
for the year ended 28 February 2011 www.stefanuttistocks.com
Group Company
2011
R’000
2010
R’000
2011
R’000
2010
R’000
28. RELATED PARTIES (continued)
Related party transactions – Intergroup
(continued)
Transactions with entities where control existed
during the year
Begane Mobile Crusher (Pty) Limited
D Quinn (director of holding company has 10%
interest) – 290
D Quinn (dividend received and loans repaid) 269 –
Ukumba Brick & Quarry (Pty) Limited
D Quinn (director of holding company has 5%
interest) 188 600
D Quinn (dividend received) 288 –
Piazza Trust (rental income received) 546 499
B Stefanutti (director of holding company’s family
trust)
G-Ko Tech CC (delivery of services) 3 868 7 288
J Saayman (director of subsidiary company has
50% interest)
Acquisition of non-controlling interests
S&B Construcoes (Moc) Lda 12 979 –
Stefanutti Stocks Building W Cape (Pty) Limited – 1 721
Civil & Coastal (Pty) Limited – 58 669
Skelton & Plummer Investment Holding Company
(Pty) Limited – 34 000
All other significant intergroup transactions are contract related and are disclosed in note 34 as intersegment contract
revenue.

Stefanutti Stocks / Annual Report 2011 / 135
Gro
up
at a
gla
nce
Man
ag
em
en
t revie
wO
pera
tion
al re
vie
wG
overn
an
ce
an
d
su
sta
inab
ilityF
inan
cia
l sta
tem
en
tsS
takeh
old
ers
’ info
rmatio
n
Group Company
2011
R’000
2010
R’000
2011
R’000
2010
R’000
29. CONTINGENT LIABILITIES
Total guarantees issued to third parties on behalf of
group companies and joint ventures amounted to: 1 477 621 1 519 132 – –
It is the opinion of the directors that the possibility of
any loss is improbable and it is not anticipated that
any material liabilities will arise.
30. CAPITAL COMMITMENTS
Approved by the directors and contracted for: 6 594 9 508 – –
Approved by the directors not yet contracted for: 302 489 17 042 – –
309 083 26 550 – –
Capital expenditure will be financed from internal resources and existing facilities.
The capital commitments relate primarily to the acquisition of project-related capital expenditure.
<1 year
R’000
2 – 5 years
R’000
>5 years
R’000
Rental commitments
Properties 4 042 1 288 –
Plant and equipment 7 311 7 004 –
Transport and motor vehicles 1 345 477 –
Furniture, fittings, office and computer equipment 216 274 –
12 914 9 043 –
Details of significant leasing arrangements
Property rented for business purposes, terms between two to three years, payable monthly.
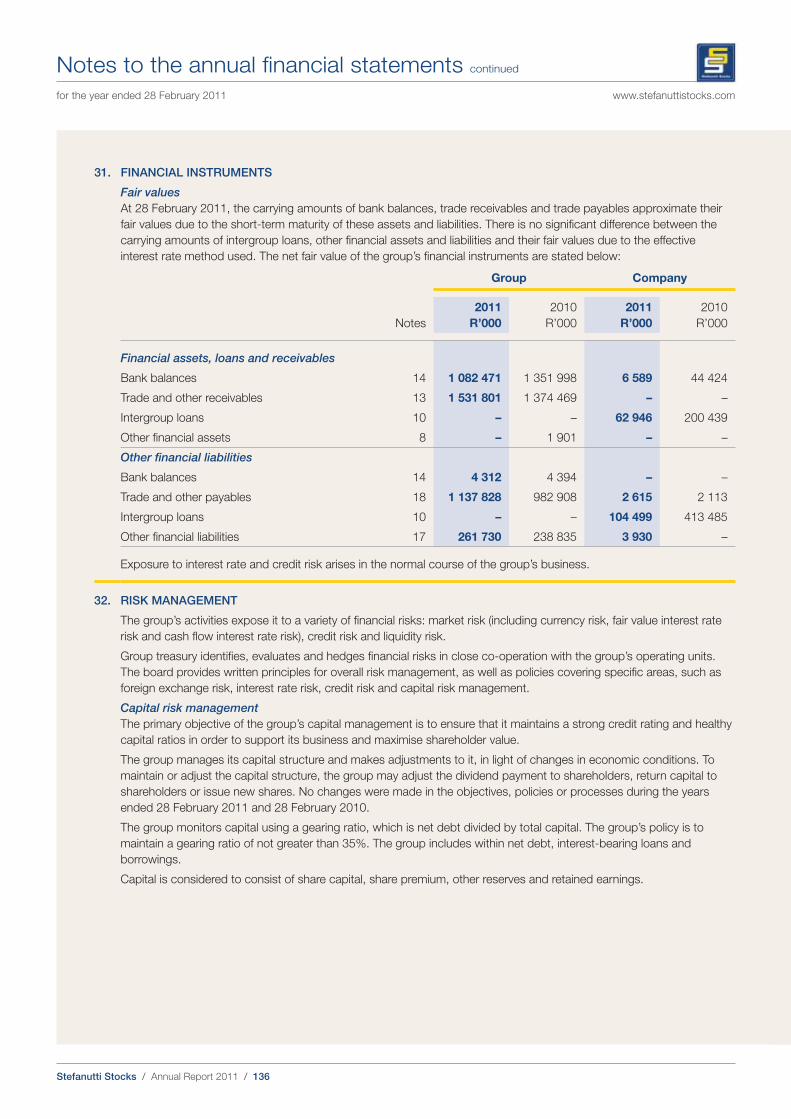
Stefanutti Stocks / Annual Report 2011 / 136
Notes to the annual financial statements continued
for the year ended 28 February 2011 www.stefanuttistocks.com
31. FINANCIAL INSTRUMENTS
Fair values
At 28 February 2011, the carrying amounts of bank balances, trade receivables and trade payables approximate their
fair values due to the short-term maturity of these assets and liabilities. There is no significant difference between the
carrying amounts of intergroup loans, other financial assets and liabilities and their fair values due to the effective
interest rate method used. The net fair value of the group’s financial instruments are stated below:
Group Company
Notes
2011
R’000
2010
R’000
2011
R’000
2010
R’000
Financial assets, loans and receivables
Bank balances 14 1 082 471 1 351 998 6 589 44 424
Trade and other receivables 13 1 531 801 1 374 469 – –
Intergroup loans 10 – – 62 946 200 439
Other financial assets 8 – 1 901 – –
Other financial liabilities
Bank balances 14 4 312 4 394 – –
Trade and other payables 18 1 137 828 982 908 2 615 2 113
Intergroup loans 10 – – 104 499 413 485
Other financial liabilities 17 261 730 238 835 3 930 –
Exposure to interest rate and credit risk arises in the normal course of the group’s business.
32. RISK MANAGEMENT
The group’s activities expose it to a variety of financial risks: market risk (including currency risk, fair value interest rate
risk and cash flow interest rate risk), credit risk and liquidity risk.
Group treasury identifies, evaluates and hedges financial risks in close co-operation with the group’s operating units.
The board provides written principles for overall risk management, as well as policies covering specific areas, such as
foreign exchange risk, interest rate risk, credit risk and capital risk management.
Capital risk management
The primary objective of the group’s capital management is to ensure that it maintains a strong credit rating and healthy
capital ratios in order to support its business and maximise shareholder value.
The group manages its capital structure and makes adjustments to it, in light of changes in economic conditions. To
maintain or adjust the capital structure, the group may adjust the dividend payment to shareholders, return capital to
shareholders or issue new shares. No changes were made in the objectives, policies or processes during the years
ended 28 February 2011 and 28 February 2010.
The group monitors capital using a gearing ratio, which is net debt divided by total capital. The group’s policy is to
maintain a gearing ratio of not greater than 35%. The group includes within net debt, interest-bearing loans and
borrowings.
Capital is considered to consist of share capital, share premium, other reserves and retained earnings.
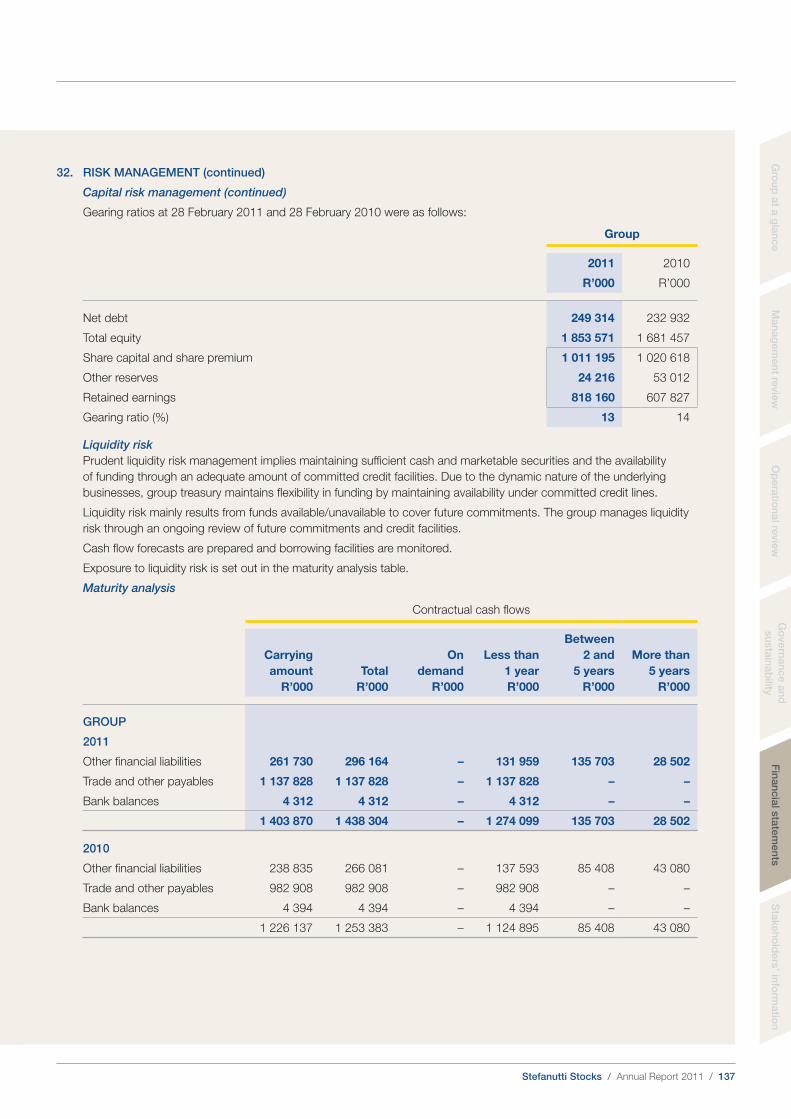
Stefanutti Stocks / Annual Report 2011 / 137
Gro
up
at a
gla
nce
Man
ag
em
en
t revie
wO
pera
tion
al re
vie
wG
overn
an
ce
an
d
su
sta
inab
ilityF
inan
cia
l sta
tem
en
tsS
takeh
old
ers
’ info
rmatio
n
32. RISK MANAGEMENT (continued)
Capital risk management (continued)
Gearing ratios at 28 February 2011 and 28 February 2010 were as follows:
Group
2011 2010
R’000 R’000
Net debt 249 314 232 932
Total equity 1 853 571 1 681 457
Share capital and share premium 1 011 195 1 020 618
Other reserves 24 216 53 012
Retained earnings 818 160 607 827
Gearing ratio (%) 13 14
Liquidity risk
Prudent liquidity risk management implies maintaining sufficient cash and marketable securities and the availability
of funding through an adequate amount of committed credit facilities. Due to the dynamic nature of the underlying
businesses, group treasury maintains flexibility in funding by maintaining availability under committed credit lines.
Liquidity risk mainly results from funds available/unavailable to cover future commitments. The group manages liquidity
risk through an ongoing review of future commitments and credit facilities.
Cash flow forecasts are prepared and borrowing facilities are monitored.
Exposure to liquidity risk is set out in the maturity analysis table.
Maturity analysis
Contractual cash flows
Carrying
amount
R’000
Total
R’000
On
demand
R’000
Less than
1 year
R’000
Between
2 and
5 years
R’000
More than
5 years
R’000
GROUP
2011
Other financial liabilities 261 730 296 164 – 131 959 135 703 28 502
Trade and other payables 1 137 828 1 137 828 – 1 137 828 – –
Bank balances 4 312 4 312 – 4 312 – –
1 403 870 1 438 304 – 1 274 099 135 703 28 502
2010
Other financial liabilities 238 835 266 081 – 137 593 85 408 43 080
Trade and other payables 982 908 982 908 – 982 908 – –
Bank balances 4 394 4 394 – 4 394 – –
1 226 137 1 253 383 – 1 124 895 85 408 43 080
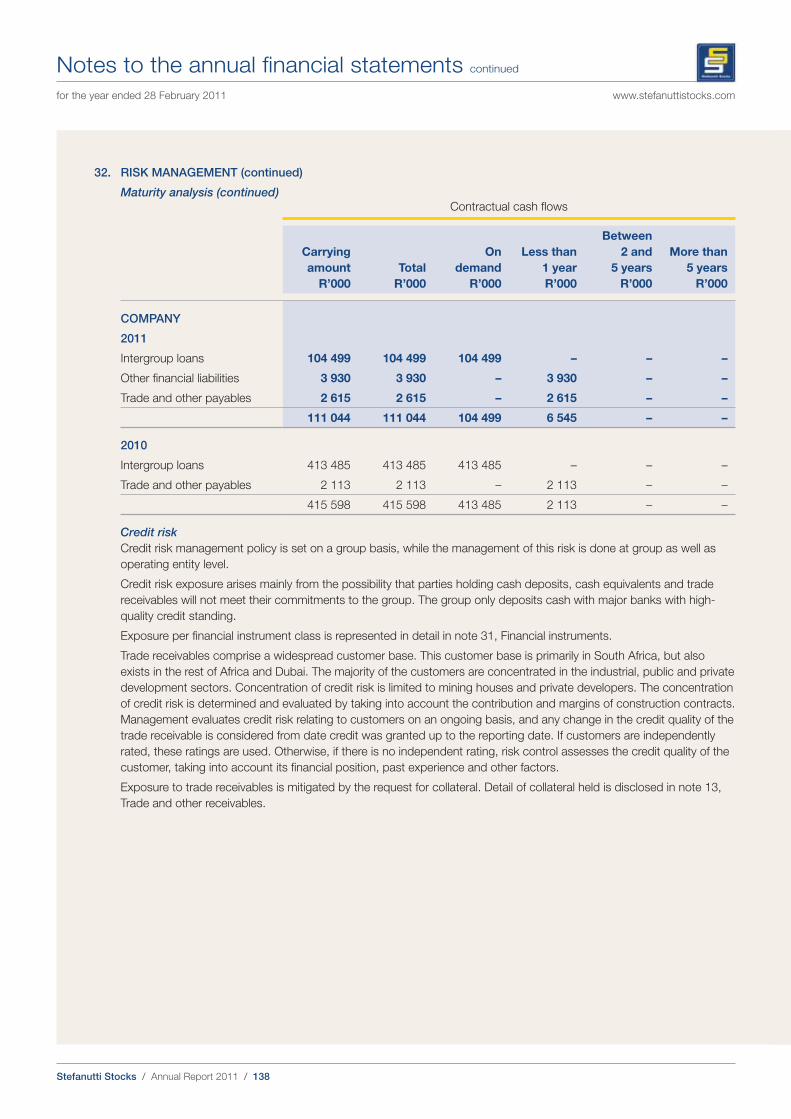
Stefanutti Stocks / Annual Report 2011 / 138
Notes to the annual financial statements continued
for the year ended 28 February 2011 www.stefanuttistocks.com
32. RISK MANAGEMENT (continued)
Maturity analysis (continued)Contractual cash flows
Carrying
amount
R’000
Total
R’000
On
demand
R’000
Less than
1 year
R’000
Between
2 and
5 years
R’000
More than
5 years
R’000
COMPANY
2011
Intergroup loans 104 499 104 499 104 499 – – –
Other financial liabilities 3 930 3 930 – 3 930 – –
Trade and other payables 2 615 2 615 – 2 615 – –
111 044 111 044 104 499 6 545 – –
2010
Intergroup loans 413 485 413 485 413 485 – – –
Trade and other payables 2 113 2 113 – 2 113 – –
415 598 415 598 413 485 2 113 – –
Credit risk
Credit risk management policy is set on a group basis, while the management of this risk is done at group as well as
operating entity level.
Credit risk exposure arises mainly from the possibility that parties holding cash deposits, cash equivalents and trade
receivables will not meet their commitments to the group. The group only deposits cash with major banks with high-
quality credit standing.
Exposure per financial instrument class is represented in detail in note 31, Financial instruments.
Trade receivables comprise a widespread customer base. This customer base is primarily in South Africa, but also
exists in the rest of Africa and Dubai. The majority of the customers are concentrated in the industrial, public and private
development sectors. Concentration of credit risk is limited to mining houses and private developers. The concentration
of credit risk is determined and evaluated by taking into account the contribution and margins of construction contracts.
Management evaluates credit risk relating to customers on an ongoing basis, and any change in the credit quality of the
trade receivable is considered from date credit was granted up to the reporting date. If customers are independently
rated, these ratings are used. Otherwise, if there is no independent rating, risk control assesses the credit quality of the
customer, taking into account its financial position, past experience and other factors.
Exposure to trade receivables is mitigated by the request for collateral. Detail of collateral held is disclosed in note 13,
Trade and other receivables.
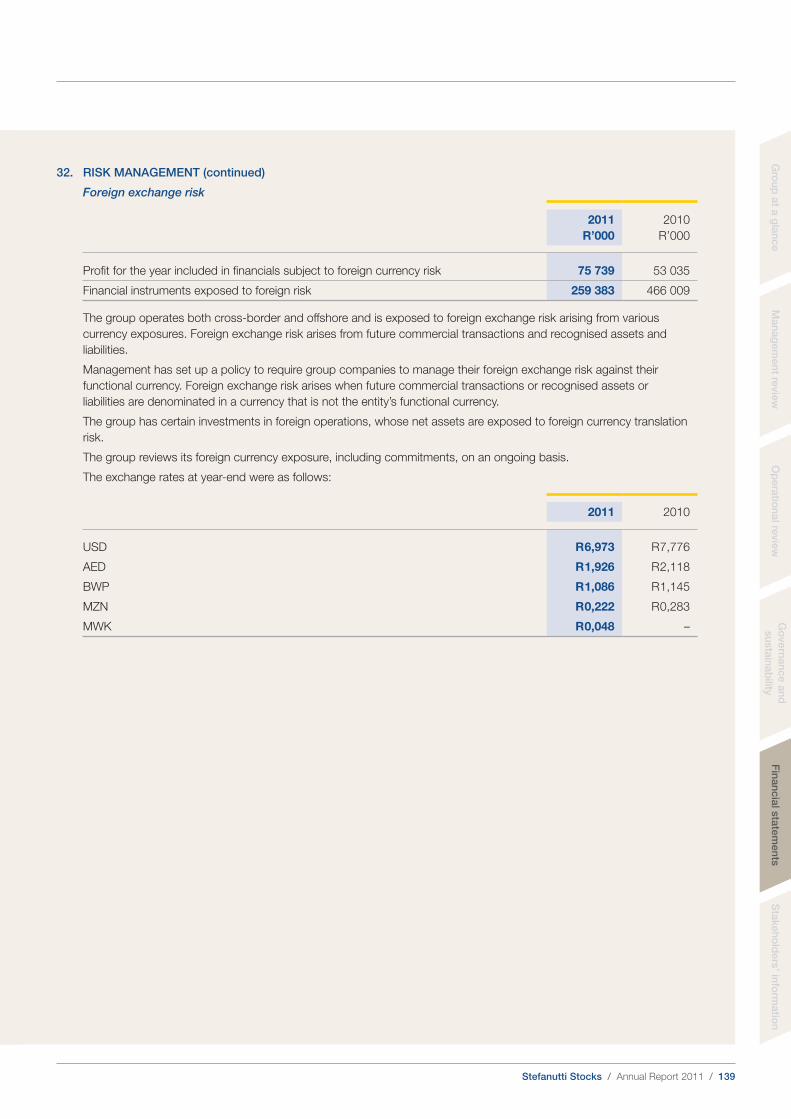
Stefanutti Stocks / Annual Report 2011 / 139
Gro
up
at a
gla
nce
Man
ag
em
en
t revie
wO
pera
tion
al re
vie
wG
overn
an
ce
an
d
su
sta
inab
ilityF
inan
cia
l sta
tem
en
tsS
takeh
old
ers
’ info
rmatio
n
32. RISK MANAGEMENT (continued)
Foreign exchange risk
2011
R’000
2010
R’000
Profit for the year included in financials subject to foreign currency risk 75 739 53 035
Financial instruments exposed to foreign risk 259 383 466 009
The group operates both cross-border and offshore and is exposed to foreign exchange risk arising from various
currency exposures. Foreign exchange risk arises from future commercial transactions and recognised assets and
liabilities.
Management has set up a policy to require group companies to manage their foreign exchange risk against their
functional currency. Foreign exchange risk arises when future commercial transactions or recognised assets or
liabilities are denominated in a currency that is not the entity’s functional currency.
The group has certain investments in foreign operations, whose net assets are exposed to foreign currency translation
risk.
The group reviews its foreign currency exposure, including commitments, on an ongoing basis.
The exchange rates at year-end were as follows:
2011 2010
USD R 6,973 R 7,776
AED R 1,926 R 2,118
BWP R 1,086 R 1,145
MZN R 0,222 R 0,283
MWK R 0,048 –
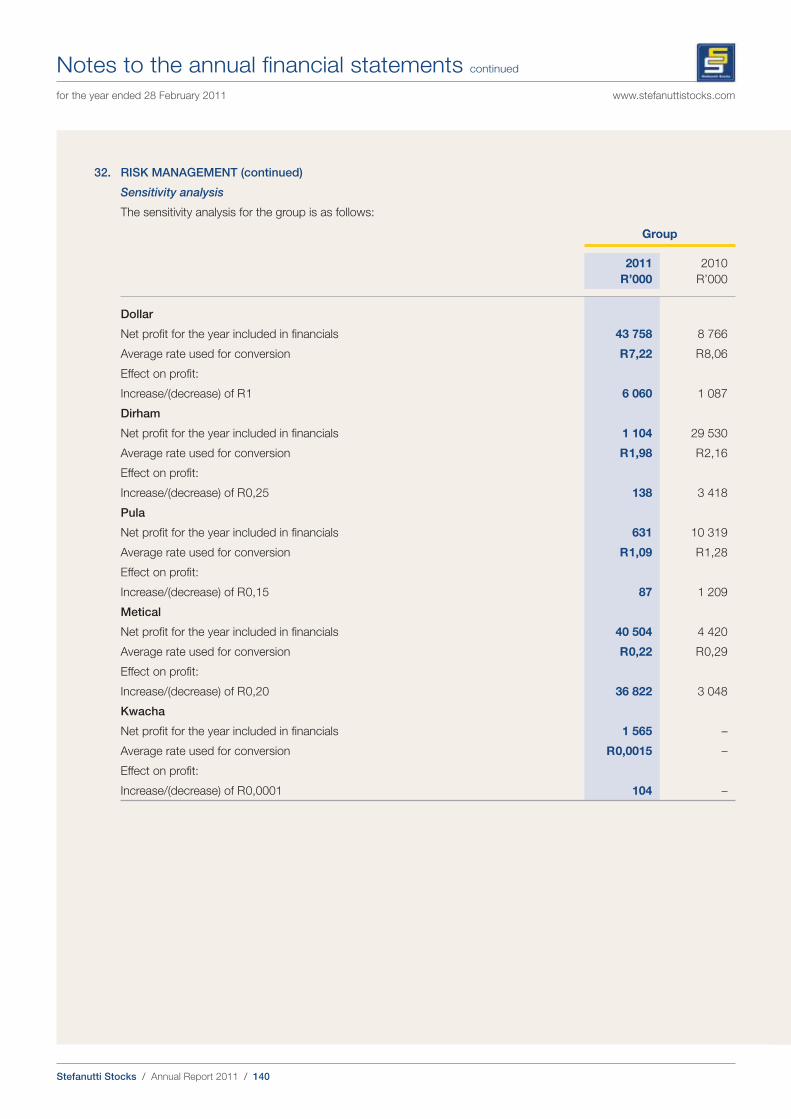
Stefanutti Stocks / Annual Report 2011 / 140
Notes to the annual financial statements continued
for the year ended 28 February 2011 www.stefanuttistocks.com
32. RISK MANAGEMENT (continued)
Sensitivity analysis
The sensitivity analysis for the group is as follows:
Group
2011
R’000
2010
R’000
Dollar
Net profit for the year included in financials 43 758 8 766
Average rate used for conversion R 7,22 R 8,06
Effect on profit:
Increase/(decrease) of R 1 6 060 1 087
Dirham
Net profit for the year included in financials 1 104 29 530
Average rate used for conversion R 1,98 R 2,16
Effect on profit:
Increase/(decrease) of R 0,25 138 3 418
Pula
Net profit for the year included in financials 631 10 319
Average rate used for conversion R 1,09 R 1,28
Effect on profit:
Increase/(decrease) of R 0,15 87 1 209
Metical
Net profit for the year included in financials 40 504 4 420
Average rate used for conversion R 0,22 R 0,29
Effect on profit:
Increase/(decrease) of R 0,20 36 822 3 048
Kwacha
Net profit for the year included in financials 1 565 –
Average rate used for conversion R 0,0015 –
Effect on profit:
Increase/(decrease) of R 0,0001 104 –
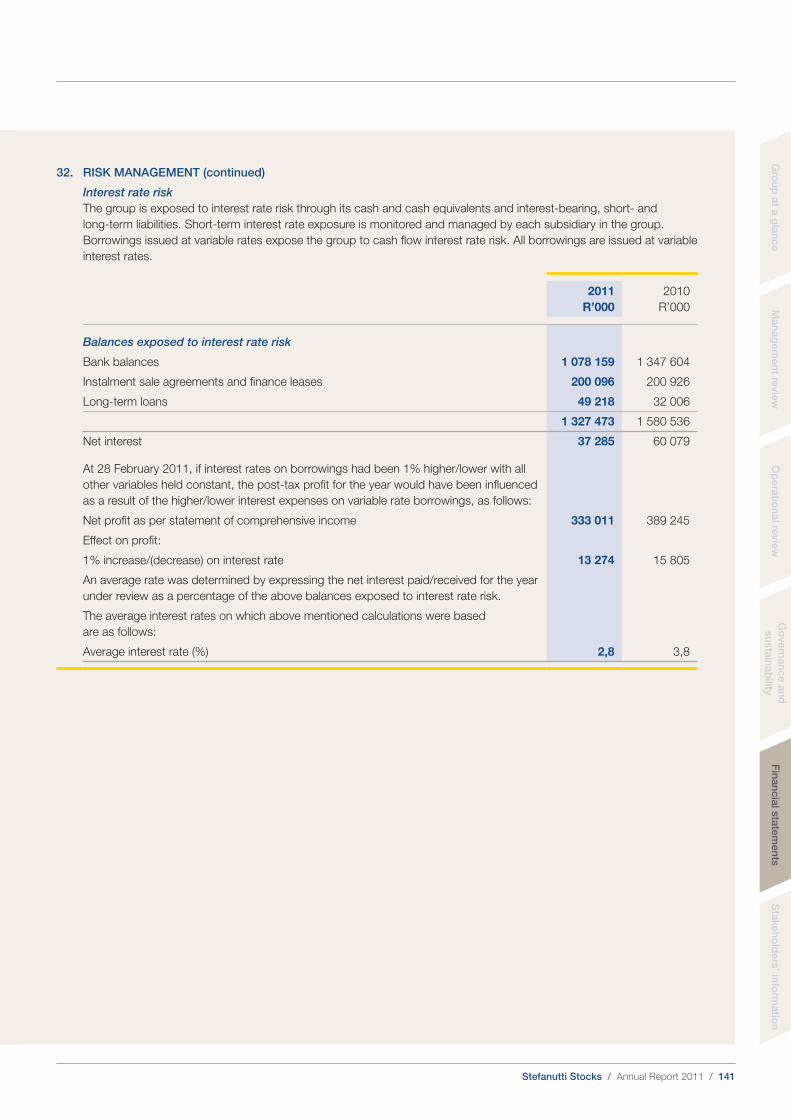
Stefanutti Stocks / Annual Report 2011 / 141
Gro
up
at a
gla
nce
Man
ag
em
en
t revie
wO
pera
tion
al re
vie
wG
overn
an
ce
an
d
su
sta
inab
ilityF
inan
cia
l sta
tem
en
tsS
takeh
old
ers
’ info
rmatio
n
32. RISK MANAGEMENT (continued)
Interest rate risk
The group is exposed to interest rate risk through its cash and cash equivalents and interest-bearing, short- and
long-term liabilities. Short-term interest rate exposure is monitored and managed by each subsidiary in the group.
Borrowings issued at variable rates expose the group to cash flow interest rate risk. All borrowings are issued at variable
interest rates.
2011
R’000
2010
R’000
Balances exposed to interest rate risk
Bank balances 1 078 159 1 347 604
Instalment sale agreements and finance leases 200 096 200 926
Long-term loans 49 218 32 006
1 327 473 1 580 536
Net interest 37 285 60 079
At 28 February 2011, if interest rates on borrowings had been 1% higher/lower with all
other variables held constant, the post-tax profit for the year would have been influenced
as a result of the higher/lower interest expenses on variable rate borrowings, as follows:
Net profit as per statement of comprehensive income 333 011 389 245
Effect on profit:
1% increase/(decrease) on interest rate 13 274 15 805
An average rate was determined by expressing the net interest paid/received for the year
under review as a percentage of the above balances exposed to interest rate risk.
The average interest rates on which above mentioned calculations were based
are as follows:
Average interest rate (%) 2,8 3,8
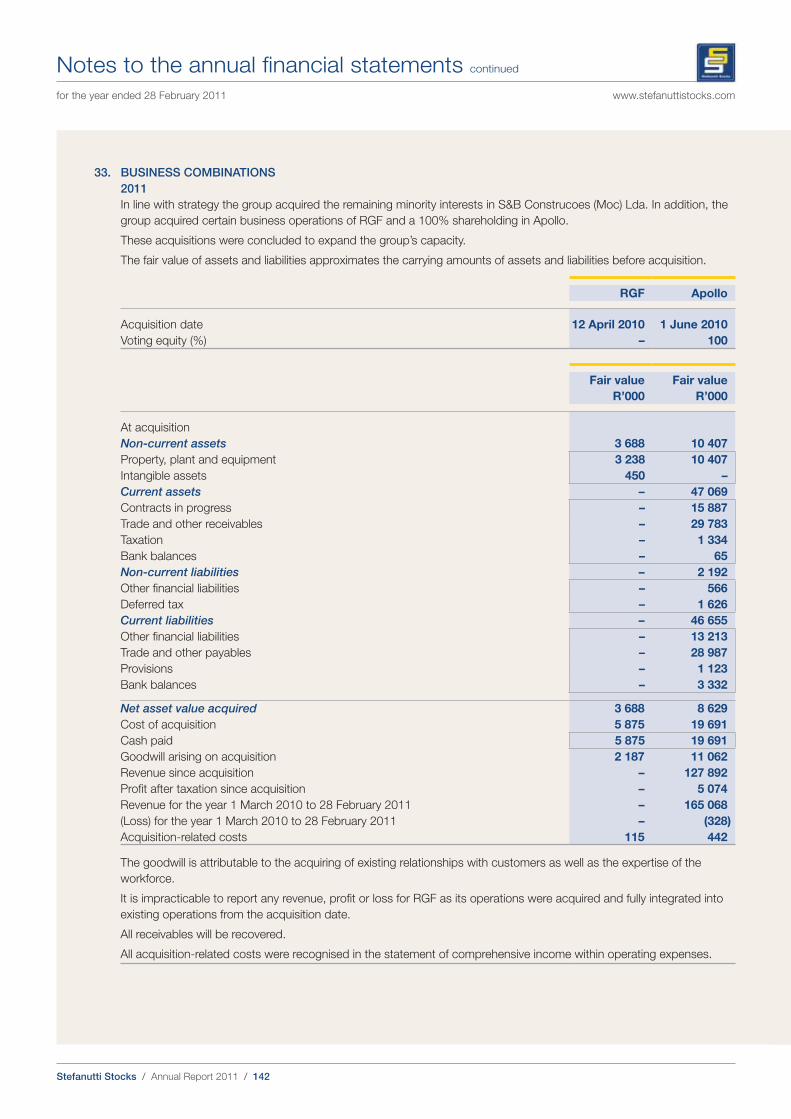
Stefanutti Stocks / Annual Report 2011 / 142
Notes to the annual financial statements continued
for the year ended 28 February 2011 www.stefanuttistocks.com
33. BUSINESS COMBINATIONS
2011
In line with strategy the group acquired the remaining minority interests in S&B Construcoes (Moc) Lda. In addition, the
group acquired certain business operations of RGF and a 100% shareholding in Apollo.
These acquisitions were concluded to expand the group’s capacity.
The fair value of assets and liabilities approximates the carrying amounts of assets and liabilities before acquisition.
RGF Apollo
Acquisition date 12 April 2010 1 June 2010
Voting equity (%) – 100
Fair value
R’000
Fair value
R’000
At acquisition
Non-current assets 3 688 10 407
Property, plant and equipment 3 238 10 407
Intangible assets 450 –
Current assets – 47 069
Contracts in progress – 15 887
Trade and other receivables – 29 783
Taxation – 1 334
Bank balances – 65
Non-current liabilities – 2 192
Other financial liabilities – 566
Deferred tax – 1 626
Current liabilities – 46 655
Other financial liabilities – 13 213
Trade and other payables – 28 987
Provisions – 1 123
Bank balances – 3 332
Net asset value acquired 3 688 8 629
Cost of acquisition 5 875 19 691
Cash paid 5 875 19 691
Goodwill arising on acquisition 2 187 11 062
Revenue since acquisition – 127 892
Profit after taxation since acquisition – 5 074
Revenue for the year 1 March 2010 to 28 February 2011 – 165 068
(Loss) for the year 1 March 2010 to 28 February 2011 – (328)
Acquisition-related costs 115 442
The goodwill is attributable to the acquiring of existing relationships with customers as well as the expertise of the
workforce.
It is impracticable to report any revenue, profit or loss for RGF as its operations were acquired and fully integrated into
existing operations from the acquisition date.
All receivables will be recovered.
All acquisition-related costs were recognised in the statement of comprehensive income within operating expenses.
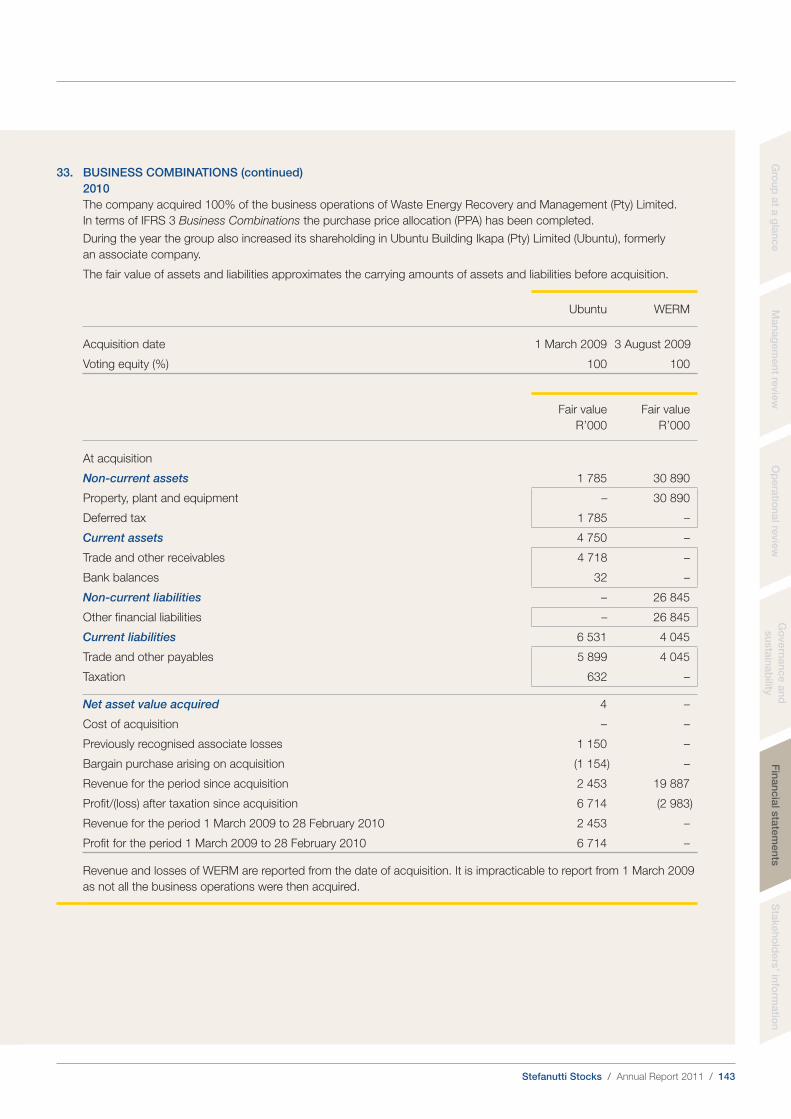
Stefanutti Stocks / Annual Report 2011 / 143
Gro
up
at a
gla
nce
Man
ag
em
en
t revie
wO
pera
tion
al re
vie
wG
overn
an
ce
an
d
su
sta
inab
ilityF
inan
cia
l sta
tem
en
tsS
takeh
old
ers
’ info
rmatio
n
33. BUSINESS COMBINATIONS (continued)
2010
The company acquired 100% of the business operations of Waste Energy Recovery and Management (Pty) Limited.
In terms of IFRS 3 Business Combinations the purchase price allocation (PPA) has been completed.
During the year the group also increased its shareholding in Ubuntu Building Ikapa (Pty) Limited (Ubuntu), formerly
an associate company.
The fair value of assets and liabilities approximates the carrying amounts of assets and liabilities before acquisition.
Ubuntu WERM
Acquisition date 1 March 2009 3 August 2009
Voting equity (%) 100 100
Fair value
R’000
Fair value
R’000
At acquisition
Non-current assets 1 785 30 890
Property, plant and equipment – 30 890
Deferred tax 1 785 –
Current assets 4 750 –
Trade and other receivables 4 718 –
Bank balances 32 –
Non-current liabilities – 26 845
Other financial liabilities – 26 845
Current liabilities 6 531 4 045
Trade and other payables 5 899 4 045
Taxation 632 –
Net asset value acquired 4 –
Cost of acquisition – –
Previously recognised associate losses 1 150 –
Bargain purchase arising on acquisition (1 154) –
Revenue for the period since acquisition 2 453 19 887
Profit/(loss) after taxation since acquisition 6 714 (2 983)
Revenue for the period 1 March 2009 to 28 February 2010 2 453 –
Profit for the period 1 March 2009 to 28 February 2010 6 714 –
Revenue and losses of WERM are reported from the date of acquisition. It is impracticable to report from 1 March 2009
as not all the business operations were then acquired.
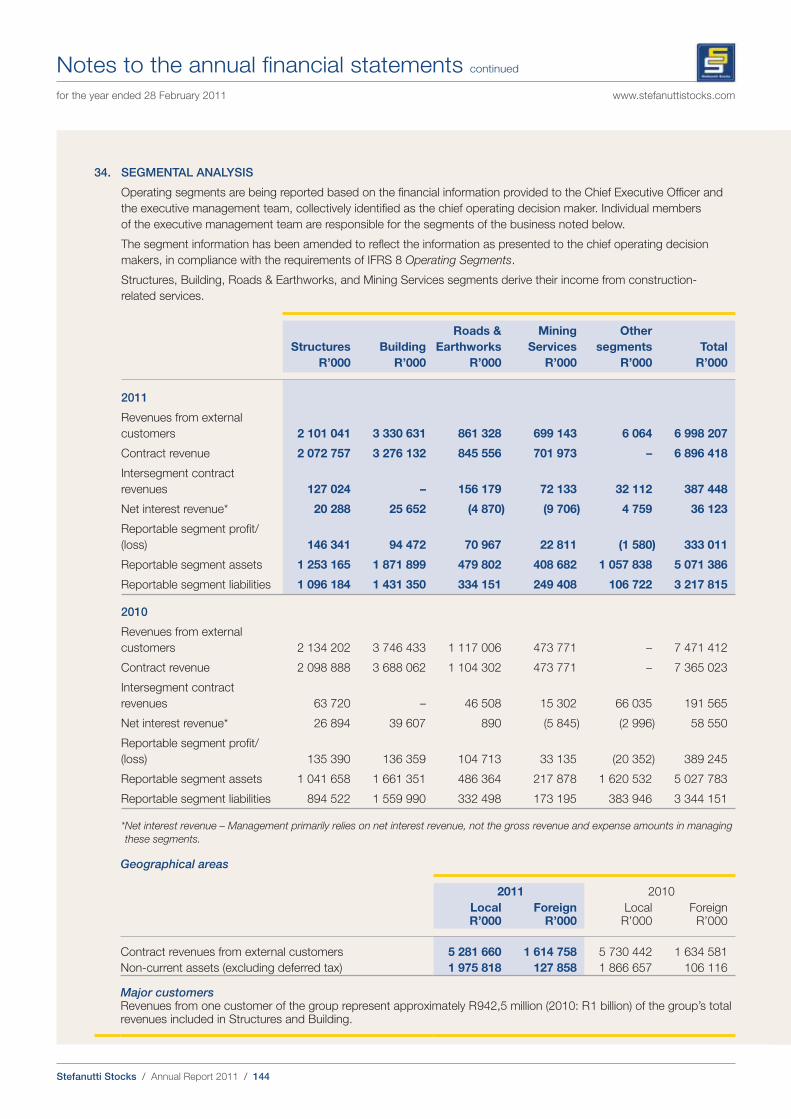
Stefanutti Stocks / Annual Report 2011 / 144
Notes to the annual financial statements continued
for the year ended 28 February 2011 www.stefanuttistocks.com
34. SEGMENTAL ANALYSIS
Operating segments are being reported based on the financial information provided to the Chief Executive Officer and
the executive management team, collectively identified as the chief operating decision maker. Individual members
of the executive management team are responsible for the segments of the business noted below.
The segment information has been amended to reflect the information as presented to the chief operating decision
makers, in compliance with the requirements of IFRS 8 Operating Segments.
Structures, Building, Roads & Earthworks, and Mining Services segments derive their income from construction-
related services.
Structures
R’000
Building
R’000
Roads &
Earthworks
R’000
Mining
Services
R’000
Other
segments
R’000
Total
R’000
2011
Revenues from external
customers 2 101 041 3 330 631 861 328 699 143 6 064 6 998 207
Contract revenue 2 072 757 3 276 132 845 556 701 973 – 6 896 418
Intersegment contract
revenues 127 024 – 156 179 72 133 32 112 387 448
Net interest revenue* 20 288 25 652 (4 870) (9 706) 4 759 36 123
Reportable segment profit/
(loss) 146 341 94 472 70 967 22 811 (1 580) 333 011
Reportable segment assets 1 253 165 1 871 899 479 802 408 682 1 057 838 5 071 386
Reportable segment liabilities 1 096 184 1 431 350 334 151 249 408 106 722 3 217 815
2010
Revenues from external
customers 2 134 202 3 746 433 1 117 006 473 771 – 7 471 412
Contract revenue 2 098 888 3 688 062 1 104 302 473 771 – 7 365 023
Intersegment contract
revenues 63 720 – 46 508 15 302 66 035 191 565
Net interest revenue* 26 894 39 607 890 (5 845) (2 996) 58 550
Reportable segment profit/
(loss) 135 390 136 359 104 713 33 135 (20 352) 389 245
Reportable segment assets 1 041 658 1 661 351 486 364 217 878 1 620 532 5 027 783
Reportable segment liabilities 894 522 1 559 990 332 498 173 195 383 946 3 344 151
* Net interest revenue – Management primarily relies on net interest revenue, not the gross revenue and expense amounts in managing
these segments.
Geographical areas
2011 2010
Local R’000
ForeignR’000
LocalR’000
ForeignR’000
Contract revenues from external customers 5 281 660 1 614 758 5 730 442 1 634 581
Non-current assets (excluding deferred tax) 1 975 818 127 858 1 866 657 106 116
Major customersRevenues from one customer of the group represent approximately R 942,5 million (2010: R 1 billion) of the group’s total revenues included in Structures and Building.
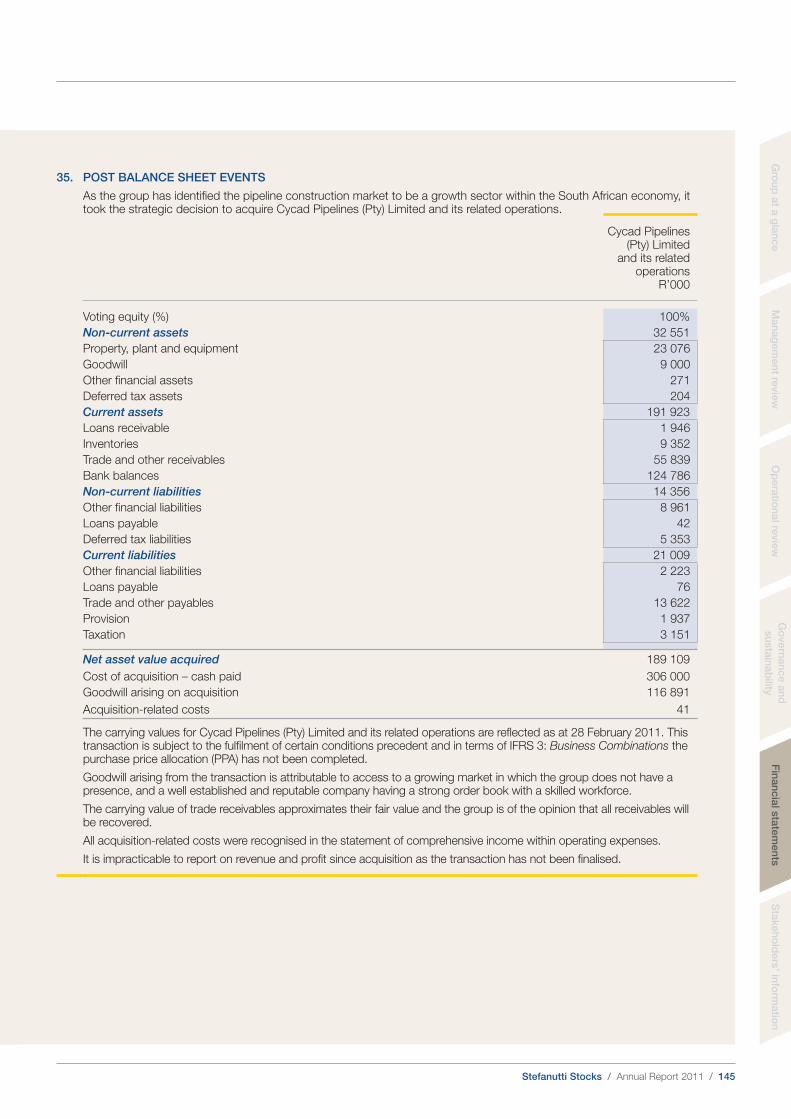
Stefanutti Stocks / Annual Report 2011 / 145
Gro
up
at a
gla
nce
Man
ag
em
en
t revie
wO
pera
tion
al re
vie
wG
overn
an
ce
an
d
su
sta
inab
ilityF
inan
cia
l sta
tem
en
tsS
takeh
old
ers
’ info
rmatio
n
35. POST BALANCE SHEET EVENTS
As the group has identified the pipeline construction market to be a growth sector within the South African economy, it took the strategic decision to acquire Cycad Pipelines (Pty) Limited and its related operations.
Cycad Pipelines(Pty) Limited
and its related operations
R’000
Voting equity (%) 100%
Non-current assets 32 551
Property, plant and equipment 23 076
Goodwill 9 000
Other financial assets 271
Deferred tax assets 204
Current assets 191 923
Loans receivable 1 946
Inventories 9 352
Trade and other receivables 55 839
Bank balances 124 786
Non-current liabilities 14 356
Other financial liabilities 8 961
Loans payable 42
Deferred tax liabilities 5 353
Current liabilities 21 009
Other financial liabilities 2 223
Loans payable 76
Trade and other payables 13 622
Provision 1 937
Taxation 3 151
Net asset value acquired 189 109
Cost of acquisition – cash paid 306 000
Goodwill arising on acquisition 116 891
Acquisition-related costs 41
The carrying values for Cycad Pipelines (Pty) Limited and its related operations are reflected as at 28 February 2011. This transaction is subject to the fulfilment of certain conditions precedent and in terms of IFRS 3: Business Combinations the purchase price allocation (PPA) has not been completed.
Goodwill arising from the transaction is attributable to access to a growing market in which the group does not have a presence, and a well established and reputable company having a strong order book with a skilled workforce.
The carrying value of trade receivables approximates their fair value and the group is of the opinion that all receivables will be recovered.
All acquisition-related costs were recognised in the statement of comprehensive income within operating expenses.
It is impracticable to report on revenue and profit since acquisition as the transaction has not been finalised.
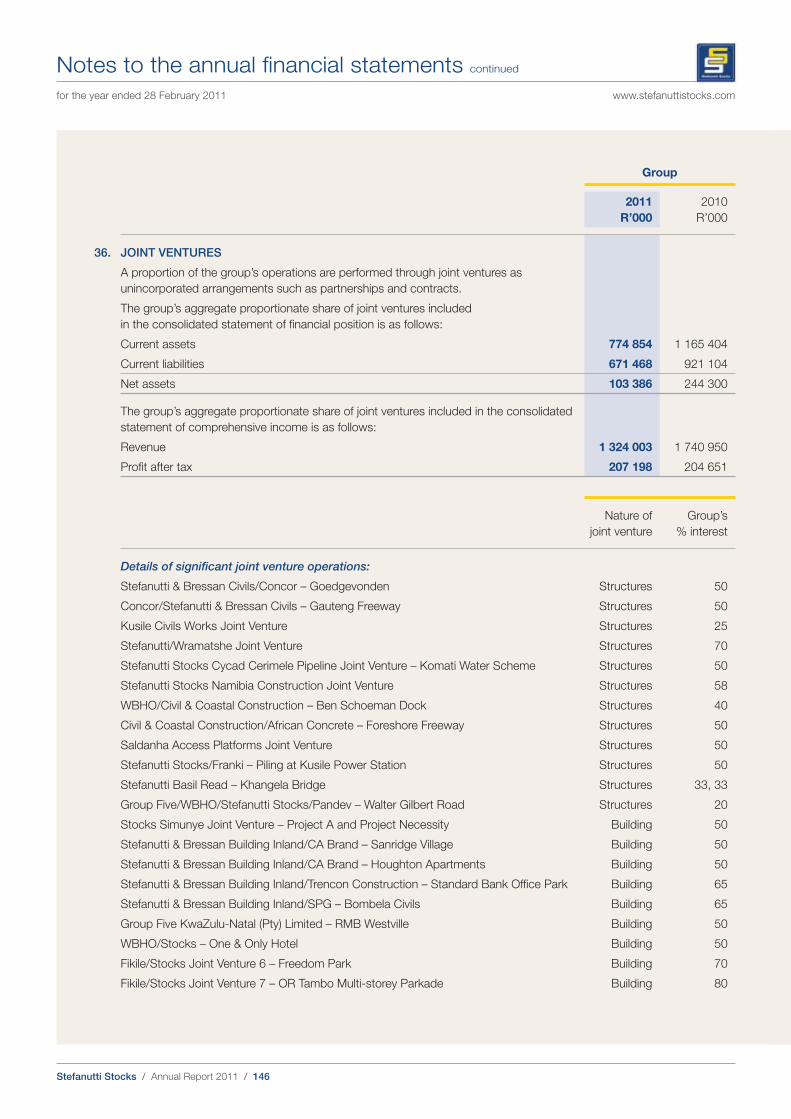
Stefanutti Stocks / Annual Report 2011 / 146
Notes to the annual financial statements continued
for the year ended 28 February 2011 www.stefanuttistocks.com
Group
2011
R’000
2010
R’000
36. JOINT VENTURES
A proportion of the group’s operations are performed through joint ventures as
unincorporated arrangements such as partnerships and contracts.
The group’s aggregate proportionate share of joint ventures included
in the consolidated statement of financial position is as follows:
Current assets 774 854 1 165 404
Current liabilities 671 468 921 104
Net assets 103 386 244 300
The group’s aggregate proportionate share of joint ventures included in the consolidated
statement of comprehensive income is as follows:
Revenue 1 324 003 1 740 950
Profit after tax 207 198 204 651
Nature of
joint venture
Group’s
% interest
Details of significant joint venture operations:
Stefanutti & Bressan Civils/Concor – Goedgevonden Structures 50
Concor/Stefanutti & Bressan Civils – Gauteng Freeway Structures 50
Kusile Civils Works Joint Venture Structures 25
Stefanutti/Wramatshe Joint Venture Structures 70
Stefanutti Stocks Cycad Cerimele Pipeline Joint Venture – Komati Water Scheme Structures 50
Stefanutti Stocks Namibia Construction Joint Venture Structures 58
WBHO/Civil & Coastal Construction – Ben Schoeman Dock Structures 40
Civil & Coastal Construction/African Concrete – Foreshore Freeway Structures 50
Saldanha Access Platforms Joint Venture Structures 50
Stefanutti Stocks/Franki – Piling at Kusile Power Station Structures 50
Stefanutti Basil Read – Khangela Bridge Structures 33, 33
Group Five/WBHO/Stefanutti Stocks/Pandev – Walter Gilbert Road Structures 20
Stocks Simunye Joint Venture – Project A and Project Necessity Building 50
Stefanutti & Bressan Building Inland/CA Brand – Sanridge Village Building 50
Stefanutti & Bressan Building Inland/CA Brand – Houghton Apartments Building 50
Stefanutti & Bressan Building Inland/Trencon Construction – Standard Bank Office Park Building 65
Stefanutti & Bressan Building Inland/SPG – Bombela Civils Building 65
Group Five KwaZulu-Natal (Pty) Limited – RMB Westville Building 50
WBHO/Stocks – One & Only Hotel Building 50
Fikile/Stocks Joint Venture 6 – Freedom Park Building 70
Fikile/Stocks Joint Venture 7 – OR Tambo Multi-storey Parkade Building 80
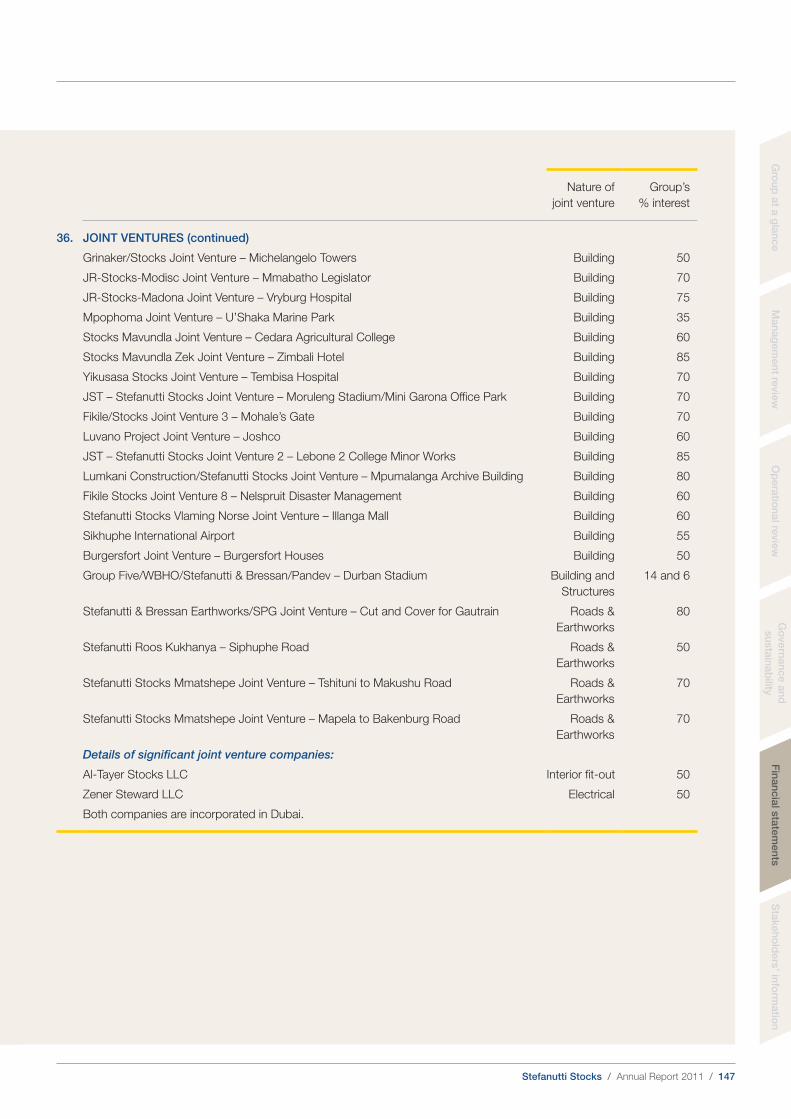
Stefanutti Stocks / Annual Report 2011 / 147
Gro
up
at a
gla
nce
Man
ag
em
en
t revie
wO
pera
tion
al re
vie
wG
overn
an
ce
an
d
su
sta
inab
ilityF
inan
cia
l sta
tem
en
tsS
takeh
old
ers
’ info
rmatio
n
Nature of
joint venture
Group’s
% interest
36. JOINT VENTURES (continued)
Grinaker/Stocks Joint Venture – Michelangelo Towers Building 50
JR-Stocks-Modisc Joint Venture – Mmabatho Legislator Building 70
JR-Stocks-Madona Joint Venture – Vryburg Hospital Building 75
Mpophoma Joint Venture – U’Shaka Marine Park Building 35
Stocks Mavundla Joint Venture – Cedara Agricultural College Building 60
Stocks Mavundla Zek Joint Venture – Zimbali Hotel Building 85
Yikusasa Stocks Joint Venture – Tembisa Hospital Building 70
JST – Stefanutti Stocks Joint Venture – Moruleng Stadium/Mini Garona Office Park Building 70
Fikile/Stocks Joint Venture 3 – Mohale’s Gate Building 70
Luvano Project Joint Venture – Joshco Building 60
JST – Stefanutti Stocks Joint Venture 2 – Lebone 2 College Minor Works Building 85
Lumkani Construction/Stefanutti Stocks Joint Venture – Mpumalanga Archive Building Building 80
Fikile Stocks Joint Venture 8 – Nelspruit Disaster Management Building 60
Stefanutti Stocks Vlaming Norse Joint Venture – Illanga Mall Building 60
Sikhuphe International Airport Building 55
Burgersfort Joint Venture – Burgersfort Houses Building 50
Group Five/WBHO/Stefanutti & Bressan/Pandev – Durban Stadium Building and
Structures
14 and 6
Stefanutti & Bressan Earthworks/SPG Joint Venture – Cut and Cover for Gautrain Roads &
Earthworks
80
Stefanutti Roos Kukhanya – Siphuphe Road Roads &
Earthworks
50
Stefanutti Stocks Mmatshepe Joint Venture – Tshituni to Makushu Road Roads &
Earthworks
70
Stefanutti Stocks Mmatshepe Joint Venture – Mapela to Bakenburg Road Roads &
Earthworks
70
Details of significant joint venture companies:
Al-Tayer Stocks LLC Interior fit-out 50
Zener Steward LLC Electrical 50
Both companies are incorporated in Dubai.
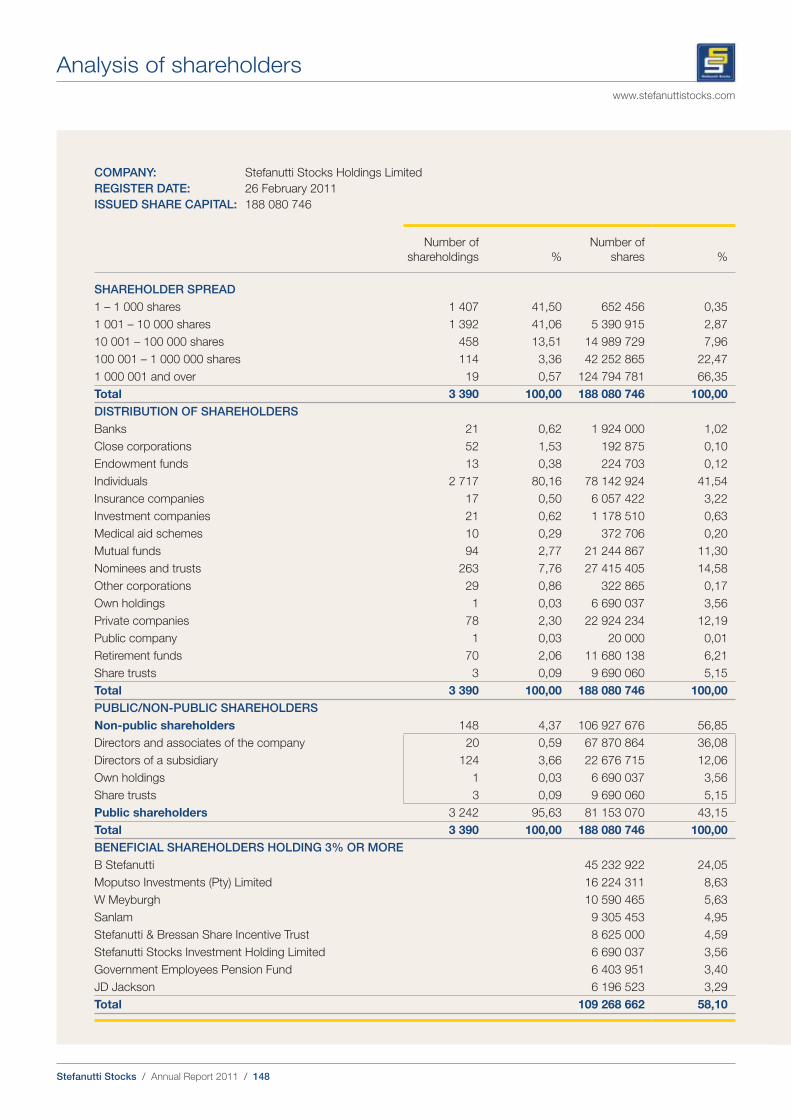
Stefanutti Stocks / Annual Report 2011 / 148
www.stefanuttistocks.com
Analysis of shareholders
COMPANY: Stefanutti Stocks Holdings Limited
REGISTER DATE: 26 February 2011
ISSUED SHARE CAPITAL: 188 080 746
Number of
shareholdings %
Number of
shares %
SHAREHOLDER SPREAD
1 – 1 000 shares 1 407 41,50 652 456 0,35
1 001 – 10 000 shares 1 392 41,06 5 390 915 2,87
10 001 – 100 000 shares 458 13,51 14 989 729 7,96
100 001 – 1 000 000 shares 114 3,36 42 252 865 22,47
1 000 001 and over 19 0,57 124 794 781 66,35
Total 3 390 100,00 188 080 746 100,00
DISTRIBUTION OF SHAREHOLDERS
Banks 21 0,62 1 924 000 1,02
Close corporations 52 1,53 192 875 0,10
Endowment funds 13 0,38 224 703 0,12
Individuals 2 717 80,16 78 142 924 41,54
Insurance companies 17 0,50 6 057 422 3,22
Investment companies 21 0,62 1 178 510 0,63
Medical aid schemes 10 0,29 372 706 0,20
Mutual funds 94 2,77 21 244 867 11,30
Nominees and trusts 263 7,76 27 415 405 14,58
Other corporations 29 0,86 322 865 0,17
Own holdings 1 0,03 6 690 037 3,56
Private companies 78 2,30 22 924 234 12,19
Public company 1 0,03 20 000 0,01
Retirement funds 70 2,06 11 680 138 6,21
Share trusts 3 0,09 9 690 060 5,15
Total 3 390 100,00 188 080 746 100,00
PUBLIC/NON-PUBLIC SHAREHOLDERS
Non-public shareholders 148 4,37 106 927 676 56,85
Directors and associates of the company 20 0,59 67 870 864 36,08
Directors of a subsidiary 124 3,66 22 676 715 12,06
Own holdings 1 0,03 6 690 037 3,56
Share trusts 3 0,09 9 690 060 5,15
Public shareholders 3 242 95,63 81 153 070 43,15
Total 3 390 100,00 188 080 746 100,00
BENEFICIAL SHAREHOLDERS HOLDING 3% OR MORE
B Stefanutti 45 232 922 24,05
Moputso Investments (Pty) Limited 16 224 311 8,63
W Meyburgh 10 590 465 5,63
Sanlam 9 305 453 4,95
Stefanutti & Bressan Share Incentive Trust 8 625 000 4,59
Stefanutti Stocks Investment Holding Limited 6 690 037 3,56
Government Employees Pension Fund 6 403 951 3,40
JD Jackson 6 196 523 3,29
Total 109 268 662 58,10
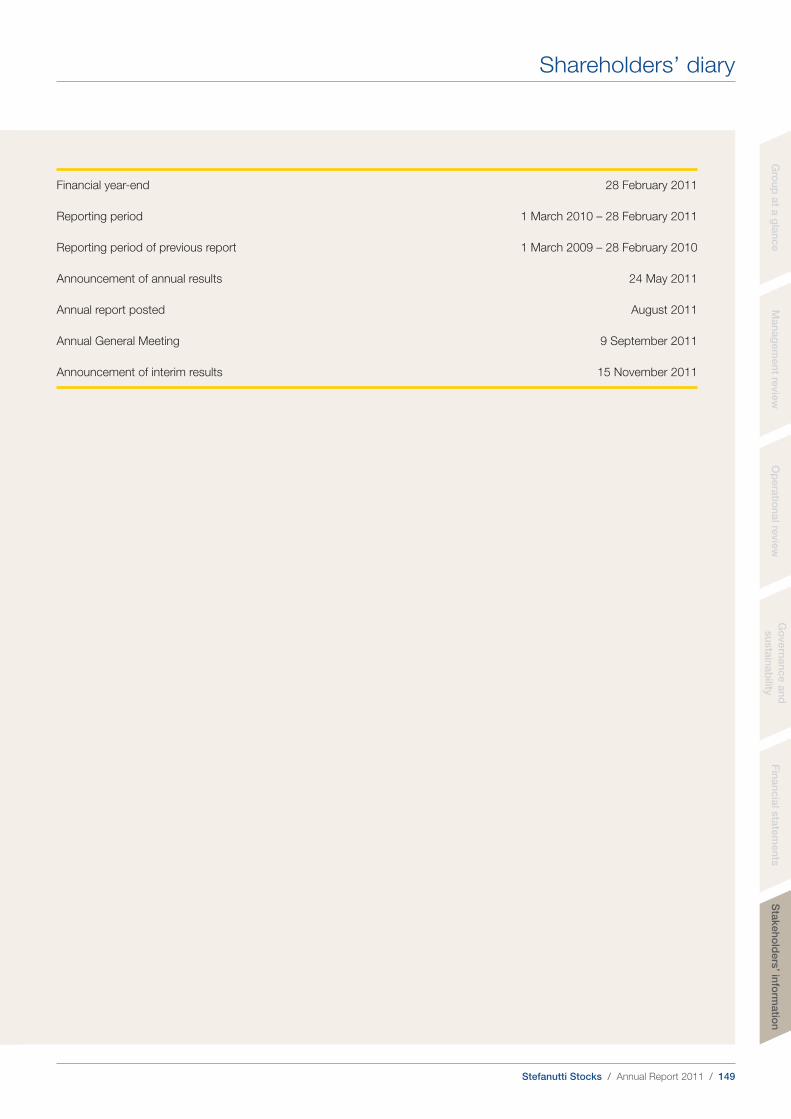
Stefanutti Stocks / Annual Report 2011 / 149
Gro
up
at a
gla
nce
Man
ag
em
en
t revie
wO
pera
tion
al re
vie
wG
overn
an
ce
an
d
su
sta
inab
ilityF
inan
cia
l sta
tem
en
tsS
takeh
old
ers
’ info
rmatio
n
Shareholders’ diary
Financial year-end 28 February 2011
Reporting period 1 March 2010 – 28 February 2011
Reporting period of previous report 1 March 2009 – 28 February 2010
Announcement of annual results 24 May 2011
Annual report posted August 2011
Annual General Meeting 9 September 2011
Announcement of interim results 15 November 2011
Stefanutti Stocks / Annual Report 2011 / 150
www.stefanuttistocks.com
Stefanutti Stocks Holdings Limited
(Registration number 1996/003767/06)
Share code: SSK
ISIN: ZAE000123766
(“Stefanutti Stocks” or “the company”)
Notice is hereby given to the shareholders of the company as at 25 July 2011, being the record date to receive notice of the
Annual General Meeting in terms of section 59(1)(a) of the Companies Act No 71 of 2008, as amended (Companies Act), that
the Annual General Meeting of Stefanutti Stocks will be held at No 9 Palala Street, Protec Park, corner Zuurfontein Avenue
and Oranjerivier Drive, Kempton Park on Friday, 9 September 2011 at 12:00, to (i) consider and, if deemed fit to pass, with
or without modification, the following ordinary and special resolutions, in the manner required by the Companies Act, as read
with the JSE Limited (JSE) Listings Requirements (JSE Listings Requirements); and (ii) deal with such other business as may
lawfully be dealt with at the meeting, which meeting is to be participated in and voted at by shareholders registered as such
as at 2 September 2011, being the record date to participate in and vote at the Annual General Meeting in terms of section
62(3)(a), read with section 59(1)(b), of the Companies Act.
NB: Section 63(1) of the Companies Act – Identification of meeting participants
Kindly note that meeting participants (including proxies) are required to provide reasonably satisfactory
identification before being entitled to attend or participate in a shareholders’ meeting. Forms of identification
include valid identity documents, drivers’ licences and passports.
ORDINARY RESOLUTIONS
Ordinary resolution 1: Adoption of annual financial statements
“RESOLVED THAT the annual financial statements of the company for the year ended 28 February 2011, including the
directors’ report and the report of the Audit, Governance and Risk Committee, be and are hereby received and adopted.”
Ordinary resolution 2: Re-election of director
“RESOLVED THAT KR Eborall, who retires by rotation in terms of the memorandum of incorporation of the company and
who is eligible and available for re-election, be re-elected as a director of the company.”
A brief curriculum vitae in respect of KR Eborall is included on page 6 of the annual report of which this notice forms part.
Ordinary resolution 3: Re-election of director
“RESOLVED THAT H Mashaba, who retires by rotation in terms of the memorandum of incorporation of the company and
who is eligible and available for re-election, be re-elected as a director of the company.”
A brief curriculum vitae in respect of H Mashaba is included on page 6 of the annual report of which this notice forms part.
Ordinary resolution 4: Re-election of director
“RESOLVED THAT B Stefanutti, who retires by rotation in terms of the memorandum of incorporation of the company and
who is eligible and available for re-election, be re-elected as a director of the company.”
A brief curriculum vitae in respect of B Stefanutti is included on page 6 of the annual report of which this notice forms part.
Ordinary resolution 5: Appointment of auditors
“RESOLVED THAT Mazars be and are hereby reappointed as auditors of the company for the ensuing financial year and the
directors be and are hereby authorised to fix the remuneration of the auditors.
Notice of Annual General Meeting
Stefanutti Stocks / Annual Report 2011 / 151
Gro
up
at a
gla
nce
Man
ag
em
en
t revie
wO
pera
tion
al re
vie
wG
overn
an
ce
an
d
su
sta
inab
ility
Ordinary resolution 6: Appointment of Audit, Governance and Risk Committee members
“RESOLVED THAT the members of the company’s Audit, Governance and Risk Committee set out below be and are hereby
appointed with effect from the end of this meeting in terms of section 94(2) of the Companies Act. The membership as
proposed by the board of directors is NJMG Canca and KR Eborall, both of whom are independent non-executive directors.”
At the time of finalisation of this notice of Annual General Meeting, the company was in the process of identifying a suitable
candidate to be appointed as a director and as the third member of the Audit, Governance and Risk Committee.
Shareholders will be advised once this appointment is finalised. Confirmation of the person’s appointment as a director and
as a member of the committee will be sought at the next Annual General Meeting.
Ordinary resolution 7: Unissued ordinary shares
“RESOLVED THAT all the authorised but unissued ordinary shares in the capital of the company be and are hereby placed at
the disposal and under the control of the directors, and that the directors be and are hereby authorised to allot, issue and
otherwise to dispose of all or any of such shares at their discretion, in terms of and subject to the provisions of the
Companies Act and the JSE Listings Requirements and subject to the proviso that the aggregate number of ordinary shares
which may be allotted and issued in terms of this ordinary resolution 7 shall be limited to 15% (fifteen percent) of the number
of ordinary shares in issue from time to time.”
A majority of the votes cast by all shareholders present, or represented by proxy at the Annual General Meeting, will be
required to approve this resolution.
Ordinary resolution 8: Signature of documentation
“RESOLVED THAT a director of the company or the Company Secretary be and is authorised to sign all such documentation
and do all such things as may be necessary for or incidental to the implementation of ordinary resolutions 1, 2, 3, 4, 5, 6 and
7 and special resolutions number 1 and 2 which are passed by the shareholders.”
SPECIAL RESOLUTIONS
Special resolution 1: Directors’ fees
“RESOLVED THAT payment to the non-executive directors of the following fees for services as directors with effect from the
date of this Annual General Meeting until the date of the next Annual General Meeting be authorised:
Fees per
meeting
Rand
Non-executive director 40 250
Audit, Governance and Risk Committee chairman 75 000
Audit, Governance and Risk Committee member 40 250
Remuneration and Nominations Committee chairman 40 250
Remuneration and Nominations Committee member 23 000
B-BBEE Transformation Committee chairman 30 000
B-BBEE Transformation Committee member 16 000
Mergers, Acquisitions and Disposals Committee chairman 30 000
Mergers, Acquisitions and Disposals Committee member 16 000
Any other committees to be formed:
Committee chairman 30 000
Committee member 16 000
Fin
an
cia
l sta
tem
en
tsS
takeh
old
ers
’ info
rmatio
n

Stefanutti Stocks / Annual Report 2011 / 152
www.stefanuttistocks.com
The non-executive chairman is paid an annual fee of R 840 000 and a monthly retainer of R 90 000 which is subject to annual
review by the Remuneration and Nominations Committee.
The Lead Independent Director’s annual fee amounts to R 648 000.
Extraordinary services are paid at a rate of R 1 600 per hour.”
Reason for and effect of special resolution 1
The reason for special resolution 1 is to comply with the provisions of the Companies Act. The effect of the special resolution
is that, if approved by the shareholders at the Annual General Meeting, the fees payable to non-executive directors until the
next Annual General Meeting will be as set out above. Executive directors are not remunerated for their services as directors
but are remunerated as employees of the company.
The above rates have been proposed to ensure that the remuneration of non-executive directors remains competitive in
order to enable the company to retain and attract persons of the calibre, appropriate capabilities, skills and experience
required in order to make meaningful contributions to the company.
Special resolution 2 – Financial assistance
“RESOLVED THAT to the extent required by the Companies Act, the board of directors of the company may, subject to
compliance with the requirements of the company’s memorandum of incorporation, the Companies Act and the JSE Listings
Requirements, each as presently constituted and as amended from time to time, authorise the company to provide direct or
indirect financial assistance by way of loan, guarantee, the provision of security or otherwise, to:
any of its present or future subsidiaries and/or any other company or corporation that is or becomes related or inter-
related to the company for any purpose or in connection with any matter, including, but not limited to, acquisition of or
subscription for any option or any securities issued or to be issued by the company or a related or inter-related
company, or for the purchase of any securities of the company or a related or inter-related company; and
any of its present or future directors or prescribed officers (or any person related to any of them or to any company or
corporation related or inter-related to any of them), or to any other person who is a participant in any of the company’s
or group of companies’ share or other employee incentive schemes, for the purpose of, or in connection with, the
acquisition of or subscription for any option or any securities issued or to be issued by the company or a related or
inter-related company, or for the purchase of any securities of the company or a related or inter-related company, where
such financial assistance is provided in terms of any such scheme that does not satisfy the requirements of section
97 of the Companies Act, such authority to endure until the annual general meeting of the company for the year ended
February 2012.”
Reason for and effect of special resolution 2
Notwithstanding the title of section 45 of the Companies Act, being “Loans or other financial assistance to directors”, on a
proper interpretation, the body of the section may also apply to financial assistance provided by a company to related or
inter-related companies and corporations, including, inter alia, its subsidiaries, for any purpose.
Furthermore, section 44 of the Companies Act may also apply to the financial assistance so provided by a company to
related or inter-related companies, in the event that the financial assistance is provided for the purpose of, or in connection
with, the acquisition or subscription for any option, or any securities, issued or to be issued by the company or a related or
inter-related company, or for the purchase of any securities of the company or a related or inter-related company.
Notice of Annual General Meeting continued
Stefanutti Stocks / Annual Report 2011 / 153
Gro
up
at a
gla
nce
Man
ag
em
en
t revie
wO
pera
tion
al re
vie
wG
overn
an
ce
an
d
su
sta
inab
ility
Both sections 44 and 45 of the Companies Act provide, inter alia, that the particular financial assistance must be provided
only pursuant to a special resolution of the shareholders, adopted within the previous 2 (two) years, which approved such
assistance either for the specific recipient, or generally for a category of potential recipients, and the specific recipient falls
within that category and the board of directors must be satisfied that:
immediately after providing the financial assistance, the company would satisfy the solvency and liquidity test; and
the terms under which the financial assistance is proposed to be given are fair and reasonable to the company.
The company would like the ability to provide financial assistance, if necessary, also in other circumstances, in accordance
with section 45 of the Companies Act. Furthermore, it may be necessary or desirous for the company to provide financial
assistance to related or inter-related companies and corporations to acquire or subscribe for options or securities or
purchase securities of the company or another company related or inter-related to it. Under the Companies Act, the
company will, however, require the special resolution referred to above to be adopted. In the circumstances and in order to,
inter alia, ensure that the company’s subsidiaries and other related and inter-related companies and corporations have
access to financing and/or financial backing from the company (as opposed to banks), it is necessary to obtain the approval
of shareholders, as set out in special resolution 2.
Sections 44 and 45 contain exemptions in respect of employee share schemes that satisfy the requirements of section 97 of
the Companies Act. To the extent that any of the company’s share or other employee incentive schemes do not satisfy such
requirements, financial assistance (as contemplated in sections 44 and 45) to be provided under such schemes will, inter
alia, also require approval by special resolution. Accordingly, special resolution number 2 authorises financial assistance to
any of the company’s directors or prescribed officers (or any person related to any of them or to any company or corporation
related or inter-related to them), or to any other person who is a participant in any of the company’s share or other employee
incentive schemes, in order to facilitate their participation in any such schemes that do not satisfy the requirements of section
97 of the Companies Act.
Any matters raised by shareholders, with or without advance notice to the company
To deal, at the Annual General Meeting, with any matters raised by shareholders, with or without advance notice to the
company.
VOTING AND PROXIES
A shareholder of the company entitled to attend and vote at the Annual General Meeting is entitled to appoint one or more
proxies (who need not be a shareholder of the company) to attend, vote and speak in his/her stead. On a show of hands,
every shareholder of the company present in person or represented by proxy shall have one vote only. On a poll, every
shareholder of the company present in person or represented by proxy shall have one vote for every share held in the
company by such shareholder.
Dematerialised shareholders who have elected own-name registration in the sub-register through a Central Securities
Depository Participant (CSDP) and who are unable to attend but wish to vote at the Annual General Meeting, should
complete and return the attached form of proxy and lodge it with the transfer secretaries of the company.
Shareholders who have dematerialised their shares through a CSDP or broker rather than through own-name registration
and who wish to attend the Annual General Meeting must instruct their CSDP or broker to issue them with the necessary
authority to attend.
Fin
an
cia
l sta
tem
en
tsS
takeh
old
ers
’ info
rmatio
n
Stefanutti Stocks / Annual Report 2011 / 154
www.stefanuttistocks.com
If such shareholders are unable to attend, but wish to vote at the Annual General Meeting, they should timeously provide
their CSDP or broker with their voting instructions in terms of the custody agreement entered into between that shareholder
and his/her CSDP or broker.
Forms of proxy may also be obtained on request from the company’s registered office. The completed forms of proxy must
be deposited at, posted or faxed to the transfer secretaries at the address below, to be received at least 24 hours prior to
the meeting.
Any member who completes and lodges a form of proxy will nevertheless be entitled to attend and vote in person at the
Annual General Meeting should the member subsequently decide to do so.
By order of the board
W Somerville
Company Secretary
18 July 2011
Registered office
No 9 Palala Street
Protec Park
Corner of Zuurfontein Avenue and Oranjerivier Drive
Kempton Park
1619
(PO Box 12394, Aston Manor, 1630)
Telephone: +27 11 571 4300
Transfer secretaries
Computershare Investor Services (Pty) Limited
70 Marshall Street
Johannesburg
2001
(PO Box 61051, Marshalltown, 2107)
Telephone: +27 11 370 5000
Fax: +27 11 688 5238
Notice of Annual General Meeting continued

Stefanutti Stocks / Annual Report 2011 / 155
Gro
up
at a
gla
nce
Man
ag
em
en
t revie
wO
pera
tion
al re
vie
wG
overn
an
ce
an
d
su
sta
inab
ility
Stefanutti Stocks Holdings Limited(Registration number 1996/003767/06)Share code: SSKISIN: ZAE000123766(“Stefanutti Stocks” or “the company”)
For use at the Annual General Meeting of the company to be held at No 9 Palala Street, Protec Park, corner of Zuurfontein Avenue and Oranjerivier Drive, Kempton Park on Friday, 9 September 2011 at 12:00 and at any adjournment thereof.
For use by the holders of the company’s certificated ordinary shares and/or dematerialised ordinary shares held through a Central Securities Depository Participant (CSDP) or broker who have selected own-name registration (own-name dematerialised shareholders). Additional forms of proxy are available from the transfer secretaries of the company.
Not for the use by holders of the company’s dematerialised ordinary shares who are not own-name dematerialised shareholders. Such shareholders must contact their CSDP or broker timeously if they wish to attend and vote at the Annual General Meeting and request that they be issued with the necessary letter of representation to do so, or provide the CSDP or broker timeously with their voting instructions should they not wish to attend the Annual General Meeting in order for the CSDP or broker to vote thereat in accordance with their instructions.
I/We (Full name in block letters)
of (address)
being a member(s) of Stefanutti Stocks and holding ordinary shares in the company,
hereby appoint of
failing him/her of
failing him/her the chairman of the Annual General Meeting, as my/our proxy to act for me/us and on my/our behalf at the Annual General Meeting which will be held for the purpose of considering and, if deemed fit, passing, with or without modification, the special and ordinary resolutions to be proposed thereat and at any adjournment thereof; and to vote for and/or against the special and ordinary resolutions and/or abstain from voting in respect of the Stefanutti Stocks ordinary shares registered in my/our name(s), in accordance with the following instructions:
Number of votes
For Against Abstain
Ordinary resolutions
1. To adopt the annual financial statements of the company for the year ended 28 February 2011, including the directors’ report and the report of the Audit, Governance and Risk Committee
2. To re-elect KR Eborall as a director of the company
3. To re-elect H Mashaba as a director of the company
4. To re-elect B Stefanutti as a director of the company
5. To reappoint the auditors and to fix their remuneration
6. To appoint members of the Audit, Governance and Risk Committee:
6.1 To appoint NJMG Canca as a member of the Audit, Governance and Risk Committee
6.2 To appoint KR Eborall as a member of the Audit, Governance and Risk Committee
7. To place unissued shares under directors’ control
8. To authorise the directors or the Company Secretary to sign documentation
Special resolutions
1. To approve the fees of non-executive directors
2. To approve financial assistance
* Please indicate with an “X” in the appropriate spaces above how you wish your votes to be cast. Unless otherwise instructed,
my/our proxy may vote as he/she thinks fit.
Signed at (place) on (date) 2011
Member’s signature assisted by (if applicable)
Form of proxy
Fin
an
cia
l sta
tem
en
tsS
takeh
old
ers
’ info
rmatio
n
Stefanutti Stocks / Annual Report 2011 / 156
www.stefanuttistocks.com
1. This form of proxy is to be completed only by those members who are:
(a) holding shares in a certificated form; or
(b) recorded in the sub-register in electronic form in their own name.
2. Members who have dematerialised their shares, other than own-name dematerialised shareholders, and who wish to
attend the Annual General Meeting must contact their CSDP or broker who will furnish them with the necessary letter of
representation to attend the Annual General Meeting, or they must instruct their CSDP or broker as to how they wish to
vote in this regard. This must be done in terms of the agreement entered into between the members and their CSDP or
broker.
3. Each member is entitled to appoint one or more individuals as a proxy (who need not be a member(s) of the company)
to participate in, speak and, on a poll, vote in place of that member at the Annual General Meeting.
4. A member wishing to appoint a proxy must do so in writing by inserting the name of a proxy or the names of two
alternative proxies of the member’s choice on the form of proxy in the space provided, with or without deleting “the
chairman of the Annual General Meeting”. The person whose name stands first on the form of proxy and who is present
at the Annual General Meeting will be entitled to act as proxy to the exclusion of those whose names follow.
5. A member’s instructions to the proxy must be indicated on the form of proxy by the insertion of the relevant number of
votes exercisable by that member in the appropriate box(es) provided. Failure to comply with the above will be deemed
to authorise the chairman of the Annual General Meeting, if the chairman is the authorised proxy, to vote in favour of the
ordinary and special resolutions at the Annual General Meeting, or any other proxy to vote or to abstain from voting at
the Annual General Meeting as he/she deems fit, in respect of all the member’s votes exercisable thereat.
6. A member or his/her proxy is not obliged to vote in respect of all the ordinary shares held by such member or
represented by such proxy, but the total number of votes for or against the ordinary resolutions and in respect of which
any abstention is recorded may not exceed the total number of votes to which the member or his/her proxy is entitled.
7. Documentary evidence establishing the authority of a person signing this form of proxy in a representative capacity
must be attached to this form of proxy, unless previously recorded by the company’s transfer office or waived by the
chairman of the Annual General Meeting.
8. The chairman of the Annual General Meeting may reject or accept any form of proxy which is completed and/or
received other than in accordance with these instructions, provided that he is satisfied as to the manner in which a
member wishes to vote.
9. Any alterations or corrections to this form of proxy must be initialled by the signatory(ies).
10. The completion and lodging of this form of proxy will not preclude the relevant member from attending the Annual
General Meeting and speaking and voting in person thereat to the exclusion of any proxy appointed in terms hereof,
should such member wish to do so.
11. A minor must be assisted by his/her parent/guardian unless the relevant documents establishing his/her legal capacity
are produced or have been registered by the company’s transfer secretaries.
12. Where there are joint holders of any shares, only that holder whose name appears first in the register in respect of such
shares need sign this form of proxy.
13. Any proxy appointment made in terms of this form of proxy remains valid until the end of the Annual General Meeting,
unless revoked earlier.
14. Shareholders are requested to lodge forms of proxy with the transfer secretaries at the address given below at least
24 hours prior to the meeting:
Computershare Investor Services (Pty) Limited
Ground Floor, 70 Marshall Street, Johannesburg, 2001
PO Box 61051, Marshalltown, 2107
Telephone: +27 11 370 5000
Fax: +27 11 688 5238
Notes to the form of proxy
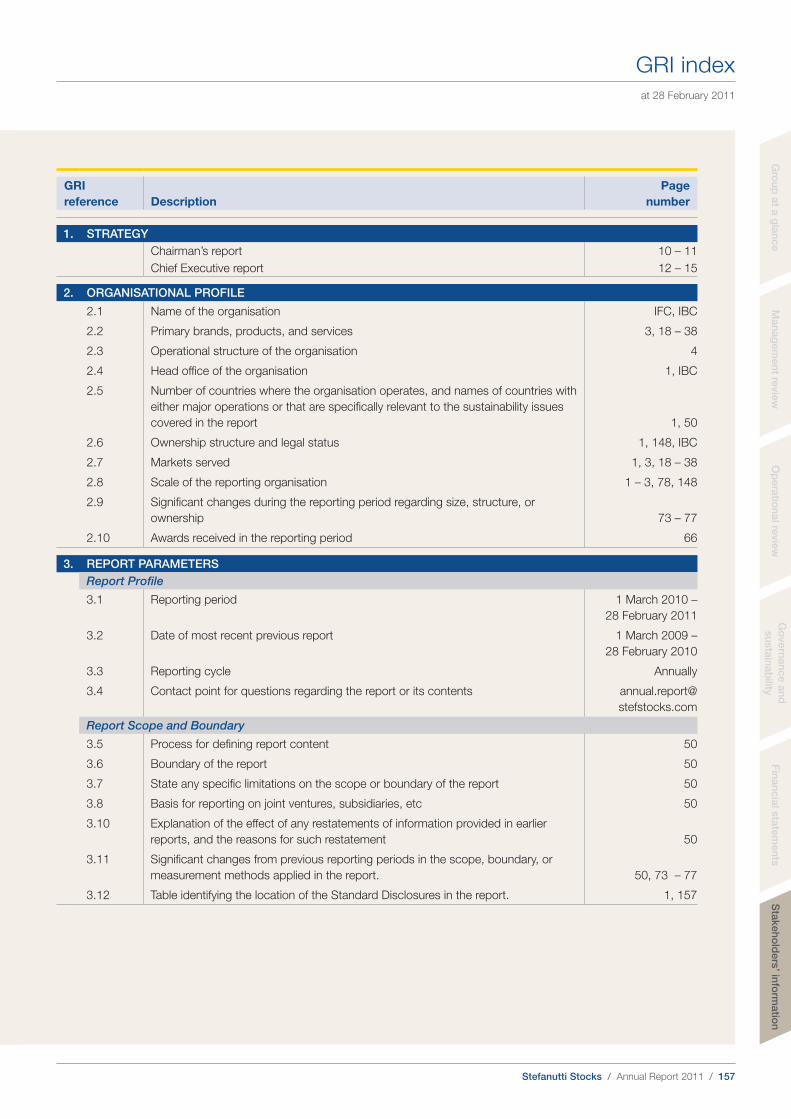
Stefanutti Stocks / Annual Report 2011 / 157
Gro
up
at a
gla
nce
Man
ag
em
en
t revie
wO
pera
tion
al re
vie
wG
overn
an
ce
an
d
su
sta
inab
ility
GRI
reference Description
Page
number
1. STRATEGY
Chairman’s report 10 – 11
Chief Executive report 12 – 15
2. ORGANISATIONAL PROFILE
2.1 Name of the organisation IFC, IBC
2.2 Primary brands, products, and services 3, 18 – 38
2.3 Operational structure of the organisation 4
2.4 Head office of the organisation 1, IBC
2.5 Number of countries where the organisation operates, and names of countries with
either major operations or that are specifically relevant to the sustainability issues
covered in the report 1, 50
2.6 Ownership structure and legal status 1, 148, IBC
2.7 Markets served 1, 3, 18 – 38
2.8 Scale of the reporting organisation 1 – 3, 78, 148
2.9 Significant changes during the reporting period regarding size, structure, or
ownership 73 – 77
2.10 Awards received in the reporting period 66
3. REPORT PARAMETERS
Report Profile
3.1 Reporting period 1 March 2010 –
28 February 2011
3.2 Date of most recent previous report 1 March 2009 –
28 February 2010
3.3 Reporting cycle Annually
3.4 Contact point for questions regarding the report or its contents annual.report@
stefstocks.com
Report Scope and Boundary
3.5 Process for defining report content 50
3.6 Boundary of the report 50
3.7 State any specific limitations on the scope or boundary of the report 50
3.8 Basis for reporting on joint ventures, subsidiaries, etc 50
3.10 Explanation of the effect of any restatements of information provided in earlier
reports, and the reasons for such restatement 50
3.11 Significant changes from previous reporting periods in the scope, boundary, or
measurement methods applied in the report. 50, 73 – 77
3.12 Table identifying the location of the Standard Disclosures in the report. 1, 157
at 28 February 2011
GRI index
Fin
an
cia
l sta
tem
en
tsS
takeh
old
ers
’ info
rmatio
n
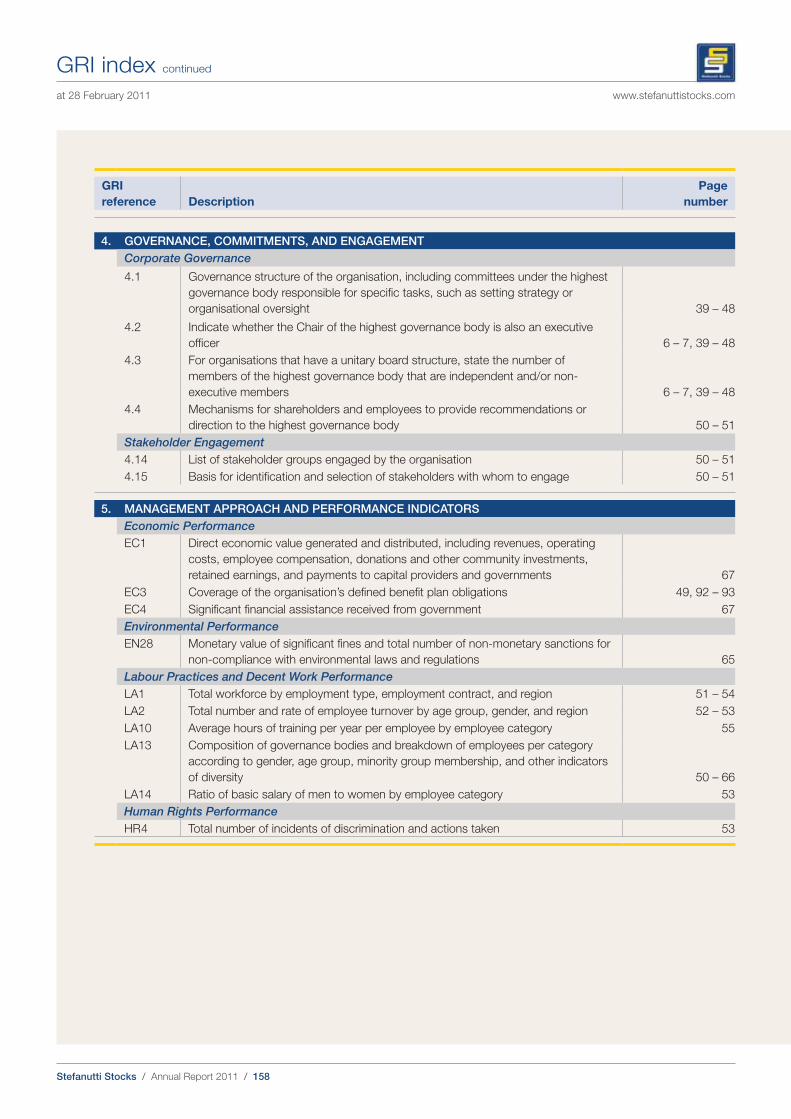
Stefanutti Stocks / Annual Report 2011 / 158
www.stefanuttistocks.com
GRI
reference Description
Page
number
4. GOVERNANCE, COMMITMENTS, AND ENGAGEMENT
Corporate Governance
4.1 Governance structure of the organisation, including committees under the highest
governance body responsible for specific tasks, such as setting strategy or
organisational oversight 39 – 48
4.2 Indicate whether the Chair of the highest governance body is also an executive
officer 6 – 7, 39 – 48
4.3 For organisations that have a unitary board structure, state the number of
members of the highest governance body that are independent and/or non-
executive members 6 – 7, 39 – 48
4.4 Mechanisms for shareholders and employees to provide recommendations or
direction to the highest governance body 50 – 51
Stakeholder Engagement
4.14 List of stakeholder groups engaged by the organisation 50 – 51
4.15 Basis for identification and selection of stakeholders with whom to engage 50 – 51
5. MANAGEMENT APPROACH AND PERFORMANCE INDICATORS
Economic Performance
EC1 Direct economic value generated and distributed, including revenues, operating
costs, employee compensation, donations and other community investments,
retained earnings, and payments to capital providers and governments 67
EC3 Coverage of the organisation’s defined benefit plan obligations 49, 92 – 93
EC4 Significant financial assistance received from government 67
Environmental Performance
EN28 Monetary value of significant fines and total number of non-monetary sanctions for
non-compliance with environmental laws and regulations 65
Labour Practices and Decent Work Performance
LA1 Total workforce by employment type, employment contract, and region 51 – 54
LA2 Total number and rate of employee turnover by age group, gender, and region 52 – 53
LA10 Average hours of training per year per employee by employee category 55
LA13 Composition of governance bodies and breakdown of employees per category
according to gender, age group, minority group membership, and other indicators
of diversity 50 – 66
LA14 Ratio of basic salary of men to women by employee category 53
Human Rights Performance
HR 4 Total number of incidents of discrimination and actions taken 53
GRI index continued
at 28 February 2011
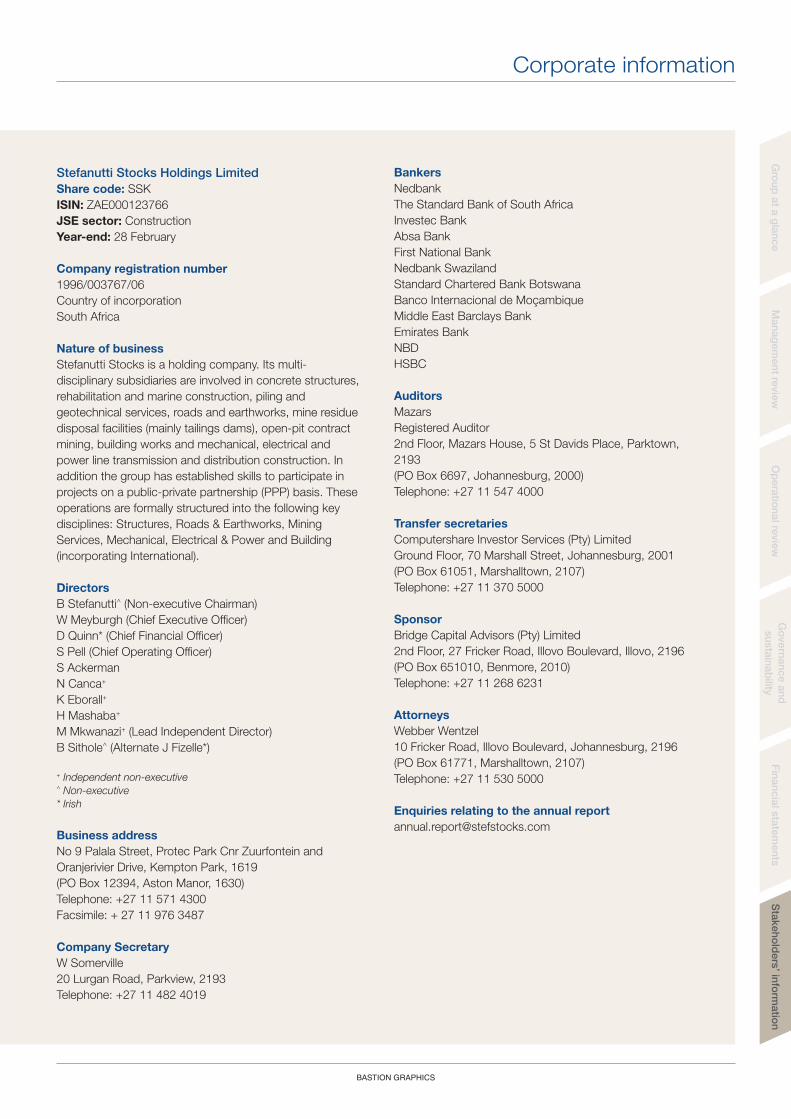
Gro
up
at a
gla
nce
Man
ag
em
en
t revie
wO
pera
tion
al re
vie
wG
overn
an
ce
an
d
su
sta
inab
ility
Stefanutti Stocks Holdings Limited
Share code: SSK
ISIN: ZAE000123766
JSE sector: Construction
Year-end: 28 February
Company registration number
1996/003767/06
Country of incorporation
South Africa
Nature of business
Stefanutti Stocks is a holding company. Its multi-
disciplinary subsidiaries are involved in concrete structures,
rehabilitation and marine construction, piling and
geotechnical services, roads and earthworks, mine residue
disposal facilities (mainly tailings dams), open-pit contract
mining, building works and mechanical, electrical and
power line transmission and distribution construction. In
addition the group has established skills to participate in
projects on a public-private partnership (PPP) basis. These
operations are formally structured into the following key
disciplines: Structures, Roads & Earthworks, Mining
Services, Mechanical, Electrical & Power and Building
(incorporating International).
Directors
B Stefanutti^ (Non-executive Chairman)
W Meyburgh (Chief Executive Officer)
D Quinn* (Chief Financial Officer)
S Pell (Chief Operating Officer)
S Ackerman
N Canca+
K Eborall+
H Mashaba+
M Mkwanazi+ (Lead Independent Director)
B Sithole^ (Alternate J Fizelle*)
+ Independent non-executive^ Non-executive
* Irish
Business address
No 9 Palala Street, Protec Park Cnr Zuurfontein and
Oranjerivier Drive, Kempton Park, 1619
(PO Box 12394, Aston Manor, 1630)
Telephone: +27 11 571 4300
Facsimile: + 27 11 976 3487
Company Secretary
W Somerville
20 Lurgan Road, Parkview, 2193
Telephone: +27 11 482 4019
Bankers
Nedbank
The Standard Bank of South Africa
Investec Bank
Absa Bank
First National Bank
Nedbank Swaziland
Standard Chartered Bank Botswana
Banco Internacional de Moçambique
Middle East Barclays Bank
Emirates Bank
NBD
HSBC
Auditors
Mazars
Registered Auditor
2nd Floor, Mazars House, 5 St Davids Place, Parktown,
2193
(PO Box 6697, Johannesburg, 2000)
Telephone: +27 11 547 4000
Transfer secretaries
Computershare Investor Services (Pty) Limited
Ground Floor, 70 Marshall Street, Johannesburg, 2001
(PO Box 61051, Marshalltown, 2107)
Telephone: +27 11 370 5000
Sponsor
Bridge Capital Advisors (Pty) Limited
2nd Floor, 27 Fricker Road, Illovo Boulevard, Illovo, 2196
(PO Box 651010, Benmore, 2010)
Telephone: +27 11 268 6231
Attorneys
Webber Wentzel
10 Fricker Road, Illovo Boulevard, Johannesburg, 2196
(PO Box 61771, Marshalltown, 2107)
Telephone: +27 11 530 5000
Enquiries relating to the annual report
BASTION GRAPHICS
Corporate information
Fin
an
cia
l sta
tem
en
tsS
takeh
old
ers
’ info
rmatio
n

www.stefanuttistocks.com