bridging the gap: understanding the academic preparation of high school graduates for college...
TRANSCRIPT

Bridging the Gap: Understanding the Academic Preparation of High School
Graduates for College Admission
Rick Kroc, University of ArizonaScott Andrew Schulz, University of
Southern California
2008 AIR Forum – Seattle, Washington

Background and Purpose
• Purpose of Today’s Presentation:– Provide a framework for
institutions/institutional systems to gauge eligibility in states where student data is not currently collected annually

Background and Purpose
• Eligibility is defined as the percentage of Arizona high school graduates who meet the criteria for university admission
• Eligibility is an important part of the access pipeline– Underrepresented populations– Changes to university admission criteria– Accountability measures– Enrollment projections and demand studies

Arizona Tri-University Admission Standards
http://www.abor.asu.edu/3_for_students/admissions%20policy2-old.pdf

Project History
• Arizona Board of Regents has commissioned the state’s three public universities to collect/analyze student eligibility every few years
• Studies have analyzed 1989, 1996, 1998, 2002, and 2006 Arizona high school transcripts
• Database containing high school course-level data available for modeling the impact of policy changes
Selecting a Sample
• -Wanted a stratified sample with at least a 95% confidence interval– Needed at least n = 400 for each ethnic group
• Calculations based on anticipated grad rate and response rates– Grad rate for students entering senior year reported by
state to be 87% – Response rate assumed to be about 70%, ended up
being 73%
• Budget constraints

Established Multipliers
Asian Black Hispanic Native Am White Total
12TH GRADE ENROLLMENT 2005-2006 805 1,337 9,224 2,092 13,761 27,219
Asian Black Hispanic Native Am White Total
Anticipated 12th Grade Graduation Rate (87%) 700
1,163 8,025 1,820
11,972
23,681
Asian Black Hispanic Native Am White Total
Expected Response Rate (70%) 490
814 5,617 1,274
8,380
16,576
Transcripts Requested Asian Black Hispanic Native Am White Total
All (1) 490 (526)
All (1) 814 (749)
1 of 9 (.11) 618 (615)
1 of 2 (.5) 637 (617)
1 of 13 (.0769) 645 (762)
3,204
(3269)

Permission and Credibility
• School District Offices of Institutional Research
• Letters of Support– Superintendent of Public Instruction– UA Office of Enrollment Research

Packets Mailed
• Addressed to School Principals
• Included Instructions for Transcript Selection
• Follow-up Phone Calls and Reminder Cards
• Consistent Credibility Challenge
Findings
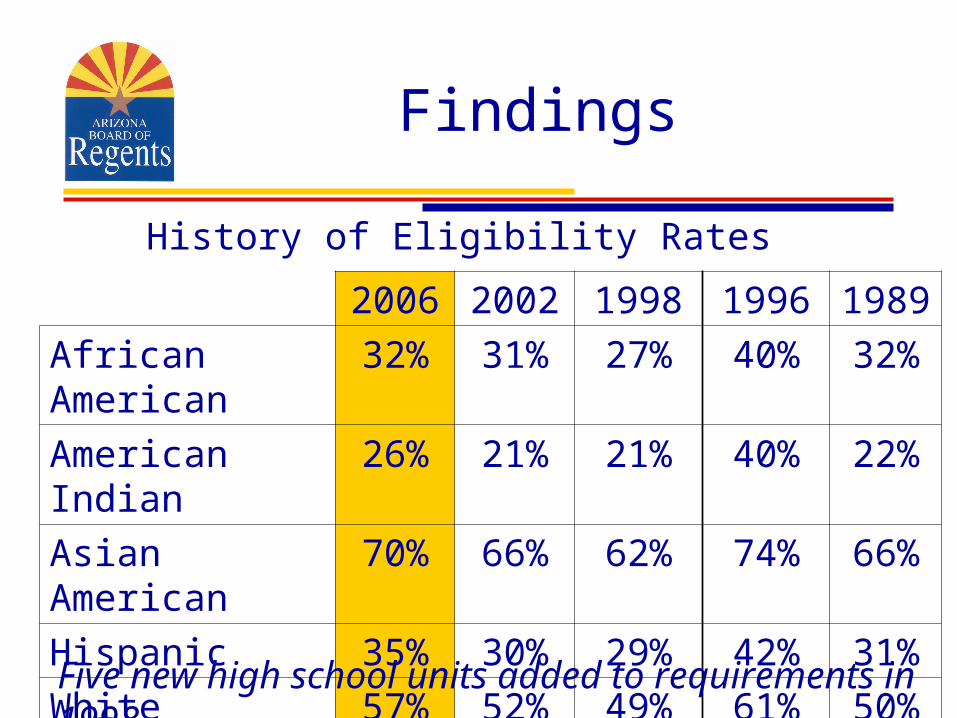
2006 2002 1998 1996 1989
African American 32% 31% 27% 40% 32%
American Indian 26% 21% 21% 40% 22%
Asian American 70% 66% 62% 74% 66%
Hispanic 35% 30% 29% 42% 31%
White 57% 52% 49% 61% 50%
Total 48% 44% 42% 55% 44%
History of Eligibility Rates
Five new high school units added to requirements in 1998

Findings
Arizona High School GraduatesEligible for Assured and Delegated Admission
47.9%
56.5%
35.3%
70.3%
25.7%32.4%
0%
10%
20%
30%
40%
50%
60%
70%
80%
90%
100%
AfricanAmerican
AmericanIndian
AsianAmerican
Hispanic White Total
Pe
rce
nt
Elig
ible
Delegated Assured

Findings
Eng Math Sci Soc Sci Lang Arts
African Am. 70% 27% 47% 77% 47% 74%
Am. Indian 66% 20% 49% 73% 37% 64%
Asian Am. 86% 68% 82% 92% 75% 91%
Hispanic 65% 26% 50% 78% 51% 71%
White 81% 48% 69% 89% 64% 87%
Total 75% 40% 62% 84% 59% 81%
Completion Rate for 2006 Eligible Graduates

Findings
41.8%
53.8%
0%
10%
20%
30%
40%
50%
60%
70%
80%
90%
100%
Female Male
Eligibility by Gender

Findings
81%84%
59%62%
40%
75%
19%
1%
16%16%
22%
6%
15%26%22%39%19%
0%
10%
20%
30%
40%
50%
60%
70%
80%
90%
100%
English Math Science Language SocialStudies
Fine Arts
Meets Requirement One Deficiency Does Not Meet Requirement
Total Competency Area Attainment
Findings
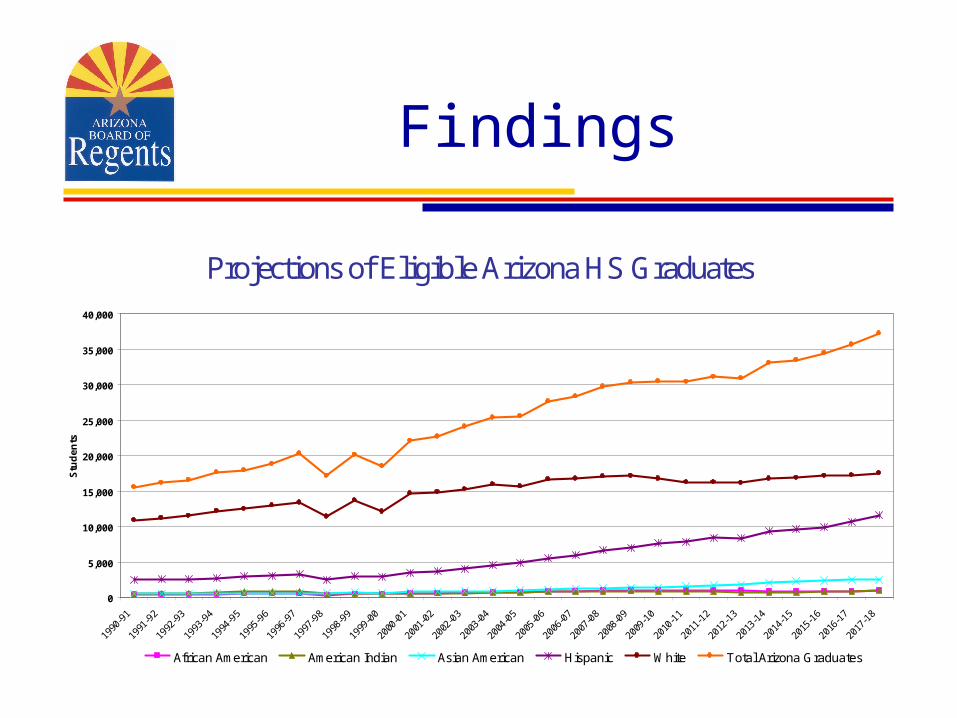
Projections of Eligible Arizona HS Graduates
0
5,000
10,000
15,000
20,000
25,000
30,000
35,000
40,000
1990
-91
1991
-92
1992
-93
1993
-94
1994
-95
1995
-96
1996
-97
1997
-98
1998
-99
1999
-00
2000
-01
2001
-02
2002
-03
2003
-04
2004
-05
2005
-06
2006
-07
2007
-08
2008
-09
2009
-10
2010
-11
2011
-12
2012
-13
2013
-14
2014
-15
2015
-16
2016
-17
2017
-18
Stu
de
nts
African American American Indian Asian American Hispanic White Total Arizona Graduates

Conclusions
• Eligibility has improved for all ethnic groups since 2002, but substantial gaps continue to exist
• Women’s eligibility rates continue to be substantially higher than rates for men
• Eligibility rates in rural areas of Arizona lag behind rates in Maricopa and Pima Counties

Conclusions
• Completion of the required units of math would have the greatest impact on eligibility, followed by completion of the science and foreign language requirements
• Enrollment projections based on current eligibility rates are consistent with those made previously for university system and statewide planning purposes

Questions and Comments???
Presentation available at: http://www.usc.edu/cerpp
Click on: CERPP Presentations