bridging the gap between physiology and behavior: evidence ... · bridging the gap between...
TRANSCRIPT

Bridging the Gap Between Physiology and Behavior:Evidence From the sSoTS Model of Human Visual Attention
Eirini Mavritsaki, Dietmar Heinke, and Harriet AllenUniversity of Birmingham
Gustavo DecoUniversitat Pompeu Fabra
Glyn W. HumphreysUniversity of Birmingham
We present the case for a role of biologically plausible neural network modeling in bridging the gapbetween physiology and behavior. We argue that spiking-level networks can allow “vertical” translationbetween physiological properties of neural systems and emergent “whole-system” performance—enabling psychological results to be simulated from implemented networks and also inferences to bemade from simulations concerning processing at a neural level. These models also emphasize particularfactors (e.g., the dynamics of performance in relation to real-time neuronal processing) that are nothighlighted in other approaches and that can be tested empirically. We illustrate our argument fromneural-level models that select stimuli by biased competition. We show that a model with biasedcompetition dynamics can simulate data ranging from physiological studies of single-cell activity (Study1) to whole-system behavior in human visual search (Study 2), while also capturing effects at anintermediate level, including performance breakdown after neural lesion (Study 3) and data from brainimaging (Study 4). We also show that, at each level of analysis, novel predictions can be derived from thebiologically plausible parameters adopted, which we proceed to test (Study 5). We argue that, at least forstudying the dynamics of visual attention, the approach productively links single-cell to psychological data.
Keywords: visual search, integrate-and-fire neurons, computational model, fMRI, neuropsychology
Understanding human cognition is difficult. One of the difficul-ties is that cognition can be described at many different levels—from the high-level computational principles that may shape thelandscape within which processes must function, through to thephysiological principles by which neurons operate. How can thesedifferent levels best be related? Marr (1982) provided an influen-tial framework in which different levels of analysis were de-scribed. This framework separated out, on the one hand, theoriesdealing with the computational principles and the neural hardware,from, on the other, “midlevel” theories that deal with abstractalgorithms, which could operate on a variety of platforms (com-puters as well as human brains). However, what was not specifiedin this framework was how we move between the different levels;indeed, the levels were described as operating in a quasi-independentmanner. This means that, within the framework, it is possible to havean algorithmic account of cognition that is separated from constraints
based on neural-level functions, as well as neural-level accountsunconstrained by data derived from the operation of componentcognitive processes. This leaves unspecified how we may link theo-ries dealing with abstract psychological mechanisms (attention, mem-ory, decision making) to theories that are concerned with how neuronscommunicate. It also means that the benefits that might be gainedfrom this linkage are unexploited; theoretical insights at one level donot infiltrate other levels. The aim of this article is to describe anapproach to develop links between physiology and high-level behav-ior through the use of formal neural models. Our argument is illus-trated by an attempt to develop a neural-level model of human visualattention, which we show can capture effects at different levels ofanalysis (from single-cell electrophysiology through to whole-systempsychological experiments). We go on to show that the interactionbetween modeling and empirical studies can be a two-way process byderiving and testing new empirical predictions that emerge from thedynamic processes introduced by modeling at the neural level. Weargue that formal, neural models can provide a means of unifying thelevels of description outlined by Marr and that there is empiricalvalidation for this approach when applied to human visual attention.
Defining Cognitive Subsystems
Since its inception in the 1960s, cognitive psychology has madeadvances in our understanding of human cognition by breakingdown “whole-system” behavior into distinct components. A vari-ety of empirical approaches have been proposed in attempts tobreak down whole-system behavior into underlying component
Eirini Mavritsaki, Dietmar Heinke, Harriet Allen, and Glyn W. Hum-phreys, School of Psychology, University of Birmingham, Birmingham,England; Gustavo Deco, Department of Technology, Computational Neu-roscience, Institucio Catalana de Recerca i Estudis Avancats (ICREA),Universitat Pompeu Fabra, Barcelona, Spain.
This work was supported by the Biotechnology and Biology and Med-ical Research Councils, United Kingdom, the EU Framework 6 (Decisionsin Motion), and the Royal Society.
Correspondence concerning this article should be addressed to Glyn W.Humphreys, School of Psychology, University of Birmingham, Birming-ham, B15 2TT, England. E-mail: [email protected]
Psychological Review © 2011 American Psychological Association2011, Vol. 118, No. 1, 3–41 0033-295X/11/$12.00 DOI: 10.1037/a0021868
3

processes—including additive factors logic (Sternberg, 1969), thepsychological refractory period (Pashler, 2000), and studies ofbrain lesioned patients. A common aim of these approaches is todefine processing in terms of a series of stages, and then to test theimpact of different factors on the contrasting stages. Consider aneuropsychological example. After damage to posterior parietalcortex (PPC), patients can present with the problem of extinction;the patients are able to respond to a single stimulus presented onthe side contralateral to their lesion but fail to detect the same itemwhen another stimulus is presented simultaneously on the ipsile-sional side (Karnath, 1988). This deficit can be understood interms of the patients suffering from spatial biases when simulta-neous stimuli compete for selection (Duncan, Humphreys, &Ward, 1997). The lesion suffered by the patients biases selection infavor of stimuli appearing on the ipsilesional side. This does nothave serious consequences on selection when the contralesionalstimulus is the only item in the field, but it does when thecontralesional stimulus must compete for selection with the ipsile-sional item; in this case, the contralesional stimulus loses and isextinguished. This result is consistent with a deficit at a stage ofvisual selection that “weights” stimuli according to their positionsin space (e.g., Bundesen, 1990). The effects of different variableshave then been defined in terms of whether they affect the limitedselection process in the patients. For example, there have beenseveral demonstrations that extinction can be reduced when stimuliin the contra- and ipsilesional fields group on the basis of localGestalt properties such as collinearity, connectedness, and good-ness of shape (e.g., Humphreys, 1998; Mattingley, Davis, &Driver, 1997; Ward, Goodrich, & Driver, 1994). These effects ofGestalt grouping can be contrasted with failures to find benefitsfrom associative coding between objects (Humphreys, 1998; Rid-doch, Humphreys, Edwards, Baker, & Willson, 2003). From this itfollows that Gestalt grouping cues may influence processing priorto visual selection, whilst higher level associative coding is influ-ential at a postselection stage.
For the most part, additive factors logic, the psychologicalrefractory period, and even neuropsychological procedures areapplied independently of any constraints derived from neural-levelinvestigations—indeed, a basic tenet of the emergent discipline ofcognitive neuropsychology in the 1980s was that the nature andneural locus of the lesion was irrelevant for understanding thefunctional deficit suffered by the patient (Mehler, Morton, &Jusczyk, 1984). This stance is encouraged by the view that differ-ent levels of theoretical description are quasi-independent. Theproblem here, though, is that these levels of description are ulti-mately not isolated from one another, and we need to find ways ofcrossing from one level to other, to use constraints at one level toinform theories at other levels.
Interactivity Across Levels
We can illustrate the importance of constraints from differentlevels of theory using, again, an example from studies of extinc-tion. Although it has been demonstrated that patients with extinc-tion can remain sensitive to the properties of stimuli in the extin-guished field (Humphreys, 1998), it is not easy to deduce frombehavioral data alone that these properties are processed normally.Patients are frequently slow to respond and make errors at stimulusexposures where controls remain at ceiling. To equate performance
levels, to compare the relative magnitude of an effect, will oftenmean that there are major data reductions imposed on controls; theconsequence is that the limitations on controls and patients may bedifferent in kind.
This problem of assessing whether processing is normal or notcan be helped by using converging evidence from a different levelof analysis. For example, studies of functional brain imagingprovide information about the activation of neurons in brain areasknown to respond to low or higher level stimulus properties. Byassessing whether activation in these low or higher level regions isnormal, we gain new information that can complement the behav-ioral data. Of interest here are studies focusing on undamagedareas of the brain, where activation is not directly compromised bythe lesion. Functional magnetic resonance imaging (fMRI) studiesof extinction have shown that, although striate and extrastriatecortex in the lesioned hemisphere can be spared and are activatedby stimuli that are extinguished, this activation is reduced relativeto cases where single stimuli appear on the contralesional side(Ress, Backus, & Heeger, 2000). Such data suggest that the PPCinteracts with “earlier” cortical regions (striate and extrastriatecortex), with feedback from parietal cortex being important for thenormal operation of those earlier regions. When a parietal lesionweakens feedback within one hemisphere, spatial biases in selec-tion emerge. Note that a critical new piece of evidence is intro-duced here by brain imaging. There is a vast literature showing thatstriate and extrastriate ventral cortex respond to basic properties ofvisual stimuli and likely support the first stages of pattern andobject recognition. Knowing this, we can then infer that the re-duced selection capacity associated with parietal extinctionemerges out of weakened modulation of earlier visual processing.Furthermore, if modulation is partial rather than being all-or-none,then it is possible for extinguished stimuli to enter into groupingand to activate higher level representations, but any such activationwill be weaker than in the unlesioned state. Grouping effects maybe present, but they are not necessarily normal in strength.
A further functional point brought out by this example is thatprocessing appears not to operate in a completely feedforwardfashion, because recurrent feedback from PPC seems necessary tobalance competition across the fields. Apparently even the “sim-ple” detection of a stimulus can depend on dynamic interactionsbetween cortical regions. As well as promoting the idea of differ-ent levels of analysis, Marr (1982) was also influential in propos-ing a feedforward approach to information processing, emphasiz-ing that the visual system should extract as much information aspossible in a purely bottom-up manner. However, at a neural level,backward connections are at least as numerous as feedforward con-nections (Mumford, 1992), and, as the extinction example illustrates,there are good grounds for supposing that these feedback connectionshave a necessary function in cognition. To understand informationprocessing, we need to understand the dynamic contributions fromfeedforward and feedback processes over time, and this involves morethan a one-sweep feedforward computation.
Computational Modeling in a Connectionist Framework
One way to understand how interactions take place betweendifferent component processes is to build models of the compo-nents and to simulate the emergent whole-system behavior. Overthe past twenty years or so, we have learned a good deal about how
4 MAVRITSAKI, HEINKE, ALLEN, DECO, AND HUMPHREYS

component processes may combine to generate whole-system re-sponses through computational modeling (Bundesen, Habekost, &Kyllingsbaek, 2005; Grossberg & Grunewald, 1997; Leveille,Versace, & Grossberg, 2010). Particularly relevant here is thedevelopment of connectionist modeling as a way to capture themicrogenesis of processing. Connectionist models have attemptedto introduce some aspects of biological plausibility into cognitivepsychology. The models use many units that compute relativelysimple functions and communicate by passing activation betweenunits. The influence of one unit on the other units to which itconnects is modulated by the strength of the connection betweenthe units, and the strength of this connection can be tuned bylearning. Within such models both the temporal dynamics and theinteractivity of information processing may be approximated moreclosely. Our concern is with modeling visual attention, whereseveral connectionist models have been put forward (e.g., Pouget& Bavelier, 2007; Tsotsos, Culhane, Wai, Davis, & Nuflo, 1995).In one example, the selective attention for identification model(SAIM; Heinke & Humphreys, 2003), feedback from storedknowledge units is used to modulate the competition betweenvisual inputs to be represented in a focus of attention. Presentingmultiple objects in the field increases the competition and slowsthe rate at which a target enters into a focus of attention, simulatingthe lengthening of reaction times (RTs) in multiple-object searchtasks (Heinke, Humphreys, & Tweed, 2006). Feedback from theknowledge units can bias attention to spread across features thattogether activate a common stored representation, and this top-down activity can override spatial reductions in input, as mightoccur in patients with visual extinction, so that effects of groupingmay emerge despite the spatial reductions. Interestingly, groupingin this model is a product of top-down feedback, contrary to theinference that grouping in extinction reflects processes operatingin a bottom-up manner.
However, as far as providing a link to real neuronal processes isconcerned, these models leave much to be desired. Due to the lackof an explicit link between connectionist models and the underly-ing neurophysiological substrate, the dynamical evolution of thechanges in network states (e.g., from a level of spontaneousactivity through to an emergent response to a stimulus) and thedescription of inherent network fluctuations are not necessarilycaptured in a way that reflects real neuronal behavior. An exampleof this is that temporal parameters in such models are typicallydivorced from the temporal properties of real neurons, making itdifficult to predict how operations at the whole-system level ofbehavior may reflect dynamic changes at a neural level. Here weshow that, by modeling at a neural level, a direct link can be forgedbased on the temporal parameters of neurons.
Toward Modeling Real Neural Networks
Critical Properties of Real Neuronal Networks
What are the properties of real neuronal networks that may becritical for developing models that link physiology to behavior?Indeed, is there a specific level of modeling that would work in thisrespect, or are we on a course for infinite regress, with thephysiological level itself not being enough and with explanationsneeding to operate further down again, say at a molecular level? Aswe try to elaborate below, we are not arguing for infinite regress.
Rather we are arguing for there being a rational level of analysisbased on the physiological operation of single neurons that can begeneralized in a direct (mathematically tractable) manner intosubnetworks of neurons, which can then be related to psycholog-ical functions. Moreover, in developing and applying the modelsthat incorporate the critical physiological properties, we believethat important emergent issues are made explicit, which we at-tempt to illustrate through our modeling of human visual attention.Our work highlights three emergent issues related to (a) the timingof neuronal processes, (b) the nature of neural degeneration, and(c) the decomposition of neural networks revealed through neural-imaging data (e.g., fMRI). We also go on to outline new predic-tions for whole-system behavior that we test. We argue that,though these issues could be raised in higher level models, they arenot brought to the fore in quite such a direct way. Importantly, theissues are not just relevant to data collected at the physiologicallevel but also to data speaking to the component processes isolatedby cognitive psychologists.
So, what might be an appropriate level of analysis to enable anexplicit bridge to be built from physiology to behavior? Wepropose that, on the one hand, models need to take into accountthose neuronal and synaptic mechanisms that are well character-ized by a large amount of physiological and anatomical data. Onthe other hand, the description should be simple enough to enableus to infer by abstraction the first principles or computationalcorrelates of the brain function(s) under study. In this respect, it isnot sufficient for simulations “merely” to reproduce psychologicaland neurophysiological phenomena (see the discussion in Heinke& Mavritsaki, 2009). Simulation, without elucidation of a compu-tational mechanism, will tell us little more than what we alreadyknow from observing highly complex biological systems in ac-tion—not to mention the fact that we are then set the problem ofestablishing free parameters in the absence of biological or com-putational constraints (see Heinke & Mavritsaki, 2009). The mainaim of computational neuroscience is, rather, to provide a theoret-ical framework for formulating explicitly our theoretical assump-tions in the light of observed experimental constraints (at bothphysiological and psychological levels of analysis). In this sense,we are faced with an inverse problem: We have to extract the freeparameters of a system that cannot be measured directly (e.g., theconnectivity between the thousands of neurons making up anyplausible subnetwork) but that can be inferred by (a) studying thedynamical capabilities of the system and (b) looking for regionswithin a parameter space that generate an emergent behaviorconsistent with the experimentally measured observations.
We assume that a proper level of description at the microscopiclevel is captured by the spiking and synaptic dynamics assumingone-compartment, point-like models, like integrate-and-fire-models. The operations in such models are based on plausiblebiophysical constants (for conductances, response latencies, etc.),which can then be used for studying the realistic time scales andfiring rates involved in the evolution of the neural activity under-lying cognition. The resulting functions can be contrasted withexperimental data. We believe that this is essential for severalreasons:
1. The brain is a dynamical system that is exquisitely sensitiveto the different underlying spiking and synaptic latencies. For thisreason, it is convenient to include a thorough description of thedifferent latencies for synaptic activity by implementing models
5BRIDGING THE GAP BETWEEN PHYSIOLOGY AND BEHAVIOR

with plausible properties for synaptic receptors (e.g., the fast andslow excitatory receptors [AMPA and NMDA] and GABA-inhibitory receptors).
2. A temporally realistic, detailed level of description of synap-tic activity is required to capture data at different levels of descrip-tion, including neuroimaging as well as behavioral data. For ex-ample, simulations of fMRI data should involve the realisticcalculation of blood-oxygen level-dependent (BOLD) signals thatare intrinsically linked to synaptic dynamics (see Logothetis, 2008;Logothetis, Pauls, Augath, Trinath, & Oeltermann, 2001).
3. In manipulating integrate-and-fire neurons we can considerthe influence of neurotransmitters and pharmacological manipula-tions (e.g., the influence of dopamine on NMDA and GABAreceptor dynamics; Durstewitz, Seamans, & Sejnowski, 2000;Zheng, Zhang, Bunney, & Shi, 1999), to study the effect on bothglobal network dynamics and the related cortical functions (e.g.,working memory; Brunel & Wang, 2001).
Now, because models at this level explicitly incorporate differ-ent neurotransmitter functions, because they show specific timecourses of neuronal firing (and delays in responding) using timeconstants taken from real neurons, and because they naturallyincorporate neuronal noise, then the models begin to show howthese issues are critical for understanding cognition. The modelsalso provide a pathway for going from single-cell to whole-systembehavior, which we illustrate.
To make concrete our arguments, we draw on studies into themodeling of visual attention we have conducted using neural-levelmodels that exploit the idea that attentional selection operatesthrough biased competition (Duncan et al., 1997). When multiplestimuli are presented, the items compete to control behavior.Which stimuli are “selected” to control behavior is determined byboth bottom-up factors (e.g., the local contrast between an itemand its surround) and top-down factors (e.g., the goals of the task),which bias the competition between the items. These bottom-upand top-down biases are captured in neural-level models that cansimulate results ranging from single-cell recordings through tomeasures of human visual search. In Studies 1 and 2 we introducethe models and show how single-cell and whole-system behaviorcan be captured. In Studies 3 and 4 we present modeling results onthe effects of brain lesion and on simulating neuroimaging data,which capture emergent results brought about by neural-levelmodeling. In each of these studies, we show how the modelingwork gives rise to new qualitative predictions about how humanselection should vary as a critical parameter of the model is varied.Importantly, the parameters in question reflect the adoption ofbiologically plausible assumptions at a spiking level. In Study 5 weput these predictions to empirical test. The results show howmodeling can play a key role at the center of cognitive neuro-science, directing new research, simulating existing results, andintegrating findings across different levels.
Spiking Models
Spiking-level neurons are complex and computationally expen-sive to implement. One way, then, to explore the implications ofprocesses operating at the spiking level is to incorporate multipleneurons into one module within a larger computational system thatoperates using a different principle (e.g., using a higher levelconnectionist format) and to examine how the operation of the
spiking units impacts on the whole. An example of this comesfrom the work of Usher and colleagues (Usher & Davelaar, 2002;Usher & McClelland, 2001). These investigators were specificallyinterested in the role of the subcortical nucleus, the locus coeruleus(LC), in regulating human attention and memory (see also Nieu-wenhuis, Gilzenrat, Holmes, & Cohen, 2005). The LC is known toexhibit specific patterns of response in relation to the occurrence oftarget stimuli, with a stimulus-locked phasic response being dis-tinguished from tonic (nonstimulus locked) activity. This activitycan also be linked to the release of the neurotransmitter norepi-nephrine, which in turn regulates higher level cortical responsesinvolved in decision making. Usher, Cohen, Servan-Schreiber,Rajkowski, and Aston-Jones (1999) first modeled the operation ofthe LC in terms of a reduced version of a nonlinear spiking systemwith two variables1 that captured the fast phasic and slow tonicmodes of operation. Activity from their LC was fed into a rela-tively simple connectionist model, whose job was to make either ago or a no-go decision to a given input. Both the connectionist partof the system and the LC part received perceptual input and fedactivity into the perceptual and response layers of the connectionistmodel, with output from the LC part altering the gain of theactivation function within the connectionist model. These simula-tions show that it is possible to integrate a relatively simplespiking-level model, with its accompanying dynamic characteris-tics, with a connectionist model, and the resulting simulations mayenable us to understand better variations in detection and memoryover time in direct relation to changes in LC activity.
However, there are limitations to such hybrid models. Mostnotably, it is not possible to take the system as a whole and to mapit onto physiological data, as the connectionist part of the modeldoes not mimic the activation functions found in real neurons. Insome sense, the model provides an existence proof that thespiking-level module can have the demonstrated functional effecton another system making detection and recognition responses, butit does not show that the detection and recognition processesthemselves operate in this way in a real biological system. Wecannot make an inference from the model back to neurophysiology—and this is one of the things that any bridge between neurophysiologyand behavior must do. It must allow physiological data to be rolledout through a model in order to generate predictions for whole-system behavior, and it must allow inferences to be made frommodels of psychological data to help predict and understand neu-rophysiological data. To make such an inference we need to usemodels that integrate neurophysiological constraints throughoutthe model.
Neuronal-Level Model
The functional specialization of the brain emerges from thecollective network dynamics of cortical circuits of coupled spikingneurons. Each neuron transforms a large set of inputs, receivedfrom different neurons, into an output spike train, that constitutesthe output signal of the neuron. This means that the spatiotemporal
1 Specifically, they used the Wilson–Cowan (Wilson & Cowan, 1972;excitatory–inhibitory) population system, which can be thought of as anapproximation of real neuronal operation (Gilzenrat, Holmes, Rajkowski,Aston-Jones, & Cohen, 2002).
6 MAVRITSAKI, HEINKE, ALLEN, DECO, AND HUMPHREYS

spike patterns produced by neural circuits convey informationbetween neurons; this is the microscopic level on which the brain’srepresentations and computations rest. A simplified version of amodel that can include as many properties as possible of themicroscopic level is the integrate-and-fire neuron. Integrate-and-fire neurons can incorporate important neurotransmitter propertiesthat provide a bridge between physiology and behavior. Below, wepresent studies where spiking-level neurons were used. The equationsfor the spiking level of these studies are presented in Figure 1. Theseequations describe the subthreshold membrane potential of theneuron, as they are dependent on the synaptic currents that enterthe cell (Deco & Rolls, 2005a). In the central nervous system, theexcitatory synapses rely on glutamate as their neurotransmitter,with different types of glutamate receptor present in each synapse.The channels that are controlled by AMPA receptors are describedby a fast response to a presynaptic current and quick decay in thepostsynaptic current; in contrast, channels that are controlled by
NMDA receptors are described by slow dynamics. NMDA andAMPA equivalents are present in our integrate-and-fire modeldescription in Figure 1. In addition, fast inhibitory neurons presentin our central nervous system are mainly regulated by!-aminobutyric acid (or GABA); a description of the GABAcurrents is presented in Figure 1. Additionally, the neurons in themodel include a frequency adaptation current, which also charac-terizes real neuronal operations (Liu & Wang, 2001). Animalstudies demonstrate that the IAHP current is primarily responsiblefor frequency adaptation over the first 300 ms of stimulus process-ing (Madison & Nicoll, 1984). The mechanism of the IAHP currentcan be described as an influx of a small amount of calcium [Ca2"]every time an action potential is generated. The influx of [Ca2"]increases the intracellular levels of [Ca2"] concentration, which inturn activates the IAHP current that inhibits the activation of the cell(Liu & Wang, 2001). The system also has external neurons that aremodeled with AMPA-like dynamics. More details for the neuronal
Figure 1. The subthreshold membrane potential of the cell can be described by the equation shown next to thepostsynaptic cell. Cm is the membrane capacitance where different values are given for excitatory Cmex andinhibitory Cmin neurons; gm is the membrane leak conductance where different values are also given forexcitatory gmex and inhibitory gmin neurons; VL is the resting potential; Isyn is the synaptic current; and IAHP is thecurrent term for the frequency adaptation mechanism. The synaptic currents are described in the correspondingboxes; in each box the portion of open channels is highlighted. VE is the excitatory reversal potential; wj are thesynaptic weights; gAMPA,rec is the synaptic conductance; and sj
AMPA,rec is the proportion of open channels forAMPA,rec. The voltage of the NMDA recurrent currents INMDA,rec is determined by the extracellular magnesium#Mg2"$ concentration (Jahr & Stevens, 1990), where #Mg2"$ is the concentration of magnesium, gNMDA is thesynaptic conductance, and sj
NMDA is the proportion of open channels for NMDA. For the inhibitory GABA currentsIGABA, gGABA is the synaptic conductance and sj
GABA is the proportion of open channels for this receptor type. Theconnections with the external neurons follow AMPA-like dynamics and the voltage IAMPA,ext, where gAMPA,ext is thesynaptic conductance and sj % 1
AMPA,ext is the fraction of open channels. VK is the reversal potential of the K"; gAHP
is the synaptic conductance; & is the #Ca2"$ influx; and 'Ca is the leaky integrator’s decay constant. #Ca2"$concentration is initially set to 0, and the values can be found in Deco and Rolls (2005a). The parameters for theequations are given in Appendix C.
7BRIDGING THE GAP BETWEEN PHYSIOLOGY AND BEHAVIOR

properties can be found in Mavritsaki, Heinke, Humphreys, andDeco (2006); Brunel and Wang (2001); and Deco and Rolls(2005a).
Mean Field Approximation
Our argument is that this neuronal description allows us to builda bridge between behavior and physiology. However, we arenevertheless faced with severe problems in scaling up the model,to capture a level of subcomponent operation that relates to psy-chological studies, given that any such model will involve multiplenonlinear dynamic equations whose operation is computationallyintensive and difficult to simulate. This is where the mean fieldapproach comes in. In this approach, individual integrate-and-fireneurons are grouped together into populations of statistically sim-ilar neurons. A statistical description of each population is givenby a probability density function that expresses the distribution ofneuronal states (i.e., the membrane potentials) across the popula-tion. The key assumption in the population density approach is thatthe afferent input currents impinging on neurons in one populationare uncorrelated and, consequently, the dynamics of the model canbe described by the evolution of the probability density function.The mean field approximation entails replacing the time-averageddischarge rate of individual cells with a common time-dependent
population activity (the ensemble average) where, in a statisticalsense, the rate of a single neuron calculated across time is equiv-alent to the rate of activity across the neurons in a given populationat a given time (see Figure 2). The whole-system behavior that wemay witness in many psychological experiments represents whatwe may term the steady state of the underlying neurodynamicalsystem (following its transient evolution to this state). To get tothis steady state for a model, and to capture the transient changesof the network en route, we need to find the appropriate parametersfor the model (in general terms, the connectivity parameters for thenetwork). This is an inverse problem—we have to go from thewhole-system behavior (the behavioral steady state) to the param-eters that generated this in the first place. There are severalproblems with this, though. One is practical—it would take anenormous amount of time to explore the parameters that wouldmake a given model approximate a network in the brain. A second,deeper issue is that the results of these simulations are probabilistic(i.e., there will be a certain probability that the neurons in apopulation are in a given state). This makes it particularly difficultto explore the parameter space in a systematic fashion, because anyset of parameters must describe a probability distribution and nota single point in the parameter space. To overcome this problem,the mean field approach is applied when a model reaches a stable
Figure 2. In the mean field approximation, the equations that represent a group of neurons in the brain (see topof the figure [blue]) are approximated with only one equation, based on the assumption that the system remainsin a stationary state. The approximations that are implemented are highlighted in the box below the mean fieldequation. 'x is the effective membrane time constant, (x is the asymptotic value the membrane potential wouldhave in the absence of fluctuations and in the absence of spiking, and )x measures the magnitude of thefluctuations in the synaptic inputs. *(t) is a Gaussian process with an exponentially decaying correlation functionwith time constant 'AMPA. For the IAHP current an adiabatic approximation is assumed. The terms of the meanfield equation are described in the box appearing on the right.
8 MAVRITSAKI, HEINKE, ALLEN, DECO, AND HUMPHREYS

(attractor) state after receiving a given input. When in a steadystate, a population transfer function can be applied that describesthe average spiking rate at a given time across the population (thepopulation rate) as a function of the average input current. Thesteady state of the network, solved through the mean field ap-proach, can be matched to a behavioral steady state, observed in agiven experiment. In finding the parameters that generate thisbehavioral steady state, we solve the inverse problem. A criticalpoint here is that, in the mean field approximation, all the bio-physical details contained in the original neural-level model aremaintained because the function is derived consistently from theoriginal spiking equations. This is not the case for connectionistmodels because the activation functions for these models areessentially arbitrary with regards to the biophysical substrate.
There is an additional point. The solution derived at the meanfield level holds only for the steady state of the network. It does notdescribe the transient states that the network goes through to reachthe steady state. The problem here is that some of the theoreticallymost informative aspects of experiments reflect the transient statesthat are passed through to obtain any final steady state. Forexample, at the mean field level the parameters for a model ofvisual selection may be set so that the target is consistently found(the attractor state we want to reach). However, mean field-levelsimulations do not give us information about how much time weneed to converge to that attractor, and yet the time to find the targetis the essence of tasks such as visual search, where selection ismeasured. Within our framework, we can solve this problem byapplying the parameters found at the mean field level to spiking-level simulations, precisely because these parameters have beenderived consistently from the integrate-and-fire level. Thesespiking-level simulations then give us the transient changes thatwe are interested in.
Following this approach, the aim is to derive parameters at themean field level in order to simulate a key behavior that we areinterested in (e.g., successful visual search that approximates therate of human search in a critical condition). Following this, aspiking-level variant of the model can be developed to capture thedynamic aspects of performance—for example, the time course ofhuman performance as the temporal relations between search dis-plays are varied. The additional parameters implemented at thespiking level, reflecting, for example, synaptic transmission pro-cesses, then need to be biologically plausible, so that direct linkscan be made between physiology and higher level behavior. Wecontend that it is important to have a direct “vertical” transfer ofparameters from the spiking level to the mean field level, in orderthat we have a transparent means of linking the different levels ofdescription. This is critical for making an inverse inference con-cerning how the real neural system must operate, based on theparameters initially derived to capture behavioral data in the modelat the mean field level—one part of the two-way bridge betweenphysiology and behavior.
In order to process from the spiking level to the mean field, anumber of approximations need to take place, which are high-lighted in Figure 2 and presented in more detail in Brunel andWang (2001) and Deco and Rolls (2005a). Critical here is thediffusion approximation, where the synaptic variables for thedifferent currents presented in Figure 1 are represented by anaverage DC component and a noise term. The noise term of allthe synaptic currents can be approximated by the noise term of
the AMPA, ext current, because the amplitudes of fluctuationsof the AMPA currents are much larger than those of the NMDAand GABA currents. Two other important approximations con-cern the NMDA current: (a) The function +(v) (i.e., the non-linear dependence of the NMDA component on the pyramidalcell discharge rate) can be calculated if we consider it in termsof a Poisson distribution, and (b) the voltage dependence of theNMDA conductance is linearized under the assumption that thevoltage stays in an area around the mean.
Study 1: Modeling at a Neuronal Level(Deco & Rolls, 2005a)
Deco and Rolls (2005a) presented a skeleton model of biasedcompetition that illustrates critical properties of the extendedmodel (the spiking selection over time and space [sSoTS] model)that we elaborate on below. Deco and Rolls’s work also illustrateshow neural-level models can be used to capture effects fromsingle-cell electrophysiological recording, whilst being extendableto model whole-system behaviors, as we illustrate. The frameworkfor their model is set out in Figure 3. Unlike for our presentationof the sSoTS model (Studies 2–5), we do not discuss the param-eterization of Deco and Rolls’s, and we refer the reader to theoriginal article.
The Deco and Rolls (2005a) model contained a simplifiednetwork with two layers, one of which may be thought to haveprocessing units with characteristics of neurons in area V2, theother containing processing units with characteristics of neurons inarea V4. Within each layer, there are excitatory neurons (a, b, c, d)that respond preferentially to particular stimuli (e.g., a particularorientation or a particular spatial frequency, in V2). The specificexcitatory neurons in V2 (a, b) are held to respond to localelements within their receptive field. The specific excitatory neu-rons in V4 (c, d) are held to have larger receptive fields than theneurons in V2 so that both sets of excitatory neurons within V4respond to both sets of local excitatory neurons in V2. The V4neurons were also set to have a “preferred” stimulus within V2(indicated by the thicker connections from the V2 neurons to theV4 neurons, indicating larger connection weights; a3 c and b3d), whilst being activated to some degree by the other (nonpre-ferred) properties (the thinner connections from V2 to V4 indicat-ing smaller connection weights; a3 d, b3 c). Simulations wereconducted assuming that stimuli corresponding to oriented bars ofparticular spatial frequency were present, to activate the corre-sponding neurons in V2. When both sets of excitatory neurons inV2 were active, then both sets of V4 neurons would be activatedtoo. The stimulus-specific excitatory neurons in each layer werealso connected to two other sets of neurons: (a) a set of inhibitoryinterneurons (left of Figure 3) and (b) a set of nonspecific excita-tory neurons assumed not to be connected to afferent input. Theinhibitory neurons modulate competition between the excitatoryneurons within each layer. The nonspecific excitatory neuronsintroduce noise into the operation of the model and help it togenerate neuronally plausible spike-firing patterns. As we illustratein Study 3, the presence of noise within neural-level models of thistype turns out to have interesting consequences for modelingwhole-system human behavior too. The excitatory neurons in themodel were based on pyramidal cells and comprised 80% of theneurons in the system; the inhibitory neurons were modeled on
9BRIDGING THE GAP BETWEEN PHYSIOLOGY AND BEHAVIOR

interneurons and comprised 20% of the neurons in the system.These proportions capture the approximate ratio of excitatory toinhibitory neurons in the cortex (Braitenberg & Schuz, 1991;Brunel & Wang, 2001; Deco & Rolls, 2005a). All neurons in themodel receive inputs from three currents: a fast inhibitory currentmediated by GABA-like dynamics, a fast excitatory current me-diated by AMPA-like dynamics, and a slow inhibitory currentmediated by NMDA-like dynamics (see Figure 1). All of theneurons received some external input to provide a backgroundlevel of firing (,ext). The excitatory neurons in V2 also receivedspecific afferent input, representing the presence of stimuli in thevisual field (,in).
This model was applied to simulate data from Reynolds,Chelazzi, and Desimone (1999; see also Moran & Desimone,1985). Reynolds et al. used a paradigm in which monkeys directedattention to a target stimulus across multiple trials. Differencesbetween neuronal firing rates for attended and nonattended stimuliwere seen relatively early in the time course, following presenta-tion of the critical target stimulus. This does not, of course, rule outattentional modulation later in the time course (after, for example,texture segmentation tasks; Roelfsema, Tolboom, & Khayat,2007). Here, however, we concentrate on the case where thestimuli are clearly segmented from the background and discrimi-nated from each other and participants receive information onsome trials that allows them to purposely attend to specific stimuli.
In Reynolds et al.’s (1999) experiment, oriented bars werepresented in the receptive fields of neurons in V2 and V4 of amonkey; one of the bars was the preferred stimulus for the V4units being studied; the other was a nonpreferred stimulus. Whenthe monkey was trained to attend to a location outside the receptivefield, the presence of the nonpreferred stimulus in the receptivefield reduced the neuron’s response to the preferred stimulus, withthe neuron responding according to the weighted average of thesignals. When the monkey was trained to attend to the location ofthe preferred stimulus, the V4 neuron increased its firing. Whenthe animal attended to the location of the nonpreferred stimulus,neuronal firing was suppressed. The effect of attention was mod-eled by introducing an extra attention input (,att) to neurons in V2with a receptive field at the attended location, when both a pre-ferred and a nonpreferred stimulus were present in the receptivefield of the neurons in V4. Deco and Rolls (2005a) examined theactivity of sets of neurons in the specific excitatory pool in V4, andthe results are shown in Figure 4. The pair condition correspondsto the case where the animal is assumed to be attending outside thereceptive field, when the activity of the V4 neurons corresponds tothe weighted average of responses to the preferred and nonpre-ferred stimuli when presented alone. In the pair " attend goodcondition, the attentional input is given to the location of thepreferred stimulus for the neuron, whereas in the pair " attend badcondition, attentional input is given to the location of the neuron’s
!!ext
!ext
Inhibitorypool
Nonspecificneurons
V4 c d
!ext
Inhibitorypool
NonspecificneuronsV2 a b
!ext!in !in !att
Figure 3. The model of Deco and Rolls (2005a). ,ext provides an externally driven level of spontaneousactivity. ,in provides input into the system (from the visual field). ,att provides an attentional signal to aparticular location. The receptive fields of neurons in level V4 are larger than those of neurons in V2, and so eachcovers more than one neuron within V2 (e.g., Unit c receives input from both Units a and b). Each cortical layercontains excitatory pyramidal neurons and inhibitory interneurons. Neurons are fully connected within eachcortical layer (see Appendix A for further details). Neurons in each cortical level cluster into excitatory andinhibitory pools. There are two types of excitatory pool. Selective pools respond to specific visual featuresrepresented in connected cortical regions (e.g., a visual feature at a given location). The nonspecific cells do nothave specific sensory inputs, but they have spontaneous firing and introduce noise into the system to producePoisson-like spike firing (see Brunel & Wang, 2001).
10 MAVRITSAKI, HEINKE, ALLEN, DECO, AND HUMPHREYS

nonpreferred stimulus. As can be seen, the model showed clearmodulation of neuronal firing, determined by whether the locationof the preferred or the nonpreferred stimulus was attended. Rela-tive to the baseline (no-attention, pair condition), there was en-hanced activation when the location of the preferred stimulus wasattended, whereas activity was suppressed when the nonpreferredstimulus was attended.
Deco and Rolls (2005a) also went on to show that these atten-tional modulations were influenced by the relative contrast of thestimuli. The effects of a nonpreferred stimulus were stronger whenit had a higher contrast relative to the preferred stimulus, butattention to the preferred stimulus reduced this effect of salience—particularly when the preferred stimulus itself was in an interme-diate contrast range. This result mimics single-cell data reported byMartınez-Trujillo and Treue (2002) and Reynolds and Desimone(2003).
Prediction 1. Interestingly, the effects of attentional modu-lation in this model were influenced by the relatively long timecourse of the NMDA current (see Figure 1). When the time courseof this current was reduced, the effects of attentional modulationwere much weaker (Deco & Rolls, 2005b). This is of interest forstudies operating at higher levels of analysis because changes inthe NMDA current may be thought to approximate the effects ofarousal by altering global activation levels within the neural sys-tem. Mavritsaki, Heinke, Deco, and Humphreys (2009) altered theNMDA in an extended version of the Deco and Rolls (2005a)model (see Study 3) to simulate effects of reduced arousal asso-ciated with damage to right frontoparietal regions in neurological
patients (see Robertson & Manley, 1999). Mavritsaki et al. (2009)found that there was reduced selectivity in their model whenNMDA modulation was reduced, which, combined with a spatialbias introduced into selection by lesioning their model, led toparticularly poor selection of stimuli on the “bad” side of space.The NMDA effects also reduced selectivity on the “good” side,however, which fits with right frontoparietal patients having non-spatial deficits that are modulated by increasing arousal (see Mal-hotra, Parton, Greenwood, & Husain, 2005; Robertson, Matting-ley, Rorden, & Driver, 1998). If alterations in NMDA function canbe taken as an approximate means of varying physiological arousal(Mavritsaki et al., 2009), and if impaired arousal is associated withright frontoparietal damage, then a qualitative prediction follows.There should be reduced attentional modulation of selection inpatients with right frontoparietal damage, which should be relatedto impairments in arousal and not just to, for example, spatialbiases in selection. This was tested in Study 5A here.
Study 2: Modeling Whole-System Behavior in Search(the sSoTS Model)
The sSoTS Model
The Deco and Rolls (2005a) model illustrates how spikingactivity in a neural-level simulation can be directly related tosingle-cell activity. However as an account of human visual atten-tion their framework is limited. For example, attention within themodel acts by modulating activity at an attended location. How-
Figure 4. Dynamical activity in the Deco and Rolls (2005a) model at level V4. The figure shows the firing rateof V4 neurons to a good (preferred) or poor (nonpreferred) stimulus when both stimuli are present simulta-neously in the receptive field. In the pair condition, there is no specific attentional input to the location of eitherthe good or the poor stimulus. In the pair " attend good condition, attention is allocated to the location of thegood stimulus. In the pair " attend poor condition, attention is allocated to the position of the poor stimulus. Thestimuli were presented in the period of 100–350 ms.
11BRIDGING THE GAP BETWEEN PHYSIOLOGY AND BEHAVIOR

ever, there is considerable evidence that participants can attend toand/or selectively ignore either the dimension that defines a targetstimulus (Found & Muller, 1996; Weidner & Muller, 2009) or thevalue of the target feature (Braithwaite & Humphreys, 2003; Folk,Remington, & Johnston, 1992). There is no mechanism for non-spatial biasing of selection within the model. In addition, themodel represents only two spatial positions, and it is not clear howwell any competition for selection will scale when more locationsare represented. We also do not know how activation emergingwithin a layer (e.g., in V4) can be used to “drive” other processes(e.g., an eye movement to the location of a stimulus that isattended) that may map on more directly to higher level behavioralstudies; note that the receptive fields in V4 cover more than onelocation at the level of V2 in the model. Deco and Zihl (2001)developed an extended model that included feature maps thatrepresent multiple spatial locations and that feed the outputs ofcompetitive processing at the feature-map level into a locationmap, which effectively represents the saliency of activity at eachlocation (cf. Itti & Koch, 2001). However, this work used ahigh-level (mean field) approximation that did not include the fullneuronal dynamics. A neural-level version of this extended frame-work, which we term the spiking search over time and space model(sSoTS), was put forward by Mavritsaki et al. (2006), and thisforms the basis of the remaining studies we present here.
The architecture for the sSoTS model is presented in Figure 5.The model takes the same basic form as the Deco and Rolls(2005a) model, with there being pools of specific excitatory neu-rons, nonspecific excitatory neurons, and inhibitory neurons. Un-like in Deco and Rolls (2005a) model, specific excitatory unitsrepresenting different visual features are coded for different loca-tions in distinct spatiotopic maps; this follows the common as-sumption that features are coded in distinct spatiotopic maps inearly vision (Treisman & Gelade, 1980). Within each featuredimension, though, there are common inhibitory units that con-strain activation to favor only one feature occupying one spatialposition during selection. There are maps for each of two features
(e.g., blue and green) in each of two dimensions (color and shape),with the specific excitatory units in each map representing sixspatial locations. In order to show how outputs from such unitsmay be used to drive other behaviors, activation within the featuremaps is fed through to a location map that sums activity acrossmaps and passes activity back to units within the feature maps inorder to sharpen the competition between the stimuli at that level.Activity in the location map reflects the relative salience of thedifferent stimuli competing for selection, whilst also conveyinginformation (for other systems, not in the model) about the locationwhere a response may be targeted. The model uses similar pro-cessing dynamics to those presented in Deco and Rolls (2005a;Figure 1). For example, units in the feature maps receive inputrepresenting external stimuli being presented (,in). All units alsoreceive a background level of spontaneous activity (,ext), with aPoisson noise distribution with value 3 Hz, consistent with activityvalues observed in the cerebellar cortex (Rolls & Treves, 1998;Wilson, O’Scalaidhe, & Goldman-Rakic, 1994). There were, how-ever, two exceptions. First, rather than attention necessarily beingdirected to the location of a stimulus, attention can be applied moreflexibly. It can be allocated in terms of an excitatory input to alocation (e.g., giving additional input into units at one positionwithin the location map), but it can also be allocated to a dimen-sion (e.g., activating all locations within the color maps) or to afeature (activating the blue map; ,excit). Second, as well as usingexcitatory attentional input, we also used inhibitory attentional input(,inhib) to optimize visual selection. We review the reasons for incor-porating this suppressive component of attention below. The changesto the activation functions are presented in Appendix A.
The sSoTS model can be applied to tasks where participants arenot set to attend to a particular location—an example would bevisual search where participants typically know the features thatdefine the target, but they have no foreknowledge of the locationsof the features. Foreknowledge of a search target in sSoTS isprovided by preactivating maps for the expected target featuresprior to the search items being presented. Following presentation
Location MapInhibitory Pool Nonspecific Pool
Feature Maps
Inhibitory Pool Nonspecific Pool
Blue GreenStimulus
Inhibitory Pool Nonspecific Pool
Figure 5. The architecture of the spiking selection over time and space (sSoTS) model. The model is composedof feature maps where units respond selectively to particular visual features (top map: color; bottom map: shape).Within each feature map, there are both selective and nonspecific excitatory neurons, with the selective neuronsresponding to particular features (e.g., blue or round). There is also a pool of inhibitory interneurons that are fullyconnected with the excitatory neurons. In the location map, the selective neurons respond to activity atcorresponding locations in the field irrespective of the features present.
12 MAVRITSAKI, HEINKE, ALLEN, DECO, AND HUMPHREYS

of the search display there is competition for selection of thelocation (in the location map) where the target falls. Units withinand across feature maps compete for selection through commonsets of inhibitory neurons, but there is a net gain for target featuresfrom the top-down expectancy that is set. This leads to the targettypically winning the competition for selection, with neurons at thetarget’s position in the location map reaching a threshold fordetection. The mechanism of setting an expectancy for the target’sfeatures is very similar to that employed in theories such as guidedsearch (Wolfe, 1994), and, like guided search, the model predictsthat differences should emerge for targets defined by a conjunctionof features (where the target shares at least one feature with everydistractor) and feature search (where the target differs from dis-tractors through the presence of a critical single feature). In con-junction search, the top-down expectancy for the target’s featureswill also preactivate feature maps responding to distractors, in-creasing competition. In single-feature search, the top-down ex-pectancy uniquely activates the feature map for the target, so agreater competitive advantage for the target occurs. Activationprofiles for different clusters of units in the location map aredepicted for single-feature and conjunction search in Figures 6Aand 6B. Mavritsaki et al. (2006) demonstrated that sSoTS gener-ated the characteristic pattern of efficient and inefficient search(increasing nonlinearly or linearly as a function of the number ofdistractors) for conjunction and single-feature tasks, matchinghuman data (see Figure 7). This result provides an existence proofthat a model of this type, with parallel processing of visual ele-ments that compete for selection, can generate linear search func-tions that have often been linked to serial models of visual selec-tion (see also Heinke & Humphreys, 2003; Townsend, 1972).
Preview search. In addition to being used to examine searchacross space, the sSoTS model has also been employed to studysearch over time. Human visual search for a conjunction target canbe made more efficient if the temporal exposure of the distractorsis staggered so that half the distractors appear as a preview beforethe other half (plus the target, when present; Watson & Hum-phreys, 1997). Interestingly, this preview benefit for search has along time course—search is optimal only when there is an intervalof 500 ms or so between the preview and the new search display
(Humphreys, Jung Stalmann, & Olivers, 2004; Humphreys, Oliv-ers, & Braithwaite, 2006; Watson & Humphreys, 1997). Given thatobservers can temporally segment and group stimuli appearingwithin 100 ms of each other (Yantis & Gibson, 1994), it is notclear why attentional benefits have such a long time lag.
Models that employ realistic biological parameters have theinteresting property that neurons will adapt their firing over time.One mechanism of adaptation, incorporated into sSoTS, reflects aslow [Ca2"]-activated K" current (Madison & Nicoll, 1984),
Basic Single Feature
AA
H
zAA1 sec
50 H
zAtime
A
A Basic Conjunction
H
H
zHA1 sec
50 H
zHtime
A
B
Figure 6. A: Activity in the neuron pools of the location map in the single-feature search condition. In eachpool we have depicted the stimulus present at that location (in the external world). The plots show the activityover time. The target (blue H) falls at the center left location. B: Activity in the location map in the conjunctioncondition.
Figure 7. Time required for the spiking selection over time and space(sSoTS) model to detect the target in a search display. The data show thetime for the winning set of units in the location map to reach threshold (seeAppendix B for details). The data are shown here for conjunction (CJ),single-feature (SF), and preview (PV) search (with a preview duration of1,000 ms), and the search slopes are, respectively, 17.9, 29.53, and 18.89ms/item. The reaction times (RTs) are derived from display sizes of 2, 3,and 4 (single feature); 4 and 6 (conjunction); and previews with 2 and 3items in both the preview and then a matching number of items in the newsearch display. Note that, in human RTs, any time taken to select the targetlocation would be added to by motor response latencies.
13BRIDGING THE GAP BETWEEN PHYSIOLOGY AND BEHAVIOR

which leads to decreases in firing rate after a cell has been activefor a given time (the process of frequency adaptation; see alsoDeco & Rolls, 2005a). Figure 8 gives the profile of [Ca2"]adaptation across various parameter values. According to the pa-rameters selected, there will be a buildup of [Ca2"] across the first300 ms or so of a stimulus, which results in decreased neuronalfiring (see Figure 8). One consequence of this is that stimuli thathave been presented for some time should decrease their activity,making them less salient for selection. The long time course of thisprocess predicts that there should be a relatively sluggish processby which old stimuli lose their attentional interest over time, muchas observed in the preview effect.
Parameter identification: From mean field to spiking neu-rons. To simulate data on preview search, the parameters of thesSoTS model were initially set at a mean field level (see above,Figure 2, and Brunel & Wang, 2001; Deco & Rolls, 2005a, formore details). The mean field simulations, which are much quickerthan simulations at a spiking level, established areas in the param-eter space where the activation was stable (stationary) and thetarget could be identified successfully in single-feature and con-junction search conditions as the main “within-map” propertieswere varied (e.g., inhibition within the location and feature maps;see Figure 9A for stationary activation and Figure 9B for success-ful target identification areas). These parameters were then incor-porated into a spiking-level network, to identify the areas thatsimulate the correct slope and success rate for single-feature andconjunction search (see Figure 9C). The slopes and rates of suc-cessful target detections were calculated according to Appendix B.
Psychological research indicates that, in addition to any generaleffects of adaptation to old stimuli in preview search, there is alsoactive suppression of distractors when participants prioritizesearch for the new stimuli. This evidence comes in various forms.Experiments have been conducted using probe procedures (whereparticipants have to detect the presence of a probe on new or old
distractors or in the background) where it has been shown thatprobes on old objects are more difficult to detect than those in thebackground or on new distractors (Agter & Donk, 2005; Braith-waite, Humphreys, & Hulleman, 2005; Humphreys, Jung Stal-mann, & Olivers, 2004; Watson & Humphreys, 2000). Such resultsare consistent with attentional suppression of old items that takesactivation below baseline levels (probe on background). Other dataindicate that this suppression can spread from the features of olditems to new stimuli sharing the same features, making these newitems difficult to detect (Braithwaite et al., 2005; Olivers & Hum-phreys, 2003). There is also evidence for effects of old itemsappearing to have reduced contrast compared with new stimuli(Allen & Humphreys, 2007). Importantly, this evidence for sup-pression of old distractors occurs only under conditions of atten-tional prioritization to new stimuli; there is little difference in thedetection of probes on new and old stimuli when probe detectionis the primary task (Humphreys, Jung Stalmann, & Olivers, 2004;Watson & Humphreys, 2000). Watson, Humphreys, and Olivers(2003) proposed that participants actively inhibit the old items toenhance any competitive advantage for new stimuli when theyappear. To incorporate this form of top-down inhibition intosSoTS, we introduced a top-down suppressive as well as a top-down excitatory component into the model, with the inhibitorycomponent (,inhib) being added to units in the feature maps for olddistractors.
Having initially set up model parameters to fit single-feature andconjunction search at the mean field level (see Figures 9A and 9B),the critical top-down excitation and inhibition parameters, and the[Ca2"] parameter determining frequency adaptation, were set tomatch human performance in preview search in the spiking level.
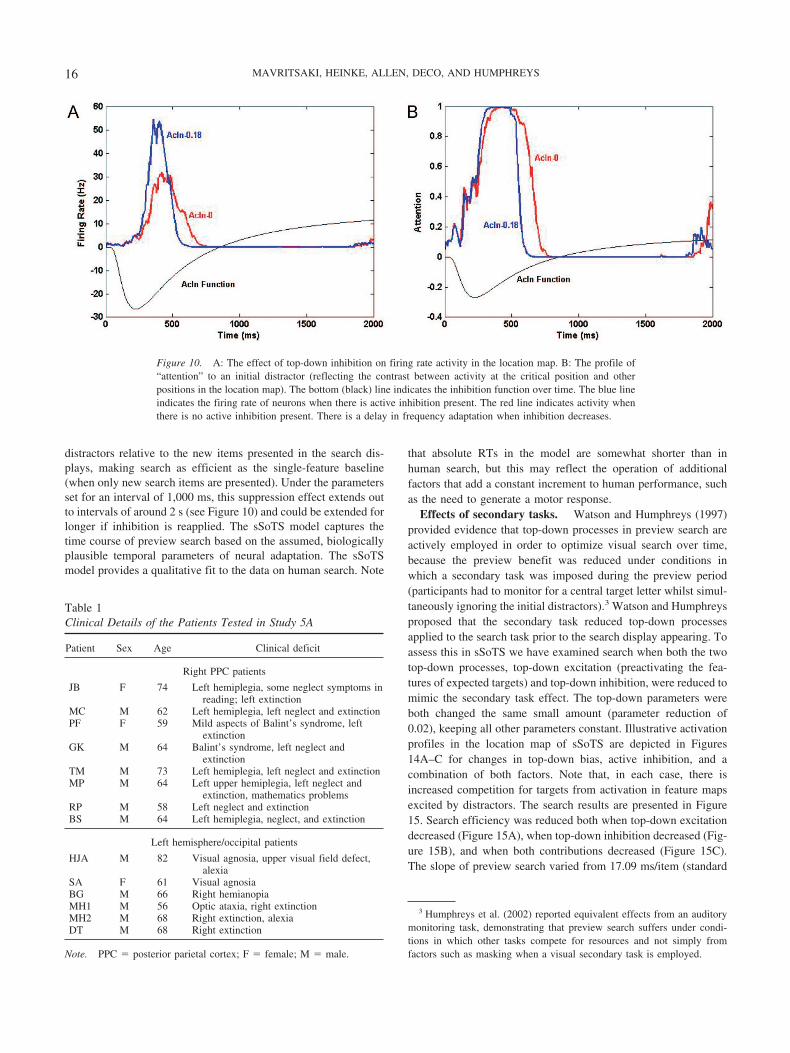
The function for top-down inhibition is shown in Figure 10,which illustrates the effects of varying this parameter on the firingrate (left panel) and the attention modulation index for the locationmap (right panel). The net effect of the top-down inhibition is toinitially raise activity in the feature maps corresponding to thelocation where the to-be-ignored feature is presented—this isbecause competition from units at other locations in the samefeature map is damped down, so activity generated by the stimulusis enhanced. This enhancement, however, leads also to fasteradaptation of the units, so that, at the level of the location map,activity from any initial, to-be-ignored distractors remains for alonger period if those distractors are not inhibited.
Explorations were conducted into the relations between theparameters determining active inhibition and those reflecting[Ca2"] adaptation (see Figure 9D), to determine a region in theparameter space where preview search could be simulated (basedon the slope of the search function under preview search condi-tions). The resultant RTs (directly based on the temporal firingpatterns of the units) are presented in Table 1 for a “standard”preview condition (e.g., with the preview presented for 1,000 msbefore the search display), along with RTs in the conjunction andfeature search conditions. Activity profiles for units within thelocation map in preview search are presented in Figure 11. Theslope of the search function was steeper in conjunction thanpreview search, whereas the slope for preview and single-featuresearch did not differ. This matches data on human search (e.g.,Watson & Humphreys, 1997). Search accuracy did not differ
150Ca-0
100
e (H
z)
Ca-0 05
50Firi
ng R
ate
Ca-0.1
Ca 0.05
0
Ca-0.15
Ca-0.20 500 1000 1500
0
Time (ms)
Figure 8. Illustration of variations in the neuronal firing rate as a functionof the [Ca2"] parameter. In each case when there is an increase in theconcentration of [Ca2"] entering the cell after the neuron spikes, there isincreasing inhibition of the neuron and a decrease in the firing rate(frequency adaptation); altering the [Ca2"] parameter changes the rate ofthis adaptation process.
14 MAVRITSAKI, HEINKE, ALLEN, DECO, AND HUMPHREYS
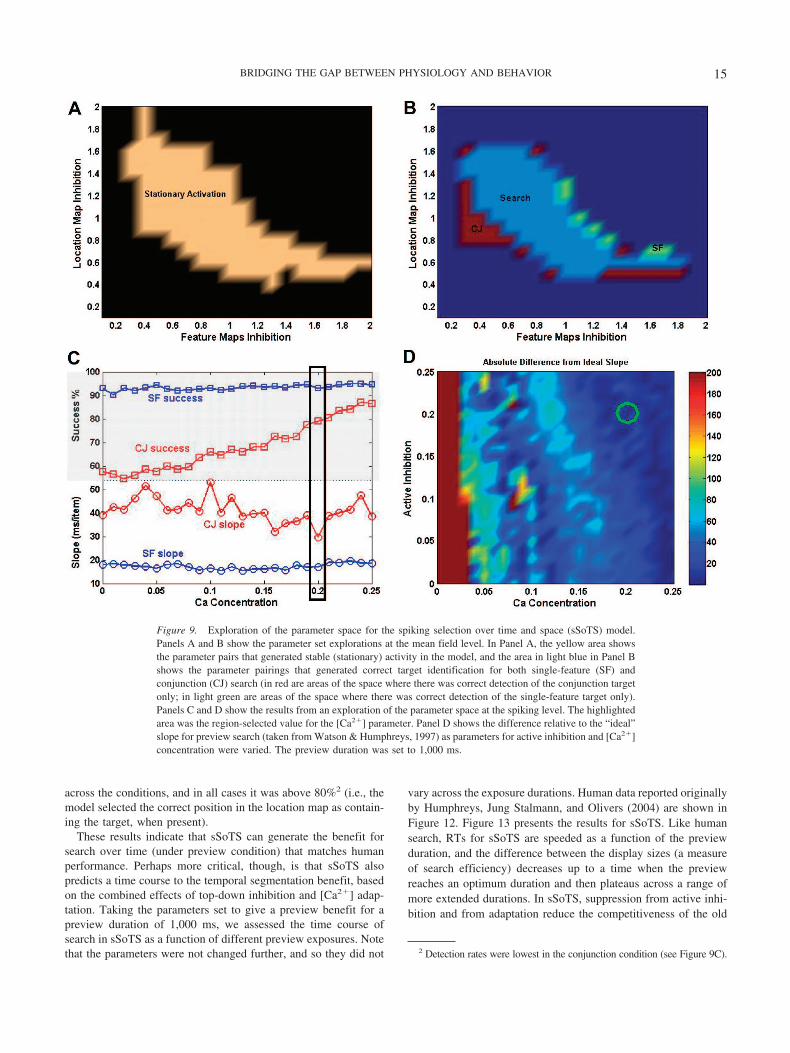
across the conditions, and in all cases it was above 80%2 (i.e., themodel selected the correct position in the location map as contain-ing the target, when present).
These results indicate that sSoTS can generate the benefit forsearch over time (under preview condition) that matches humanperformance. Perhaps more critical, though, is that sSoTS alsopredicts a time course to the temporal segmentation benefit, basedon the combined effects of top-down inhibition and [Ca2"] adap-tation. Taking the parameters set to give a preview benefit for apreview duration of 1,000 ms, we assessed the time course ofsearch in sSoTS as a function of different preview exposures. Notethat the parameters were not changed further, and so they did not
vary across the exposure durations. Human data reported originallyby Humphreys, Jung Stalmann, and Olivers (2004) are shown inFigure 12. Figure 13 presents the results for sSoTS. Like humansearch, RTs for sSoTS are speeded as a function of the previewduration, and the difference between the display sizes (a measureof search efficiency) decreases up to a time when the previewreaches an optimum duration and then plateaus across a range ofmore extended durations. In sSoTS, suppression from active inhi-bition and from adaptation reduce the competitiveness of the old
2 Detection rates were lowest in the conjunction condition (see Figure 9C).
Figure 9. Exploration of the parameter space for the spiking selection over time and space (sSoTS) model.Panels A and B show the parameter set explorations at the mean field level. In Panel A, the yellow area showsthe parameter pairs that generated stable (stationary) activity in the model, and the area in light blue in Panel Bshows the parameter pairings that generated correct target identification for both single-feature (SF) andconjunction (CJ) search (in red are areas of the space where there was correct detection of the conjunction targetonly; in light green are areas of the space where there was correct detection of the single-feature target only).Panels C and D show the results from an exploration of the parameter space at the spiking level. The highlightedarea was the region-selected value for the [Ca2"] parameter. Panel D shows the difference relative to the “ideal”slope for preview search (taken from Watson & Humphreys, 1997) as parameters for active inhibition and [Ca2"]concentration were varied. The preview duration was set to 1,000 ms.
15BRIDGING THE GAP BETWEEN PHYSIOLOGY AND BEHAVIOR
distractors relative to the new items presented in the search dis-plays, making search as efficient as the single-feature baseline(when only new search items are presented). Under the parametersset for an interval of 1,000 ms, this suppression effect extends outto intervals of around 2 s (see Figure 10) and could be extended forlonger if inhibition is reapplied. The sSoTS model captures thetime course of preview search based on the assumed, biologicallyplausible temporal parameters of neural adaptation. The sSoTSmodel provides a qualitative fit to the data on human search. Note
that absolute RTs in the model are somewhat shorter than inhuman search, but this may reflect the operation of additionalfactors that add a constant increment to human performance, suchas the need to generate a motor response.
Effects of secondary tasks. Watson and Humphreys (1997)provided evidence that top-down processes in preview search areactively employed in order to optimize visual search over time,because the preview benefit was reduced under conditions inwhich a secondary task was imposed during the preview period(participants had to monitor for a central target letter whilst simul-taneously ignoring the initial distractors).3 Watson and Humphreysproposed that the secondary task reduced top-down processesapplied to the search task prior to the search display appearing. Toassess this in sSoTS we have examined search when both the twotop-down processes, top-down excitation (preactivating the fea-tures of expected targets) and top-down inhibition, were reduced tomimic the secondary task effect. The top-down parameters wereboth changed the same small amount (parameter reduction of0.02), keeping all other parameters constant. Illustrative activationprofiles in the location map of sSoTS are depicted in Figures14A–C for changes in top-down bias, active inhibition, and acombination of both factors. Note that, in each case, there isincreased competition for targets from activation in feature mapsexcited by distractors. The search results are presented in Figure15. Search efficiency was reduced both when top-down excitationdecreased (Figure 15A), when top-down inhibition decreased (Fig-ure 15B), and when both contributions decreased (Figure 15C).The slope of preview search varied from 17.09 ms/item (standard
3 Humphreys et al. (2002) reported equivalent effects from an auditorymonitoring task, demonstrating that preview search suffers under condi-tions in which other tasks compete for resources and not simply fromfactors such as masking when a visual secondary task is employed.
Figure 10. A: The effect of top-down inhibition on firing rate activity in the location map. B: The profile of“attention” to an initial distractor (reflecting the contrast between activity at the critical position and otherpositions in the location map). The bottom (black) line indicates the inhibition function over time. The blue lineindicates the firing rate of neurons when there is active inhibition present. The red line indicates activity whenthere is no active inhibition present. There is a delay in frequency adaptation when inhibition decreases.
Table 1Clinical Details of the Patients Tested in Study 5A
Patient Sex Age Clinical deficit
Right PPC patients
JB F 74 Left hemiplegia, some neglect symptoms inreading; left extinction
MC M 62 Left hemiplegia, left neglect and extinctionPF F 59 Mild aspects of Balint’s syndrome, left
extinctionGK M 64 Balint’s syndrome, left neglect and
extinctionTM M 73 Left hemiplegia, left neglect and extinctionMP M 64 Left upper hemiplegia, left neglect and
extinction, mathematics problemsRP M 58 Left neglect and extinctionBS M 64 Left hemiplegia, neglect, and extinction
Left hemisphere/occipital patients
HJA M 82 Visual agnosia, upper visual field defect,alexia
SA F 61 Visual agnosiaBG M 66 Right hemianopiaMH1 M 56 Optic ataxia, right extinctionMH2 M 68 Right extinction, alexiaDT M 68 Right extinction
Note. PPC % posterior parietal cortex; F % female; M % male.
16 MAVRITSAKI, HEINKE, ALLEN, DECO, AND HUMPHREYS

setting) to 30.8, 29.73, and 31.79 ms/item under conditions wherethere were decreases in top-down excitation, inhibition, and bothfactors. Changes isolated to the top-down parameters simulated thequalitative shift in search slopes under dual-task conditions.
These results show that sSoTS can simulate both the time courseand the effects of secondary tasks on preview search. The full timecourse is captured by parameters set for a single preview duration,whereas secondary task effects are captured by variation in just thetop-down parameters. Figure 16 presents predictive simulations
Figure 11. Activity within the clusters of units in the location map of the spiking selection over time and space(sSoTS) model in the preview condition. On the right, the gray area within each cluster indicates the time whenthe preview was present, and the white area represents the time when the search display was present. On the left,the activity profiles are shown in a combined graph for all positions (target in Position 3, red) in the form ofspikes (top) and firing rate (bottom).
750800 4
8
650700
ms)
816
500550600
RTs (
m
400450500
4000 500 1000 1500 2000 2500
SOA (ms)
Figure 12. Data on human preview search (blue H target vs. old green Hsand new blue A distractors) as a function of the interval from the start ofthe preview until the start of the search display (the stimulus onset asyn-chrony [SOA]). The zero condition here represents a conjunction searchtask, where all the items appear simultaneously. There were three displaysizes with four, eight, or 16 items in the final display (adapted fromHumphreys, Kyllingsbaek, et al., 2004). RT % reaction time.
Figure 13. Simulations from the spiking selection over time and space(sSoTS) model of preview (PV) search as a function of the duration of thepreview prior to the search display, for displays with a final total of four orsix items. RT % reaction time.
17BRIDGING THE GAP BETWEEN PHYSIOLOGY AND BEHAVIOR

from the model when these factors are combined but the parame-ters are otherwise kept constant—when different durations ofpreview are presented and a dual-task load is imposed throughout(with reduced top-down biases). These data show two results.First, as we have noted previously, reducing top-down biases
(under dual-task conditions) generates a cost in terms of searchefficiency. Second, the effects of weaker top-down biases aregreatest under short preview presentation conditions, and the costsare largely eliminated if the preview presentation time is extended.This is interesting because we modeled performance with top-down biases reduced throughout the preview period. Active inhi-bition accounts of preview search have not proposed a role for thefrequency adaptation process present in sSoTS (e.g., Watson &Humphreys, 1997). These theories predict that preview searchshould continue to be disrupted when participants remain engagedon a secondary task during the preview period, if that secondarytask continues to consume the attentional resources required toinhibit the old distractors. However, for sSoTS, preview searchbecomes efficient as the preview duration is extended due to thesecond factor, frequency adaptation. According to the model,frequency adaptation takes longer when top-down processes arereduced, because previewed items gain in strength more slowlywhen top-down biases decrease, but adaptation should still even-tually take place. In Study 5 we test the predicted time course ofhuman search under dual-task conditions. Note that, here, sSoTS’sprediction of efficient search at the long preview durations reflectsthe biologically plausible frequency adaptation process incorpo-rated into the model.
Dual-task time course. It is also possible to assess perfor-mance as a function of the interplay between phases of previewsearch in which secondary tasks either are or are not introduced.We tested sSoTS when a “top-up” preview was presented withouta secondary task, followed by a period when there was a secondarytask. Watson and Humphreys (1997) examined human perfor-mance in a similar situation, when participants were given a top-uppreview without any memory load and then a secondary task(monitoring for a target at fixation) was imposed while the previewremained present. Subsequently the search display appeared andthe secondary task stopped. Watson and Humphreys found thatengaging participants on the secondary task after the initial stan-dard preview was sufficient to disrupt search to a level equivalentto that when no preview was initially presented. They suggestedthat, as soon as resources were withdrawn from the preview, therewas reduced inhibition of the old items. However, they did notexamine performance across a range of preview/preview " dual-task intervals, and it is not clear that Watson and Humphreys’sconclusion stands across other conditions. We tested this in pre-dictive simulations of sSoTS by evaluating the model in twoconditions, with alteration only of the parameter reflecting thedegree of top-down bias: (a) with reduced top-down inhibitionthrough the preview period (for various durations, see above), tosimulate performance when a dual task was continued through thepreview, and (b) when a top-up preview, presented under standardconditions (with the usual top-down biases applied for 500 ms),occurred before the different lengths of preview exposed underdual-task conditions (when top-down biases were reduced).
The results are shown in Figure 17. According to these simula-tions, there is little benefit from the top-up (standard) previewwhen the duration of the preview " secondary task is relativelyshort (here, 500 ms). However, a benefit from the initial top-updoes emerge as the duration of the preview " secondary taskincreases (with durations of 900 and 1,000 ms for the preview "secondary task). This result occurred even though the initial pre-view top-up was not itself sufficient to generate a maximum
WM Preview (reduced top-down bias))
H HH H
H
HzHHA
1 sec50
HHHAtime
A
WM Preview (reduced active inhibition))
H HH H
H
HzHHA
1 sec
50 HHHA
time
B
WM Preview (combined reductions intop-down bias and active inhibition)p )
H HH H
H
HzHHA
1 sec
50 HHHA
time
C
Figure 14. A: Activation in the clusters of units at each position of thelocation map of the spiking selection over time and space (sSoTS) model,for the preview condition with reduced top-down (excitatory) guidance tothe target. B: Activation in the location map for preview search withreduced active inhibition. C: Activation in the location map for previewsearch when there is a combination of reduced excitatory guidance andreduced active inhibition. WM % working memory.
18 MAVRITSAKI, HEINKE, ALLEN, DECO, AND HUMPHREYS

preview benefit when presented alone (i.e., it was not sufficient to“push” previewed items into their refractory state; see Figure 13,where the initial top-up period is covered)—but the previewduration was clearly sufficient to move activation toward therefractory state, so that subsequent effects of reduced inhibitionwere less detrimental to performance. Unlike the high-level psy-chological account offered by Watson and Humphreys (1997),sSoTS holds that preview effects can emerge even when resourcesare withdrawn from the preview, but this depends on the initial“state” of participants and how far along the attentional system istoward adaptation taking place.
Predictions 2 and 3. These simulations with sSoTS lead totwo novel predictions. One is that, even when participants engagein a secondary task during the preview period, a preview benefitshould emerge if the preview is presented for long enough (seeFigure 16). The second prediction is that, if a top-up of the previewis given before a secondary task is imposed, there should be a gainto performance—but this emerges only as the duration of thepreview " secondary task increases (see Figure 17). In each casethere is not a simple loss of search efficiency if resources are
withdrawn during the preview period (contra to the claim ofWatson & Humphreys, 1997). These novel predictions, based onthe biologically plausible temporal dynamics of the spiking-levelmodel, were assessed in Studies 5B and 5C.
Study 3: Simulating Effects of Brain Lesions
Classically, disorders of visual attention are associated withclinical impairments such as unilateral neglect that are complexand multifaceted, with behavioral dissociations occurring acrossand sometimes even within patients (e.g., Humphreys & Riddoch,1994). Computational modeling offers the possibility of providingan overarching account of these disorders, with the behavioraldeficits emerging after damage to different components of themodeled attentional system. There have now been several attemptsto simulate visual neglect, typically using relatively high-levelconnectionist approaches (Heinke & Humphreys, 2003; Mozer,Halligan, & Marshall, 1997). These models have typically aimed atcapturing the spatial biases that characterize the syndrome withoutexploring wider aspects of lesioning, where neglect may emerge in
380
400
380
400 BA
300
320
340
360
Tim
e (m
s)
PV
CJ
WMPV-AcIn
300
320
340
360
Tim
e (m
s)
PV
CJWMPV-TD
220
240
260
280
Rea
ctio
n T
SF
PV
220
240
260
280
Rea
ctio
n T
SF
PV
2 3 4 5 6 180
200
Display size2 3 4 5 6
180
200
Display size
400
320
340
360
380
400
e (m
s)
CJ
WMPV-TD AcIn
C
240
260
280
300
Rea
ctio
n Ti
me
SF
PV
2 3 4 5 6 180
200
220
Display size
R
Figure 15. A: Simulation of search under conditions of reduced top-down excitatory guidance. B: Reducedactive inhibition. C: A combination of both A and B.
19BRIDGING THE GAP BETWEEN PHYSIOLOGY AND BEHAVIOR

the context of other deficits. One interesting possibility offered byspiking-level models is that some of the nonspatial deficits asso-ciated with neglect may stem from basic biological constraints oninformation processing. These constraints can be captured by suchmodels.
Within the framework of a spiking-level model, a neurologicalinsult such as a stroke can be modeled very simply (and plausibly)by removing the number of neurons available within a given pool.This will have several consequences. One is that it will generallyadd to the level of noise operating within the system, because noiseis a function of the number of neurons present within the network(noise - √firing rate/number of neurons in the population). Anatural prediction, then, is that the performance of patients will bemore variable than that of control participants, as neurons areremoved from the model to create the lesioned state. Figure 18Apresents data from patients with posterior parietal lesions on form–color conjunction search and matched single-feature search tasks(for a form and a color-defined target), for targets in their contra-and ipsilesional fields.4 It is evident that there is an increase in thevariance in the contra- relative to the ipsilesional field, and thiswas greatest for the conjunction condition.
We have simulated these generic effects of lesioning in thesSoTS model. The model was lesioned by removing a percentageof the neurons in the pools representing the left side of the locationnetwork (Mavritsaki et al., 2009) but keeping the other parametersconstant. The model was run with different random seeds for thePoisson noise in the firing rates, and with an average of 10% of theneurons on one side lesioned (how many units were lesioned wasvaried randomly). This lesioning level was selected by reducingthe number of neurons until some change in the behavior wasobserved. Figure 18B illustrates that the lesioned model showed anincrease in variability in the contra- relative to the ipsilesional
field, particularly in conjunction search. The effect emerges in themodel because reducing the number of neurons present increasesthe level of noise present, and this leads to greater variance acrosstrials. The effects of noise are particularly influential when there isgreater competition for selection (for conjunction relative tosingle-feature search). This points to the importance of looking atthe variance as well as the mean levels of performance in neuro-psychological patients—an issue that emerges naturally when le-sioning at the spiking neuron level but that is not suggesteddirectly by higher level simulations.
As noted in Study 1, brain lesions can have specific effects at amicrogenetic level; Posner and Petersen (1990) argued that there islocalized control of arousal systems within the right hemisphere ofthe brain through lateralization of the norepinephrine regulationsystem. This can decrease neurotransmitter function generally, sothat there is a performance detriment on both sides of space. Theysuggested that this was a contributory factor to neglect being moreprevalent after right than left hemisphere damage (cf. Heilman &Valenstein, 1979). Consistent with this, Malhotra et al. (2005)found that the deficits in spatial selection associated with neglectdecreased when patients were administered a drug that increasedexcitatory neuron–transmitter function. To capture such effects,Mavritsaki et al. (2009) contrasted effects of (solely) removingneurons from pools on one side of the location map in sSoTS, withthe effects of doing this plus varying the level of NMDA neuro-transmitter within the model (mimicking changes associated with
4 Data were collected over 12 patients with posterior parietal lesions,mean age 63 years. The display conditions matched those reported in Study5. The single-feature task involved search for a blue H target amongst blueA distractors (form feature) or search for the same stimulus amongst greenH distractors. The same target was used in the conjunction task, but thedistractors were half blue A distractors and half green H distractors. Thesingle-feature data are averaged across the two feature targets.
140Standard
100
120
m)
Standard
ReduceexcitationReduceinhibition
60
80
ope
(ms/
item inhibition
Reduce both
20
40
Slo
0200 400 600 800 1000 1200 1400 1600 1800
Previewduration(ms)Preview duration (ms)
Figure 16. Predictions from the spiking selection over time and space(sSoTS) model concerning the slope of the search function (ms/item) as afunction of the preview duration under conditions of a secondary task load(with reduced top-down guidance, active inhibition, or a combination).
30
15
20
25
ms/
item
)
5
10
15
Slop
e (m
Reduced inhibition
T ( d di hibiti )
0500 900 1000
Secondary task + preview duration
Top-up (reduced inhibition)
Figure 17. Predictions from the spiking selection over time and space(sSoTS) model for the slope of the search function (ms/item) as a functionof the preview duration given under secondary task conditions (the reducedinhibition condition) and when the same conditions are preceded by atop-up preview (500 ms) prior to the secondary task period.
20 MAVRITSAKI, HEINKE, ALLEN, DECO, AND HUMPHREYS

damage to the norepinephrine system; Posner & Petersen, 1990).Damage to the location map alone strongly affected the detectionof targets on the impaired side of space. This deficit was moreserious on conjunction search than on feature search, reflecting thegreater competition for selection that characterizes conjunctionsearch. This matches human neuropsychological data (Eglin, Rob-ertson, & Knight, 1990; Riddoch & Humphreys, 1987). The samelesion, when combined with reduced neuromodulation of synaptictransmission, led to more marked impairments for a given degreeof lesioning. The effect was to exaggerate the deficit with con-junction targets, especially when targets fell in the contralesionalfield. In addition to this, problems emerged in the detection of ipsi-as well as the contralesional targets (there was about a 27%decrease in performance for ipsilesional conjunction targets, withstandard vs. reduced NMDA). These results are presented inFigure 19.5 Thus, over and above the effects of increased noise,there may be selective effects on neuromodulation from alteringthe central regulation of neurotransmitter function. This factoremerges naturally from models that incorporate neurotransmitterfunctions while also predicting whole-system behavior (here, vi-sual search). Changes in arousal have not been examined in higherlevel simulations of neglect.
Time Course After Lesioning
As well as simulating overall aspects of spatial search, as noiseand neurotransmitter levels vary, sSoTS also simulates deficits invisual search over time. As we have noted, lesions of the PPCgenerate selective problems in preview search in humans, mea-sured relative to a single-feature search baseline (Humphreys et al.,
2006; Olivers & Humphreys, 2004). Lesioning the map of loca-tions in sSoTS, even without additional changes in arousal, gen-erates a deficit in preview search similar to that found in PPCpatients, with search being particularly difficult for contralesionaltargets. Figure 20A presents the slopes of the search functions forthe single-feature and preview conditions (efficiency/item) for apreview duration of 1,000 ms and an average 10% lesion on oneside of the location map. There was a clear and selective loss ofsearch efficiency for contralesional targets in the preview condi-tion. In sSoTS this deficit in preview search arises because lesion-ing increased the time to accumulate information from the preview(especially on the lesioned side of the field), so that previews werenot inhibited when the target appeared. In addition, there was aslowing down of target selection on the contralesional side. Thenet result was that there was increased competition for selectionfor contralesional targets. This increased competition is demon-strated in Figure 21 (note the activation for the pool of unitscorresponding to the old [blue A] distractors). Although competi-tion increased across single-feature as well as conjunction andpreview search, the effect of lesioning was greatest in the latterconditions due to the overlap of features across targets and dis-tractors in conjunction and preview search.
The sSoTS results are consistent with lesions to the PPC leading topoor spatiotemporal segmentation of old previewed distractors fromnew search items. This spatiotemporal segmentation account contrasts
5 The data here are presented in terms of RT/proportion correct(Townsend & Ashby, 1983), to provide a single processing efficiencymeasure where reaction times and errors are combined.
140 140
Contralesional Ipsilesional
A
6080
100120140
ev (m
s)single feature
j ti80
100120140
v (m
s)
single feature
A
0204060
St. d
e conjunction
0204060
St. d
e conjunction
8 16Display size
08 16
Display size
100120140
ms) 100
120140
ms)
B
20406080
St. d
ev (m single feature
conjunction
20406080
St. d
ev (m single feature
conjunction
08 16
Display size
08 16
Display size
Figure 18. A: Data from patients with posterior parietal cortex (PPC) lesions showing the variability (st. dev)of reaction time in single-feature and conjunction search conditions, as a function of whether targets arepresented in the contra- or ipsilesional field. B: Comparable data from the spiking selection over time and space(sSoTS) model when units on one side of the location map are lesioned.
21BRIDGING THE GAP BETWEEN PHYSIOLOGY AND BEHAVIOR

with other accounts of the effects of posterior parietal lesioning. Forexample, one influential account of PPC lesions is that they lead toimpaired spatial disengagement of attention from the ipsilesional tothe contralesional field (Posner, Walker, Friedrich, & Rafal, 1984).According to this account, a deficit for contralesional targets inpreview search may arise because patients have difficulty disengagingattention from ipsilesional distractors in the preview. Olivers andHumphreys (2004) discarded a spatial disengagement account, how-
ever. This account predicts that performance should be most disruptedwhen the preview items fall in the ipsilesional field and the newsearch items in the contralesional field. In contrast to this, Olivers andHumphreys found that patients performed relatively well in thatcondition and suffered most when the old and new stimuli werespatially overlapping (especially when both the old stimuli and thetarget were presented on the contralesional side). Rather than fitting adisengagement account, these data are consistent with patients having
Contralesional Ipsilesional
A
1200
1500
1800
rop.
cor
rect
single feature 1200
1500
1800
rop.
cor
rect
single feature
300
600
900RT
(ms)
/pr conjunction
300
600
900
RT(m
s)/p
r conjunction
4 6Display size
4 6Display size
B
1200
1500
1800
p. c
orre
ct
single feat re 1200
1500
1800
. cor
rect
300
600
900
1200
RT(m
s)/p
rop single feature
conjunction
300
600
900
1200
RT(m
s)/p
rop. single feature
conjunction
3004 6Display size
3004 6Display size
Figure 19. A: Data from patients with posterior parietal cortex (PPC) damage showing the efficiency ofsingle-feature and conjunction search (RT/proportion correct) with contra- and ipsilesional targets. B: Simula-tions with the spiking selection over time and space (sSoTS) model after unilateral lesioning of the location mapfor single-feature and conjunction search with contra- and ipsilesional targets. RT % reaction time.
100
120
/item
)
Standard506070
e m)
A B
40
60
80
ope
(effi
ency
/
Lesioned(contra)Lesioned(ipsi)20
304050
Sear
ch s
lope
effic
ienc
y/ite
m
Single featurePreview
0
20
400 600 800 1000 1200 1400 1600 1800
Preview duration
Slo ( p )
010
Contralesional Ipsilesional
Field
(e
Figure 20. A: The slope of the search function (based on a measure of processing efficiency, RT/proportioncorrect) for the spiking selection over time and space (sSoTS) model after lesioning of the location map, forsingle-feature search (blue H vs. blue As) and preview search (blue H vs. green Hs and blue As). B: The slopeof the search function (using an efficiency measure) for the standard and lesioned versions of sSoTS as a functionof the duration of the preview. The slope for targets in the lesioned field reduces over time, but, across the timeperiods sampled, it does not reach the level found in the standard (nonlesioned) condition.
22 MAVRITSAKI, HEINKE, ALLEN, DECO, AND HUMPHREYS

generally poor spatiotemporal segmentation, with the problemsemerging most strongly when the time course of processing of targetsand old distractors are both delayed (preview and target in the con-tralesional field). Mavritsaki et al. (2009) reported a simulation of thisresult.
To date, empirical studies of the effects of PPC lesions on previewsearch have examined performance only under preview durations that,in normal participants, produce an asymptotic level of performance.An examination of the time course of processing in the lesionedversion of sSoTS is presented in Figure 20B. These simulationsindicate that the deficit for contralesional targets can extend across awide range of preview durations, including those at least double thedurations required for normal participants to reach asymptotic searchperformance (e.g., previews of 1,800 ms, in Figure 20B). In addition,the model predicts that, for patients, the search slope for contralesionaltargets under preview conditions remains higher than that for ipsile-sional targets, even when the slopes reach their asymptote. Thiscontrasts with the results from our simulations of dual-task perfor-mance, where search does eventually reach the same asymptote as thestandard (single-task) preview condition. This contrast between dual-task effects and lesioning arises because the basic activation withinthe location map of the model is affected by removing neurons but notby altering top-down activity prior to the preview. Due to the gener-ally reduced activation, contralesional new items do not benefit somuch from top-down activity (excitation and inhibition), which nor-mally contributes to the competitive advantage for the target overdistractors. The net result is that there remains a residual cost tocontralesional targets in preview search, because an abnormal level ofcompetition remains across even long time courses. In addition, thereis heightened competition for selection from new items appearing inunlesioned areas of field. In contrast, under dual-task conditions thenew items eventually gain a full advantage from any top-down bias,and there is not unbalanced competition across the visual field. As aconsequence, performance reaches the standard asymptote once (de-layed) adaptation takes place.
Prediction 4. The examination of lesioned performance acrossthe time course gives rise to a fourth prediction, which is that PPCpatients should show a residual deficit in preview search even ifthe preview is presented for a prolonged duration. Without runningthe detailed neural-level simulations, it is not clear that a differencebetween the effects of brain lesion and of dual-task load would beevident. We tested the new prediction from sSoTS for a different
profile of lesioning effects over different preview time courses inStudy 5D.
Study 4: Simulating fMRI Data
Cognitive analyses of the functional components making up agiven processing system have, over the past 15 years, been com-plemented by imaging studies that generate neural-level data dur-ing task performance (e.g., using positron emission topography[PET] and fMRI). These studies essentially correlate neural activ-ity (via the BOLD signal in fMRI) with effects of manipulatedstimulus and task variables in order to identify which brain regionssupport which component processes. However, it is one thing tolink activity in cortical regions to variables in tasks and another toidentify the functional role of those regions in the task. Mostcommonly, investigators adopt an empirical approach to identifyingthe functional role of brain regions identified through imaging—forexample, by manipulating an appropriate variable and measuring itsjoint behavioral and neural effects. Problems can arise though when agiven variable affects more than one process—an example is previewsearch, because there is evidence for both inhibitory and excitatorycomponents (suppressing distractors and biasing search to new tar-gets) contributing to performance (e.g., Braithwaite et al., 2005). Howcan we distinguish areas linked to the inhibitory and the excitatorycomponents of search?
Spiking-level models can simulate imaging (e.g., fMRI) as well asbehavioral data, because synaptic outputs in different regions of themodel can be combined with an assumed hemodynamical response(HDR) function (Glover, 1999) to predict the BOLD function mea-sured in fMRI studies (see Corchs & Deco, 2004; Deco, Rolls, &Horwitz, 2004; Humphreys, Mavritsaki, Allen, Heinke, & Deco,2009; Stemme, Deco, Busch, & Schneider, 2005; see Logothetis,2008; Logothetis et al., 2001, for physiological support for this ap-proach). Note that these simulations depend on having synaptic ac-tivity directly available to feed into the HDR function.
There have now been four studies of human visual search overtime using the preview paradigm (Allen, Humphreys, & Matthews,2008; Humphreys, Kyllingsbaek, et al., 2004; Olivers, Smith,Matthews, & Humphreys, 2005; Pollmann et al., 2003). In eachcase, preview search has been associated with increased activationof the PPC, including the superior parietal lobe and the precuneus.This activation of the PPC could reflect either inhibition of the
Figure 21. Activation in the location map in the lesioned version of the spiking selection over time and space(sSoTS) model in preview search (1,000-ms preview) for (A) four and (B) six items. The shading across the leftside of the map indicates the lesioned area.
23BRIDGING THE GAP BETWEEN PHYSIOLOGY AND BEHAVIOR

preview (e.g., due to the activation of inhibitory interneurons),top-down excitation of target features, or both. These differentpossibilities can be prized apart by combining fMRI studies withcomputational modeling. For example, the sSoTS model uses bothactive inhibition (applied to the features of old distractors) andactive excitation (applied to the features of the expected target) inorder to optimize visual search over time. Now, let us suppose thatthe task is to search for a new blue vertical target that appearsamongst new blue A horizontal distractors and that follows a set ofold green vertical distractors. In such a search task, excitationwould be given to the blue and vertical feature maps (correspond-ing to the target’s features), while active inhibition would be givento the green and vertical maps (corresponding to the features of thedistractors in the preview). We can then extract activation in themodel reflecting the positive and inhibitory biases:
(a) Active excitation % (activation for target form – activationfor distractor forms, summed across their respective featuremaps) " (activation for target color – activation for distractorcolor, summed across their respective maps)
(Vertical – Horizontal " Blue . Green).
(b) Active inhibition % (activation for distractor form –activation for target form, summed across their respectivefeature maps) " (activation for distractor color – activationfor target color, summed across the respective feature maps)
(Horizontal – Vertical " Green . Blue).
The resulting activation, pooled across the maps, can then beconvolved with the assumed HDR to generate the HDR reflectingactive excitatory and inhibitory biases in the model, and the HDRspredicted by the model can be used as regressors in the analysis ofthe fMRI data. This does more than simulate an HDR by aspecified model; it uses the activity in the model associated with aparticular (excitatory or inhibitory) function to identify the role ofthe activation patterns in different brain regions. This was done byMavritsaki, Allen, and Humphreys (2008, 2010), with the param-eters of sSoTS set to match human behavioral data on single-feature, conjunction, and preview search. Mavritsaki et al. (2008,2010) found that distinct regions of the PPC and extrastriate visualcortex were independently correlated with the activity profile overtime, for the two types of bias. The active inhibitory bias signifi-cantly predicted the HDR function in the precuneus, while theactive excitatory bias significantly predicted the HDR function inmore lateral parietal cortex (see Figure 22). Thus, activation pat-terns associated with particular functions in the model were able toseparate distinct patterns of activation found in the fMRI data.These results suggest that the cluster of regions activation in thePPC under conditions of preview search may be involved infunctionally distinct computations in human visual selection.
One noteworthy aspect of these simulations of fMRI data is thatthe activation in the model is not bound to one anatomical regionwithin the model, as activity was pooled across the feature maps.Here the analogy from the model is not at an anatomical but at afunctional level—functional activity representing the changingactivity profile across feature maps linked to either top-downexcitation or inhibition correlated with activity in particular brain
regions. It follows that these brain regions may provide a source ofthe activation profiles evident in the feature maps in the model.
Mavritsaki et al. (2010) also carried out a more direct analysisof topological parallels between sSoTS and brain activity. To dothis, activity within the location map was summed and convolvedwith the assumed HDR and then correlated with the brain activa-tion recorded in an fMRI study of single-feature, conjunction, andpreview search conducted by Allen et al. (2008). There was onereliable correlation, which was between the time course of neuralactivity summed across the location map and neural activity insearch—with the correlation found in relation to BOLD activity ina region around the right temporoparietal junction (TPJ; see Figure23). This result is of considerable interest, given that the model-directed fMRI analysis was performed at a whole-brain levelwithout any prior constraints. The right TPJ has been identified asplaying a critical role in human visual selection, and lesions of thisregion are associated with clinical deficits in selection such asunilateral neglect.6 Corbetta and Shulman (2002) have argued thatthe right TPJ area serves as a “circuit breaker,” signaling thepresence of task-related stimuli in the environment that attentionneeds to be switched to. Shulman, Astafiev, McAvoy, Davossa,and Corbetta (2007) have further proposed that one role of theright TPJ is to filter out irrelevant distractors. The role of thelocation map in sSoTS bears some similarities to both ideas. In
6 Note that Mavritsaki et al. (2009) simulated neglect by lesioning thelocation map in sSoTS.
Figure 22. Brain areas where the blood-oxygen level-dependent (BOLD)signal in preview search showed significant correlation with either top-down excitation (red) or active inhibition (blue) in the spiking selectionover time and space (sSoTS) model, with the excitation and inhibitionvalues pooled across specific maps. From “Decomposing the Neural Mech-anisms of Visual Search Through Model-Based Analysis of fMRI: Top-Down Excitation, Active Ignoring and the Use of Saliency by the RightTPJ,” by E. Mavritsaki, H. Allen, and G. W. Humphreys, 2010, NeuroIm-age, 52, p. 940. Copyright 2010 by Elsevier.
24 MAVRITSAKI, HEINKE, ALLEN, DECO, AND HUMPHREYS

sSoTS, activation in the location map provides information aboutthe likely presence of a target, which can then act as an input toother response-related systems that, for example, program an eyemovement to that position. The pattern of activity in the locationmap also reflects the filtering-out of activity from distractors—there is a sharper profile of activity in the location map when thereis reduced competition for a target from the distractors (see Figure6). It should be noted, though, that the activity used for thesesimulations was pooled across the locations within the map. Thusthe observed correlation to activation in the human right TPJ doesnot necessarily indicate a topographic organization of the neuronsin this region, but rather how target detection varies across time. Itis also noteworthy that, in our analysis, activity correlated with thelocation map in the model was localized within the right hemi-sphere even though the search stimuli (including targets) werepresented on both sides of space. This suggests that the locationmap may actually have bilateral receptive fields and be activatedby stimuli on the right as well as the left side of space. Whateverthe case, the simulations indicate that both functional (here, forexcitatory and inhibitory processes in selection) and anatomicallinks (the TPJ and the location map) can be made on the basis ofdirect simulations of fMRI from neural-level models.
If the location map of sSoTS does mimic activation in the rightTPJ, then we can derive neural-level predictions about how acti-vation in this brain region may vary across different search con-ditions. For example, both experimental and modeling work hasdemonstrated that preview search is disrupted when participants
carry a working memory load during the preview (Humphreys,Jolicoeur, & Watson, 2002; see Figure 15 for simulations here),which reflects increased competition for target selection from the olddistractors when top-down influences on search are decreased. Underthese conditions, the contrast between target and distractor activationis reduced (see Figure 24). If the right TPJ reflects this contrast, thenactivation in this region should decrease when search is carried outwith a load through the preview period. Note that search itself be-comes more difficult under these conditions, so a decrease in activa-tion in the right TPJ would suggest that this region does not reflectsearch difficulty. Instead it would be consistent with the right TPJreflecting target–distractor contrast (saliency).
Prediction 5. We predict that, relative to standard previewsearch, activation in the right TPJ should reduce when a load isintroduced during the preview period. This was tested in Study 5E,where we reevaluated data from Allen et al. (2008), who usedfMRI to study search in these two conditions.
Study 5: Tests of the Predictions
We have derived five novel predictions that emerge from thesSoTS model: (a) Impairments in selection can reflect generallevels of arousal even when spatial biases are minimized in pa-tients (Study 1); (b) there should be a prolonged time course ofpreview search under dual-task load conditions, but search canreach the same asymptote as under no load (Study 2); (c) there arebenefits from giving a top-up preview prior to a preview beingpresented under dual-task conditions, and the benefits of thistop-up should increase with increases in the exposure of thepreview under dual-task conditions (Study 2); (d) in patients withlesions including the proposed location map, any deficit in detect-ing a contralesional target under preview conditions should de-crease as the preview interval lengthens; however, search maynever reach the same asymptote as that found in nonlesionedcontrol participants; and (e) the BOLD signal in the right TPJshould be modulated when a dual-task load is introduced to pre-view search, but not in other search conditions. These predictionswere evaluated in Study 5. These predictions emerge from thespiking-level simulations that attempt to incorporate biologicallyplausible parameters into the model.
Study 5A: Selection and Deficits in Arousal/SustainedAttention
In a first study we assessed selection in a case series ofpatients with posterior brain lesions and evaluated whetherdeficits in selection were related to changes in arousal/sustainedattention. Posner and Petersen (1990) proposed that arousal/sustained attention was modulated by a right hemisphere later-alized system and that activation of this arousal/sustained at-tention system was required in order to maintain attentionalselectivity. Robertson and Manley (1999) extended this idea topropose that reduced arousal/sustained attention adds to thelateralized biases in selection after right hemisphere lesion, togenerate symptoms of unilateral neglect—a disorder typicallyassociated with right hemisphere lesions (Heilman & Valen-stein, 1979). The link between reduced arousal and poor selec-tion was also apparent in Deco and Rolls’s (2005a) simulationsof single-cell recording data, where decreasing arousal (simu-
Figure 23. The brain region (right temporoparietal junction [TPJ]) whereactivity during search correlated with the hemodynamical response (HDR)derived from activity over time pooled across the location map of thespiking selection over time and space (sSoTS) model. From “Decomposingthe Neural Mechanisms of Visual Search Through Model-Based Analysisof fMRI: Top-Down Excitation, Active Ignoring and the Use of Saliencyby the Right TPJ,” by E. Mavritsaki, H. Allen, and G. W. Humphreys,2010, NeuroImage, 52, p. 940. Copyright 2010 by Elsevier.
25BRIDGING THE GAP BETWEEN PHYSIOLOGY AND BEHAVIOR

lated by reducing the effects of NMDA on the activation func-tions) disrupted the ability of the model to select a precuedtarget. In Study 5A we tested whether poor selection in patientswith posterior brain lesions was associated with poor arousal/sustained attention. Selection was measured in terms of thecontrast between reporting stimuli on trials with one and twoitems, and arousal was manipulated by providing an arousingbut spatially noninformative tone prior to the occurrence ofstimuli. To remove effects of lateral spatial biases on selection,we presented targets and distractors above and below fixation,and we tested whether patients with posterior right hemispherelesions not only showed a selection impairment, but, specifi-cally, whether their selection was modulated by changingarousal.
Method
Participants. There were 15 patients, all of whom had suf-fered strokes and all of whom had lesions involving posterior brainregions. Eight patients had damage that included the right PPC;seven had damage to either occipital regions or to left parietalcortex. Clinical details on the patients are presented in Table 1, andanalyses of magnetic resonance imaging (MRI) scans are shown inFigure 25. In addition to the patients, a group of five age-matchedcontrol participants, without any history of brain lesion, was tested(age range 64–80 years).
Apparatus and stimuli. A Pentium IV computer with anATI RAGE PRO 128-MB graphics card controlled the stimulusdisplays and responses. The task was programmed and run onthis computer using E-Prime (Schneider, Eschman, & Zucco-lotto, 2002a, 2002b). The stimuli were displayed on a SamsungSynchMaster 753s color monitor. The monitor’s resolution was1024 / 768 pixels. The presentation of the stimuli was syn-
chronized with the refresh rate of the monitor. Frame rate wasfixed at 85 Hz.
Design and procedure. The display was viewed from adistance of approximately 60 cm. Each trial began with thepresentation of a fixation cross for 500 ms that appeared alone(standard condition) or with a 200-ms tone at the onset of thecross (arousal condition). The 500-ms cue–target display inter-val was chosen here because prior work has indicated that thisis an optimal time to change tonic arousal (Posner & Boies,1971). This was followed by a target display containing one ortwo letters, each 3° of visual angle centered 3° above or belowfixation. The stimuli were the letters A–D, which occurredequally often on one- and two-letter trials and equally oftenabove and below fixation. In both the standard and arousalconditions there were 48 one-item trials (24 above and 24below) and 48 two-item trials. One- and two-item trials ap-peared at random, and the order of the standard and arousalconditions was randomized across participants. The task was toidentify the letter. The stimuli were presented in white on ablack background. The stimulus durations were 500 ms for allparticipants.
Results
The data for the patients are depicted in Figure 26. The controlsscored at ceiling, with only 16 errors out of 480 on two-item trials(3.4% error rate). Trials for the patients were scored as beingcorrect or not and analyzed in a mixed-design analysis of vari-ance (ANOVA) with the factors being arousal (standard vs.arousal condition), number of items (one vs. two), and patientgroup (right PPC patients vs. left hemisphere/occipital pa-tients). There were reliable main effects of arousal, F(1, 13) %40.4, p 0 .001, *p
2 % .757, and number, F(1, 13) % 110.29, p 0.001, *p
2 % .895. There were significant interactions betweenarousal and patient, F(1, 13) % 32.97, p 0 .001, *p
2 % .717;arousal and number of items, F(1, 13) % 17.39, p 0 .001, *p
2 %.572; and between arousal, number of items, and patient group,F(1, 13) % 14.19, p 0 .01, *p
2 % .522.The three-way interaction was decomposed by analyzing the
data for each patient group separately. The patients with damage tothe right PPC showed reliable effects of arousal and number ofitems, F(1, 7) % 164.61 and 54.97, both ps 0 .001, *p
2 % .959 and.887, respectively. The interaction was significant, F(1, 7) %32.09, p 0 .001, *p
2 % .821. There was no effect of the arousalcondition on one-item trials (t 0 1.0), but there was on two-itemtrials, t(7) % –9.0, p 0 .001.
The left hemisphere/occipital group showed only a significanteffect of item number, F(1, 6) % 61.74, p 0 .001, *p
2 % .911, butneither the effect of arousal nor the Arousal / Number interactionwere reliable, F(1, 6) % 1.09 and 2.55, both ps 1 .05.
We also compared the performance of the right PPC and the lefthemisphere/occipital patients in each condition. Performance dif-fered only in the standard condition on two-item trials, t(13) %–2.18, p 0 .05.
Discussion
The patients performed worse than the controls, and allencountered some difficulty on identifying both letters on two-
0.3
0.35
z)
0.25
0.3
ctiv
atio
n (H
z
0.15
0.2
al T
arge
t Ac
0.05
0.1
Diff
eren
tia
0Normal PV PV & WM
(TD)PV & WM
(AcIn)PV & WM
(TD & AcIn)
Figure 24. The differential rate of firing (Hz) summed over units at thetarget location, compared with the rate over firing across distractor loca-tions, within the location map of the spiking selection over time and space(sSoTS) model. Data are shown for the normal preview (PV; no load),when there is reduced top-down excitation (TD), reduced active inhibition(AcIn), and a combination of these factors (TD & AcIn). WM % workingmemory. The error bars represent 1 standard error.
26 MAVRITSAKI, HEINKE, ALLEN, DECO, AND HUMPHREYS

item trials. The right PPC patients tended to perform better thanthe left hemisphere/occipital patients on one-item trials, whilstperforming reliably worse in the standard condition with two-item displays. This points to there being a deficit in selectingmultiple items after right PPC damage. In addition to this, therewas a selective effect of including an arousing auditory cue onthe performance of the right hemisphere patients, who selec-tively improved report on two-item trials. There was no evi-dence for any consistent bias for reporting upper or lower fielditems, across the patients. These results are consistent with theselective deficit in the right PPC patients being linked to poorarousal, which is improved in the arousal condition. It is un-
likely that this effect of the arousal cue was solely due to therelatively poor performance of the right PPC patients in thestandard two-item condition. The four worst performing lefthemisphere/occipital patients showed 0% improvement in thearousal condition, whereas four right PPC patients with a meanoverall score matched to those of the worst left hemisphere/occipital patients had a mean improvement of 15% on two-itemtrials in the arousal condition. The data point to differences inarousal rather than selection difficulty per se.
These results fit with Prediction 1 derived from the simulationsof Deco and Rolls (2005a). There can be problems in selectionlinked to poor arousal that can be moderated by increasing arousal.
Figure 25. Lesion transcriptions for the patients tested in Study 5A. The figure depicts T1 structural scans(taken at 3T, with a 1-mm isotropic resolution). Colored-in light gray areas and colored-in dark areas reflect,respectively, changes in gray and white matter in the patients relative to scans from 201 control participants aged40" years with no history of brain lesion. The changes were detected using voxel-based morphological analysisin SPM5 (http://www.fil.ion.ucl.ac.uk/spm/software/spm5/), and they are overlaid here on a standard multislicetemplate in MRIcron. The images were first segmented into gray matter, white matter, and cerebrospinal fluid(CSF), and the resulting tissue class images were normalized without modulation (i.e., to compensate for theeffect of spatial normalization). Images were smoothed with a Gaussian kernel of 2 / 2 / 2 mm. The analysesare based on one-sample t tests with three covariates: healthy gray/white matter versus patient gray/white matter,age, and gender. All areas are family-wise error corrected with p % .05 and an extent threshold specifying thatonly significant blobs containing !100 voxels be included in the lesion. The panels represent patients with (A)posterior right hemisphere lesions or (B) posterior left hemisphere or occipital lesions.
27BRIDGING THE GAP BETWEEN PHYSIOLOGY AND BEHAVIOR

The present data suggest that these deficits are encountered mostnotably after right PPC damage.
Study 5B: The Time Course of Preview Search UnderLoad Conditions
The sSoTS model also makes further predictions based on itstime course of processing, especially under preview search condi-tions. One prediction is that, even though search efficiency de-creases when a load is introduced through the preview, searchshould eventually reach the same asymptote as that found underconditions of no load. Prior behavioral studies of load effects havereported only decreased search efficiencies (e.g., Humphreys et al.,2002), but they may not have tracked a sufficiently long timeperiod to enable the asymptote to be reached under load condi-tions. This was tested here by examining preview search underdual-task conditions across longer ranges of preview durations.
Method
Participants. There were eight participants aged between 20and 25 years, four male and four female. All had either normal orcorrected-to-normal vision.
Apparatus and stimuli. The displays were presented on a15-in. monitor driven by a Pentium 200 PC with a VESA graphicscard and running at a resolution of 800 / 600 pixels. The stimuliwere generated by a purpose-written Turbo Pascal program (Ver-sion 7.0), which also recorded RTs and responses. Search displayswere constructed by randomly plotting search stimuli within avirtual 8 / 8 grid, subtending approximately 8.3° / 8.3° in visualangle (at approximately 75 cm). The target was a blue H and thedistractors were blue As and green Hs. The letters were rectangularand approximately 0.6° high / 0.4° wide. The green and bluecolors (Commission Internationale d’Eclairage [CIE] values: 0.23,0.38 for green; 0.26, 0.32 for blue) were selected as being verysimilar to those used originally by Watson and Humphreys (1997),set to equal luminance using a flicker fusion test on the experi-menter (Ives, 1912).
Design and procedure. A trial began with a white fixationcross against a black background. In the single-feature and con-junction baseline conditions, this cross remained on the screen for2,500 ms, which was the maximum length of the preview. Onpreview trials the cross appeared for 250 ms and was then replacedby a series of numbers that appeared at fixation consecutively for250 ms each through the preview period. The numbers wereselected at random with the exception that the number 1 could
Figure 25. (continued)
28 MAVRITSAKI, HEINKE, ALLEN, DECO, AND HUMPHREYS

appear only once on a trial. Participants were asked to try anddetect whether a number 1 appeared. Prior studies have shown thatthis secondary task disrupts preview search (Watson & Hum-phreys, 1997). There were four preview periods: 750, 1,000, 1,500,and 2,500 ms. When the preview is presented without an additionalload task, search efficiency reaches an asymptote at the shortestinterval used here (Humphreys, Kyllingsbaek, et al., 2004; seeFigure 12 here). In addition to the letters at fixation, green Hstimuli were presented as a preview (either two, four, or eightitems, randomly determined, on a trial). At the end of the fixation(single feature, conjunction) or load-task period (preview), thesearch displays were presented. In the conjunction condition thedisplay contained four, eight, or 16 items. There was always a blueH target present along with 2 green Hs and 1 blue A (four-itemdisplay), 4 green Hs and 3 blue As (eight-item display), or 8 greenHs and 7 blue As (16-item display). In the single-feature condition,only the blue items were presented in the search displays (DisplaySizes 2, 4, and 8). The green H previews remained at the samelocations, and search displays matching those in the single-featurebaseline were presented. The task was to localize the blue H target,which fell randomly either to the left or right of fixation. Re-sponses were made by making a left or right mouse click, matchingthe left or right field for the target. In earlier studies of previewsearch, participants have made responses concerning either thelocation or a feature of the target that has always been present, andthe pattern of data has been similar to that found on classic targetpresent–absent tasks (e.g., Kunar, Humphreys, & Smith, 2003;Olivers & Humphreys, 2004). By presenting a target on every trial,we maximized the target-present data. Each of the six searchconditions was blocked, and the order of the blocks was randomlyassigned to the participants. There were 32 trials at each displaysize in each condition, leading to 576 trials per participant. Par-ticipants were instructed to remain fixated during the whole pre-view period.
Participants responded first to the location of the search target.In the preview conditions they were subsequently asked whetherthe target number 1 had appeared in the initial stream of numbers.Participants made a right mouse click if a number 1 had beenpresent and a left click if it had been absent.
Results
The error rates were low and did not vary systematically acrossthe conditions. The mean error rates are presented in Table 2 andwere not analyzed further. The mean RTs are displayed inFigure 27. In Figure 27a the data for the preview and single-feature
Standard condition Arousal condition
80
90
100
als
Left/occip patientsRight PPC patients
80
90
100
rials
Left/occip patients
Right PPC patients
40
50
60
70
% c
orre
ct tr
ia
40
50
60
70
% c
orre
ct tr
30
40
meti-2meti-1
Number of items
301-item 2-item
Number of items
Figure 26. The percentage of correct reports on one- and two-item trials for right posterior parietal cortex(PPC) and left hemisphere/occipital patients in a standard selection condition (left) and in an arousal condition(right, with an auditory precue; Study 5A). The error bars represent 1 SE.
Table 2Percentage of Errors in Studies 5B and 5C
Condition
Display size
2 4 8
Study 5B
Single feature 1.6 1.2 2.0Conjunction 0.8 3.5 2.0750-ms preview 1.2 2.0 1.81,000-ms preview 2.7 3.5 3.51,500-ms preview 0.4 2.0 2.32,500-ms preview 0.8 0.8 4.7
Study 5C
Single feature 3.1 2.7 3.1Conjunction 2.3 4.3 0.8350 " 750-ms preview 1.2 2.0 3.1350 " 1,000-ms preview 0.8 3.1 3.1350 " 1,500-ms preview 2.3 2.7 1.6
Note. The data are shown as a function of the number of blue itemspresent (i.e., half the items present in a conjunction display).
29BRIDGING THE GAP BETWEEN PHYSIOLOGY AND BEHAVIOR

conditions are plotted together (relative to the number of bluedistractors), and in Figure 27b the data are presented for thepreview conditions relative to the conjunction condition (plotsagainst the total number of distractors in the final search displays).The slopes for the functions, measured against the number of bluedistractors or the total number of distractors, are shown in Figures27c and 27d. In Figure 27c the zero preview duration is thesingle-feature baseline; in Figure 27D the zero preview conditionis the conjunction baseline. If, in the preview condition, there is noimpact of old green distractors, then search should be equivalent tothat found in the single-feature baseline (in Figures 27A and 27C).Comparisons relative to the number of distractors in the finaldisplay (in Figures 27B and 27D) assess whether the previewimproves search relative to when the initial display is absent (in theconjunction baseline).
The mean correct RTs were subjected to a two-factor repeated-measures ANOVA with the factors being condition (single feature,conjunction, and each preview condition) and display size (two,four, and eight, reflecting the number of blue distractors present).There were reliable main effects of condition and display size,F(15, 35) % 75.23, and F(2, 14) % 340.24, *p
2 % .915 and .98, bothps 0 .001, and a Condition / Display Size interaction, F(10,70) % 32.3, *p
2 % .822, p 0 .001.The interaction was assessed by comparing each preview con-
dition against the single-feature baseline. For the 750-, 1,000-, and1,500-ms previews, the interactions between condition (previewvs. single feature) and display size were significant, F(2, 14) %35.90, 18.22, and 5.19, *p
2 % .837, .722, and .426, respectively (allps 0 .025). For the 2,500-ms preview there was no effect ofcondition and no interaction with display size, F(1, 7) % 3.27,*p
2 % .318, p 1 .05, and F 0 1.0, respectively.
Discussion
The data show that, for preview durations of up to 1,500 ms,there remained a cost in search efficiency compared with thesingle-feature baseline, when participants performed a secondarytask during the preview period. However, at the longer previewduration (2,500 ms), this cost was completely eliminated. Theeradication of the secondary task cost is unlikely to be due toparticipants having time to read the target number into short-termmemory at the longest preview duration, which could lessen thesecondary task load. We separated out trials where the secondarytask target was present and when it was absent, because in thelatter condition participants would have to remain monitoring thenumbers at fixation throughout the preview period. There was noeffect of the presence of the secondary task target and no interac-tions (all Fs 0 1.0). We conclude that the effects of the secondarytask decrease if there is a sufficiently long preview duration. Thismatches Prediction 2 from sSoTS, which holds that there is a delayrather than an elimination of suppression under load conditionsdue to frequency adaptation to the preview. The data contradict theoriginal proposal from Watson and Humphreys (1997) that, underconditions of reduced resources, there would be less suppression ofthe preview irrespective of the preview’s duration.
Study 5C:Effects of Cognitive Load and Preview Top-Up
The third prediction from sSoTS is that, even when a secondarytask load is imposed across the duration of the preview leading upto visual search, there can be residual effects of having processedthe preview earlier (in a top-up period). Furthermore, this can
800
900
1000
)
Singlefeature750 PV 800
900
1000
Conjunction
BA
500
600
700
800
RT (m
s) 750 PV
1000 PV
1500 PV 500
600
700
800
RT (m
s) 750 PV1000 PV1500 PV2500 PV
4002 4 8
Number of blue items
2500 PV 4004 8 16
Number of blue items
30
40
50
/no.
blu
e ct
ors)
C D
30
40
50
dist
ract
ors)
0
10
20
0 750 1000 1500 2500
Slop
e (R
T/di
stra
c
0
10
20
0 750 1000 1500 2500
Slop
e (R
T/al
l
noitarud weiverPnoitarud weiverP
Figure 27. The mean correct reaction times (RTs) and the slopes of the search functions in Study 5B. A: RTsas a function of the number of blue stimuli, for four preview (PV) durations and a single-feature search task. Ineach preview condition, there was a secondary task load imposed. B: The data for the same preview conditionsin relation to the total number of items in the final search display, plus data for the conjunction baselinecondition. C: The slope of the single-feature (zero preview duration) and preview conditions against the numberof blue stimuli. D: The slope of the search functions for the conjunction condition (zero preview duration) andthe preview conditions, measured relative to the total number of stimuli in the final search display.
30 MAVRITSAKI, HEINKE, ALLEN, DECO, AND HUMPHREYS

occur even when the initial preview duration itself is not sufficientto optimize search (see Figures 13 and 17). This was examined inStudy 5C. In this experiment, participants received preview dura-tions of 750, 1,000, and 1,500 ms, during which time they alsocarried out a secondary task (monitoring for a target in a stream ofnumbers). In Study 5B, we demonstrated that performance in thepreview condition did not reach the single-feature baseline levelwith those durations. However, in contrast to the earlier study, weintroduced a top-up preview of 350 ms prior to the secondary taskstarting. This duration preview typically does not optimize searchperformance (Humphreys, Jung Stalmann, & Olivers, 2004). Weassessed whether, even though insufficient in its own right, thetop-up preview “pushed” processing of a prolonged preview intoits adaptation state, to generate maximum efficiency in the previewtask.
Method
Unless otherwise mentioned, the method was the same as forStudy 5B. There were eight participants (aged 19–26 years, sixfemale and two male). The preview conditions were altered so thata preview of 350-ms duration was inserted after fixation and priorto the start of the preview " load displays. There were threedurations of preview where the secondary task load was present:750, 1,000, and 1,500 ms. One other change was that the fixationtimes for the single-feature and conjunction baselines were 1,500ms. This provided a warning interval between that in the 350 "1,000- and 350 " 1,500-ms preview conditions.
Results
Errors were again infrequent, and there was no evidence of anyspeed–accuracy trade-offs. These data are presented in Table 2,and they were not analyzed further. The RT results are presentedin Figure 28.
The RTs were analyzed as for Study 5B, assigning all theconditions to a single factor (condition), with display size nestedwithin this. There were reliable main effects of condition anddisplay size, F(4, 28) % 41.90, and F(2, 14) % 103.56, *p
2 % .857and .937, respectively, both ps 0 .001. There was also a Condi-tion / Display Size interaction, F(8, 56) % 17.84, *p
2 % .718, p 0.001.
Comparisons were made between each preview condition andthe single-feature baseline. For the 350 " 750-ms preview condi-tion there was a reliable interaction between the condition and thedisplay size, F(2, 14) % 10.03, p 0 .01, *p
2 % .589. For the otherpreview conditions (350 " 1,000 and 350 " 1,500) neither themain effect of condition (vs. the single-feature baseline) nor theCondition / Display Size interaction was reliable (F 0 1.0 forboth interactions).
Discussion
A preview presented for 350 ms prior to a search display,without any imposed secondary task, is suboptimal for search(Humphreys, Jung Stalmann, & Olivers, 2004; Watson & Hum-phreys, 1997). Presenting a preview for this duration and thenwithdrawing attention through a secondary task, while leaving the
800
900
1000
)
Singlefeature350+750 PV 800
900
1000
Conjunction
BA
500
600
700
800
RT (m
s) 350+750 PV
350+1000 PV
350+1500 PV500
600
700
800
RT (m
s)
Conjunction350+750 PV350+1000 PV350+1500 PV
4002 4 8
Number of blue items
4004 8 16
Number of blue items
30
40
50
/no.
blu
e ct
ors)
DC
30
40
50
dist
ract
ors)
0
10
20
0 750 1000 1500
Slop
e (R
T/di
stra
c
0
10
20
0 750 1000 1500
Slop
e (R
T/al
l
noitarud weiverPnoitarud weiverP
Figure 28. The mean correct reaction times (RTs) and the slopes of the search functions in Study 5C. A: RTsas a function of the number of blue stimuli, for three preview (PV) conditions and a single-feature search task.In the preview conditions there was a 350-ms standard preview followed by either a 750-, 1,000-, or 1,500-mspreview when a secondary task was also imposed. B: The data for the same preview conditions in relation to thetotal number of items in the final search display, plus data for the conjunction baseline condition. C: The slopeof the single-feature (zero preview duration) and preview conditions against the number of blue stimuli. D: Theslope of the search functions for the conjunction condition (zero preview duration) and the preview conditions,measured relative to the total number of stimuli in the final search display.
31BRIDGING THE GAP BETWEEN PHYSIOLOGY AND BEHAVIOR

preview present, disrupts subsequent search. This matches datareported by Humphreys et al. (2002) and Watson and Humphreys(1997). The new result here is that, with exactly the same durationof initial preview, we showed that search did approximate theefficiency levels in the single-feature baseline if the subsequentdual-task preview period was lengthened. This again indicates thatwithdrawing attentional resources, by engaging participants in asecondary task, is not sufficient to eradicate the preview benefit.The results fit with the predictions of the sSoTS model, where theinitial top-up preview is sufficient to push activation toward anadaptation state, which is subsequently reached even when asecondary task is imposed during the following preview period.Once the preview enters this adaption state, an optimal previewbenefit can arise.
Study 5D: The Time Course of Preview Search AfterLesioning
When effects of a secondary task load are simulated, the sSoTSmodel generates efficient preview search but needs a prolongedpreview period (see Figure 16). This picture contrasts with the datawhen sSoTS was lesioned. After lesioning the model showedrelatively slow selection of targets falling on the affected side evenacross long durations of preview. We attribute this result to re-duced data-driven activation on the affected side, which slows anyaccumulation of information and any subsequent adaptation. InStudy 5D we assessed whether patients with PPC damage, match-ing the lesioning of the location map in sSoTS, would also showa residual deficit for contralesional targets in preview search.
Method
The method was the same as that in Study 5B except whereotherwise mentioned. We tested six patients with damage focusedaround the right TPJ (patients JB, MC, TM, MP, RP, and BS; seeFigure 25 and Table 1). Previews were presented for 1,000, 1,500,and 2000 ms, and followed by the search displays for an unlimitedperiod. In addition to this, blocks of single-feature and conjunctionsearch trials were run. Unlike previously, the patients had to makea mouse click response when they detected the target. When thisresponse was made, each occupied location in the search displaywas filled with a gray circle to cover the search letters. The patientswere then asked to move the mouse to the location where theyperceived the target. This procedure was adopted so that anydeficits with contralesional targets were not due to slowed initia-tion of a response to the affected side (because an initial simpledetection response was required). Targets appeared equally oftenin the left and right fields, and there were 96 trials per condition(16 per field per display size), making 480 trials in total. Thepatients performed the different trial blocks over periods of 2–3weeks, depending on the patient.
Results
The accuracy and error data were combined to create a singleefficiency score (RT/proportion correct; see Townsend & Ashby,1983). The data are plotted in Figure 29, showing RTs for thepreview conditions against the single-feature baseline (top) and theconjunction baseline (bottom), assessing performance, respec-
tively, against the number of blue items and the total number ofitems in the final search display. The slopes of the search func-tions, plotted against the number of blue items (in Panel a) and thetotal number of items (in Panel b), are shown in Figure 30.
Search efficiency was analyzed in a three-factor repeated-measures ANOVA with the factors condition (three preview con-ditions plus single-feature and conjunction baselines), visual fieldof target (contra- vs. ipsilesional), and display size (two or fourblue items). There were reliable main effects of condition, visualfield, and display size, F(4, 20) % 18.94, F(1, 5) % 25.19, and F(1,5) % 30.13, *p
2 % .791, .834, and .858, respectively, all ps 0 .001.All the interactions were reliable, including the three-way interac-tion between condition, field, and display size, F(4, 20) % 6.86,p 0 .001, *p
2 % .578.The three-way interaction was broken down by comparing the
preview conditions against the single-feature and then the conjunc-tion baseline. For each comparison between the preview and thesingle-feature condition, there was a significant interaction be-tween condition (preview vs. single feature), field, and displaysize: for 1,000, 1,500, and 2000 ms, F(1, 5) % 7.14, 8.17, and 8.04,*p
2 % .588, .62, and .62, all ps 0 .05, respectively. In each case, theslope of the search function was steeper for the preview relative tothe single-feature baseline, particularly for contralesional targets(see Figure 30).
Similar comparisons performed between the preview and con-junction conditions showed slightly different results across thedifferent preview durations. For the 1,000-ms preview there wasno effect of condition, and the interaction with display size andfield was not reliable, F(1, 5) % 2.70, p 1 .05, *p
2 % .351. For the1,500- and 2,000-ms previews there were main effects of condi-tion, F(1, 5) % 19.12 and 23.89, *p
2 % .793 and .83, both ps 0 .01,but no interaction with field or display size. For the 2,000-mspreview the interaction between condition, field, and display sizeapproached significance, F(1, 5) % 4.41, p 0 .10, *p
2 % .468.There was a trend for a lower slope for the preview than theconjunction condition, with the change being larger with contrale-sional targets.
Discussion
The data replicate prior studies of visual search in patients withdamage to the PPC. There was relatively poor search for contrale-sional targets, with the effect tending to be more pronounced forconjunction than single-feature-defined stimuli (the slope for con-tralesional conjunction targets here was 217 ms/item, vs. 41 ms/item for the single-feature condition; see Eglin et al., 1990; Rid-doch & Humphreys, 1987). In addition, and again replicating priordata, the PPC patients were selectively impaired at preview searchand indeed showed little preview benefit overall compared withthe conjunction baseline (in terms of search efficiency). Age-matched control participants showed asymptotic search perfor-mance, with little difference in slope for preview and single-feature baselines, for preview durations of 750 ms or so (seeOlivers & Humphreys, 2004). In contrast, even with previewdurations more than twice as long as this, the patients were stillrelatively impaired in the preview condition. There was a trend forsome benefit emerging (compared with the conjunction baseline)at the longest preview duration (see Figures 29 and 30), but eventhen there was a cost to preview search against the single-feature
32 MAVRITSAKI, HEINKE, ALLEN, DECO, AND HUMPHREYS

condition. We conclude that damage to the PPC makes it difficultfor any adaptation effects to emerge under preview conditions.This matches the results from sSoTS and occurs in the model whenlesions to the location map mean that the rate of gain in theaffected units is insufficient to benefit from any boost coming fromtop-down biases under preview conditions (for target features andagainst distractor features).
Study 5E: Predictions for fMRI
The final prediction derived from sSoTS concerned the brainactivation that we may expect according to whether preview searchis conducted under conditions of secondary task load. Underconditions of task load, the differential activation within the loca-tion map for the target relative to distractors decreases (see Figure24). Mavritsaki et al. (2010) have shown that there is a correlationbetween the HDR function predicted from the time course ofactivity in the location map and activity in the right TPJ in previewsearch. If this neural activity reflects the contrast between thetarget and distractors (i.e., the saliency of the target), then wepredict that, compared with standard preview search, activity in theright TPJ should decrease under conditions of secondary task load.Allen et al. (2008) measured BOLD activity using fMRI for bothstandard preview search and for preview search conducted whenparticipants were holding a load in working memory. Here wereturned to these data and extracted activity within the right TPJ
region found to correlate with the HDR derived from the locationmap in sSoTS, to test whether this region did show decreasedactivity under load conditions.
Method
The experiment and original data analysis were fully reported byAllen et al. (2008). In the basic preview condition, participants sawa set of blue faces (the preview, for 2 s) followed by a searchdisplay of red house distractors and a blue house target. The taskwas to localize the target (left or right of fixation). In the dual-taskcondition, participants saw a random display of dots for 500 msprior to the preview and search displays. They were instructed tokeep the dot pattern in working memory during the previewdisplay. For the current analysis, we selected a region of interest(ROI) based on the area found to correlate with the HDR functionderived from the model’s location map activity with a z score 13.We extracted time courses of activation from this area for thepreview and the preview " load conditions in Allen et al. andanalyzed the data on the basis of the mean activity within theregion in the two conditions (although the same results were alsoobtained using the peak activity; see Figure 31).
Results
The results are presented in Figure 31. There was a significantdecrease in activation within the right TPJ in the preview " load
Single feature
tegrat lanoiselispItegrat lanoiselartnoC
A
1400
1600pr
op. c
orre
ct)
Singlefeature1000 PV
g
1400
1600
prop
. cor
rect
)
Singlefeature1000 PV
800
1000
1200
ffici
ency
(RT/
p
1500 PV
2000 PV
800
1000
1200
ffici
ency
(RT/
p
1500 PV
2000 PV
8002 4
Number of blue items
Ef 8002 4
Number of blue items
Ef
ConjunctionB
1400
1600
prop
. cor
rect
)
Conjunction1000 PV
1400
1600
prop
. cor
rect
)
Conjunction1000 PV
800
1000
1200
ffici
ency
(RT/
p 1000 PV1500 PV2000 PV
800
1000
1200
ffici
ency
(RT/
p 1000 PV1500 PV2000 PV
8004 8
Number of blue items
Ef
8004 8
Number of blue items
Ef
Figure 29. Search efficiency (RT/proportion correct) for a group of right posterior parietal cortex (PPC)patients in Study 5D. A: The data against the number of blue items for the single-feature baseline and preview(PV) search with three preview durations, as a function of whether the target fell in the contra- or ipsilesionalfield. B: The results for the same preview conditions along with a conjunction condition, in this case plottedagainst the total number of items in the final search display. RT % reaction time.
33BRIDGING THE GAP BETWEEN PHYSIOLOGY AND BEHAVIOR

condition compared with the standard preview condition, F(1,8) % 5.804, p 0 .05, *p
2 % .42.
Discussion
The data match the prediction derived from sSoTS, if the rightTPJ region reflects the saliency of targets (determined by thecontrast between their activation and the activation of distractors):There was decreased activation in the preview " load conditioncompared with the standard preview search task. This result wasnot due to there being a general decrease in activation in thepreview " load condition. For example, Allen et al. (2008) re-ported that this condition led to increased activation in the cuneusand precuneus, regions that were also found to be activated whenparticipants ignored previews (even in a dummy preview condi-tion, where search displays were not presented but participantsprepared to ignore the preview). Allen et al. proposed that, in boththe preview and the load task, participants hold a working memoryrepresentation, though in the case of preview search they suppressthis representation (the preview) to help bias search to new stimuli.Critically, any increased activation due to the dot working memoryload did not lead to activation of the right TPJ. This fits with theproposal that the right TPJ responds to the presence of salient,behaviorally relevant stimuli (here, the target, relative to the dis-
tractors), perhaps to provide a signal to other response-relatedregions of cortex (see Corbetta et al., 2000). The saliency signalcarried by the right TPJ may reflect either enhanced activity for thetarget or decreased activation/filtering of distractors mediated bythis brain region. In either case, the data suggest that saliencydecreased when a working memory load was held during thesearch task.
General Discussion
We have presented an argument that computational modelingwithin a biologically plausible framework can provide a usefulmeans of linking neurophysiological studies of information pro-cessing through to whole-system behavior. Our argument has beenbased around the example of modeling human visual selection,where, using a consistent system architecture, we have shown thatdata at a number of neuroscientific levels can be simulated acrossa number of different neuroscientific levels: from single-cell elec-trophysiology (Study 1) through to whole-system behavioral ex-periments on visual search (Study 2), including also work onneuropsychological lesions of particular cortical regions (Study 3)and modeling fMRI data (Study 4). We have also argued thatmodeling using biologically plausible architectures can emphasizefactors that are stressed less in other approaches, including the
Single feature
tegrat lanoiselispItegrat lanoiselartnoC
A
120
160
200
240ie
ncy/
no. b
lue
ract
ors)
g
120
160
200
240
ienc
y/no
. blu
e ra
ctor
s)
0
40
80
0 1000 1500 2000P i d ti
Slop
e (E
ffic
dist
r
0
40
80
0 1000 1500 2000P i d ti
Slop
e (E
ffic
dist
r
Preview duration
Conjunction
Preview duration
B
120
160
200
240
cien
cy/n
o. b
lue
tract
ors)
120
160
200
240
cien
cy/n
o. b
lue
tract
ors)
0
40
80
0 1000 1500 2000Preview duration
Slop
e (E
ffi dist
0
40
80
0 1000 1500 2000Preview duration
Slop
e (E
ffi dist
e e du at o e e du at o
Figure 30. The slopes of the search functions for the right posterior parietal cortex (PPC) patients in Study 5D.A: The slopes for the single-feature condition (zero preview duration) and three preview duration conditions,measured against the number of blue items. B: The slopes for the conjunction condition (zero preview duration)along with the same preview conditions, shown relative to the total number of items in the final search display.
34 MAVRITSAKI, HEINKE, ALLEN, DECO, AND HUMPHREYS

effects of noise/variability on information processing, the timecourse of processing, and the effects of neurotransmitter modula-tion/arousal on performance. Furthermore, novel predictionsemerge due to models stressing these factors, and these predictionshave been tested empirically (Study 5). Our data here show thefollowing:
(a) Patients with right PPC damage are impaired at selectingstimuli presented vertically, compared with patients with posteriorbrain lesions not involving this area. This deficit can be reduced byusing a cue to increase the patients’ arousal. The data here matchthe argument that low arousal impairs visual selection even whenspatial deficits are not apparent (Studies 1 and 5A);
(b) Under dual-task conditions, normal participants can show anormal preview benefit (with search slopes reaching the levelfound in single-feature search), provided preview exposures aresufficiently long. In sSoTS this result arises because the dual taskcauses delays in the time when preview adaptation takes places,but it does not eradicate it (Studies 2 and 5B);
(c) Giving an initial (top-up) preview prior to engaging partic-ipants in a secondary task can lead to preview benefit. This occurseven when there is a lack of a full preview benefit from eithertop-up alone or the preview under secondary task conditions. Thepredictions of the model here match data from sSoTS. In the modelthe result occurs because the initial preview pushes activationtoward a level where adaptation can take place under dual-taskconditions (Studies 2 and 5C);
(d) Patients with right PPC damage are impaired in previewsearch and do not reach levels of search efficiency found in thesingle-feature baseline even with prolonged presentations of pre-views. In sSoTS this result occurs because lesioning reducesactivity within the location map so that there is continued compe-
tition across an abnormally long time course (Studies 3 and 5D);and
(e) There is reduced activation within the right TPJ whenpreview search is undertaken under conditions of dual-task load.This is consistent with activation in the right TPJ reflecting thecontrast of activation with the location map of sSoTS betweentarget and distractor stimuli (Studies 4 and 5E).
Our stress here is that the predictions we have tested arisenaturally from biologically plausible assumptions incorporatedinto sSoTS—from the role of neurotransmitter modulation (Study5A), the temporal dynamics of processing and particularly the roleof frequency adaptation (Studies 5B and 5C), the effects of reduc-ing the neuronal population (Study 5D), and the predicted HDRfunction derived from synaptic transmission in the model (Study5E). This is not to state that these predictions could not be derivedfrom other higher level models—it is certainly possible that theycould. However, our contention is that the predictions follow fromour attempt to use biologically plausible parameters, and the testsof the predictions provide a way to link lower level physiologicalprocesses (e.g., frequency adaptation) to whole-system behavior,typically examined in our search tasks. Overall, the results indicatethat there can be a close interlinking between modeling and em-pirical investigations, with models providing the bridge between,for example, behavioral and imaging data.
The data we have reported highlight several factors that have notbeen demonstrated previously:
1. Modulating arousal levels (e.g., here, by giving a spatiallyuninformative auditory cue) can have a direct impact on theefficiency of visual selection (Studies 1 and 5A). In prior neuro-psychological work it has been argued that decreased arousal isfound after right PPC lesions in patients (Robertson & Manley,
Figure 31. The percentage blood-oxygen level-dependent (BOLD) signal change in a region of interest (ROI)around the right temporoparietal junction (TPJ), based on the area that showed significant correlation with thehemodynamical response (HDR) time function derived from the location map of the spiking selection over timeand space (sSoTS) model in preview search. Here the data are shown for the mean signal change across the ROI(white) or for the max signal change (gray). The results are for standard preview search and for preview searchunder secondary task conditions (preview " load). The error bars represent 1 SE.
35BRIDGING THE GAP BETWEEN PHYSIOLOGY AND BEHAVIOR

1999), but this has been studied only within the context of thepatients also showing a spatial deficit in selection. Our resultsindicate that selection deficits occur in these patients even whenspatial biases in performance are eradicated under the presentationconditions. Our neural-level modeling provides a framework forunderstanding these nonspatial arousal effects.
2. The effects of a secondary task on preview search can beovercome over time. In earlier accounts of preview search (e.g.,Watson & Humphreys, 1997), it was argued that participantsneeded to fully engage attention in order to inhibit a previewdisplay. Hence any removal of attentional capacity from thisinhibition process would lead to a lessening of search efficiency.Our results indicate that this account is not correct. Even if asecondary task is imposed, preview search can be as efficient as asingle-feature baseline (when only new search items appear) pro-vided there is a sufficiently long preview. There are also effects of“topping up” a preview, and these effects are not eradicated assoon as a secondary task is imposed (Studies 5B and 5C). For thesSoTS model, these temporal effects arise due to the adaptationprocess, which operates when the preview reaches its thresholdlevel of activation, irrespective of whether this threshold is passedwith or without a second task. The effect of an initial top-uppreview is also to push activity toward this threshold, giving riseto a benefit when the preview remains but now under dual-taskconditions. The data highlight that the effects of time alone areimportant, even if a dual task disrupts top-down biases againstdistractors and toward targets. The exception to this, at least up tothe time limits studied, occurs with right PPC patients, who remainunable to gain the maximum preview benefit even with prolongedpreview displays (Study 5D). The contrast between the effects ofsecondary task load and PPC lesioning here is interesting. Itsuggests that the lesioning cannot be directly mimicked by givingnormal participants a secondary task load. In sSoTS, this contrastreflects the difference between (a) a reduction in the rate ofinformation accumulation across the field (under load conditions)and (b) the spatial imbalance of selection after a lesion to thelocation map and the slowed rate of information accumulationwhen location units are reduced in number. The spatial imbalance,and the slow accumulation of bottom-up activity in the locationmap, cannot be easily captured by a simple load manipulation.
3. In sSoTS, top-down inhibition is modulated by an initialenhancement of stimuli followed by inhibition of their features andlocations. The process of initial attention, followed by subsequentinhibition, matches the probe report data of Humphreys, JungStalmann, and Olivers (2004). In this study the detection of probesfalling on a preview was enhanced when the probes appearedshortly after the preview (200 ms), whereas detection appeared tobe inhibited (relative to when the probe fell in a backgroundlocation) when the delay was longer (800 ms). Inhibition in themodel is applied across a feature map. This fits with data onpreview search, where there are carry-over effects from old itemsto new targets sharing common features (e.g., see Braithwaite &Humphreys, 2003; Olivers & Humphreys, 2003). By placing oldfeatures into an inhibitory state, there will be delayed processing oftargets if they are represented within the same feature maps.
4. The argument for initial enhancement of processing followedby inhibition, in sSoTS, fits with recent work showing that stimulican be suppressed from awareness following an initial allocation
of attention to their location (Carter, Luedeman, Mitroff, &Nakayama, 2008), whereas sustained attention can reduce sensi-tivity to an attended stimulus (Ling & Carrasco, 2006). In theirfMRI study of preview search, Allen et al. (2008) and Payne andAllen (2010) also reported that there was initially enhanced activ-ity in neural areas responding to the feature properties of previewsfollowed by decreases in activity in the search period. This initialenhanced activity may reflect the initial allocation of attention tothe preview. An alternative is that it could reflect the activation ofinhibitory interneurons, which suppress preview-related activity.Against this last argument, other researchers have found either adecrease in BOLD activity to ignored distractors (Gazzaley,Cooney, McEvoy, Knight, & D’Esposito, 2005; Smith, Singh, &Greenlee, 2000) or no change in activation relative to baselineconditions (Egner & Hirsch, 2005). However it also very difficultto know what to conclude from underactivity in BOLD data,because the findings may reflect the choice of baseline conditionsrather than real reductions in neuronal responding. Interestingly,our analysis of brain areas linked to active suppression (Study 4)highlights the change in signal over time, rather than its reductionper se, and this form of model-based analysis may provide impor-tant converging evidence on the interpretation of any neuronalsignals. The fact that excitatory and inhibitory activity were ab-stracted across different maps in sSoTS is also noteworthy. Thedata suggest that, at a neural level, particular regions of the PPCmay be involved in coordinating inhibitory and excitatory guid-ance of selection, with the inhibitory and excitatory componentspooling together to determine competition for selection in otherbrain regions. It will clearly be important to explore this possibilityin more detail, using finer grained imaging protocols.
5. We have also shown how model-based analysis of fMRI datacan suggest direct associations between localized componentswithin a model (e.g., the location map in sSoTS) and localizedbrain regions (the right TPJ), providing converging evidence onthe functional role of those regions. Here, our evaluation suggeststhat the right TPJ responds specifically to contrasts in activationbetween behaviorally relevant targets and behaviorally irrelevantdistractors, and so indexes the salience of a target (Study 5E). Wepropose that this signal would be useful for other response sys-tems, which care about the target’s location but not necessarilyabout irrelevant parts of a scene. This argument is similar to theproposal made by Corbetta and Shulman (2002) that the right TPJacts as a circuit breaker, signaling the presence of a potentiallybehaviorally relevant stimulus so that attention (including a sac-cadic eye movement) may be shifted to the selected location.Corbetta and Shulman speculated that the greater prevalence ofvisual neglect after damage to the right relative to the left PPC mayreflect the lateralization of the circuit breaker to the right hemi-sphere. Our analysis is consistent with this, and it is noteworthythat we found the correlation with activity in the location map ofsSoTS to be right lateralized, based on a whole-brain analysis. Inaddition to this, though, patients with right hemisphere lesions mayalso suffer due to a reduction in general arousal levels (Mavritsakiet al., 2009; Robertson et al., 1998). If this is coupled with aspecific deficit in detecting contralesional, salience-defined targets(Studies 5D and 5E), then there will be poor selection of stimuli onthe contralesional side of space.
36 MAVRITSAKI, HEINKE, ALLEN, DECO, AND HUMPHREYS

Limitations of sSoTS
The sSoTS model is what we might term a “minimal” model,concentrating on the time course of selection of a likely targetlocation in search. The model does not realistically capture aspectsof early visual processing, nor does it deal with how visualselection may link to ongoing selection of a response to a stimulus(e.g., to reach to or make a saccade to a target’s position). Clearly,sSoTS will need to be extended to cover these other topics.Nevertheless, even within its limited domain, the model usefullyshows how different patterns of search can emerge as the temporalproperties of displays are varied and how neuropsychologicaldeficits can stem naturally from reductions in the number ofneurons supporting selection. The fits of the model to the data hereare primarily qualitative, based on common patterns of perfor-mance as different factors are varied (e.g., the duration of apreview or the presence of a secondary task). On top of this, ourwork shows how quantitative variations in activation within amodel can usefully complement brain imaging. For example, ourmodel-based analysis uses quantitative fitting of activation pat-terns (and predicted HDR functions) to differentiate between (a)brain regions linked to the excitatory guidance of attention totargets and (b) the inhibitory suppression of irrelevant distractors(see Figure 22). This goes beyond simple contrasts between searchconditions, where the contrast may involve both excitatory andinhibitory processes (e.g., contrasting preview with conjunctionsearch; cf. Allen et al., 2008; Braithwaite & Humphreys, 2003).
To date, the vast majority of attempts to develop biologicallyplausible models, operating at a neural level, have limited them-selves to dealing with single domains, even to single experi-ments—one reason for this being the computational constraintsinvolved in running larger scale simulations of this type, the otherbeing that it is not always clear how to link physiological processesin the model to the larger scale emergent behavior of wholesystems. One contribution of the sSoTS simulations presented hereis to show that neural-level models can have a wide scope, with thesame model covering single-cell electrophysiology, neuropsycho-logical deficits, fMRI, and whole-system reaction times, and indoing this, the model provides a multilevel account of visualselection. Nevertheless it is moot question as to whether suchmodels will scale up, as additional components are added—forexample, the addition of a fully dynamic working memory systemto modulate top-down biases, or the addition of a response selec-tion system to guide action to a target’s location. We note, how-ever, the utility of mean field approximations here. Mean field-level models operate above the spiking level but can then be“rolled out” at the spiking level. For instance, a mean field accountof interactions between several modules can be tested not only byits overall, whole-system behavior, but also by (subsequently)focusing on spiking activity within just one level (where the morespecific evidence exists). The direct linkage between mean field-and spiking-level models provides a framework for developinglarger scale models, which we look forward to exploring.
References
Agter, F., & Donk, M. (2005). Prioritized selection in visual search throughonset capture and color inhibition: Evidence from a probe-dot detectiontask. Journal of Experimental Psychology: Human Perception and Per-formance, 31, 722–730. doi:10.1037/0096-1523.31.4.722
Allen, H. A., & Humphreys, G. W. (2007). Previewing distractors reducestheir effective contrast. Vision Research, 47, 2992–3000. doi:10.1016/j.visres.2007.07.019
Allen, H. A., Humphreys, G. W., & Matthews, P. M. (2008). A neuralmarker of content-specific active ignoring. Journal of ExperimentalPsychology: Human Perception and Performance, 34, 286–297. doi:10.1037/0096-1523.34.2.286
Braitenberg, V., & Schuz, A. (1991). Anatomy of the cortex: Statistics andgeometry (Vol. 18). New York, NY: Springer-Verlag.
Braithwaite, J. J., & Humphreys, G. W. (2003). Inhibition and anticipationin visual search: Evidence from effects of color foreknowledge onpreview search. Perception & Psychophysics, 65, 213–237.
Braithwaite, J. J., Humphreys, G. W., & Hulleman, J. (2005). Color-basedgrouping and inhibition in visual search: Evidence from a probe-detection analysis of preview search. Perception & Psychophysics, 67,81–101.
Brunel, N., & Wang, X. (2001). Effects of neuromodulation in a corticalnetwork model of object working memory dominated by recurrentinhibition. Journal of Computational Neuroscience, 11, 63–85. doi:10.1023/A:1011204814320
Bundesen, C. (1990). A theory of visual attention. Psychological Review,97, 523–547. doi:10.1037/0033-295X.97.4.523
Bundesen, C., Habekost, T., & Kyllingsbaek, S. (2005). A neural theory ofvisual attention: Bridging cognition and neurophysiology. PsychologicalReview, 112, 291–328. doi:10.1037/0033-295X.112.2.291
Carter, O., Luedeman, R., Mitroff, S., & Nakayama, K. (2008). Motioninduced blindness: The more you attend the less you see. [Abstract].Journal of Vision, 8, 237. doi:10.1167/8.6.237
Corbetta, M., Kincade, J. I. M., Olinger, J. I. M., McAvoy, M. P., &Shulman, G. L. (2000). Voluntary orienting is dissociated from targetdetection in human posterior parietal cortex. Nature Neuroscience, 3,292–297. doi:10.1038/73009
Corbetta, M., & Shulman, G. L. (2002). Control of goal-directed andstimulus-driven attention in the brain. Nature Reviews Neuroscience, 3,201–215. doi:10.1038/nrn755
Corchs, S., & Deco, G. (2004). Feature-based attention in human visualcortex: Simulation of fMRI data. NeuroImage, 21, 36–45. doi:10.1016/j.neuroimage.2003.08.045
Deco, G., & Rolls, E. (2005a). Neurodynamics of biased competition andcooperation for attention: A model with spiking neurons. Journal ofNeurophysiology, 94, 295–313. doi:10.1152/jn.01095.2004
Deco, G., & Rolls, E. (2005b). Sequential memory: A putative neural andsynaptic dynamical mechanism. Journal of Cognitive Neuroscience, 17,294–307. doi:10.1162/0898929053124875
Deco, G., Rolls, E., & Horwitz, B. (2004). Integrating fMRI and single-celldata of visual working memory. Neurocomputing, 58–60, 729–737.doi:10.1016/j.neucom.2004.01.120
Deco, G., & Zihl, J. (2001). Top-down selective visual attention: Aneurodynamical approach. Visual Cognition, 8, 118–139. doi:10.1080/13506280042000054
Duncan, J., Humphreys, G. W., & Ward, R. (1997). Competitive brainactivity in visual attention. Current Opinion in Neurobiology, 7, 255–261. doi:10.1016/S0959-4388(97)80014-1
Durstewitz, D., Seamans, J. K., & Sejnowski, T. J. (2000). Neurocompu-tational models of working memory. Nature Neuroscience, 3, 1184–1191. doi:10.1038/81460
Eglin, M., Robertson, L. C., & Knight, R. T. (1990). Visual searchperformance in the neglect syndrome. Journal of Cognitive Neuro-science, 1, 372–385. doi:10.1162/jocn.1989.1.4.372
Egner, T., & Hirsch, J. (2005). Cognitive control mechanisms resolveconflict through cortical amplification of task-relevant information. Na-ture Neuroscience, 8, 1784–1790. doi:10.1038/nn1594
Folk, C. L., Remington, R. W., & Johnston, S. (1992). Involuntary covertorienting is contingent on attentional control settings. Journal of Exper-
37BRIDGING THE GAP BETWEEN PHYSIOLOGY AND BEHAVIOR

imental Psychology: Human Perception and Performance, 18, 1030–1044. doi:10.1037/0096-1523.18.4.1030
Found, A., & Muller, H. J. (1996). Searching for features across dimen-sions: Evidence for a dimensional weighting account. Perception &Psychophysics, 58, 88–101.
Gazzaley, A., Cooney, J. W., McEvoy, K., Knight, R. T., & D’Esposito, M.(2005). Top-down enhancement and suppression of the magnitude andspeed of neural activity. Journal of Cognitive Neuroscience, 17, 507–517. doi:10.1162/0898929053279522
Gilzenrat, M. S., Holmes, B. D., Rajkowski, J., Aston-Jones, G., & Cohen,J. J. (2002). Simplified dynamics in a model of noradrenergic modula-tion of cognitive performance. Neural Networks, 15, 647–663. doi:10.1016/S0893-6080(02)00055-2
Glover, G. H. (1999). Deconvolution of impulse response in event-relatedBOLD fMRI. NeuroImage, 9, 416–429. doi:10.1006/nimg.1998.0419
Grossberg, S., & Grunewald, A. (1997). Cortical synchronization andperceptual framing. Journal of Cognitive Neuroscience, 9, 117–132.doi:10.1162/jocn.1997.9.1.117
Heilman, K. M., & Valenstein, E. (1979). Mechanisms underlying hemis-patial neglect. Annals of Neurology, 5, 166 –170. doi:10.1002/ana.410050210
Heinke, D., & Humphreys, G. (2003). Attention, spatial representation andvisual neglect: Simulating emergent attention and spatial memory in theselective attention for identification model (SAIM). Psychological Re-view, 110, 29–87. doi:10.1037/0033-295X.110.1.29
Heinke, D., Humphreys, G. W., & Tweed, C. L. (2006). Top-down guid-ance of visual search: A computational account. Visual Cognition, 14,985–1005. doi:10.1080/13506280500195482
Heinke, D., & Mavritsaki, E. (2009). Bridging the gap between neurophys-iology and behaviour. London, England: Psychology Press.
Humphreys, G. W. (1998). Neural representation of objects in space: Adual coding account. Philosophical Transactions of the Royal Society ofLondon, Series B: Biological Sciences, 353, 1341–1351. doi:10.1098/rstb.1998.0288
Humphreys, G. W., Jolicoeur, P., & Watson, D. (2002). Fractionating thepreview benefit in search: Dual-task decomposition of visual marking bytiming and modality. Journal of Experimental Psychology: Human Per-ception and Performance, 28, 640 – 660. doi:10.1037/0096-1523.28.3.640
Humphreys, G. W., Jung Stalmann, B., & Olivers, C. N. L. (2004). Ananalysis of the time course of attention in preview search. Perception &Psychophysics, 66, 713–730.
Humphreys, G. W., Kyllingsbaek, S., Watson, D. G., Olivers, C. N. L.,Law, I., & Paulson, O. (2004). Parieto-occipital areas involved in effi-cient filtering in search: A time course analysis of visual marking usingbehavioral and functional imaging procedures. Quarterly Journal ofExperimental Psychology, 57(A), 610–635.
Humphreys, G. W., Mavritsaki, E., Allen, H. A., Heinke, D. G., & Deco,G. (2009). Modelling visual search in biologically plausible neuralnetworks: From whole system behaviour through neuropsychology tofMRI. In D. Heinke & E. Mavritsaki (Ed.), Bridging the gap betweenneurophysiology and behaviour. London, England: Psychology Press.
Humphreys, G. W., Olivers, C. N. L., & Braithwaite, J. J. (2006). The timecourse of preview search with color-defined, not luminance-defined,stimuli. Perception & Psychophysics, 68, 1351–1358.
Humphreys, G. W., & Riddoch, M. J. (1994). Attention to within-subjectand between-object spatial representations: Multiple sites for visualselection. Cognitive Neuropsychology, 11, 207–241. doi:10.1080/02643299408251974
Itti, L., & Koch, C. (2001). Computational modeling of visual attention.Nature Reviews Neuroscience, 2, 194–203. doi:10.1038/35058500
Ives, H. E. (1912). Studies of the photometry of different colours: I.Spectral luminosity curves obtained by equality of brightness photom-
eter and the flicker photometer under similar conditions. PhilosophicalMagazine, 24, 149–188.
Jahr, C. E., & Stevens, C. (1990). Voltage-dependence of NMDA-activatedmacroscopic conductances predicted by single-channel kinetics. Journalof Neuroscience, 10, 3178–3182.
Karnath, H. O. (1988). Deficits of attention in acute and recovered visualhemi-neglect. Neuropsychologia, 26, 27– 43. doi:10.1016/0028-3932(88)90028-0
Kunar, M. A., Humphreys, G. W., & Smith, A. C. (2003). History matters:The preview benefit in search is not onset capture. Psychological Sci-ence, 14, 181–185. doi:10.1111/1467-9280.t01-1-01439
Leveille, J., Versace, M., & Grossberg, S. (2010). Running as fast as it can:How spiking dynamics form object groupings in the laminar circuits ofvisual cortex. Journal of Computational Neuroscience, 28, 323–346.doi:10.1007/s10827-009-0211-1
Ling, S., & Carrasco, M. (2006). When sustained attention impairs per-ception. Nature Neuroscience, 9, 1243–1245. doi:10.1038/nn1761
Liu, Y. H., & Wang, X. (2001). Spike-frequency adaptation of a general-ized leaky integrate-and-fire model neuron. Journal of ComputationalNeuroscience, 10, 25–45. doi:10.1023/A:1008916026143
Logothetis, N. K. (2008, June 12). What we can do and what we cannot dowith fMRI. Nature, 453, 869–878.
Logothetis, N. K., Pauls, J., Augath, M. A., Trinath, T., & Oeltermann, A.(2001, July 12). Neurophysiological investigation of the basis of thefMRI signal. Nature, 412, 150–157. doi:10.1038/35084005
Luce, R. D. (1959). Individual choice behavior. New York, NY: Wiley.Luce, R. D. (1977). The choice axiom after twenty years. Journal of
Mathematical Psychology, 15, 215–233. doi:10.1016/0022-2496(77)90032-3
Madison, D., & Nicoll, R. (1984). Control of the repetitive discharge of ratCA l pyramidal neurones in vitro. Journal of Physiology, 345, 319–331.
Malhotra, P., Parton, A. D., Greenwood, R., & Husain, M. (2005). Nor-adrenergic modulation of space exploration in visual neglect. Annals ofNeurology, 59, 189–190.
Marr, D. (1982). Vision. San Francisco, CA: W. H. Freeman.Martınez-Trujillo, J. C., & Treue, S. (2002). Attentional modulation
strength in cortical area MT depends on stimulus contrast. Neuron, 35,365–370. doi:10.1016/S0896-6273(02)00778-X
Mattingley, J. B., Davis, G., & Driver, J. (1997, January 31). Preattentivefilling-in of visual surfaces in parietal extinction. Science, 275, 671–674.doi:10.1126/science.275.5300.671
Mavritsaki, E., Allen, H., & Humphreys, G. W. (2008). Model basedanalysis of fMRI-data: Applying the sSoTS framework to the neuralbasis of preview search. In L. Paletta & J. K. Tsotsos (Eds.), Lecturenotes in artificial intelligence: Attention in cognitive systems (Vol. 5395,pp. 124–138). Berlin, Germany: Springer-Verlag.
Mavritsaki, E., Allen, H., & Humphreys, G. W. (2010). Decomposing theneural mechanisms of visual search through model-based analysis of fMRI:Top-down excitation, active ignoring and the use of saliency by the rightTPJ. NeuroImage, 52, 934–946. doi:10.1016/j.neuroimage.2010.03.044
Mavritsaki, E., Heinke, D., Deco, G., & Humphreys, G. W. (2009).Simulating posterior parietal damage in a biologically plausible frame-work: Neuropsychological tests of the search over time and spacemodel. Cognitive Neuropsychology, 26, 343–390. doi:10.1080/02643290903424329
Mavritsaki, E., Heinke, D., Humphreys, G. W., & Deco, G. (2006). Acomputational model of visual marking using an interconnected networkof spiking neurons: The spiking search over time & space model(sSoTS). Journal of Physiology—Paris, 100, 110–124. doi:10.1016/j.jphysparis.2006.09.003
Mehler, J., Morton, J., & Jusczyk, P. W. (1984). On reducing language tobiology. Cognitive Neuropsychology, 1, 83–116. doi:10.1080/02643298408252017
Moran, J., & Desimone, R. (1985, August 23). Selective attention gates
38 MAVRITSAKI, HEINKE, ALLEN, DECO, AND HUMPHREYS

visual processing in the extrastriate cortex. Science, 229, 782–784.doi:10.1126/science.4023713
Mozer, M. C., Halligan, P. W., & Marshall, J. C. (1997). The end of theline for a brain-damaged model of hemispatial neglect. Journal ofCognitive Neuroscience, 2, 96–123. doi:10.1162/jocn.1997.9.2.171
Mumford, D. (1992). On the computational architecture of the neocortex:II. The role of cortico-cortical loops. Biological Cybernetics, 66, 241–251. doi:10.1007/BF00198477
Nieuwenhuis, S., Gilzenrat, M. S., Holmes, B. D., & Cohen, J. D. (2005).The role of the locus coeruleus in mediating the attentional blink: Aneurocomputational theory. Journal of Experimental Psychology: Gen-eral, 134, 291–307. doi:10.1037/0096-3445.134.3.291
Olivers, C. N. L., & Humphreys, G. W. (2003). Visual marking inhibitssingleton capture. Cognitive Psychology, 47, 1–42. doi:10.1016/S0010-0285(03)00003-3
Olivers, C. N. L., & Humphreys, G. W. (2004). Spatiotemporal segregationin visual search: Evidence from parietal lesions. Journal of ExperimentalPsychology: Human Perception and Performance, 30, 667–688. doi:10.1037/0096-1523.30.4.667
Olivers, C. N. L., Smith, S., Matthews, P. M., & Humphreys, G. W. (2005).Prioritizing new over old: An fMRI study of the preview search task.Human Brain Mapping, 24, 69–78. doi:10.1002/hbm.20071
Pashler, H. (2000). Task switching and multitask performance. In S.Monsell & J. Driver (Eds.), Attention and Performance XVIII: Controlof Cognitive Processes (pp. 277–308). London, England: AcademicPress.
Payne, H. E., & Allen, H. A. (2010). Active ignoring in early visual cortex.Journal of Cognitive Neuroscience. Advance online publication. doi:10.1162/jocn.2010.21562
Pollmann, S., Weidner, R., Humphreys, G. W., Olivers, C. N. L., Muller,H. M., Lohmann, G., . . . Watson, D. G. (2003). Separating segmentationand target detection in posterior parietal cortex: An event-related fMRIstudy of visual marking. NeuroImage, 18, 310–323. doi:10.1016/S1053-8119(02)00036-8
Posner, M., & Boies, S. J. (1971). Components of attention. PsychologicalReview, 78, 391–408. doi:10.1037/h0031333
Posner, M., & Petersen, S. E. (1990). The attention system of the humanbrain. Annual Review of Neuroscience, 13, 25– 42. doi:10.1146/annurev.ne.13.030190.000325
Posner, M. I., Walker, J. A., Friedrich, F. J., & Rafal, R. D. (1984). Effectsof parietal injury on the covert orienting of attention. Journal of Neu-roscience, 4, 1863–1874.
Pouget, A., & Bavelier, D. (2007). Paying attention to neurons withdiscriminating taste. Neuron, 53, 473– 475. doi:10.1016/j.neuron.2007.02.004
Ress, D., Backus, B., & Heeger, D. (2000). Activity in primary visualcortex predicts performance in a visual detection task. Nature Neuro-science, 3, 940–945. doi:10.1038/78856
Reynolds, J. H., Chelazzi, L., & Desimone, R. (1999). Competitive mech-anisms subserve attention in macaque areas V2 and V4. Journal ofNeuroscience, 19, 1736–1753.
Reynolds, J. H., & Desimone, R. (2003). Interacting roles of attention andvisual salience in V4. Neuron, 37, 853– 863. doi:10.1016/S0896-6273(03)00097-7
Riddoch, M. J., & Humphreys, G. W. (1987). A case of integrative visualagnosia. Brain, 110, 1431–1462. doi:10.1093/brain/110.6.1431
Riddoch, M. J., Humphreys, G. W., Edwards, S., Baker, T., & Wilson, K.(2003). Seeing the action: Neuropsychological evidence for action-basedeffects on object selection. Nature Neuroscience, 6, 82–89. doi:10.1038/nn984
Robertson, I. H., & Manley, T. (1999). Sustained attention deficits in timeand space. In G. W. Humphreys, J. Duncan, & A. Treisman (Eds.),Attention, space and action: Studies in cognitive neuroscience (pp.297–310). Oxford, England: Oxford University Press.
Robertson, I. H., Mattingley, J. B., Rorden, C., & Driver, J. (1998, September10). Phasic alerting of neglect patients overcomes their spatial deficit invisual awareness. Nature, 395, 169–172. doi:10.1038/25993
Roelfsema, P. R., Tolboom, M., & Khayat, P. (2007). Different processingphases for features, figures, and selective attention in the primary visualvortex. Neuron, 56, 785–792. doi:10.1016/j.neuron.2007.10.006
Rolls, E., & Treves, A. (1998). Neural networks and brain function.Oxford, England: Oxford University Press.
Schneider, W., Eschman, A., & Zuccolotto, A. (2002a). E-Prime referenceguide. Pittsburgh, PA: Psychology Software Tools.
Schneider, W., Eschman, A., & Zuccolotto, A. (2002b). E-Prime user’sguide. Pittsburgh, PA: Psychology Software Tools.
Shulman, G. L., Astafiev, S. V., McAvoy, M. P., Davossa, G., & Corbetta,M. (2007). Right TPJ deactivation during visual search: Functionalsignificance and support for a filter hypothesis. Cerebral Cortex, 17,2625–2633. doi:10.1093/cercor/bhl170
Smith, A. T., Singh, K. D., & Greenlee, M. W. (2000). Attentionalsuppression of activity in the human visual cortex. NeuroReport, 11,271–278. doi:10.1097/00001756-200002070-00010
Stemme, A., Deco, G., Busch, A., & Schneider, W. A. (2005). Neurons andthe synaptic basis of the fMRI signal associated with cognitive flexibil-ity. NeuroImage, 26, 454–470. doi:10.1016/j.neuroimage.2005.01.044
Sternberg, S. (1969). The discovery of processing stages: Extensions ofDonders’ method. Acta Psychologica, 30, 276–315. doi:10.1016/0001-6918(69)90055-9
Townsend, J. T. (1972). Some results concerning the identifiability ofparallel and serial processes. British Journal of Mathematical and Sta-tistical Psychology, 25, 168–199.
Townsend, J. T., & Ashby, F. G. (1983). The stochastic modeling ofelementary psychological processes. New York, NY: Cambridge Uni-versity Press.
Treisman, A. M., & Gelade, G. (1980). A feature-integration theory ofattention. Cognitive Psychology, 12, 97–136. doi:10.1016/0010-0285(80)90005-5
Tsotsos, J. K., Culhane, S. M., Wai, W., Davis, N., & Nuflo, F. (1995).Modeling visual attention via selective tuning. Artificial Intelligence, 78,507–545. doi:10.1016/0004-3702(95)00025-9
Usher, M., Cohen, J. D., Servan-Schreiber, D., Rajkowski, J., & Aston-Jones, G. (1999, January 22). The role of locus coeruleus in the regu-lation of cognitive performance. Science, 283, 549–554. doi:10.1126/science.283.5401.549
Usher, M., & Davelaar, E. J. (2002). Neuromodulation of decision andresponse selection. Neural Networks, 15, 635–645. doi:10.1016/S0893-6080(02)00054-0
Usher, M., & McClelland, J. L. (2001). The time course of perceptualchoice: The leaky, competing accumulator model. Psychological Re-view, 108, 550–592. doi:10.1037/0033-295X.108.3.550
Ward, R., Goodrich, S., & Driver, J. (1994). Grouping reduced visualextinction: Neuropsychological evidence for weight-linkage invisual selection. Visual Cognition, 1, 101–129. doi:10.1080/13506289408402295
Watson, D. G., & Humphreys, G. W. (1997). Visual marking: Prioritizingselection for new objects by top-down attentional inhibition. Psycholog-ical Review, 104, 90–122. doi:10.1037/0033-295X.104.1.90
Watson, D. G., & Humphreys, G. W. (2000). Visual marking: Evidence forinhibition using a probe-dot detection paradigm. Perception & Psycho-physics, 62, 471–481.
Watson, D. G., Humphreys, G. W., & Olivers, C. (2003). Visual marking:Using time in visual selection. Trends in Cognitive Sciences, 7, 180–186. doi:10.1016/S1364-6613(03)00033-0
Weidner, R., & Muller, H. J. (2009). Dimensional weighting of primaryand secondary target-defining dimensions in visual search for singletonconjunction targets. Psychological Research, 73, 198–211.
Wilson, F. A., O’Scalaidhe, S., & Goldman-Rakic, P. (1994). Functional
39BRIDGING THE GAP BETWEEN PHYSIOLOGY AND BEHAVIOR

synergism between putative gamma-aminobutyrate-containing neuronsin pyramidal neurons in prefrontal cortex. Proceedings of the NationalAcademy of Sciences, USA, 91, 4009–4013. doi:10.1073/pnas.91.9.4009
Wilson, H., & Cowan, S. (1972). Excitatory and inhibitory interactions inlocalized populations of model neurons. Biological Cybernetics, 12, 1–24.
Wolfe, J. W. (1994). Guided search 2.0: A revised model of visual search.Psychonomic Bulletin & Review, 1, 202–238.
Yantis, S., & Gibson, B. S. (1994). Object continuity in apparent motionand attention. Canadian Journal of Experimental Psychology, 48, 182–204. doi:10.1037/1196-1961.48.2.182
Zheng, P., Zhang, X.-X., Bunney, B. S., & Shi, W.-X. (1999). Oppositemodulation of cortical N-methyl-D-aspartate receptor-mediated re-sponses by low and high concentrations of dopamine. Neuroscience, 91,527–535. doi:10.1016/S0306-4522(98)00604-6
Appendix A
The Top-Down Inhibitory Function
In the spiking selection over time and space (sSoTS) model, inaddition to the passive adaptation process, there is also an activenegative bias applied to distractors that are presented in advance oftargets (e.g., under preview search conditions). This is imple-mented through a small increase to the outputs of the inhibitorypools to those feature maps representing the characteristics of theinitial (previewed) distractors. Recent behavioral studies have in-dicated that stimuli can be suppressed from awareness followingan initial allocation of attention to their location (Carter et al.,2008) but that sustained attention can impair sensitivity to an attendedstimulus (Ling & Carrasco, 2006). Matching these observations, weintroduced a top-down negative bias based on the following function:AcIn % max Ac ! 100 ! (e.500/time . 0.99e.500/(time " 15)). This
function reduces the overall inhibition that the initially activefeature maps receive in the first 300 ms of stimulus (preview)presentation. This enables these initial items to be fully attendedbefore being inhibited. This matches data on preview search pre-sented by Humphreys, Jung Stalmann, and Olivers (2004). Theinhibitory function can be viewed in Figure 10, where we show thefiring rates of the pool of neurons in the location map representingone of the previewed items for two cases: negative bias 0 andnegative bias 0.18. For negative bias 0, the previewed item con-tinues to maintain attentional salience for longer than when anegative bias of 0.18 is used (e.g., if the contrast between targetand distractor activation in the location map reflects attentionalsalience).
Appendix B
Calculating Search Slopes and Reaction Times
The spiking level allows us to simulate reaction times (RTs) andtarget detection rates, with different runs of the model reflectingthe Poisson noise present in neurons external to the model (e.g.,responding to sensory input). As a consequence, runs with thesame parameters provide a range of RTs, and there is a variablerate of detecting the target (selecting the units in the location mapwhere the target falls).
To measure the reaction times and the detection rates, an atten-tion index (IndA) is calculated based on Luce’s (1959, 1977)
choice axiom, IndA2t3 "fi2t3
!j fj2t3, where fi(t) represents the firing
rate of pool i at time t. The RT is determined when the attentionindex crosses a given threshold (set according to the average IndAfor all conditions). The time that the threshold is crossed is
considered the RT for the trial and, if the pool in the location mapcrossing the threshold first is the target pool, then we judge that thetarget has been detected successfully.
From the pool of parameters identified in mean field-level simula-tions, we selected one set of parameters that resulted in target selec-tion for most values of Ca. For this set of parameters, thebehaviorally most plausible Ca parameter was then identified(see Figure 9C). Ideally, to fit with behavioral observations(e.g., Watson & Humphreys, 1997), the slope for single-featuresearch should be below 19 ms/item and the slope for conjunc-tion less than 40 but higher than 26 ms/item. Furthermore, thedetection rate for conjunction search had to be above 80%. Allthese criteria were satisfied when a Ca concentration of 0.2 wasused (see Figure 9C).
(Appendices continue)
40 MAVRITSAKI, HEINKE, ALLEN, DECO, AND HUMPHREYS

Appendix C
Parameters Used in sSoTS
Parameter Value Description
gAMPA,rec excitatory 0.0208 nS AMPA recurrent synaptic conductance for excitatory neuronsgAMPA,rec inhibitory 0.0162 nS AMPA recurrent synaptic conductance for inhibitory neuronsgNMDA excitatory 0.22 nS NMDA recurrent synaptic conductance for excitatory neuronsa 0.18 (M [Ca2"] influx when a spike occursNE 1,600 (800) Number of excitatory neurons in each layer for the feature maps
(for the location map)NI 400 (200) Number of inhibitory neurons in each layer for the feature maps
(for the location map)Next 800 Number of external neuronsw" 2.2 Coupling for the pools in the feature mapswi1 1.0 Inhibition for the two feature dimension mapswi2 0.9 Inhibition for the location mapwi3 1.0 Connection weight from feature maps to the location mapwi4 0.25 Connection weight from the location map to feature maps,in 150 Hz The total input that each pool receives from the external
neurons to show that there is an item in the visual field,att 190 Hz The total top-down that the target pools receive to signify the
target’s characteristicsmaxAc 0.18 The maximum top-down inhibition that can be applied to the
previewed distractors’ maps
Note. Parameters were set to generate data matching human search for single-feature, conjunction, and preview conditions(preview duration 1,000 ms). Subsequently, the only parameter variations that occurred reflected changes in the top-downparameters, presumed to occur under secondary task conditions. sSoTS % spiking selection over time and space model.
Received December 15, 2008Revision received July 29, 2010
Accepted July 30, 2010 !
41BRIDGING THE GAP BETWEEN PHYSIOLOGY AND BEHAVIOR