bridging relation between initial organic load...
TRANSCRIPT
89 | P a g e
BRIDGING RELATION BETWEEN INITIAL
ORGANIC LOAD AND CRITICAL OXYGEN
DEFFICIENCY – A CASE STUDY P.K.Chandravathi1, G.Resmi2
1Research Scholar, CED, Karpagam University, Coimbatore, (India) 2Associate Professor, CED, NSS College of Engineering, Palakkad, (India)
ABSTRACT Water Quality and its measure have turned into a genuine issue around the world. Release of used waters to the
water bodies crumbles the amount and nature of the streams which causes significant sporadic attributes in the
organic frameworks. Regardless of the way that stream can self-cleaning, on occasion contamination is done
quickly and to a much higher degree that surpasses the breaking point of conduit to recover. Self-cleaning is the
strategy which conform recovery of the water environment. A study was carried out in Periyar River through the
selected stations for the period from 2011 to 2013. Monthly samplings were taken and analysis was carried out
for the parameters such as temperature, Dissolved Oxygen and Biochemical Oxygen Demand. Secondary data
for these parameters were obtained through authorized Organisations for the period from 2004 to 2010. The
study enables about the status of dissolved oxygen in the stream. It made a relationship between critical oxygen
deficiency and the initial organic load disposed into the stream. The formulated relationships are able to assist
the authorities concerned for urgent appropriate measures.
Keywords: Surface Water, Dissolved Oxygen, Biochemical Oxygen Demand, Critical Dissolved
Oxygen, Critical Oxygen Deficiency, Streeter Phelps Equation
I. INTRODUCTION
A river is a natural flowing water course, usually freshwater, flowing towards an ocean, sea, lake or another
river. A river begins at a source (or more often several sources) and ends at a mouth, following a path called a
course. Surface water as such is not safe to use as drinking water. It is possible to treat surface water and make it
potable. The quality of surface water is unpredictable, because the water continually moves and pollutants can
be entered at any time.
In view of the available quality of surface water and the intended required quality, it is always advisable to go
for a better source area for raw water. This paper is an attempt for a stepping stone to assess better source points
in the river stretch under study. In view of this, it is intended to study how the critical oxygen demand is related
with the initial organic load at the time of discharge and an effort has been made to formulate a relationship
between the initial organic loading and the Critical Oxygen Demand for all the selected stretches throughout the
year.
90 | P a g e
II. LIERATURE REVIEW
2.1 Water Quality Assessment The purpose of water quality monitoring is to determine the physical and chemical properties of natural waters.
Properties of water such as temperature, pH, dissolved oxygen, and the concentration of nitrates and phosphates
are important indicators of water quality [1]. These properties can change as a result of natural and human
related activities [8]. The same properties can be used to determine the quality of the stream water and can be
used to identify sources of pollution in the water. Changes in these parameters may be detrimental to the
organisms in and around the water source [2].
2.1.1 Temperature
The most common physical assessment of water quality is the measurement of temperature. Temperature
impacts both the chemical and biological characteristics of surface water. It affects the dissolved oxygen level in
the water, photosynthesis of aquatic plants, metabolic rates of aquatic organisms, and the sensitivity of these
organisms to pollution, parasites and disease. Warm water is less capable of holding dissolved oxygen. For this
reason, temperature should be measured at the same place within the stream at which dissolved oxygen is
measured. This allows the correlation between the two parameters to be observed [3].
2.1.2 Dissolved oxygen
Dissolved oxygen refers to the level of free, non-compound oxygen present in water or other liquids. It is an
important parameter in assessing water quality because of its influence on the organisms living within a body of
water. A dissolved oxygen level that is too high or too low can harm aquatic life and affect water quality [4].
2.1.3 Dissolved Oxygen and Biochemical Oxygen Demand
The stream system both produces and consumes oxygen. Running water, because of its churning, dissolves more
oxygen than still water, such as that in a reservoir behind a dam. Wastewater from sewage treatment plants often
contains organic materials that are decomposed by microorganisms, which use oxygen in the process. The
amount of oxygen consumed by these organisms in breaking down the waste is known as the biochemical
oxygen demand or BOD. BOD also measures the chemical oxidation of inorganic matter. BOD directly affects
the amount of dissolved oxygen in rivers and streams. The greater the BOD, the more rapidly oxygen is depleted
in the stream [2].
III. METHODOLOGY
The Study was carried out in Periyar River from Neriyamangalam to the Estuaries through the selected stations
in the river for the period from 2011 to 2013. Monthly samplings were taken and analysis was carried out for the
parameters such as temperature, Dissolved Oxygen and Biochemical Oxygen Demand. Secondary data for these
parameters were obtained through authorized Organisations; such as Kerala Water Authority, Central Water
Commission and Kerala State Pollution Control Board for the period from 2004 to 2010.
91 | P a g e
Dissolved oxygen level refers the condition of the water. The river condition in general can be ascertained
through the critical oxygen demand assessed. The Classic Streeter Phelps Equation is the best easily available
method for river analysis after considering its assumptions and limitations [6]. Here, for the river under study is
taken into different stretches to minimise the constraints and also to find out the load and other contributing
factors as indicated by Streeter Phelps [5].
IV. RESULTS AND DISCUSSIONS
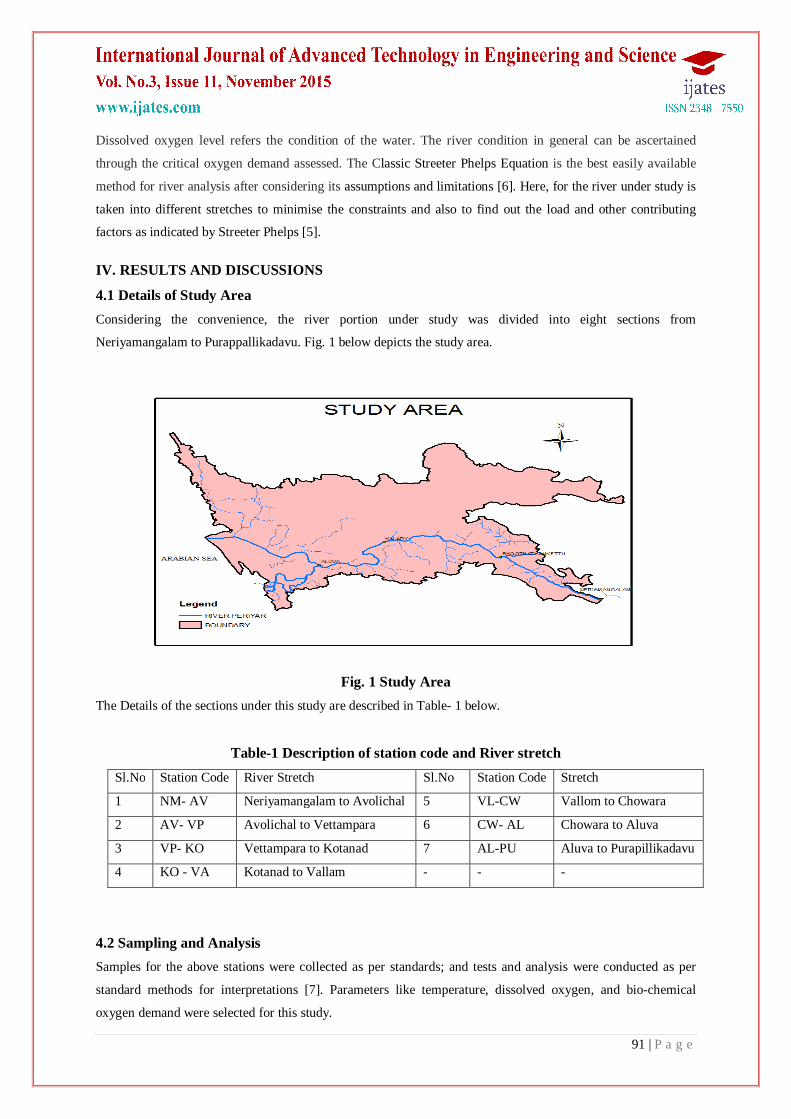
4.1 Details of Study Area Considering the convenience, the river portion under study was divided into eight sections from
Neriyamangalam to Purappallikadavu. Fig. 1 below depicts the study area.
Fig. 1 Study Area
The Details of the sections under this study are described in Table- 1 below.
Table-1 Description of station code and River stretch Sl.No Station Code River Stretch Sl.No Station Code Stretch
1 NM- AV Neriyamangalam to Avolichal 5 VL-CW Vallom to Chowara
2 AV- VP Avolichal to Vettampara 6 CW- AL Chowara to Aluva
3 VP- KO Vettampara to Kotanad 7 AL-PU Aluva to Purapillikadavu
4 KO - VA Kotanad to Vallam - - -
4.2 Sampling and Analysis Samples for the above stations were collected as per standards; and tests and analysis were conducted as per
standard methods for interpretations [7]. Parameters like temperature, dissolved oxygen, and bio-chemical
oxygen demand were selected for this study.
92 | P a g e
The initial oxygen deficiency, critical oxygen deficit, critical oxygen demand, critical distance and critical time
were computed from the values of the parameters determined on sample analysis for the period 2005 to 2012
and stations mentioned above.
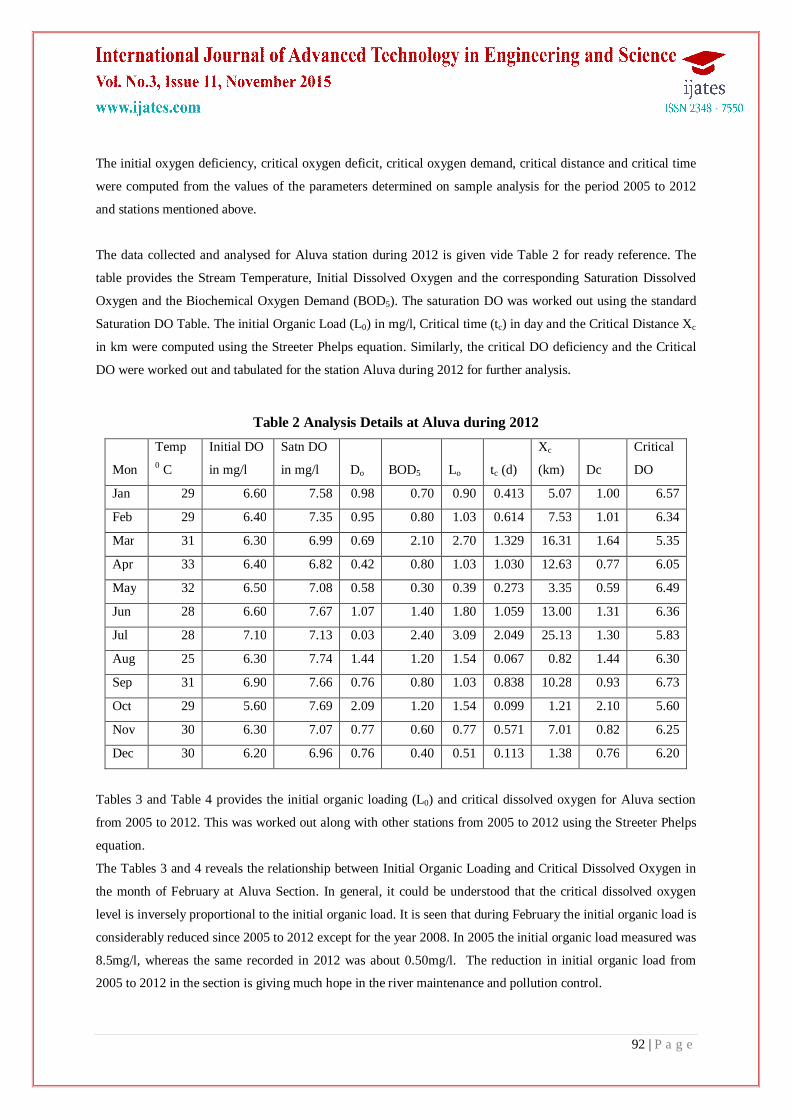
The data collected and analysed for Aluva station during 2012 is given vide Table 2 for ready reference. The
table provides the Stream Temperature, Initial Dissolved Oxygen and the corresponding Saturation Dissolved
Oxygen and the Biochemical Oxygen Demand (BOD5). The saturation DO was worked out using the standard
Saturation DO Table. The initial Organic Load (L0) in mg/l, Critical time (tc) in day and the Critical Distance Xc
in km were computed using the Streeter Phelps equation. Similarly, the critical DO deficiency and the Critical
DO were worked out and tabulated for the station Aluva during 2012 for further analysis.
Table 2 Analysis Details at Aluva during 2012
Mon
Temp 0 C
Initial DO
in mg/l
Satn DO
in mg/l Do BOD5 Lo tc (d)
Xc
(km) Dc
Critical
DO
Jan 29 6.60 7.58 0.98 0.70 0.90 0.413 5.07 1.00 6.57
Feb 29 6.40 7.35 0.95 0.80 1.03 0.614 7.53 1.01 6.34
Mar 31 6.30 6.99 0.69 2.10 2.70 1.329 16.31 1.64 5.35
Apr 33 6.40 6.82 0.42 0.80 1.03 1.030 12.63 0.77 6.05
May 32 6.50 7.08 0.58 0.30 0.39 0.273 3.35 0.59 6.49
Jun 28 6.60 7.67 1.07 1.40 1.80 1.059 13.00 1.31 6.36
Jul 28 7.10 7.13 0.03 2.40 3.09 2.049 25.13 1.30 5.83
Aug 25 6.30 7.74 1.44 1.20 1.54 0.067 0.82 1.44 6.30
Sep 31 6.90 7.66 0.76 0.80 1.03 0.838 10.28 0.93 6.73
Oct 29 5.60 7.69 2.09 1.20 1.54 0.099 1.21 2.10 5.60
Nov 30 6.30 7.07 0.77 0.60 0.77 0.571 7.01 0.82 6.25
Dec 30 6.20 6.96 0.76 0.40 0.51 0.113 1.38 0.76 6.20
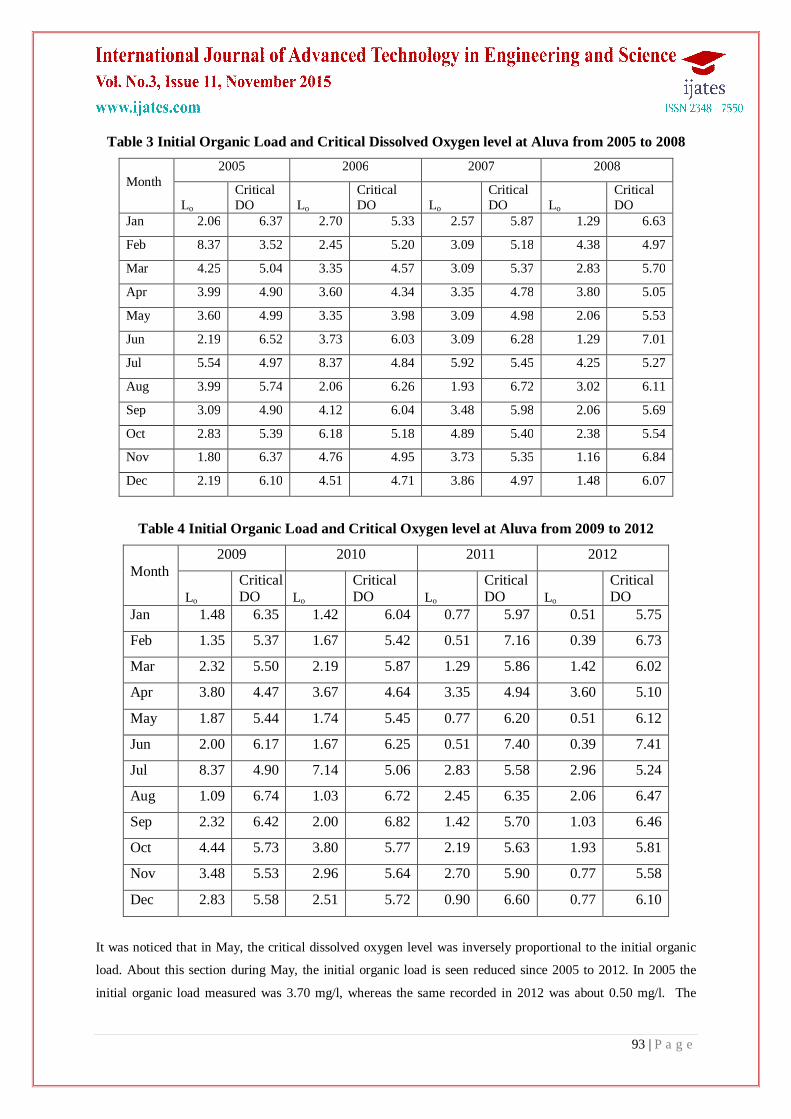
Tables 3 and Table 4 provides the initial organic loading (L0) and critical dissolved oxygen for Aluva section
from 2005 to 2012. This was worked out along with other stations from 2005 to 2012 using the Streeter Phelps
equation.
The Tables 3 and 4 reveals the relationship between Initial Organic Loading and Critical Dissolved Oxygen in
the month of February at Aluva Section. In general, it could be understood that the critical dissolved oxygen
level is inversely proportional to the initial organic load. It is seen that during February the initial organic load is
considerably reduced since 2005 to 2012 except for the year 2008. In 2005 the initial organic load measured was
8.5mg/l, whereas the same recorded in 2012 was about 0.50mg/l. The reduction in initial organic load from
2005 to 2012 in the section is giving much hope in the river maintenance and pollution control.
93 | P a g e
Table 3 Initial Organic Load and Critical Dissolved Oxygen level at Aluva from 2005 to 2008
Month 2005 2006 2007 2008
Lo Critical DO Lo
Critical DO Lo
Critical DO Lo
Critical DO
Jan 2.06 6.37 2.70 5.33 2.57 5.87 1.29 6.63
Feb 8.37 3.52 2.45 5.20 3.09 5.18 4.38 4.97
Mar 4.25 5.04 3.35 4.57 3.09 5.37 2.83 5.70
Apr 3.99 4.90 3.60 4.34 3.35 4.78 3.80 5.05
May 3.60 4.99 3.35 3.98 3.09 4.98 2.06 5.53
Jun 2.19 6.52 3.73 6.03 3.09 6.28 1.29 7.01
Jul 5.54 4.97 8.37 4.84 5.92 5.45 4.25 5.27
Aug 3.99 5.74 2.06 6.26 1.93 6.72 3.02 6.11
Sep 3.09 4.90 4.12 6.04 3.48 5.98 2.06 5.69
Oct 2.83 5.39 6.18 5.18 4.89 5.40 2.38 5.54
Nov 1.80 6.37 4.76 4.95 3.73 5.35 1.16 6.84
Dec 2.19 6.10 4.51 4.71 3.86 4.97 1.48 6.07
Table 4 Initial Organic Load and Critical Oxygen level at Aluva from 2009 to 2012
Month 2009 2010 2011 2012
Lo Critical DO Lo
Critical DO Lo
Critical DO Lo
Critical DO
Jan 1.48 6.35 1.42 6.04 0.77 5.97 0.51 5.75
Feb 1.35 5.37 1.67 5.42 0.51 7.16 0.39 6.73
Mar 2.32 5.50 2.19 5.87 1.29 5.86 1.42 6.02
Apr 3.80 4.47 3.67 4.64 3.35 4.94 3.60 5.10
May 1.87 5.44 1.74 5.45 0.77 6.20 0.51 6.12
Jun 2.00 6.17 1.67 6.25 0.51 7.40 0.39 7.41
Jul 8.37 4.90 7.14 5.06 2.83 5.58 2.96 5.24
Aug 1.09 6.74 1.03 6.72 2.45 6.35 2.06 6.47
Sep 2.32 6.42 2.00 6.82 1.42 5.70 1.03 6.46
Oct 4.44 5.73 3.80 5.77 2.19 5.63 1.93 5.81
Nov 3.48 5.53 2.96 5.64 2.70 5.90 0.77 5.58
Dec 2.83 5.58 2.51 5.72 0.90 6.60 0.77 6.10
It was noticed that in May, the critical dissolved oxygen level was inversely proportional to the initial organic
load. About this section during May, the initial organic load is seen reduced since 2005 to 2012. In 2005 the
initial organic load measured was 3.70 mg/l, whereas the same recorded in 2012 was about 0.50 mg/l. The
94 | P a g e
reduction in initial organic load from 2005 to 2012 in the section is benevolent much hope in the river
maintenance and pollution control.
Further, it is observed that the critical dissolved oxygen level is inversely proportional to the initial organic load
during August. In relation to the section during August month, the initial organic load is seen reduced since
2005 to 2012 except for the year 2008. In 2005 the initial organic load measured was 4.00 mg/l, whereas the
same recorded in 2012 was about 2.00 mg/l. During 2009, the Initial organic load was seen reduced to 0.80
mg/l. The reduction in initial organic load from 2005 to 2012 in the section is benevolent much hope in the river
maintenance and pollution control.
The above tables also describe the relationship between Initial Organic Loading and Critical Dissolved Oxygen
in the month of November at Aluva Section which examined that the critical dissolved oxygen level is inversely
proportional to the initial organic load during the months of November. During November, the initial organic
load is seen reduced since 2005 to 2012 for the section. The initial organic load was seen increased during 2006,
2007, 2009, 2010 and 2011. The critical dissolved oxygen was also changed in proportional to the input values.
The initial organic load measured during 2005 was 1.80 mg/l, whereas the same recorded in 2012 was about
0.80 mg/l. The reduction in initial organic load from 2005 to 2012 in the section is compassionate much hope in
the river maintenance and pollution control.
Tables 3 and 4 reveal the relationship between the Critical Dissolved Oxygen against the Initial Organic loading
for the months of February, May, August and November for Chowara- Aluva section. The values clearly
indicate that the Critical Dissolved Oxygen is inversely proportional to the initial organic loading. That means
the critical oxygen deficiency is directly proportional to the organic loading.
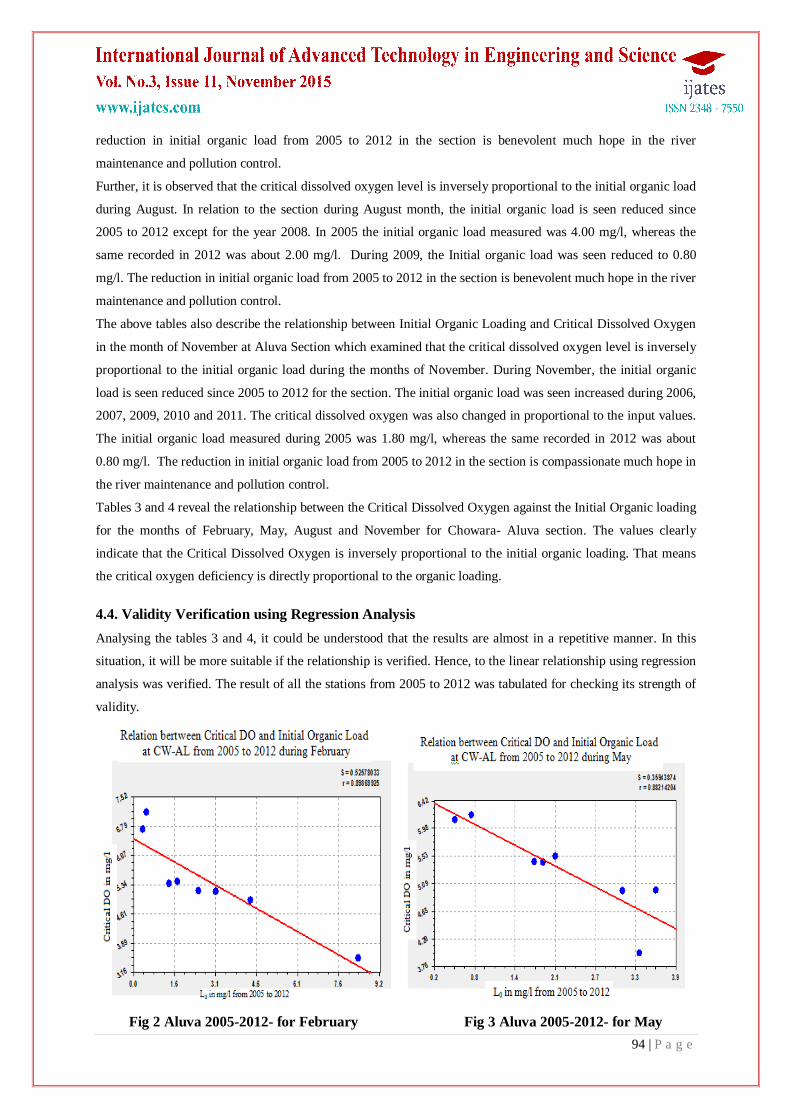
4.4. Validity Verification using Regression Analysis Analysing the tables 3 and 4, it could be understood that the results are almost in a repetitive manner. In this
situation, it will be more suitable if the relationship is verified. Hence, to the linear relationship using regression
analysis was verified. The result of all the stations from 2005 to 2012 was tabulated for checking its strength of
validity.
Fig 2 Aluva 2005-2012- for February Fig 3 Aluva 2005-2012- for May
95 | P a g e
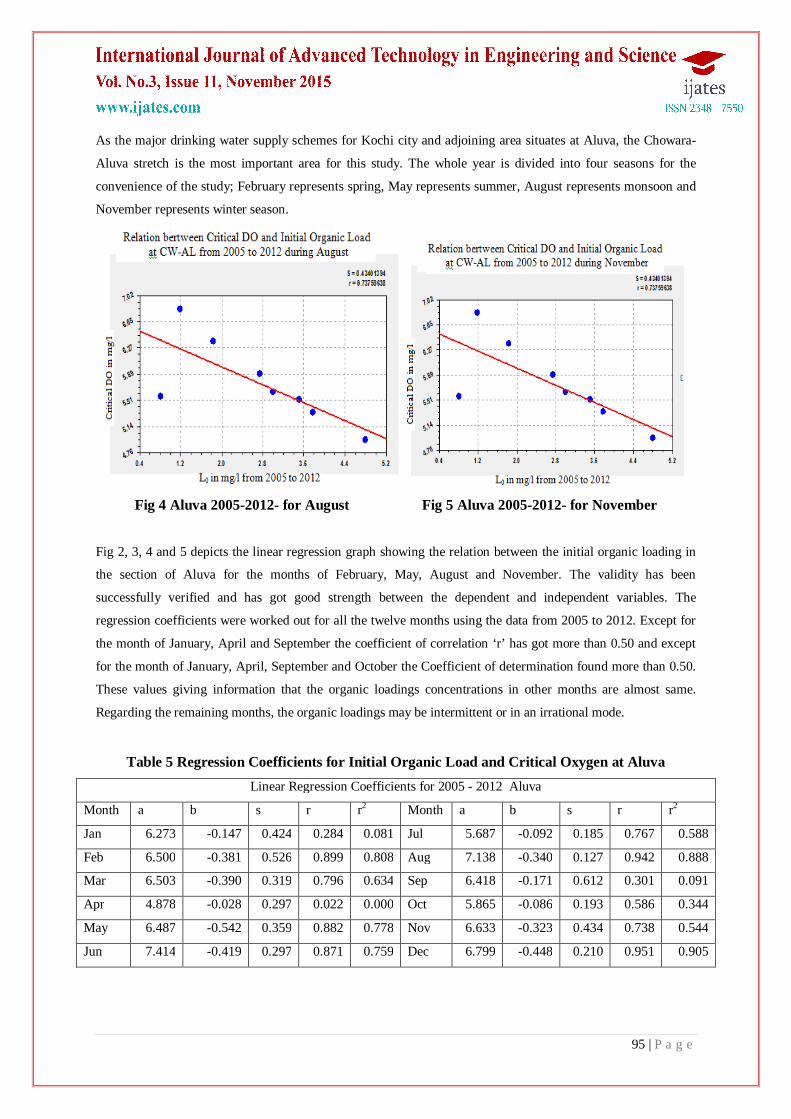
As the major drinking water supply schemes for Kochi city and adjoining area situates at Aluva, the Chowara-
Aluva stretch is the most important area for this study. The whole year is divided into four seasons for the
convenience of the study; February represents spring, May represents summer, August represents monsoon and
November represents winter season.
Fig 4 Aluva 2005-2012- for August Fig 5 Aluva 2005-2012- for November
Fig 2, 3, 4 and 5 depicts the linear regression graph showing the relation between the initial organic loading in
the section of Aluva for the months of February, May, August and November. The validity has been
successfully verified and has got good strength between the dependent and independent variables. The
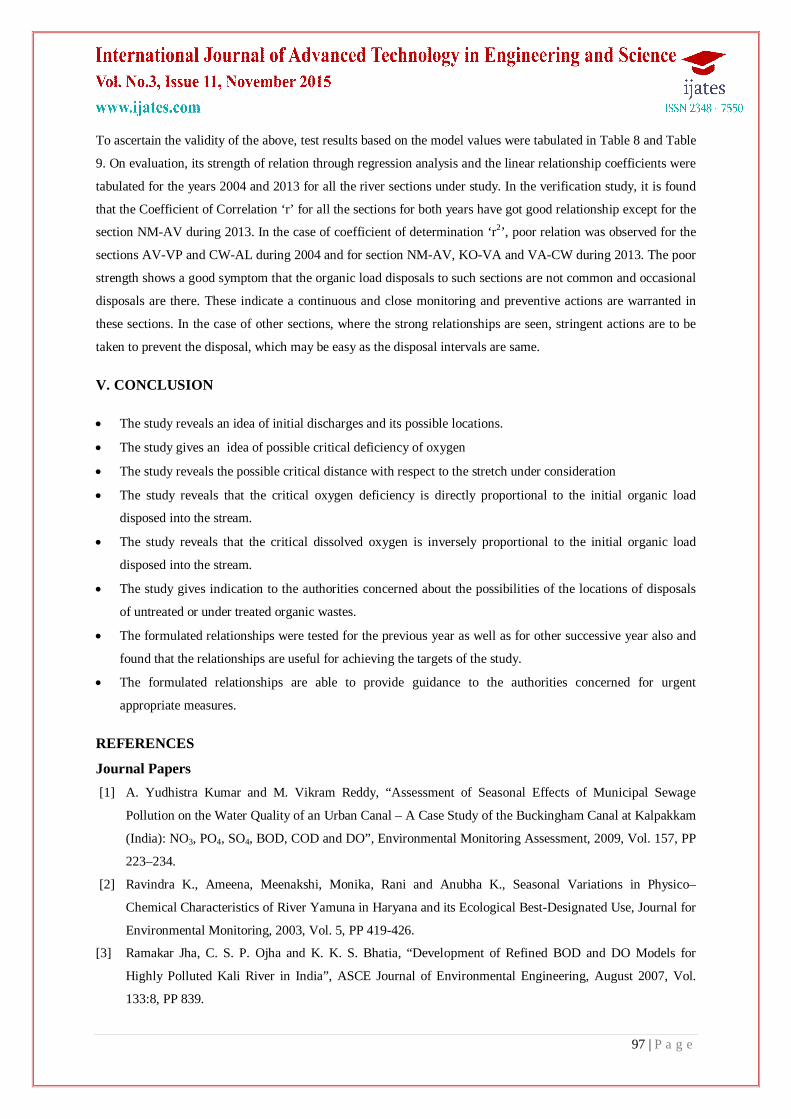
regression coefficients were worked out for all the twelve months using the data from 2005 to 2012. Except for
the month of January, April and September the coefficient of correlation ‘r’ has got more than 0.50 and except
for the month of January, April, September and October the Coefficient of determination found more than 0.50.
These values giving information that the organic loadings concentrations in other months are almost same.
Regarding the remaining months, the organic loadings may be intermittent or in an irrational mode.
Table 5 Regression Coefficients for Initial Organic Load and Critical Oxygen at Aluva Linear Regression Coefficients for 2005 - 2012 Aluva
Month a b s r r2 Month a b s r r2
Jan 6.273 -0.147 0.424 0.284 0.081 Jul 5.687 -0.092 0.185 0.767 0.588
Feb 6.500 -0.381 0.526 0.899 0.808 Aug 7.138 -0.340 0.127 0.942 0.888
Mar 6.503 -0.390 0.319 0.796 0.634 Sep 6.418 -0.171 0.612 0.301 0.091
Apr 4.878 -0.028 0.297 0.022 0.000 Oct 5.865 -0.086 0.193 0.586 0.344
May 6.487 -0.542 0.359 0.882 0.778 Nov 6.633 -0.323 0.434 0.738 0.544
Jun 7.414 -0.419 0.297 0.871 0.759 Dec 6.799 -0.448 0.210 0.951 0.905

96 | P a g e
The above model coefficients for all the months have been tested for the year 2004 and 2013 with initial organic
loads. The critical dissolved oxygen values thus obtained along with the same obtained using the Streeter Phelps
model were tabulated in Table 6 for the year 2004 and Table 7 for the year 2013
Table 6 Initial Organic Load and Critical DO Table 7 Initial Organic Load and Critical DO
(Streeter Phelps and Model) for 2004 (Streeter Phelps and Model) for 2013
Table 8 Regression Coefficients for Critical DO Table 9 Regression Coefficients for Critical DO
(Streeter Phelps and Model) for 2004 (Streeter Phelps and Model) for 2013
2004
Month
Lo
Critical
DO
Critical
DO using
Model
January 2.05955 6.07 5.971
February 1.8021 5.56 5.815
March 1.28722 5.91 6.000
April 3.34676 5.26 4.786
May 2.05955 6.26 5.371
June 1.8021 6.84 6.659
July 2.83188 6.45 5.426
August 3.73293 6.11 5.869
September 1.41594 6.05 6.177
October 2.18827 6.00 5.677
November 2.70316 5.56 5.759
December 3.47549 4.85 5.242
2013
Month Lo
Critical
DO
Critical
DO using
Model
January 0.644 5.287 6.179
February 1.030 5.299 6.108
March 1.287 5.514 6.000
April 3.990 4.077 4.768
May 0.386 6.537 6.278
June 2.060 5.970 6.551
July 8.367 4.746 4.914
August 0.772 6.690 6.875
September 0.515 7.238 6.331
October 2.703 6.342 5.633
November 2.188 6.100 5.925
December 1.158 6.490 6.280
Model Testing for the Year 2004
Station a b s r r2
NM-AV 0.768 0.834 0.566 0.928 0.862
AV-VP 2.351 0.541 1.191 0.537 0.288
VP -KO 0.732 0.879 0.423 0.943 0.889
KO -VA 2.006 0.691 0.205 0.920 0.847
VA-CW 3.343 0.452 0.330 0.715 0.512
CW-AL 2.386 0.566 0.395 0.627 0.393
AL -PU 2.595 0.560 0.240 0.853 0.727
PU - ES 0.324 1.000 1.093 0.900 0.811
Model Testing for the Year 2013
Station a b s r r2
NM-AV 3.852 0.343 0.811 0.324 0.105
AV-VP 0.711 0.858 0.386 0.801 0.642
VP - KO 1.212 0.791 0.418 0.884 0.782
KO -VA 3.140 0.492 0.296 0.693 0.480
VA-CW 4.036 0.336 0.496 0.457 0.209
CW -AL 2.932 0.521 0.423 0.759 0.576
AL -PU 2.658 0.575 0.309 0.804 0.646
PU - ES 1.198 0.813 0.461 0.748 0.559
97 | P a g e
To ascertain the validity of the above, test results based on the model values were tabulated in Table 8 and Table
9. On evaluation, its strength of relation through regression analysis and the linear relationship coefficients were
tabulated for the years 2004 and 2013 for all the river sections under study. In the verification study, it is found
that the Coefficient of Correlation ‘r’ for all the sections for both years have got good relationship except for the
section NM-AV during 2013. In the case of coefficient of determination ‘r2’, poor relation was observed for the
sections AV-VP and CW-AL during 2004 and for section NM-AV, KO-VA and VA-CW during 2013. The poor
strength shows a good symptom that the organic load disposals to such sections are not common and occasional
disposals are there. These indicate a continuous and close monitoring and preventive actions are warranted in
these sections. In the case of other sections, where the strong relationships are seen, stringent actions are to be
taken to prevent the disposal, which may be easy as the disposal intervals are same.
V. CONCLUSION
The study reveals an idea of initial discharges and its possible locations.
The study gives an idea of possible critical deficiency of oxygen
The study reveals the possible critical distance with respect to the stretch under consideration
The study reveals that the critical oxygen deficiency is directly proportional to the initial organic load
disposed into the stream.
The study reveals that the critical dissolved oxygen is inversely proportional to the initial organic load
disposed into the stream.
The study gives indication to the authorities concerned about the possibilities of the locations of disposals
of untreated or under treated organic wastes.
The formulated relationships were tested for the previous year as well as for other successive year also and
found that the relationships are useful for achieving the targets of the study.
The formulated relationships are able to provide guidance to the authorities concerned for urgent
appropriate measures.
REFERENCES
Journal Papers [1] A. Yudhistra Kumar and M. Vikram Reddy, “Assessment of Seasonal Effects of Municipal Sewage
Pollution on the Water Quality of an Urban Canal – A Case Study of the Buckingham Canal at Kalpakkam
(India): NO3, PO4, SO4, BOD, COD and DO”, Environmental Monitoring Assessment, 2009, Vol. 157, PP
223–234.
[2] Ravindra K., Ameena, Meenakshi, Monika, Rani and Anubha K., Seasonal Variations in Physico–
Chemical Characteristics of River Yamuna in Haryana and its Ecological Best-Designated Use, Journal for
Environmental Monitoring, 2003, Vol. 5, PP 419-426.
[3] Ramakar Jha, C. S. P. Ojha and K. K. S. Bhatia, “Development of Refined BOD and DO Models for
Highly Polluted Kali River in India”, ASCE Journal of Environmental Engineering, August 2007, Vol.
133:8, PP 839.
98 | P a g e
[4] Ganjar Samudrol and Sarwoko Mangkoedihardjo, “Review on BOD, COD and BOD/COD Ratio: A
Triangle Zone for toxic, Biodegradable and Stable Levels”, International Journal of Academic Research,
July 2010, Vol. 2, No. 4
[5] M.M.Prabhakaran and G Resmi, Significance of Estuary Discharges in Controlling Salinity – A Case
Study on Kochi Water Supply Scheme, International Journal of Advance Research in Science and
Engineering, IJARSE, Vol. No.2, Issue No.9, September 2013, PP15-25
Books [6] Metcalf and Eddy, Wastewater Engineering – Treatment, Disposal, Reuse, Tata McGraw-Hill, Second
Edition, 1979.
[7] American Public Health Association (APHA), 1985, Standard Methods for the Examination of Water and
Wastewater, Washington, 20th edition.
Proceedings Papers [8] J.A.Adakole, D.S.Abulode and M.L.Balarabe, Assessment of Water Quality of a Man-made Lake in Zaria,
Nigeria, Proceedings of Taal 2007: The 12th World Lake Conference: 1373-1382.