bridging gaps between conservation action and policy on
TRANSCRIPT

Montclair State University Montclair State University
Montclair State University Digital Montclair State University Digital
Commons Commons
Theses, Dissertations and Culminating Projects
1-2018
Bridging Gaps Between Conservation Action and Policy on Small Bridging Gaps Between Conservation Action and Policy on Small
Island Developing States – Case Analog of The Republic of Island Developing States – Case Analog of The Republic of
Mauritius Mauritius
Pricila Iranah Montclair State University
Follow this and additional works at: https://digitalcommons.montclair.edu/etd
Part of the Earth Sciences Commons, and the Environmental Sciences Commons
Recommended Citation Recommended Citation Iranah, Pricila, "Bridging Gaps Between Conservation Action and Policy on Small Island Developing States – Case Analog of The Republic of Mauritius" (2018). Theses, Dissertations and Culminating Projects. 169. https://digitalcommons.montclair.edu/etd/169
This Dissertation is brought to you for free and open access by Montclair State University Digital Commons. It has been accepted for inclusion in Theses, Dissertations and Culminating Projects by an authorized administrator of Montclair State University Digital Commons. For more information, please contact [email protected].
BRIDGING GAPS BETWEEN CONSERVATION ACTION AND POLICY ON
SMALL ISLAND DEVELOPING STATES
CASE ANALOG OF THE REPUBLIC OF MAURITIUS
A DISSERTATION
Submitted to the Faculty of
Montclair State University in partial fulfillment
of the requirements
for the degree of Doctor of Philosophy
by
PRICILA IRANAH
Montclair State University
Upper Montclair, NJ
2017
Dissertation Chair: Dr. Pankaj Lal

Copyright © 2017 by Pricila Iranah. All rights reserved.

iv
ABSTRACT
BRIDGING GAPS BETWEEN CONSERVATION ACTION AND POLICY ON
SMALL ISLAND DEVELOPING STATES – CASE ANALOG OF THE REPUBLIC
OF MAURITIUS
by Pricila Iranah
Mauritius, a small island state in the Indian Ocean, is a biodiversity hotspot with highly
threatened forest ecosystems. It is also a country where environmental and conservation
programs have been successful in the past. However, the issue of funding has received
relatively less attention and national park systems are chronically underfunded. As part
of assessing the potential for local funding, we assessed the demand for forest recreation.
Recreation in forest ecosystems is one of the cornerstones of modern nature-based
tourism. Tourism is increasingly a favored tool to promote conservation of natural
forests, especially in developing countries where conservation financing can be
intermittent. At policy level, stakeholders on the island have limited opportunity to
translate conservation policies they help formulate into direct action. Enhancing the
stakeholder engagement process is all-the-more relevant on a small island developing
state where differences in gender, income, ethnicity interplay with differences in resource
access and power distribution.
Our study is organized in three core chapters. In Chapter 2 we explored means of
ensuring and enhancing conservation funding on the island. To that end, we designed
and administered survey based contingent valuation approach to estimate the willingness

v
to pay for conservation of state and privately owned forested sites. Study results suggest
international and domestic tourists have a mean willingness to pay of USD 7.73 and USD
3.74 respectively, for conservation. These values represent amounts that visitors are
willing to pay for conservation every time they visit a public or private forested site.
Results show that education and mid-level supervisory roles positively influence
willingness to pay values. Study results also show that people aged 50 and above, not
having any supervisory role, married with one child or less, tend to have lower
willingness to pay for conservation.
In Chapter 3, we focused on the contribution of domestic tourism to the conservation
potential of native forests in the small island developing state of Mauritius. Our study
used individual travel cost data from 188 residents, collected from in-person surveys at
nine forested areas on the island. Results indicate that the consumer surplus for nature-
tourism ranges between USD 3,739.21 and USD 3,975.54 per person per year. Our
models also show that visit rates, and therefore residents’ investment into tourism
activities in forests, can increase with better sensitization campaigns and better
understanding of the role played by forestland managers. Our most conservative estimate
gives native forests of the island an annual recreation value of USD 260 million.
The third aspect of our study, explored in Chapter 4, used analytic hierarchy process
(AHP), in combination with an analysis of strengths, weaknesses, opportunities and
threats (SWOT) associated to conservation programs and policies developed on the
island. Our findings present a robust overview of stakeholder preferences by establishing
their priorities and assessing existing conflicts. Our findings show that state and private

vi
stakeholders favor expansion of existing nurseries and the setting up of new ones to
increase re-afforestation programs. The opportunities to raise funds through corporate
social responsibility and nature-based tourism are also prioritized in their chosen
strategies. Refining identification and management of invasive species remain a priority
for the scientific community. Other stakeholders view their continued participation in
conservation policy formulation as a strong factor to keep building upon, but seek to
address the lack of legal enforcement in forestlands as well as development threats to
environmentally sensitive areas.
Our study contributes to the literature by empirically assessing willingness to pay for
conservation between and among international and national tourists visiting forest sites in
Mauritius and developing an approach for determining predictors and mean willingness
to pay values. We show that conservation strategies can extract greater benefit from the
stakeholder engagement processes of formulating conservation policy by integrating
AHP and developing outcomes that have better stakeholder buy-in than a one-size-fits-all
solution.
vii
Acknowledgements
These last five years have been an adventure of a lifetime. I am immensely grateful to
Dr. Pankaj Lal for having shown an interest in my research topic when I first emailed
about it in 2011. Few are those with the privilege to work on a topic and country for
which they hold a personal stake, and for that I count myself lucky. Dr. Lal has been a
wonderful advisor, wading between pushing me to do more than I thought I could, and
giving me the space, time and understanding to do so. I wish to thank Dr William
Thomas and Dr Meiyin Wu for their support and encouragement as committee members
and as teachers. I thank Dr Vincent Florens and Dr Cláudia Baider for being such
amazing mentors, friends and teachers; they have had a massive influence on my life
since my undergraduate days at the University of Mauritius.
I am grateful to staff of the Mauritius Herbarium, the Forestry Service, the National Parks
and Conservation Service for their support during my data collection in Mauritius. I also
thank La Vallée d’Osterlog Endemic Garden Foundation, CIEL Group, La Vallée des 23
Couleurs, the Mauritian Wildlife Foundation and the Ministry of Agro Industry and Food
Security for granting me permission to interview visitors to their sites. I thank Joanne
Carpouron, Virginie Azor and Anäis Karghoo of the University of Mauritius for their
help whilst in Mauritius and for having enjoyed the day trips with such gusto. I also
thank all participants to the study for their time and patience.
I thank the faculty and staff of the Earth and Environmental Studies department for
creating an atmosphere conducive to professional respect, quality research and fun.
Special thanks to Dr. Amy Tuininga and Mr. Rohan Padhye of the PSEG Institute for

viii
Sustainability Studies for giving me such a wonderful summer opportunity and for their
constant encouragement. I thank the Graduate School, and the International Services
Center for making my time here as a foreigner smooth and worry-free.
I am very grateful to my parents for their patience and encouragement when I decided to
move to new pastures. I know it has not been easy for them to fend off on their own at
home, with both of their children overseas. I am grateful to my brother, sister-in-law and
my two adorable nephews for the Skype calls – they were and remain the highlight of my
days. I am so thankful to Dr. Priya Issuree just for being my best friend, for being a mere
bus ride away, for all the Mauritian nights in her apartment and for her unconditional
love.
I express sincere thanks to the Masters and PhD students in the Earth and Environmental
Studies department for their friendship, the constant banter that keeps the office
environment alive, the potlucks, lunches and gym time! Huge thanks to my friends and
flatmates Dr Bernabas Wolde and Mr Jay Prakash Singh.
I can never express my full appreciation to my partner, Prosper. His love, support and
patience with me has been a source of strength. I have depended on you to keep me
grounded. Thank you.

ix
To my dad

x
Table of Contents
List of Tables .................................................................................................................... xv
List of Figures ................................................................................................................. xvii
List of Acronyms and Abbreviations ............................................................................... xix
1 INTRODUCTION ........................................................................................................... 1
1.1 Small Island Developing States ................................................................................ 1
1.2 Role of forests on SIDS ............................................................................................. 1
1.3 Threats to forests on SIDS ........................................................................................ 2
1.4 Protecting forests on islands ...................................................................................... 3
1.5 Study Aims ................................................................................................................ 6
1.6 Study Area ................................................................................................................. 8
1.6.1 Location and Geography .................................................................................... 8
1.6.2 Society and Economy ......................................................................................... 9
1.6.3 State of forest ecosystems and their conservation ............................................ 11
1.6.4 Conservation financing in Mauritius ................................................................ 17
1.6.5 Forest Uses on the Mainland ............................................................................ 19
1.7 Research Methodology ............................................................................................ 20
1.7.1 Objective 1 – Stated Preference Method: Contingent Valuation ..................... 20
1.7.2 Objective 2 – Revealed Preference Method: Travel Cost Method ................... 22

xi
1.7.3 Objective 3 – SWOT-AHP ............................................................................... 23
References ..................................................................................................................... 24
2 VALUING VISITOR ACCESS TO FORESTED AREAS AND EXPLORING
WILLINGNESS TO PAY FOR FOREST CONSERVATION AND RESTORATION . 35
2.1 Introduction ................................................................................................................. 35
2.2 Methodology ........................................................................................................... 38
2.2.1 Study approach ................................................................................................. 38
2.2.2 Data collection .................................................................................................. 38
2.2.3 Survey design ................................................................................................... 41
2.2.4 Theoretical specification ................................................................................... 42
2.2.5 Revenue Requirements for Conservation and Restoration ............................... 44
2.3 Results and Discussion ............................................................................................ 45
2.3.1 Regression Model ............................................................................................. 45
2.3.1 Respondents’ background ................................................................................. 48
2.3.2 Gender .............................................................................................................. 51
2.3.3 Tourism ............................................................................................................. 51
2.3.4 Number of children, Marital Status .................................................................. 53
2.3.5 Age.................................................................................................................... 53
2.3.6 Supervisory role ................................................................................................ 54

xii
2.3.7 Ethnicity............................................................................................................ 54
2.3.8 Annual household income ................................................................................ 56
2.3.9 Zero payment respondents ................................................................................ 56
2.3.10 Revenue Analysis ........................................................................................... 58
References ..................................................................................................................... 66
3 RECREATION DEMAND AND ECONOMIC VALUE OF NATIVE FOREST
LANDS ............................................................................................................................. 70
3.1 Introduction ............................................................................................................. 70
3.2 Methodology ........................................................................................................... 71
3.2.1 Survey design ................................................................................................... 71
3.2.2 Data Collection ................................................................................................. 77
3.2.3 Theoretical Specification .................................................................................. 79
3.2.4 Analysis ............................................................................................................ 80
3.2.5 Consumer Surplus and Recreation Value ......................................................... 83
3.3 Results and Discussion ............................................................................................ 84
3.3.1 Respondents’ background ................................................................................. 84
3.3.2 Travel Cost ....................................................................................................... 85
3.3.3 Model Output .................................................................................................... 86
3.3.4 Socio-Demographics ........................................................................................ 88
xiii
3.3.5 Attitudes to Conservation ................................................................................. 89
3.3.6 Consumer Surplus............................................................................................. 90
References ................................................................................................................. 93
4 USING SWOT ANALYTICAL HIERARCHY PROCESS TO ASSESS
CONSERVATION PRIORITIES OF STAKEHOLDERS ............................................ 101
4.1 Introduction ........................................................................................................... 101
4.2 Methodology ......................................................................................................... 103
4.2.1 Study Area ...................................................................................................... 103
4.2.2 Theoretical Specification ................................................................................ 106
4.2.3 Data collection ................................................................................................ 108
4.2.4 Survey Design................................................................................................. 113
4.3 Results & Discussion ............................................................................................ 114
References ............................................................................................................... 134
5 CONCLUSION, POLICY IMPLICATIONS & FUTURE WORK ............................ 142
5.1 Environmental Policy Implications ....................................................................... 142
5.2 Study Limitations & Future work ......................................................................... 148
References ............................................................................................................... 152
Appendix I ...................................................................................................................... 153
Appendix II ..................................................................................................................... 169

xiv
Appendix III – Contingent Valuation data summaries ................................................... 174
Appendix IV.................................................................................................................... 188
Appendix V – Travel Cost Data Summaries ................................................................... 192

xv
List of Tables
Table 1 Distribution of protected areas, private forest lands, state owned
forest lands, leased forest lands and forest lands with deer ranching
on the mainland. Information sourced from UNDP-GEF (2009)
and NBSAP (2006)
13
Table 2 Descriptive summary of CV model variables and how they were
coded for data analysis
45
Table 3 List of variables used to explain visitors’ WTP 48
Table 4 Trends in willingness to pay based on regression variables 50
Table 5 Reasons provided by respondents who are not willing to pay for
conservation in the form of entry fees or a levy.
57
Table 6 Estimated costs in million USD (rounded to nearest whole number)
for restoration, segregated by documented targets and coverage.
59
Table 7 Distribution of resident population and tourist arrivals to Mauritius
by age group.
62
Table 8 Estimated revenues (in million USD) that can be raised for
conservation using mean WTP values and lowest and highest CI
values.
63

xvi
Table 9 Description of attitude and socio-demographic variables from the
TCM survey.
72
Table 10 Summary statistics for total travel costs, fuel costs and round-trip
distance covered.
85
Table 11 Variables that can predict the frequency of visits to forested areas,
using TTRCFW and TTRCW/3.
86
Table 12 Annual recreation value in USD, calculated using TTRCFW and
TTRCW/3
90
Table 13 List of biodiversity conservation SWOT factors used to elicit
preferences using AHP. Factors were validated through focus
group discussions with Mauritian stakeholders.
109
Table 14 a: Number of times a factor had highest global priority across all
groups.
132
b: Number of times a factor had lowest global priority across all
groups.
132
xvii
List of Figures
Figure 1 In (A) using mammalian species as a proxy, Waldron et al (2013)
show the differences in levels of threatened global biodiversity
stewarded by each country. In (B) Levels of underfunding by
country with darker colors indicating least amount of funding
(Waldron et al., 2013)
5
Figure 2 Location of Mauritius (C) relative to Madagascar (A), from
GoogleTM Maps (2017).
9
Figure 3 Loss of native forest cover on Mauritius between the late 1700s to
the late 1900s.
11
Figure 4 Land use distribution for mainland Mauritius. Numbers are land
areas in km2. 12
Figure 5 Approximate location of study sites at which CV surveys were
conducted.
42
Figure 6 Illustrative map of Mauritius showing approximate locations of sites
where TCM surveys were conducted.
78
Figure 7a Preference map of SWOT factors for “Activist” stakeholder group. 115
Figure 7b Preference map of SWOT factors for “Agriculture” stakeholders. 116

xviii
Figure 7c
Preference map of SWOT factors for “Environmental Consultant”
stakeholder.
118
Figure 7d Preference map of SWOT factors for “large corporation”
stakeholder.
119
Figure 7e Preference map of SWOT factors for “non-governmental
organization” stakeholders.
120
Figure 7f Preference map of SWOT factors for “outdoor sports” stakeholder. 122
Figure 7g Preference map of SWOT factors for “scientist” stakeholder. 123
Figure 7h Preference map of SWOT factors for “sugar estate” stakeholder. 125
Figure 7i Preference map of SWOT factors for “state agencies” stakeholder. 127
Figure 7j Preference map of SWOT factors for “hunting association”
stakeholder.
129
Figure 7k Preference map of SWOT factors for “facilitators” stakeholder. 130

xix
List of Acronyms and Abbreviations
AHP Analytical Hierarchy Process
CBD Convention on Biological Diversity
CMA Conservation Management Area
CSR Corporate Social Responsibility
CV Contingent Valuation
ESA Environmentally Sensitive Areas
FAO Food and Agricultural Organization
FS Forestry Service
GDP Gross Domestic Product
GEF Global Environmental Facility
IAS Invasive Alien Species
IPCC Intergovernmental Panel on Climate Change
IUCN International Union for the Conservation of Nature
MID Maurice Ile Durable

xx
MOESD Ministry of Environment and Sustainable Development
MOENDU Ministry of Environment and National Development Unit
MTPA Mauritius Tourism Promotion Authority
MUR Mauritian Rupee
NBSAP National Biodiversity Strategy and Action Plan
NGO Non-Governmental Organization
NIASSAP National Invasive Alien Species Strategy and Action Plan
NPCS National Parks and Conservation Service
PAN Protected Area Network
SIDS Small Island Developing States
SWOT Strength Weaknesses Opportunities and Threats
TCM Travel Cost Method
UN United Nations
UNCTAD United Nations Conference on Trade and Development
UNDP United Nations Development Program

xxi
UNOHRLLS United Nations Office of the High Representative for the Least
Developed Countries, Landlocked Developing Countries and Small
Island Developing States
UNICEF United Nations Children’s Fund
US United States
USD United States Dollar
WTP Willingness to Pay
1
1 INTRODUCTION
1.1 Small Island Developing States
Small Island Developing States (SIDS) are defined as a “distinct group of
developing countries facing specific social, economic and environmental vulnerabilities”
(United Nations Office of the High Representative for the Least Developed Countries,
Landlocked Developing Countries and Small Island Developing States [UN-OHRLLS],
2011). SIDS have a number of common characteristics, namely their small size,
geographical dispersion, greater vulnerability to rapid and drastic environmental change,
limited administrative and technical resources (United Nations Conference on Trade and
Development [UNCTAD], 2004). Members of the SIDS network range from the largest
size of 426,840 km2 (State of Papua, New Guinea) to the smallest size of 21 km2 (Nauru,
Pacific) (Neale, 2006) and range from high income to least developed countries. Within
an already restricted land space SIDS have to accommodate urban and agricultural areas,
as well as enough forest cover to keep providing essential ecosystem services,
recreational and traditional benefits. Thus, SIDS are a laboratory case of issues affecting
the developing world.
1.2 Role of forests on SIDS
Sea surface temperatures across the Indian Ocean have shown an increasingly warming
trend over multiple decades (Alory et al., 2007). Surface land temperatures for countries
of the Western Indian Ocean have also increased, but total annual rainfall has decreased
over 48 years, and the number of consecutive dry days has increased (Vincent et al.,

2
2011). The Inter-Governmental Panel on Climate Change (IPCC) Fifth report however
predicts a one to nine percent increase in precipitation over the Indian Ocean for a
scenario with 500-700 ppm of CO2 emissions (Nurse et al., 2014). Increases in
temperature and changes in precipitation can lead to more flooding and erosion events
(Trenberth, 2008); especially in areas experiencing forest loss (Bradshaw et al., 2007).
Preserving native forests on islands is important in maintaining essential ecosystem
goods and services, like provision of fresh water, prevention of soil erosion (Maina et al.,
2013) and for capturing atmospheric carbon (Bolin and Sukumar, in Watson et al., 2000).
1.3 Threats to forests on SIDS
Four SIDS were listed amongst the top ten countries with three percent or more
deforestation per annum in 1990 and 2000 (Wilkie, et al., 2002). Malay and Philippines
archipelagos, including Timor Leste and New Guinea have lost one percent of their
rainforests annually between 2000 and 2010, with lowland evergreens and peat swamps
disappearing faster (Miettinen, et al., 2011). Madagascar lost 40 percent of its forest
cover between the 1950s and 2000 with severe impacts on its endemic biota (Grady et al.,
2007). Forests on island states make up less than one percent of the global forest
coverage (Wilkie et al., 2002) – which stands at 1.5 billion hectares (Achard et al., 2014)
- but provide invaluable goods and services to about 66 million islanders (House, 2013).
Kier et al. (2009) found that plant endemism richness on islands is 9.5 times than
mainland regions, showing that conservation of terrestrial ecosystems on islands are of
prime importance. Human activity (Gibson et al., 2011), invasive alien species (IAS)
(Vitousek et al., 1997), habitat destruction and fragmentation (Brooks et al., 2002), dense

3
human populations (McKee et al., 2004) and increasingly climate change (Loope and
Giambelluca, 2009; Fordham and Brook, 2010) are amongst the many factors that
particularly threaten island biota.
1.4 Protecting forests on islands
Since the 1970s, rates of biodiversity loss have increased, and rates of consumption of
natural resources have increased, along with increasing spread of invasive species and
increasing habitat fragmentation worldwide (Butchart et al., 2010). The Convention on
Biological Diversity (CBD) set targets in 2002 for a “significant decline in biodiversity
loss by 2010”, followed by the Aichi Biodiversity Targets for the period 2011-2020
(CBD, 2014); targets that have not been met. This has, in part, been attributed to a lack
of financial resources, exacerbated by incomplete, thorough country-level data (Waldron
et al., 2013).
The most underfunded countries with regards to conservation are located within the
tropical belt as shown in Figure 1 below. Out of those, SIDS collectively received
around 2.4 percent of the 1.2 billion USD allocated globally to conservation for the
period 2001-2008 (Waldron et al., 2013; Miller et al., 2013).
4
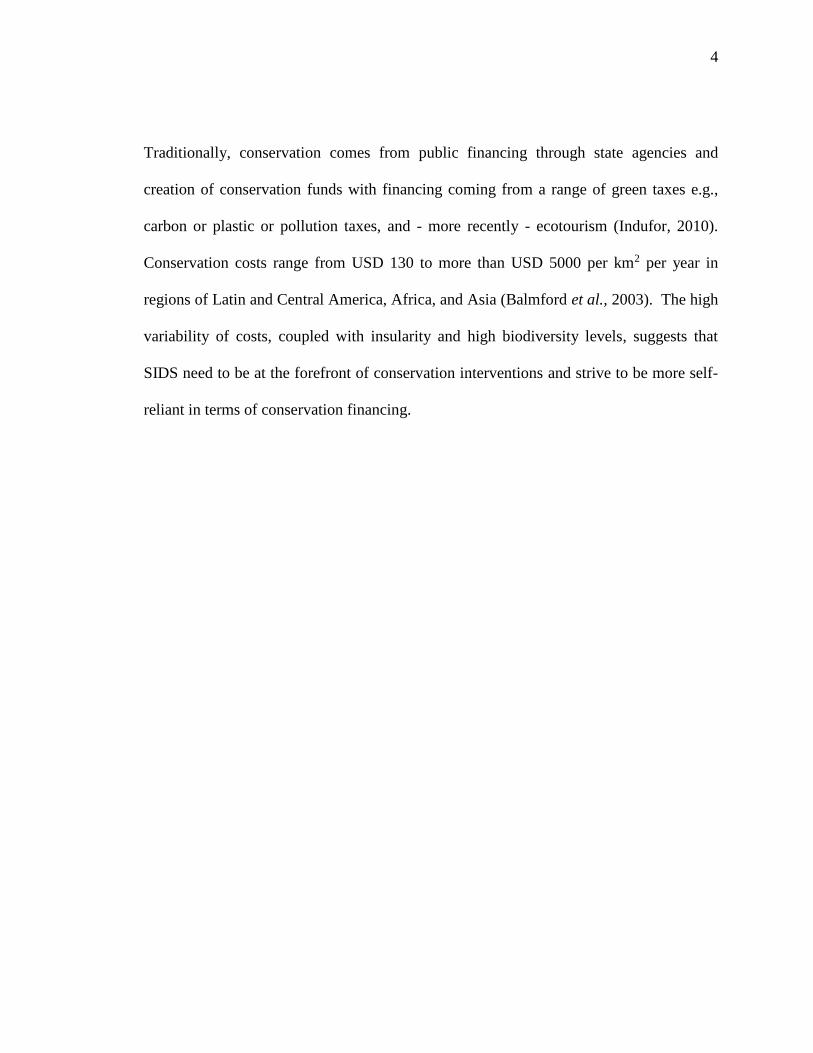
Traditionally, conservation comes from public financing through state agencies and
creation of conservation funds with financing coming from a range of green taxes e.g.,
carbon or plastic or pollution taxes, and - more recently - ecotourism (Indufor, 2010).
Conservation costs range from USD 130 to more than USD 5000 per km2 per year in
regions of Latin and Central America, Africa, and Asia (Balmford et al., 2003). The high
variability of costs, coupled with insularity and high biodiversity levels, suggests that
SIDS need to be at the forefront of conservation interventions and strive to be more self-
reliant in terms of conservation financing.

5
Legend for A: very low threatened biodiversity low threatened diversity
medium diversity to high diversity
Legend for B: to levels of underfunding from bad to worst
Figure 1. In (A) using mammalian species as a proxy, Waldron et al. (2013) show the
differences in levels of threatened global biodiversity stewarded by each country. In
(B) Levels of underfunding by country with darker colors indicating least amount of
funding (Waldron et al., 2013)
6
1.5 Study Aims
Given the growing financial constraints on conservation worldwide and increased
awareness of SIDS, the need to implement and prioritize conservation related policy
interventions has become all the more challenging. Policies for SIDS needs to use
adaptive mechanisms built on local knowledge, flexible governance, self-regulation and
diversification of livelihoods (Lauer et al., 2013). Our study therefore sought to address
the following questions.
1. What is the willingness to pay for conservation in SIDS?
2. What is the value attributed to forests by people living in SIDS?
3. What factors influence decision-making and stakeholder preferences towards
conservation initiatives?
Altogether, we expect these three intertwined objectives to facilitate a self-funding
sustainable conservation model for SIDS. To address these aims, we focused our study
on the Republic of Mauritius, an upper middle income SIDS that is also within one of the
most bio-diverse hotspots of the world (Myers et al., 2000). Mauritius was amongst the
first countries to ratify the Convention on Biological Diversity in 1992, following which
several in-situ and ex-situ conservation practices have been set up (National Biodiversity
Strategy and Action Plan [NBSAP], 2006), whilst at the same time increasing state and
private investment in rapid development. Specifically, our objectives were:
1. Assess the potential for state and private lands in Mauritius to use entry fees as a
way to leverage conservation funds.

7
2. Assess the recreation value of forests in Mauritius as a means of placing a dollar
value on their worth.
3. Assess the priorities of a range of state and private stakeholders in Mauritius with
respect to forest conservation.
Chapter 2 addresses the first objective, for which we designed and administered a survey-
based contingent valuation approach to estimate the willingness to pay for conservation
of state and privately owned forests. Chapter 3 addresses the second objective for which
we used a revealed preference survey-based approach to obtain individual travel cost data
from residents, collected at nine forested areas on the island. Chapter 4 addresses the
third objective for which we used strengths, weaknesses, opportunities and threats
(SWOT) analysis combined with analytic hierarchy process (AHP) to assess preferences
and priorities of local stakeholders with regards to terrestrial conservation management.
Chapter 5 presents the conclusions drawn from the studies, the implications for
environmental policy, study limitations and the potential for future work.

8
1.6 Study Area
1.6.1 Location and Geography
Mauritius, an island of 1,856km2, is part of the Mascarenes archipelago, together with
Reunion and Rodrigues. It is located about 900km east of Madagascar (Saddul, 1995), as
shown in Figure 2, between latitudes 19°50’ and 20°51’ South, and between longitudes
57°18’ and 57°48’ East. The island has a tropical humid climate with average
temperatures between 20.4°C (winter) and 24.7°C (summer) (Mauritius Meteorological
Service, 2017). The island terrain comprises of a surrounding coastal plain that rises up
to mountain ranges that encircle a central plateau. Mauritius formed volcanically around
7.8 million years ago (McDouglall and Chamalaun, 1969 in Strahm, 1993). The primary
crater is still distinguishable from a chain of mountains running from the Black River
Ranges with the highest peak at 828m, to the Moka Range and to some isolated peaks in
between (Saddul, 1995).

9
Figure 2: Location of Mauritius (C) relative to Madagascar (A), from GoogleTM Maps
(2017). Encircled is the Mascarene archipelago with Reunion (B) and Rodrigues (D).
1.6.2 Society and Economy
Arab and Portuguese sailors had the Mascarene Archipelago on their routes since the
tenth century. Mauritius was first colonized by the Dutch from 1638 to 1710, during
which time they exploited the island for its ebony wood, palm and animals (Brouard,
1963). The next colonization periods saw the island occupied by the French and the
British from the 18th century until independence in 1968. Throughout this period large
expanses of forest land were cleared for agriculture, timber production and settlement.
Colonization saw the arrival of slaves from Madagascar and East Africa, followed by the
arrival of indentured laborers from India once slavery was abolished on the island in
1835. Mauritian society today is a multi-cultural, multi-ethnic, multi-lingual society
A
B
C D
10
made up of descendants of French and British colonizers, slaves, indentured laborers, as
well as Chinese tradesmen.
Post-independence, the Mauritian economy was centered on agricultural export (mainly
sugarcane), followed by textile and clothing manufacturing, all of which were dependent
on significant foreign direct investment and preferential markets in Europe (Sobhee,
2009). From the 1990s, the economy diversified towards construction, tourism and the
financial sector. Trend in economic indicators for the island are as follows: (i) real Gross
Domestic Product (GDP) grew by 5.2 percent between 1977 and 2006 (ii) average
income increased three times in that same period (iii) life expectancy at birth increased
from 61 years in 1965 to 73 in 2005 (iv) Gini coefficient declined from 0.5 in 1962 to
0.34 in 2004 (v) consumer price inflation averaged 8.7 percent per year between 1976
and 2006 (Subramanian, 2009). The island is today classified as an upper middle income
country with a gross domestic product of USD 12.2 billion (The World Bank, 2016), for a
population of 1.3 million (Statistics Mauritius, 2016).

11
1.6.3 State of forest ecosystems and their conservation
Colonization also saw the introduction of alien plants and animals like the Chinese guava
(Psidium cattleianum), the Traveller’s Palm (Ravenala madagascarensis) and the Indian
Mynah (Acridotheres tristis) (Brouard, 1963), most of which are now major invasive
species, threatening native biota on the island. With time, development and lifestyle
changes, Mauritius has seen a rapid decline in forest cover with the percentage of forest
bearing at least 50% native canopy, drastically reduced from 85 percent of the island’s
surface area in the 1700s to under two percent in late 1990s (Vaughan and Wiehe, 1937;
Page and D'Argent, 1997), a decline shown in Figure 3.
Figure.3. Loss of native forest cover on Mauritius between the late 1700s to the late
1900s. (Vaughan and Wiehe, 1937; Page and D'Argent, 1997)

12
Native forests left on Mauritius are now surrounded by urban, industrial and agricultural
development (National Biodiversity Strategy and Action Plan [NBSAP], 2006), with land
use distributions shown in Figure 4. They are mostly located on mountain ranges and
other hill slopes that could not be converted to agriculture or urban land-uses. More
information on the distribution of forest remnants are given in Table 1.
Figure 4: Land use distribution for mainland Mauritius. Numbers are land areas in
km2.

13
The spread of IAS encourages further habitat degradation and fragmentation (Vitousek et
al., 1997). When combining these conditions to ecological impacts like loss of natural
dispersers or pollinators as well as increased distance from source populations, the
extinction of species left within fragments increases (Gibson et al., 2013). Yet, Mauritian
native forests retain the highest tree diversity of the Mascarene region (Florens et al.,
2012) and are home to 12 native forest birds, 9 of which are endemic (NBSAP, 2006).
The island bears 691 species of native flowering plants of which 273 are endemic to
Mauritius only, and about 150 species are endemic to the Mascarenes (Baider et al.,
2010).
Table 1: Distribution of protected areas, private forest lands, state owned forest lands,
leased forest lands and forest lands with deer ranching on the mainland. Information
sourced from UNDP-GEF (2009) and NBSAP (2006)
State owned and
managed (km2)
Leased or Privately
owned (km2)
Total Area 221.84 250.16
Protected
Areas
Black River Gorges National
Park
65.74
Bras d'Eau National Park 4.972
Perrier Nature Reserve 0.0144
Les Mares Nature Reserve 0.051
Gouly Pere Nature Reserve 0.1095

14
Cabinet Nature Reserve 0.1773
Bois Sec Nature Reserve 0.0591
Le Pouce Nature Reserve 0.688
Corps de Garde Nature Reserve 0.9033
Rivulet Terre Rouge Estuary
(Ramsar Site)
0.26
Mountain reserves
38
River reserves
27.4
Mondrain private reserve 0.05
Emile Series private reserve 0.08
>50% native canopy 26
Plantation forests 118.16 26
Land with
deer
State owned and managed 69.3
State owned – Leased 30.7
Privately owned
150
Undisclosed land use 8.63
15
Mauritius has been a forerunner in implementing conservation measures. It was one of
the first countries to ratify the CBD in 1992, following which several in-situ and ex-situ
conservation practices have been set up (NBSAP, 2006). In-situ conservation practices
involve creating Conservation Management Areas, active weeding of invasive alien plant
species, trapping of invasive alien animal species, captive native bird breeding programs
and provision of supplemental feeding for released native birds. Ex-situ conservation
practices include native plant propagation in nurseries, maintaining a native arboretum
and herbarium collections. The island bears twelve formal state protected areas on the
mainland which are two National Parks, seven Nature Reserves, one Forest Reserve, one
Bird Sanctuary, one Ramsar site, in addition to nine offshore islet protected areas,
covering a total area of 80.27 km2 (United Nations Development Program-Global
Environment Facility [UNDP-GEF], 2009; Government Information Service [GIS],
2011). The Nature Reserves, Forest Reserves, as well as river and mountain reserves, are
managed by the Forestry Services (FS), whilst the National Parks and Conservation
Service (NPCS) oversees the management of the National Parks, most offshore islet
Nature Reserves, the Ramsar site and Ancient Monuments. The main conservation
strategy used by state agencies is the creation of Conservation Management Areas
(CMA), where patches of good quality forest are fenced off and cleared of all invasive
alien plant species within them. Since the setting up of the first CMA in 1987 covering
0.012km2 (Baider and Florens, 2011), today the fenced CMAs cover some 0.6km2
(NBSAP, 2006). A more detailed discussion of CMAs as a conservation tool is provided
in Section 2.1.
16
With regards to private lands, about 65.53km2 under forests are classified as Mountain
Reserve or River Reserve under the Forest and Reserves Act of 1983. Enforcement of
regulations or conservation activities in those reserves is limited and private landowners
lack technical and financial incentives to invest wholly in IAS control or the setting up of
CMAs on their lands (Seewoobaduth et al., 2005).
Mauritian forests are still heavily threatened. By 2021, it is estimated that approximately
122km2 of land will be needed for additional urban, business and infrastructural
development (Ministry of Environment and Sustainable Development [MOESD], 2011),
making land-use change a substantial pressure on forest lands. However, IAS present the
greatest biological threat to Mauritian biota, such that their control and eradication is the
major component of forest restoration and conservation for the island. Florens (2013)
showed that investing in forest restoration by removing invasive alien plants alone can
bring about strong positive effects on both native plants (Baider and Florens, 2006, 2011;
Monty, Florens and Baider, 2013) and animals (Florens and Baider, 2007; Florens et al.,
2010; Hugel, 2012), and this at lower costs than required by traditional setting up of
fenced CMAs.

17
1.6.4 Conservation financing in Mauritius
The Wildlife and National Parks Act (1994) catered for the creation of the National Parks
and Conservation Fund. Money for this fund comes from a USD 75/head tax on the
export of F1-generation Macaca fascicularis for vivisection (Greenwood, 2008). This
funding is used for all expenses incurred by the NPCS, and any additional annual funding
is secured through Government budget. There is no disclosed information on the actual
allocation of funds within the NPCS and therefore it is hard to establish the minimum
amount that goes specifically to forest restoration work on an annual basis, as opposed to
salaries, office maintenance or other expenses. Additional local sources of funding for
the NPCS come from export and import permits under the Convention against Illegal
Trade in Endangered Species (CITES) and sales of nursery-grown native plants (CBD,
2003). Additional biodiversity funding (amount unknown) comes from the National
Environment Fund created under the Environment Protection Act (1991) (CBD, 2003).
In terms of donor funds (whether the donors are international agencies or local bodies), if
a project falls within the jurisdictional range of the Director of the NPCS, then the NPCS
can receive part of the funding and act as lead agency, even if implementation goes to a
non-governmental organization or other third party (CBD, 2003). Mauritius has been
receiving international funding from the GEF for over 14 years, disbursed through the
World Bank, the United National Environment Program (UNEP), the UNDP and the
Food and Agricultural Organization (FAO) (CBD, 2003). This GEF funding - to the tune
of USD 270,000 per year - went to marine conservation and to energy management
projects in Rodrigues, amongst other areas, including biodiversity conservation (CBD,

18
2003). The island obtained about USD 43 million from the European Commission’s
European Development Funds, but which went mostly to waste water management
(CBD, 2003).
The Government of Mauritius allocated about USD 35 million annually to recurrent and
capital expenditures on fisheries, environmental management, parks management,
agricultural services, waste water management, agricultural research and extension
program, as well as support to non-governmental organizations (CBD, 2003). The forest
biodiversity-related allocations go to both the NPCS and the FS. Another report to the
CBD dated 2014 highlights that Government budget allocations were to the tune of USD
38 million for the NPCS and USD 97 million for the FS.
Lastly, the 2003 report to the CBD recognized that the private sector in Mauritius has
contributed to biodiversity conservation, but does not give the levels of those
contributions. In 2009, the Ministry of Finance sought to formalize the contributions of
the private sector and introduced a Corporate Social Responsibility (CSR) program that
gave corporate bodies the option to direct two percent of their annual book profits
towards projects that would bring social and environmental benefit to local communities,
otherwise these two percent would be collected by the state (PriceWaterhouseCoopers,
2010). There is however no clear documentation on how much of this CSR funding has
specifically gone to forest conservation activities, since the inception of this program.
The Government of Mauritius has set itself the target of turning the island into a high-
income economy by 2020 (GIS, 2016; Fakun and Jaddoo, 2017). However, it is expected
that the flow of international aid to Mauritius will eventually decline in favor of lower

19
income countries (Paupiah, 2004). The 2003 report to the CBD on biodiversity-related
spending in Mauritius recognized that most conservation activities are financially
supported by the Government and various legislative funds, but funding was still limited.
With budgetary allocations already deemed insufficient, investigating means to
complement current funding sources for conservation is of importance, especially as
concern for protecting forest areas increases, both for nature-tourism opportunities and in
response to social pressures on mitigating impacts of climate change.
1.6.5 Forest Uses on the Mainland
Unlike most of the Pacific and Caribbean islands, the Mascarenes bear no indigenous
human populations, with all populations that reached Mauritius over the last 300 years
coming from Europe, Asia and Africa, creating the baseline for its multi-ethnicity and
multi-culturality (Paupiah, 2004). During and immediately post-colonization, people
established on the island relied on forest products, principally for fuelwood and timber.
Traditional knowledge of slaves and indentured laborers has expanded to a number of
native medicinal plants (Rouillard and Gueho, 1999), many of which are now well-
documented, for example, antiplasmodial and anti-inflammatory effects of Aphloia
theiformis and Nuxia verticillata (Jonville et al., 2011). Modern-day Mauritians bear
little to no direct link to, or reliance upon, native forests for survival. However plantation
forests and some areas of the National Parks are highly favored by residents as picnic and
hiking spots, as well as for collection of Psidium cattleianum and Rubus rosifolius
berries, a habit now well encroached in the local culture, despite these two species being
IAS. State lands that are under the purview of the FS and NPCS, for the most part can be

20
accessed at no cost by members of the public but there is a dearth of annual visitor
counts. Even then, many of the Nature Reserves and Forest Reserves remain largely
unknown and not easily accessible to the public, with the exception of the National Parks
(fruit picking, hiking, trail running), Le Pouce Nature Reserve (mountain climbing) and
Corps de Garde Nature Reserve (mountain climbing). Private forest lands and some
mountain and river reserves on private lands are also popular with visitors as they bear
nature-tourism operators.
Mauritius offers a set of enabling conditions (favorable economy, existing and upcoming
legal implements, value attached to biodiversity and natural areas, long standing history
of biodiversity research) to successfully develop and test a scientific and socio-economic
model in favor of greater and more sustainable conservation of native forests.
1.7 Research Methodology
1.7.1 Objective 1 – Stated Preference Method: Contingent Valuation
Objective 1 is addressed in Chapter 2 using a stated preference based non-market
valuation method, namely contingent valuation (CV). The contingent valuation approach
has been used successfully in various settings and places a monetary value that people
attach to goods or services by directly eliciting response contingent on a set of conditions
(Lal et al., 2017). Surveys help estimate peoples’ willingness to pay (WTP) for the
provision of utility from nature, for which market prices may not exist, (King and
Mazzotta, 2000). The method relies on creating a hypothetical market for the good
and/or service respondents are being asked to value. This method has been extensively

21
used in valuing recreation, ecosystem services and other benefits perceived by
populations affected. For example, results of a CV survey in the Murchison-Semliki
landscape in Uganda showed that households were willing to accept USD 630/ha/year as
compensation for preserving corridor forests (Wildlife Conservation Society, 2010).
Nuva et al. (2009) used a CV approach, to assess visitors’ WTP as an additional entry fee
to the Gunung Gede Pangrango National Park in Jakarta, concluding that the mean WTP
was RP 7629.77 (USD 0.57 at 2017 exchange rates) per visit and influential factors were
gender, income and where they lived. Alvarez and Larkin (2010) used an open-ended
CV survey, alongside revealed preference methods, to estimate the WTP for restoration
of the Los Nevados National Park in Colombia following wildfire damage. They found
that higher entry fees may not be enough towards a one-time investment into restoring all
2,500 ha, but may efficiently fund on-going small-scale restoration projects. Mwebaze et
al. (2010) found that tourists in Seychelles were willing to pay between USD 50 and
USD 57 on top of usual entry fees, towards a conservation fund dedicated to prevention
measures against invasive alien species.
National parks and forest reserves in Mauritius are free of charge to members of the
public, except for areas specifically closed off. Eco-tourism sites on privately-owned
forest lands bear an entry fee but these cover maintenance and personnel costs. The WTP
for conservation was to domestic and international tourist visitors in the form of either
paying an entry fee to state-owned forested areas, or paying an extra amount to sites that
are already charging an entry fee.

22
1.7.2 Objective 2 – Revealed Preference Method: Travel Cost Method
Objective 2 is addressed in Chapter 3 using a revealed preference based non-market
valuation method, namely travel cost (TCM). TCM uses travel costs of visitors to
estimate the recreational value of a site. The three types of travel cost methods are the
utility-based TCM, zonal TCM and individual TCM. Benson et al. (2013) used TCM
with a zero-truncated negative binomial regression and K-means cluster analysis to assess
benefits that users (n=580) with differing activity preferences, gain from visiting
Yellowstone National Park. They found that summer visitors derived between USD 276
and USD 235 per person per trip in benefits from the park. Shrestha, Stein & Clark
(2007) assessed 237 visitors’ demand for nature-based recreation in the Apalachicola
River region (USA) using TCM and showed that mean WTP was USD 74.18 per visit per
day, equivalent to USD 484.56 million per year. Pirikiya et al. (2016) used TCM to
establish that the recreation value of Shahid Zare Sari Forest Park in Iran is about USD
52,558 per hectare per year, based on 302 individual responses. Ezebilo (2016) used
mailed-in TCM survey data to establish that visitors to nature areas in Sweden had a visit
frequency of 80 times per year, with a travel cost of USD 16 per person, per visit.
Bartczak et al. (2012) used on-site survey of 1128 respondents to establish that visitors to
forest areas in Poland had a consumer surplus between USD 3.12 and USD 5.62 per
person, per visit. TCM has also been successfully used to estimate the economic value
attached to marine parks (Chae et al., 2012; Mwebaze & MacLeod, 2013), coral reef
systems (Carr & Mendelsohn, 2002; van Beukering, et al., 2015; Seenprachawong, 2016)
and other coastal protected areas, but there is limited literature on the application of TCM

23
to value forested landscapes on SIDS. In our study, we used the travel cost method to
assess the recreation value of Mauritian forests across the island, by targeting users at
different sites and assessing their individual travel costs and demand for outdoor
recreation.
1.7.3 Objective 3 – SWOT-AHP
Objective 3 is addressed in Chapter 4 where SWOT factors were compared to one
another in a pairwise fashion using a 9-point scale system (Saaty, 1990). This allows for
preference weights to be calculated for each SWOT and for those eights to show
similarities or differences in preferences between different respondents. AHP has been
successfully applied to assess the case for forest certification in Finland (Kurttila et al.,
2000); assess environmental and socio-economic indicators for all terrestrial Italian
protected areas (Scolozzi et al., 2014); assessing how local communities perceive
community-based management for the Nyungwe Forest Reserve in Rwanda (Masozera et
al., 2006). These studies have already proven the use of SWOT-AHP in natural resource
and conservation management, but there are limited studies on its application to inform
forest conservation strategies in SIDS, a gap which our study seeks to address by
focusing on the Republic of Mauritius and its conservation programs.

24
References
Achard, F., Beuchle, R., Mayaux, P., Stibig, H. J., Bodart, C., Brink, A., Carboni, S.,
Desclée, B., Donnay, F., Eva, H.D., Lupi, A., Raši, R., Seliger, R. & Simonetti, D.
(2014). Determination of tropical deforestation rates and related carbon losses from 1990
to 2010. Global Change Biology, 20(8), 2540-2554.
Alory, G., Wijffels, S., and Meyers, G. (2007). Observed temperature trends in the Indian
Ocean over 1960–1999 and associated mechanisms. Geophysical Research Letters, 34(2).
L02606. doi:10.1029/2006GL028044.
Alvarez, S., & Larkin, S. L. (2010). Valuing ecological restoration and recreational
benefits in a mountain protected area: The case of Los Nevados national park, Colombia.
Journal of Sustainable Development. 34, 3-15.
Baider , C. & Florens , F. B. V. (2006) Current decline of the “Dodo-tree”: a case of
broken-down interactions with extinct species or the result of new interactions with alien
invaders? In Emerging Threats to Tropical Forests (eds W. F. Laurance and C. A. Peres).
Chicago University Press, Chicago, IL , pp. 199 – 214.
Baider, C., and Florens, F. B. V. (2011). Control of invasive alien weeds averts imminent
plant extinction. Biological Invasions, 13(12), 2641-2646.
Baider, C., Florens, F. V., Baret, S., Beaver, K., Matatiken, D., Strasberg, D., and
Kueffer, C. (2010, June). Status of plant conservation in oceanic islands of the Western
Indian Ocean. In Proceedings of the 4th Global Botanic Gardens Congress (p. 1).

25
Balmford, A., Gaston, K.J., Blyth, S., James, A., Kapos, V. (2003) Global variation in
terrestrial conservation costs, conservation benefits, and unmet conservation needs.
Proceedings of the National Academy of Sciences. 100(3),1046-1050.
Bradshaw, C. J., Sodhi, N. S., Peh, K. S. H., and Brook, B. W. (2007). Global evidence
that deforestation amplifies flood risk and severity in the developing world. Global
Change Biology, 13(11), 2379-2395.
Brooks, T. M., Mittermeier, R. A., Mittermeier, C. G., Da Fonseca, G. A., Rylands, A.
B., Konstant, W. R., ... & Hilton T. C. (2002). Habitat loss and extinction in the hotspots
of biodiversity. Conservation Biology. 164, 909-923
Brouard, N. R. (1963) A History of Woods and Forests in Mauritius. Port-Louis,
Mauritius.: Government Printer.
Butchart, S.H.M., Walpole, M., Collen, B., Strien, A.v., Scharlemann, J.P.W., Almond,
R.E.A., Baillie, J.E.M., Bomhard, B., Brown, C., Bruno, J., Carpenter, K.E., Carr, G.M.,
Chanson, J., Chenery, A.M., Csirke, J., Davidson, N.C., Dentener, F., Foster, M., Galli,
A., Galloway, J.N., Genovesi, P., Gregory, R.D., Hockings, M., Kapos, V., Lamarque, J-
F., Leverington, F., Loh, J., McGeoch, M.A., McRae, L., Minasyan, A., Morcillo, M.H.,
Oldfield, T.E.E., Pauly, D., Stanwell-Smith, D., Stuart, S.N., Symes, A., Tierney, M.,
Tyrrell, T.D., Vié, J-C., Watson, R. (2010) Global Biodiversity: Indicators of Recent
Declines. Science. 328. 1164-1168.
CBD (2003) Biodiversity Spending in Mauritius. Available from
<https://www.cbd.int/financial/expenditure/Mauritius-spending.doc>
26
CBD (2014) Convention on Biological Diversity – The Convention. Available from <
www.cbd.int/sp/ >
CBD (2014) Implementation Of The Strategy For Resource Mobilization - Preliminary
Reporting Framework for Mauritius. By the National Parks and Conservation Service.
Available from <https://www.cbd.int/financial/oda/mauritius-preliminary-reporting-
framework-2014-en.pdf >
Fakun, N., Jaddoo, J. (2017). High-Income economy: Are we on the right track? News on
Sunday. Le Déi Media Group. Port Louis. Mauritius. Available from <
http://defimedia.info/high-income-economy-are-we-right-track>
Florens , F. B. V. & Baider , C. (2007) Relocation of Omphalotropis plicosa (Pfeiffer,
1852), a Mauritius endemic landsnail believed extinct . Journal of Molluscan Studies, 73,
205 – 206.
Florens , F. B. V. , Mauremootoo , J. R. , Fowler , S. V. , Winder , L. & Baider , C.
(2010) Recovery of indigenous butterfly community following control of invasive alien
plants in a tropical island’s wet forests. Biodiversity and Conservation, 19, 3835–3848.
Florens , F. B. V. & Baider , C. (2013) Ecological restoration in a developing island
nation: how useful is the science? Restoration Ecology, 21(1), 1 – 5 ; DOI:
10.1111/j.1526-100X.2012.00920.x
Florens, F. V., Baider, C., Martin, G. M., and Strasberg, D. (2012). Surviving 370 years
of human impact: what remains of tree diversity and structure of the lowland wet forests
of oceanic island Mauritius? Biodiversity and Conservation, 21(8), 2139-2167.

27
Fordham, D. A., & Brook, B. W. (2010). Why tropical island endemics are acutely
susceptible to global change. Biodiversity and Conservation, 19(2), 329-342.
Gibson, L., Lynam, A. J., Bradshaw, C. J., He, F., Bickford, D. P., Woodruff, D. S., ... &
Laurance, W. F. (2013). Near-complete extinction of native small mammal fauna 25
years after forest fragmentation. Science, 3416153, 1508-1510.
GIS (2011) Prime Minister Inaugurates the Bras d’Eau National Park. Government
Information Service Newsletter. PrimeMinister’s Office. Government of Mauritius. 13
pp. Available from
<http://gis.gov.mu/English/Documents/GIS%20Publication/enewsdec2011.pdf>
GIS (2016) Mauritius to become a high income economy through Innovation, says Ag
President of the Republic. Government Information Service Newsletter. Prime Minister’s
Office. Government of Mauritius. Available from <
http://www.govmu.org/English/News/Pages/Mauritius-to-become-a-high-income-
economy-through-Innovation,-says-Ag-President-of-the-Republic.aspx>
Grady, H. J., Steininger, M, K., Compton, J., Juhn, D., Hawkins, F. (2007) Fifty years of
deforestation and forest fragmentation in Madagascar. Environmental Conservation.
34(4) 325-333.
House, W.J. (2013) Population and Sustainable Development in Small Island Developing
States: Challenges, Progress made and Outstanding Issues. Population Division Technical
Paper No. 2013/4. United Nations Department of Economic and Social Affairs. New
York.

28
Hugel, S. (2012) Impact of native forest restoration on endemic crickets and katydids
density in Rodrigues island. Journal of Insect Conservation, 16, 473–474.
Indufor (2010) Financing forests and sustainable forest management in small island
developing states. Second macro-level paper. Prepared for the United Nations Forum on
Forests. Helsinki.
Jonville, M. C., Kodja, H., Strasberg, D., Pichette, A., Ollivier, E., Frédérich, M.,
Angenot, L., Legault, J. (2011). Antiplasmodial, anti-inflammatory and cytotoxic
activities of various plant extracts from the Mascarene Archipelago. Journal of
Ethnopharmacology, 136(3), 525-531.
Kier, G., Kreft, H., Lee, T. M., Jetz, W., Ibisch, P. L., Nowicki, C., Mutke, J. & Barthlott,
W. (2009). A global assessment of endemism and species richness across island and
mainland regions. Proceedings of the National Academy of Sciences, 106(23), 9322-
9327.
King, D.M., Mazzotta, M.J. (2000) Ecosystem Valuation. United States Department of
Agriculture, Natural Resources and Conservation Service, National Oceanographic and
Atmospheric Administration. Available from <
http://www.ecosystemvaluation.org/index.html>
Kurttila, M., Pesonen, M., Kangas, J., & Kajanus, M. (2000) Utilizing the analytic
hierarchy process (AHP) in SWOT analysis—a hybrid method and its application to a
forest-certification case. Forest policy and economics, 1(1), 41-52.

29
Lal, P., Wolde, B., Masozera, M., Burli, P., Alavalapati, J., Ranjan, A., Montambault, J.,
Banerjee, O., Ochuodho, T. & Mugabo, R. (2017). Valuing visitor services and access to
protected areas: The case of Nyungwe National Park in Rwanda. Tourism Management.
61, 141-151.
Lauer, M., Albert, S., Aswani, S., Halpern, B.S., Campanella, L., La Rose, D. (2013)
Globalization, Pacific islands, and the paradox of resilience. Global Environmental
Change 23. 40-50.
Loope, L. L., & Giambelluca, T. W. (1998). Vulnerability of island tropical montane
cloud forests to climate change, with special reference to East Maui, Hawaii. In Potential
Impacts of Climate Change on Tropical Forest Ecosystems (pp. 363-377). Springer
Netherlands.
Maina, J., De Moel, H., Zinke, J., Madin, J., McClanahan, T., & Vermaat, J. E. (2013).
Human deforestation outweighs future climate change impacts of sedimentation on coral
reefs. Nature communications, 4:1986 doi: 10.1038/ncomms2986 (2013)
Masozera, M. K., Alavalapati, J. R., Jacobson, S. K., & Shrestha, R. K. (2006) Assessing
the suitability of community-based management for the Nyungwe Forest Reserve,
Rwanda. Forest Policy and Economics, 8(2), 206-216.
Mauritius Meteorological Service (2017) Climate of Mauritius. Available from
<http://metservice.intnet.mu/climate-services/climate-of-mauritius.php>

30
McKee, J. K., Sciulli, P. W., Fooce, C. D., & Waite, T. A. (2004). Forecasting global
biodiversity threats associated with human population growth. Biological Conservation.
1151, 161-164.
Miettinen, J., Shi, C., and Liew, S. C. (2011). Deforestation rates in insular Southeast
Asia between 2000 and 2010. Global Change Biology, 17(7), 2261-2270.
Miller, D.C., Agrawal, A. and Timmons Roberts, J. (2013) Biodiversity, governance, and
the allocation of international aid for conservation. Conservation Letters 6: 12-20.
Ministry of Environment and Sustainable Development. (2011). Mauritius Environment
Outlook Report. In Commission de l’Ocean Indien (Ed.). Port Louis, Mauritius:
Government of Mauritius.
Mwebaze, P., MacLeod, A., Tomlinson, D., Barois, H., & Rijpma, J. (2010). Economic
valuation of the influence of invasive alien species on the economy of the Seychelles
islands. Ecological Economics. 6912, 2614-2623.
Myers, N., Mittermeier, R. A., Mittermeier, C. G., da Fonseca, G. A. B., and Kent, J.
(2000). Biodiversity hotspots for conservation priorities. Nature, 403, 853-858.
NBSAP (2006). National biodiversity strategic action plan 2006 – 2015. Réduit,
Mauritius. 136 pp.
Neale, D. (2006,). Marine Administration in Small Island Developing States (SIDS).
Paper presented at the Promoting Land Administration and Good Governance 5th FIG
Regional Conference.
31
Nurse, L.A., R.F. McLean, J. Agard, L.P. Briguglio, V. Duvat-Magnan, N. Pelesikoti, E.
Tompkins, and A. Webb. (2014) Small islands. In: Climate Change 2014: Impacts,
Adaptation, and Vulnerability. Part B: Regional Aspects. Contribution of Working Group
II to the Fifth Assessment Report of the Intergovernmental Panel on Climate Change
[Barros, V.R., C.B. Field, D.J. Dokken, M.D. Mastrandrea, K.J. Mach, T.E. Bilir, M.
Chatterjee, K.L. Ebi, Y.O. Estrada, R.C. Genova, B. Girma, E.S. Kissel, A.N. Levy, S.
MacCracken, P.R. Mastrandrea, and L.L. White (eds.)]. Cambridge University Press,
Cambridge, United Kingdom and New York, NY, USA, pp. 1-60.
Nuva, R., Shamsuddin, M.N., Radam, A., & Slaub, A. (2009) Willingness to Pay towards
the Conservation of Ecotourism resources at Gunung Gede Pangrango National Park,
West Java, Indonesia. Journal of Sustainable Development. 22 173-186.
Page, W. S., and D'Argent, G. (1997). A survey of Mauritius (Indian Ocean) to identify
priority rainforest areas for conservation management. Mauritius: Mauritius Wildlife
Foundation. Report.
Paupiah, S. A. (2004). National Report to the Fifth Session of the United Nations Forum
on Forests for the Republic of Mauritius. New York, USA: United Nations Forum on
Forests Secretariat.
Rouillard, G., and Gueho, J. (1999). Les Plantes et leur Histoire a L'ile Maurice.
Mauritius: MSM Ltd.
Saaty, T.L., (1990) How to make a decision: the analytic hierarchy process. European
Journal of Operational Research. 48(1), 9-26.

32
Saddul, P., Nelson, B. W., and Jahangeer-Chojoo, A. (1995). Mauritius: A
geomorphological analysis. Mahatma Gandhi Institute.
Scolozzi, R., Schirpke, U., Morri, E., D'Amato, D., & Santolini, R. (2014) Ecosystem
services-based SWOT analysis of protected areas for conservation strategies. Journal of
environmental management, 146, 543-551.
Seewoobaduth, J., Naga, K. D., Allas, J., Florens, F.B.V., Goolaup, P., Paupiah, S. A.,
Rughooputh, S. D. D. V. (2005) National Capacity Needs Self-Assessment for Global
Environmental Management-Republic of Mauritius. Policy. 37, 5-2.
Sobhee, S. K. (2009). The Economic Success of Mauritius: Lessons and Policy Options
for Africa. Journal of Economic Policy Reform.12 (1), 29–42.
Statistics Mauritius (2016) Population and Vital Statistics 2015. Ministry of Finance and
Economic Development. Republic of Mauritius. Available from
<http://statsmauritius.govmu.org/English/Publications/Documents/EI1230/Pop_Vital_Sta
ts_Year15.doc>
Strahm, W. A. (1993) The Conservation and Restoration of the Flora of Mauritius and
Rodrigues. Unpublished PhD thesis, University of Reading
Subramanian, A. (2013). The Mauritian success story and its lessons. Achieving
development success: strategies and lessons from the developing world. United Nations
University (UNU), World Institute for Development Economics Research (WIDER)
36.204-231. ISBN 978-92-9230-207-8.

33
Saaty, T.L., (1990) How to make a decision: the analytic hierarchy process. European
Journal of Operational Research. 48(1), 9-26.
The World Bank (2016). Country data: Mauritius [Datafile]. Available from
<https://data.worldbank.org/country/mauritius>.
Trenberth, K. E. (2008). The impact of climate change and variability on heavy
precipitation, floods, and droughts. Encyclopedia of hydrological sciences.
UNCTAD. (2004). Is a special treatment of small island developing States possible?
Geneva: United Nations Conference on Trade and Development.
UNDP-GEF (2009) Expanding coverage and strengthening management effectiveness of
the protected area network on the island of Mauritius. UNDP Project document. PIMS
1749, GEF Project ID 3526. Unpublished report.
UN-OHRLLS. (2011). Small Island Developing States – Small island bigger stakes.
Flyer. New York. Available online < http://unohrlls.org/custom-
content/uploads/2013/08/SIDS-Small-Islands-Bigger-Stakes.pdf>
Vaughan, R. E., and Wiehe, P. O. (1937). Studies on the vegetation of Mauritius. I. A.
preliminary survey of the plant communities. Journal of Ecology, 25(2), 289–343.
Vincent, L. A., Aguilar, E., Saindou, M., Hassane, A. F., Jumaux, G., Roy, D.,
Booneeady, Virasami, R., Randriamarolaza, L.Y.A., F. R. Faniriantsoa. F.R., Amelie, V.,
Seeward, H., and Montfraix, B. (2011). Observed trends in indices of daily and extreme
temperature and precipitation for the countries of the western Indian Ocean, 1961–2008.
Journal of Geophysical Research: Atmospheres (1984–2012), 116(D10).
34
Vitousek, P. M., D'Antonio, C. M., Loope, L. L., Rejmanek, M., & Westbrooks, R.
(1997). Introduced species: a significant component of human-caused global change. New
Zealand Journal of Ecology. 211, 1-16.
Waldron, A., Mooers, A.O., Miller, D.C., Nibbelink, N., Redding, D., Kuhn, T.S.,
Roberts, J.T., Gittleman, J.L. (2013) Targeting global conservation funding to limit
immediate biodiversity declines. Proceedings of the National Academy of Sciences
110(29), 12144-12148.
Watson, R. T., Noble, I. R., Bolin, B., Ravindranath, N. H., Verardo, D. J., & Dokken, D.
J. (2000). Land use, land-use change and forestry. A special report of the
Intergovernmental Panel on Climate Change (IPCC). Cambridge: Cambridge University.
Wildlife Conservation Society (2011) Socio-Economic Values of Corridor Forests in the
Albertine Rift Forests of the Murchison-Semliki Landscape. UNDP-GEF. Kampala,
Uganda.
Wilkie, M. L., Eckelmann, C. M., Laverdière, M., and Mathias, A. (2002). Forests and
forestry in Small Island Developing States. International Forestry Review, 4(4), 257-267.

35
2 VALUING VISITOR ACCESS TO FORESTED AREAS AND EXPLORING
WILLINGNESS TO PAY FOR FOREST CONSERVATION AND
RESTORATION
2.1 Introduction
Most SIDS countries are focused on economic and social development, such that
conservation needs remain largely unmet. The unreliability of international aid towards
conservation in the developing world means that the ability to leverage funds from
tourists and residents to improve biota, can ensure greater success for conservation
programs. This chapter explores individual willingness to pay for conservation of biota
in the Republic of Mauritius.
As highlighted in Section 1.6.4, several areas of the National Parks, some Mountain and
Nature Reserves and some privately owned forests in the country are favored as picnic
and hiking spots, nature-based tourism as well as for collection of wild fruits. Even if
state lands are for the most part free to members of the public, conservation and
maintenance of native forest lands are cost-intensive. For example, conservation costs
associated to setting up CMAs on state forest lands range from USD 10,000 (Dulloo et
al., 2002) to USD 13,000 per ha per year (UNDP-GEF, 2009, Florens et al., 2010);
adjusted to USD 16,064 and USD 20,883 respectively to reflect 2017 inflation and
exchange rates (Mauremootoo, 2017). In their traditional form, CMAs are fenced plots
of native forest land that are then weeded of invasive alien plant species. The base of the
fencing is often lined with piles of small rocks to deter feral pigs. However, fenced
CMAs have limits in their effectiveness. The requirements for fencing material, sturdy

36
wooden posts and heavy use of manual labor, limit CMAs to being located near truck-
accessible tracks, therefore incorporating areas of forests prone to edge effect. This
requirement also means that it is not always the most critical habitats that are enclosed,
but rather those fitting convenience and location. In many instances, the CMAs enclosed
deer and feral pigs (which they are supposed to keep out) whilst the fencing itself is not
impervious to rats, feral cats, disease-prone alien bird species (Florens, 2013), nor to
vandalism on public lands. Baider and Florens (2011) found that fencing was not
actually significant in deterring introduced animals. They showed that focusing on
improved weeding and contracting labor from local communities can not only reduce
initial restoration costs to USD 1,000- USD 3,000 per ha, but also drastically improve the
health of the ecosystem (Florens et al., 2010; Florens and Baider, 2013). These costs
were adjusted to fit 2017 inflation and exchange rates at USD 2,400 and USD 3,100
(Mauremootoo, 2017). As discussed in Section 1.6.4, diverting funds to active forest
restoration through removal of invasive alien plant species can result in significant
recovery for native species in terms of increased number of seedlings, increased
recolonization of forest gaps by native pioneer species with potential positive ripple
effects on the health of the ecosystem as a whole and for native animal and insect species
(Florens 2013). Mauremootoo (2017) highlights that CMA costs (excluding fencing) go
to paying salaries of laborers and supervisors; overhead costs associated to utilities and
administrative salaries; rental of storage facilities for pesticides; transport costs of fuel
and vehicle purchases; costs of tools and equipment used for weeding and data collection
and lastly, costs of consumables like masks, gloves and herbicides. Private owners of

37
forest land tend to lack technical and financial incentives to invest towards setting up
CMAs or other consistent conservation programs on their lands (Seewoobaduth, et al.,
2005). If cost-saving measures are employed, the area of restored forest can be
significantly increased. Alternatively, smaller amounts can be leveraged for effective
restoration work with lower financial risk. It may also be easier for private forest
landowners to divert smaller amounts of money to consistent conservation efforts, as
opposed to waiting for one-off donations.
Strategies like payments for ecosystem services, government land retirement,
conservation subsidy programs, conservation easements and tax incentives, in the
country, are still in infancy. Hence, for Mauritius, using entry fees as a source of revenue
for environmental conservation can act as a viable first-step towards improving services
and increasing the quality of the experience that is valued by visitors to natural areas.
With regards to local funding, the government spends some USD 6.5 million on the
NPCS, out of which an unspecified amount is allocated specifically to native forest
restoration (NBSAP, 2006). State-owned forest lands, except for specifically restricted
areas, are freely accessible to the general public. The demand from locals and tourists for
nature-based tourism is significant, but updated and regularly published data on the total
number of visitors per site per year is not available (Dr J. Mauremootoo, Personal
Communication, 25 April 2015). Private forest landowners have, over the last decade,
picked up upon the growing demand for nature-based tourism, opening their lands for
paid activities e.g. guided treks, zip-lining, and quad biking. However, much of the
money collected through these tourism ventures goes towards operational costs or as debt
38
payments for capital expenses. So far, no nature-based tourism operator has been able to
redirect profits towards conservation activities. This study used a stated preference
method to investigate whether nature tourism payments sourced from international and
national tourists on private and public sites can be used to accrue revenue that can be
used for forest conservation and restoration activities on the island. This study also
discusses visitors’ choices, socioeconomic determinants, and provides insights that can be
used to enhance tourists’ satisfaction and awareness as well as provides suggestion to
improve tourist programs. The results from this study can help guide decision makers
regarding improved natural resource and tourism management as well as increased
revenue for conservation and restoration efforts.
2.2 Methodology
2.2.1 Study approach
Our study builds upon prior studies and assesses how much money visitors to state and
private forest areas in Mauritius are willing to pay for forest conservation and restoration,
either in the form of entry fees to sites where no such fees exists, or as an incremental fee
to sites that already have preexisting entry fee. We are assuming that the willingness to
pay values we estimate, are entry fees (or extra amounts) paid by an adult aged 18 and
above, visiting an average forested area on mainland Mauritius.
2.2.2 Data collection
Respondents for this study were international and domestic visitors to forested areas in
mainland Mauritius and surveys were conducted at public and private sites, elucidated in
39
Figure 5. The state-owned sites selected were the Black River Gorges National Park, the
Bras d’Eau National Park, Vallee d’Osterlog Endemic Garden, Le Pouce Nature Reserve,
Ile Aux Aigrettes Islet Nature Reserve and Trou aux Cerfs. Privately owned sites
selected were La Vallee de Ferney Forest and Wildlife Reserve, Le Domaine de l’Etoile
and La Vallee des 23 Couleurs. Every fifth adult visitor at each site was approached for
survey. Surveys were administered on weekdays as well as weekends between 2nd May
and 23rd August 2015. Survey responses were higher during weekends than on
weekdays, following established trend of more weekend visitors than the ones who visit
on weekdays.

40
Figure 5: Approximate location of study sites at which CV surveys were conducted.
1 – La Vallee des 23 Couleurs; 2 – Upper Black River Gorges National Park; 3 – Lower
Black River Gorges National Park; 4 – Trou aux Cerfs; 5 – Le Pouce Nature Reserve; 6 –
41
Bras d’Eau National Park; 7 – Le Domaine de L’Etoile; 8 – La Vallee d’Osterlog; 9 – La
Vallee de Ferney; 10 – Ile aux Aigrettes
2.2.3 Survey design
Expert local reviewers, chosen because of their experience on the topic and of the
geographic area, and focus groups were conducted on the island to pre-test the survey
instrument (see Appendix I) and improve comprehensiveness and understandability.
Because most state-owned and state-managed sites are freely accessible, a fully open-
ended valuation could have resulted in very high or low WTP value. Using open-ended
questions, in focus groups, we elicited fees respondents were willing to pay, which
provided the range of values used to determine five fees (BID values) quoted in the final
survey. We adapted the payment card method following Mitchell and Carson (1981) for
this study. Entry fees charged at paid-for sites were compiled and broken into five BID
values ranging from the lowest to the highest. One entry BID price, was presented to
each respondent at state-owned as well as private sites. For sites already charging entry
fees, the willingness to pay for conservation was framed as a conservation levy over and
above the existing entry fee. Respondents at paid sites were offered the option of paying
10%, 25%, 50%, 75% or 100% extra, on top of the existing entry fee. The survey
reminded respondents to give a realistic estimate of the additional amount they are
willing to pay by taking into account their budget and maintaining their current spending
pattern, as opposed to reducing duration of stay, for instance, to make up for the higher
fee. The respondents were offered an opt-out option and were also provided the

42
opportunity to record their explanation. The payment values presented and recorded in
the survey were in Mauritian Rupee but converted to US dollars in this chapter at August
2015 (end of study) prevalent rate of 0.03478 (Bank of Mauritius, 2016).
The introductory script of the survey explained the context of the study and explained the
importance of better conserved and restored forests in terms of human health, freshwater
and environmental aesthetics. The ensuing questions assessed respondents’ existing
knowledge of, and attitudes to, biodiversity-related topics. The third section presented a
hypothetical scenario where visitors were explained that additional funds could support
better forest conservation and help in the removal of invasive species. This section then
enquired about their willingness to pay for better forest conservation to enhance provision
of ecosystem services and protect wildlife. Similar to the work by Randall, et al. (1974)
photographs (see Plates 1 to 6 in Appendix II) were used to give a visual aid to
respondents in understanding a scenario with more forest conservation, versus one with
low to none. Socio-economic background questions were asked in the last section of the
survey. Surveys were conducted in English, French and Mauritian Creole.
2.2.4 Theoretical specification
For dependent variable p, the following function was estimated
𝑝 = 𝑓(𝑋)
where X= X1, X2, …., Xn, represents the set of variables that can explain a respondent’s
WTP. A regression model of the form
p = β0 + β1X1 + β2X2 + β3X3 + βnXn +…+ ε

43
can also be used to assess the relative strengths of various independent variables in
influencing WTP bid values. In such a regression model, β0 is the regression constant or
y-intercept, whereas β1, β2… βn are the coefficients for each variable X1, X2,…Xn
respectively, and ε is a random error term. X1 to Xn represent variables like age, gender,
ethnicity, income range, education level, supervisory role, civil status, and number of
children, amongst others. The direction and strength of the vector for any one variable
expressed the significance of that variable at 95% and 99% confidence level was used to
explain differences in WTP values. All data were analyzed using SAS JMP® Pro v.11.
We used the stepwise regression modeling approach to define the final models. Stepwise
approach enables the optimal subset of variables to be picked up following an iterative
optimization process. In general, a stepwise regression calculates the squared t-statistic
for each variable, reporting it as a F-statistic. The statistical software measures if that
value is a high enough F statistic to keep the variable, or low-enough to reject a variable
from the model (Warner, 2008). We hypothesized that possible variables such as gender,
annual income, level of schooling completed, age group, marital status, number of
children, supervisory position in the workplace, number of hours spent at the site, mode
of transport (private car or otherwise), purpose of visit to site, whether respondent was
alone or accompanied and whether respondent was a domestic or international tourist
could influence WTP. The regression model identified number of children, age,
ethnicity, supervisory position and annual income as significant factors.

44
2.2.5 Revenue Requirements for Conservation and Restoration
The initial process of conservation and restoration in the country can be costly as it
includes a first phase of invasive species management, comprising of weeding, animal
trapping, tree guards, nursery set-up, tree planting, all taking place in the first year of a
project. Mauremootoo (2017) highlights that the frequency of maintenance weeding
decreases as the native vegetation gets re-established and associated costs can be annual
or less frequent depending on site-specific factors and weeding techniques used. The
NPCS’ weeding costs are reported at USD 5,000 (adjusted to 2017 prices) per hectare for
the first year of initial weeding, skimming down to USD 556 per hectare per year from
the fifth year, and USD 278 per hectare per year from the tenth year, for maintenance
weeding (Mauremootoo, 2017).In this study, we disregarded maintenance costs as it
could be met from government and other grants and support programs, and assumed the
funds that can be raised from visitor entry fees are used for initiating and expanding
acreage of restoration activities only. In reality, some areas may have already initiated
weeding activities and can use new funds earmarked for conservation towards
maintenance weeding or any other activities. We used the mean WTP values calculated
for domestic and international tourists, and the lowest and highest 95% confidence limits,
to determine firstly, how much could be raised by targeting increasing portions of the
visitor population; and secondly, how close state and private landowners can get to
achieving biodiversity conservation targets set by the government.

45
2.3 Results and Discussion
2.3.1 Regression Model
Based on the stepwise regression approach outlined earlier, we arrived at the final model
with variables outlined in Table 2 and the levels in which they were coded. The model
could explain about 43.23% of the variance, with the regression output summarized in
Table 3. The results suggested that on average, married people with at least one child,
aged 50 and above, who were not Sino-Mauritians and had low level supervisory roles,
would be willing to pay less than people in other demographic categories. Results also
suggest that, respondents with an annual income between USD 12,000 and USD 18,000
were more likely to have a higher WTP values.
Table 2: Descriptive summary of CV model variables and how they were coded for
data analysis
Variable Levels Type Code
Number of
children
None Ordinal 1
One child 2
2 children 3
More than 2 children 4
Age group 18 to 29 years old Ordinal 1
30 to 39 years old 2
40 to 49 years old 3
50 to 59 years old 4

46
Table 2: Descriptive summary of CV model variables and how they were coded for
data analysis
Variable Levels Type Code
60 years old and above 5
Supervisory
role
I do not supervise Nominal 1
I am the lead worker in my unit 2
I supervise a single unit employees 3
I supervise two or more units, each unit having
an individual supervisor
4
I supervise a major division of an agency or
department
5
I supervise an entire agency or department 6
I supervise more than one agency or
department
7
Ethnicity Franco-Mauritian Nominal 1
Indo-Mauritian 2
Sino-Mauritian 3
Creole 4
Asian 5
Caucasian 6
Marital Status Single Nominal 1
Married 2
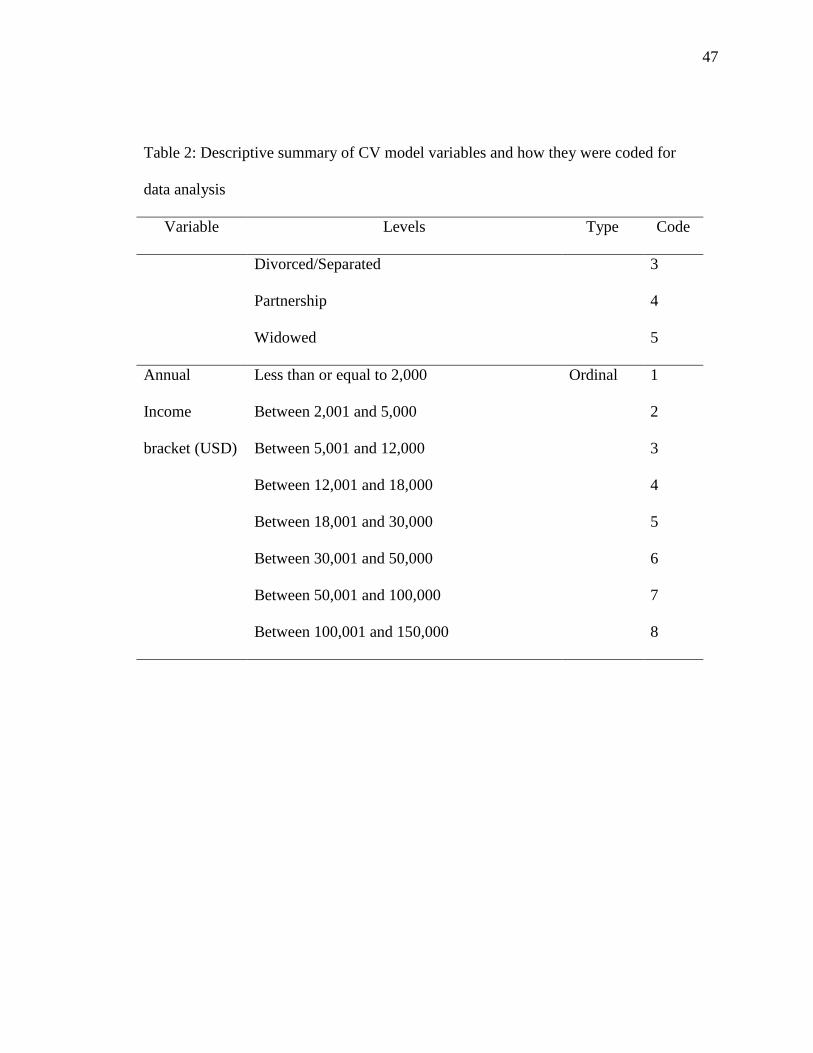
47
Table 2: Descriptive summary of CV model variables and how they were coded for
data analysis
Variable Levels Type Code
Divorced/Separated 3
Partnership 4
Widowed 5
Annual
Income
bracket (USD)
Less than or equal to 2,000 Ordinal 1
Between 2,001 and 5,000 2
Between 5,001 and 12,000 3
Between 12,001 and 18,000 4
Between 18,001 and 30,000 5
Between 30,001 and 50,000 6
Between 50,001 and 100,000 7
Between 100,001 and 150,000 8

48
Table 3. List of variables used to explain visitors’ WTP
Predictor Level Comparisons Estimate Prob > |t|
Intercept 9.261829 < 0.0001***
Number of Children 1,2 – 3,4 -1.97201 0.0004***
Age group 2,3 – 4,5 2.260647 < 0.0001***
2-3 -1.4139 0.0241**
Supervisory Role 1-4, 7 – 6,5 -3.54357 < 0.0001***
Ethnicity 1-6– 3 -2.2502 0.0006***
Marital Status 2 – 1 -1.34435 0.0074**
Annual Income bracket
USD 4 – 5 1.845616 0.0323**
Number of children 3-4 1.148093 0.1261
** and *** denote statistical significance at 99% and 95% confidence level
2.3.1 Respondents’ background
The survey was conducted on-site and in-person, and we ended up with 215 complete
survey responses from 6 out of the 9 study sites. 77% of the respondents were domestic
tourists of which 40% were between the ages of 18 and 29, while 62% of respondents
were male. The most represented ethnicity was Indo-Mauritians (people with Indian and
Pakistani ancestral lineages) at 44%, whilst the least represented were Franco-Mauritians
(locals with colonial French or British ancestral lineage) at 4% and Sino-Mauritians
(locals with Chinese ancestral lineage) at 5%. 35% of respondents had undergraduate or
graduate level education, but 46% reported not being in a supervisory position in their
workplace. 55% of respondents reported themselves as married and 56% of respondents
reported not having children. 14% of respondents reported an annual income bracket less
49
than USD 2,000 (lowest range), but only 6% of respondents had income between USD
50,001 and USD 150,000 (highest range). More distribution data is given in Appendix
III.
For comparison, population census data for 2015 gives 14.8% of the total population
aged 60 and above; 14.9% aged between 20 and 29; 15.2% aged between 30 and 39; 14%
aged between 40 and 49 and between 50 and 59 (Statistics Mauritius, 2016c). 50.5% of
the population were females (Statistics Mauritius, 2016c).
International tourists comprised 23% of the responses and came from countries like
France, India, Saudi Arabia, South Africa, Mozambique, Madagascar and Reunion
Island. The residence or point of origin for domestic respondents showed no distinctive
pattern across the territory.
Mean WTP values were calculated for visitors, and segregated by domestic and
international tourists at 0.95 confidence level. The mean predicted value of all
respondents per visit was USD 4.77 with a 95% confidence interval of [3.97-5.58], with
international tourists having higher willingness to pay mean predicted value of USD 7.73
[confidence interval 5.34-10.11], than domestic tourists with mean predicted value of
USD 3.74 [confidence interval 3.11-4.36].

50
A summary of the inferences drawn from the regression model is shown in Table 4
below.
Table 4: Trends in willingness to pay based on regression variables
Factor Likely to pay less Likely to pay more
Tourism Domestic visitors International visitors
No. of Children Parents of at least 1 child Parents of ≥ 2 children
Civil Status Married Single
Age
50 years and above 30 to 49
30 to 39 years 40 to 49
Job level
Any other job levels Mid-level supervisory roles
Highest supervisory roles Other job levels
Ethnicity All other ethnicities Sino-Mauritians

51
2.3.2 Gender
One way ANOVA was used to test for differences in the mean WTP values between male
and female respondents. Student’s t-test and connecting letters report showed no
significant difference across gender.
2.3.3 Tourism
International and domestic tourists showed significant difference [F(1,148) = 20.86, p <
0.0001] between their mean WTP values of USD 7.73 and USD 3.74 respectively.
Mwebaze et al. (2010) found that international tourists (n = 286) to Seychelles had a
mean WTP of €40-44 (USD 47.55-USD 52.30 at September 2017 exchange rate) on top
of their existing expenses to fund conservation for the Copsychus sechellarum
(Seychelles Magpie Robin) and sea turtles1. The WTP for international and national
tourists are in sync with expectations, as international visitors tend to value the
experience of the visit more than the national tourists, and is reflected in recent literature
(e.g., Lal et al., 2017) and differential pricing mechanism adopted by countries like
Rwanda charging higher fees from international visitors. Similar to our findings,
Tyrväinen et al. (2014) found that international tourists had higher WTP for forest
conservation management, than domestic tourists. Tyrväinen et al. (2014) attributed this
to tourists being more used to paying entry fees as well as having a higher purchasing
power than domestic visitors. The results suggest Mauritius has much to gain by
1 Mwebaze et al. (2010) do not give the turtles’ species name but there are two species known to nest in
Seychelles and receive significant legal protection – the Hawksbill turtle (Eretmochelys imbricata) and the
Green turtle (Chelonia mydas).
52
maximizing marketing of nature-based tourism to international markets, however,
managers should also investigate the ideal tourism carrying capacity of their sites.
We compared our findings with those published in the 2017-2020 Black River Gorges
Management Plan. This management plan, published by the NPCS, reports interviewing
184 visitors in 2014, of which 41.8% were Mauritians, 51.7% were foreigners. The
report refers a separate study report that should provide details of the survey
methodology (length of data collection period, whether data was collected at Upper or
Lower Black River Gorges or both entry points, whether the data was collected in peak or
off-peak tourist season, how the sample was randomized and how the WTP bid values
were estimated), but this report is not available online, and has not been made available
by the NPCS. The report also states 53.2% of Mauritians would not be willing to pay a
“small” entry fee, but 18.9% of international visitors would be willing to pay about USD
3.71 (December 2017 exchange rate 1 USD = MUR 33.70). There is no information on
how the “small” entry fee is defined monetarily, now how the means by which the WTP
of USD 3.71 was derived (open ended WTP question, bidding system, payment card
system or otherwise). They also report a 2016 survey of 117 international visitors
reporting that 26.5% were willing to pay a fee between USD 1.51 and USD 2.97 while
18% were willing to pay between USD 4.48 and USD 5.93. The depth of information on
this study’s methods, assumptions made, justifications and analysis is also lacking and
therefore hard to accurately compare.

53
2.3.4 Number of children, Marital Status
Results suggest statistically significant negative parameter estimate for “Number of
children” and show that people with one child or less tend to have lower WTP than
people with at least two children. Alvarez and Larkin (2010) found that park visitors
with children had a higher WTP than those with no children; results which the authors
associated with the value placed on natural resources for future generations. However,
parents with one child or less, may be weighing their WTP against their income and
family needs. The significant negative parameter estimate for marital status suggests that
married people tend to have a lower WTP value than single people, possibly associated to
weighing the costs of a family outing, as opposed to individual costs of visiting a site.
2.3.5 Age
Results suggest that visitors aged between 30 to 49 have a higher WTP value than visitors
aged 50 and above. Results also show that visitors’ aged 30 to 39, tend to have a lower
WTP value than those in 40-49 age group. In comparison, Alvarez and Larkin (2010)
found that people younger than 40 were likely to have higher WTP values and associated
this trend to greater pro-environment attitudes in younger age groups. They also found
that older visitors tend to have a lower WTP value, linked to skepticism about park
transparency in the use of funds. Currently, almost all public and private service
providers in the country provide discounts of up to 50% for senior citizens (aged 60 and
above). Our study results also reinforce the fact that maintaining such a policy on entry

54
fees to benefit visitors aged 60 and above to state and private forest sites has a positive
effect on WTP.
2.3.6 Supervisory role
The regression model indicated that people with mid-level supervisory positions
(supervising “a major division of an agency or department” or supervising “an entire
agency or department) tend to have higher WTP value than other supervisory categories.
Contrary to expectations, study results suggest that respondents in highest job positions
tend to have lower WTP vis a vis their counterparts. Lower WTP values for the
respondents who do not supervise others or are in low-level supervisory positions can be
attributed to their lower income status.
2.3.7 Ethnicity
Results show that all ethnic groups, except Sino-Mauritians, tend to have a lower WTP
value. Based on direct observation of visitor behavior, that differences in WTP values
between ethnicities could be explained by the social context of their visits to a site. The
distribution of “purpose of visit” by ethnicity highlighted that Sino-Mauritians favored
socialization by 64% compared to other ethnic groups, and this may explain their
willingness to pay more to keep having access and enjoying the site. 78% of Franco-
Mauritians surveyed were actively training for the 2015 Indian Ocean Island Games and
other marathons. Training gear and participation costs, as well as frequency of training,
could explain their lower WTP. 59% of Indo-Mauritians and 52% of Creoles favored
family and friend gatherings as a reason to visit a forested area, but outlines that they

55
intended to finish their trips at the beach rather than at the site itself, suggesting that their
total expenses might influence their WTP towards lower values.
Larson et al. (2014), in a study preferences of visitors (n = 1,073) to Georgia state parks
in the United States, found that visitors belonging to minority groups and who are low
income earners highly preferred “being active with family and friends” and preferred
participation in activities that involved their relatives and friends. Alvarez and Larkin
(2010) found that visitors’ interest to be part of a group could lead to a higher WTP for
restoration. They also outline that visitors that were part of bus tours could perceive
entry fees as unrecoverable costs associated to the package already paid for. Similar to
Larson et al. (2014) suggestions, managers of natural areas in Mauritius (state and
privately owned) can create lower entry fee packages for repeat visitors, or seasonal
passes to cater for differences in income ability and activity preferences. In high visitor
season, multiple trips may be detrimental to encouraging visitors, if they have to pay
entry fees or levies at all sites. Entry fees for large families or groups can be perceived
unfavorably. Weekly entry fees may also become a budgetary burden to regular trail
runners. An inflexible entry fee system may be appealing in administrative simplicity but
might result in unintentional tradeoffs in terms of lowering visitor numbers. The variety
of ways and means of applying an entry fee system to forested areas is given in Section
5.2.

56
2.3.8 Annual household income
Study results suggest that people with annual incomes between USD 12,000 and USD
18,000 are significantly more likely to have a positive WTP. Alvarez and Larkin (2010)
found that higher income earners are likely to spend more on nature-based tourism and
conservation. Our results suggest that the income impact was not statistically significant.
One explanation may be similar to the findings of Kamri (2013) who suggests that high
income earners may feel that they are already making their contribution to conservation
funding through their income tax.
2.3.9 Zero payment respondents
30% of respondents, in our study, were not willing to pay an entry fee or any extra
amount on existing entry fees. Of these, 85% were domestic tourists and 15% were
international tourists. Table 5 below shows the proportion of visitors who identified
reasons for their choice, from a given list. As shown by the list, the two main arguments
favored by visitors dealt with the perceived lack of transparency when it comes to
allocating funds to conservation, and the sense that Government should have a bigger
share of responsibility.

57
Table 5. Reasons provided by respondents who are not willing to pay for conservation in
the form of entry fees or a levy.
Answer options to question: “If you are not willing to pay
an entry fee, please tell us why.”
Domestic
tourists
International
tourists
I don’t believe that the funds will go to conservation of the
park.
35% 10%
The entry fee is already expensive for me. 8% -
I do not have the financial capability to invest in
conservation or pay any entry fee
15% 10%
I do not care for biodiversity issues 7% -
The government should pay. 48% 50%
Only big corporations should pay. 26% 20%
I do not think our forests and biodiversity are at risk. 2% -
The benefits are too distant/I don’t care for future
generations.
- -
I don’t have enough information about the threats to
forests and the conservation measures.
- -

58
Some respondents provided additional arguments for not wanting to pay an entry fee or
levy, arguing that these would discourage low-income visitors. They suggested having
donation boxes at the sites, rather than making additional fees/levy mandatory. Some of
the respondents suggested that forestlands are a public good and should therefore remain
free. Some others argued that conservation would come with investment in better
education and sensitization on respecting nature. Some respondents, particularly at
Government managed sites, said that the site offered poor facilities in terms of inadequate
bathrooms, intermittent water supply, absence of garbage collection and/or garbage bins,
absence of adequate security for visitors’ vehicles and property, and are not willing to
pay any amount. These findings are similar to the work of Lee et al. (2010) who showed
that enjoyment of natural areas increases with provision of facilities like tables, toilets,
parking space and educational signs. From a policy perspective, improving visitor
satisfaction, especially at state-managed sites, could generate greater acceptance of an
entry fee.
2.3.10 Revenue Analysis
Taking into account the upper and lower bounds of per hectare costs reported in
Mauremootoo (2017), the estimated per hectare costs of restoring different extent of
native forests are shown in Table 6 below. The areas represented are estimates and based
off of data from the NBSAP (2006), the Protected Area Network project (UNDP-GEF,
2009), Paupiah (2001) and the Aichi Biodiversity Targets of the Convention on
Biological Diversity (CBD) (Secretariat of the CBD, 2010). A decrease in costs
significantly alters the total amount that would need to be raised for each of the coverage

59
targets shown. For example, restoring the full extent of mountain and river reserves,
without fencing, would require between USD 16 million and USD 33 million,
disregarding the time factor. The estimates shown in Table 6 may include marginal
lands, heavily degraded forest lands and coastal forests.
Table 6. Estimated costs in million USD (rounded to nearest whole number) for
restoration, segregated by documented targets and coverage.
Target for
restoration
Area in
hectares
(ha)
Total projected costs based on
Government reports
Total projected costs
based on Florens et
al (2010) and
Florens and Baider
(2013)
Fencing + Weeding Weeding
only Weeding
USD
16,064 per
ha (lower
bound)
USD
20,883 per
ha (upper
bound)
USD 5000
per ha
USD
2,400 per
ha (lower
bound)
USD
3,100
per ha
(upper
bound)
NBSAP (2006)
target 1,000 16 21 5 2 3
Protected Area 14,920 240 312 75 36 46
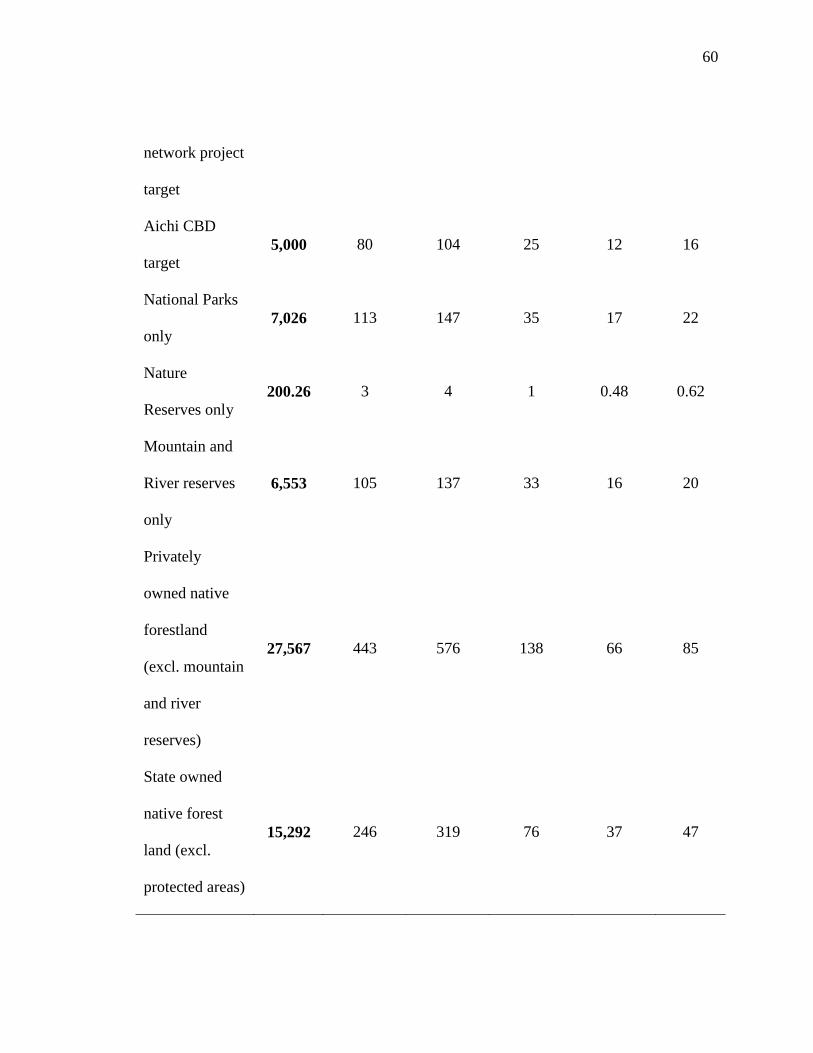
60
network project
target
Aichi CBD
target 5,000 80 104 25 12 16
National Parks
only 7,026 113 147 35 17 22
Nature
Reserves only 200.26 3 4 1 0.48 0.62
Mountain and
River reserves
only
6,553 105 137 33 16 20
Privately
owned native
forestland
(excl. mountain
and river
reserves)
27,567 443 576 138 66 85
State owned
native forest
land (excl.
protected areas)
15,292 246 319 76 37 47
61
The dearth of visitor number data makes it difficult to estimate funds that could be raised
at individual sites. We therefore calculated the revenue potential of targeting 10%, 25%,
50%, 75% and 100% of total adult (aged 20 and above) domestic population and
international tourists using 2015 census data. The population breakdown by age group is
given in Table 7. To estimate conservation finance (in USD) that can be raised at any
one site, we used mean WTP values and lowest and highest CI values, multiplied by
targeted sections of residents and tourists aged 20 and above. The estimated revenues are
shown in Table 8. We assumed a visitor only went to a single site per year. In practice, a
visitor might go to multiple sites on both state and privately owned lands in a period of a
year or visit the same site multiple times. We anticipate that funds collected at state-
owned sites will be centralized by the lead state agencies prior to future disbursement,
whilst privately owned sites have greater flexibility of using funds they individually raise.

62
Table 7. Distribution of resident population and tourist arrivals to Mauritius by age
group. Data compiled from Statistics Mauritius 2014, 2016b and 2016c.
Age group
2015 estimated resident
population based on 2011 census
data
2015 tourist arrivals
0-19 345,105 178,473
20-29 188,048 195,478
30-39 191,651 225,811
40-49 175,576 206,126
50-59 175,814 185,496
60 and above 186,411 159,868
Total population 1,262,605 1,151,723
Total aged 20 and above 917,500 972,779

63
Table 8. Estimated revenues (in million USD) that can be raised for conservation using
mean WTP values and lowest and highest CI values.
Target
percentage of
people aged
20 and above
Using
lowest
CI value
of 3.11
USD
Using all
visitors'
mean of
4.77
USD
Using
domestic
mean of
3.74 USD
Using
internatio
nal mean
of 7.73
USD
Using
upper CI
of 10.11
USD
Domestic
tourists
10% 0.29 0.44 0.34
0.93
25% 0.71 1.09 0.86 2.32
50% 1.43 2.19 1.72 4.64
75% 2.14 3.28 2.57 6.96
100% 2.85 4.38 3.43 9.28
International
tourists
10% 0.30 0.46
1.92 0.98
25% 0.76 1.16 4.81 2.46
50% 1.51 2.32 9.61 4.92
75% 2.27 3.48 14.42 7.38
100% 3.03 4.64 19.22 9.83

64
Estimates suggest that if a minimum of 10% of the resident adult population each paid
USD 3.11 towards conservation, this could bring USD 290,000 in a year to a site for
forest restoration. Assuming costs of USD 3,100 per hectare, 93.5 hectares could be
cleared of invasive species in a year at any one site. If 10% of residents and 10% of all
tourist arrivals visited any one site and paid the mean WTPs of USD 3.74 and USD 7.73
respectively, at least 729 hectares could be cleared in a year at costs of USD 3,100 per
hectare. If state agencies use state-reported restoration costs of USD 20,883 per hectare,
with 10% of residents and 10% of all tourist arrivals paying the mean WTP of USD 4.77,
this could result in about 43 hectares restored and fenced per year. Even our most
conservative estimates suggest that there is significant ecological and economic gain to
be made by using entry fees as a means to raise revenue for forest conservation on the
island. On a yearly basis, entry fees can result in more consistent restoration programs
being funded and carried out.
Our studies contrast with the 2017-2020 Black River Gorges Management Plan which
reports that the park can generate about USD 949.44 (December 2017 exchange rate of 1
USD = MUR 33.70) every day using visitor counts for the month of June 2016 and by
charging only international visitors an entry fee of USD 2.97 per person. As explained
earlier, the management plan does not provide details of the surveys nor the methodology
used to establish the bid values. Nonetheless, our lower CI for the international visitors’
WTP value exceeds the WTP reported in the management plan by USD 2.37, suggesting
that state agencies may be foregoing on a much larger revenue stream from international
65
visitors, and therefore compromising the extent of restoration that can be successfully and
sustainably financed.
Mwebaze et al. (2010) report costs between USD 3,100 and USD 50,220 for invasive
species management planning; between USD 10,300 and USD 50,220 for eradication,
and long terms monitoring costs between USD 15,000 and USD 40,000 per year. In the
case of Seychelles invasive species eradication and management considered insect and
animal invasive species, as well as prevention measures like border inspections. Insect
and pest control in Mauritius is limited to agricultural pests and reporting on costs is not
within the purview of the NPCS and FS, such that the restoration costs we report pertain
principally to weeding of long-established alien plant species from forest lands.
To conclude, our findings indicate that there exists a positive WTP from both
international and domestic tourists. We also validated the current practice of charging
differential entry fees for domestic and international visitors and showed that privately-
owned sites can potentially increase their entry fees, on the principle that the extra
amount will be directed to forest conservation and restoration. Costs of invasive species
removal increase with plot size. Forested sites vary in their land extent and
geomorphology, making it difficult to predict how long private and public forestland
managers may take to fully complete restoration. The slope of the land, the degree of risk
perceived by laborers, contractor rates, and market inflation rates also influence costs.
Nonetheless, entry fees offer a viable mechanism of building a sustainable revenue
stream for forest conservation.

66
References
Alvarez, S., & Larkin, S. L. (2010). Valuing ecological restoration and recreational
benefits in a mountain protected area: The case of Los Nevados national park, Colombia.
Journal of Sustainable Development. 34, 3-15.
Baider, C., & Florens, F. B. V. (2011). Control of invasive alien weeds averts imminent
plant extinction. Biological Invasions, 1312, 2641-2646.
Bank of Mauritius (2016) Consolidated Indicative Exchange Rates of Commercial Banks.
from 1 August 2015 to 31 August 2015. Available from
<https://www.bom.mu/?id=ExchangeRates>
Florens, F. B. (2013). Conservation in Mauritius and Rodrigues: challenges and
achievements from two ecologically devastated oceanic islands. Conservation Biology:
Voices from the tropics, 40-50.
Florens, F. B., & Baider, C. (2013). Ecological restoration in a developing island nation:
how useful is the science?. Restoration Ecology. 211, 1-5.
Florens, F. V., Baider, C., Martin, G. M., & Strasberg, D. (2012). Surviving 370 years of
human impact: what remains of tree diversity and structure of the lowland wet forests of
oceanic island Mauritius? Biodiversity Conservation. 218, 2139-2167.
Florens, F. V., Mauremootoo, J. R., Fowler, S. V., Winder, L., & Baider, C. (2010).
Recovery of indigenous butterfly community following control of invasive alien plants in
a tropical island’s wet forests. Biodiversity Conservation. 1914, 3835-3848.

67
Kamri, T. (2013) Willingness to pay for conservation of natural resources in the Gunung
Gading National Park, Sarawak. Procedia Social and Behavioral Sciences. 101, 506-515.
Lal, P., Wolde, B., Masozera, M., Burli, P., Alavalapati, J., Ranjan, A., Montambault, J.,
Banerjee, O., Ochuodho, T. & Mugabo, R. (2017). Valuing visitor services and access to
protected areas: The case of Nyungwe National Park in Rwanda. Tourism Management.
61, 141-151.
Larson, L., Whiting, J. W., Green, G. T., & Bowker, J. M. (2014). Physical activity levels
and preferences of ethnically diverse visitors to Georgia state parks. Journal of Leisure
Research. 465, 540.
Lee, C.F., H.I. Huang, and H.R. Yeh. (2010). Developing and evaluation model for
destination attractiveness: sustainable forest recreation tourism in Taiwan. Journal of
Sustainable Tourism.18, 811–828.
Mauremootoo, J.R. (2017) Good Practice Guide to Native Vegetation Restoration in
Mauritius. Ministry of Agro Industry and Food Security, Port Louis, Mauritius.
Unpublished.
Mwebaze, P., MacLeod, A., Tomlinson, D., Barois, H., & Rijpma, J. (2010). Economic
valuation of the influence of invasive alien species on the economy of the Seychelles
islands. Ecological Economics. 6912, 2614-2623.
NBSAP (2006). National biodiversity strategic action plan 2006 – 2015. Réduit,
Mauritius. 136 pp.

68
Paupiah, H. (2001). Forestry Outlook Studies in Africa: Mauritius: Ministry of Natural
Resources and Tourism. Available from
<ftp://ftp.fao.org/docrep/fao/004/AB586E/AB586E00.pdf>
Secretariat of the Convention on Biological Diversity. (2010) The Strategic Plan for
Biodiversity 2011-2020 and the Aichi Biodiversity Targets. Document
UNEP/CBD/COP/DEC/X/2. Secretariat of the Convention on Biological Diversity,
Nagoya, Japan.
Seewoobaduth, J., Naga, K. D., Allas, J., Florens, F.B.V., Goolaup, P., Paupiah, S. A., &
Rughooputh, S. D. D. V. (2005) National Capacity Needs Self-Assessment for Global
Environmental Management-Republic of Mauritius. Policy. 37, 5-2.
Statistics Mauritius (2014) Digest of Demographic Statistics 2013. Ministry of Finance
and Economic Development. Vol.29. Port Louis, Republic of Mauritius.
Statistics Mauritius (2016b) International travel and tourism 2015. Ministry of Finance
and Economic Development. Republic of Mauritius. Available from
<http://statsmauritius.govmu.org/English/Publications/Documents/EI1214/ESITourismJa
n-Sep2015.pdf>
Statistics Mauritius (2016c) Population and Vital Statistics 2015. Ministry of Finance
and Economic Development. Republic of Mauritius. Available from
<http://statsmauritius.govmu.org/English/Publications/Documents/EI1230/Pop_Vital_Sta
ts_Year15.doc>

69
Tyrväinen, L., Mäntymaa, E., & Ovaskainen, V. (2014). Demand for enhanced forest
amenities in private lands: The case of the Ruka-Kuusamo tourism area, Finland. Forest
Policy and Economics. 47, 4-13.
UNDP-GEF (2009) Expanding coverage and strengthening management effectiveness of
the protected area network on the island of Mauritius. UNDP Project document. PIMS
1749, GEF Project ID 3526. Unpublished report.
Warner, R. M. 2008. Applied statistics: From bivariate through multivariate techniques.
Sage.
70
3 RECREATION DEMAND AND ECONOMIC VALUE OF NATIVE FOREST
LANDS
3.1 Introduction
Combining shifts in economic trends and the growing need to preserve and protect
declining natural resources, tourism has become a go-to conservation strategy to generate
revenue and awareness (Wunder, 1999). Many small island states have been able to turn
their insularity, tropical climate, culture, exoticism, unique flora and fauna into viable
assets for the tourism sector (Wortman et al., 2016). Pressures and demands from
tourists generally drive local companies towards innovative and competitive tourist
services (Van den Bulcke et al., 2009). Growth of nature-based tourism as a product for
international markets is often paralleled by the interest of residents to become domestic
tourists themselves and explore the same products and services offered to international
visitors. At the same time, conservation of forest land has been spurred given the
economic potential of this industry (Balmford et al., 2009). Canavan’s (2013) study
showed that residents of the Isle of Man favored internal tourism to break-away from
routine, entertain friends and family and explore new places. Outdoor recreation and
nature-based tourism can be quantified using economic methods.
Mauritius has not escaped the global nature tourism industry. Various sites across the
island offer opportunities for scenic non-commercial outdoor recreation like jogging as
well as commercial activities like guided hikes, quad biking and mountain climbing.
Sites that offer a variety of such activities are on both state and privately owned forest
lands. In 2009, a project funded by the United Nations Development Program-Global
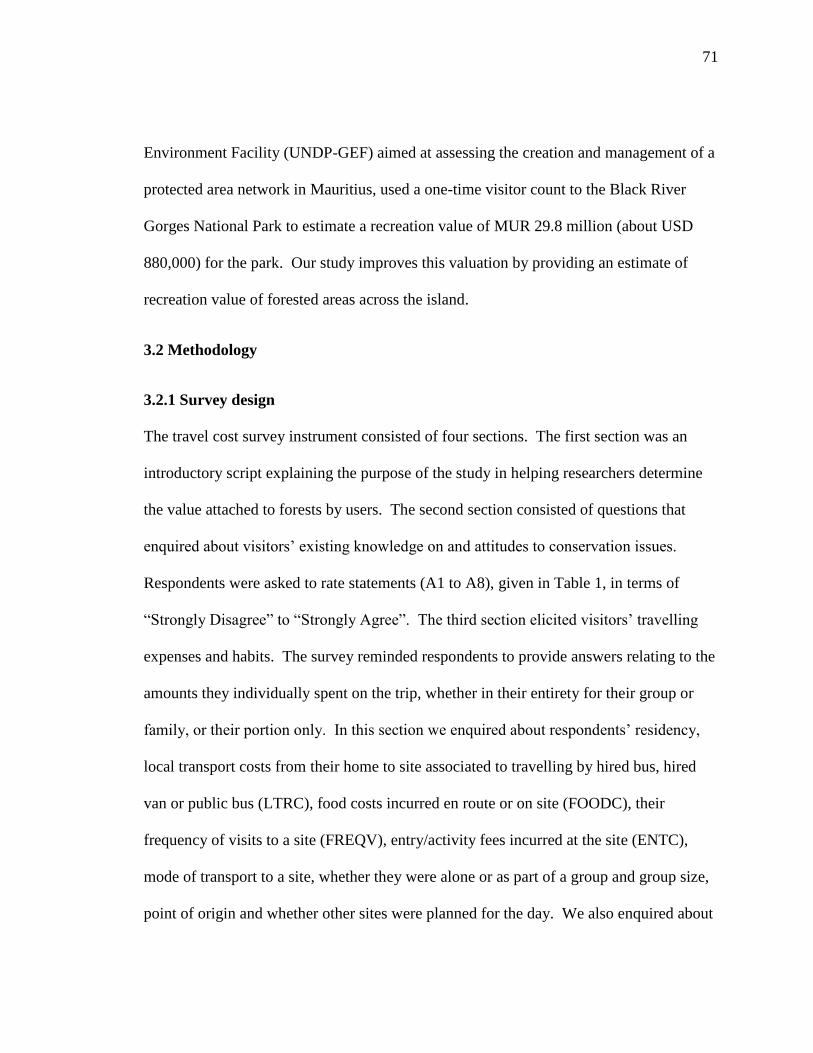
71
Environment Facility (UNDP-GEF) aimed at assessing the creation and management of a
protected area network in Mauritius, used a one-time visitor count to the Black River
Gorges National Park to estimate a recreation value of MUR 29.8 million (about USD
880,000) for the park. Our study improves this valuation by providing an estimate of
recreation value of forested areas across the island.
3.2 Methodology
3.2.1 Survey design
The travel cost survey instrument consisted of four sections. The first section was an
introductory script explaining the purpose of the study in helping researchers determine
the value attached to forests by users. The second section consisted of questions that
enquired about visitors’ existing knowledge on and attitudes to conservation issues.
Respondents were asked to rate statements (A1 to A8), given in Table 1, in terms of
“Strongly Disagree” to “Strongly Agree”. The third section elicited visitors’ travelling
expenses and habits. The survey reminded respondents to provide answers relating to the
amounts they individually spent on the trip, whether in their entirety for their group or
family, or their portion only. In this section we enquired about respondents’ residency,
local transport costs from their home to site associated to travelling by hired bus, hired
van or public bus (LTRC), food costs incurred en route or on site (FOODC), their
frequency of visits to a site (FREQV), entry/activity fees incurred at the site (ENTC),
mode of transport to a site, whether they were alone or as part of a group and group size,
point of origin and whether other sites were planned for the day. We also enquired about

72
the main purpose (P1 to P4) of respondents’ visit to a site. The last section of the survey
enquired about respondents’ socio-demographic background, with the different levels
shown in Table 9. The survey instrument was pre-tested and refined in
comprehensiveness by local experts in nature-based tourism and forest management. The
survey was administered in English, French and Mauritian Creole.
Table 9: Description of attitude and socio-demographic variables from the TCM survey.
Variable Type Partition
Age Group Ordinal
1: 18-29 1: {1,2}
2: 30-39
3: 40-49
4: 50-59
5: Above 60
Gender Nominal 1: Male 2: Female -
Ethnicity Nominal
1: Franco-Mauritian
-
2: Indo-Mauritian
3: Sino-Mauritian
4: Asian-born resident
5: Overseas-born Caucasian resident
6: Creole
Marital status Nominal
1: Single
-
2: Married

73
3: Divorced/Separated
4: Partnership
5: Widowed
Highest level of
schooling
completed.
Nominal
1: Certificate of Primary Education 1: {1,2}
2: School Certificate 2: {3,4,5}
3: Higher School Certificate /Baccalaureate
4: Trade/technical/vocational diploma
5: Bachelor’s degree
6: Masters degree
7: Doctoral degree
Supervisory role Ordinal
1: I do not supervise 1: {1,2,3}
2: I am the lead worker in my unit 2: {4,5,6}
3: I supervise a single unit of employees
4: I supervise two or more units, each unit
having an individual supervisor
5: I supervise a major division of an agency
or department
6: I supervise an entire agency or department
7: I supervise more than one agency or
department
Number of
Children
Nominal
1: None 2: 1
-
3: 2 4: More than 2

74
Annual Income
Bracket (USD)
Ordinal
1: Less than or equal to 2000 1: {1,2}
2: 2001 to 5000 2: {3,4,5
3: 5001 to 12000 ,6,7,8}
4: 12001 to 18000
5: 18001 to 30000
6: 30001 to 50000
7: 50001 to
100000
8: 100000 to 150000
A1: Forests in
Mauritius are
well protected
Ordinal
1 : SD 2: D 3: N 1: {1}
4: A 5: SA
2:
{2,3,4,5}
A2: Native
species are at
risk of
extinction
Ordinal
1 : SD 2: D 3: N
1:
{1,2,3,4}
4: A 5: SA 2: {5}
A3: Only
professionals
should decide
how the park
should be
managed.
Ordinal
1 : SD 2: D 3: N
1:
{1,2,3,4}
4: A 5: SA 2: {5}
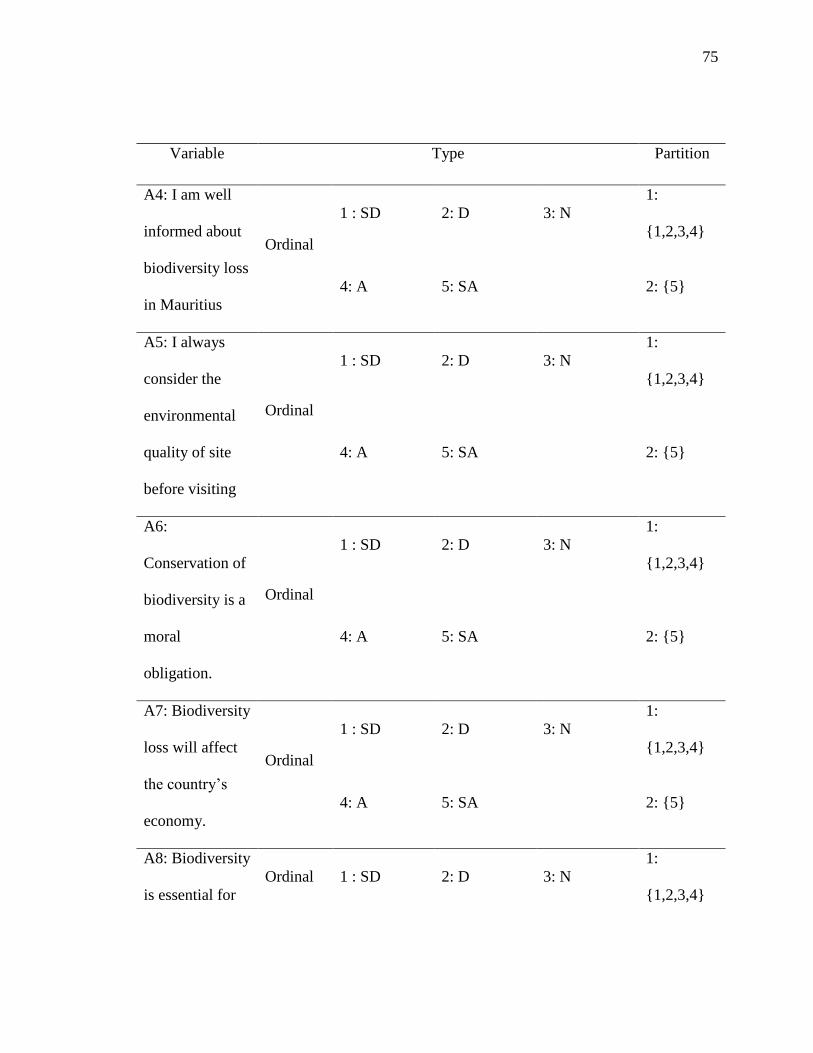
75
Variable Type Partition
A4: I am well
informed about
biodiversity loss
in Mauritius
Ordinal
1 : SD 2: D 3: N
1:
{1,2,3,4}
4: A 5: SA 2: {5}
A5: I always
consider the
environmental
quality of site
before visiting
Ordinal
1 : SD 2: D 3: N
1:
{1,2,3,4}
4: A 5: SA 2: {5}
A6:
Conservation of
biodiversity is a
moral
obligation.
Ordinal
1 : SD 2: D 3: N
1:
{1,2,3,4}
4: A 5: SA 2: {5}
A7: Biodiversity
loss will affect
the country’s
economy.
Ordinal
1 : SD 2: D 3: N
1:
{1,2,3,4}
4: A 5: SA 2: {5}
A8: Biodiversity
is essential for
Ordinal 1 : SD 2: D 3: N
1:
{1,2,3,4}

76
production of
goods and
medicine.
4: A 5: SA 2: {5}
P1: Sports and
Fitness
Nominal 1: No 2: Yes
P2: Enjoy
nature and
outdoors
Nominal 1: No 2: Yes
P3: Socialize
with friends and
family
Nominal 1: No 2: Yes
P4: Reduce
stress
Nominal 1: No 2: Yes
Notes: SD ‘Strongly Disagree’, D ‘Disagree’, N ‘Neutral’, A ‘Agree’, SA ‘Strongly
Agree’.

77
3.2.2 Data Collection
We surveyed every fifth domestic visitor to forested sites across mainland Mauritius.
State owned and state managed forested sites surveyed were Upper Black River Gorges
National Park (Pétrin – Site 2 in Fig.6), Lower Black River Gorges National Park (Black
River – Site 3), Bras d’Eau National Park (Site 6) and Le Pouce Nature Reserve (Site 5).
No entry or activity fees are charged by the state at these sites. We also surveyed visitors
to Trou aux Cerfs (Site 4), a publicly-accessible dormant volcano with well-preserved
vegetation, surrounded by urbanization and popular with joggers and scenic viewers.
Privately owned and managed forested sites we surveyed were La Vallée des 23 Couleurs
(Site 1), La Vallée de Ferney Forest and Wildlife Reserve (Site 8) and Le Domaine de
L’Etoile (Site 7), all of which offer various paid outdoor recreation activities. Lastly, we
surveyed visitors to Ile aux Aigrettes (Site 9), a fully-restored islet managed by the non-
profit Mauritius Wildlife Foundation and which offers paid nature-tourism tours.
Surveys were conducted between 2nd May and 23rd August 2015 with the majority of
responses recorded during weekends because of the higher number of weekend visitors.
Given our objective was to assess the overall value of accessing forested areas across
Mauritius, our study considered the island as a ‘single-site’, combining survey-based data
from nine sites.

78
Figure 6: Illustrative map of Mauritius showing approximate locations of sites where
TCM surveys were conducted.

79
3.2.3 Theoretical Specification
In assessing the demand for recreation, maximum utility becomes a function of costs
involved (i.e. travel costs (tc)), number of visits (v) to a recreation site and its
environmental quality (a), as shown below:
max u (tc, v, a)
In TCM, trip frequency is treated as a function of costs incurred and individual
characteristics of the park user, as shown in the equation below;
𝑉𝑖 = 𝑓 (𝑇𝐶𝑖 , 𝑍𝑖, 𝐴𝑖, ℰ)
where Vi is the frequency of visits to a park by user i, TCi is the total travel cost incurred
by user i, Zi is the set of socio-demographic characteristics that define user i, Ai is the set
of attitudes of user i to environmental topics and ε is the independent, randomly
distributed error term for unobserved factors. From a utility perspective, the maximum
benefit for a visitor can be capped by a maximum travel cost, beyond which visit
frequency declines. With count data like visit frequency, the typical approach is to use a
Poisson distribution with equal mean and variance to represent the probability of user i
taking V trips, as shown below.
𝑃 (𝑉𝑖) = 𝑒−𝜆. 𝜆𝑉
𝑉!
where λ is the mean and variance of the expected number of trips and follows the demand
function:
𝜆 = 𝑒𝛽(𝑇𝐶+𝑍+𝐴)

80
ln(𝜆) = 𝛽𝑇𝐶𝑖 + 𝛽𝑍𝑖 + 𝛽𝐴𝑖
The Poisson model relies on equal mean and variance of V. In many cases of visit
frequency data however, there can exist more observed variance than expected, resulting
in over-dispersion. This can be adjusted for by using a negative binomial regression
where the variance is a function of the mean and the regression output includes a
dispersion parameter (Greene, 2008). The probability of an observed visitor frequency vi
can be given by:
𝑃 (𝑉 = 𝑣𝑖|𝜇𝑖, 𝛼) = Γ (𝑣𝑖 + 𝛼−1)
Γ(𝛼−1)Γ(𝑣𝑖 + 1) (
1
1 + 𝛼𝜇𝑖)
𝛼−1
(𝛼𝜇𝑖
1 + 𝛼𝜇𝑖)
𝑣𝑖
where Г represents the gamma function. The negative binomial regression will have
mean λ and variance λ(1 + αλ) and the parameter estimates can be derived using
maximum likelihood (Greene, 2008).
3.2.4 Analysis
Similar to Benson et al. (2013), our study targeted visitors directly at forested sites on the
island, such that those whom were not there on survey dates, would have a default trip
frequency of zero. We adapted the method of Bartczak et al. (2012) by asking
respondents to report the frequency of their visits to the park over a typical year
(FREQV) in terms of “Once a year”, “Once a month”, “Several times a week” (taken as 3
times a week), “Once a week” or “Once a day”. These categorical variables were
converted to discrete values “1”, “12”, “156”, “52” and “365” respectively.

81
The travel costs for each respondent comprised of how much they spent on
transportation, fuel, food, entry fees (if applicable) and the opportunity cost of their travel
and leisure time. All money amounts were in Mauritian Rupee but converted to US
dollars in this chapter at August 2015 (end of study) prevalent rate of 0.03478 (Bank of
Mauritius, 2016).
Potential opportunity costs associated to the time (TIMEC) visitors took to travel to the
site (TRTMC), and the time they spent at the site (STTMC) was calculated as follows:
TIMECi = TRTMCi (Wage rate USD/hr) + STTMCi (Wage rate USD/hr)
The average wage rate for Mauritius was obtained from the International Labor
Organization’s ILOSTAT database and given at MUR 568/month (USD 3.28/hour). For
the purposes of this study, we assumed adult visitors are all employed full time, working
40 hours a week, 52 weeks a year. Cesario (1976) used evidence from transportation
research to warrant the use of one-third of the wage rate in recreation demand valuation.
The main argument for using a third of the wage rate is the lower perception of value
attached to leisure time, compared to working time. On the other hand, using the full
wage rate provides a more accurate valuation of the opportunity cost of the time.
Adapting the method of Benson et al. (2013), we used the full wage rate and a third of the
wage rate to assess the sensitivity of the travel cost analysis.
Respondents were asked their mode of travel to the site, their point of origin and any
other sites included in their trip. We used Google MapsTM road mapping to establish
two-way distance covered by respondents (DIST). Domestic visitors travelled using

82
either their private cars, public bus or by booking a multi-passenger transport if they were
travelling as part of a large group. We assumed that the transport costs paid to book a
multi-passenger van or bus for group visits, included the costs of fuel. We used the 2014
fuel economy rate of 5.8L/100km reported for Mauritius by the Global Fuel Economy
Initiative (2016) and the gasoline retail price of MUR 45.95 (USD 1.60) per liter reported
for August 2015 by the Mauritian Petroleum Pricing Committee (State Trading
Corporation, 2014), to estimate the cost of fuel (FUELC) incurred by visitors using
private cars, using the following formula.
FUELC = DIST km x 0.058 L/km x 1.60 USD/L
All statistical analyses were performed using SAS JMP® Pro v.13.2 software. We used
the partitioning function to split attitude, purpose and some socio-demographic
observations (see Table 9) into similar groupings, which were then assigned dummy
categorical variables. This allowed for a more robust regression analysis by taking into
account thresholds of observations, as opposed to multiple levels.
With all variables accounted for, we defined two TTRCs as follows:
TTRCFW = LTRCi + FOODCi + FUELCi + TIMECi + ENTCi , using the full wage rate.
TTRCW/3 = LTRCi + FOODCi + FUELCi + TIMECi + ENTCi , using a third of the wage
rate.
We used the mixed stepwise approach to come up with a robust subset of variables to be
picked up by the regression models, following an iterative optimization process. This

83
iterative process computes the squared t-statistic for each variable, giving it as a F-
statistic. A variable with high enough F statistic is kept whilst a low-enough one gets
rejected from the model (Warner, 2008). The mixed stepwise regression is preferred for
its flexibility; as variables get added to the model, any variable that has a p-value above
the probability-to-leave threshold, is automatically removed.
With the set of variables identified by the stepwise method, Poisson and negative
binomial regressions were used to model FREQV. The Poisson output gave the deviance
statistic, which when divided by the degrees of freedom, gave an over-dispersion
parameter of 84 and 203 for models with TTRCFW and TTRCW/3 respectively. The
Poisson models using TTRCFW and TTRCW/3 both had highly significant p-values for the
goodness of fit statistic, thereby rejecting the null hypothesis that the model is a good fit.
The negative binomial model was therefore favored and reported upon.
3.2.5 Consumer Surplus and Recreation Value
We used the same method as Alvarez and Larkin (2010) to estimate the residents’
consumer surplus for forested areas in Mauritius.
𝐶𝑆 = ∫ (𝛽0 + 𝛽1𝑇𝑇𝑅𝐶) 𝑑𝑇𝑇𝑅𝐶𝑇𝑇𝑅𝐶𝑚𝑎𝑥
𝑇𝑇𝑅𝐶𝜇
where CS is the consumer surplus, β0 is the intercept of the demand function, β1 is the
estimate for the TTRC and TTRCμ is the mean TTRC. Our study solved for two travel
cost means (Table 10), two intercepts and two coefficients (Table 11), therefore
generating two consumer surplus estimates. Given the absence of annual visitor counts

84
from the sites included in this study, we estimated the recreational value of forested areas
by multiplying our CS estimates with target percentages of the Mauritian adult population
(as per census data, aged 20 and above) of 917,500 (Statistics Mauritius, 2016).
3.3 Results and Discussion
3.3.1 Respondents’ background
Our data collection resulted in 188 complete responses across nine study sites. 21% of
respondents were aged between 18 and 29 (Statistics Mauritius (2016) has 15% of the
population in that age group); 31% of respondents were aged 30 to 39 years (15% of the
population); 20% aged 40 to 49 (14% of population); 17% aged 50 to 59 and 12% aged
60 and above (14% and 15% of the population respectively). 62% of respondents were
male (Statistics Mauritius (2016) has 50% of population as males). 48% were of Indo-
Mauritian ethnicity (i.e. born with Indian/Pakistani ancestral lineage). 67% were married
and 54% reported being parents to maximum one child. 32% reported having studied up
to higher education and 51% reported not being in any supervisory position. 39%
reported earning between USD 2000 and USD 5000 per year. 21% were visiting as a
couple, 51% as a group of family and/or friends and 26% were visiting by themselves.
On average, our findings suggest residents visit forested-areas across the island 39 times
a year, with a 95% confidence interval [29-49 days]. Additional distribution data is given
in Appendix V.

85
3.3.2 Travel Cost
Our computation of time costs used the time respondents reported they took to travel
from their home to the site, similar to approach followed by Czajkowski et al. (2015).
They argued that this approach caters for differences in respondents’ preferences for
alternate routes, or any stops on the way e.g. to pick up friends and family, or buy food.
Only 20% of respondents reported ending their trips at a beach or picnic area on their
way back home. Given the forest site had priority in respondents’ plans, we did not
consider side trips to the beach or other rest areas as significantly impacting respondents’
main purpose for visiting a forested site. Table 10 gives an overview of the summary
statistics for the total travel costs.
Table 10: Summary statistics for total travel costs, fuel costs and round-trip distance
covered.
Mean
Standard
Dev
Lower CI Upper CI
Max
TTRCFW 31.20543 58.40621 22.80216 39.60869 526.3138
TTRCW/3 22.7989 57.45609 14.53234 31.06547 519.7599
FUELC 4.383547 3.24014 3.836111 4.930983
DIST/km 46.40957 33.47799 41.59289 51.22626

86
3.3.3 Model Output
The model accepted the null hypothesis that the model is a good fit based on p-value.
The regression output is given in Table 10.
Table 11. Variables that can predict the frequency of visits to forested areas, using
TTRCFW and TTRCW/3.
with TTRCFW with TTRCW/3
Term Estimate Std. Error p-value Estimate Std. Error p-value
Intercept 5.751711 0.587466 <.0001*** 5.682741 0.584514 <.0001***
TTRC -0.00981 0.004068 0.0159* -0.01043 0.004309 0.0155*
Gender [1-
2]
1.157588 0.346686 0.0008** 1.168809 0.343755 0.0007**
Ethnicity{
2,3,5,6-
1,4}
-0.27332 0.241988 0.2587 -0.27383 0.24131 0.2565
Marital
status{1,2,
3-4,5}
-0.44716 0.496649 0.3679 -0.47387 0.495432 0.3388
Marital
status{2&1
-3}
-0.65383 0.465941 0.1605 -0.64898 0.463045 0.161
Marital -0.10604 0.93464 0.9097 -0.12105 0.93328 0.8968

87
status{4-5}
Education
Partition
[1-2]
-0.26161 0.320137 0.4138 -0.2795 0.318653 0.3804
A2
Partition
[1-2]
-0.80675 0.293793 0.006** -0.81468 0.291317 0.005**
A3
Partition
[1-2]
-0.64743 0.315981 0.0405* -0.61885 0.314657 0.0492*
A4
Partition
[1-2]
-0.97704 0.317589 0.0021** -0.97527 0.316073 0.002**
Sports,
Exercise
and Fitness
[1-2]
-0.4856 0.319039 0.128 -0.48703 0.318545 0.1263
Dispersion 2.034639 0.223545 <.0001 2.027835 0.223319 <.0001
Loglikelih
ood
-506.934
-506.757
Sample
size
188
188
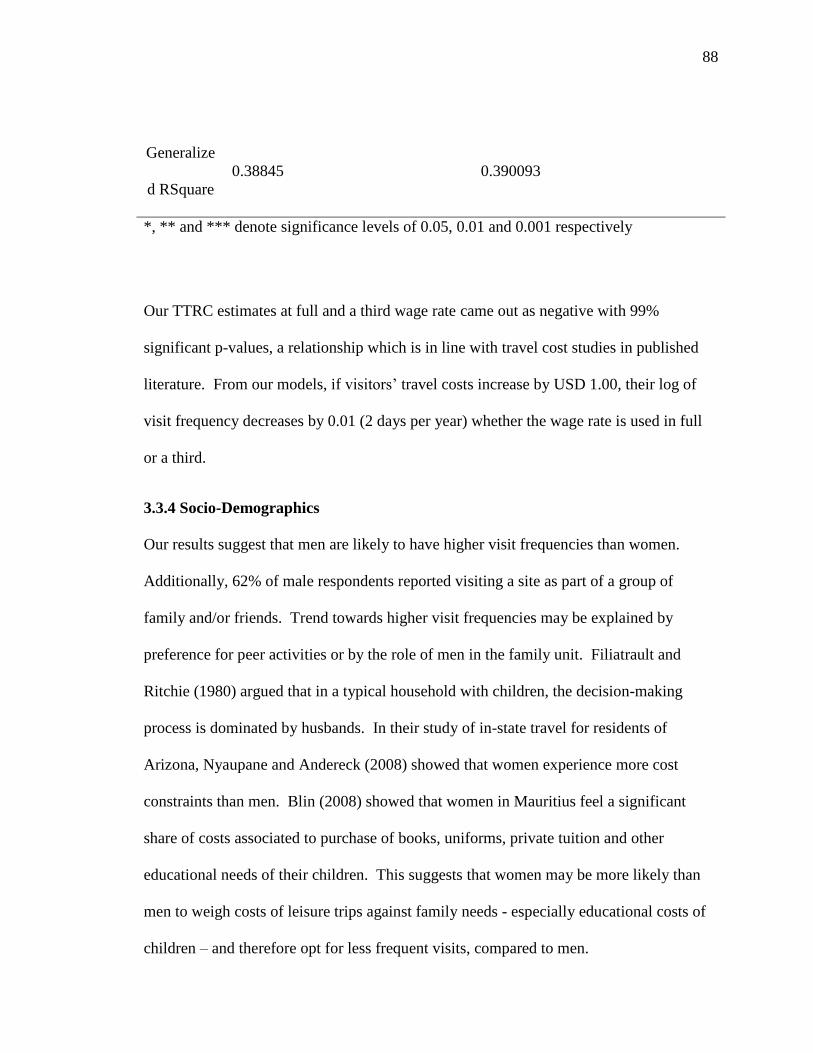
88
Generalize
d RSquare
0.38845
0.390093
*, ** and *** denote significance levels of 0.05, 0.01 and 0.001 respectively
Our TTRC estimates at full and a third wage rate came out as negative with 99%
significant p-values, a relationship which is in line with travel cost studies in published
literature. From our models, if visitors’ travel costs increase by USD 1.00, their log of
visit frequency decreases by 0.01 (2 days per year) whether the wage rate is used in full
or a third.
3.3.4 Socio-Demographics
Our results suggest that men are likely to have higher visit frequencies than women.
Additionally, 62% of male respondents reported visiting a site as part of a group of
family and/or friends. Trend towards higher visit frequencies may be explained by
preference for peer activities or by the role of men in the family unit. Filiatrault and
Ritchie (1980) argued that in a typical household with children, the decision-making
process is dominated by husbands. In their study of in-state travel for residents of
Arizona, Nyaupane and Andereck (2008) showed that women experience more cost
constraints than men. Blin (2008) showed that women in Mauritius feel a significant
share of costs associated to purchase of books, uniforms, private tuition and other
educational needs of their children. This suggests that women may be more likely than
men to weigh costs of leisure trips against family needs - especially educational costs of
children – and therefore opt for less frequent visits, compared to men.
89
Ethnicity, marital status and education were not identified by our regressions as
significant variables. Income was also not picked up as a variable of interest by the
stepwise process. With regards to potential effects of income, it is important to
acknowledge that in the coming years, recognition of greater management costs are likely
to shift policies towards implementation of entry fees at sites that are currently free. This
may become an impediment to frequent visits to forested areas by low-income residents.
Blaine et al. (2015) cite a body of literature that report zero to negative relationship
between income and visitation rate, suggesting that low-income visitors may have fewer
options to choose from as compared to higher income earners. They also suggest that
choices for low-income earners may dwindle further as more and more publicly
accessible sites follow private development trends and adopt restrictive access policies.
3.3.5 Attitudes to Conservation
Respondents who “strongly disagreed” to “agreed” with the statement that native species
in Mauritius are at risk of extinction, were more likely to have fewer visits per year to a
forested area, compared to those whom strongly agreed with the statement. Similarly,
respondents who “strongly disagreed” to “agreed” with the statement that they are well-
informed about conservation issues in Mauritius, were likely to have a lower visit
frequency that those whom “strongly agreed”. Lastly, respondents who “strongly
disagreed” to “agreed” with the statement that only professionals should be involved in
forest management, were likely to have an annual visit frequency lower than those whom
strongly agreed with the statement. Canavan (2013) argued that having a sense of
ownership could be a factor in maintaining a strong domestic tourism industry. He

90
highlighted this could manifest in the form of residents’ interest in their surrounding
environment and their motivation to explore. With that in mind, we suggest that
respondents may have associated the statement “Only professionals should decide how
the park should be managed” with possible restrictions on access to forested areas by land
owners and/or the state, explaining the significant trend towards lower visit rates.
3.3.6 Consumer Surplus
Per person, the CS is USD 3,975.54 per year when using the full wage rate, and USD
3,739.21 per year when using a third of the wage rate. The recreation value of forested
areas, shown in Table 12, can be estimated by multiplying the CS with target percentages
of the Mauritian population aged 20 and above, as a proxy for the annual number of
visitors to forested areas.
Table 12: Annual recreation value in USD, calculated using TTRCFW and TTRCW/3
Target Resident
Population
Annul Recreation Value
USD (full wage)
Annual Recreation Value
USD (third of wage)
10 % = 91,750 261,723,298 259,584,605
25 % = 229,375 654,308,244 648,961,513
50 % = 458,750 1,308,616,488 1,297,923,025
75 % = 688,125 1,962,924,731 1,946,884,538
100 % = 917,500 2,617,232,975 2,595,846,050

91
The total recreation value estimates shown in Table 12 are conservative estimates. Our
survey data was acquired during a low-visitor season, given that the majority of domestic
tourists favor long summer school holidays for their leisure activities. The Strategic Plan
2016-2020 for the Food Crop, Livestock and Forestry Sectors (Ministry of Agro-Industry
and Food Security, 2016) reports budgeting MUR 56.4 million (USD 1.7 million) to the
forestry sector for the period 2017/18 and MUR 50.15 million (USD 1.5 million) for the
period 2018/19. Coupled with the popularity of the sites with international tourists the
surplus value of forested areas in Mauritius exceeds the annual state budget put aside for
their conservation, as has been recognized by Alvarez and Larkin (2010) for parks in
Colombia. The recreation value of MUR 29.8 million (about USD 880,000) reported by
the UNDP-GEF (2009) for the Black River Gorges National Park is roughly 300 times
lower than our most conservative island-wide estimate. Shrestha et al. (2007) argued that
public land managers could capitalize visitation rates by engaging more local outfitters
and guides to help access natural areas and learn about the natural environment. Cho et
al. (2014) pointed out that managers of national forests have the challenge of allocating
already scarce resources towards policies and practices that can curb potential declines in
visitation rates. Hein (2011) discussed how Hoge Veluwe Park in Netherlands built a
successful business model that relies on recreation income from entry fees. They
highlight that the park’s high annual visit frequencies are directly related to the popularity
of the park, its ease of access from urban areas and the variety of activities promoted by
park managers e.g. photography workshops and provision of bicycles. All of these are

92
examples that state forest managers in Mauritius can adopt to increase the direct returns
on expenditure made for conservation management.
93
References
Alvarez, S., & Larkin, S. L. (2010). Valuing ecological restoration and recreational
benefits in a mountain protected area: The case of Los Nevados national park, Colombia.
Journal of Sustainable Development. 34, 3-15.
Baider, C., Florens, F. V., Baret, S., Beaver, K., Matatiken, D., Strasberg, D., and
Kueffer, C. (2010), June. Status of plant conservation in oceanic islands of the Western
Indian Ocean. In Proceedings of the 4th Global Botanic Gardens Congress p. 1.
Balmford, A., Beresford, J., Green, J., Naidoo, R., Walpole, M., & Manica, A. (2009). A
global perspective on trends in nature-based tourism. PLoS Biology. 76, e1000144.
Bank of Mauritius (2016) Consolidated Indicative Exchange Rates of Commercial Banks.
from 1 August 2015 to 31 August 2015. Available from
<https://www.bom.mu/?id=ExchangeRates>
Bartczak, A., Englin, J., & Pang, A. (2012). When are forest visits valued the most? An
analysis of the seasonal demand for forest recreation in Poland. Environmental Resource
Economics. 522, 249-264.
Benson, C., Watson, P., Taylor, G., Cook, P., & Hollenhorst, S. (2013). Who visits a
national park and what do they get out of it?: A joint visitor cluster analysis and travel
cost model for Yellowstone National Park. Environmental Management. 524, 917-928.
Blaine, T. W., Lichtkoppler, F. R., Bader, T. J., Hartman, T. J., & Lucente, J. E. (2015).
An examination of sources of sensitivity of consumer surplus estimates in travel cost
models. Journal of Environmental Management. 151, 427-436.
94
Blin, M. (2008). Export-oriented policies, women's work burden and human development
in Mauritius. Journal of Southern African Studies, 34(2), 239-253.
Bojanic, D. C., & Lo, M. (2016). A comparison of the moderating effect of tourism
reliance on the economic development for islands and other countries. Tourism
Management. 53, 207-214.
Canavan, B. (2013). The extent and role of domestic tourism in a small island: the case of
the Isle of Man. Journal of Travel Research. 523, 340-352.
Carr, L., & Mendelsohn, R. (2003). Valuing coral reefs: a travel cost analysis of the Great
Barrier Reef. AMBIO. 325, 353-357.
Cesario, F.J. (1976). Value of Time in Recreation Benefit Studies. Land Economics. 521,
32‐ 41.
Chae, D. R., Wattage, P., & Pascoe, S. (2012). Recreational benefits from a marine
protected area: A travel cost analysis of Lundy. Tourism Management. 334, 971-977.
Cho, S. H., Bowker, J. M., English, D. B., Roberts, R. K., & Kim, T. (2014). Effects of
travel cost and participation in recreational activities on national forest visits. Forest
Policy and Economics. 40, 21-30.
Clawson, M. & Knetsch, J.L. (1966). Economics of outdoor recreation. The Johns
Hopkins University Press for Resources for the Future. Washington.

95
Czajkowski, M., Giergiczny, M., Kronenberg, J., & Englin, J. (2015). The individual
travel cost method with consumer-specific values of travel time savings. Working Paper-
Faculty of Economic Sciences, University of Warsaw, WP12/160.
Domencich, T. & McFadden, D. (1975). Urban Travel Demand A Behavioral Analysis.
North- Holland Publishing Company, Amsterdam.
Ezebilo, E. E. (2016). Economic value of a non-market ecosystem service: an application
of the travel cost method to nature recreation in Sweden. International Journal of
Biodiversity Science, Ecosystem Services and Management. 124, 314-327.
Filiatrault, P., Ritchie, J. (1980). Joint Purchasing Decisions: A Comparison of Influence
Structure in Family and Couple Decision-Making Units. Journal of Consumer Research.
7, 131-140.
Florens, F. V., Baider, C., Martin, G. M., and Strasberg, D. (2012). Surviving 370 years
of human impact: what remains of tree diversity and structure of the lowland wet forests
of oceanic island Mauritius? Biodiversity Conservation. 218, 2139-2167.
Greene, W. (2008). Functional forms for the negative binomial model for count data.
Economics Letters. 99(3), 585-590.
Global Fuel Economy Initiative (2016) Global Fuel Economy An update for COP 22.
London, UK. Available from < https://www.globalfueleconomy.org/media/412594/gfei-
cop22-update-lr-spreads.pdf>
96
Hein, L. (2011). Economic benefits generated by protected areas: the case of the Hoge
Veluwe forest, the Netherlands. Ecological Society. 162: 13. [online] URL:
http://www.ecologyandsociety.org/vol16/iss2/art13/
House, W.J. (2013) Population and Sustainable Development in Small Island Developing
States: Challenges, Progress made and Outstanding Issues. Population Division
Technical Paper No. 2013/4. United Nations Department of Economic and Social Affairs.
New York.
International Labor Organization (2017). ILOSTAT database on earnings by country
dated from 1999 to 2016 [Datafile]. Available from
<http://www.ilo.org/ilostat/faces/oracle/webcenter/portalapp/pagehierarchy/Page3.jspx?
MBI_ID=435&_adf.ctrl-
state=4b86j4jph_9&_afrLoop=57435835637933&_afrWindowMode=0&_afrWindowId=
4b86j4jph_6#!>
Mauritius Meteorological Service (2017) Climate of Mauritius. Available from
<http://metservice.intnet.mu/climate-services/climate-of-mauritius.php>
Ministry of Agro-Industry and Food Security (2016) Strategic Plan 2016-2020 for the
Food Crop, Livestock and Forestry Sectors. Government of Mauritius. Available from
<http://agriculture.govmu.org/English/Reports/Pages/default.aspx>
Mwebaze, P., & MacLeod, A. (2013). Valuing marine parks in a small island developing
state: A travel cost analysis in Seychelles. Environmental and Developmental Economics.

97
184, 405-426.
doi:http://dx.doi.org.ezproxy.montclair.edu:2048/10.1017/S1355770X12000538
Myers, N., Mittermeier, R. A., Mittermeier, C. G., da Fonseca, G. A. B., and Kent, J.
(2000). Biodiversity hotspots for conservation priorities. Nature, 403 , 853-858.
NBSAP (2006). National Biodiversity Strategy and Action Plan 2006 – 2015. Réduit,
Mauritius. 136 pp.
Nyaupane, G. P., & Andereck, K. L. (2008). Understanding travel constraints:
Application and extension of a leisure constraints model. Journal of Travel Research.
464, 433-439.
Nyaupane, G. P., & Andereck, K. L. (2008). Understanding travel constraints:
Application and extension of a leisure constraints model. Journal of Travel Research.
464, 433-439.
Organization for Economic Cooperation and Development (2015). Small island
developing states SIDS and the post-2015 development finance agenda. Third
International Conference on Financing for Development. Addis Ababa.
Page, W. S., and D'Argent, G. (1997). A survey of Mauritius Indian Ocean to identify
priority rainforest areas for conservation management. Mauritius: Mauritius Wildlife
Foundation. Report.
Parsons, G. R. (2003). The travel cost model. In A primer on nonmarket valuation pp.
269-329. Springer Netherlands.

98
Paupiah, S. A. (2004). National Report to the Fifth Session of the United Nations Forum
on Forests for the Republic of Mauritius. New York, USA: United Nations Forum on
Forests Secretariat.
Pirikiya, M., Amirnejad, H., Oladi, J., & Solout, K. A. (2016). Determining the
recreational value of forest park by travel cost method and defining its effective factors.
Journal of Forest Sciences. 629, 399-406.
Prayag, G. (2011). Rejuvenating paradise: Changing products, changing markets and
changing visitor behaviour in Mauritius. Island Tourism. Sustainable Perspectives.
Wallingford: CAB International, 157-170.
Saddul, P., Nelson, B. W., and Jahangeer-Chojoo, A. (1995). Mauritius: A
geomorphological analysis. Mahatma Gandhi Institute.
Seenprachawong, U. (2016). An economic analysis of coral reefs in the Andaman Sea of
Thailand. In Marine and Coastal Ecosystem Valuation, Institutions, and Policy in
Southeast Asia pp. 31-45. Springer Singapore.
Shrestha, R. K., Stein, T. V., & Clark, J. (2007). Valuing nature-based recreation in
public natural areas of the Apalachicola River region, Florida. Journal of Environmental
Management. 854, 977-985.
State Trading Corporation (2014) Petroleum Retail Prices. Available from <
http://www.stcmu.com/pps/retailprices.html>
Statistics Mauritius (2016) Population and Vital Statistics 2015. Ministry of Finance and
Economic Development. Republic of Mauritius. Available from

99
<http://statsmauritius.govmu.org/English/Publications/Documents/EI1230/Pop_Vital_Sta
ts_Year15.doc>
The World Bank (2016). Country data: Mauritius [Datafile]. Available from
<https://data.worldbank.org/country/mauritius>.
Tietenberg, T. H., & Lewis, L. (2016). Environmental and natural resource economics.
Routledge.
Tillman, D. (1997). Biodiversity and ecosystem functioning. In G. C. Daily Ed., Nature’s
services: Societal dependence on natural ecosystems pp. 93–112. Washington, DC &
Covelo, CA: Island Press.
UNDP-GEF (2009) Expanding coverage and strengthening management effectiveness of
the protected area network on the island of Mauritius. UNDP Project document. PIMS
1749, GEF Project ID 3526. Unpublished report.
UNOHRLLS (2013) United Nations Office of the High Representative for the Least
Developed Countries, Landlocked Developing Countries and the Small Island
Developing States – Small Island Developing States Factsheet 2013. Available from
<http://unohrlls.org/custom-content/uploads/2013/09/Small-Island-Developing-States-
Factsheet-2013-.pdf>
van Beukering, P., Sarkis, S., van der Putten, L., & Papyrakis, E. (2015). Bermuda׳ s
balancing act: The economic dependence of cruise and air tourism on healthy coral reefs.
Ecosystem Services. 11, 76-86.

100
Van den Bulcke, D., Verbeke, A., & Yuan, W. Eds. (2009). Handbook on small nations
in the global economy: The contributions of multinational enterprises to national
economic success. Edward Elgar Publishing.
Vaughan, R. E., and Wiehe, P. O. (1937). Studies on the vegetation of Mauritius. I. A.
preliminary survey of the plant communities. Journal of Ecology. 252, 289–343.
Warner, R. M. (2008). Applied statistics: From bivariate through multivariate
techniques. Sage.
Wortman, T., Donaldson, R., & Westen, G. (2016). ‘They are stealing my island’:
Residents’ opinions on foreign investment in the residential tourism industry in Tamarin,
Mauritius. Singapore Journal of Tropical Geography. 372, 139-157.
Wunder, S. (1999). Promoting forest conservation through ecotourism income? No.
CIFOR Occasional Paper no. 21, p. 24p. CIFOR, Bogor, Indonesia.

101
4 USING SWOT ANALYTICAL HIERARCHY PROCESS TO ASSESS
CONSERVATION PRIORITIES OF STAKEHOLDERS
4.1 Introduction
The willingness to gain a better understanding of complexities in social-ecological
systems has led to identification of issues like inequalities in resource need versus
resource ownership (Ostrom et al. 1999), power inequalities, unequal distribution of
information and unequal management outcomes (Robards et al. 2011). Involving diverse
stakeholders has been shown to result in improved management plans and in obtaining a
wider range of information and perspectives needed for resource management (Colfer,
2005). Stakeholder participation is a mainstay of processes established by the Secretariat
of the Convention for Biological Diversity (CBD) (2011) for signatory countries to
prepare their National Biodiversity Strategy and Action Plans (NBSAP). Similarly, the
United Nations Development Program (UNDP) has set up mandatory Social and
Environmental Standards (SES), including as requirement that all of their projects and
programs fully and effectively engage stakeholders and provide a means to address
complaints from project-affected people (UNDP, 2014). Adopting these trends into
national and international policy processes are often accomplished by making use of
either a contracted consultant or project staff to structure the stakeholder engagement.
However, constraints of time and project resources can limit the depth of understanding
needed to capture how stakeholders interact and make decisions on natural resource
management. Fritsch and Newig (2012) found that matching interests and goals of
stakeholders was the single most determining factor in deciding the success of

102
environmental projects and policies. One of the most commonly used tools in
stakeholder engagement processes is conducting an analysis of a project’s or policy’s
internal strengths and weaknesses, and external opportunities and threats (SWOT). Our
study provides an example of how SWOT analysis in conservation programs can be taken
one step further towards actively recognizing priorities of stakeholders and customizing
project outcomes to their needs where possible, or at the very least, minimizing perceived
risks.
Small island developing states (SIDS) juggle heavily between conservation of their
endemic biota and pressures on ecosystems from high population densities, small
geographic size, economic development, limited local resources and limited local
capacity (Teelucksingh et al., 2013). Restricted land space on islands forces close
proximity of resource users which in turn tends to magnify conflicts in natural resource
management. Therefore, engaging stakeholders in policy formulation early in the process
can bring greater flexibility in formulating strategies and greater acceptance of outcomes.
Additionally, SIDS are amongst the most underfunded countries with regards to
conservation (Waldron et al., 2013; Miller et al., 2013), such that finding innovative
conservation strategies using limited resources requires input from a wide array of
stakeholders.
The level of participation in policy formulation varies from a low level of public
information to high level joint decision making processes (Arnstein, 1969). In the latter
case, SWOT analysis is popular, but offers limited insight into individual stakeholder
priorities and does not pinpoint the differential contribution of SWOT factors to
103
influencing decision-making. Hill and Westbrook (1997) also stated that the limits of
SWOT analyses are that the factors tend to be general in nature and will differ when a
single stakeholder is carrying it out as opposed to when the analysis is undertaken by an
external consultant, or by a group. Thus, generating prioritized factors, through SWOT
AHP, to guide conservation and exploring differences in those priorities between
stakeholders are key challenges facing conservation organizations in tropical island
communities (McLeod et al. 2016).
4.2 Methodology
4.2.1 Study Area
Mauritius is a small island developing state, part of the Mascarene Archipelago and
located in the Indian Ocean, 900km east of Madagascar. Along with Madagascar and the
Seychelles archipelago, Mauritius is recognized as a biodiversity hotspot (Myers et al.
2000), bearing 40 % of the region’s single island floral endemics (Baider et al. 2010).
The biodiversity of the island, like many other oceanic islands, is heavily threatened.
Successive phases of colonization followed by rapid post-independence economic
development has reduced the extent of good quality native forests to less than 2% of the
land area (Page and d’Argent, 1997). Remaining natural habitats and terrestrial
ecosystems are heavily affected by plant and animal IAS and developmental pressures
(Mauremootoo, 2003). These same habitats and ecosystems are essential in the provision
of critical ecosystem services (freshwater, fertile soil, carbon storage, and weather

104
regulation), recreational benefits through outdoor sports, economic benefits through
nature-based tourism as well as a range of other religious and aesthetic benefits.
The road to forest conservation on the island is paved with a number of successes, for
example saving the Falco punctatus (Jones et al., 1995), creating Conservation
Management Areas (CMAs) (Baider and Florens, 2011), formal protection status for the
Black River Gorges National Park, the Bras d’Eau National Park as well as seven nature
reserves. Successful conservation strategies center on the eradication of IAS (Baider and
Florens, 2011), creation of legal implements e.g. the Native Terrestrial Biodiversity and
National Parks Act 2015, and captive breeding and release programs for native birds
(Gardenne and Torto, 2017). Formulation and implementation of these strategies have to
take into account a number of pressures. Firstly, forest remnants on the island span both
state and privately owned lands where access for forest restoration can be restricted.
Secondly, funding for conservation may not match restoration targets or be available to
private landowners. Thirdly, loss of natural dispersers and pollinators as well as
increased distance from source populations results in increased species loss (Gibson et al.
2013). This pressure on ecosystem health is increased when local government is lobbied
to cull populations of important dispersers like the Mauritian fruit bat Pteropus niger
(Florens, 2016). Other special interest groups that are affected by conservation strategies
include deer ranchers and hunting associations, private land developers and nature-
tourism operators.
Nonetheless, Mauritius has a good experience of engaging stakeholders for major
national projects, typically through consultative workshops between private land owners,

105
state agency representatives (Forestry Service, and National Parks and Conservation
Service) and non-governmental organizations (NGOs). The main biodiversity related
projects and policies that we explored for this study are (i) National Biodiversity Strategy
and Action Plan 2006-2015 (ii) Study on Environmentally Sensitive Areas (ESA) by the
Ministry of Environment and National Development Unit (2008), (iii)“Expanding
coverage and strengthening management effectiveness of the protected area network
(PAN) on the island of Mauritius” project (UNDP and Global Environment Facility
(GEF), 2009), (iv) the National Invasive Alien Species Strategy and Action Plan
(NIASSAP) (2009), (v) the Maurice Ile Durable (MID) project (Mott McDonald, 2012)
and (vi) the 2015 Native Terrestrial Biodiversity and National Parks Act. Each of these
projects and policies incorporated consultative workshops with a wide range of local
stakeholders, resulting in an exhaustive list of SWOT factors. The concerns and interests
of stakeholders have been reported and listed at group level, but there is no documented
evidence of priorities that drive the decision-making process of each stakeholder group
when it comes to conservation. Our study uses the list of SWOT factors compiled
through the above-named projects and policies and presents them to actors that use and
are directly or indirectly affected by, or are benefitting from (Jolibert and Wesselink,
2012) native forest conservation on state and private lands in Mauritius.

106
4.2.2 Theoretical Specification
For our study, applying AHP to SWOT analysis was a three-step process. With SWOT
factors pre-established, local priorities of factors are calculated using the eigenvalue
method as the first step. For this, a reciprocal matrix is constructed by comparing one
factor to another in a pairwise fashion, for each factor within the strengths, weaknesses,
opportunities and threats categories in turn. Respondents are asked to rank the
importance of one factor relative to another using a 9-point scale, as shown in the
example below:
A 9 8 7 6 5 4 3 2 1 2 3 4 5 6 7 8 9 B
where 9 stands for “Extremely important”, 5 for “strong importance”, 3 for “moderate
importance” and for “equal importance”. Using this scale, if A is more important than
B, a number is picked to the left side of “1”. If B is more important than A, a number is
picked to the right side of the scale from “1’. We also assume that comparing A to B is
the reciprocal value of comparing B to A. A relative weight therefore is represented by
aij and its reciprocal on the opposite side of the diagonal, as 1/aij. Using the ranks as
weights yields a square matrix of the form shown below, where n is the number of factors
being compared:
𝐴 = [𝑤𝑖
𝑤𝑗] =
𝑤1𝑤1
⁄𝑤1
𝑤2⁄ …
𝑤1𝑤𝑛
⁄𝑤2
𝑤1⁄
𝑤2𝑤2
⁄ …𝑤𝑛
𝑤1⁄
𝑤𝑛𝑤2
⁄ … 𝑤𝑛
𝑤𝑛⁄

107
The comparison matrix A is then normalized by adding the values in each column and
dividing each cell value by the column total. The normalized matrix is used to obtain
local priorities of each factor by calculating the average of each row. Multiplying the
transpose of the vector of weights w by matrix A we get a vector represented by λmaxw,
where
𝐴𝑤 = 𝜆𝑚𝑎𝑥𝑤
and w = (w1, w2, …wn)T, where λmax is the largest eigenvalue of matrix A and w is the
transpose of the vector of weights. In a consistent matrix, λmax is equal to or greater then
n (Saaty 1977). The consistency ratio (CR) of a matrix can be calculated using the
formula:
𝐶𝑅 = 𝐶𝐼
𝑅𝐼
where 𝐶𝐼 = (𝜆𝑚𝑎𝑥−1)
𝑛−1 and RI is the consistency index of a random matrix of order n. As a
rule of thumb, Saaty (1977) recommends keeping the CR ≤ 10%. Alonso and Lamata
(2006) argued that the consistency of a matrix depends on the scope and the decision
maker’s actual need, such that more flexibility may be required than a 10% cut-off.
The second step of the methodology requires identifying those factors within each
category with the highest local priority and using these as representative of its category.
A second pairwise comparison is then carried out between the four SWOT categories.
This calculation becomes a scaling factor used in the third step of the AHP method. This
last step involves multiplying each local factor priority by the category scaling value to
obtain a global priority for each factor. In simple terms, the local priorities allow for

108
ranking a factor within a category, whilst the global priority indicates a stakeholder’s
perception of the factor’s relative contribution to its SWOT category (Ramirez et al.
2012).
4.2.3 Data collection
Following recommendations by the African Development Bank (2001), Jolibert and
Wesselink (2012) as well as the Climate Investment Funds (2013), we broke down the
list of stakeholders provided in the policy documents listed in Section 4.2.1 into two main
categories. The first are key stakeholders that include scientists, policy-makers, forest
land owners and local NGOs engaged in environmental initiatives. Secondary
stakeholders include private companies with a corporate social responsibility (CSR)
portfolio, hunting associations, tourism operators, outdoor sports professionals and
facilitators like representatives and project leaders for the UNDP. A comprehensive
contact list of stakeholders was built using (i) published contributors for the NBSAP
(2006), ESA (2008), NIASSAP (2008), PAN (2009), MID (2012), and consultative
workshops for the new native terrestrial biodiversity and national parks bill (Government
Information Service (GIS), 2015) (ii) lists of CSR providers and non-profit environmental
organizations eligible for CSR funding (National CSR Foundation, 2017). Stakeholders
thus identified were invited to participate in a focus group, or participate in a one-to-one
survey.
Saaty (1977) argued that cognitive limits in conducting pair-wise comparisons generally
limit the number of factors in a SWOT category to ten. The focus group, held on 29th
May 2015, was therefore tasked with firstly validating the list of factors to avoid

109
compiler bias, and secondly, streamlining the factors to a maximum of ten unambiguous
factors per category, as shown in Table 13. In-person interviews with stakeholders who
chose this method of participation in the study were conducted between 30th May 2015
and 20th August 2015.
Table 13: List of biodiversity conservation SWOT factors used to elicit preferences using
AHP. Factors were validated through focus group discussions with Mauritian
stakeholders.
Strengths Weaknesses
S1
Identification of IAS and good
knowledge/research on management
and control.
W1
Costs of setting up Conservation
Management Areas (fencing +
weeding) are very high,
discouraging private landowners
from investing in them.
S2
Known conservation status of native
species and existing list of
threatened and endangered species.
W2
Lack of public awareness of native
species, ecosystem services and the
need for their protection.
S3
River and mountain reserves already
bear legal protection.
W3
Mountain reserves and forests on
steep slopes are difficult to access
or restoration and monitoring.
S4
Stakeholders actively engaged in
national projects and policy
W4
Absence of consistent multiple
land-use planning e.g. conservation

110
processes on biodiversity
conservation.
areas and buffer zones with deer
pasture, nature-based tourism,
plantation and infrastructure.
S5
Mauritius has made strong national
and international commitments in
terms of biodiversity targets.
W5
Deforestation due to lack of state
monitoring and enforcement, or as a
result of forest land leasing for deer
ranching.
S6
Forests provide natural areas for
recreation and leisure, favored by
local population and tourists.
W6
Invasive Alien Species Strategy and
Action Plan not disseminated to all
stakeholders.
S7
New forest nurseries and expansion
of existing ones can now support an
annual re-afforestation program of
150 hectares.
W7
Absence of structured, time-bound
and targeted management plans for
all state, leased and private
forestlands.
S8
Mauritius has already known a
number of conservation success
stories e.g. saving the Kestrel,
creation of the Black River Gorges
National Park, establishing the
Vallee de Ferney public-private
partnership.
W8
Absence of or limited habitat and
species monitoring on leased and
private forest lands.
W9 Technical knowhow not exchange

111
between state agencies and private
land owners.
W10
Shortage of skilled local personnel
for successful establishment and
management of protected areas on
state and private lands.
Opportunities Threats
O1
Public and private stakeholders have
good awareness of IAS and
associated problems.
T1
Absence of mitigation plans or
short-term risks of large-scale IAS
removal (erosion, soil compaction,
non-aesthetic gaps, fire risk)
O2
A Protected Area Network funded
by the UNDP-GEF is in discussion
since 2009; PAN to include viable
populations and representative
habits, and cover 10% of land mass.
T2
Limited cooperative governance
and partnership agreements to scale
up forest restoration.
O3
Use of nature-based tourism and
CSR to enhance conservation and
sustainable use of biodiversity on
state and private lands.
T3
Lack of control on where private
nurseries source native plants for
commercial sale, with risk of over-
exploitation.
O4
Nurseries on private forest lands
showing interest and capacity to
T4
Lack of incentives (e.g. tax rebates)
to maintain native forests and

112
grow native plant species. sensitive habitats on private lands.
O5
Restoring native forests can take
advantage of future economic tools
in favor of ecosystem services.
T5
Limited restrictions on land-use and
development in and near
Environmentally Sensitive Areas.
O6
Forests can be actively restored
through intensive eradication of IAS
and reforestation.
T6
IAS control and management not
undertaken on a large scale.
O7
Communities and users show
increasing appreciation of restored
forests – media coverage, nature-
based recreation, green jobs and
other volunteer-based capacity
building.
T7
Deer ranching is difficult to
regulate. Even if deer is a listed
IAS, it is a significant source of
income.
O8
Cost effective IAS control methods
known and are available (e.g. drill
and herbicide; cut and herbicide;
ring barking).
T8
Staffing levels and budget
allocation within state agencies (FS
and NPCS) are low.
T9
Binding agreements are formulated
on the basis of lack of trust and lack
of transparency from parties
involved.

113
4.2.4 Survey Design
The survey for eliciting factor preferences was structured into three parts with the first
providing an introductory script explaining the purpose of the study, the second part
provided a grid system for the pairwise comparisons of SWOT factors and the third part
provided another grid system for the pairwise comparison of SWOT groups. The survey
was accompanied by a PowerpointTM presentation with a worded pairwise comparison on
each slide to help respondents, an example of which is “S1 – Identification of IAS and
good knowledge/research on management and control vs. S6 – Forests provide natural
areas for recreation and leisure, favored by local population and tourists”. Because of the
one-on-one nature of the interview, respondents had ample opportunity to clarify the
SWOT factors and understand the methodology, such that their final responses could be
taken at face value. Surveys and the focus group agenda received institutional review
board approval prior to deployment in Mauritius.
Once all preference weights were input, respondents were asked to state the stakeholder
category they best saw themselves in, or best identified as. For groups with more than
one respondent we used the geometric mean (Saaty, 2001) to obtain the local and global
priorities, whilst other individuals were assumed to be representative of their stakeholder
group. We used the local and global priorities of factors to create perception maps for
each stakeholder group in an XY space, similar to Ramirez et al. (2012). We also
assessed those factors that held the highest and lowest global priority rankings across all
stakeholders in the study.

114
4.3 Results & Discussion
One of the main advantages of SWOT-AHP is that it does not necessitate a large
response sample, but can target people knowledgeable of the issue at hand (Shrestha et
al., 2004). We had 22 respondents in total, classified into 11 stakeholder types namely
‘activist group’, ‘agriculture group’, ‘environmental consultant group ‘, ‘large
corporation group’, ‘non-profit organization group’, ‘outdoor sports group’,
‘scientist/ecologist group’, ‘sugar estate group’, ‘state agencies group’, ‘hunting
association group’ and ‘facilitators’ group’. A scatterplot of prioritized SWOT factors
for each of these stakeholder groups is shown in Figures 7a to 7k.
For the “activist” stakeholder group, existing legal protections for river and mountain
reserves (S3) are the strongest perceived strengths, difficulty in accessing forests on
mountains and steep slopes for effective restoration (W3) is the strongest perceived
weakness, and absence of adequate restrictions on land-uses and development near ESAs
(T5) is perceived as the strongest threat. The “activist group” also perceived all
opportunities to bear equal importance. Our findings for this stakeholder group are in
line with Wapner (1995) who suggested that activists typically see their role as being
political influencers, acting as pressure groups on state policy makers.

115
● Strengths ●Weaknesses ● Opportunities ●Threats
Figure 7a: Preference map of SWOT factors for “Activist” stakeholder group.
For the “agriculture” stakeholder group, the ability of plant nurseries to expand
operations and propagation of native plants for afforestation (S7) is perceived as the most
important strength, whilst absence of adequate enforcement and monitoring on state
forest lands to avoid deforestation (W5) is seen as the most important weakness. The
opportunities presented by CSR funding and nature-based tourism (O3) have the highest
importance and not eradicating IAS on a large scale (T6) is perceived to be the most
important threat. The agricultural community on the island is affected by loss of soil
fertility from legacy deforestation (Norder et al. 2017) and land abandonment as small
land owners shift occupation choices based on social–economic factors (Lalljee and

116
Facknath, 2008). Even if Mauritius relies heavily on food imports, local agriculture
remains threatened by soil loss, increased water runoff, lower infiltration rates, and lower
water-holding capacity (Pimentel et al. 1995). The set of SWOT factors favored by this
stakeholder group suggests that the ecosystem service links between agriculture and
forests are well understood and there is a willingness to contribute to enhancing those
links. Additionally, propagating native species and replanting these on marginal and
abandoned lands is part of the PAN project and can arguably bring future economic
benefits to private land owners and nursery managers.
● Strengths ●Weaknesses ● Opportunities ●Threats
Figure 7b: Preference map of SWOT factors for “Agriculture” stakeholders.
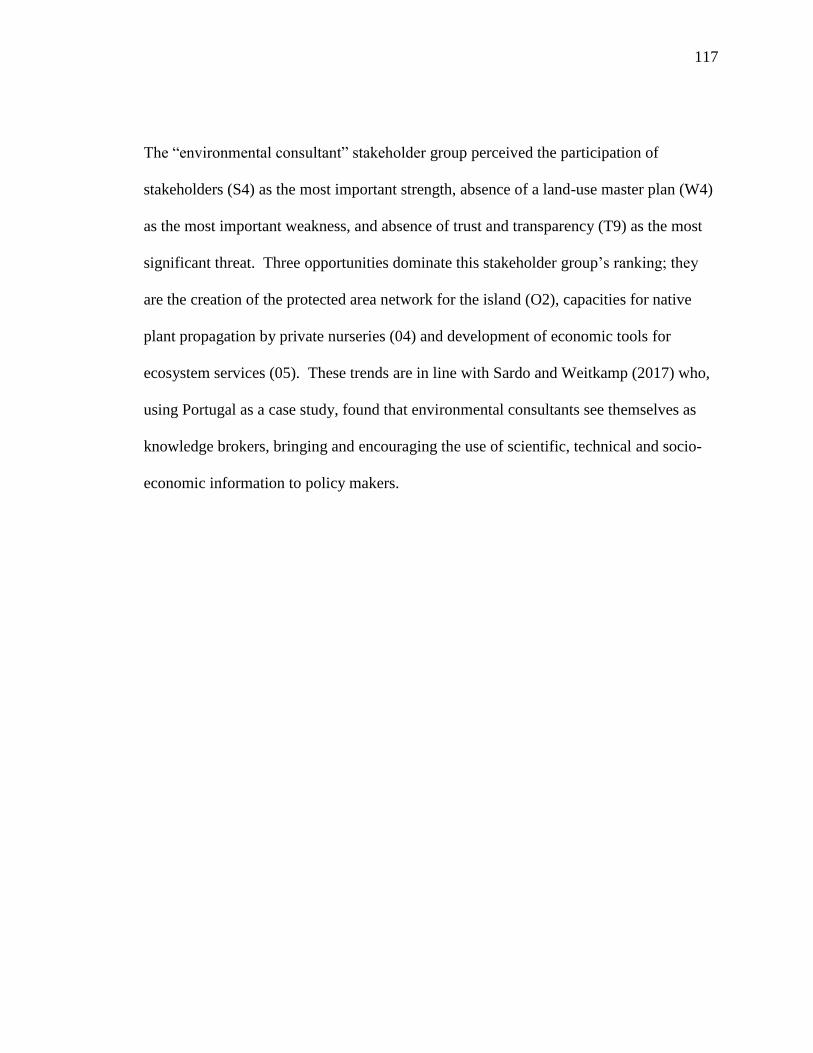
117
The “environmental consultant” stakeholder group perceived the participation of
stakeholders (S4) as the most important strength, absence of a land-use master plan (W4)
as the most important weakness, and absence of trust and transparency (T9) as the most
significant threat. Three opportunities dominate this stakeholder group’s ranking; they
are the creation of the protected area network for the island (O2), capacities for native
plant propagation by private nurseries (04) and development of economic tools for
ecosystem services (05). These trends are in line with Sardo and Weitkamp (2017) who,
using Portugal as a case study, found that environmental consultants see themselves as
knowledge brokers, bringing and encouraging the use of scientific, technical and socio-
economic information to policy makers.
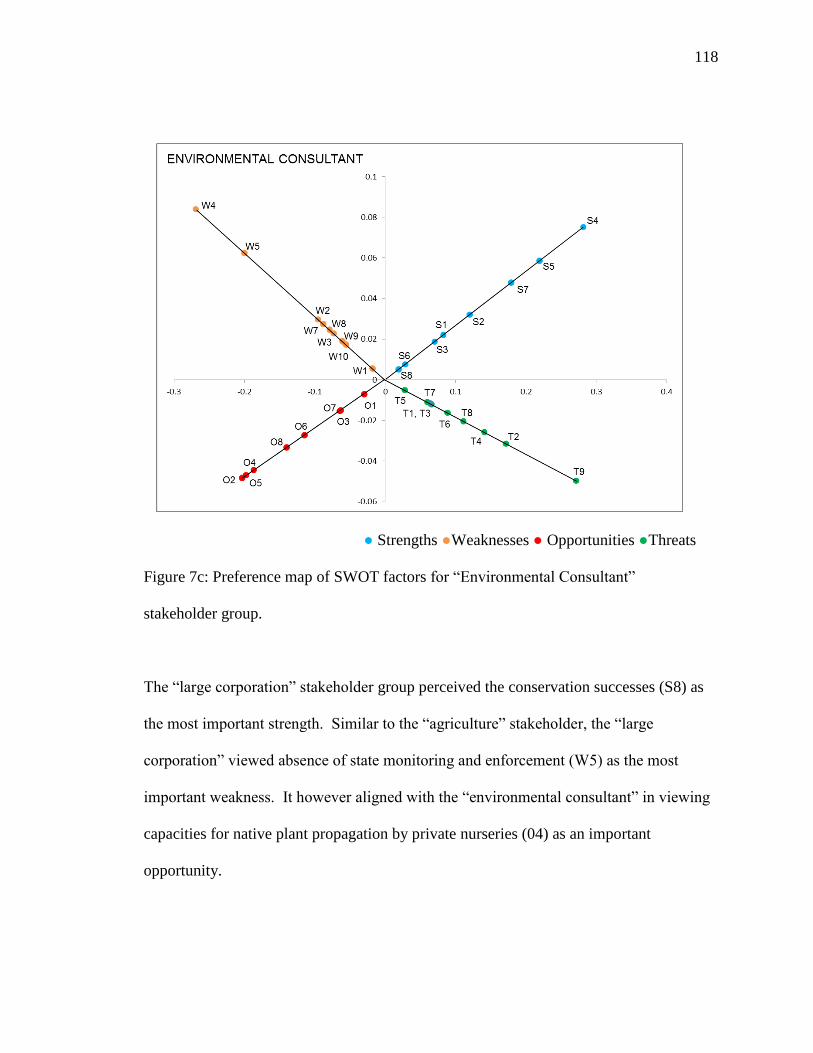
118
● Strengths ●Weaknesses ● Opportunities ●Threats
Figure 7c: Preference map of SWOT factors for “Environmental Consultant”
stakeholder group.
The “large corporation” stakeholder group perceived the conservation successes (S8) as
the most important strength. Similar to the “agriculture” stakeholder, the “large
corporation” viewed absence of state monitoring and enforcement (W5) as the most
important weakness. It however aligned with the “environmental consultant” in viewing
capacities for native plant propagation by private nurseries (04) as an important
opportunity.

119
● Strengths ●Weaknesses ● Opportunities ●Threats
Figure 7d: Preference map of SWOT factors for “large corporation” stakeholder group.
Similar to the “agriculture” stakeholder, the “non-governmental organization”
stakeholder group perceived the expansion of existing nurseries and the setting up of new
ones to increase re-afforestation programs (S7), as the most important strength. They
also equally perceived opportunities presented by CSR funding and nature-based tourism
(O3) as having the highest importance. They perceived the shortage of skilled local
personnel for successful establishment and management of protected areas on state and
private lands (W10) as the most important weakness. Lastly, they perceived deer
ranching (T7) and low staffing levels and low budget allocation within state agencies
(T8) as highly important threats. Under the S50L of the Income Tax Act of Mauritius

120
(Act 16 of 1995), all but specially-exempt companies registered with the Registrar of
Companies of Mauritius have to put two percent of their book profits into a CSR fund to
be used by approved non-governmental organizations for projects with social and
environmental benefits (National CSR Foundation, 2017). Many non-governmental
organizations on the island have been able to tap into CSR funds to hire more volunteers,
employ more staff and diversify their operations (for example by setting up their own
plant nurseries), allowing them to maximize S7, make up for W10 and mitigate T8.
● Strengths ●Weaknesses ● Opportunities ●Threats
Figure 7e: Preference map of SWOT factors for “non-governmental organization”
stakeholder groups.
121
The “outdoor sports” stakeholder group comprises of people who use outdoor sports as
their source of income by providing guided bike tours or mountaineering trips. They
perceived the national and international commitments made with regards to
environmental protection (S5) as the most important strength, a preference which we can
attribute to their reliance on well-preserved natural environments. Similar to the
“agriculture” and “large corporation” stakeholders, the “outdoor sports” stakeholder
perceived absence of state monitoring and enforcement on forestlands (W5) as the most
important weakness, and low staffing levels and low budget allocation within state
agencies (T8) as a highly important threat. They related W5 and T8 to the unregulated
field of outdoor nature sports where large groups have been known to go on difficult
terrain with poor safety equipment and inadequate training. Limiting the risk of harm to
users and risk of damage to critical habitats and species is made difficult by the
unsupervised, open and free access to the national parks and nature reserves. Lastly, they
view the appreciation of communities and users for restored forests (O7) has the most
important opportunity which can be associated to the variety of nature-tourism and
adventure sports operators on the island, as well as the popularity of trail running, with
events like the Rando Raid, Ferney Trail, Parakeet Challenge and 15 other trail races held
annually, across the island (http://www.randotrail.mu) and which attract thousands of
domestic and international participants.

122
● Strengths ●Weaknesses ● Opportunities ●Threats
Figure 7f: Preference map of SWOT factors for “outdoor sports” stakeholder.
The “scientist/ecologist” stakeholder group perceived the identification, management and
control of IAS (S1) as the most important strength. Moon, Blackman and Brewer (2015)
highlight that eradicating invasive species from inhabited areas is a much more
considerable challenge for scientists and decision-makers because of differing
stakeholder perceptions, in addition to source areas of IAS, for example on private forest
lands. This explains the higher perceived threat importance given to the absence of large
scale IAS control and management (T6). However, research into their control and
management has yielded cost-effective forest restoration methods (Dulloo et al., 2002;

123
Gopal, 2003; NIASSAP, 2009; Florens et al. 2010; Florens and Baider, 2013) that can
easily be applied to both state and private forestlands and can be funded more easily.
Similar to the “environmental consultant” stakeholder, scientists perceived absence of a
land-use master plan (W4) as the most important weakness and ranked top-most the
opportunities that can be offered through nature-based tourism and CSR (O3).
● Strengths ●Weaknesses ● Opportunities ●Threats
Figure 7g: Preference map of SWOT factors for “scientist” stakeholder.
The “sugar estate” stakeholder group perceived the history of conservation successes (S8)
as the most important strength. The economic tools that can be used in favor of
ecosystem services (O5) and rapid restoration that can be achieved through intensive
eradication of IAS and reforestation (O6) are perceived as high priority opportunities.

124
Sugar estates on the island date back to colonial times and are for the most part privately
owned. These estates also include significant tracts of remnant native lowland forests as
well as land reserved for deer ranching and hunting. These forests, especially those not
included in mountain reserves, would almost certainly have been cleared if not for
hunting (Mauremootoo et al., 2003). Though many privately owned forests are heavily
degraded state, they represent the most extensive and best-conserved lowland forest in
the Mascarenes (Mauremootoo et al., 2003). Some land owners have invested in
maximizing use of these forests through nature-based tourism (for example La Vallee de
Ferney Forest and Wildlife Reserve, Le Domaine de L’Etoile, Ebony Forest), whilst in
other areas, large owners turned the landscape into an asset for integrated resort schemes.
As a key stakeholder, these large land owners recognize the economic benefits to be
gained from conservation but will favor public-private partnerships with the state (for
example La Vallee de Ferney Conservation Trust) and access to green grants. “Sugar
estate” stakeholders view the lack of habitat and species monitoring on their lands (W8)
as the top-most weakness, and perceive the low staffing and budget levels of state
agencies (T8) as the most important threat. This suggests that as large forestland owners,
they need better support to gauge the ecological value of their properties but fail to see
state agencies as being able to provide that support.
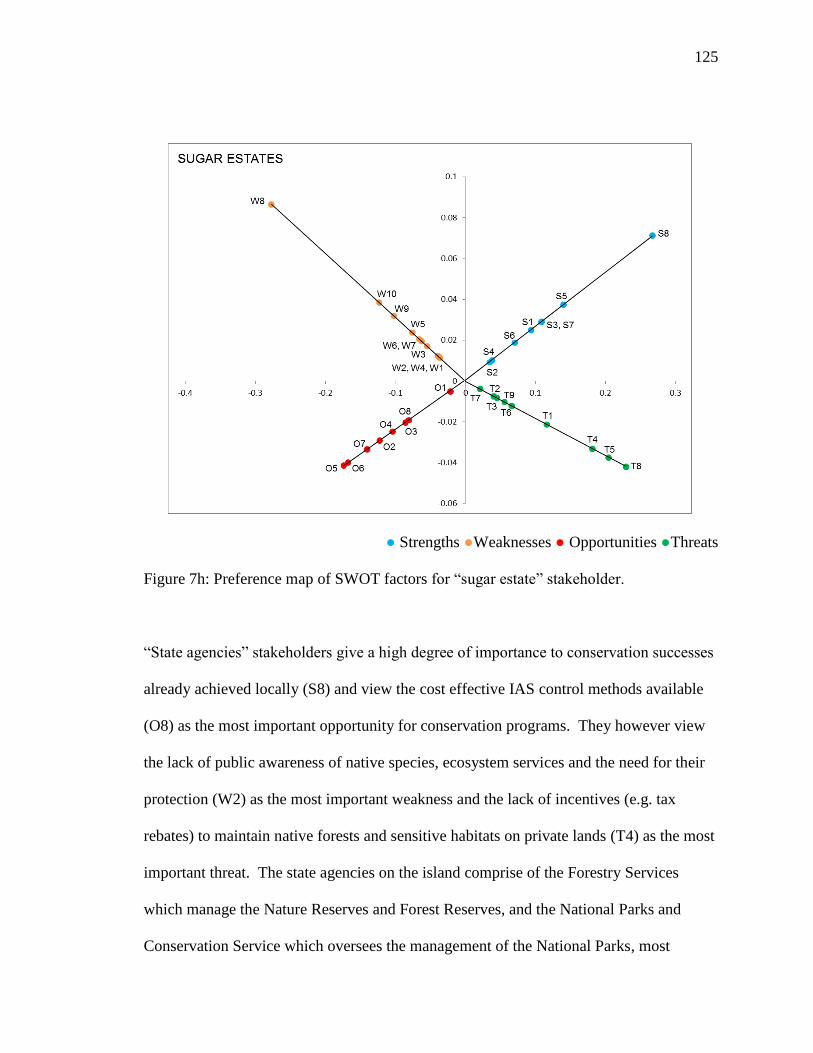
125
● Strengths ●Weaknesses ● Opportunities ●Threats
Figure 7h: Preference map of SWOT factors for “sugar estate” stakeholder.
“State agencies” stakeholders give a high degree of importance to conservation successes
already achieved locally (S8) and view the cost effective IAS control methods available
(O8) as the most important opportunity for conservation programs. They however view
the lack of public awareness of native species, ecosystem services and the need for their
protection (W2) as the most important weakness and the lack of incentives (e.g. tax
rebates) to maintain native forests and sensitive habitats on private lands (T4) as the most
important threat. The state agencies on the island comprise of the Forestry Services
which manage the Nature Reserves and Forest Reserves, and the National Parks and
Conservation Service which oversees the management of the National Parks, most

126
offshore islet Nature Reserves, the Bird Sanctuaries and Ancient Monuments. Low
staffing and budget levels limit the available human resources to invest in consistent
public education programs on conservation and forests. Steinberg (2005) argued that
policy decisions regarding biodiversity conservation require information input from a
range of sources, as opposed to relying on central planners only. They suggested that in
addition to the regular stream of information from scientists, environmental non-profits
and other typical stakeholders, citizens can provide useful ecological information. Thus
for Mauritius, we suggest that using more modern means of engaging the public (for
example social media or smartphone applications) can reduce W2 and leverage public
support. With regards to mitigating or eliminating T4, the PAN project (2009) offers
opportunities to develop bilateral and multi-lateral partnerships with private land owners
and the creation of a future land stewardship council to protect ESAs. These conditions
of the PAN project are still in the works.

127
● Strengths ●Weaknesses ● Opportunities ●Threats
Figure 7i: Preference map of SWOT factors for “state agencies” stakeholder.
The “hunting association” stakeholder group perceived the history of conservation
successes (S8) as the most important strength, similar to the “sugar estate” and “large
corporation” stakeholders. They perceived shortage of skilled local personnel for
successful establishment and management of protected areas on state and private lands
(W10) as the most important weakness, similar to the “non-governmental organization”
stakeholder group, but perceived lack of incentives for conservation on private lands (T4)
and the lack of trust and transparency in multi-partite agreements (T9) as the most
important threats. From Table 1, an estimated 250 km2 of land in Mauritius is used for
deer ranching and deer hunting purposes. Mauremootoo et al. (2003) provide a

128
discussion of the repercussions of deer ranching on native forests, highlighting that
ranchers have cleared tracts of native forests to provide hunters with a clear line of sight,
as well as to create grass pastures. Deer ranching operations stock deer in densities of 70
to 600 heads per km2 and this creates repetitive, destructive and indiscriminate herbivory
pressures on the native vegetation, which has not evolved in the presence of these
animals (Mauremootoo et al., 2003). Our discussion in Chapter 2 recognized that
restoration efforts for forests that are on or near hunting grounds may well require
investment into the setting up of fenced CMAs. The higher costs associated to this form
of conservation project likely influence this stakeholder group’s priority for incentive
packages.

129
● Strengths ●Weaknesses ● Opportunities ●Threats
Figure 7j: Preference map of SWOT factors for “hunting association” stakeholder.
Similar to the “outdoor sports” stakeholder group, the “facilitator” stakeholder group
perceived the national and international commitments made in terms of conservation
targets (S5) as the most important strength. Like the “sugar estate” stakeholder group,
they see the development of economic tools in favor of ecosystem services (O5) as the
most important opportunity. Along with the “environmental consultant” and
“scientist/ecologist” stakeholder groups, they perceive the absence of a land-use master
plan (W4) as the highest priority weakness. Lastly, low staffing and budget levels of
state agencies (T8) were perceived as the most important threat to conservation programs,

130
a priority threat shared by the “non-governmental organization” stakeholder group, the
“outdoor sports” stakeholder group and the “sugar estate” stakeholder group.
● Strengths ●Weaknesses ● Opportunities ●Threats
Figure 7k: Preference map of SWOT factors for “facilitators” stakeholder.

131
From Table 14a, the low staffing and low budget levels of state agencies (T8) is given
high priority four times, whilst absence of consistent land-use planning (W4) and absence
of state monitoring and enforcement on forestlands (W5) are each given high priority
three times. It is very possible that state agencies in Mauritius will never have enough
manpower and financial resources for a fully effective, long-term enforcement of all
protection laws for all forestlands under their jurisdiction. But since those threats and
weaknesses are ranked highly by agriculturalists, outdoor sportspeople, corporations,
sugar estates (private forestland owners), and hunting associations, resolving this conflict
is a key determinant for conservation strategies on the island. Brechin et al. (2002)
argued that it is more practical to negotiate agreements with stakeholders in a way that all
participants view their roles and expectations as legitimate and feasible. They also
suggest that the organizational challenges of biodiversity conservation can be mitigated
with self-enforcement from the part of all stakeholders, as opposed to relying on forced
compliance by the state. In the case of Mauritius building on existing conservation
successes which include the only conservation-oriented public-private partnership (S8)
offers the opportunity for applying the suggestions of Brechin et al. (2002).
Woodford et al. (2016) recognized that a myriad of contrasting perspectives, multiple
objectives, and targeting too many management goals can make resolving issues in policy
and project implementation, difficult. It can be all the more difficult to satisfy every
stakeholder. However, conservation programs can be rendered more efficient when
systems and institutions can mitigate threats and take advantage of opportunities.
Margles et al. (2010) used SWOT AHP to show that it can be a powerful method to

132
engage different stakeholders in an open and transparent process, encouraging
communication of preferences and allowing for both conflict resolution and compromises
in strategies.
Table 14a: Number of times a factor had highest global priority across all groups. Only
factors appearing more than once are given.
Strengths Freq. Weaknesses Freq. Opportunities Freq. Threats Freq.
S8 4 W4 3 O3 3 T8 4
S5 2 W5 3 O5 3 T6 2
S7 2 W10 2 T9 2
Table 14b: Number of times a factor had lowest global priority across all groups. Only
factors appearing more than once are given.
Strength
s
Freq.
Weaknesse
s
Freq.
Opportunitie
s
Freq. Threats Freq.
S8 3 W1 5 O1 5 T5 3
S6 3 W3 3 O2 3 T7 3
S1 2 W2 2 T9 2
S2 2 T1 2
Tables 14a and 14b show that no single factor dominated the stakeholder collective in
terms of highest or lowest priorities. This suggests that SWOT AHP can be a valid

133
complementary method to policy formulation and planning purposes. Even if policies are
typically formulated and implemented within short decision time frames, and are subject
to political pressures as well as legal and bureaucratic barriers (Lach et al. 2003),
adaptive management strategies can still be put in place to cater for shifts in
demographics and economics. Changing environmental, social and economic conditions
can alter stakeholders’ preferences, such that the elicitation of these preferences should
occur at a acceptable frequency. It can be especially beneficial as a means of evaluating
project and policy impacts.

134
References
African Development Bank (2001) Handbook on Stakeholder Consultation and
Participation in ADB Operations. 56 pp. Available from
<http://www.afdb.org/fileadmin/uploads/afdb/Documents/Policy-
Documents/Handbook%20on%20Stakeholder%20Consultaion.pdf>
Alonso, J. A., & Lamata, M. T. (2006). Consistency in the analytic hierarchy process: a
new approach. International journal of uncertainty, fuzziness and knowledge-based
systems, 14(04), 445-459.
Arnstein, S. R. (1969). A ladder of citizen participation. Journal of the American Institute
of planners, 35(4), 216-224.
Baider, C., and Florens, F. B. V. (2011) Control of invasive alien weeds averts imminent
plant extinction. Biological Invasions, 13(12), 2641-2646.
Baider, C., Florens, F. V., Baret, S., Beaver, K., Matatiken, D., Strasberg, D., and
Kueffer, C. (2010, June) Status of plant conservation in oceanic islands of the Western
Indian Ocean. In Proceedings of the 4th Global Botanic Gardens Congress (p. 1).
Brechin, S. R., Wilshusen, P. R., Fortwangler, C. L., & West, P. C. (2002). Beyond the
square wheel: toward a more comprehensive understanding of biodiversity conservation
as social and political process. Society &Natural Resources, 15(1), 41-64.
Climate Investment Funds CIF (2013) Incentivizing the Involvement of the Private
Sector in REDD+. 16pp. Available from
<https://www.climateinvestmentfunds.org/cif/sites/climateinvestmentfunds.org/files/FIP
%20Incentivizing%20Private%20Sector%20Involvement%20in%20REDD+.pdf>

135
Colfer, C. J. P. (2005) The complex forest: communities, uncertainty and adaptive
collaborative management. RFF Press and CIFOR, Washington, D.C., USA and Bogor,
Indonesia.
Dulloo, M. E., Kell, S. P., and Jones, C. G. (2002). Impact and control of invasive alien
species on small islands. International Forestry Review, 4(4), 277-285.
Florens, F. B., & Baider, C. (2013). Ecological restoration in a developing island nation:
how useful is the science?. Restoration Ecology. 211, 1-5.
Florens, F. V. (2016). Biodiversity law: Mauritius culls threatened fruit bats. Nature,
530(7588), 33-33.
Florens, F. V., Mauremootoo, J. R., Fowler, S. V., Winder, L., & Baider, C. (2010).
Recovery of indigenous butterfly community following control of invasive alien plants in
a tropical island’s wet forests. Biodiversity Conservation. 1914, 3835-3848.
Fritsch, O., & Newig, J. (2012). Participatory governance and sustainability: findings of a
meta-analysis of stakeholder involvement in environmental decision making. In
Brousseau, E., Dedeurwaerdere, T., & Siebenhüner, B. (Eds.). Reflexive Governance for
Global Public Goods. MIT Press. Retrieved from
<http://www.jstor.org/stable/j.ctt5vjq3m>
Gardenne, J.H. and Torto, O. (2017) Reintroducing the pink pigeon and echo parakeet in
Mauritius. Birdlife International Africa. Available from
<https://www.birdlife.org/africa/news/reintroducing-pink-pigeon-and-echo-parakeet-
mauritius>

136
Gibson, L., Lynam, A. J., Bradshaw, C. J., He, F., Bickford, D. P., Woodruff, D. S.,
Bumrungsri, S., Laurance, W. F. (2013). Near-complete extinction of native small
mammal fauna 25 years after forest fragmentation. Science, 341(6153), 1508-1510.
GIS (2013) Consultative workshop on Native Terrestrial Biodiversity and National Parks
Draft Bill. Government Information Service Newsletter. Prime Minister’s Office.
Government of Mauritius. Available from
<http://www.gov.mu/English/News/Pages/Consultative-Workshop-on-Native-Terrestrial-
Biodiversity-and-National-Parks-Draft-Bill-.aspx>
Hill, T., Westbrook, R., (1997) SWOT analysis: it's time for a product recall. Long Range
Plan. 30, 46-52
Jolibert, C., and Wesselink, A. (2012) Research impacts and impact on research in
biodiversity conservation: the influence of stakeholder engagement. Environmental
Science and Policy, 22, 100-111.
Jones, C. G., Heck, W., Lewis, R. E., Mungroo, Y., Slade, G., & Cade, T. O. M. (1995).
The restoration of the Mauritius kestrel Falco punctatus population. Ibis, 137(s1).
Lach, D., List, P., Steel, B., Shindler; B. (2003) Advocacy and Credibility of Ecological
Scientists in Resource Decision-making: A Regional Study, BioScience, 53(2):170–178.
Lalljee, B., & Facknath, S.. (2008). A study of the historical and present day changes in
land use profile, and their driving forces in Mauritius. Pages 231–256. In Mrityunjay,
M..J, and Singh, R.B. (Eds). Land use: reflection on spatial informatics agriculture and
development. Concept Publishing Company, New Delhi, India.

137
Margles, S. W., Masozera, M., Rugyerinyange, L., & Kaplin, B. A. (2010). Participatory
planning: Using SWOT-AHP analysis in buffer zone management planning. Journal of
sustainable forestry, 29(6-8), 613-637.
Mauremootoo, J.R. (2003). African Case Study II: Mauritius - a history of degradation
and the beginnings of restoration. Proceedings of the World Parks Congress. Session 4b
and 5b: Invasive alien species. Leads Maj De Poorter and Geoffrey Howard.
Mauremootoo, J.R., Richards, N. & Watt, I. (2003). Mauritius Socio-Economic Drivers.
Unpublished Book Chapter produced for Conservation International’s State of the
Hotspots publication: Madagascar & Indian Ocean Islands. 33pp.
Mcleod, E., Szuster, B., Hinkel, J., Tompkins, E. L., Marshall, N., Downing, T., ... &
Bharwani, S. (2016). Conservation organizations need to consider adaptive capacity: why
local input matters. Conservation Letters, 9(5), 351-360.
Miller, D. C., Agrawal, A., & Roberts, J. T. (2013). Biodiversity, governance, and the
allocation of international aid for conservation. Conservation Letters, 6(1), 12-20.
Ministry of Environment and National Development Unit MOENDU (2008) Study on
Environmentally Sensitive Areas. Unpublished report. Port Louis. Mauritius.
Moon, K., Blackman, D. A., & Brewer, T. D. (2015) Understanding and integrating
knowledge to improve invasive species management. Biological invasions, 17(9), 2675-
2689.
Mott McDonald for the Government of Mauritius (2012) Maurice Ile Durable Policy,
Strategy and Action Plan. Ministry of Environment and Sustainable Development.
138
Government of Mauritius. Available from <
http://www.gov.mu/portal/sites/mid/file/full%20report%20midpolicy.pdf>
Myers, N., Mittermeier, R. A., Mittermeier, C. G., da Fonseca, G. A. B., and Kent, J.
(2000) Biodiversity hotspots for conservation priorities. Nature, 403, 853-858.
National CSR Foundation (2017) NGOs – Non Profit Organisations. Available from
<https://www.ncsrfoundation.org/organizations/>
NBSAP (2006) National biodiversity strategic action plan 2006 – 2015. Réduit,
Mauritius. 136 pp.
NIASSAP (2009) National Invasive Alien Species Strategy and Action Plan 2009-2018.
Mauritius. 70pp.
Norder, S. J., Seijmonsbergen, A. C., Rughooputh, S. D., van Loon, E. E., Tatayah, V.,
Kamminga, A. T., & Rijsdijk, K. F. (2017). Assessing temporal couplings in social–
ecological island systems: historical deforestation and soil loss on Mauritius (Indian
Ocean). Ecology and Society, 22(1).
Ostrom, E., Burger, J., Field, C. B., Norgaard, R. B., & Policansky, D. (1999) Revisiting
the commons: local lessons, global challenges. science, 284(5412), 278-282.
Page, W. S., and D'Argent, G. (1997). A survey of Mauritius (Indian Ocean) to identify
priority rainforest areas for conservation management. Mauritius: Mauritius Wildlife
Foundation. Unpublished report.
Pimentel, D., C. Harvey, P. Resosudarmo, K. Sinclair, D. Kurz, M. McNair, S. Crist, L.
Shpritz, L. Fitton, R. Saffouri, & Blair, R. (1995) Environmental and economic costs of
soil erosion and conservation benefits. Science. 267(5201):1117–1123.
139
Ramirez, S., Dwivedi, P., Bailis, R., & Ghilardi, A. (2012). Perceptions of stakeholders
about non-traditional cookstoves in Honduras. Environmental Research Letters, 7(4),
044036.
Robards, M. D., Schoon, M. L., Meek, C. L., & Engle, N. L. (2011). The importance of
social drivers in the resilient provision of ecosystem services. Global Environmental
Change, 21(2), 522-529.
S50L Income Tax Act of the Republic of Mauritius, Act 16 of 1995. Available from
<http://www.mra.mu/download/ITA1995-180615.pdf>
Saaty, T.L., (1977) Scenarios and priorities in transport planning: Application to the
Sudan. Transportation Research. 11(5), 343-350.
Saaty,T.L. (2001)The seven pillars of the analytical hierarchy process. In:Saaty,T.L.,
Vargas,L.G.(Eds.),Models, Methods, Concepts & Applications of Analytical Hierarchy
Process. Kluwer Academic Publisher, Dordrecht, Netherlands, pp.27–46.
Sardo, A. M., & Weitkamp, E. (2017). Environmental consultants, knowledge brokering
and policy-making: a case study. International Journal of Environmental Policy and
Decision Making, 2(3), 221-235.
Secretariat of the Convention on Biological Diversity (2011) NBSAP training modules
version 2.2 – Module 2. Using the Biodiversity Planning Process to Prepare or Update a
National Biodiversity Strategy and Action Plans. Montreal, June 2011.
Shrestha, R. K., Alavalapati, J. R., & Kalmbacher, R. S. (2004). Exploring the potential
for silvopasture adoption in south-central Florida: an application of SWOT–AHP method.
Agricultural Systems, 81(3), 185-199.

140
Steinberg, P. F. (2005). From public concern to policy effectiveness: civic conservation
in developing countries. Journal of International Wildlife Law and Policy, 8(4), 341-365.
Teelucksingh, S., Nunes, P.A.L.D. & Perrings, C. (2013) Biodiversity-based
development in Small Island Developing States. Environment and Development
Economics, 18, 381–391.
The Native Terrestrial Biodiversity And National Parks Act 16 of 2015. Available from
<http://agriculture.govmu.org/English/Documents/Acts%20and%20Regulation/Native%2
0Terrestrial%20BD%20and%20National%20Parks%20Act%202015.pdf>
UNDP (2014) Social and Environmental Standards. 60pp. Available from
<http://www.undp.org/content/undp/en/home/librarypage/operations1/undp-social-and-
environmental-standards.html>
UNDP-GEF (2009) Expanding coverage and strengthening management effectiveness of
the protected area network on the island of Mauritius. UNDP Project document. PIMS
1749, GEF Project ID 3526. Unpublished report.
Waldron, A., Mooers, A. O., Miller, D. C., Nibbelink, N., Redding, D., Kuhn, T.S.,
Roberts, J.T., Gittleman, J.L. (2013). Targeting global conservation funding to limit
immediate biodiversity declines. Proceedings of the National Academy of Sciences,
110(29), 12144-12148.
Wapner, P. (1995). Politics beyond the state environmental activism and world civic
politics. World Politics, 47(3), 311-340.

141
Woodford, D. J., Richardson, D. M., MacIsaac, H. J., Mandrak, N. E., van Wilgen, B.
W., Wilson, J. R., & Weyl, O. L. (2016). Confronting the wicked problem of managing
biological invasions. NeoBiota, 31, 63.

142
5 CONCLUSION, POLICY IMPLICATIONS & FUTURE WORK
5.1 Environmental Policy Implications
Local experts and agency representatives consulted during the focus group meetings
suggested that various state-owned and state-managed sites on the island may be subject
to entry fees in the near future. Buckley (2003) provided a thorough discussion of entry
fee systems for parks. He recognized that land managers may charge visitors for general
admission into the park, access to specific areas or fees for specific activities such as
climbing. State agencies in Mauritius do not allow camping or overnight stays on public
forest lands but private landowners can provide facilities for lodging, camping,
mountaineering, rafting, diving, in addition to existing facilities for quad biking or
horseback riding. Buckley (2003) also pointed out that managers can issue permits for
commercial tour operators and charge at the application, licensing and renewal processes.
Private nature-tourism operators on the island charge fees from visitors for guided and
non-guided hikes, whilst visitors to public lands can hire a freelance guide for their trips
and pay the guide directly. If state agencies wish to capitalize on guided tours, they can
hire their own guides or train rangers to provide this service, against a fee. Commonly,
however, visitor fees are understood to refer to charges imposed by landowners and land
management agencies on either independent visitors or commercial tour operators and
their clients, for entry, admission, overnight stays, recreational activities and tours,
educational walks and talks or use of recreational and/or educational facilities.

143
Competitiveness of state-managed sites can be increased by investing in visitor-friendly
amenities at points of entry, e.g. security personnel or cameras for parking lots, guides
and customer service representatives, regular garbage collection and modern restrooms.
Designing packages for repeat visitation could be beneficial in encouraging paid-visits.
In Section 5.2 we highlight that different sites have different appeal to domestic and
international visitors, with some sites being more popular than others. In Section 1.6.5
we also point out that some forest areas are not easily accessible to visitors, either
because the access track is small and unmarked, or the area is specifically restricted.
With regards to funds raised through entry fees, there are two possible policy alternatives.
Firstly, state-managed and privately-managed sites collect funds for direct use at the site
of interest. Secondly, an approach similar to that used by the United States National
Parks Service (USNPS) can be employed, where sites retain 80% of visitor-generated
revenues, and divert remaining 20% to a centralized pot of money for disbursement to
other national parks’ projects (Calfas, 2017). Ensuring that a portion of funds goes to a
centralized system may allow forest areas that do not or cannot get regular visitors, still
benefit from a cash influx.
With regards to the use of funds generated from entry fees, our premise is for funds to be
directed towards forest restoration efforts. Even if favoring active invasive plant species
weeding has proven to be effective, there are scenarios that may call for more material
and labor intensive protection in the form of fenced CMAs. Mauremootoo (2017) reports
that total fencing cost were at USD 70 per running meter in 2003 (USD 110 when
adjusted to 2017 prices; and using an exchange rate of USD 1 = MUR 36). He also

144
recognizes that fencing would be appropriate in areas with high deer and pig densities –
e.g. in or near deer ranching lands, and in areas where land managers seek to control
public access.
With regards to sources of funds for restoration, we used the study to advocate for entry
fees as a sustainable way to raise money, but this should not come at the expense of
efforts to secure research grants, international aid, corporate social responsibility funding
or encouraging more effective, efficient and equitable allocation of Government funds.
The roles and functioning of the FS and NPCS were not discussed in detail in this thesis,
but suffice to say both agencies have a significant amount of overlap in their duties and
jurisdictional range but differing budget allocations and staff levels, to the point that one
way to consolidate use of scarce funds may well be merging these two similar state
agencies.
The International Union for the Conservation of Nature (IUCN) has established
categories for protected areas with a breakdown of permissible activities ranging from
strict protection to sustainable uses (Dudley, 2008). Currently the national parks and
nature reserves of the island are not integrated within an IUCN-style classification.
Given the small size of the island, land use classifications around protected areas will
have to accommodate the relative closeness of a range of operations to public forest
lands. A properly defined sustainable land use classification can allow state agencies or
private contractors to rent out equipment, operate transport and accommodation facilities,
as well as retail shops, within the parks or near nature reserves. Other sources of income

145
can come from licensing for commercial activities such as filming, bee-keeping and
sports competitions.
Our findings in Chapter 3 show that even conservative estimates of travel cost and total
visitor count yield a high recreation value for Mauritian forests. Whether the user
demand wanes between simple daily recreation, to infrequent sophisticated forms of
recreation, there are clear benefits to be gained by protecting forested areas and investing
in sustainable nature-tourism practices. State managers can tap into the demand for
outdoor recreation through entry fees and any of a number of possible activities,
generating jobs in the process and offsetting, at least in part, conservation costs. Private
forestland owners are already investing in a growing outdoor recreation culture and
coupling these to local food, crafts and outdoor gear businesses. It is important for
private land owners to also invest the returns in conserving the main raw material of their
industry through conservation management of their forests. Maintaining demand for
forest recreation and discovery is centered on improving annual visit rates. Our results
suggest that this can be achieved with investments in public education and awareness
campaigns on the value of forests to Mauritian society, as well as promoting public
identification and appreciation of native species. Visit rates can also be improved by
promoting greater understanding of the participatory role of residents in conservation and
improving communication from forest managers on their work and challenges. From
education, sensitization and communication standpoints, the use of smartphone
applications and social media are severely limited or non-existent, especially from state
agencies. Minin et al. (2015) argued for using social media to gather visitor-supplied
146
data on spatio-temporal changes in ecosystems, values attached to a site, and activities
carried out by different groups of people in a natural area, to inform conservation science.
They suggest that engaging social media users can create more awareness and become a
campaigning platform for biodiversity-related issues. They also recognized that social
media data comes with posters’ biases and knowledge limitations, but can act as a viable
complement to existing research and nature communication programs.
The 2017-2020 Black River Gorges Management Plan is a key policy instrument, but
provides no information on the methodology and validity of the studies used for their
reported willingness to pay values. Chapter 2 and 3 of this thesis on the other hand
provide a means to replicate our studies, and improve the findings by collecting a larger
data sample and from a wider array of forested areas. Our findings and methodologies
are a much better fit for forest management plans, both for public and private forestlands.
In Chapter 4, we show that SWOT AHP presents a much more robust analysis of
stakeholder preferences with the potential of adjusting project or policy deliverables
accordingly. Our findings show that state and private landowners favor expansion of
existing nurseries and the setting up of new ones to increase re-afforestation programs.
They also see corporate social responsibility and nature-based tourism as viable strategies
to tap into. For scientists, conservation policy should be driven by management of
invasive alien species. Other stakeholders view their continued participation in
conservation policy formulation as a strong factor to keep building upon, but seek to
address the lack of legal enforcement in forestlands as well as development threats to
environmentally sensitive areas. Overall, stakeholder needs and priorities can conflict
147
one another, or matching one set of preferences can have unforeseen consequences on
project or policy outcomes. Nonetheless the merits of gaining deeper, more detailed
insights out of stakeholder engagement cannot be understated. We argue that
conservation strategies can integrate multiple management versions based on SWOT
AHP outcomes and obtain better stakeholder buy-in than a one-size-fits-all solution. For
example, given the priority given to expansion of native plant nurseries, nature-based
tourism and dealing with the lack of skilled personnel for protected area management,
this suggests that significant support can be generated for the creation of green jobs as
horticulture specialists, nature-tourism guides and forest managers. The high priority
given to corporate social responsibility as a source of funds suggests that corporations
may be open to increasing their legally-defined contribution. The limitations of the
current formulation of the CSR program are discussed in Section 5.2. With regards to
establishing partnerships, stakeholders have shown a bias towards relying on the
involvement of state agencies and large forest land owners. We suggest that community
organizations living near forestlands of interest can and should be encouraged to act as a
stakeholder group. Opportunities exist for villages and townships to partner with the FS,
NPCS and private forestland owners to develop green businesses, green jobs and promote
environmental stewardship and education.

148
5.2 Study Limitations & Future work
Chapter 2 focused on the use of contingent valuation. Arrow et al. (1993) provide a
thorough discussion of the CV methodology and its limitations. Our formulation of the
contingent valuation hypothetical market focused on the direct use of the forest areas for
recreation. This iteration of the study did not address the recreation value attached to
forest areas by people who were not at the site on survey days. The analysis can benefit
from more data collection streams that extend findings to domestic and international
visitors at non-forested areas (food courts, supermarkets, shopping centers, beaches,
hotels, city and town centers, museums). Any additional surveys should also attempt to
collect data during peak visitor season, between September and January and assess if
WTP values differ from those expressed by off-peak visitors. Our findings are also in
response to the model chosen in this study such that using other regression forms or
factorial analysis will yield different explanatory relationships.
With financing conservation, the transparency of allocating funds relies for the most part
on self-monitoring, be it for private or public land owners/managers. It is also likely that
more popular sites may raise more income during the year, than less popular or less
accessible sites. A week’s worth of survey days at Vallee d’Osterlog forest area (Site 8
in Figure 4) yielded only two responses. The site’s staff reported not seeing as many
visitors as the more popular National Parks, even during peak visitor season. Even if the
site is stated owned, and has high ecological value, access to the site is limited by an
unsurfaced and unmarked private road. Relying on entry fees here as a source of funding
for conservation may not be a viable option, until the site is more popularized and access

149
is facilitated. Having entry fees at sites that are currently free does pose problems of
discrimination against low income people. Managing the money flow entails
administrative work, but also poses the risk that prioritizing revenue can come at the
expense of resource protection. Setting up an entry fee system, or increasing existing
fees can also be a hassle and an inconvenience to visitors.
The travel cost study presented in Chapter 3 targeted only domestic visitors at the sites
elucidated in Figure 5. Future travel cost surveys should target a wider range of residents
at off-site locations to get a closer-to-reality reflection of people’s forest-visiting habits.
Future surveys should also be carried out during peak visitor seasons between September
and January to cover year-long trends. A more important future extension of this work is
to create and administer a survey targeting tourists travel costs and preferences with
regards to forested areas on the island. A tourist-targeted travel cost survey will seek to
collect information on country of origin, costs of international travel, frequency of visits
to the country, frequency of visits to forest areas, preferred residence whilst on the island,
and any related spending and socio-demographics similar to those queried for Chapter 3.
Repanshek (2010) reported that for 2010 the USNPS spent half of the revenues parks
collected on asset repairs and maintenance; about 20% on visitor services; another 20%
on administration and operations. He reported that only about ten percent of revenues get
directed to habitat restoration activities. This suggests that on the island too, public and
private forest managers may have pressing repair and maintenance needs (e.g. bridges,
tracks, access vehicles) that can pre-dominate the allocation of funds raised from entry
fees, at the expense of forest conservation and restoration work. Future economic

150
assessments of forest management on the island will benefit from cost benefit
assessments measuring revenue trends against predicted expenses (infrastructure,
conservation, visitor services) that apply to different sites.
With regards to the use of CSR funds for conservation activities, the Government budget
2016/2017 proposed the creation of a National CSR Foundation under the aegis of the
Ministry of Social Integration and Economic Empowerment and which will be led by
Directors from the public sector, the private sector and civil society (Ministry of Finance,
2016). The CSR framework was modified such that corporations are now required to
have 50 to 75% of their mandated 2% profit allocation, disbursed to the Foundation. The
Foundation’s priority areas are listed as poverty alleviation, educational support, social
housing, supporting people with severe disabilities; dealing with health problems
resulting from substance abuse and poor sanitation; and providing protection to victims of
domestic violence (Ministry of Finance, 2016). Thus, only between 25 to 50% of CSR
money can be made directly available for biodiversity and forest conservation projects,
subject to the corporation’s choice. This implies that CSR money may not be as easily
available for conservation financing as some stakeholders might expect.
Chapter 4 relied on a focus group meeting and subsequent in-person interviews with
stakeholders willing to participate in the study between May and August 2015. Time
constraints and scheduling conflicts filtered out many stakeholders. The interview
process itself is a lengthy means of gathering SWOT AHP data. Margles et al. (2010)
used group sessions between stakeholders to collectively establish factor priorities.
Putting stakeholders into small groups to discuss priorities can eliminate issues of biases

151
and subjectivity in stakeholders’ choices and preferences. Use of software like Expert
ChoiceTM can also drastically reduce the time it takes to compute priorities. Future
application of SWOT AHP should target a larger number of participants and include
randomly selected members of the public as a stakeholder group. SWOT AHP as a
methodology is not for exclusive application to biodiversity and conservation related
policy but rather a tool that can engage stakeholders for a wide array of national projects.

152
References
Arrow, K., Solow, R., Portney, P. R., Leamer, E. E., Radner, R., & Schuman, H. (1993).
Report of the NOAA panel on contingent valuation. Federal register, 58(10), 4601-4614.
Buckley, R. (2003). Pay to play in parks: An Australian policy perspective on visitor fees
in public protected areas. Journal of Sustainable Tourism, 11(1), 56-73.
Calfas, J. (2017) It may cost $70 to visit popular national parks like Grand Canyon soon.
Available from <http://time.com/money/4995704/national-park-service-higher-
admission-fees/>
Di Minin, E., Tenkanen, H., & Toivonen, T. (2015). Prospects and challenges for social
media data in conservation science. Frontiers in Environmental Science, 3, 63.
Dudley, N. (Editor) (2008). Guidelines for Applying Protected Area Management
Categories. Gland, Switzerland: IUCN. 86pp.
Ministry of Finance (2016) The New Corporate Social Responsibility (CSR) Framework.
Government of Mauritius. Available from
<http://mof.govmu.org/English/Documents/New%20CSR%20Franework%202016.pdf>
Repanshek, K. (2010). Entrance Fees Generate Hundreds of Millions of Dollars A Year
for National Park Service. Traveller. Available from
<https://www.nationalparkstraveler.org/2010/02/entrance-fees-generate-hundreds-
millions-dollars-year-national-park-service5360>

153
Appendix I
SURVEY OF VISITORS TO PRIVATE ECO-TOURISM SITES AND THEIR
PERCEPTIONS AND VALUE ATTACHED TO NATIVE FORESTS
Hello! I’m Pricila Iranah, a doctoral candidate at Montclair State University in the
United States. We are inviting you to participate in a survey about native forest
management in Mauritius. I have randomly approached you. Your answers will inform
us about your perceptions and values attached to native forest conservation.
Mauritius, is exposed to unique challenges that impact upon how much conservation is
done. They also affect how successful conservation is. The objective of this research is
to determine the value attached to native forests on state and private lands.
We designed this survey to estimate your willingness to pay for forest conservation in
places you visit. A hypothetical scenario has been created. It suggests what an extra
amount will contribute to.
The response you provide in this survey is strictly confidential. Final results will be in
summary form only. No individual answers can be identified. This survey is voluntary.
However, you can help us immensely by taking about 10 minutes to complete the survey.
There is no right or wrong answer – we are interested in your opinions. You can
terminate the interview whenever you want without consequences.
If you have any question or comment about the study, please contact: Pricila Iranah,
Doctoral Candidate, phone: +230.5814.1974, email: [email protected], or Dr
Pankaj Lal, Assistant Professor Environmental Economics, phone: +1-973-655-3137,
email: [email protected]. Address for both is Department of Earth and

154
Environmental Studies, Montclair State University, 1, Normal Avenue, Montclair NJ
07043, USA. Site: _______________________________________

155
SECTION II – GENERAL QUESTIONS
Please circle one number from the scale of 5 (Extremely
familiar) to 1 (Not at all familiar). Not at all
familiar
Slightly
familiar
Moderatel
y familiar
Very
familiar
Extremely
familiar
1. “Native” forests are natural areas with species that came to
an area naturally, often long before humans. How familiar
are you with the term “native forest”?
1 2 3 4 5
2. The term “ecosystem” describes the whole unit that links
plants and animals to their non-living environment (soils,
water). It includes the relationships between the different
components. How familiar are you with the term
“ecosystem”?
1 2 3 4 5
3. The term “ecosystem services” describes the goods and
services that nature provides directly or indirectly. These
benefit humans e.g. oxygen production, freshwater, soil
fertility, timber, wild fruits. How familiar are you with the
term “ecosystem services”?
1 2 3 4 5
4. Invasive Alien Species (IAS) are species introduced by
humans in areas where they do not naturally occur. They
spread to such an extent that they threaten the native
biological diversity. How familiar are you with the term
“invasive species”?
1 2 3 4 5
5. Select which of the following are invasive species according to you.
Strawberry Guava □ Ravenale □ Trochetia □ Bois de Ronde □ Pic pic □ Monkeys □ Deer □ Bats □
6. Please rate how important each of the following goods and
services are for you. Circle one number from the scale of 5
(Highly important) to 1 (Least important)
Least
Importa
nt
Somewha
t
Importan
t
Highly
Importan
t
Good supply of clean water 1 2 3 4 5
Less storm runoff. Flood control 1 2 3 4 5
Lessen impacts of changing climate 1 2 3 4 5
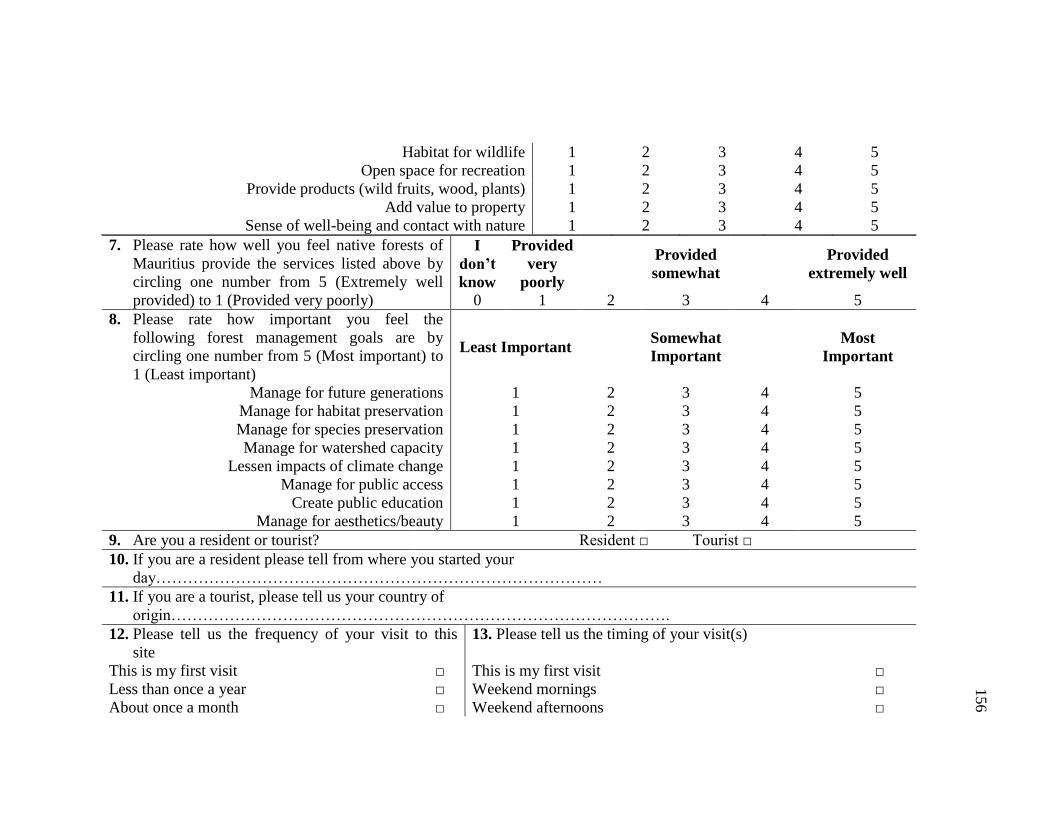
156
Habitat for wildlife 1 2 3 4 5
Open space for recreation 1 2 3 4 5
Provide products (wild fruits, wood, plants) 1 2 3 4 5
Add value to property 1 2 3 4 5
Sense of well-being and contact with nature 1 2 3 4 5
7. Please rate how well you feel native forests of
Mauritius provide the services listed above by
circling one number from 5 (Extremely well
provided) to 1 (Provided very poorly)
I
don’t
know
Provided
very
poorly
Provided
somewhat
Provided
extremely well
0 1 2 3 4 5
8. Please rate how important you feel the
following forest management goals are by
circling one number from 5 (Most important) to
1 (Least important)
Least Important Somewhat
Important
Most
Important
Manage for future generations 1 2 3 4 5
Manage for habitat preservation 1 2 3 4 5
Manage for species preservation 1 2 3 4 5
Manage for watershed capacity 1 2 3 4 5
Lessen impacts of climate change 1 2 3 4 5
Manage for public access 1 2 3 4 5
Create public education 1 2 3 4 5
Manage for aesthetics/beauty 1 2 3 4 5
9. Are you a resident or tourist? Resident □ Tourist □
10. If you are a resident please tell from where you started your
day…………………………………………………………………………
11. If you are a tourist, please tell us your country of
origin………………………………………………………………………………….
12. Please tell us the frequency of your visit to this
site
13. Please tell us the timing of your visit(s)
This is my first visit □ This is my first visit □
Less than once a year □ Weekend mornings □
About once a month □ Weekend afternoons □

157
Several times a week □ Weekday mornings □
Every day □ Weekday afternoons □
14. Please tell us the purpose of your visit 15. Please select how you came to the site
Scientific interest / Research □ Family car □
Sports, Exercise and Fitness □ Minivan □
Enjoy nature and outdoors □ Walking □
Socialize with friends and family □ Bus □
Reduce stress □ Bicycle □
Collect wild fruits for own use □ Motorbike □
Collect wild fruits for commercialization □ 16. Please tell us if you are here by yourself or as a group
Other (please specify) □ I am here by myself □
17. Please tell us how long you expect your visit to
last.
I am here with ……………… adults
More than 4 hours □ I am here with ………….. teens under 18.
2 to 4 hours □
More than 1 hour but less than 2 hours □
30 to 60 minutes □
Less than 30 minutes □
I don’t know □
18. Please rate how well you agree with the following
statements, circling one number from 5 (Strongly
Agree) to 1 (Strongly disagree)
I don’t
know
I do not
agree
Somewhat
Agree
Strongly
Agree
Forests in Mauritius, are well protected 0 1 2 3 4 5
Native species are at risk of extinction 0 1 2 3 4 5
Only professionals should decide how the park should
be managed 0 1 2 3 4 5
I am well informed about biodiversity loss in
Mauritius 0 1 2 3 4 5
I always consider the environmental quality of site
before visiting 0 1 2 3 4 5

158
Conservation of biodiversity is a moral obligation 0 1 2 3 4 5
Biodiversity loss will affect the country’s economy 0 1 2 3 4 5
Biodiversity is essential for production of goods and
medicine 0 1 2 3 4 5
19. Please select which of the following do you think are causes of biodiversity loss in Mauritius
Intensive
farming
□ Deforestation □ Invasive Alien
Species
□ Other
(specify)…………………………………
Climate
change
□ Over-population □ Water pollution □
Air pollution □ Roads and
buildings □
Cyclones □
20. Please rate these four areas in terms of their relative importance for Government spending, with 1 being the most
important, 2 is the next most important, 3 is the third most important and 4 is the least important.
Education ………….. Crime …………. Environment ………. Unemployment ………….
SECTION III – WILLINGNESS TO PAY
Native forests are an important source of oxygen and freshwater for everyone on the island. However our forests are heavily
threatened by invasive alien species, deforestation and degradation. Managing and restoring forests costs money, but the
benefits are a lot more. Restoration is not difficult. But it requires tools and labor. If nothing is done, the forest becomes a
plantation of one or a few invasive species only. We lose forest function and diversity. Prior studies have shown that there
is a significant difference between what people SAY they would be willing to pay, and what they would ACTUALLY pay.
Please pretend that the choice offered to you in the next question is real. Please provide an honest answer, keeping in mind
your own budget. You have paid an entry fee for this site. The money go mainly for site maintenance and salaries. To
enable a greater extent of forest restoration an extra amount on the entry fee, in the form of a conservation levy, would be
helpful. This levy would raise funds for the land owners/managers to remove invasive alien species faster and over a larger
area. This would help native forest recover more quickly and increase the quality and quantity of ecosystem goods and
services.
21. Would you be willing to pay an EXTRA MUR [10%, 25%, 50%, 75%, 100%] per person to enter this site? Yes □
No □
22. If you have are not willing to pay an extra fee, please tell us why.
I don’t believe that the funds will go to conservation of the forest □
The entry fee is already expensive for me □

159
I do not have the financial capability to invest in conservation □
I do not care for biodiversity issues □
The government should pay □
Only the owners or big corporations should pay □
I do not think that our forests and biodiversity are at risk □
The benefits are too distant/I don’t care for future generations □
I don’t have enough information about the threats to forests and the conservation measures □
Other (please specify) …………………………………………………………….
SECTION IV – BACKGROUND INFORMATION
23. Please select your age
group
18-29 30-39 40-49 50-59 Above 60
□ □ □ □ □
24. Gender 25. Please select your ethnicity
Male □ Franco-
Mauritian
Indo-
Mauritian
Sino-
Mauritian
Creol
e
Caucasian Asian Prefer not to
answer Female □
□ □ □ □ □ □ □
26. Please select the highest level of schooling
you have completed.
27. Please select the category best representing your supervisory role:
Certificate of Primary Education □ I do not supervise □
School Certificate □ I am the lead worker in my unit □
Higher School Certificate /Baccalaureate □ I supervise a single unit of employees □
Trade/technical/vocational diploma □ I supervise two or more units, each unit having an individual
supervisor □
Bachelor’s degree □ I supervise a major division of an agency or department □
Masters degree □ I supervise an entire agency or department □ Doctoral degree □ I supervise more than one agency or department □
Prefer not to answer □
28. Please identify your marital status Single □ Married □ Divorced/Separated □ Partnership □ Widowed □
29. Number of children? None □ 1 □ 2 □ More than 2 □
30. If you are a resident please identify your monthly
income bracket.
31. If you are a tourist, please identify your annual household
income bracket. Country’s currency:

160
…………………………
Less than or equal to MUR 5,000 □ Less than 10,000 □
MUR 5,001 to MUR 15,000 □ 10,001 to 30,000 □
MUR 15,001 to MUR 30,000 □ 30,001 to 50,000 □
MUR 30,001 to MUR 50,000 □ 50,001 to 100,000 □
MUR 50,001 to MUR 100,000 □ More than 100,000 □
More than MUR 100,000 □ Country currency …………………………….

161
SURVEY OF VISITORS TO STATE FORESTS AND THEIR PERCEPTIONS
AND VALUE ATTACHED TO NATIVE FORESTS
Hello! I’m Pricila Iranah, a doctoral candidate at Montclair State University in the
United States. We are inviting you to participate in a survey about native forest
management in Mauritius. I have randomly approached you. Your answers will inform
us about your perceptions and values attached to native forest conservation.
Mauritius, is exposed to unique challenges that impact upon how much conservation is
done. They also affect how successful conservation is. The objective of this research is
to determine the value attached to native forests on state and private lands.
We designed this survey to estimate your willingness to pay for forest conservation in
places you visit. A hypothetical scenario has been created. It suggests what an extra
amount will contribute to.
The response you provide in this survey is strictly confidential. Final results will be in
summary form only. No individual answers can be identified. This survey is voluntary.
However, you can help us immensely by taking about 10 minutes to complete the survey.
There is no right or wrong answer – we are interested in your opinions. You can
terminate the interview whenever you want without consequences.
If you have any question or comment about the study, please contact: Pricila Iranah,
Doctoral Candidate, phone: +1-973-655-3456, email: [email protected], or
Dr Pankaj Lal, Assistant Professor Environmental Economics, phone: +1-973-655-3137,
email: [email protected]. Address for both is Department of Earth and

162
Environmental Studies, Montclair State University, 1, Normal Avenue, Montclair NJ
07043, USA. Site: _____________________________________________________

163
SECTION II – GENERAL QUESTIONS
Please circle one number from the scale of 5 (Extremely familiar)
to 1 (Not at all familiar). Not at all
familiar
Slightly
familiar
Moderately
familiar
Very
familiar
Extremely
familiar
1. “Native” forests are natural areas with species that came to an
area naturally, often long before humans. How familiar are you
with the term “native forest”?
1 2 3 4 5
2. The term “ecosystem” describes the whole unit that links plants
and animals to their non-living environment (soils, water). It
includes the relationships between the different components.
How familiar are you with the term “ecosystem”?
1 2 3 4 5
3. The term “ecosystem services” describes the goods and
services that nature provides directly or indirectly. These
benefit humans e.g. oxygen production, freshwater, soil
fertility, timber, wild fruits. How familiar are you with the
term “ecosystem services”?
1 2 3 4 5
4. Invasive Alien Species (IAS) are species introduced by humans
in areas where they do not naturally occur. They spread to such
an extent that they threaten the native biological diversity.
How familiar are you with the term “invasive species”?
1 2 3 4 5
5. Select which of the following are invasive species according to you.
Strawberry Guava □ Ravenale □ Trochetia □ Bois de Ronde □ Pic pic □ Monkeys □ Deer □ Bats □
6. Please rate how you value each of the following goods and
services by circling one number from the scale of 5 (Highly
valued) to 1 (Least valued)
Least
Valued
Somewhat
valued
Highly
valued
Good supply of clean water 1 2 3 4 5
Less storm runoff. Flood control 1 2 3 4 5
Lessen impacts of changing climate 1 2 3 4 5
Habitat for wildlife 1 2 3 4 5
Open space for recreation 1 2 3 4 5
Provide products (wild fruits, wood, plants) 1 2 3 4 5

164
Add value to property 1 2 3 4 5
Sense of well-being and contact with nature 1 2 3 4 5
7. Please rate how well you feel native forests of
Mauritius provide the services listed above by
circling one number from 5 (Extremely well
provided) to 1 (Provided very poorly)
I
don’t
know
Provided
very
poorly
Provided
somewhat
Provided
extremely
well
0 1 2 3 4 5
8. The nature reserves and national parks of Mauritius are
managed by the Forestry Service and the National Parks and
Conservation Service of the Government. Please rate how
important you feel the following management goals are by
circling one number from 5 (Most important) to 1 (Least
important)
Least
Important
Somewhat
Important
Most
Important
Manage for future generations 1 2 3 4 5
Manage for habitat preservation 1 2 3 4 5
Manage for species preservation 1 2 3 4 5
Manage for watershed capacity 1 2 3 4 5
Lessen impacts of climate change 1 2 3 4 5
Manage for public access 1 2 3 4 5
Create public education 1 2 3 4 5
Manage for aesthetics/beauty 1 2 3 4 5
9. Are you a resident or tourist? Resident □ Tourist □
10. If you are a resident please tell from where you started your day
……………………………………………………………………
11. If you are a tourist, please tell us your country of origin
…………………………………………………………………………
12. Please tell us the frequency of your visit to the park 13. Please tell us the timing of your visit(s)
This is my first visit □ This is my first visit □
Less than once a year □ Weekend mornings □
About once a month □ Weekend afternoons □
Several times a week □ Weekday mornings □

165
Every day □ Weekday afternoons □
14. Please tell us the purpose of your visit 15. Please select how you came to the park
Scientific interest / Research □ Family car □
Sports, Exercise and Fitness □ Minivan □
Enjoy nature and outdoors □ Walking □
Socialize with friends and family □ Bus □
Reduce stress □ Bicycle □
Collect wild fruits for own use □ Motorbike □
Collect wild fruits for commercialization □ 16. Please tell us if you are here by yourself or as a group
Other (please specify) □ I am here by myself □
17. Please tell us how long you expect your visit to last. I am here with ……………… adults
I am here with ………….. teens under 18.
More than 4 hours □
2 to 4 hours □
More than 1 hour but less than 2 hours □ Less than 30 minutes □
30 to 60 minutes □ I don’t know □
18. Please rate how well you agree with the following
statements, circling one number from 5 (Strongly Agree) to
1 (Strongly disagree)
I don’t
know
I do
not
agree
Somewhat
Agree
Strongly
Agree
Forests in Mauritius are well protected 0 1 2 3 4 5
Native species are at risk of extinction 0 1 2 3 4 5
Only professionals should decide how the park should be
managed 0 1 2 3 4 5
I am well informed about biodiversity loss in Mauritius 0 1 2 3 4 5
I always consider the environmental quality of site before
visiting 0 1 2 3 4 5
Conservation of biodiversity is a moral obligation 0 1 2 3 4 5

166
Biodiversity loss will affect the country’s economy 0 1 2 3 4 5
Biodiversity is essential for production of goods and medicine 0 1 2 3 4 5
19. Please select which of the following do you think are causes of biodiversity loss in Mauritius
Intensive farming □ Deforestation □ Invasive Alien Species □
Climate change □ Over-population □ Water pollution □
Air pollution □ Building of roads and buildings □
Cyclones □ Other
(specify)……………………………………………………………………………
20. Please rate these four areas in terms of their relative importance for Government spending, with 1 being the most
important, 2 is the next most important, 3 is the third most important and 4 is the least important.
Education ………….. Crime …………. Environment ………. Unemployment ………….
SECTION III – WILLINGNESS TO PAY
Native forests are an important source of oxygen and freshwater for everyone on the island. However our forests are heavily
threatened by invasive alien species, deforestation and degradation. Managing and restoring forests costs money, but the
benefits are a lot more. Restoration is not difficult. But it requires tools and labor. If nothing is done, the forest becomes a
plantation of one or a few invasive species only. We lose forest function and diversity. Prior studies have shown that there is a
significant difference between what people SAY they would be willing to pay, and what they would ACTUALLY pay. Please
pretend that the choice offered to you in the next question is real. Please provide an honest answer, keeping in mind your own
budget. Entrance to this site is currently free. An entry fee would help the Government agencies raise funds to remove
invasive alien species faster and over a larger area. This would help the forest recover more quickly. It would increase the
quality and quantity of ecosystem goods and services.
21. Would you be willing to pay an entry fee per person to enter this site? Yes □ No □
22. You have been given a list of prices for hiking at other sites in Mauritius. With those
in mind, what do you think would be a fair entry price per person for this site? ……………………… MUR
23. If you have are not willing to pay an entry fee, please tell us why.
I don’t believe that the funds will go to conservation of the park □
I do not have the financial capability to invest in conservation or pay any entry fee □
I do not care for biodiversity issues □
The government should pay □

167
Only big corporations should pay □
I do not think that our forests and biodiversity are at risk □
The benefits are too distant/I don’t care for future generations □
I don’t have enough information about the threats to forests and the conservation measures □
Other (please specify) …………………………………………………………….
SECTION IV – BACKGROUND INFORMATION
24. Please select your age group 18-29 30-39 40-49 50-59 Above 60
□ □ □ □ □
25. Gender 26. Please select your ethnicity
Male □
Female □
Caucasian □ Franco-Mauritian □ Indo-Mauritian □ Sino-Mauritian □ Creole □
Asian □ Prefer not to answer □
27. Please select the highest level of schooling you
have completed.
28. Please select the category best representing your supervisory role:
Certificate of Primary Education □ I do not supervise □
School Certificate □ I am the lead worker in my unit □
Higher School Certificate
/Baccalaureate □ I supervise a single unit of employees □
Trade/technical/vocational diploma □ I supervise two or more units, each unit having an individual
supervisor □
Bachelor’s degree □ I supervise a major division of an agency or department □
Masters degree □ I supervise an entire agency or department □ Doctoral degree □ I supervise more than one agency or department □
Prefer not to answer □
29. Please identify your marital status: Single □ Married □ Divorced/Separated □ Partnership □ Widowed □
30. Number of children? None □ 1 □ 2 □ More than 2 □
31. If you are a resident please identify your monthly
income bracket.
32. If you are a tourist, please identify your annual household
income bracket. Country’s currency:
…………………………..
Less than MUR 5,000 □ Less than 10,000 □
MUR 5,001 to MUR 15,000 □ 10,001 to 30,000 □

168
MUR 15,001 to MUR 30,000 □ 30,001 to 50,000 □
MUR 30,001 to MUR 50,000 □ 50,001 to 100 000 □
MUR 50,001 to MUR 100,000 □ More than 100 000 □
More than MUR 100,000 □
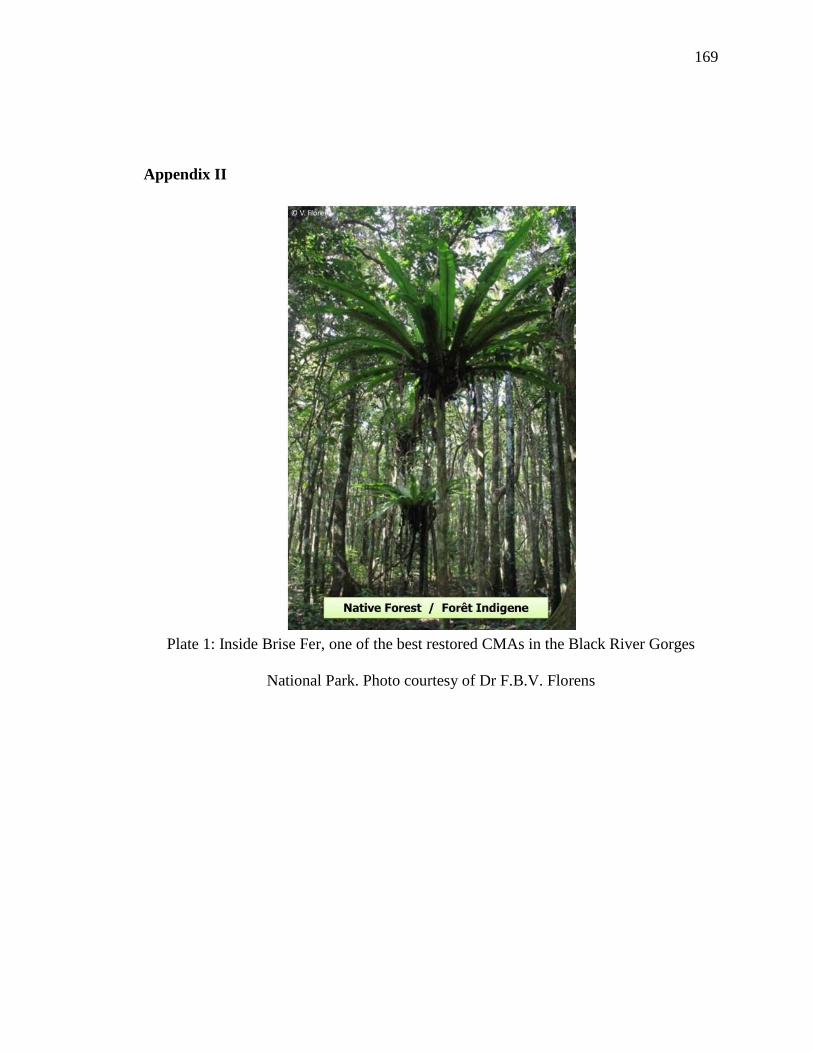
169
Appendix II
Plate 1: Inside Brise Fer, one of the best restored CMAs in the Black River Gorges
National Park. Photo courtesy of Dr F.B.V. Florens

170
Plate 2: Forest densely invaded with Psidium cattleianum. Photo courtesy of Dr Cláudia
Baider

171
Plate 3: A set of native animal and plant species.

172
Plate 4: A set of introduced, invasive animal and plant species.
Plate 5: Picture of a forest with a canopy of invasive alien species. Photo courtesy of Dr
John Mauremootoo.

173
Plate 6: Picture of laborer in a restoration project, weeding out Psidium cattleianum.

174
Appendix III – Contingent Valuation data summaries
Response distributions by questions for the Contingent Valuation surveys:
Response distribution by site
Question 1
Mean 2.6478873
Std Dev 1.5730507
Std Err Mean 0.1077837
Upper 95% Mean 2.8603523
Lower 95% Mean 2.4354223
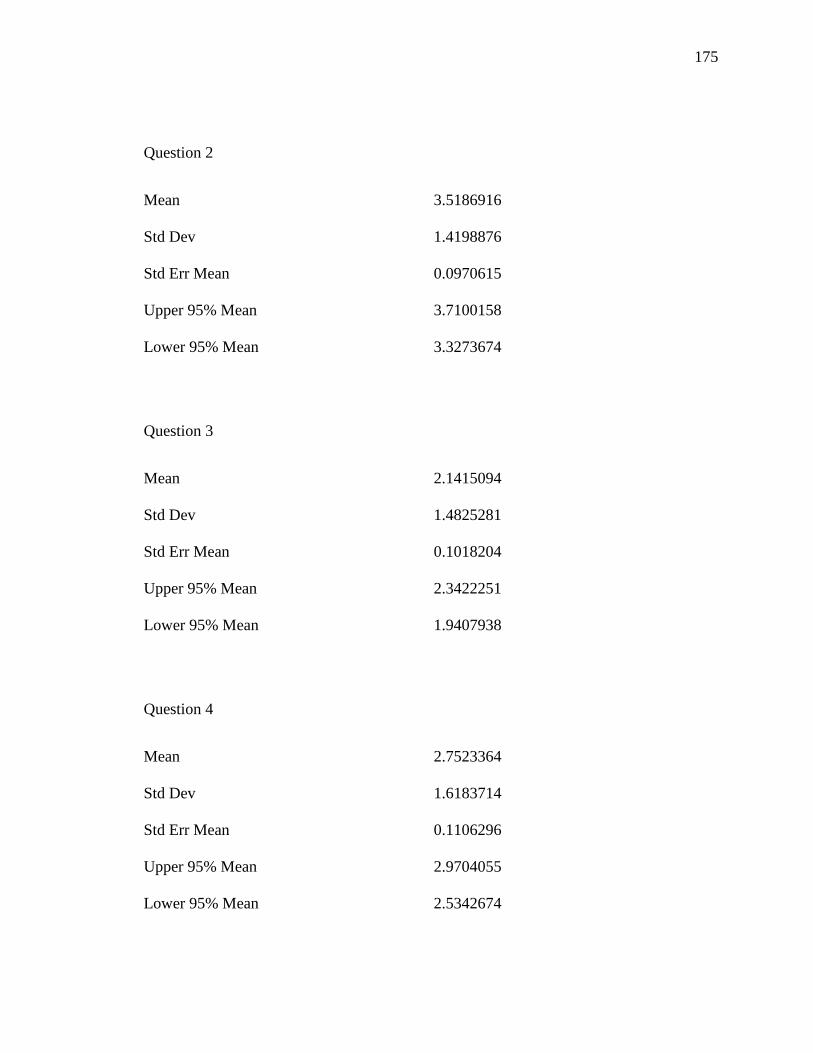
175
Question 2
Mean 3.5186916
Std Dev 1.4198876
Std Err Mean 0.0970615
Upper 95% Mean 3.7100158
Lower 95% Mean 3.3273674
Question 3
Mean 2.1415094
Std Dev 1.4825281
Std Err Mean 0.1018204
Upper 95% Mean 2.3422251
Lower 95% Mean 1.9407938
Question 4
Mean 2.7523364
Std Dev 1.6183714
Std Err Mean 0.1106296
Upper 95% Mean 2.9704055
Lower 95% Mean 2.5342674

176
Question 5
Yes (%) No or Don’t Know (%)
Psidium cattleianum var. sabine 39 61
Ravenala madagascariensis 24 76
Trochetia boutonianna 13 87
Erythroxylum sideroxyloides 10 90
Zosterops mauritanus 43 57
Macaca fascicularis 43 57
Cervus timorensis 20 80
Pteropus niger 56 44
Question 6
Mean Std Dev
Std Err
Mean
Upper
95%
Mean
Lower
95%
Mean
Good supply of clean
water
4.6448598 1.0323621 0.0705708 4.7839665 4.5057532
Less storm runoff.
Flood control
4.3849765 1.2597393 0.0863159 4.5551239 4.2148291
Lessen impacts of
changing climate
4.5164319 1.1014409 0.0754695 4.6651987 4.3676652
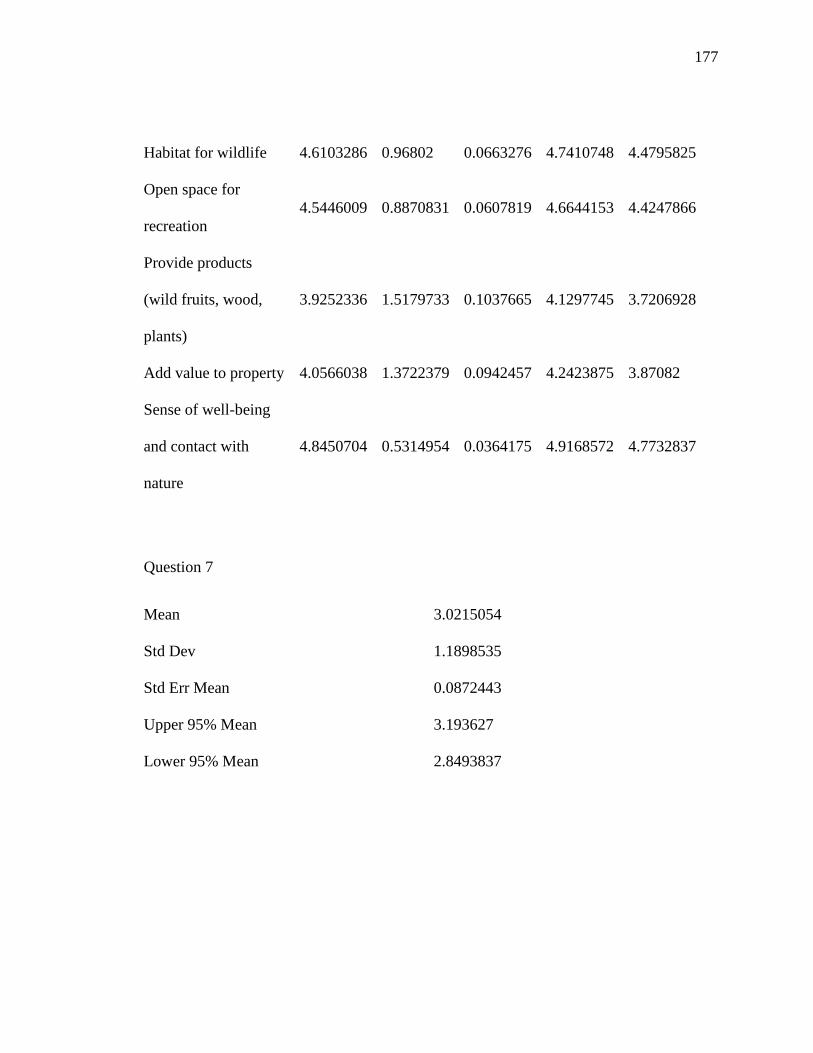
177
Habitat for wildlife 4.6103286 0.96802 0.0663276 4.7410748 4.4795825
Open space for
recreation
4.5446009 0.8870831 0.0607819 4.6644153 4.4247866
Provide products
(wild fruits, wood,
plants)
3.9252336 1.5179733 0.1037665 4.1297745 3.7206928
Add value to property 4.0566038 1.3722379 0.0942457 4.2423875 3.87082
Sense of well-being
and contact with
nature
4.8450704 0.5314954 0.0364175 4.9168572 4.7732837
Question 7
Mean 3.0215054
Std Dev 1.1898535
Std Err Mean 0.0872443
Upper 95% Mean 3.193627
Lower 95% Mean 2.8493837

178
Question 8
Mean Std Dev
Std Err
Mean
Upper
95%
Mean
Lower
95%
Mean
Manage for future
generations
4.8254717 0.5615755 0.0385692 4.901502 4.7494414
Manage for habitat
preservation
4.8349057 0.5727695 0.039338 4.9124514 4.7573599
Manage for species
preservation
4.8679245 0.5433872 0.03732 4.9414923 4.7943567
Manage for
watershed capacity
4.7857143 0.6465112 0.0446135 4.8736644 4.6977641
Lessen impacts of
climate change
4.7122642 0.7648936 0.0525331 4.8158211 4.6087072
Manage for public
access
4.3981043 1.0835551 0.074595 4.5451553 4.2510533
Create public
education
4.759434 0.7112206 0.0488468 4.8557243 4.6631436
Manage for
aesthetics/beauty
4.1706161 1.2758896 0.0878359 4.3437691 3.9974631
Question 9

179
Residents 77 %
International visitors 23 %
Question 12
This is my first visit 41 %
Less than once a year 28 %
About once a month 18 %
Several times a week 9 %
About once a week 2 %
Every day 2 %
Question 13
This is my first visit 24 %
Weekday mornings 46 %
Weekday afternoons 16 %
Weekend mornings 9 %
Weekend afternoons 5 %
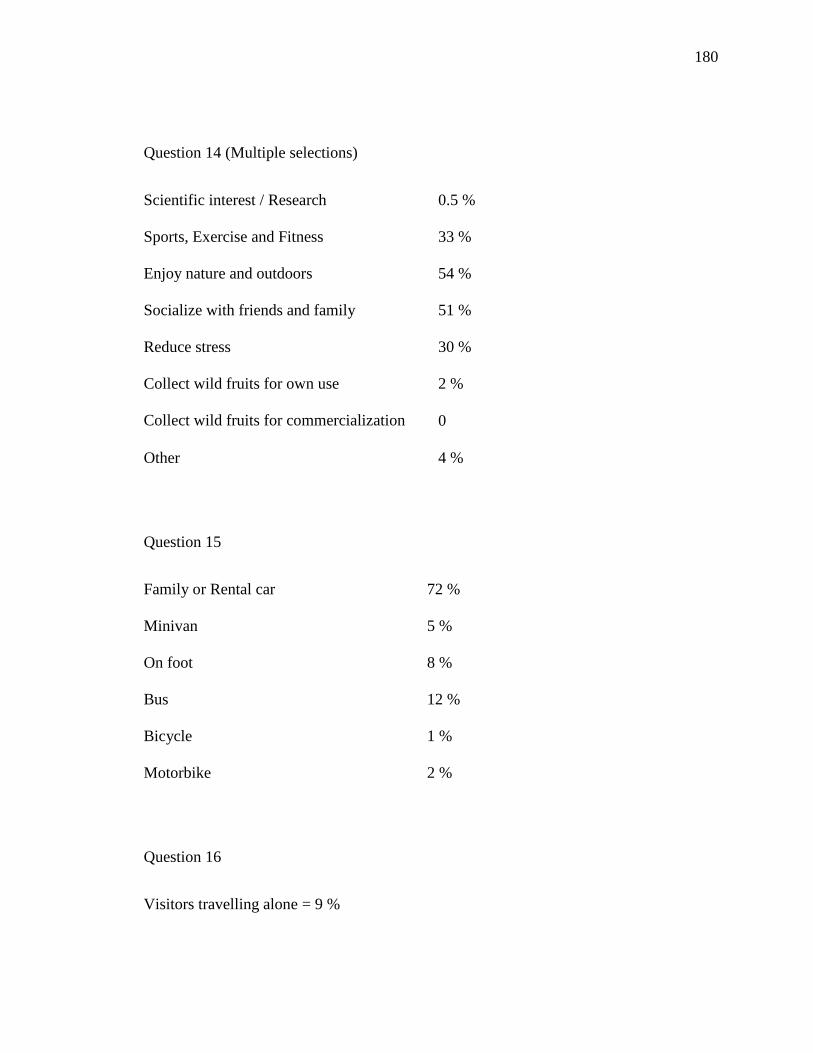
180
Question 14 (Multiple selections)
Scientific interest / Research 0.5 %
Sports, Exercise and Fitness 33 %
Enjoy nature and outdoors 54 %
Socialize with friends and family 51 %
Reduce stress 30 %
Collect wild fruits for own use 2 %
Collect wild fruits for commercialization 0
Other 4 %
Question 15
Family or Rental car 72 %
Minivan 5 %
On foot 8 %
Bus 12 %
Bicycle 1 %
Motorbike 2 %
Question 16
Visitors travelling alone = 9 %

181
Number of accompanying adults = 193
Number of accompanying teens under 18 years old = 86
Question 17
More than 4 hours 27 %
Between 2 and 4 hours 45 %
Between 1 and 2 hours 18 %
Between 30 minutes and 1 hour 7 %
Less than 30 minutes 1 %
I don’t know 1 %
Question 18
Mean Std Dev
Std Err
Mean
Upper
95%
Mean
Lower
95%
Mean
Forests in Mauritius
are well protected
2.5759162 1.5194341 0.1099424 2.7927807 2.3590518
Native species are at
risk of extinction
3.9417989 1.4483295 0.1053505 4.1496199 3.733978
Only professionals
should decide how
2.3267327 1.7225973 0.1212015 2.5657223 2.0877431
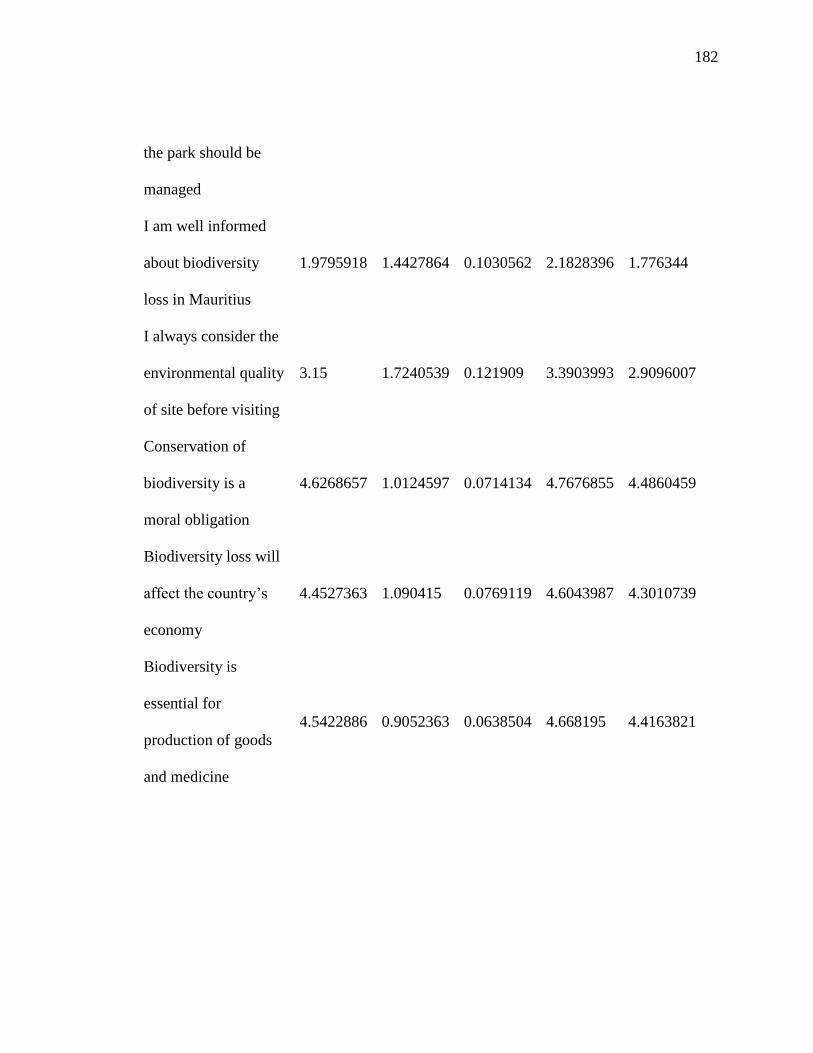
182
the park should be
managed
I am well informed
about biodiversity
loss in Mauritius
1.9795918 1.4427864 0.1030562 2.1828396 1.776344
I always consider the
environmental quality
of site before visiting
3.15 1.7240539 0.121909 3.3903993 2.9096007
Conservation of
biodiversity is a
moral obligation
4.6268657 1.0124597 0.0714134 4.7676855 4.4860459
Biodiversity loss will
affect the country’s
economy
4.4527363 1.090415 0.0769119 4.6043987 4.3010739
Biodiversity is
essential for
production of goods
and medicine
4.5422886 0.9052363 0.0638504 4.668195 4.4163821
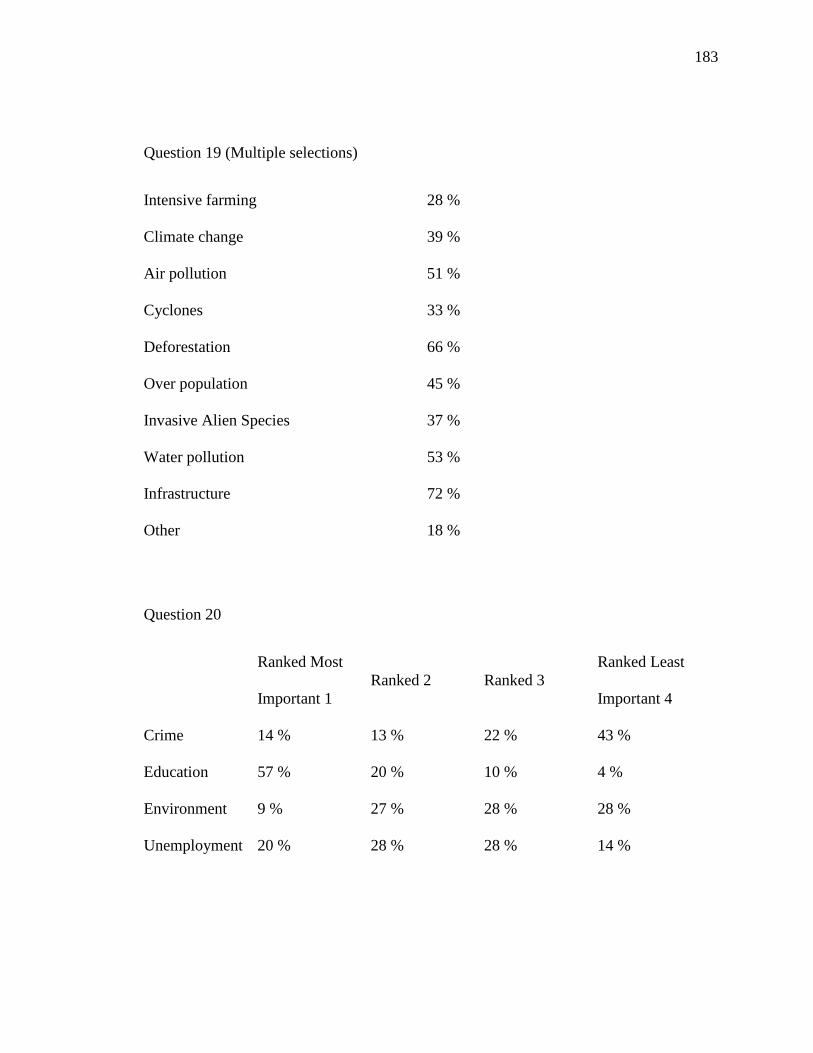
183
Question 19 (Multiple selections)
Intensive farming 28 %
Climate change 39 %
Air pollution 51 %
Cyclones 33 %
Deforestation 66 %
Over population 45 %
Invasive Alien Species 37 %
Water pollution 53 %
Infrastructure 72 %
Other 18 %
Question 20
Ranked Most
Important 1
Ranked 2 Ranked 3
Ranked Least
Important 4
Crime 14 % 13 % 22 % 43 %
Education 57 % 20 % 10 % 4 %
Environment 9 % 27 % 28 % 28 %
Unemployment 20 % 28 % 28 % 14 %

184
Question 24
Age Group Percentage
18 to 29 40
30 to 39 25
40 to 49 16
50 to 59 12
60 and above 7
Question 25
Gender Female = 38%
Gender Male = 62%
Question 26
Ethnicity Percentage
Franco-Mauritian 4
Indo-Mauritian 44
Sino-Mauritian 5
Creole 13
Asian 9
Caucasian 14
Prefer not to answer 11

185
Question 27
Schooling Percentage
Certificate of Primary Education 12
School Certificate 18
Higher School Certificate /Baccalaureate 19
Trade/technical/vocational diploma 11
Bachelor’s degree 16
Masters degree 19
Doctoral degree 2
I prefer not to answer 2
Question 28
Supervisory level Percentage
I do not supervise 46
I am the lead worker in my unit 16
I supervise a single unit of employees 20
I supervise two or more units, each unit having an individual supervisor 10
I supervise a major division of an agency or department 3
I supervise an entire agency or department 3
I supervise more than one agency or department 1
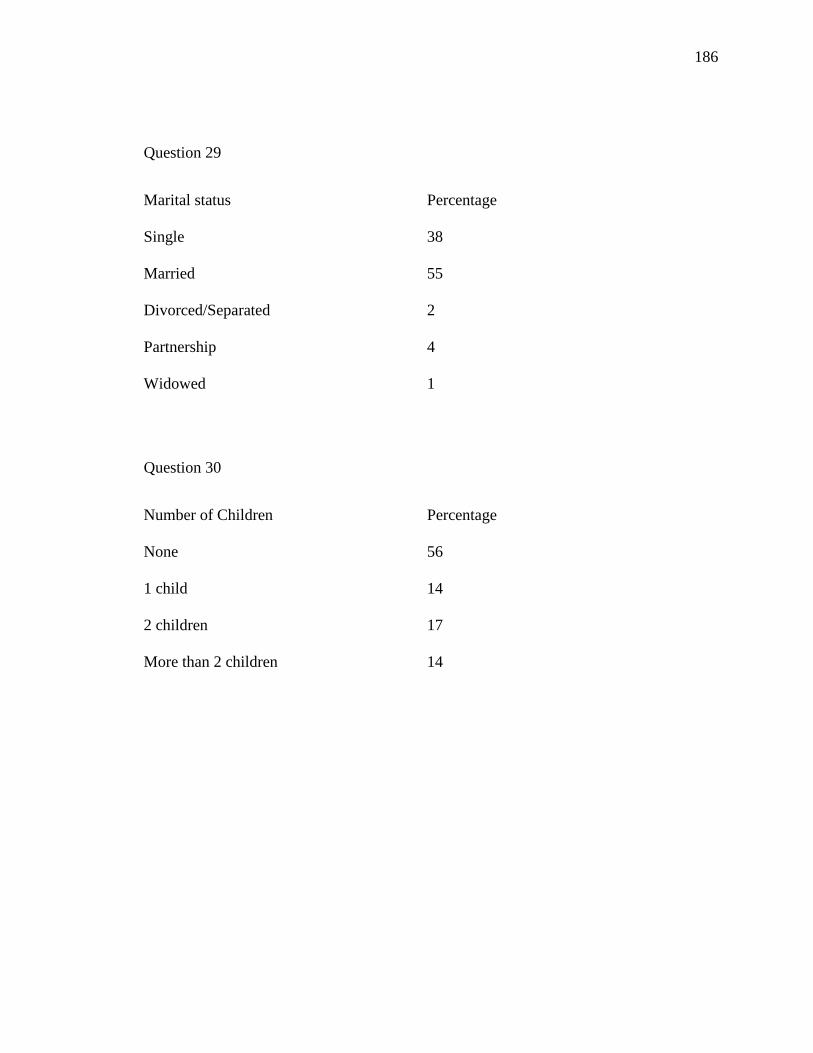
186
Question 29
Marital status Percentage
Single 38
Married 55
Divorced/Separated 2
Partnership 4
Widowed 1
Question 30
Number of Children Percentage
None 56
1 child 14
2 children 17
More than 2 children 14
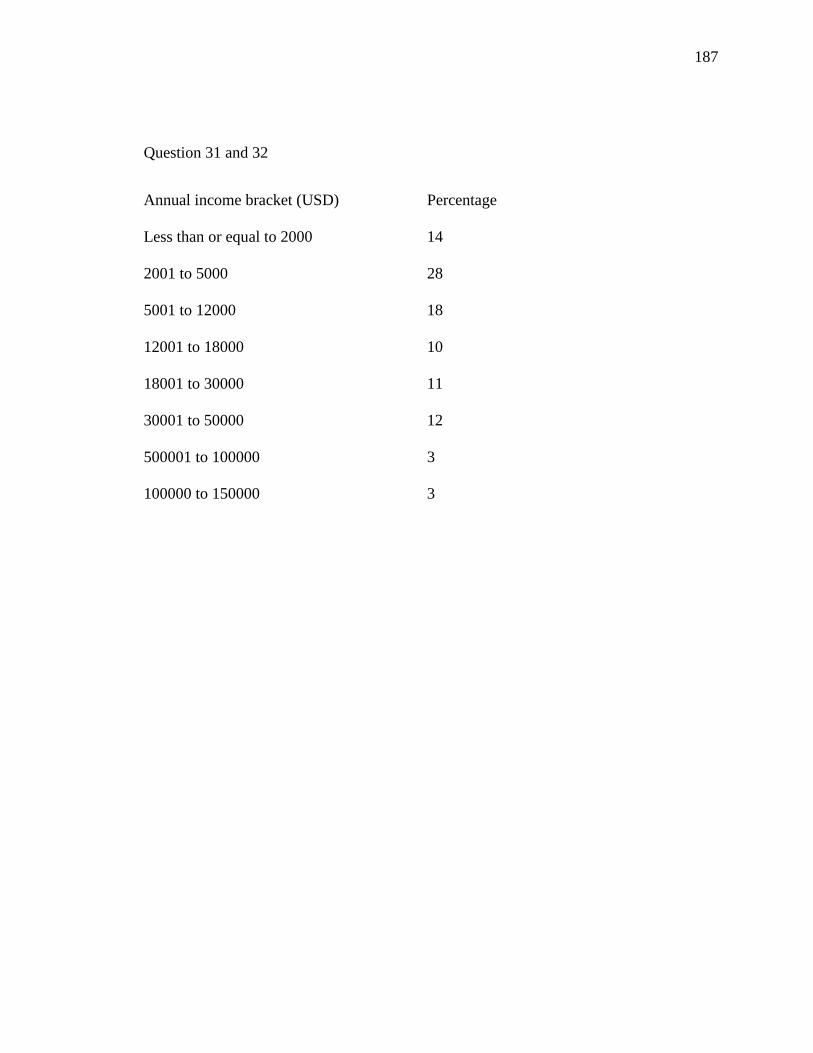
187
Question 31 and 32
Annual income bracket (USD) Percentage
Less than or equal to 2000 14
2001 to 5000 28
5001 to 12000 18
12001 to 18000 10
18001 to 30000 11
30001 to 50000 12
500001 to 100000 3
100000 to 150000 3
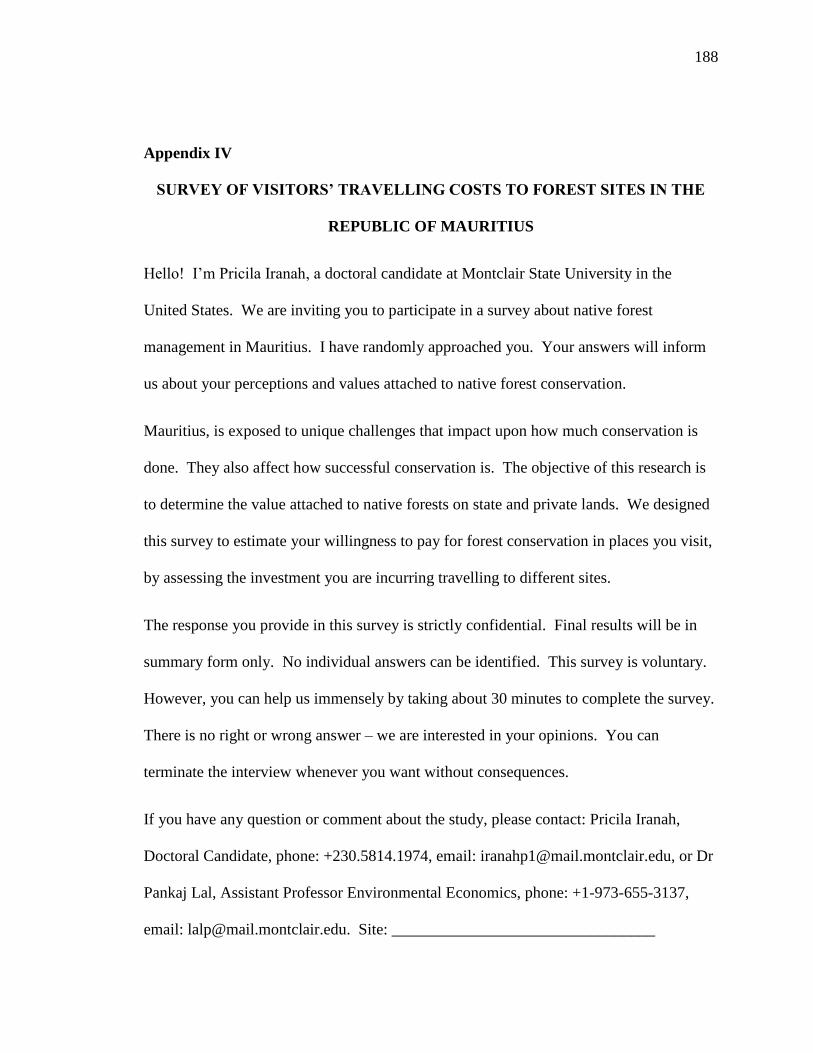
188
Appendix IV
SURVEY OF VISITORS’ TRAVELLING COSTS TO FOREST SITES IN THE
REPUBLIC OF MAURITIUS
Hello! I’m Pricila Iranah, a doctoral candidate at Montclair State University in the
United States. We are inviting you to participate in a survey about native forest
management in Mauritius. I have randomly approached you. Your answers will inform
us about your perceptions and values attached to native forest conservation.
Mauritius, is exposed to unique challenges that impact upon how much conservation is
done. They also affect how successful conservation is. The objective of this research is
to determine the value attached to native forests on state and private lands. We designed
this survey to estimate your willingness to pay for forest conservation in places you visit,
by assessing the investment you are incurring travelling to different sites.
The response you provide in this survey is strictly confidential. Final results will be in
summary form only. No individual answers can be identified. This survey is voluntary.
However, you can help us immensely by taking about 30 minutes to complete the survey.
There is no right or wrong answer – we are interested in your opinions. You can
terminate the interview whenever you want without consequences.
If you have any question or comment about the study, please contact: Pricila Iranah,
Doctoral Candidate, phone: +230.5814.1974, email: [email protected], or Dr
Pankaj Lal, Assistant Professor Environmental Economics, phone: +1-973-655-3137,
email: [email protected]. Site: _________________________________

189
SECTION II – GENERAL QUESTIONS
1. Please rate how well you agree with the following
statements, circling one number from 5 (Strongly
Agree) to 1 (Strongly disagree)
I don’t
know
I do not
agree
Somewhat
Agree
Strongly
Agree
Forests in Mauritius are well protected 0 1 2 3 4 5
Native species are at risk of extinction 0 1 2 3 4 5
Only professionals should decide how a park/reserve
should be managed
0 1 2 3 4 5
I am well informed about biodiversity loss in Mauritius 0 1 2 3 4 5
I always consider the environmental quality of site before
visiting
0 1 2 3 4 5
Conservation of biodiversity is a moral obligation 0 1 2 3 4 5
Biodiversity loss will affect the country’s economy 0 1 2 3 4 5
Biodiversity is essential for production of goods and
medicine
0 1 2 3 4 5
SECTION III – TRAVEL COST
2. If you are a resident please tell us from where you started your day …………………………………………………..
3. Please estimate the time and distance it took for you to get to this site
from your point of origin
Time: ……………………………….. hrs/min
Distance: …………………………… km/miles
4. If you had not come to this site today, which of the following activities
would you most likely be doing?
Working at my job □ Watching TV □
Housework/Shopping □ Socializing □
Visiting another location □
5. Please tell us the frequency of your visit to the park 6. Please tell us the timing of your visit(s)
This is my first visit □ This is my first visit □
Less than once a year □ Weekend mornings □
About once a month □ Weekend afternoons □
Several times a week □ Weekday mornings □
Every day □ Weekday afternoons □

190
7. Please tell us the purpose of your visit 8. Please select how you came to the park
Scientific interest / Research □ Family car □
Sports, Exercise and Fitness □ Minivan □
Enjoy nature and outdoors □ Walking □
Socialize with friends and family □ Bus □
Reduce stress □ Bicycle □
Collect wild fruits for own use □ Motorbike □
Collect wild fruits for commercialization □ 9. Please tell us if you are here by yourself or as a group
Other (please
specify)……………………………….
□ I am here by myself □
10. Please tell us how long you expect your visit to
last.
I am here with ……………… adults
I am here with ………….. teens under 18.
More than 4 hours □ 11. Please tell us how much you have spent on your trip to this
site
2 to 4 hours □ Transportation MUR………… (if public transport, taxi or hired
vehicle)
More than 1 hour but less than 2 hours □ Fuel MUR
……………………… Food MUR……………………
30 to 60 minutes □ Entry Fee
MUR………. per adult
Less than 30 minutes □ MUR………. per child
12. Have you visited or will you visit other sites today? Please
list them
13. Do you know of any other national park or eco-
tourism site that you would like to visit instead of
this site? Please provide a name.
…………………………………………………
…………………………………………………
14. How much time would you spend at that alternate
site?
…………………………………………………. hrs/minutes
SECTION IV – BACKGROUND INFORMATION
15. Please select
your age
18-29 30-39 40-49 50-59 Above
60
16. Gender?

191
group □ □ □ □ □ Male □ Female □
17. Please select your ethnicity 18. Marital Status?
Franco-Mauritian
□
Sino-Mauritian
□
Creole
□
Asian □ Single
□
Married □ Divorced □
Separated
□
Partnership □
Indo-Mauritian □ Caucasian □ Prefer not to answer
□
19. Please select the highest level of schooling you have
completed.
20. Please select the category best representing your
supervisory role:
Certificate of Primary Education □ I do not supervise □
School Certificate □ I am the lead worker in my unit □
Higher School Certificate /Baccalaureate □ I supervise a single unit of employees □
I supervise two or more units, each unit having an
individual supervisor □
Trade/technical/vocational diploma □
Bachelor’s degree □ I supervise a major division of an agency or
department □
Masters degree □
Doctoral degree □ I supervise an entire agency or department □
Prefer not to answer □
21. Number of children I supervise more than one agency or department □
None □ 1 □ 2 □ More than 2 □
22. If you are a resident please identify your monthly income bracket.
Less than MUR 5,000 □ MUR 5,000 to MUR 15,000 □
MUR 15,000 to MUR 30,000 □ MUR 30,000 to MUR 50,000 □
MUR 50,000 to MUR 100,000 □ More than MUR 100,000 □
23. Would you like a copy of the final report? Yes □ No □

192
Appendix V – Travel Cost Data Summaries
Response distribution by site
BENP – Bras d’Eau National Park
DDE – Domaine de L’Etoile
IAA – Ile Aux Aigrettes
L-BRGNP – Lower Black River Gorges National Park
Le Pouce Nature Reserve
TAC – Trou aux Cerfs
UBRGNP – Upper Black River Gorges National Park
V23C – La Vallee des 23 Couleurs

193
VDF – La Vallee de Ferney
Question 1
Mean Std Dev
Std Err
Mean
Upper
95%
Mean
Lower
95%
Mean
Forests in Mauritius
are well protected
2.6312849 1.4371961 0.1074211 2.8432676 2.4193022
Native species are at
risk of extinction
3.6861702 1.4450432 0.1053906 3.8940775 3.4782629
Only professionals
should decide how
the park should be
managed
2.8297872 1.6812161 0.1226153 3.0716742 2.5879003
I am well informed
about biodiversity
loss in Mauritius
2.6276596 1.4328763 0.1045032 2.8338164 2.4215028
I always consider the
environmental quality
of site before visiting
3.606383 1.4604818 0.1065166 3.8165116 3.3962544
Conservation of
biodiversity is a
4.537234 0.8613488 0.0628203 4.6611616 4.4133065

194
moral obligation
Biodiversity loss will
affect the country’s
economy
4.25 1.2393935 0.0903921 4.4283192 4.0716808
Biodiversity is
essential for
production of goods
and medicine
4.393617 0.9217292 0.067224 4.5262319 4.2610021
Question 4
Working at my job 11 %
Housework/Shopping 21 %
Visiting another location 23 %
Watching TV 23 %
Socializing 26 %
Question 6
First visit 18 %
Weekends 74 %
Weekdays 7 %

195
Question 7(Multiple selections)
Scientific interest / Research 1 %
Sports, Exercise and Fitness 35 %
Enjoy nature and outdoors 59%
Socialize with friends and family 39 %
Reduce stress 32 %
Collect wild fruits for own use 5 %
Collect wild fruits for commercialization 0
Other (please specify) 0
Question 8
Family car %
Minivan %
On foot %
Bus %
Bicycle %
Motorbike %

196
Question 9
Visitors travelling alone = 21 %
Number of accompanying adults = 126
Number of accompanying teens under 18 years old = 53
Question 15
Age Group Percentage
18 to 29 21
30 to 39 30
40 to 49 20
50 to 59 17
60 and above 12
Question 16
Gender Female = 38%
Gender Male = 62%
Question 17
Ethnicity Percentage
Franco-Mauritian 16
Indo-Mauritian 52

197
Sino-Mauritian 7
Creole 25
Question 18
Marital status Percentage
Single 26
Married 67
Divorced/Separated 4
Partnership 2
Widowed 1
Question 19
Schooling Percentage
Certificate of Primary Education 17
School Certificate 19
Higher School Certificate /Baccalaureate 17
Trade/technical/vocational diploma 12
Bachelor’s degree 18
Masters degree 14
Doctoral degree 0
I prefer not to answer 3
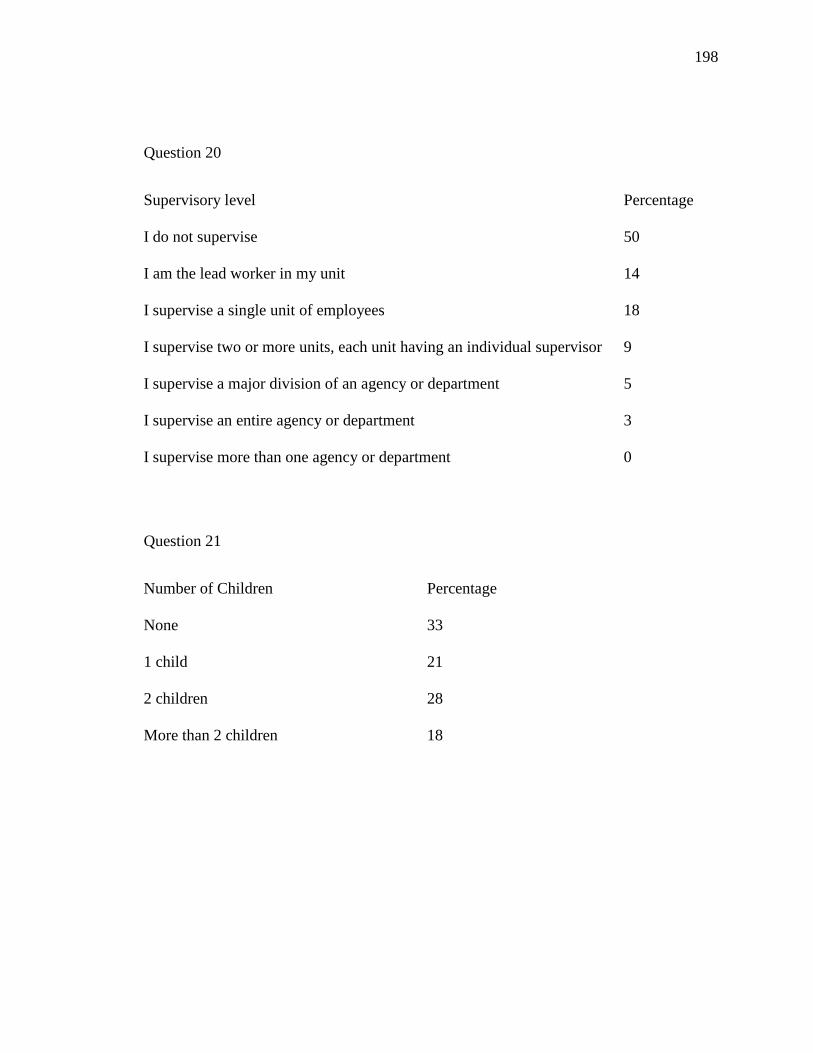
198
Question 20
Supervisory level Percentage
I do not supervise 50
I am the lead worker in my unit 14
I supervise a single unit of employees 18
I supervise two or more units, each unit having an individual supervisor 9
I supervise a major division of an agency or department 5
I supervise an entire agency or department 3
I supervise more than one agency or department 0
Question 21
Number of Children Percentage
None 33
1 child 21
2 children 28
More than 2 children 18
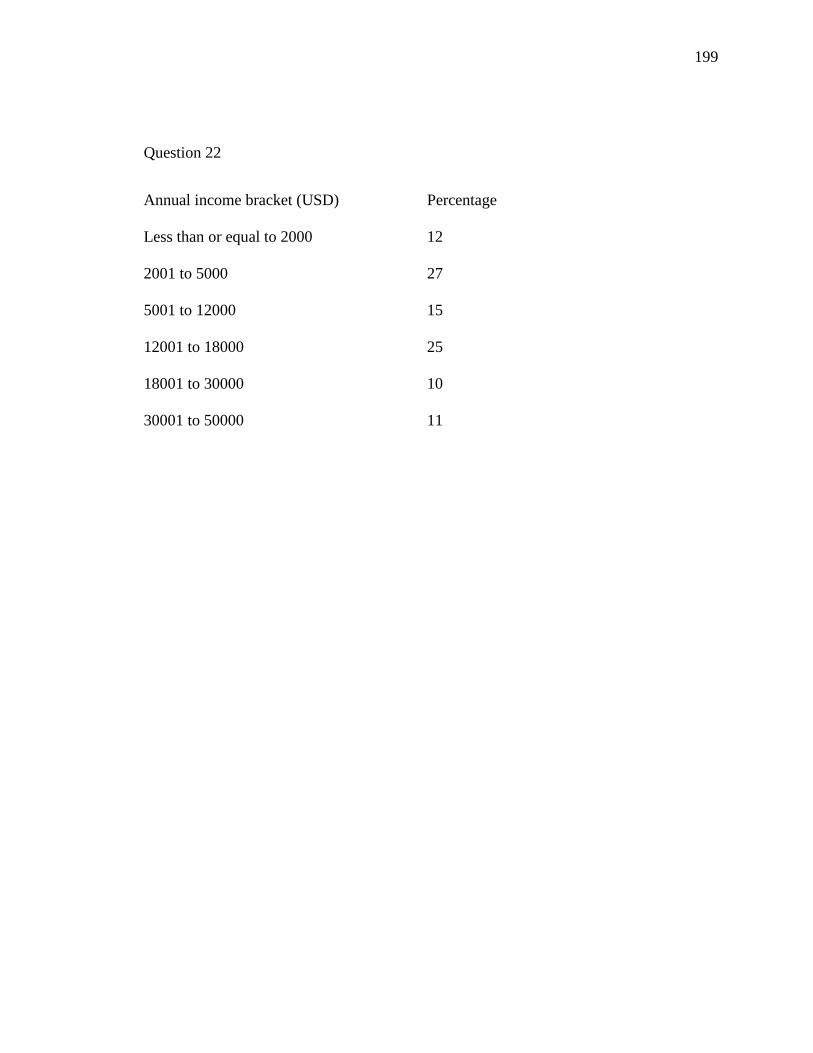
199
Question 22
Annual income bracket (USD) Percentage
Less than or equal to 2000 12
2001 to 5000 27
5001 to 12000 15
12001 to 18000 25
18001 to 30000 10
30001 to 50000 11

200
This page intentionally left blank.