bridge pier scour evaluation in meandering channels shoubra/civil... · 2015-11-02 · bridge pier...
TRANSCRIPT

Vol.16| September 2015 ISSN-5563-1682
VOL 16 ISSUE 9 September 2015 Paper 1 1
Journal of The International Association of Advanced Technology and Science
Bridge pier Scour Evaluation in Meandering Channels
Gamal Elsaeed1, Hossam Elsersawy2, Mohammad Ibraheem3, Fatma Samir4
1*Professor of Hydraulics and Water Resources, Faculty of Engineering, Shobra, Banha University, Cairo, Egypt.
2Assistant Professor, Nile Research Institute, National Water Research Center, Delta Barrage, Egypt. 3Lecturer, Faculty of Engineering, Shobra, Banha University, Cairo, Egypt.
4Assistant Researcher, Nile Research Institute, National Water Research Center, Delta Barrage, Egypt.
ABSTRACT
The objectives of this research are to predict and evaluate the effect of releasing high/extreme flow
discharges on scour at 13 bridge piers of (3) bridges located at Kafr El-Zayat City. Field data, empirical
equations and a two-dimensional model were used. The empirical equations were used to predict the
general, contraction and bend scour of the bed's morphological changes along the entire reach of the
Rosetta Branch.
The 2-D model was used to predict scour at the bridge piers in the study area considering two scenarios of
high river discharges. The expected extending of the scour holes around the main piers was also predicted.
The results showed that in case the released discharges were (69.90, 220.00m.m3/day), the total scour
around piers evaluated at the (3) bridges were (13.98, 17.74m) for bridge No. (1), (10.33, 13.93m) for
bridge No. (2) and (12.64, 15.34m) for bridge No. (3). It is recommended to follow up the geometry of the
scour holes after one year of passing extreme high discharges.
Keywords: High Discharges, Rosetta Branch, Local Scour, Numerical Models, Kafr El-Zayat Bridges,
Bridge Piers.
1. INTRODUCTION During extreme high discharges, greater discharges than the annual maximum were released. These
peak discharges caused local scour in the vicinity of bridges, harbors and other structures and inundation to
former flood plains that are currently in use.
The Nile River is relatively straight with some sinuous reaches over short distances that are related to
steeper bed slopes. The increase in sinuosity in turn increases the bed slope more than 10cm/km. Steeper
portions become more active and bank erosive. Consequently, scouring action was expected to continue in
these areas. The meander wavelengths of the River Nile varied
from 2500m to 4500m. The meander pattern was subsequent to
the construction of the High Aswan Dam (H.A.D.) as a result of a
reduction in discharge and sediment load. After constructing
H.A.D, the Nile was considered as a very low energy river with
low water surface gradients. From the Aswan Dam to the head of
the Nile Delta, the river distance is about 950km, and the river
bed drops ranging from + 79m to + 11m, giving rise to an
average slope of 7.2cm/km. The average bed slope along the
Damietta and Rosetta Branches of the Nile Delta (240km from
Delta Barrage, (Fig. 1)) was 5.6cm/km. The suspended bed
material loads for the Nile downstream Aswan has changed
substantially as a result of the creation of Lake Nasser HRI [1].
* Corresponding Author: Prof. Gamal Elsaeed – Email: [email protected]

Vol.16| September 2015 ISSN-5563-1682
VOL 16 ISSUE 9 September 2015 Paper 1 2
The released water from Aswan Dam was kept as far as possible equal to the water demand, leaving no
surplus water to be wasted into the sea except during the winter closure period and in emergency cases
belonging to the decided regulations of the HAD. High discharges released from HAD were determined
according to the regulation guidelines for operating the HAD. These extreme discharges cause damages to
the water control structures along the Nile and its branches. Relatively high discharges cause local scour
near bridges, harbors and other structures. Also, relatively high discharges cause inundation to former flood
plains currently in use. Such inundation in turn ruins
agricultural properties, urban areas, and roads and may
expose human lives to danger.
2. LITERATURE REVIEW The RNDP Project [2] has accomplished a comprehensive analysis of the fluvial characteristics of the
River Nile. Before the construction of H.A.D., the peak flows were quite regular down the river but after
building H.A.D., the peak flow decreases significantly downstream as irrigation water is withdrawn.
During extreme high floods, higher discharges than the annual maximum discharge in an average year may
be released. Associated high discharges cause local scour near bridge piers, especially the wide area.
Meander migration is a process in which water flow erodes soil on one bank and deposits it on the opposite
bank. Therefore, a gradual shift of bank line occurs over the long term. Bank erosion undermines bridge
piers and abutments, scours the foundations of parallel highways, and causes loss of useful land, according
to [3].
Scour is the result of the erosive action of flowing water, excavating and carrying away material from
the bed and banks of streams and from around the piers and abutments of bridges, [4]. It is considered one
of the main factors affecting the stability of the bridges. (Fig. 2) shows flow profile around a circular bridge
pier, [4]
Local Scour is defined as the erosion due to
redirected and contracted flow lines around piers or
abutments [5]. The evaluation of local scour was
developed by [6] and procedure set in [4]. Local
scour is caused by flow obstruction and impingement
- most local scour caused by man-made structures
such as bridge piers, bridge abutment, culverts, grade
control, and drop structures. The factor of safety for
local scour is basely 1.3 [5], but it may be reduced to
1.0 due to excessive calculated local scour, [7]. There
are many local scour depth prediction equations
considered in the literature as well as a number of
review studies that used the comparison
techniques between different equations and
methodologies involved in scour prediction. [8] measured mean flow directions, magnitude, and turbulent
flow fluctuations and computed turbulent power spectra around a circular pile for flatbed, intermediate, and
equilibrium scour holes. He found that a strong vertical downward flow developed ahead of the cylinder as
the scour hole enlarged. The size and circulation of the horseshoe vortex increased rapidly, and the velocity
near the hole bottom decreased as the scour hole was enlarged.
As the scour hole develops further, the intensity of the vortex decreases and reaches a constant value at the
equilibrium stage. Large scour holes may also develop downstream from piers under certain circumstances
(e.g. [9]). More recently another potential scour mechanism was identified [10]. This mechanism resulted
from the pressure gradient field generated by the presence of the structure in the flow. [11] collected new
long-duration clear-water scour data for single cylindrical piers with the objective of investigating the
effect of sediment coarseness on the equilibrium scour depth and improving the scour depth time evolution
modeling by using the exponential function suggested in the literature.
The effect of a single-peaked flood wave on pier scour was investigated theoretically and
experimentally by [12]. The conditions considered involve clear-water scour of a cohesion-less material for
a given median sediment size and sediment non-uniformity. An approach flow characterized by a flow
depth and velocity, a circular-shaped cylindrical bridge pier, and a flood hydrograph defined by its time to
peak discharge. Sheppard et al. [13], employed twenty-three of the more recent and commonly used
equilibrium local scour equations for cohesion-less sediments which were evaluated using compiled
laboratory and field databases. Because the maturity of the scour hole at the time of measurement for the
Fig. 2. Flow profile around a circular bridge pier [4]
Fig. 1. Rosetta and Damietta branches

Vol.16| September 2015 ISSN-5563-1682
VOL 16 ISSUE 9 September 2015 Paper 1 3
field data was unknown, they were only used to evaluate under prediction by the equations. A preliminary
quality control screening of the equilibrium scour methods/equations reduced the number of equations from
the initial 23 to 17. The remaining 17 methods/equations were analyzed using laboratory and field data.
Contraction scour is located at the flow area of the river that is reduced due to the bridge construction.
The contraction scour evaluation was developed by Federal Highway Administration criteria. The higher
value between the contraction scour equation in this section and Neill’s general scour equation (Equation
(5) next page) could be used for this component [5]. If there is a bend, then the higher value between
Neill’s equation with a bend and the contraction scour equation and the bend scour equation could be used.
The following equation (for critical velocity) can be used to determine the contraction scour if the flow
upstream of the bridge is clear-water or live-bed [6]. The equation has the following form:
(1)
Clear-water when Vc > mean velocity, Live-bed when Vc < mean velocity.
See Section (9) (List of Symbols) for the definition of the symbols used in this section and the paper.
Live-bed Contraction Scour Determination
1
2
17
6
1
2
1
2
K
W
W
Q
Q
y
y
02 yyys
(2)
Clear-water Contraction Scour
Ys= y2-y0 (3)
Bend scour is concentrated near the outside of the bend resulting from stream plan form characteristics
and scour at confluences [5]. The equation has the form [14]:
(4)
The general scour component is the scour caused by the passage of one flood. The Flood Control
District of Maricopa County [7] uses three general scour equations: Lacey’s Equation, Neill’s Equation and
Blench’s Equation, [15]. Neill’s Equation is applicable to streams where there is constriction of the
channels due to bridges or other structures. The equation has the form [15]:
(5)
The wide pier problem is considered to be a concern when the relative depth, y/b, is too small to allow
the vortices to fully develop where y is the flow depth and b is the pier width. Earlier investigations of the
dependence of scour depth on y/b were performed with small piles and very small water depths, [16]. [17]
established an upper threshold at y/b = 3 beyond which the scour depth is relatively independent of the
relative depth. Recent data from [18] on large piers indicated that this threshold was closer to 2. HEC-18 is
the standard used by most highway agencies in USA for evaluating scour at bridges. The pier scour
equation was checked using laboratory data by researchers at Colorado State University and was presented
as the CSU equation in an earlier [6] publication, Highways in the River Environment. All of the data used
for the original equation was for circular piers in relatively uniform fine grain sands. Correction factors
were added later to account for various pier shapes, angle of attack, bed forms, and coarse bed material
fractions to produce the familiar pier scour equation that is currently in HEC-18:
(6)
Vol.16| September 2015 ISSN-5563-1682
VOL 16 ISSUE 9 September 2015 Paper 1 4
[19] defined a wide pier as one situated in shallow, low velocity flows so that y/b < 0.8 and Fr<0.8. He
isolated the data that met these conditions in the original data set used in the CSU equation and added data
from other sources to derive a new equation for wide piers using the same parameters. That equation could
be written as:
(7)
Then he divided the wide pier equation by the HEC-18 equation to express the difference as another
correction factor, KW, for the HEC-18 equation:
(8)
Which can be applied to the HEC-18 equation when y/b < 0.8 and Fr < 0.8 in case both of these
conditions were met. But if y/b = 0.5 and Fr = 0.5, which could occur, then KW = 0.81 which is a 19%
reduction. [20] used a 2-D depth-averaged river model based on finite element theory (FESWMS) to
simulate the hydraulic conditions at a contracted bridge site. The studied area was located at James River
bridges near Mitchell, South Dakota. The parallel bridges were located in a crossing between the two bends
of a meander. The validated model was used to examine the site characteristics that influence the
concentrated flow on the right side of the main channel and the exchange of flow between the main channel
and flood plains. The scour analysis was performed using the equations mentioned in [4] and a method that
accounts for the soil erodibility using the curve of measured erosion rate versus shear stress.
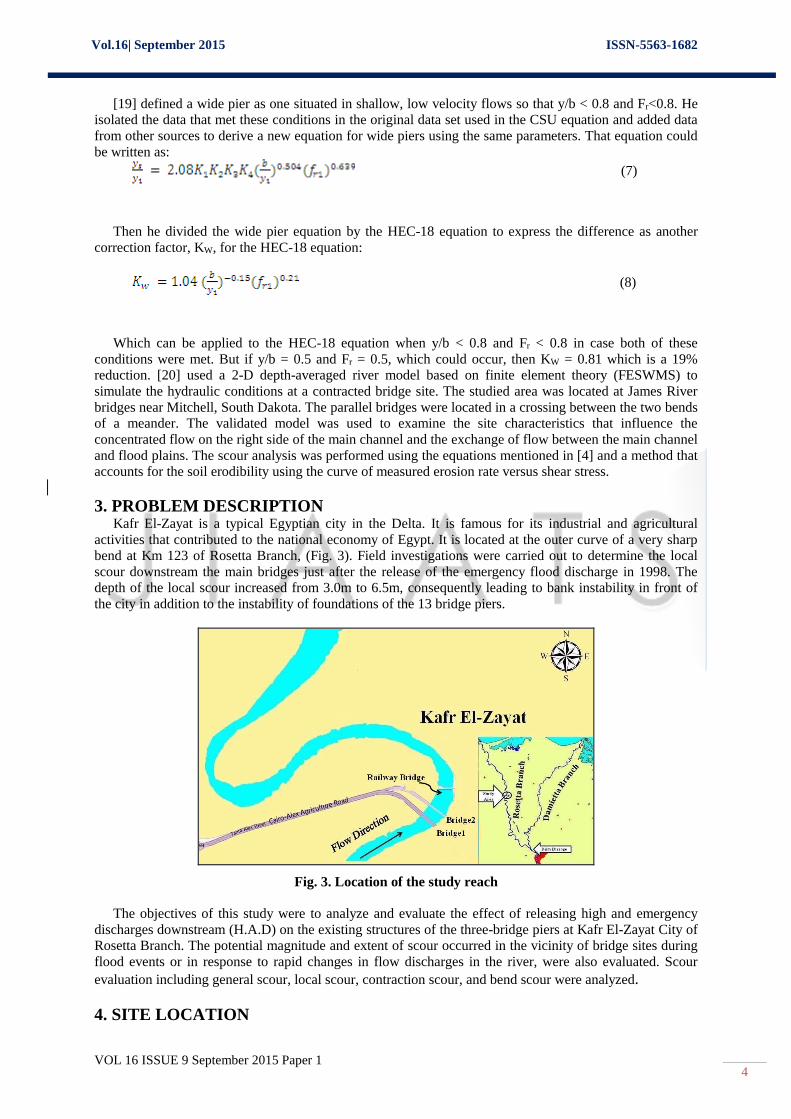
3. PROBLEM DESCRIPTION Kafr El-Zayat is a typical Egyptian city in the Delta. It is famous for its industrial and agricultural
activities that contributed to the national economy of Egypt. It is located at the outer curve of a very sharp
bend at Km 123 of Rosetta Branch, (Fig. 3). Field investigations were carried out to determine the local
scour downstream the main bridges just after the release of the emergency flood discharge in 1998. The
depth of the local scour increased from 3.0m to 6.5m, consequently leading to bank instability in front of
the city in addition to the instability of foundations of the 13 bridge piers.
Fig. 3. Location of the study reach
The objectives of this study were to analyze and evaluate the effect of releasing high and emergency
discharges downstream (H.A.D) on the existing structures of the three-bridge piers at Kafr El-Zayat City of
Rosetta Branch. The potential magnitude and extent of scour occurred in the vicinity of bridge sites during
flood events or in response to rapid changes in flow discharges in the river, were also evaluated. Scour
evaluation including general scour, local scour, contraction scour, and bend scour were analyzed.
4. SITE LOCATION
Vol.16| September 2015 ISSN-5563-1682
VOL 16 ISSUE 9 September 2015 Paper 1 5
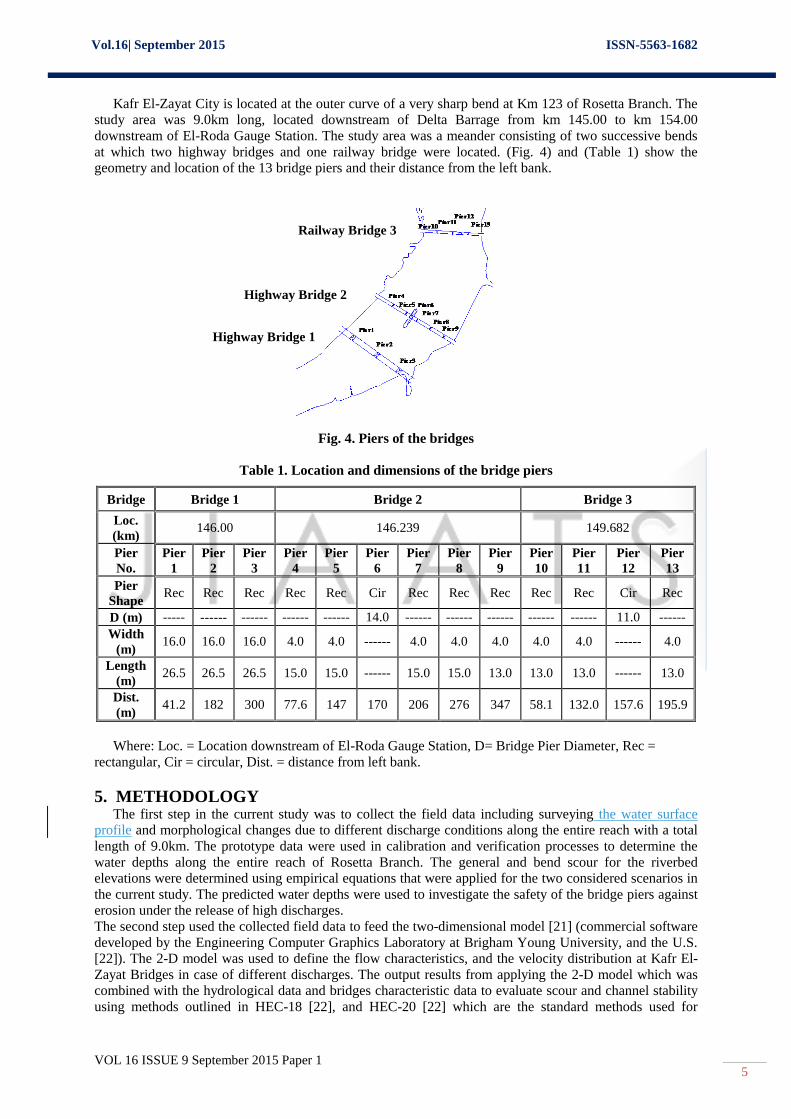
Kafr El-Zayat City is located at the outer curve of a very sharp bend at Km 123 of Rosetta Branch. The
study area was 9.0km long, located downstream of Delta Barrage from km 145.00 to km 154.00
downstream of El-Roda Gauge Station. The study area was a meander consisting of two successive bends
at which two highway bridges and one railway bridge were located. (Fig. 4) and (Table 1) show the
geometry and location of the 13 bridge piers and their distance from the left bank.
Fig. 4. Piers of the bridges
Table 1. Location and dimensions of the bridge piers
Bridge Bridge 1 Bridge 2 Bridge 3
Loc.
(km) 146.00 146.239 149.682
Pier
No.
Pier
1
Pier
2
Pier
3
Pier
4
Pier
5
Pier
6
Pier
7
Pier
8
Pier
9
Pier
10
Pier
11
Pier
12
Pier
13
Pier
Shape Rec Rec Rec Rec Rec Cir Rec Rec Rec Rec Rec Cir Rec
D (m) ----- ------ ------ ------ ------ 14.0 ------ ------ ------ ------ ------ 11.0 ------
Width
(m) 16.0 16.0 16.0 4.0 4.0 ------ 4.0 4.0 4.0 4.0 4.0 ------ 4.0
Length
(m) 26.5 26.5 26.5 15.0 15.0 ------ 15.0 15.0 13.0 13.0 13.0 ------ 13.0
Dist.
(m) 41.2 182 300 77.6 147 170 206 276 347 58.1 132.0 157.6 195.9
Where: Loc. = Location downstream of El-Roda Gauge Station, D= Bridge Pier Diameter, Rec =
rectangular, Cir = circular, Dist. = distance from left bank.
5. METHODOLOGY The first step in the current study was to collect the field data including surveying the water surface
profile and morphological changes due to different discharge conditions along the entire reach with a total
length of 9.0km. The prototype data were used in calibration and verification processes to determine the
water depths along the entire reach of Rosetta Branch. The general and bend scour for the riverbed
elevations were determined using empirical equations that were applied for the two considered scenarios in
the current study. The predicted water depths were used to investigate the safety of the bridge piers against
erosion under the release of high discharges.
The second step used the collected field data to feed the two-dimensional model [21] (commercial software
developed by the Engineering Computer Graphics Laboratory at Brigham Young University, and the U.S.
[22]). The 2-D model was used to define the flow characteristics, and the velocity distribution at Kafr El-
Zayat Bridges in case of different discharges. The output results from applying the 2-D model which was combined with the hydrological data and bridges characteristic data to evaluate scour and channel stability
using methods outlined in HEC-18 [22], and HEC-20 [22] which are the standard methods used for
Highway Bridge 1
Highway Bridge 2
Railway Bridge 3

Vol.16| September 2015 ISSN-5563-1682
VOL 16 ISSUE 9 September 2015 Paper 1 6
evaluating scour at bridges.
6. MODEL CONSTRUCTION The simulated length was about 9.0km, which included the 13 piers of the 3 bridges in the study. The
mesh was generated for the studied area, and the bed elevations were determined using the bathymetric
survey of the river. The mesh was designed by dividing the studied reach into different regions. Each
region was divided into elements called quadrilateral elements and triangular elements. It should be
mentioned that the designed mesh was condensed at the locations of the bridge piers to simulate the
dimensions of piers with high accuracy (Fig. 5). The depth file was created based on the hydrographic
survey data collected in 2006. The discharge and the water level were used as upstream and downstream
boundary conditions respectively. The hydraulic roughness coefficient was defined at each grid point and
ranged from 0.02 to 0.05.
Fig. 5. Mesh generation
6.1. Model Calibration The model was run using the field hydraulic measurements in 2006. The discharge of 222.8m3/sec and
the corresponding water level of 2.0m MSL were used as upstream and downstream boundary conditions
respectively. In the model calibration process, the velocity distributions were determined at 3 different
cross-sections 1, 2 and 3 (Fig. 6). The water surface slope was adjusted in the model by changing the
roughness coefficient until a good agreement between the prototype, and model water surface slope was
obtained after which the roughness coefficient was fixed. (Figs. 7, 8 and 9) as show reasonably good
comparisons between the velocities obtained from the used model and field measurements taken at
different cross sections.
Fig. 6. Location of the calibration cross sections
Fig. 7. Flow velocity calibration at cross
section (1)
Bridge 1
Bridge 2
Bridge 3

Vol.16| September 2015 ISSN-5563-1682
VOL 16 ISSUE 9 September 2015 Paper 1 7
Fig. 8. Flow velocity calibration at cross section
(2)
Fig. 9. Flow velocity calibration at cross section
(3)
6.2. Simulating Maximum and Emergency Flow and Results The high velocities cause degradation to the entire bed of the reach, particularly in the outer curve,
where the city of Kafr El-Zayat is located. Consequently, the bridges' stability is expected to be at risk of
foundation failure because of the scouring action. So it is required to simulate and predict the velocities at
the outer curve and at bridge piers in case of high flow condition. To achieve that, the model was run for
the two considered scenarios, the maximum and the emergency flow conditions. The used surveyed reach
at the year of 2006 was simulated as an original case. The used boundary condition of the simulated year
were as presented in (Table 2).
The model results were presented at three cross sections A, B and C which are located just upstream
Bridges 1, 2 and 3 respectively. The results showed that maximum velocity values along Cross Sections A,
B and C were 0.76, 0.80 and 0.88m/sec in case of maximum flow; while in case of emergency flow the
results were 1.48, 1.37 and 1.48m/sec respectively (Figs. 10, 11 and 12). These figures illustrate also the
considered noticeable differences in velocity values in case of maximum and emergency flow conditions.
Table 2. Boundary condition
Flow Case Discharge (m.m3/day) Water Level (m)
Maximum 69.90 2.60
Emergency 220.00 5.90
Fig. 10. The velocity and bed profile at cross
Fig. 11. The velocity and bed profile at cross

Vol.16| September 2015 ISSN-5563-1682
VOL 16 ISSUE 9 September 2015 Paper 1 8
section a in cases of maximum and emergency
flow
section b in cases of maximum and emergency
flow
Fig. 12. The velocity and bed profile at cross section c in cases of maximum and emergency flow
7. SCOUR EVALUATION AND ANALYSIS
7.1. The Analysis Procedures The scour analysis was done to define the maximum scour at piers of the three bridges crossing Rosetta
Branch at Kafr El-Zayat associated to the release of high flow discharges in this reach. The field
measurements were combined with the hydrological data to be applied to the 2-D numerical model. The
model was applied to predict the water levels and velocities for the study area under different high
discharges (Fig. 13). The model results were used in addition to the procedures outlined in HEC-18 [22]
and HEC-20 [22] to estimate the scour at the bridge piers considering the general scour, local scour,
contraction scour, and bend scour.
a- Bed elevations
b- Water surface elevation (m)
c- Velocity distribution (m/s)
Fig. 13. The procedures of applying the 2-d model on the Kafr El-Zayat bridges at maximum flow
conditions
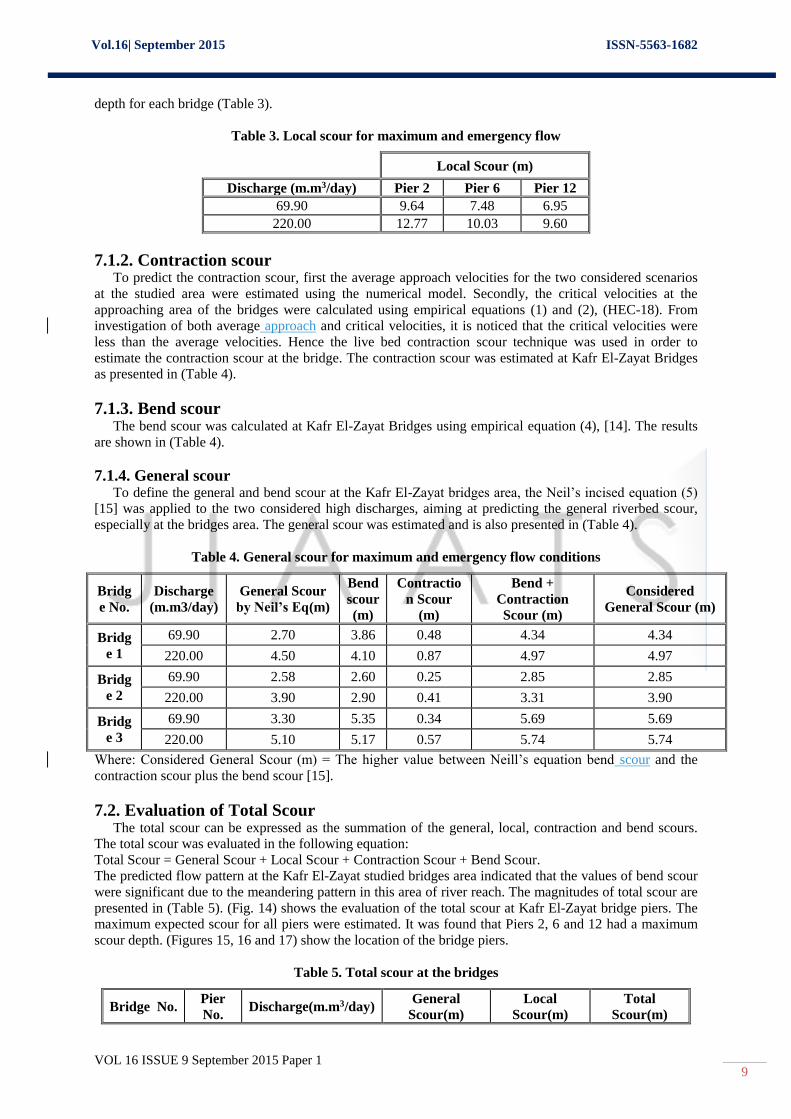
7.1.1. Local scour The piers' local scour hole was calculated using the hydraulic parameters based on the water velocities'
magnitudes and water depths obtained from applying the 2D model in case of maximum and emergency
flow at Rosetta Branch. The model results showed that Piers 2, 6 and 12 had the maximum local scour
Vol.16| September 2015 ISSN-5563-1682
VOL 16 ISSUE 9 September 2015 Paper 1 9
depth for each bridge (Table 3).
Table 3. Local scour for maximum and emergency flow
Local Scour (m)
Discharge (m.m3/day) Pier 2 Pier 6 Pier 12
69.90 9.64 7.48 6.95
220.00 12.77 10.03 9.60
7.1.2. Contraction scour To predict the contraction scour, first the average approach velocities for the two considered scenarios
at the studied area were estimated using the numerical model. Secondly, the critical velocities at the
approaching area of the bridges were calculated using empirical equations (1) and (2), (HEC-18). From
investigation of both average approach and critical velocities, it is noticed that the critical velocities were
less than the average velocities. Hence the live bed contraction scour technique was used in order to
estimate the contraction scour at the bridge. The contraction scour was estimated at Kafr El-Zayat Bridges
as presented in (Table 4).
7.1.3. Bend scour The bend scour was calculated at Kafr El-Zayat Bridges using empirical equation (4), [14]. The results
are shown in (Table 4).
7.1.4. General scour To define the general and bend scour at the Kafr El-Zayat bridges area, the Neil’s incised equation (5)
[15] was applied to the two considered high discharges, aiming at predicting the general riverbed scour,
especially at the bridges area. The general scour was estimated and is also presented in (Table 4).
Table 4. General scour for maximum and emergency flow conditions
Bridg
e No.
Discharge
(m.m3/day)
General Scour
by Neil’s Eq(m)
Bend
scour
(m)
Contractio
n Scour
(m)
Bend +
Contraction
Scour (m)
Considered
General Scour (m)
Bridg
e 1
69.90 2.70 3.86 0.48 4.34 4.34
220.00 4.50 4.10 0.87 4.97 4.97
Bridg
e 2
69.90 2.58 2.60 0.25 2.85 2.85
220.00 3.90 2.90 0.41 3.31 3.90
Bridg
e 3
69.90 3.30 5.35 0.34 5.69 5.69
220.00 5.10 5.17 0.57 5.74 5.74
Where: Considered General Scour (m) = The higher value between Neill’s equation bend scour and the
contraction scour plus the bend scour [15].
7.2. Evaluation of Total Scour The total scour can be expressed as the summation of the general, local, contraction and bend scours.
The total scour was evaluated in the following equation:
Total Scour = General Scour + Local Scour + Contraction Scour + Bend Scour.
The predicted flow pattern at the Kafr El-Zayat studied bridges area indicated that the values of bend scour
were significant due to the meandering pattern in this area of river reach. The magnitudes of total scour are
presented in (Table 5). (Fig. 14) shows the evaluation of the total scour at Kafr El-Zayat bridge piers. The
maximum expected scour for all piers were estimated. It was found that Piers 2, 6 and 12 had a maximum
scour depth. (Figures 15, 16 and 17) show the location of the bridge piers.
Table 5. Total scour at the bridges
Bridge No. Pier
No. Discharge(m.m3/day)
General
Scour(m)
Local
Scour(m)
Total
Scour(m)

Vol.16| September 2015 ISSN-5563-1682
VOL 16 ISSUE 9 September 2015 Paper 1 10
Bridge 1 Pier 2 69.90 4.34 9.64 13.98
220.00 4.97 12.77 17.74
Bridge 2 Pier 6 69.90 2.85 7.48 10.33
220.00 3.90 10.03 13.93
Bridge 3 Pier 12 69.90 5.69 6.95 12.64
220.00 5.74 9.60 15.34
Water Level (5.90)m for Q = 220m.m^3/day
Max. Water Level(2.60)mMin. Water Level(1.57)m
Nourth South
Kfer El-Zayat Bridge
Q = 220m.m^3/day
Original Bed (-4.00)
General Scour = 4.97m
Local Scour = 12.77m
Total Scour = 17.74m
Bridge
Pier
(-21.74)m
Fig. 14. Evaluation of the total scour at Kafr El-Zayat
Fig. 15. First bridge piers location
Fig. 16. Second bridge piers location
Fig. 17. Third bridge piers location
8. CONCLUSION The present study was carried out to analyze and evaluate the effect of releasing high discharges (69.90,
220.00m.m3/day) on the existing structures by using a 2-D numerical model and empirical equations to
predict the scour around bridge piers. The following main conclusions may be drawn:
1. Unexpected velocity profiles resulted in some cross sections were appeared due to the human
interference.
2. The maximum scour depth was directly proportional to discharge. 3. The increase of the scour hole around the piers of the first bridge was higher than the increase of the
scour hole around the piers of the second and third bridges.

Vol.16| September 2015 ISSN-5563-1682
VOL 16 ISSUE 9 September 2015 Paper 1 11
4. The local scour around the bridge piers estimated by the 2-D numerical model gave higher scour values
than the general scour (Neil’s equation) under the same conditions.
5. The scour around the bridge piers calculated by the scour bend equation [14] gave higher scour values
than both general scour equation (Neil’s equation) and contraction scour.
6. Contraction scour results gave the lowest scour values when compared to the other types of scours.
9. LIST OFSYMBOLS VC = Critical velocity. [ft/s]
ya = Average depth of flow upstream of the bridge. [ft]
D50 = Particle size in a mixture in which 50% are smaller. [ft]
Ys = Average depth of scour. [ft]
Y0 = Average depth of flow in the contracted section before scour. [ft]
Y1 = Depth of flow in the upstream of bridge. [ft]
Y2 = Depth of flow in the contracted section. [ft]
Vc = Critical velocity. [ft/s]
W1 = Bottom width upstream of bridge. [ft]
W2 = Bottom width in the contracted section. [ft]
Q1 = Flow in the upstream of bridge transporting sediment. [f3/s]
Q2 = Flow in the contracted section. [f3/s]
K1 = Exponent depending upon the mode of bed material transport.
Q = Discharge through the bridge. [f3/s]
Dm = Diameter of the smallest non-transportable particle in the bed material (1.25xD50) in the
contracted section. [ft]
W = Bottom width of the contracted section less pier width. [ft]
y0 = Average existing depth in the contracted section. [ft]
Zbs = Bend scour component of total scour depth. [ft]
V = Velocity of upstream flow. [ft/s]
y = Maximum depth of upstream flow. [ft]
Yh = Hydraulic depth of upstream flow. [ft]
se = Upstream energy slope. [ft/ft]
a = Angle formed by the projection of the channel centerline from the point of curvature to
a point which meets a line tangent to the outer bank of the channel.
[degrees
]
ygs = General scour depth. [ft]
df = Scoured depth below design floodwater level. [ft]
di = Average depth at bankfull discharge in incised reach. [ft]
qf = Design flood discharge per unit width. [cfs/ft]
qi = Bankfull discharge in incised reach per unit width. [cfs/ft]
m = Exponent varying from 0.67 for sand to 0.85 for coarse gravel.
Z = Multiplying factor (0.5 for straight reach, 0.6 for moderate bend, 0.7 for severe bend).
ys = Equilibrium scour depth. [ft]
y1 = Flow depth. [ft]
b = Pier width. [ft]
Fr1 = Froude number directly upstream of the pier KW = Means there would be a 5% reduction in the estimated scour depth approximately 0.95.
K1, K2,K3, and K4 = Correction factors.
10. REFERENCES [1] Hydraulic Research Institute (HRI), "Protection of Bank against Erosion along the River Nile".
Report No. (3), Cairo, Egypt, 2005.
[2] River Nile Development Project (RNDP), Ministry of Public Works and Water Resources, Egypt,
1991a, 1992b.
[3] Jean-Louis Briaud, Hamn-Ching Chen, Kuang-An Chang, Young-An Chung, Namgyu Park, Wei
Wang, and Po-Hung Yeh, "Establish Guidance for Soils Properties Based-Prediction of Meander
Migration Rate". Zachry Department of Civil Engineering, Texas A&M University, 2007.
[4] Hydraulic Engineering Circular 18. Fifth Edition, "Evaluating Scour at Bridges". FHWA HIF 12
003 HEC-18, Federal Highway Administration. U.S. Department of Transportation. Washington
D.C., 2012.

Vol.16| September 2015 ISSN-5563-1682
VOL 16 ISSUE 9 September 2015 Paper 1 12
[5] Flood Control District of Maricopa County (FCDMC), "River Mechanics Manual for DDMSW".
Draft, 2009.
[6] Federal Highway Administration (FHWA), "Evaluating Scour at Bridges". Hydraulic Engineering
Circular, Number (18), (HEC-18), 2001.
[7] Flood Control District of Maricopa County (FCDMC), "Drainage Design Manual for Maricopa
County". Draft: Chapter (11), 2007.
[8] Melville, B.W., "Local Scour at Bridge Sites". Report No. (117), University of Auckland, School of
Engineering, Auckland, New Zealand, 1975.
[9] Shen, H.W., Schneider, V.R. andKaraki, S.S., "Mechanics of Local Scour". Colorado State
University, Civil Engineering Dept., Fort Collins, Colorado, Pub. No. (CER66-HWS22), 1966.
[10] Sheppard, D. M., "An Overlooked Local Sediment Scour Mechanism". Proceedings of the 83rd
Meeting of the Transportation Research Board, Washington D.C., published in the J. of the
Transportation Research Board, Transportation Research Record. No. (1890), pp. 107-111, January
11-15, 2004.
[11] Lança, R., Fael, C., Maia, R., Pêgo, J., and Cardoso, A., "Clear-Water Scour at Comparatively Large
Cylindrical Piers", ASCE. Journal of the Hydraulic Division, Vol. (139), Issue (11), 2013..
[12] Hager, W. and Unger, J., "Bridge Pier Scour under Flood Waves". ASCE, Journal of the Hydraulic
Division, Vol. (136), Issue (10), 2010.
[13] Sheppard, D., Melville, B., and Demir, H., "Evaluation of Existing Equations for Local Scour at
Bridge Piers". ASCE, Journal of the Hydraulic Division, Vol. (140), Issue (1), 2014.
[14] Simons, Li & Assoc. (SLA), "Standards Manual for Drainage Design and Floodplain Management in
Tucson". Arizona. Prepared for City of Tucson, Department of Transportation. Engineering
Division, 1989b (revised July, 1998).
[15] Pemberton, E.L. and Lara, J.M., "Computing Degradation and Local Scour". U.S. Bureau of
Reclamation. Sedimentation section, Denver CO., 1984.
[16] Ettema, R., "Scour at Bridge Piers". Dissertation, Department of Civil Engineering, University of
Auckland, New Zealand, 1980.
[17] Melville, B.W. and Sutherland, A.J., "Design Method for Local Scour at Bridge Piers", ASCE.
Journal of the Hydraulic Division. Vol. (114), No. (10), Oct. 1988.
[18] Jones, J. Sterling and D. Max Sheppard, "Scour at Wide Piers", Proceedings for the 2000 Joint
Conference on Water Resources Engineering and Water Resources Planning and Management
Conference. Minneapolis. MN. July 30-August 2, 2000.
[19] Johnson, Peggy A., "Scour at Wide Piers Relative to Flow Depth. Stream Stability and Scour at
Highway Bridges", Compendium of ASCE conference papers edited by E. V. Richardson and P. F.
Lagasse. pp 280 . 287, 1999.
[20] Rossell, R. and Ting, F., " Hydraulic and Contraction Scour Analysis of a Meandering Channel"
James River Bridges near Mitchell, South Dakota. J. Hydraul. Eng., 139 (12), 1286–1296, 2013.
[21] SMS, "Surface Water Modeling System. Reference Manual", version 8.0. Brigham. Young
University. Engineering Computer Graphics Laboratory. Provo, Utah, 2002.
[22] Federal Highway Administration, "Scour ability of Rock Formations. U.S. Department of
Transportation Memorandum", HNG-31. Washington D.C. R5, 1991.