brevard county public schools school improvement plan...
TRANSCRIPT

Page 1
Brevard County Public Schools
School Improvement Plan
2013-2014
Name of School: Area:
Principal: Area Superintendent:
SAC Chairperson:
Superintendent: Dr. Brian Binggeli
Mission Statement:
Provide a positive school environment where students may develop their individual skills and talents and prepare for their future endeavors in high school and beyond. Our school culture will foster
security, responsibility, respect, and achievement for all.
Vision Statement:
Provide a quality education in a friendly and supportive environment.
DeLaura Middle School Central
Claudia L. Shirley
Jane Cline
Marc Rocque

Page 2
Brevard County Public Schools
School Improvement Plan
2013-2014
RATIONALE – Continuous Improvement Cycle Process
Data Analysis from multiple data sources: (Needs assessment that supports the need for improvement-
Examples may be, but are NOT limited to survey data, walk-through data, minutes from PLC’s or Dept. Mtgs. Move
away from talking about every single data source and determine your rationale. Much like the PGP, what is your
focus and why?)
FCAT Data: In 2013, we earned 631 points towards our school grade, 76% of students in grades 7 and 8
earned high achievements in Reading which was a 1% decrease from 2012, whereas, students in grades 7
and 8 earning high achievements in Math saw a 4% decrease. Students making gains in Reading stayed at
65% with students making gains in Math declined 8% (70% to 62%). FCAT Science and Writing
assessments experienced realignment with the scoring system; Writing achievement levels increased
from 3.0 to 3.5 and more rigorous Science cut scores were implemented. Sixty-eight percent of 8th
grade students achieved the 3.5 level and 90% achieved the 3.0 level. The FCAT Writing achievement
level standard for 2014 will move to 4.0. Only 45.7% of 8th graders scored 4 or higher on the 2013
writing assessment; this indicates a need to improve instructional methods and focus this school year to
meet this rising expectation. Seventy-two percent of 8th graders achieved a level 3 or above on the
FCAT Science which was a 5% decrease from 2012.
The bottom 25% data was reviewed, analyzing student performance relating to FCAT Reading and FCAT
Mathematics improvement. We moved into the 70%tile with our lowest 25% Reading students, gaining
11% (59% in 2012 to 70% in 2013). In Math, the lowest 25% student performance dropped to 46%; this
was a 14% decline from 2012. This continued decline in Math, for both high performing and the lowest
25% students, indicates a need to support students academically and focus on instructional methods.
In 2013, The DOE used more rigorous standards in assessing a school’s grade contributing in-part to
DeLaura’s grade dropping from an A to a B. The “Bottom 25% Learning Gains in Mathematics” fell below
the 50% minimum. The number of students not making gains declined by four points and resulted in only
46% of the bottom 25% making gains (2013) in Mathematics. Unlike most other middle schools,
DeLaura’s bottom 25% includes students scoring Level 3 in Mathematics. Therefore, these students
were enrolled in Algebra. Although the results were calculated in, the number of students tested at
DeLaura was much smaller.
We have synthesized as much data as possible within Table One: 4-Year Comparison School Grade
Indicators. The school comparison table for school grades provides brevity of capturing data over
multiple years enhancing data analysis and maintaining the integrity of the data. In Table One, 10
indicators are identified and used by The DOE in computing the school’s overall grade.

Page 3
Table 1: 4-Year Comparison School Grade Indicators DeLaura
Year Grade Points
H %
Read
H %
Math
H %
write
H %
Science
% LG
Read
% LG
Math
%25
LGR
%25
LGM
Free
/Red
Minority
2013 B 629 76 78 68 72 65 62 70 46 21 24
2012 A 677 77 82 87 77 65 70 59 60 20 21
2011 A 633 91 91 90 80 63 74 72 72 18 21
2010 A 661 90 93 92 82 68 80 71 85 15 16
An analysis of Algebra and Geometry End Of Course (EOC) data indicated very positive results. Ninety-two percent of the 259 students completing Algebra scored at or above L3 and 100% (40) of the students scored at L3 and above (9 at L3, 14 at L4 and 17 at L5) as noted in Table 2. In 2013, a vigorous screening process was used to identify students who possessed the mathematics maturity for higher mathematics concepts and algebraic expressions. One hundred percent of the 7th grade students taking Algebra scored at L3 and above. In 2014, this process will continue with more attention on the initial screening process and discussing the traits used by mathematics teachers to continue to be consistent and use objective data from state and district assessments, teacher tests, and observation for recommendations into Algebra.
Table 2: 2013 EOC Algebra and Geometry Data
EOC Algebra 2013 Total Students = 259
Achievement Level (AL) 1 2 3 4 5
Algebra % of students Less
than 1% 7% 49% 19% 25%
Algebra 7thand 8th student numbers (259) 2 18 126 49 64
Geometry % of students 0 0 22% 35% 43%
Geometry student numbers (40) 0 0 9 14 17
FAIR Data: DeLaura Middle School students demonstrated gains in Reading Comprehension as measured
by FAIR. Seventh graders began the year with an average Reading Comprehension score average of
54.97%tile and ended the year with 60.47%tile. This was an increase of 5.5%tiles. Eight graders began
the year with an average Reading Comprehension score average of 54.89%tile and ended the year with
60.91%tile. This was an increase of 6.02%tiles. Combined, DeLaura’s students increased their beginning
of the year Reading Comprehension score average of 57.1%tile to 60.68%tile at the end of the year.
This was a combined increase of 3.58%tiles. Results from the September 2013 AP1 impulse, showed 7th
grade students at the 64th %tile rank and 8th grade students at the 65th%tile for a school Reading
Comprehension average score of 64.5%tile.
Renaissance Learning Accelerated Reader Data: DeLaura utilizes the Renaissance Learning’s Accelerated
Reader program to enhance independent reading opportunities for students. In 2012-2013, 376 seventh
grade students tested on 4,656 independent reading books with a 77% pass rate. This is a slight
decrease from the 2011-2012 78% pass rate. In 2012-2013, approximately 8% of the tests taken were
from nonfiction material. This is also a slight decrease from 2011-2012 when 10% of the tests taken
were from nonfiction titles. Likewise in 2012-2013, 335 eighth grade students tested on 3,020
independent reading books with an 83.3% pass rate. This is a 0.3% increase from the 2011-2012 score.
Of the 8th grade tests taken in 2012-2013, 21% were nonfiction titles. This is a significant increase
Page 4
from the 2011-2012 as 14.7% of the tests taken were from nonfiction. The data indicates a strong need
to reinforce both independent as well as cross-curricular nonfiction reading. As we move toward
Common Core State Standards, students are required to read more complex text, indicating a need for
classroom teachers to reinforce complex text along with higher level vocabulary.
Analysis of Current Practice: (How do we currently conduct business?)
Move any Action Steps that have become standard practice to this section.
DeLaura Middle School is recognized as a National Model School of Professional Learning Communities at
Work and is referenced on Dufour’s website, www.allthingsplc.org. This practice has been firmly
embedded into DeLaura’s culture. As a PLC model school, our implementation process has strengthened
our faculty’s resolve to be the best. We will continue our implementation of the Districts’ systemic
instructional model BEST (Brevard Effective Strategies for Teaching) promoting three goals: student
engagement, student achievement and continuous teaching improvement. This model supports the
implementation of Marzano’s research on student achievement and Dr. Max Thompson’s action-oriented
research.
Our 2012-13 School Improvement Plan objective, All teachers at DeLaura Middle School will implement Thinking Maps within lessons as appropriate to increase literacy and student achievement across the curriculum , was supported by nine action strategies. Of the nine strategies, three were completed with
positive results, and six are sustaining; we consider these now to be a “best practice” and will maintain
the way we conduct PLT business fostering a collaborative culture. DeLaura is working to become a more
dedicated community of lifelong-learners. This can be attributed to providing additional professional
development opportunities expanding on B.E.S.T. strategies. Additionally, we will maintain our school
focus on book studies: Classroom Instruction that Works (2010-2011); The Art and Science of Teaching (2011-12); The Practice of Authentic PLCs, and Thinking Maps (2012-2013) to include resources in the
area of differentiated instruction, student engagement, complex text, and lesson planning. We will
continue our practice of discussing student work, developing common summative assessments,
administrative walk-throughs, and teacher leaders presenting best practices at faculty meetings
throughout the school year. Furthermore, DeLaura will continue with PLCs in Interdisciplinary grade
level, Department, Gifted and Collaborative Mutual Accountability Teams (focusing on bottom 25% of
their team’s students).
During the summer, our Data Team (PLT) analyzed the 2012-2013 FAIR, FCAT assessment results, as
well as selected common MESH (Math, English, Science, History, i.e., Civics and US History), DA Music
(Band, Chorus and Orchestra) summative assessments along with rising 7th grade data in Reading and
Math. Additionally, data and information pertaining to student achievement was reviewed. This analysis
was presented to the faculty during preplanning and distributed to the core academic areas for the
utilization and expansion of DeLaura’s current instructional practices. We sent a team of teachers and
administrators to the Common Core Summer Institute (CCSI), Peer Coaching Training (PCT) and
continued our HPLC team training with the district. Teams developed Action Plans to assist student
achievement, shifts in curriculum, support professional development, and foster collegiality to align with
the District Strategic Plan.

Page 5
Data chats with students in the area of learning performance in Reading became a common practice in
the Language Arts classroom last year and will continue in the new school year. Students scoring Level 1
or 2 on the 2013 Reading FCAT, receive intensive instruction in additional reading classes. DeLaura uses
Journeys 1 and 2, a specific reading program supported by technology and researched based strategies.
Due to Reading success, Data chats for math will be introduced through the math teacher based on
FCAT assessments, DA and pre-assessment results. This year, through classroom enrollment allocations
for ESE and district support, students who scored a Level 1 or 2 on the 2013 Math FCAT will have the
opportunity to receive intensive instruction in additional math classes.
During pre-planning, teachers were led in a discussion and activity to identify Classroom Walk Through
“Look Fors and Ask Abouts” to promote transparency through a variety of methodology and pedagogy
practices which support a High Performing Learning Culture (HPLC) and will ultimately improve student
achievement. A “Look Fors and Ask Abouts” list was established and will be the focus for CWT
throughout the year. Through our established relationships within PLTs, we will continue to implement
technology to support CWT and the Individual Performance Appraisal System. Further enhancements are
accomplished through building-level trainings addressing the research design and implementation of
teachers’ PGPs.
The FCAT Writing achievement level standard for 2014 will move from 3.5 to 4.0. On FCAT Writes
2013, only 45.7% scored 4 or higher indicating a need to improve instructional methods and focus. Our
goal is to increase the number of 8th grade students achieving a 4 or higher to 50% or better on the
summative assessment by preparing for the new scoring requirements. Prior to this year, 3.5 was a
passing score as compared to 4 for the 2014 testing year. Seventh grade students will be administered
the formative assessment of “Mock Writes” throughout the school year to monitor progress in order to
meet the challenges of more argumentative writing. In anticipation of this change, our Language Arts
teachers have joined forces with the Social Studies department to prepare lessons targeted to meet
this need. Furthermore, Science, Math, Fine Arts, and Intensive Reading teachers are taking part in
this effort through the proven methods of common note-taking and summarizing techniques.
Professional development trainings and sessions will be scheduled to support this effort and will include
technology in some content areas. The September essay scores will be recorded in A3 data system,
presented at an upcoming faculty meeting and the school-wide average for both grades will provide a
data base-line for informed instruction and establishing student achievement writing goals.
Our Homeroom advisory program and curriculum continues to provide activities and information promoting Character Education, Anti-Bully, Depression, Suicide Prevention, Internet Safety, and Community Service Learning awareness/opportunities. Gifted students are assigned to a Gifted endorsed teacher or in-training Gifted teacher as their homeroom advisors. Additionally, Gifted homerooms use an expanded set of lessons that concentrate on topics such as careers, PSAT, college and creativity/critical thinking and service learning.
Enrichment programs, clubs, and academic acceleration opportunities for students have expanded over
the past three years. We now maintain two Lego Robotic Teams, a Math Club, Science Bowl Team, along
with the normal middle school club offerings. In addition, we received a $4,000.00 grant from the
Florida Endowment Foundation for Florida’s Graduates, Inc. to promote a Girls Get I.T. (STEM) and
SUPERB (Parent and student Anti-Bullying) Clubs. Academically, students experience rigor and relevance
with classes such as Science Research, Yearbook, Creative Writing, Mass Media, Art, Music, and TV

Page 6
production and are challenged even more so with high school classes in Algebra I, Geometry, Spanish I
and II and Computing for College and Careers in the CTE arena.
Collaborative Mutual Accountability Teams will continue to monitor our struggling students (at-risk,
lowest 25%) utilizing state, district and school data, state assessments, FAIR, ESE, DA, Common and
Free and reduced reports to develop SMART goals supported by action strategies. Also, we will require
that each guidance counselor conduct periodic follow-ups to assist teams with progress monitoring to
ensure an overall performance improvement within the FRL group and our at-risk students.
We use the academic support program funding to implement the “NO ZERO ZONE” (NZZ) strategy and provide opportunities to remediate for FCAT achievement level one and two students. The NZZ strategy serviced 479 students with 360 or 75% completing missing assignment.
Best Practice: (What does research tell us we should be doing as it relates to data analysis above?)
DeLaura is a practicing Professional Learning Community (PLC) that works as evidenced with our
instructional program of designated PLT’s: MESH teams, Departments, Data, CMAT, Gifted, Common
Core, HPLC Team. These PLCs focused on student achievement, student engagement and continuous
teaching improvement. As a PLC, we consistently work together on implementing researched base
instruction across the curriculum, designating time and common planning to enhance collaboration,
construct common assessments in all content areas, review data, and generate SMART objectives and
goals. “The foundation for productive classroom assessment is teachers of the same content agreeing on the most important learning expectations for the course or semester.” Reeves (2004)
Carol Tomlinson’s work in differentiated instruction indicates that classroom instruction should target
individual student needs and strengths. This is accomplished through differentiation in content for
different groups of students, process in the lesson delivery and providing choices in the product they
complete for lesson assessment. Differentiation is a practical strategy that can be used with students
of all ability levels – teaching them at their level of readiness. Planning is a key component of
differentiated instruction; when done right, it is time-intensive and a stretch for the teacher but will
generate great rewards in the classroom.
Dr. Max Thompson states, “To raise the standards for students, you raise the standards for teachers.”
He further emphasizes the importance of teachers utilizing research-based high impact strategies that
help raise student learning and achievement significantly; (1) extended thinking strategies, (2)
summarizing, (3) vocabulary in context, (4) advance organizers, and (5) non-verbal representations. Dr.
Marzano’s research and studies support Dr. Thompson’s Learning-Focused balanced achievement program
for schools. A balanced approach to student achievement maintains guidance and supports researched –
based instruction, integrates literacy in all studies, provides assistance for all student achievement
levels and utilizes assessments throughout the learning process within the curriculum. Additionally, the
balanced approach advocates a culture of continuous improvement supported by leaders and teachers
willing to learn and facilitate programs with consistency and fidelity. (Thompson, 2011)
In our first year as a “Thinking Maps” school, we experienced positive growth among our lowest 25%
readers based on FCAT Reading, maintained learning gains in reading, and met with positive
implementation outcomes from teachers, students and parents. As a Thinking Maps school, we will
Page 7
continue to provide training and utilize Thinking Maps in all content areas. Thinking Maps encourage
extended thinking skills as students work collaboratively to use higher order thinking strategies to build
connections and deepen understanding of new concepts and skills. Thinking Maps support interactive
learning, promote reflective thinking, and provide a common language for teachers and students across
all content areas. Teachers can use Thinking Maps to assess prior knowledge as well as determine what
was learned. Students are able to construct knowledge by forming informational patterns, transferring
thinking processes to content learning, and creating final products. Most importantly, Thinking Maps
promote metacognition (Thinking Maps: Tools for Learning, David Hyerlo, Ed.D, 1995).

Page 8
CONTENT AREA:
Reading Math Writing Science Parental Involvement
Drop-out Prevention Programs
Language Arts
Social Studies
Arts/PE Other:
School Based Objective: (Action statement: What will we do to improve programmatic and/or instructional
effectiveness?)
DeLaura Middle School will continue its two-year plan to implement Thinking Maps within lessons
with a focus on higher order thinking skills and differentiated instruction to increase
comprehension of material in all content areas with an emphasis on literacy and math.
Strategies: (Small number of action oriented staff performance objectives)
Barrier Action Steps Person
Responsible Timetable Budget In-Process
Measure 1. Identifying
needs
1. Implement
school CC
action plan
CC Team
members
On going 1,500.00 from
state for the
CCSI
See Appendix 1
2. Identifying
needs
2. Implement
HPLC action
plan
HPLC Team
members
On going See Appendix 2
3. Identifying
needs
3.Implement
Peer Coaching
Action Plan
Peer Coaching
Team members
On going See Appendix 3
4. Teaching
allocation
4. Hire a Math
ESE teacher to
support FCAT
L1 and L2 math
students.
Principal August 2013 6 day count,
Monitor interim
and nine weeks
grade reports,
FCAT Math LG’s
of Lowest 25%
5. Time and
presenters,
release time
for teachers
and funding
5. Provide PD in
content areas to
promote
Differentiated
Instruction,
student
engagement,
complex text
and Lesson
Plans/Design.
Professional
Development
Council, teacher
leaders, district
resource teachers
Pre-planning,
Early Release
and PD days
Mock writing
evaluation
200.00 SAC
1,000.00 ASP
1,000.00 School
Lesson Plans
SAC Faculty
survey
Student survey
Lowest 25%
Read and Math
Mock writing
evaluation, In-
service records
6. Time and
funding to
train new
teachers.
6.Provide
Thinking Map
training to new
staff members
PDC, Teacher
leaders and
resource teachers
PDD, and
Release time for
teachers
400.00 School Lesson plan
documenting TM
reviewed with
Administrator/
SharePoint
7. Scheduling
presentations
7. Share CC
Lesson plans
with Thinking
Map, DI, and
instructional
strategies for
Administration
Teachers
Faculty meetings
Team meetings
SharePoint
Lesson plans
review
colleagues
Presentations
Student survey

Page 9
math and
literacy.
8. Time and
technology
preparations
Provide training
in 21 century
communication
skills and
knowledge to
enhance PLT
productivity.
PDC and teacher
leaders
August 2013-
May 2014
PLT meetings,
Lesson plans
reflecting
technology
enrichments
EVALUATION – Outcome Measures and Reflection-begin with the end in mind.
Qualitative and Quantitative Professional Practice Outcomes: (Measures the level of
implementation of professional practices throughout the school)
Currently, we have 85% of the faculty trained in Thinking Maps. In the 2013-14 school year, 100% of
DeLaura teachers will continue to be trained in Thinking Maps and all teachers will develop and implement
Common Core lesson plans and or units of study that support higher order thinking skills (Thinking Maps,
Summary Writing, Complex Text, Problem Solving, Vocabulary) with emphasis on Differentiated
Instruction. Quantitative measures will be pre/post exit slips, lesson plans, and number of PGP’s with a
direct correlation to DeLaura’s School Improvement Plan. Qualitative data will include surveys, PLT
minutes, CWT, and colleague observation slips.
Qualitative and Quantitative Student Achievement Expectations: (Measures student
achievement)
In the 2013-14 school year, 100% of DeLaura students across the curriculum will be exposed to Common Core lessons and or units of study that emphasize literacy and math skills through Thinking Maps, common note-taking, summary writing utilizing non-fiction text, close reading of complex text, problem solving and higher order vocabulary which will increase assessment scores. In 2012-13, quantitative measures will be an increase of: the average FAIR Reading Comprehension percentage from 64.5% to 66.5%, the average 8th grade Mock Writes scores from 2013 September 2.7 to 2013 December 3.2 , the average 7th grade CC writing from 1.1 to 2.0, FCAT Reading gains for the lowest 25% group will maintain 70% and FCAT Math gains for the lowest 25% group will increase from 46% to 50%. In addition, students will be surveyed in the fall and spring to show an increase in confidence when comprehending content material due to exposure to lessons focused on CC and higher order thinking skills; 70% being DeLaura’s goal.
Page 10
MULTI-TIERED SYSTEM OF SUPPORTS (MTSS)/RtI This section meets the requirements of Sections 1114(b)(1)(B)(i)-(iv) and
1115(c)(1)(A)-(C), P.L. 107-110, NCLB, codified at 20 U.S.C. § 6314(b).
A school administrator, reading teacher, intensive math teacher, literacy coach, school counselor, and
IPST member participate as members of our schools MTSS Leadership Team. A focus of the team will
be to communicate and facilitate a problem/decision‐making system to ensure assistance for struggling
students. The team will plan, implement, and monitor progress to improve student achievement through
data collection. In the summer months, team members reviewed common assessment and FCAT results to
identify trends and focus areas. During pre-planning, the team members presented to the faculty the
school intervention plan. By incrementally improving our strengths and reducing our weaknesses, we
improve our core instruction. The team is actively involved in the developing of intervention strategies as
well as analyzing student assessment data. In addition, they analyzed data from our common summative
assessments to determine the focus for the school year. Team members provide monthly data analysis to
the faculty and staff and monitor student progress. The team is a key conduit for communications within
the school for at risk students. Assessment and Information Management system(AIMS), FCAT,
summative assessments, FCAT/EOC practice simulations, formative assessments, Florida Assessment for
Instruction in Reading (FAIR), Diagnostic Assessment for Reading, Math and Science (DAR), and grade
reporting will be used to track and monitor student learning. In 2013, the school's MTSS resource
teacher will regularly present to the faculty current data and best practice strategies to promote
student achievement. Regular cross talks and updates on our response to intervention with the school’s
Data team and Literacy Team will continue. New personnel will be trained on the software specifics of
the MTSS by their team leaders, counselors, and the technology specialist. PARENT INVOLVEMENT: (Parent Survey Data must be referenced) Title I Schools may use the Parent Involvement Plan to
meet the requirements of Sections 1114(b)(1)(F) and 1115(c)(1)(G), P.L. 107-110, NCLB, codified at 20 U.S.C. § 6314(b).
DeLaura Middle School was tied for the highest percent of parent responses in a middle school. DeLaura
Middle School had 319 (40.5%) parent/guardian responses to the 2013 online parent survey. This is a
decrease of 5.5% from last year. As was the previous two years, parents responded that email (94.6%)
and Edline (65.9%) were the best tools for communication. DeLaura saw a 8.1 % decrease in response for
using Edline for communication. We have committed to maintaining 100% of students registered with an
active Edline account and maintaining at least a 95% and higher parent activation Edline account.
When addressing school personnel, 84.1% of parents maintained that the front office did an excellent
job welcoming parents to the school. As for staff members addressing the needs and concerns of
parents, more than 60% believed guidance counselors, office staff, and nurse, did an excellent job. Fifty
percent to 57% of parents that responded noted the principal, assistant principal, dean, and teachers did
an excellent job. Cafeteria staff was rated the lowest at 44.6% excellence.
Eighty-one percent of parents responded that they have attended informational meetings or academic
events. This is down one percent from last year. Of those parent responses, 92.5% felt that the
information they received was useful. This is an increase from last year of 5.5%. As in the past two
years, parents not attending informational or academic events noted their lack of participation was due
to inconvenient meeting times, or that the topics were not relevant to their child (43.5% for both).
Seventy-three percent of parents checked that Wednesday evenings were best to attend school events.
Overall, parents have shown a positive response to quality and quantity of information they receive.
Progress reports, grade reports, assessment information, and technology received ‘good to excellent’
remarks. Similarly, parents have been pleased with school meals, transportation, and cleanliness. More

Page 11
than 75% rated these areas “good to excellent”. Over 99% of parents indicated they have internet
access. As for specific school subjects, at least 72% of parents rated all core subjects ‘good to
excellent’. Overall, parents rated DeLaura Middle School with 89.1% “excellent to good’ satisfaction.
DeLaura Middle School has achieved the Gold School/Five Star Award for the past 13 years with
recorded volunteer hours for the past three school years of 5,454 hours, 5,775.5 hours, and 5,508
hours respectively. Parental involvement is encouraged throughout the year through the school’s
website, EDLINE, Kibbles and Bits (school e-mail), electronic newsletter, and our active DeLaura Parent
Organization (DPO). Parents also serve on the School Advisory Council to assist in decision-making for
school improvement initiatives and/or volunteer to assist with athletics, clubs, activities and special
events. In addition, we have parents from SAC and DPO attending the district’s scheduled Parent
Leadership Team meetings. During the registration process, the DPO recruits new parent members and
provides information on upcoming meetings and school events. The DPO coordinates and assists with
parent volunteers for school events (Literacy and Math programs), awards programs, and community
events. In addition to monthly board and general meetings, DPO Board members meet monthly with
administration to discuss campus activities and related school business. Many opportunities within the
school year exist to inform parents of expectations, and student study skills/academic progress.
Early Warning Systems (Formerly Attendance, Suspension, and Graduation Rate)
1. Middle School Indicators
The following data shall be considered by middle schools.
a) Students who miss 10 percent or more of available instructional time. 19
b) Students who fail a mathematics course. 1
c) Students who fail an English Language Arts course. 4
d) Students who fail two or more courses in any subject. 2
e) Students who receive two or more behavior referrals 37
f) Students who receive one or more behavior referrals that lead to 47 suspension, as defined in s.1003.01(5), F.S.
CTE/STEM: The following data may be considered by middle and high schools.
a) Students enrolling in one or more CTE courses. 714
b) Students who have completed one or more CTE courses who enroll 0
in one or more accelerated courses 0
c) Completion rate (%) for CTE students enrolled in accelerated courses 0
d) Students taking CTE industry certification exams 0
e) Passing rate (%) for students who take CTE industry certification exams 0
f) CTE program concentrators N/A
g) CTE teachers holding appropriate industry certifications 0
STUDENT SURVEY RESULTS (Required):
We had 74% of our students complete the Brevard Public Schools Student Survey (580/787). Of those
students, 99.66% of them had computer access at home. The survey had students reflect on
themselves and the importance of their actions. The majority of students (78.45%) were confident with
Page 12
(TITLE 1 SCHOOLS ONLY)
Highly Effective Teachers
Describe the school based strategies that will be used to recruit and retain high quality, highly effective teachers to the school.
Descriptions of Strategy Person Responsible Projected Completion
Date
1.
2.
3. Non-Highly Effective Instructors Provide the number of instructional staff and paraprofessionals that are teaching out-of-
field and/or who are not highly effective. *When using percentages, include the number of teachers the percentage represents (e.g., 70% [35]).
Number of staff and paraprofessionals that are
teaching out-of-field/and who are not highly
effective
Provide the strategies that are being
implemented to support the staff in becoming
highly effective
who they were and their decisions. Eighty-three percent of students chose ‘having tolerance for others’
as most important for acceptance. To promote anti-bullying campus wide we will implement the SUPERB
(Parent and student Anti-Bullying Club) program utilizing the Stand Up and Speak Out Club.
When it comes to higher education, 82.24% of students responded that they would like to attend college
after high school. Eight percent of students still had not decided yet. Students were consistent on how
they believe they could achieve their fullest potential. The majority of our students selected
‘sometimes’ to all three options for reaching their potential. Those three options consisted of
collaboration, demonstrations, and participation. All but 20 students agreed that school work will help
them later in life. Students also responded to questions about technology use. Almost 40% of students
surveyed that they had received a hurtful text or email. Twenty-eight percent of students responded
that problems online had caused problems at school. Of all the students that responded, 81% of
students felt safe at school.
Page 13
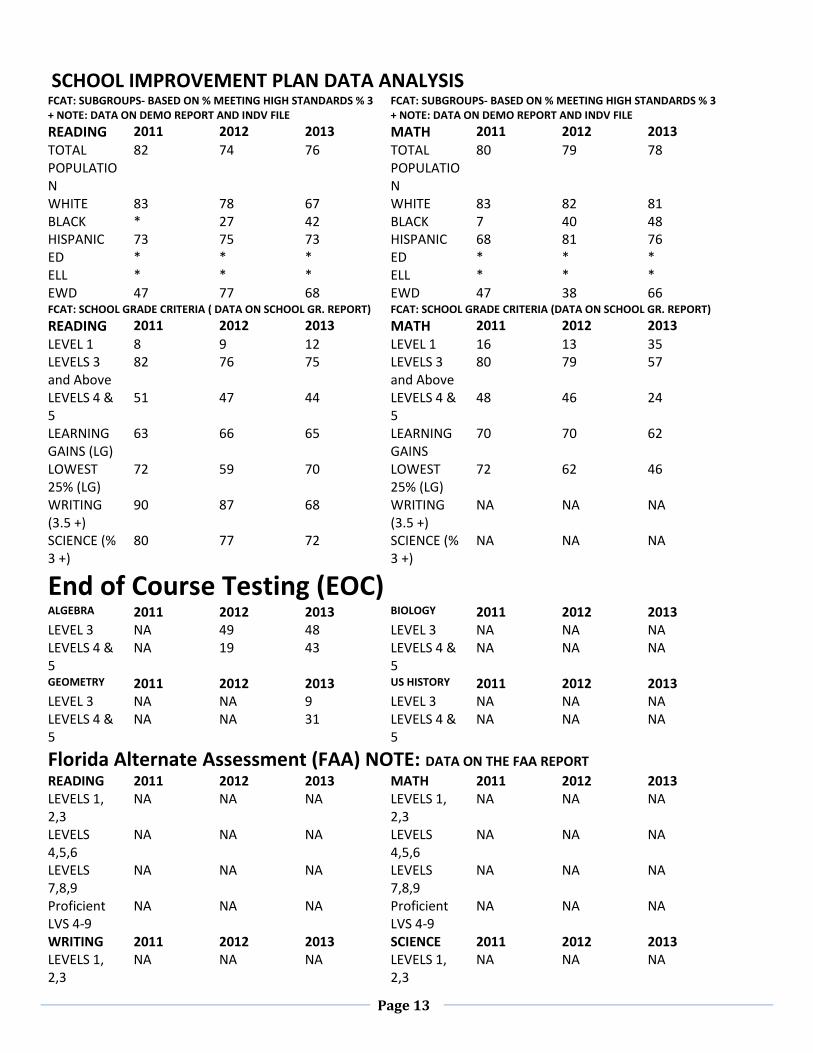
SCHOOL IMPROVEMENT PLAN DATA ANALYSIS FCAT: SUBGROUPS- BASED ON % MEETING HIGH STANDARDS % 3 + NOTE: DATA ON DEMO REPORT AND INDV FILE
FCAT: SUBGROUPS- BASED ON % MEETING HIGH STANDARDS % 3 + NOTE: DATA ON DEMO REPORT AND INDV FILE
READING 2011 2012 2013 MATH 2011 2012 2013
TOTAL POPULATION
82 74 76 TOTAL POPULATION
80 79 78
WHITE 83 78 67 WHITE 83 82 81 BLACK * 27 42 BLACK 7 40 48 HISPANIC 73 75 73 HISPANIC 68 81 76 ED * * * ED * * * ELL * * * ELL * * * EWD 47 77 68 EWD 47 38 66 FCAT: SCHOOL GRADE CRITERIA ( DATA ON SCHOOL GR. REPORT) FCAT: SCHOOL GRADE CRITERIA (DATA ON SCHOOL GR. REPORT)
READING 2011 2012 2013 MATH 2011 2012 2013
LEVEL 1 8 9 12 LEVEL 1 16 13 35 LEVELS 3 and Above
82 76 75 LEVELS 3 and Above
80 79 57
LEVELS 4 & 5
51 47 44 LEVELS 4 & 5
48 46 24
LEARNING GAINS (LG)
63 66 65 LEARNING GAINS
70 70 62
LOWEST 25% (LG)
72 59 70 LOWEST 25% (LG)
72 62 46
WRITING (3.5 +)
90 87 68 WRITING (3.5 +)
NA NA NA
SCIENCE (% 3 +)
80 77 72 SCIENCE (% 3 +)
NA NA NA
End of Course Testing (EOC) ALGEBRA 2011 2012 2013 BIOLOGY 2011 2012 2013 LEVEL 3 NA 49 48 LEVEL 3 NA NA NA LEVELS 4 & 5
NA 19 43 LEVELS 4 & 5
NA NA NA
GEOMETRY 2011 2012 2013 US HISTORY 2011 2012 2013 LEVEL 3 NA NA 9 LEVEL 3 NA NA NA LEVELS 4 & 5
NA NA 31 LEVELS 4 & 5
NA NA NA
Florida Alternate Assessment (FAA) NOTE: DATA ON THE FAA REPORT
READING 2011 2012 2013 MATH 2011 2012 2013 LEVELS 1, 2,3
NA NA NA LEVELS 1, 2,3
NA NA NA
LEVELS 4,5,6
NA NA NA LEVELS 4,5,6
NA NA NA
LEVELS 7,8,9
NA NA NA LEVELS 7,8,9
NA NA NA
Proficient LVS 4-9
NA NA NA Proficient LVS 4-9
NA NA NA
WRITING 2011 2012 2013 SCIENCE 2011 2012 2013 LEVELS 1, 2,3
NA NA NA LEVELS 1, 2,3
NA NA NA
Page 14
LEVELS 4,5,6
NA NA NA LEVELS 4,5,6
NA NA NA
LEVELS 7,8,9
NA NA NA LEVELS 7,8,9
NA NA NA
Proficient LVS 4-9
NA NA NA Proficient LVS 4-9
NA NA NA
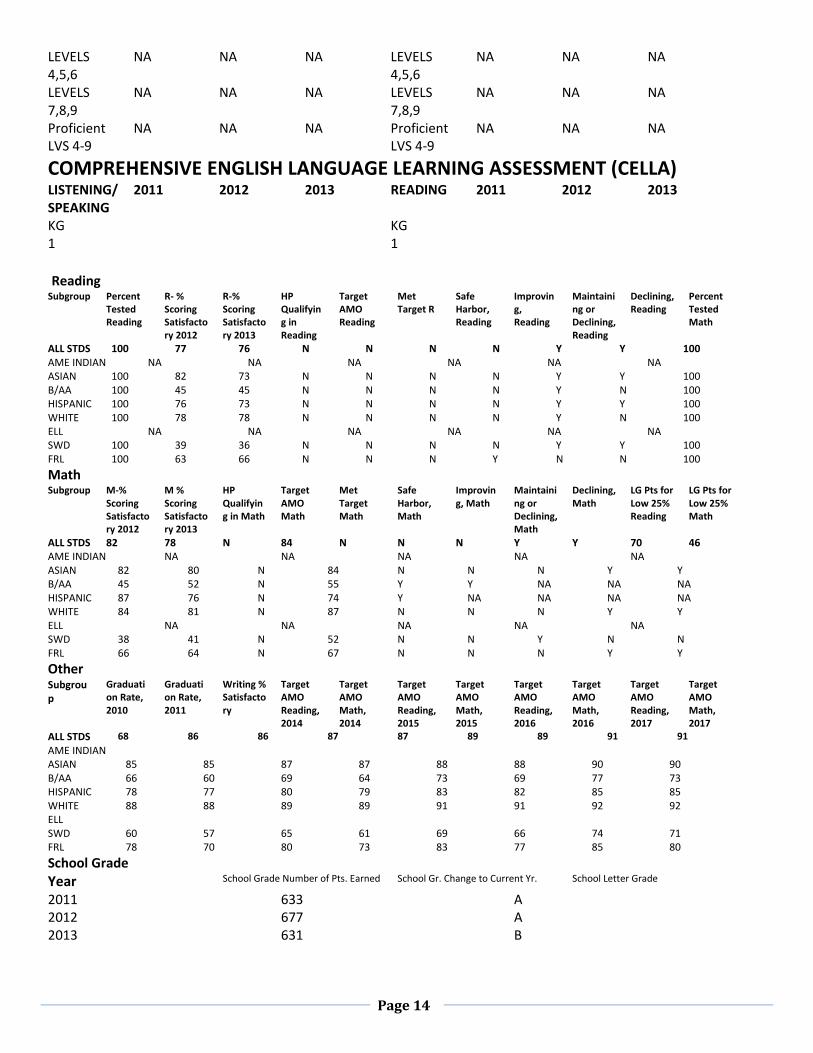
COMPREHENSIVE ENGLISH LANGUAGE LEARNING ASSESSMENT (CELLA) LISTENING/SPEAKING
2011 2012 2013 READING 2011 2012 2013
KG KG 1 1
Reading Subgroup Percent
Tested Reading
R- % Scoring Satisfactory 2012
R-% Scoring Satisfactory 2013
HP Qualifying in Reading
Target AMO Reading
Met Target R
Safe Harbor, Reading
Improving, Reading
Maintaining or Declining, Reading
Declining, Reading
Percent Tested Math
ALL STDS 100 77 76 N N N N Y Y 100 AME INDIAN NA NA NA NA NA NA ASIAN 100 82 73 N N N N Y Y 100 B/AA 100 45 45 N N N N Y N 100 HISPANIC 100 76 73 N N N N Y Y 100 WHITE 100 78 78 N N N N Y N 100 ELL NA NA NA NA NA NA SWD 100 39 36 N N N N Y Y 100 FRL 100 63 66 N N N Y N N 100
Math Subgroup M-%
Scoring Satisfactory 2012
M % Scoring Satisfactory 2013
HP Qualifying in Math
Target AMO Math
Met Target Math
Safe Harbor, Math
Improving, Math
Maintaining or Declining, Math
Declining, Math
LG Pts for Low 25% Reading
LG Pts for Low 25% Math
ALL STDS 82 78 N 84 N N N Y Y 70 46 AME INDIAN NA NA NA NA NA ASIAN 82 80 N 84 N N N Y Y B/AA 45 52 N 55 Y Y NA NA NA HISPANIC 87 76 N 74 Y NA NA NA NA WHITE 84 81 N 87 N N N Y Y ELL NA NA NA NA NA SWD 38 41 N 52 N N Y N N FRL 66 64 N 67 N N N Y Y
Other Subgroup
Graduation Rate, 2010
Graduation Rate, 2011
Writing % Satisfactory
Target AMO Reading, 2014
Target AMO Math, 2014
Target AMO Reading, 2015
Target AMO Math, 2015
Target AMO Reading, 2016
Target AMO Math, 2016
Target AMO Reading, 2017
Target AMO Math, 2017
ALL STDS 68 86 86 87 87 89 89 91 91
AME INDIAN ASIAN 85 85 87 87 88 88 90 90 B/AA 66 60 69 64 73 69 77 73 HISPANIC 78 77 80 79 83 82 85 85 WHITE 88 88 89 89 91 91 92 92 ELL SWD 60 57 65 61 69 66 74 71 FRL 78 70 80 73 83 77 85 80
School Grade
Year School Grade Number of Pts. Earned School Gr. Change to Current Yr. School Letter Grade
2011 633 A 2012 677 A 2013 631 B

Page 15
Appendix 1 Common Core Action Plan 2013-14 DeLaura Middle School
Team Members - Claudia Shirley, Lisa Kratz, Cynthia Mitchell, Karla Skinner,
Jeff Skinner, Terry Schlichenmaier
Action Item/ Strategies Due Date Who Resources
Evidence of Impact
Establish 2013-14 CC team and send to the
2013 CCSI to gain deeper understanding and
knowledge of CCSS.
May 2013 2013-14
CC Team
DOE –
Summer
Institute
2013-14 CC Action Plan
Review Common Core State Standards with
the faculty of the “Whys, Whats, and
Hows,” to emphasize full implementation in
2014-15.
August
2013
Principal School Pre-planning agenda
Model and demonstrate CC Lessons/units of
study utilizing CC standards and objectives
supporting high yield strategies to
emphasize rigor and student engagement.
On going CC Team
PLT’s,
Teacher
Admin
School,
District
Pre-planning agenda
Faculty mtg,
agenda/minutes
SharePoint CC folder
Develop and implement through content area
PLT’s and utilize BEST lesson plan format
for 2 per semester (common) CC
Lessons/Units of Study that support 2 high
yield strategies (Thinking Maps, Summary
Writing, Complex Text, Problem solving),
identify Differentiated Instruction
strategies and exhibit common formative
assessments.
December
2013 and
April
2014
Teachers Early
release
days
CPALMS
BEST
Lesson
Format
KUD
PLT Common lesson
plans/units of study 2
per semester
BEST Lesson Plan
COI – CWT feedback
Units of study and
Lesson plans with CCSS
embedded
Schedule Professional Development sessions
based on student data and teacher input on
early release days, utilizing best practices in
Differentiated Instructions, reading –
Complex Text, Math- problem solving,
rubric analysis, summary writing, technology,
and student engagement to support the
implementation CCSS.
Early
Release
Dates for
PD
Professio
nal
Developm
ent
Council/
Teacher
Leaders
District
District
resource
teachers,
Teacher
Leaders
Feedback from teachers
PLT meeting discussion
minutes
Early Release Day PD
schedule and agenda
Monitor and review of CC Lessons/ units of
study in all content areas utilizing
established Look Fors and classroom
observation instrument to ensure timeline
implementation.
On going Administr
ation and
Teacher
Leaders
School Look For feedback
COI feedback, Lesson
plans

Page 16
Appendix 2
Creating A High Performance Learning Culture – Action Plan 2013-2014 DeLaura Middle
Team Members - Claudia Shirley, Dr. Hewitt, Debbie Austin and Karla Skinner
Action Item Action
steps/strategies
Due Date Who Evidence of Impact
Establish a school Professional Development
Council to guide, promote, and implement exemplar
school practices that build collegiality and
increase student achievement.
Select PDC
Leader and ask
for volunteers
August
2013
Principal
designates
Teacher
leader
Pre-planning agenda –
Meeting of first PDC
PD plan for school
Provide time for Peer Mentor Coaches to present
information of the collaborative process to refine
Best practices in the classroom.
Follow Peer
Coaching Action
Plan
On going Peer Coaching
Team /
district
resources
Faculty Agendas
Early release PD days
Survey teachers to reflect on past practices,
current needs and professional development
interests and knowledge for the school year.
Personal Goal
sheet hand out
at pre-planning/
September
Survey
August
2013
Principal Tally professional
development and
survey results at end
of year
Establish common Look Fors and Asks Abouts
linked to the Exemplary Practices in the classroom
to support consistent and meaningful feedback
with colleagues and administrators.
Through PLT’s
engage in
discussion of
common Look
Fors- answer
questions on
Look Fors
August
2013
All teachers,
Administrators
Feedback from
Common Look Fors
and Asks Abouts, COI
Monitor implementation of CC standards,
Extended Thinking skills, Thinking Maps, SCAN,
rubric writing, academic vocabulary, utilizing
established CWT- Look Fors to gain collaborative
feedback and ensure continuous improvement with
Best professional practices.
Train Teacher
leader to Review
Look Fors with
team members
Set dates,
acquire funding
for coverage.
On going Administration
and Team
Leaders
Lesson plans/ Units
of study
Recorded Data on
CWT – Look Fors
Provide IPPAS rubric training for the entire
faculty to gain knowledge and deeper
understanding of IPPAS (PGP).
Establish
schedule for
trainings.
August-
February
District
Resource, PRT,
Peer Coaches
Teacher feedback on
trainings and or
school IPPAS data.
Schedule PD presentations on Common Core units
of study/Lesson study that are student centered
(Differentiated Instruction) and embedded with
Extended Thinking Strategies (Thinking Maps),
Summarizing, “consistent” across the curriculum
Note-taking skills and Vocabulary practices
(literacy skills) to model and demonstrate best
practices for teachers in all content areas.
Pre-planning
activities
PD early release
days
Faculty meetings
Team Leader
meetings
Ongoing Teacher
Leaders,
District
resource
teachers,
Literacy coach
Professional
Development school
calendar. In-service
report, Faculty
meeting exit slips
Lesson plans
Introduce to Team Leaders the instructional
review process to assess instructional Best
practices for continuous improvement.
Educate Team
Leaders
October /
November
2013
District SIP
office
Feedback from
Review Team
Page 17
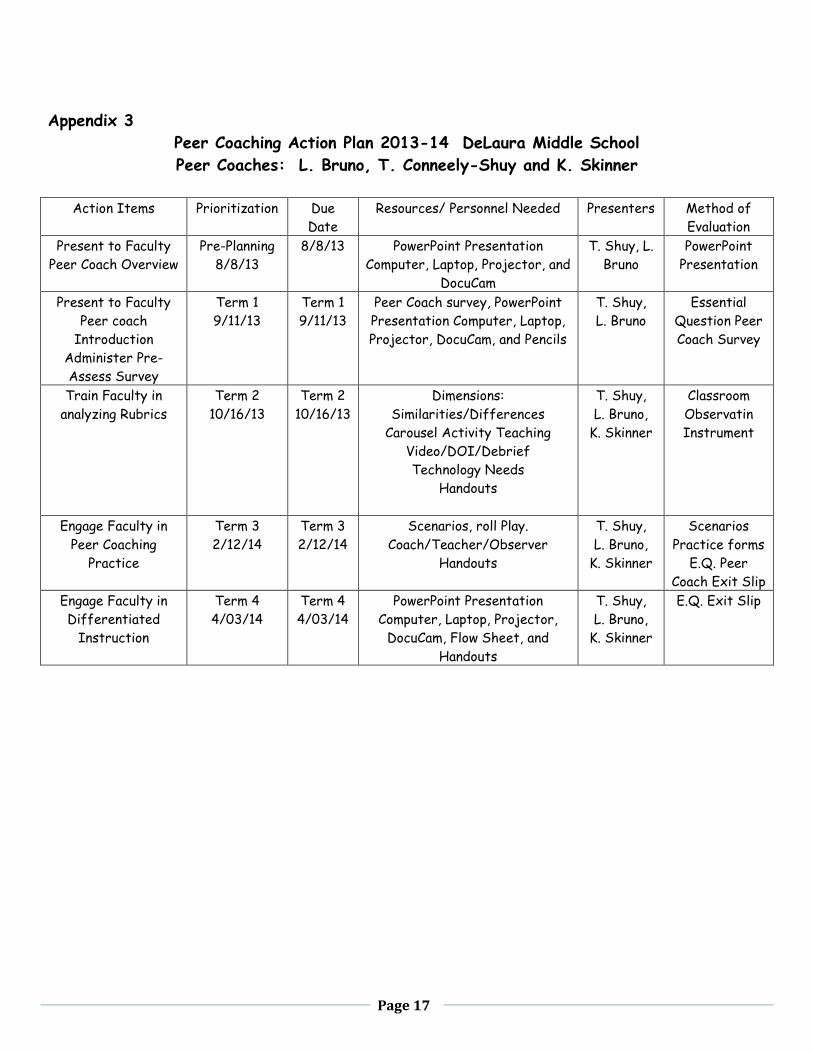
Appendix 3
Peer Coaching Action Plan 2013-14 DeLaura Middle School
Peer Coaches: L. Bruno, T. Conneely-Shuy and K. Skinner
Action Items Prioritization Due
Date
Resources/ Personnel Needed Presenters Method of
Evaluation
Present to Faculty
Peer Coach Overview
Pre-Planning
8/8/13
8/8/13 PowerPoint Presentation
Computer, Laptop, Projector, and
DocuCam
T. Shuy, L.
Bruno
PowerPoint
Presentation
Present to Faculty
Peer coach
Introduction
Administer Pre-
Assess Survey
Term 1
9/11/13
Term 1
9/11/13
Peer Coach survey, PowerPoint
Presentation Computer, Laptop,
Projector, DocuCam, and Pencils
T. Shuy,
L. Bruno
Essential
Question Peer
Coach Survey
Train Faculty in
analyzing Rubrics
Term 2
10/16/13
Term 2
10/16/13
Dimensions:
Similarities/Differences
Carousel Activity Teaching
Video/DOI/Debrief
Technology Needs
Handouts
T. Shuy,
L. Bruno,
K. Skinner
Classroom
Observatin
Instrument
Engage Faculty in
Peer Coaching
Practice
Term 3
2/12/14
Term 3
2/12/14
Scenarios, roll Play.
Coach/Teacher/Observer
Handouts
T. Shuy,
L. Bruno,
K. Skinner
Scenarios
Practice forms
E.Q. Peer
Coach Exit Slip
Engage Faculty in
Differentiated
Instruction
Term 4
4/03/14
Term 4
4/03/14
PowerPoint Presentation
Computer, Laptop, Projector,
DocuCam, Flow Sheet, and
Handouts
T. Shuy,
L. Bruno,
K. Skinner
E.Q. Exit Slip