breitling - histograms, myths and facts
DESCRIPTION
Myths and Facts Wolfgang Breitling - www.centrexcc.com 25+ years in database management Mathematics major at University of Stuttgart Oracle since 1993 (7.0.12) OCP certified DBA - 7, 8, 8i, 9i DL/1, IMS, ADABAS, SQL/DS, DB2, Oracle Hotsos Symposium, March 6-9, 2005 © Wolfgang Breitling, Centrex Consulting Corporation 2TRANSCRIPT
Histograms-
Myths and Facts
Wolfgang Breitlingwww.centrexcc.com
Hotsos Symposium, March 6-9, 2005© Wolfgang Breitling, Centrex Consulting Corporation2
Who am I
Independent consultant since 1996 specializing in Oracle and Peoplesoft setup, administration, and performance tuning
Member of the Oaktable Network25+ years in database management
DL/1, IMS, ADABAS, SQL/DS, DB2, Oracle
OCP certified DBA - 7, 8, 8i, 9iOracle since 1993 (7.0.12)Mathematics major at University of Stuttgart
Hotsos Symposium, March 6-9, 2005© Wolfgang Breitling, Centrex Consulting Corporation3
Agenda
Look at two (still) rather widespread misconceptions about histograms
Explore the relationship between the number of buckets and the column statistics, particularly for height-balanced histograms
Explore the effect of some “auto-options” in statistics gathering
Dispense Guidelines for Statistics Gathering

Hotsos Symposium, March 6-9, 2005© Wolfgang Breitling, Centrex Consulting Corporation4
Myth or Fact ?
Histograms allow the CBO to make a better choice between index access and table scan
and are therefore only useful for indexed columns
Hotsos Symposium, March 6-9, 2005© Wolfgang Breitling, Centrex Consulting Corporation5
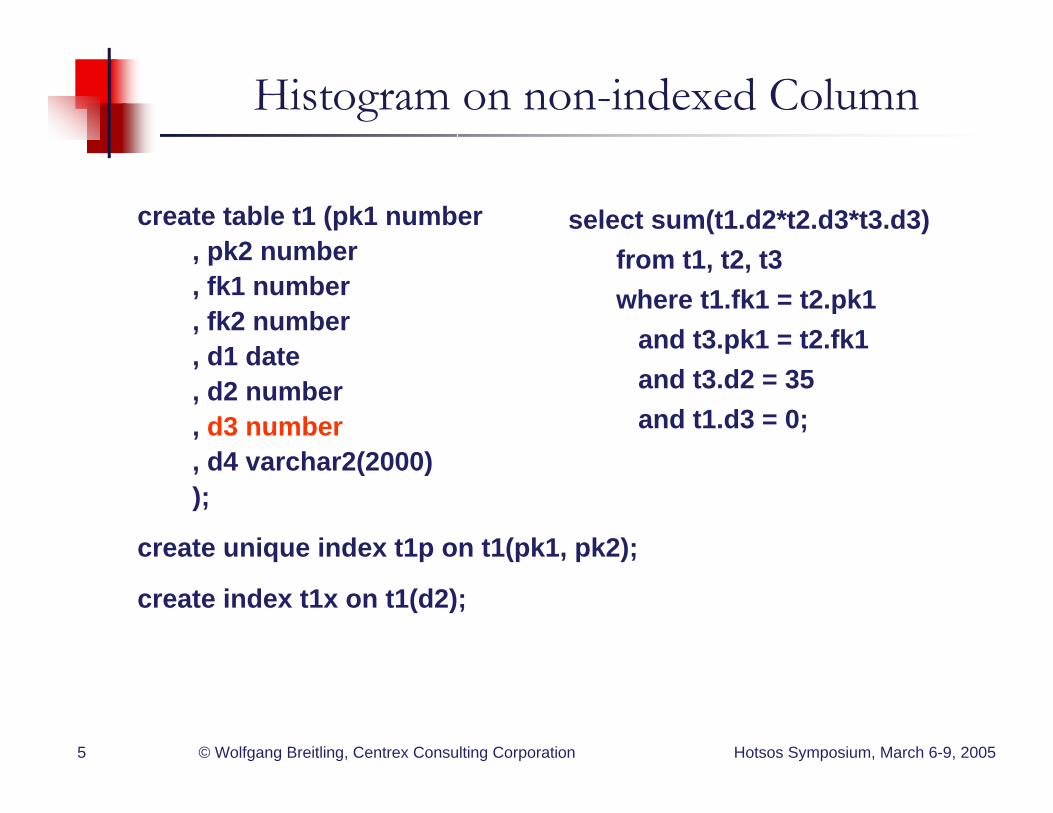
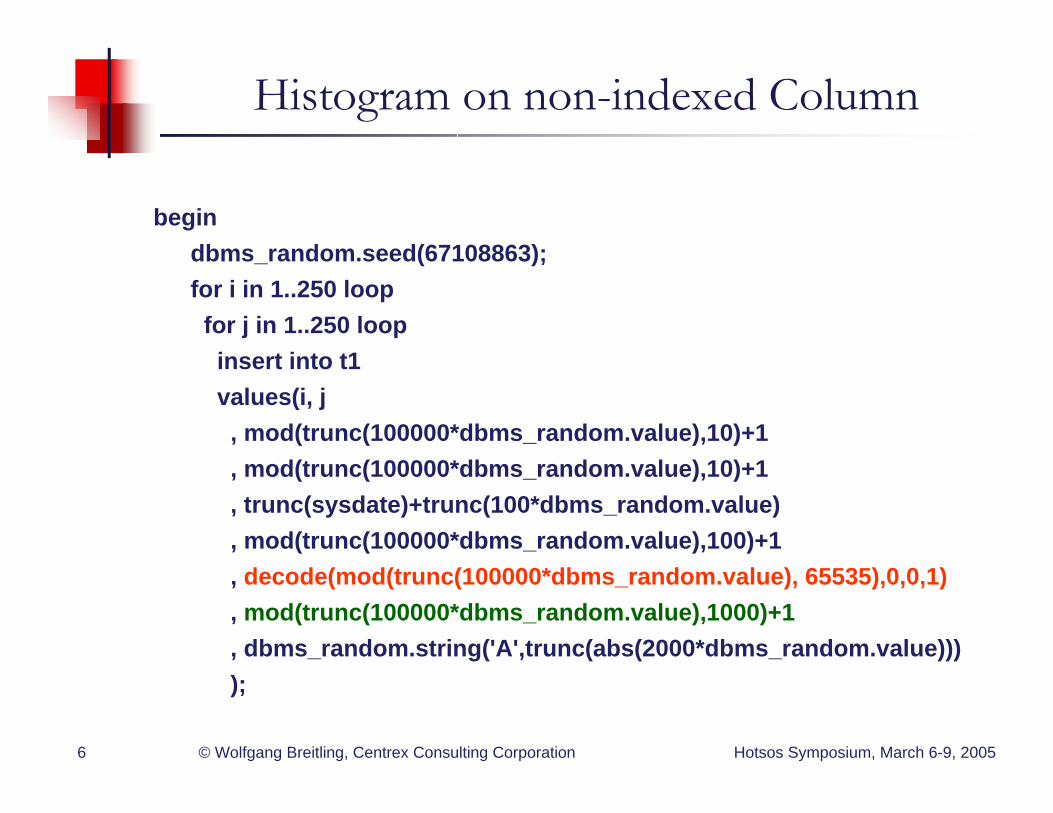
Histogram on non-indexed Column
create table t1 (pk1 number, pk2 number, fk1 number, fk2 number, d1 date, d2 number, d3 number, d4 varchar2(2000));
create unique index t1p on t1(pk1, pk2);
create index t1x on t1(d2);
select sum(t1.d2*t2.d3*t3.d3)from t1, t2, t3where t1.fk1 = t2.pk1
and t3.pk1 = t2.fk1and t3.d2 = 35and t1.d3 = 0;
Hotsos Symposium, March 6-9, 2005© Wolfgang Breitling, Centrex Consulting Corporation6
Histogram on non-indexed Column
begindbms_random.seed(67108863);for i in 1..250 loopfor j in 1..250 loopinsert into t1values(i, j, mod(trunc(100000*dbms_random.value),10)+1, mod(trunc(100000*dbms_random.value),10)+1, trunc(sysdate)+trunc(100*dbms_random.value), mod(trunc(100000*dbms_random.value),100)+1, decode(mod(trunc(100000*dbms_random.value), 65535),0,0,1), mod(trunc(100000*dbms_random.value),1000)+1, dbms_random.string('A',trunc(abs(2000*dbms_random.value))));
Hotsos Symposium, March 6-9, 2005© Wolfgang Breitling, Centrex Consulting Corporation7
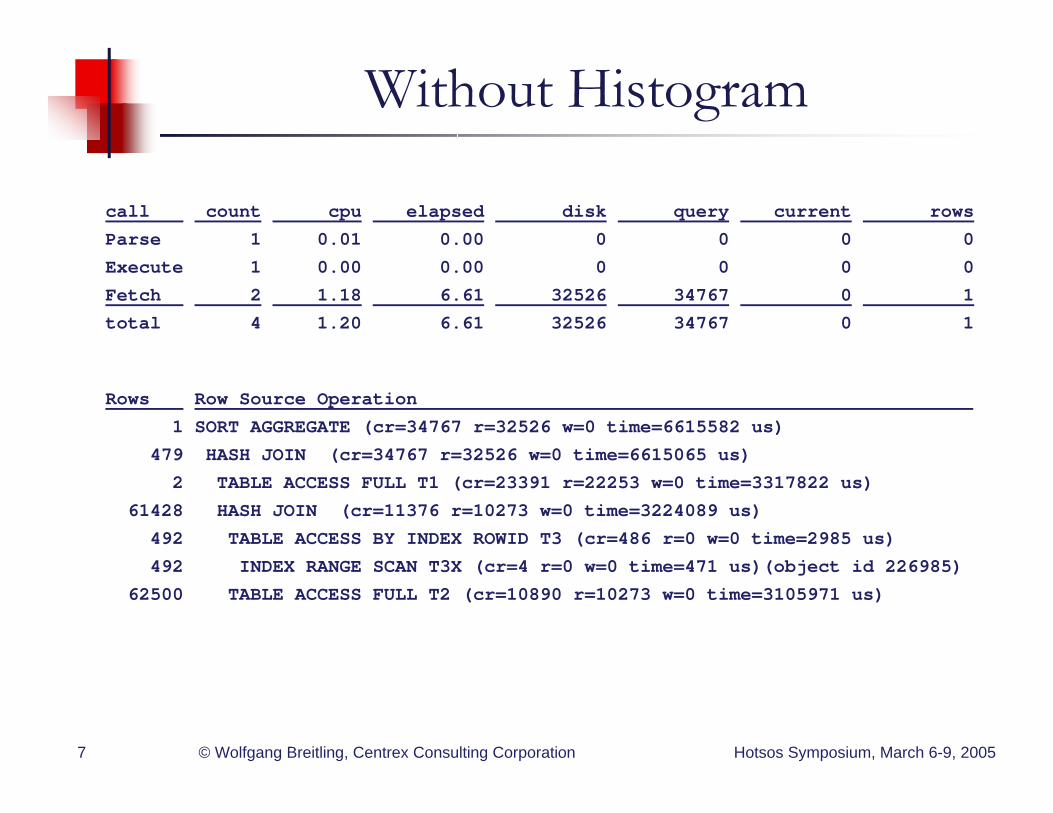
Without Histogram
call count cpu elapsed disk query current rows
Parse 1 0.01 0.00 0 0 0 0
Execute 1 0.00 0.00 0 0 0 0
Fetch 2 1.18 6.61 32526 34767 0 1
total 4 1.20 6.61 32526 34767 0 1
Rows Row Source Operation
1 SORT AGGREGATE (cr=34767 r=32526 w=0 time=6615582 us)
479 HASH JOIN (cr=34767 r=32526 w=0 time=6615065 us)
2 TABLE ACCESS FULL T1 (cr=23391 r=22253 w=0 time=3317822 us)
61428 HASH JOIN (cr=11376 r=10273 w=0 time=3224089 us)
492 TABLE ACCESS BY INDEX ROWID T3 (cr=486 r=0 w=0 time=2985 us)
492 INDEX RANGE SCAN T3X (cr=4 r=0 w=0 time=471 us)(object id 226985)
62500 TABLE ACCESS FULL T2 (cr=10890 r=10273 w=0 time=3105971 us)
Hotsos Symposium, March 6-9, 2005© Wolfgang Breitling, Centrex Consulting Corporation8
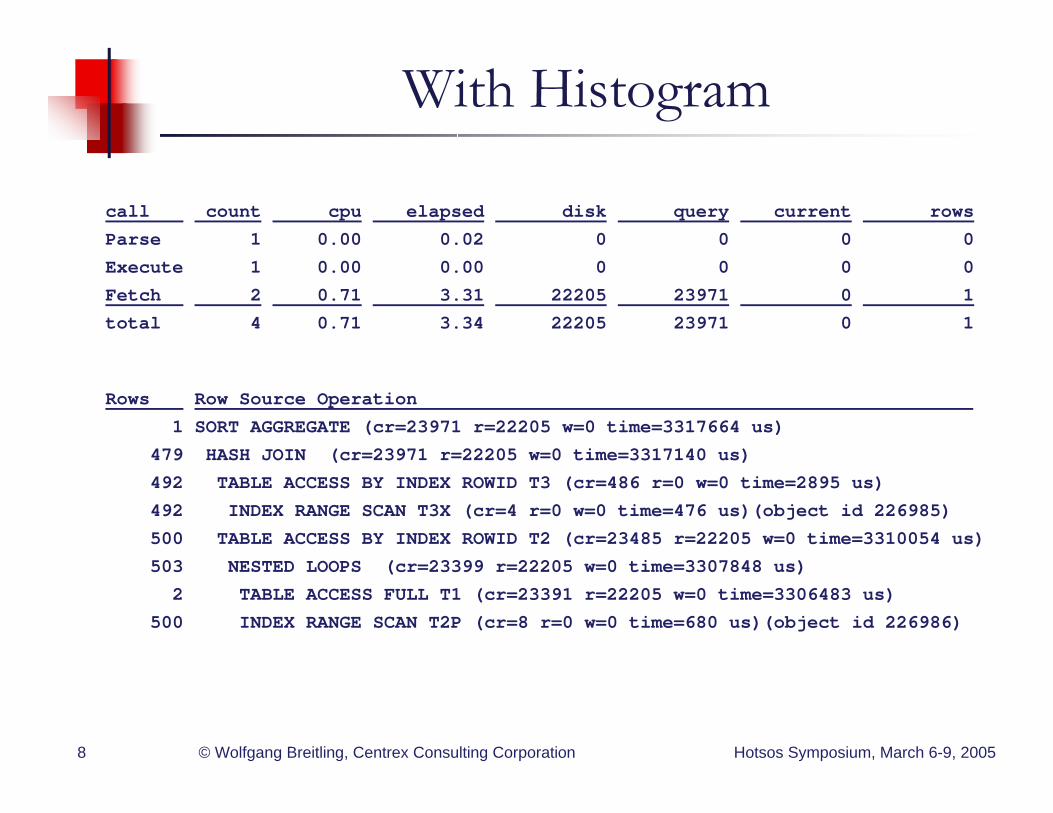
With Histogram
call count cpu elapsed disk query current rows
Parse 1 0.00 0.02 0 0 0 0
Execute 1 0.00 0.00 0 0 0 0
Fetch 2 0.71 3.31 22205 23971 0 1
total 4 0.71 3.34 22205 23971 0 1
Rows Row Source Operation
1 SORT AGGREGATE (cr=23971 r=22205 w=0 time=3317664 us)
479 HASH JOIN (cr=23971 r=22205 w=0 time=3317140 us)
492 TABLE ACCESS BY INDEX ROWID T3 (cr=486 r=0 w=0 time=2895 us)
492 INDEX RANGE SCAN T3X (cr=4 r=0 w=0 time=476 us)(object id 226985)
500 TABLE ACCESS BY INDEX ROWID T2 (cr=23485 r=22205 w=0 time=3310054 us)
503 NESTED LOOPS (cr=23399 r=22205 w=0 time=3307848 us)
2 TABLE ACCESS FULL T1 (cr=23391 r=22205 w=0 time=3306483 us)
500 INDEX RANGE SCAN T2P (cr=8 r=0 w=0 time=680 us)(object id 226986)
Hotsos Symposium, March 6-9, 2005© Wolfgang Breitling, Centrex Consulting Corporation9
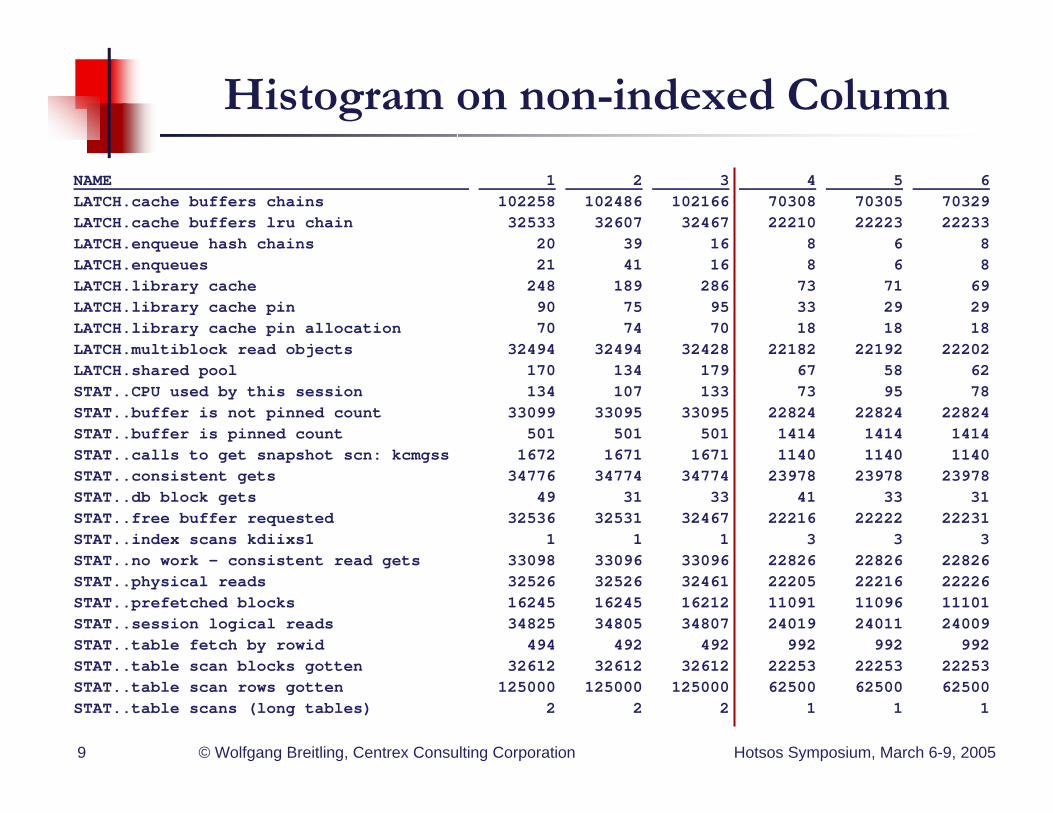
NAME 1 2 3 4 5 6LATCH.cache buffers chains 102258 102486 102166 70308 70305 70329LATCH.cache buffers lru chain 32533 32607 32467 22210 22223 22233LATCH.enqueue hash chains 20 39 16 8 6 8LATCH.enqueues 21 41 16 8 6 8LATCH.library cache 248 189 286 73 71 69LATCH.library cache pin 90 75 95 33 29 29LATCH.library cache pin allocation 70 74 70 18 18 18LATCH.multiblock read objects 32494 32494 32428 22182 22192 22202LATCH.shared pool 170 134 179 67 58 62STAT..CPU used by this session 134 107 133 73 95 78STAT..buffer is not pinned count 33099 33095 33095 22824 22824 22824STAT..buffer is pinned count 501 501 501 1414 1414 1414STAT..calls to get snapshot scn: kcmgss 1672 1671 1671 1140 1140 1140STAT..consistent gets 34776 34774 34774 23978 23978 23978STAT..db block gets 49 31 33 41 33 31STAT..free buffer requested 32536 32531 32467 22216 22222 22231STAT..index scans kdiixs1 1 1 1 3 3 3STAT..no work - consistent read gets 33098 33096 33096 22826 22826 22826STAT..physical reads 32526 32526 32461 22205 22216 22226STAT..prefetched blocks 16245 16245 16212 11091 11096 11101STAT..session logical reads 34825 34805 34807 24019 24011 24009STAT..table fetch by rowid 494 492 492 992 992 992STAT..table scan blocks gotten 32612 32612 32612 22253 22253 22253STAT..table scan rows gotten 125000 125000 125000 62500 62500 62500STAT..table scans (long tables) 2 2 2 1 1 1
Histogram on non-indexed Column
Hotsos Symposium, March 6-9, 2005© Wolfgang Breitling, Centrex Consulting Corporation10
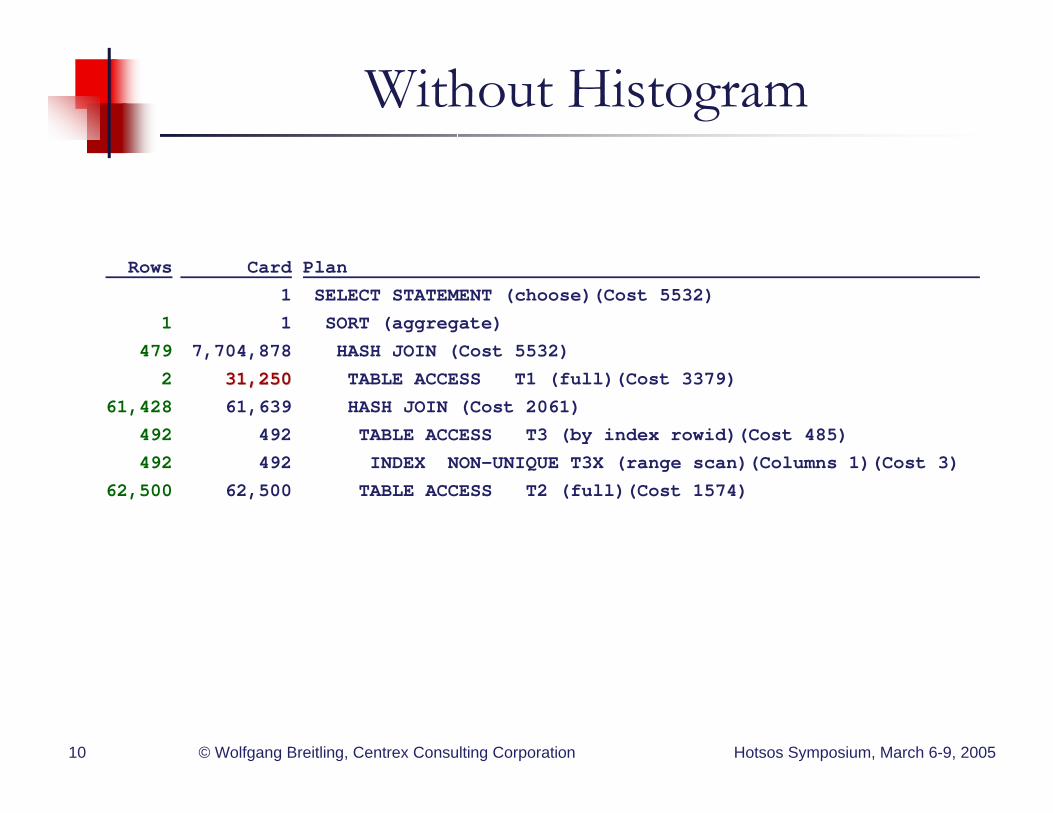
Without Histogram
Card Plan
1 SELECT STATEMENT (choose)(Cost 5532)
1 SORT (aggregate)
7,704,878 HASH JOIN (Cost 5532)
31,25031,250 TABLE ACCESS T1 (full)(Cost 3379)
61,639 HASH JOIN (Cost 2061)
492 TABLE ACCESS T3 (by index rowid)(Cost 485)
492 INDEX NON-UNIQUE T3X (range scan)(Columns 1)(Cost 3)
62,500 TABLE ACCESS T2 (full)(Cost 1574)
Rows
1
479
2
61,428
492
492
62,500
Hotsos Symposium, March 6-9, 2005© Wolfgang Breitling, Centrex Consulting Corporation11
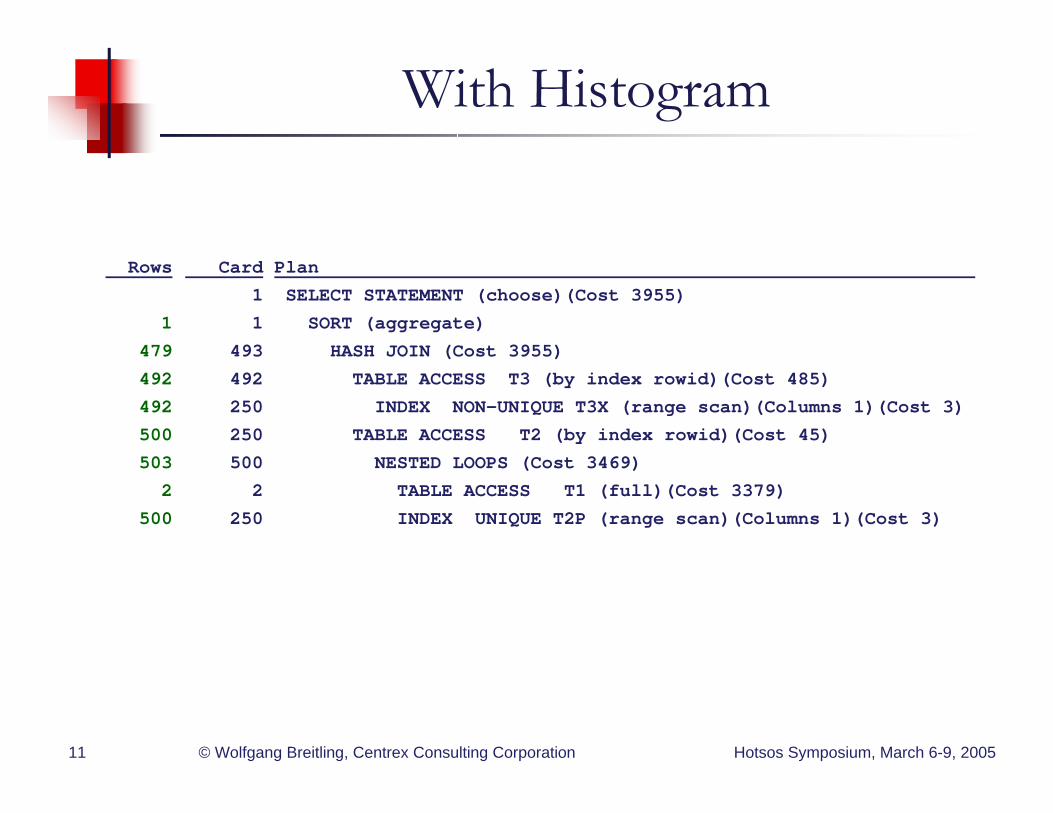
With Histogram
Card Plan
1 SELECT STATEMENT (choose)(Cost 3955)
1 SORT (aggregate)
493 HASH JOIN (Cost 3955)
492 TABLE ACCESS T3 (by index rowid)(Cost 485)
250 INDEX NON-UNIQUE T3X (range scan)(Columns 1)(Cost 3)
250 TABLE ACCESS T2 (by index rowid)(Cost 45)
500 NESTED LOOPS (Cost 3469)
2 TABLE ACCESS T1 (full)(Cost 3379)
250 INDEX UNIQUE T2P (range scan)(Columns 1)(Cost 3)
Rows
1
479
492
492
500
503
2
500
Hotsos Symposium, March 6-9, 2005© Wolfgang Breitling, Centrex Consulting Corporation12
Myth or Fact ?
If I have the time window,there is no harm in collecting histograms on all columns.
(so that I don’t miss any that I really need)
Hotsos Symposium, March 6-9, 2005© Wolfgang Breitling, Centrex Consulting Corporation13
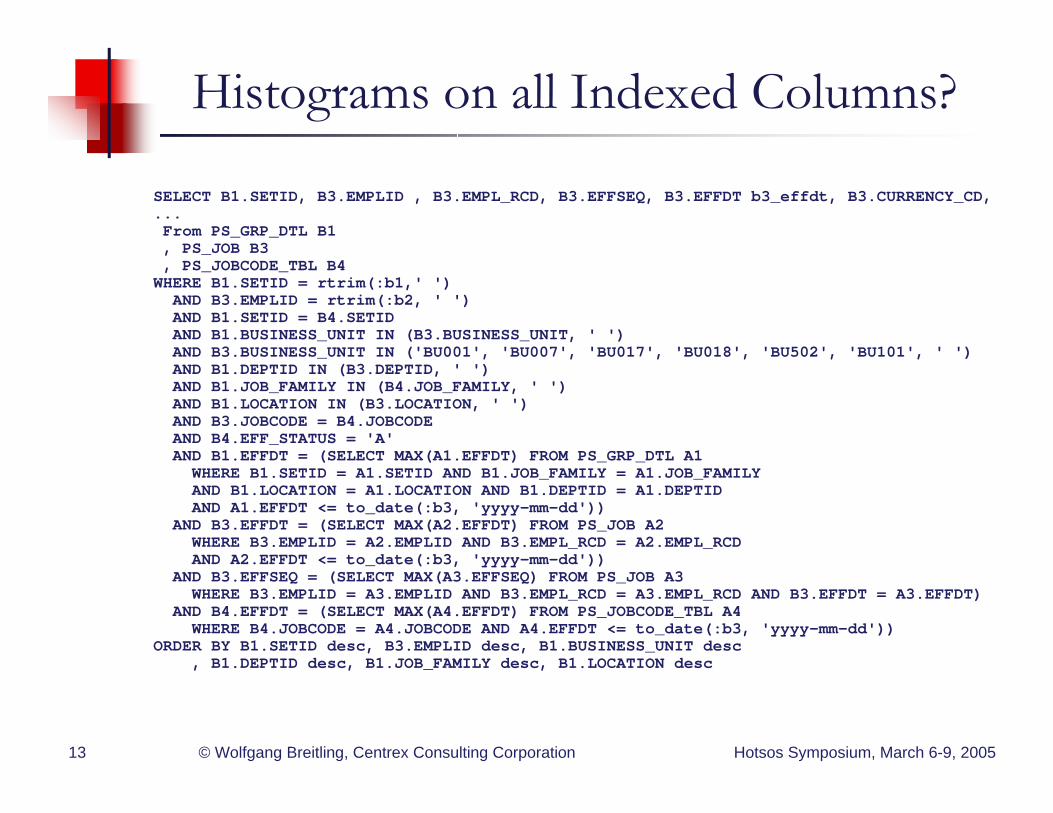
SELECT B1.SETID, B3.EMPLID , B3.EMPL_RCD, B3.EFFSEQ, B3.EFFDT b3_effdt, B3.CURRENCY_CD,...From PS_GRP_DTL B1, PS_JOB B3, PS_JOBCODE_TBL B4
WHERE B1.SETID = rtrim(:b1,' ')AND B3.EMPLID = rtrim(:b2, ' ')AND B1.SETID = B4.SETIDAND B1.BUSINESS_UNIT IN (B3.BUSINESS_UNIT, ' ')AND B3.BUSINESS_UNIT IN ('BU001', 'BU007', 'BU017', 'BU018', 'BU502', 'BU101', ' ')AND B1.DEPTID IN (B3.DEPTID, ' ')AND B1.JOB_FAMILY IN (B4.JOB_FAMILY, ' ')AND B1.LOCATION IN (B3.LOCATION, ' ')AND B3.JOBCODE = B4.JOBCODEAND B4.EFF_STATUS = 'A'AND B1.EFFDT = (SELECT MAX(A1.EFFDT) FROM PS_GRP_DTL A1
WHERE B1.SETID = A1.SETID AND B1.JOB_FAMILY = A1.JOB_FAMILYAND B1.LOCATION = A1.LOCATION AND B1.DEPTID = A1.DEPTIDAND A1.EFFDT <= to_date(:b3, 'yyyy-mm-dd'))
AND B3.EFFDT = (SELECT MAX(A2.EFFDT) FROM PS_JOB A2WHERE B3.EMPLID = A2.EMPLID AND B3.EMPL_RCD = A2.EMPL_RCDAND A2.EFFDT <= to_date(:b3, 'yyyy-mm-dd'))
AND B3.EFFSEQ = (SELECT MAX(A3.EFFSEQ) FROM PS_JOB A3WHERE B3.EMPLID = A3.EMPLID AND B3.EMPL_RCD = A3.EMPL_RCD AND B3.EFFDT = A3.EFFDT)
AND B4.EFFDT = (SELECT MAX(A4.EFFDT) FROM PS_JOBCODE_TBL A4WHERE B4.JOBCODE = A4.JOBCODE AND A4.EFFDT <= to_date(:b3, 'yyyy-mm-dd'))
ORDER BY B1.SETID desc, B3.EMPLID desc, B1.BUSINESS_UNIT desc, B1.DEPTID desc, B1.JOB_FAMILY desc, B1.LOCATION desc
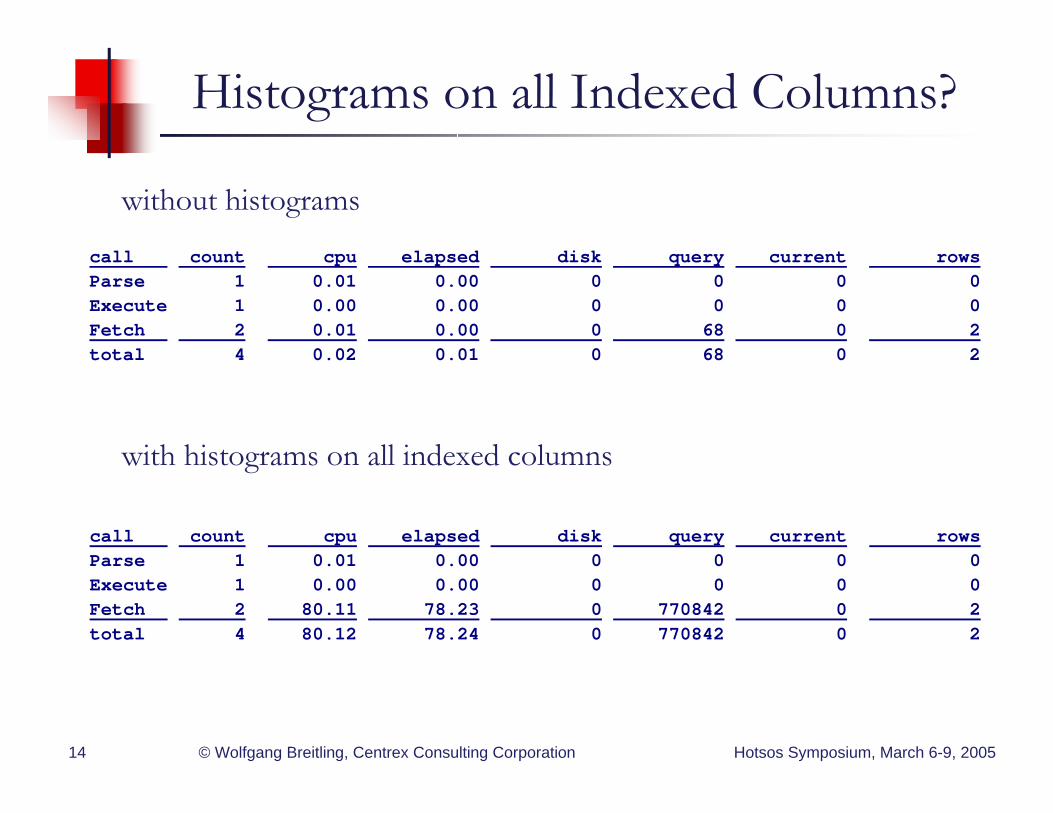
Histograms on all Indexed Columns?
Hotsos Symposium, March 6-9, 2005© Wolfgang Breitling, Centrex Consulting Corporation14
call count cpu elapsed disk query current rowsParse 1 0.01 0.00 0 0 0 0Execute 1 0.00 0.00 0 0 0 0Fetch 2 0.01 0.00 0 68 0 2total 4 0.02 0.01 0 68 0 2
without histograms
call count cpu elapsed disk query current rowsParse 1 0.01 0.00 0 0 0 0Execute 1 0.00 0.00 0 0 0 0Fetch 2 80.11 78.23 0 770842 0 2total 4 80.12 78.24 0 770842 0 2
with histograms on all indexed columns
Histograms on all Indexed Columns?
Hotsos Symposium, March 6-9, 2005© Wolfgang Breitling, Centrex Consulting Corporation15
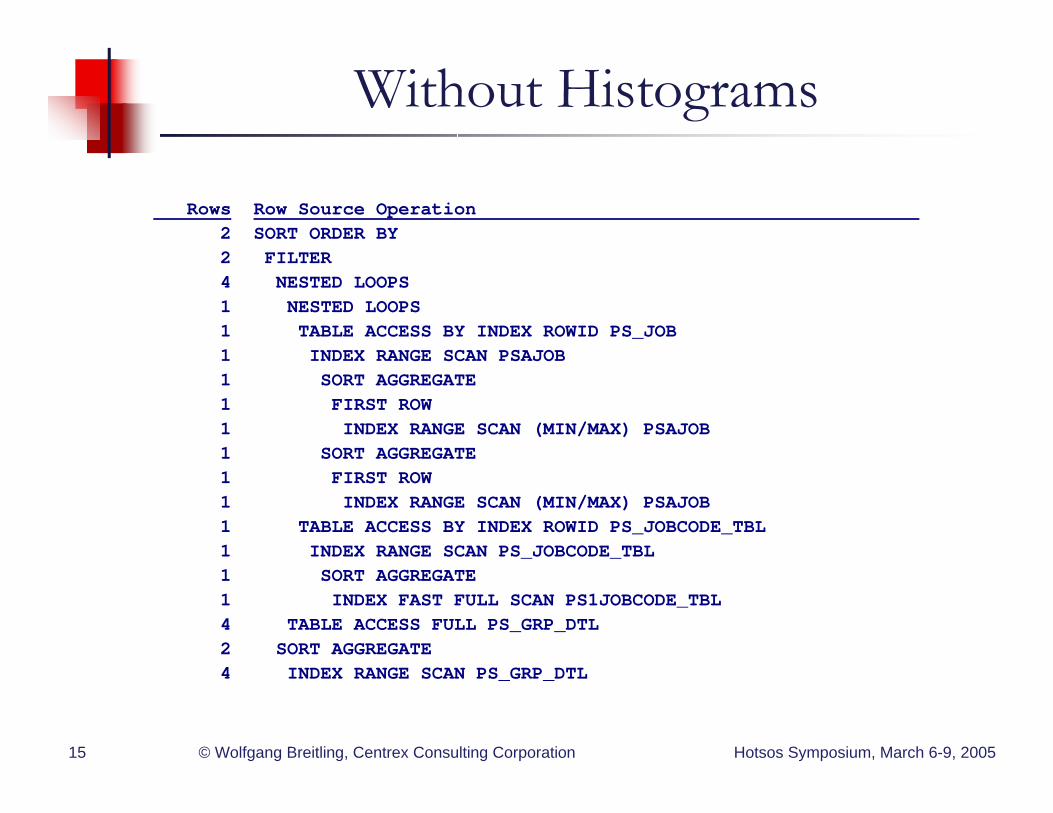
Rows Row Source Operation2 SORT ORDER BY 2 FILTER 4 NESTED LOOPS 1 NESTED LOOPS 1 TABLE ACCESS BY INDEX ROWID PS_JOB 1 INDEX RANGE SCAN PSAJOB 1 SORT AGGREGATE 1 FIRST ROW 1 INDEX RANGE SCAN (MIN/MAX) PSAJOB1 SORT AGGREGATE 1 FIRST ROW 1 INDEX RANGE SCAN (MIN/MAX) PSAJOB 1 TABLE ACCESS BY INDEX ROWID PS_JOBCODE_TBL 1 INDEX RANGE SCAN PS_JOBCODE_TBL1 SORT AGGREGATE 1 INDEX FAST FULL SCAN PS1JOBCODE_TBL4 TABLE ACCESS FULL PS_GRP_DTL 2 SORT AGGREGATE 4 INDEX RANGE SCAN PS_GRP_DTL
Without Histograms
Hotsos Symposium, March 6-9, 2005© Wolfgang Breitling, Centrex Consulting Corporation16
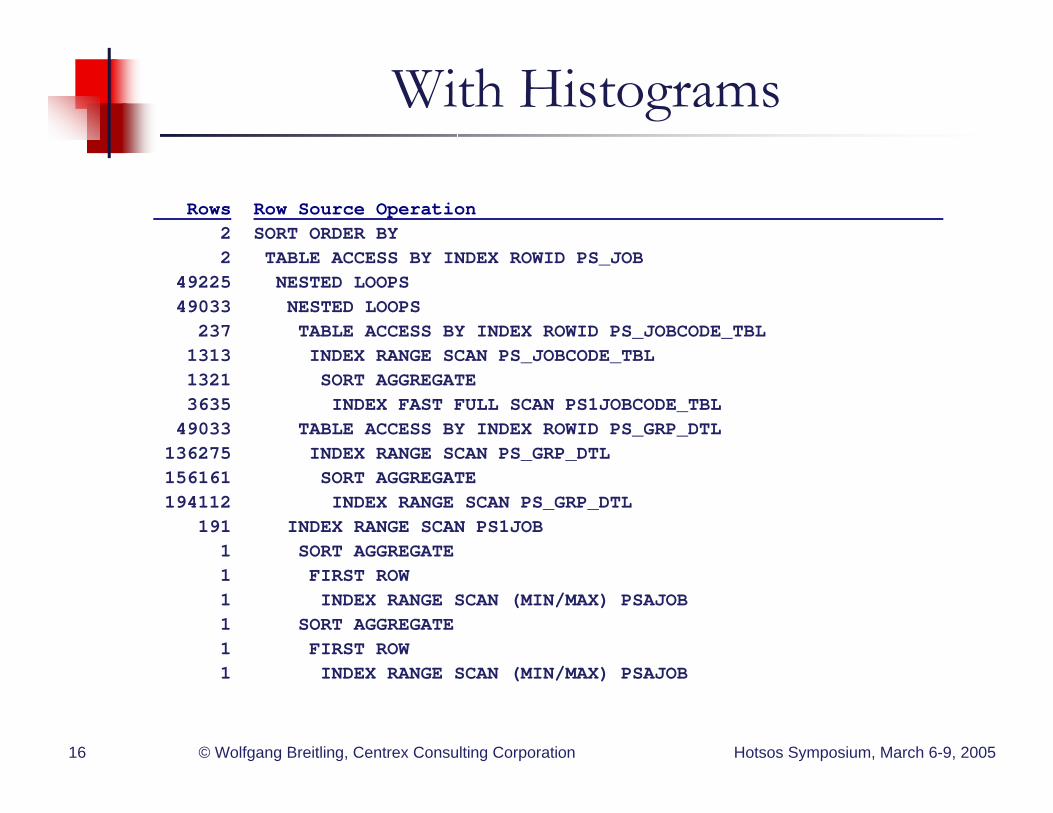
Rows Row Source Operation2 SORT ORDER BY 2 TABLE ACCESS BY INDEX ROWID PS_JOB
49225 NESTED LOOPS 49033 NESTED LOOPS 237 TABLE ACCESS BY INDEX ROWID PS_JOBCODE_TBL 1313 INDEX RANGE SCAN PS_JOBCODE_TBL1321 SORT AGGREGATE 3635 INDEX FAST FULL SCAN PS1JOBCODE_TBL49033 TABLE ACCESS BY INDEX ROWID PS_GRP_DTL 136275 INDEX RANGE SCAN PS_GRP_DTL156161 SORT AGGREGATE 194112 INDEX RANGE SCAN PS_GRP_DTL
191 INDEX RANGE SCAN PS1JOB1 SORT AGGREGATE 1 FIRST ROW 1 INDEX RANGE SCAN (MIN/MAX) PSAJOB1 SORT AGGREGATE 1 FIRST ROW 1 INDEX RANGE SCAN (MIN/MAX) PSAJOB
With Histograms
Hotsos Symposium, March 6-9, 2005© Wolfgang Breitling, Centrex Consulting Corporation17
Misplaced Histogram
If that scenario is correct, i.e. histogram on xxx, then I’d test what happens if you get rid of the histogram. How many distinct values of xxx are in the table?
thx; good idea; checkin into it...
I dropped the histogram ...did help thx a lot ....(hope the rest will still work ..)
Hotsos Symposium, March 6-9, 2005© Wolfgang Breitling, Centrex Consulting Corporation18
Myth or Fact ?
When collecting a histogram,the greater the number of buckets
the higher the accuracy

Hotsos Symposium, March 6-9, 2005© Wolfgang Breitling, Centrex Consulting Corporation19
Histograms and Density
without histogram
density = 1/num_distinct1/num_distinct
with height balanced histogram
density = ΣΣ cntcnt*2*2 / ( num_rows * / ( num_rows * ΣΣ cnt cnt ))
with frequency histogram
density = 1/(2*num_rows)1/(2*num_rows)
Hotsos Symposium, March 6-9, 2005© Wolfgang Breitling, Centrex Consulting Corporation20
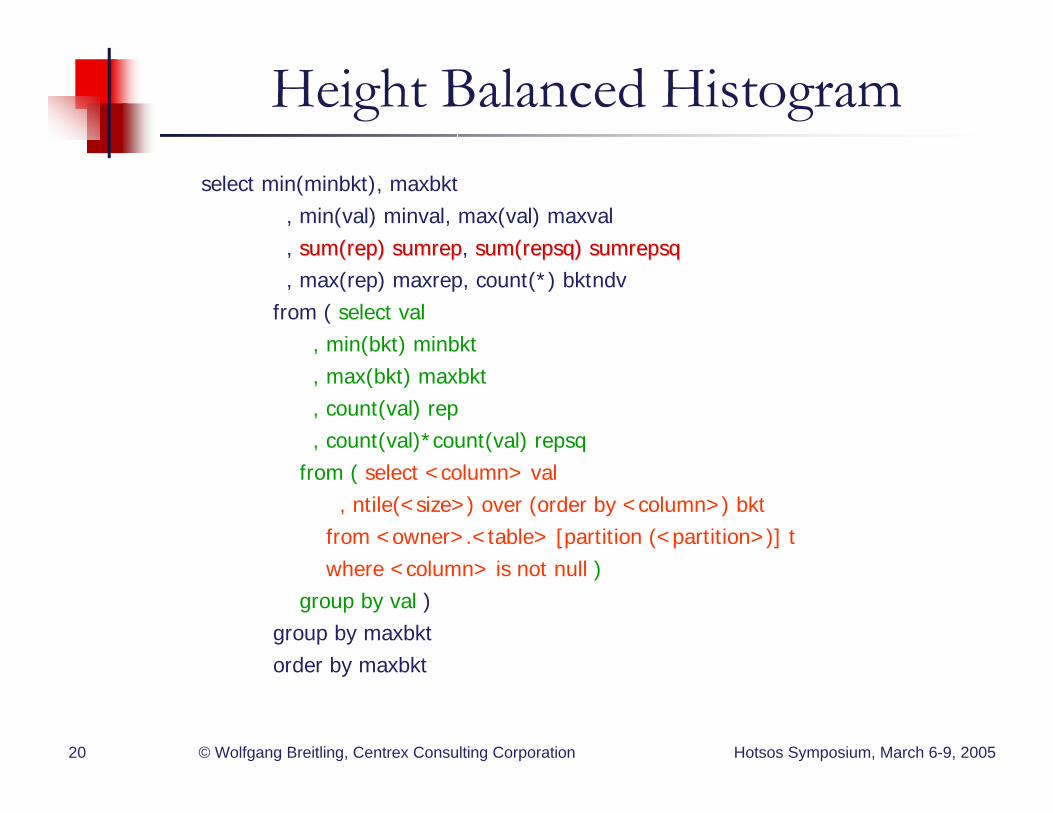
Height Balanced Histogramselect min(minbkt), maxbkt
, min(val) minval, max(val) maxval, sum(rep)sum(rep) sumrepsumrep, sum(sum(repsqrepsq)) sumrepsqsumrepsq, max(rep) maxrep, count(*) bktndv
from ( select val, min(bkt) minbkt, max(bkt) maxbkt, count(val) rep, count(val)*count(val) repsq
from ( select <column> val, ntile(<size>) over (order by <column>) bkt
from <owner>.<table> [partition (<partition>)] twhere <column> is not null )
group by val )group by maxbktorder by maxbkt
Hotsos Symposium, March 6-9, 2005© Wolfgang Breitling, Centrex Consulting Corporation21
Height Balanced Histogram
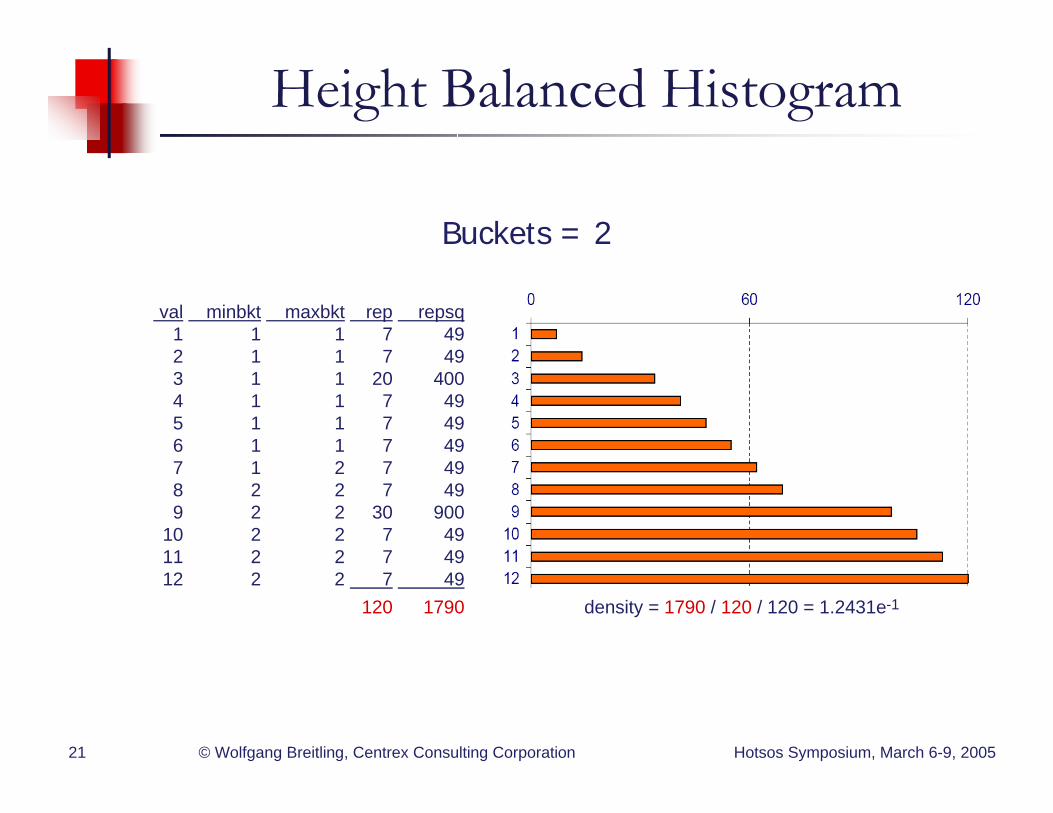
val minbkt maxbkt rep repsq1 1 1 7 492 1 1 7 493 1 1 20 4004 1 1 7 495 1 1 7 496 1 1 7 497 1 2 7 498 2 2 7 499 2 2 30 900
10 2 2 7 4911 2 2 7 4912 2 2 7 49
120 1790 density = 1790 / 120 / 120 = 1.2431e-1
Buckets = 2

Hotsos Symposium, March 6-9, 2005© Wolfgang Breitling, Centrex Consulting Corporation22
Height Balanced Histogram
val minbkt maxbkt rep repsq1 1 1 7 492 1 1 7 493 1 2 20 4004 2 2 7 495 2 2 7 496 3 3 7 497 3 3 7 498 3 3 7 4999 33 55 3030 900900
10 5 5 7 4911 5 5 7 4912 5 5 7 49
90 890 density = 890 / 90 / 120 = 8.2407e-2
Buckets = 5
Hotsos Symposium, March 6-9, 2005© Wolfgang Breitling, Centrex Consulting Corporation23
Height Balanced Histogram
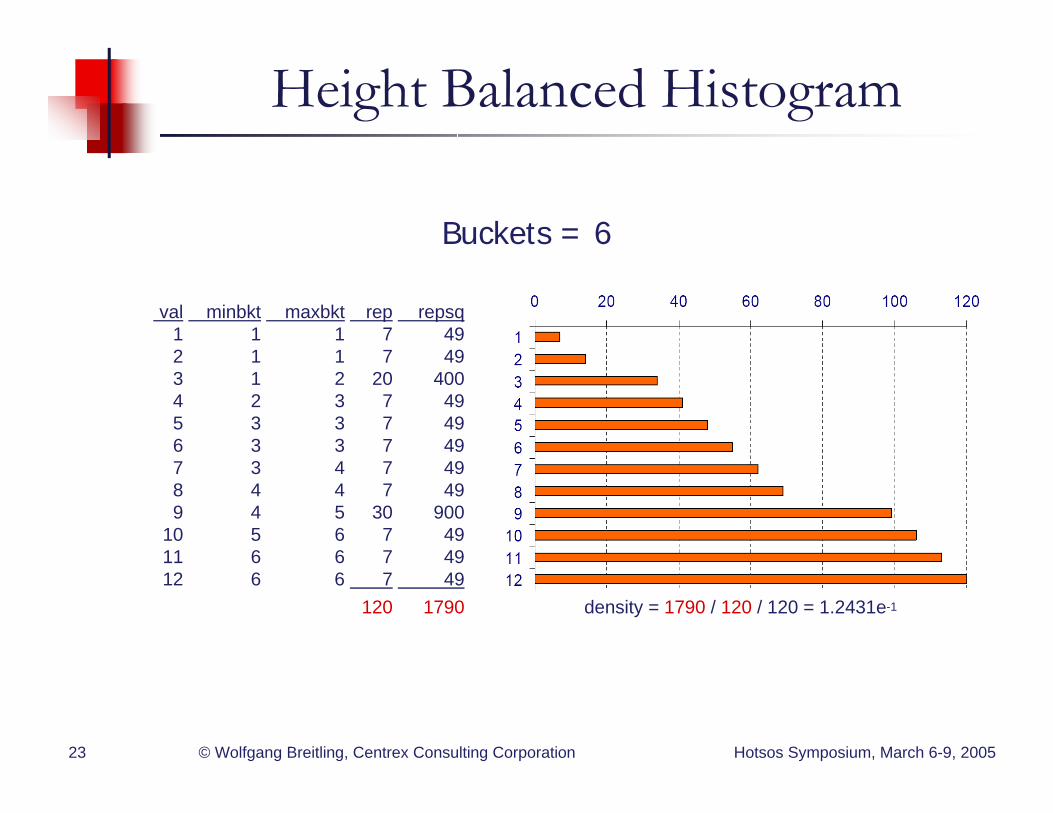
val minbkt maxbkt rep repsq1 1 1 7 492 1 1 7 493 1 2 20 4004 2 3 7 495 3 3 7 496 3 3 7 497 3 4 7 498 4 4 7 499 4 5 30 900
10 5 6 7 4911 6 6 7 4912 6 6 7 49
120 1790 density = 1790 / 120 / 120 = 1.2431e-1
Buckets = 6
Hotsos Symposium, March 6-9, 2005© Wolfgang Breitling, Centrex Consulting Corporation24
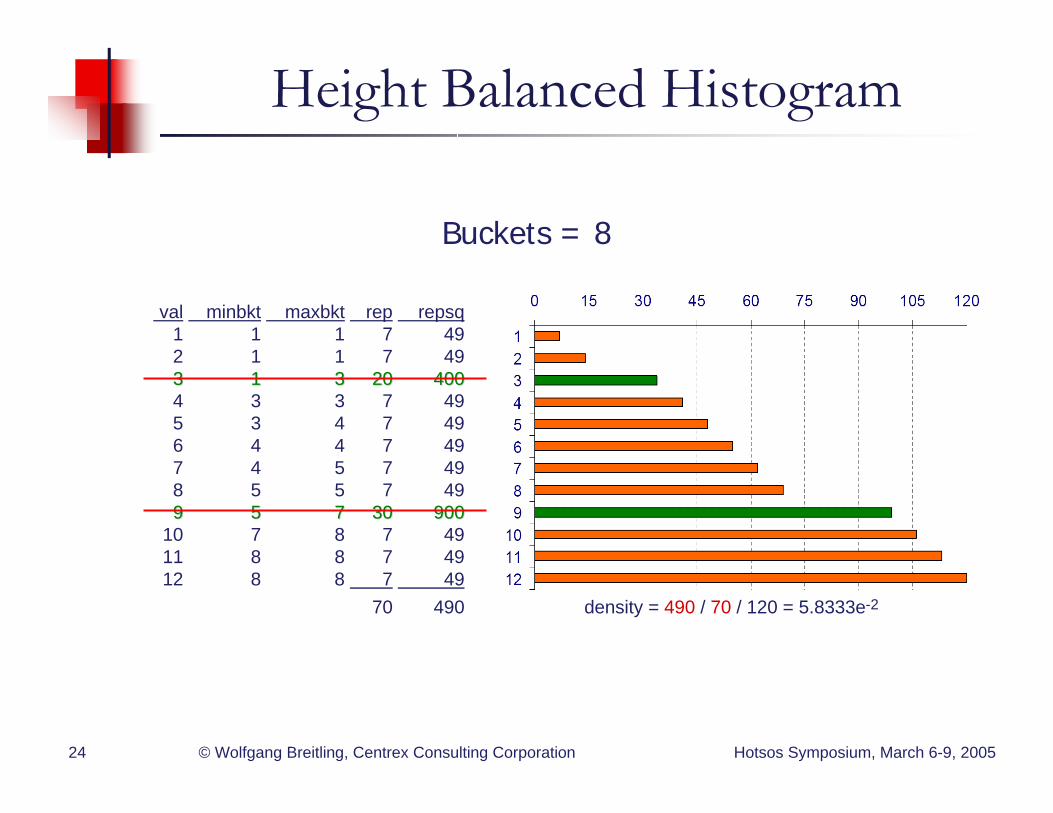
Height Balanced Histogram
val minbkt maxbkt rep repsq1 1 1 7 492 1 1 7 4933 11 33 2020 4004004 3 3 7 495 3 4 7 496 4 4 7 497 4 5 7 498 5 5 7 4999 55 77 3030 900900
10 7 8 7 4911 8 8 7 4912 8 8 7 49
70 490 density = 490 / 70 / 120 = 5.8333e-2
Buckets = 8

Hotsos Symposium, March 6-9, 2005© Wolfgang Breitling, Centrex Consulting Corporation25
Height Balanced Histogram
val minbkt maxbkt rep repsq1 1 1 7 492 1 2 7 4933 22 44 2020 4004004 4 5 7 495 5 5 7 496 5 6 7 497 6 7 7 498 7 7 7 4999 77 1010 3030 900900
10 10 11 7 4911 11 12 7 4912 12 12 7 49
70 490 density = 490 / 70 / 120 = 5.8333e-2
Buckets = 12

Hotsos Symposium, March 6-9, 2005© Wolfgang Breitling, Centrex Consulting Corporation26
Height Balanced Histogram
val minbkt maxbkt rep repsq1 1 1 7 492 1 2 7 493 2 5 20 4004 5 6 7 495 6 7 7 496 7 8 7 497 8 9 7 498 9 10 7 499 10 14 30 900
10 15 15 7 4911 16 16 7 4912 17 17 7 49
70 490 density = 1 / (2 *120) = 4.1667e-3
Buckets = 17
Hotsos Symposium, March 6-9, 2005© Wolfgang Breitling, Centrex Consulting Corporation27
“A histogram approximates the distribution of data values in attributes of the database relations by grouping the data values into a group of buckets. This grouping into buckets loses information. It is important to choose bucket placement wisely, to minimize this loss of information for any chosen level of data summarization. Poor quality histograms might lead the optimizers to Poor quality histograms might lead the optimizers to choose suboptimal query execution plans that may choose suboptimal query execution plans that may degrade the system performance dramaticallydegrade the system performance dramatically.”
Jagadish, H. V., Hui Jin, Beng Chin Ooi, and Kian-Lee Tan. "Global Optimization of Histograms.“Paper presented at the ACM SIGMOD International Conference on Management of Data, Santa Barbara, California, United States 2001.
Histograms

Hotsos Symposium, March 6-9, 2005© Wolfgang Breitling, Centrex Consulting Corporation28
Size SKEWONLY ?
So how are you supposed to gather histograms and set # of buckets (size)
SKEWONLY ?“I highly recommend that all Oracle DBA's use the method_opt=skewonlyoption to automatically identify skewed column values and generate histograms.”*
* http://www.dba-oracle.com/oracle_tips_skewonly.htm
Hotsos Symposium, March 6-9, 2005© Wolfgang Breitling, Centrex Consulting Corporation29
Size SKEWONLY
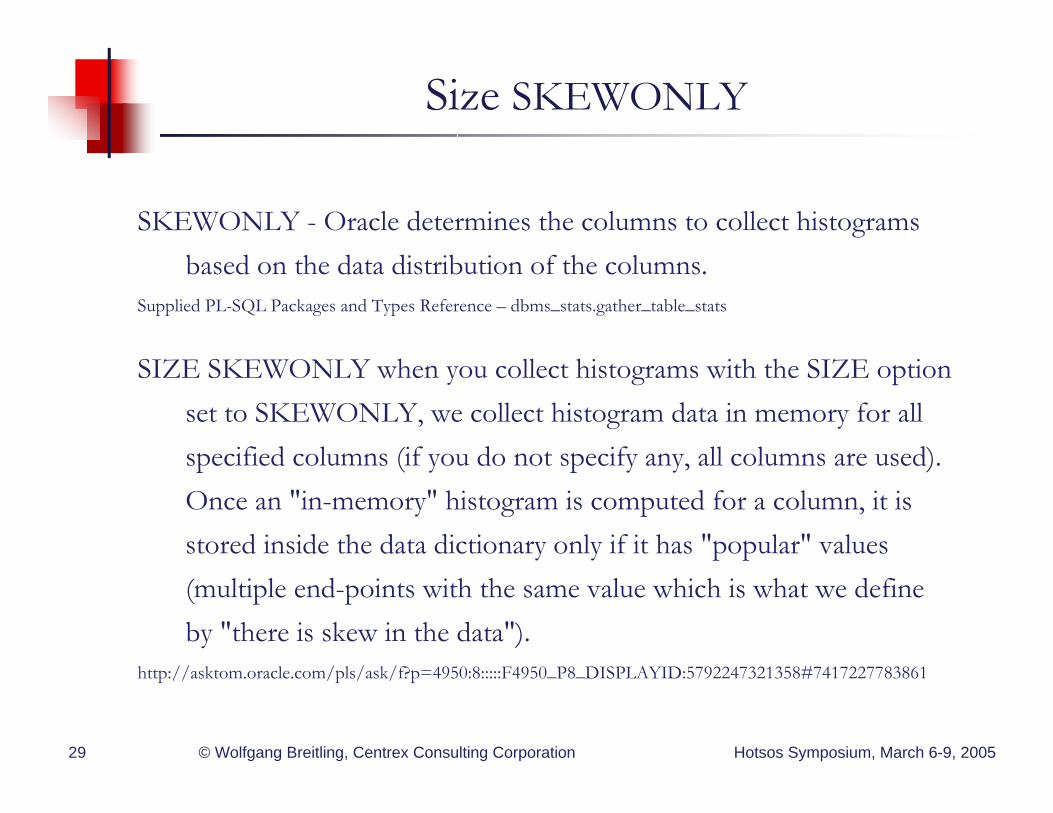
SKEWONLY - Oracle determines the columns to collect histograms based on the data distribution of the columns.
Supplied PL-SQL Packages and Types Reference – dbms_stats.gather_table_stats
SIZE SKEWONLY when you collect histograms with the SIZE option set to SKEWONLY, we collect histogram data in memory for all specified columns (if you do not specify any, all columns are used). Once an "in-memory" histogram is computed for a column, it is stored inside the data dictionary only if it has "popular" values (multiple end-points with the same value which is what we define by "there is skew in the data").
http://asktom.oracle.com/pls/ask/f?p=4950:8:::::F4950_P8_DISPLAYID:5792247321358#7417227783861
Hotsos Symposium, March 6-9, 2005© Wolfgang Breitling, Centrex Consulting Corporation30
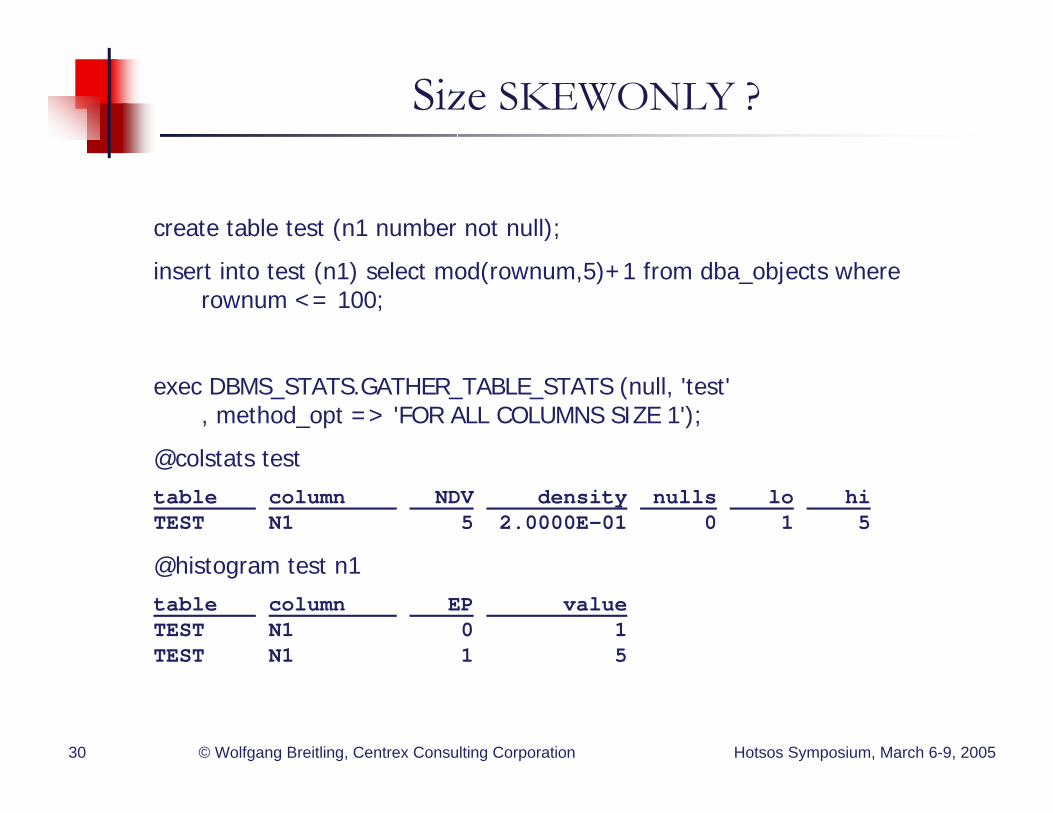
create table test (n1 number not null);
insert into test (n1) select mod(rownum,5)+1 from dba_objects where rownum <= 100;
exec DBMS_STATS.GATHER_TABLE_STATS (null, 'test', method_opt => 'FOR ALL COLUMNS SIZE 1');
@colstats testtable column NDV density nulls lo hi TEST N1 5 2.0000E-01 0 1 5
@histogram test n1table column EP valueTEST N1 0 1TEST N1 1 5
Size SKEWONLY ?
Hotsos Symposium, March 6-9, 2005© Wolfgang Breitling, Centrex Consulting Corporation31
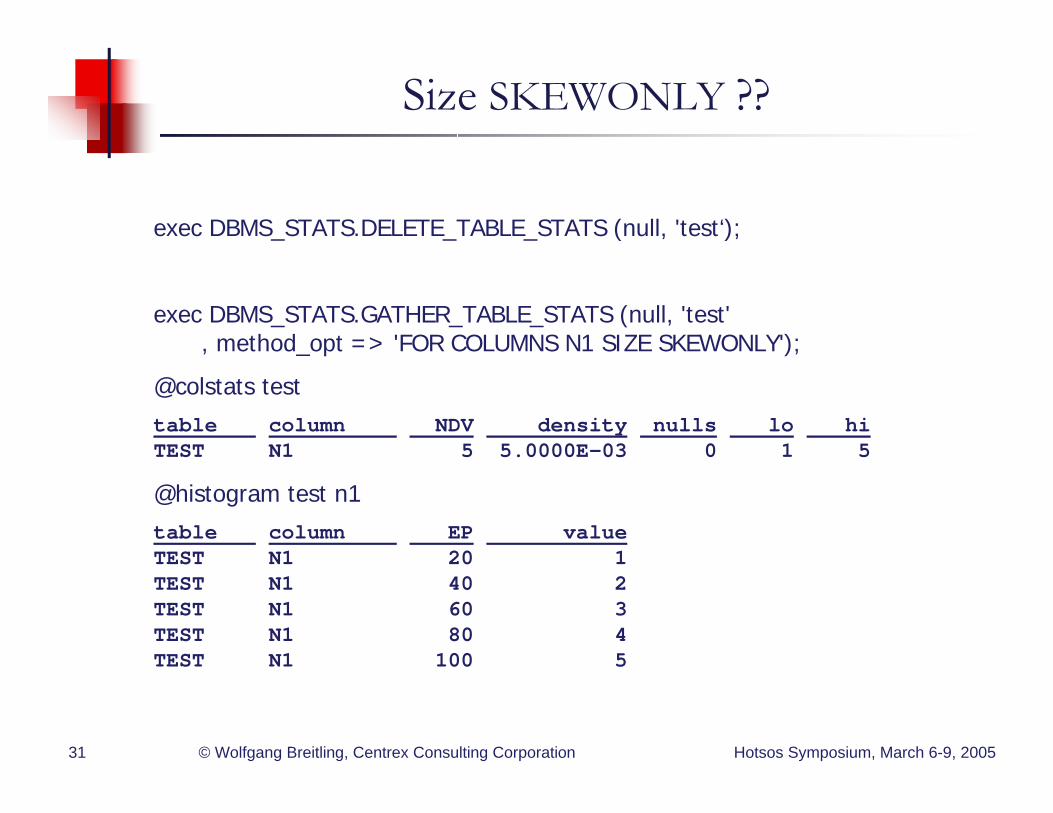
exec DBMS_STATS.DELETE_TABLE_STATS (null, 'test‘);
exec DBMS_STATS.GATHER_TABLE_STATS (null, 'test', method_opt => 'FOR COLUMNS N1 SIZE SKEWONLY');
@colstats testtable column NDV density nulls lo hi TEST N1 5 5.0000E-03 0 1 5
@histogram test n1table column EP valueTEST N1 20 1TEST N1 40 2TEST N1 60 3TEST N1 80 4TEST N1 100 5
Size SKEWONLY ??
Hotsos Symposium, March 6-9, 2005© Wolfgang Breitling, Centrex Consulting Corporation32
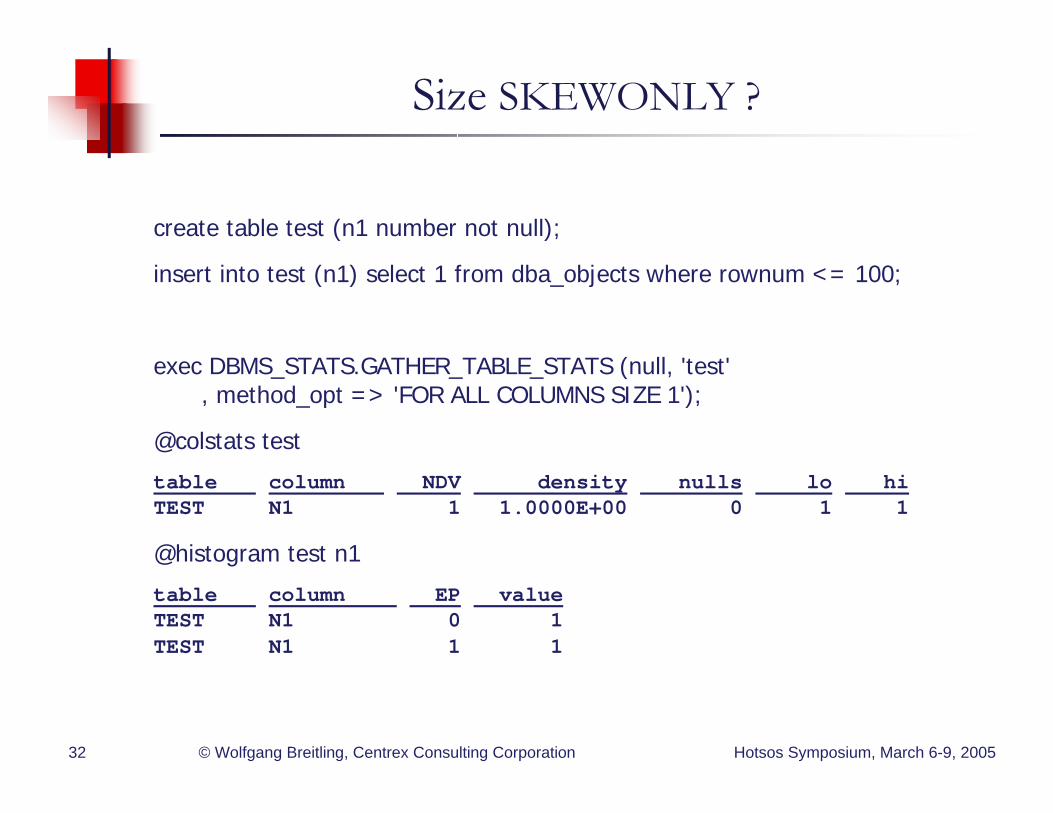
create table test (n1 number not null);
insert into test (n1) select 1 from dba_objects where rownum <= 100;
exec DBMS_STATS.GATHER_TABLE_STATS (null, 'test', method_opt => 'FOR ALL COLUMNS SIZE 1');
@colstats test
table column NDV density nulls lo hiTEST N1 1 1.0000E+00 0 1 1
@histogram test n1
table column EP valueTEST N1 0 1TEST N1 1 1
Size SKEWONLY ?
Hotsos Symposium, March 6-9, 2005© Wolfgang Breitling, Centrex Consulting Corporation33
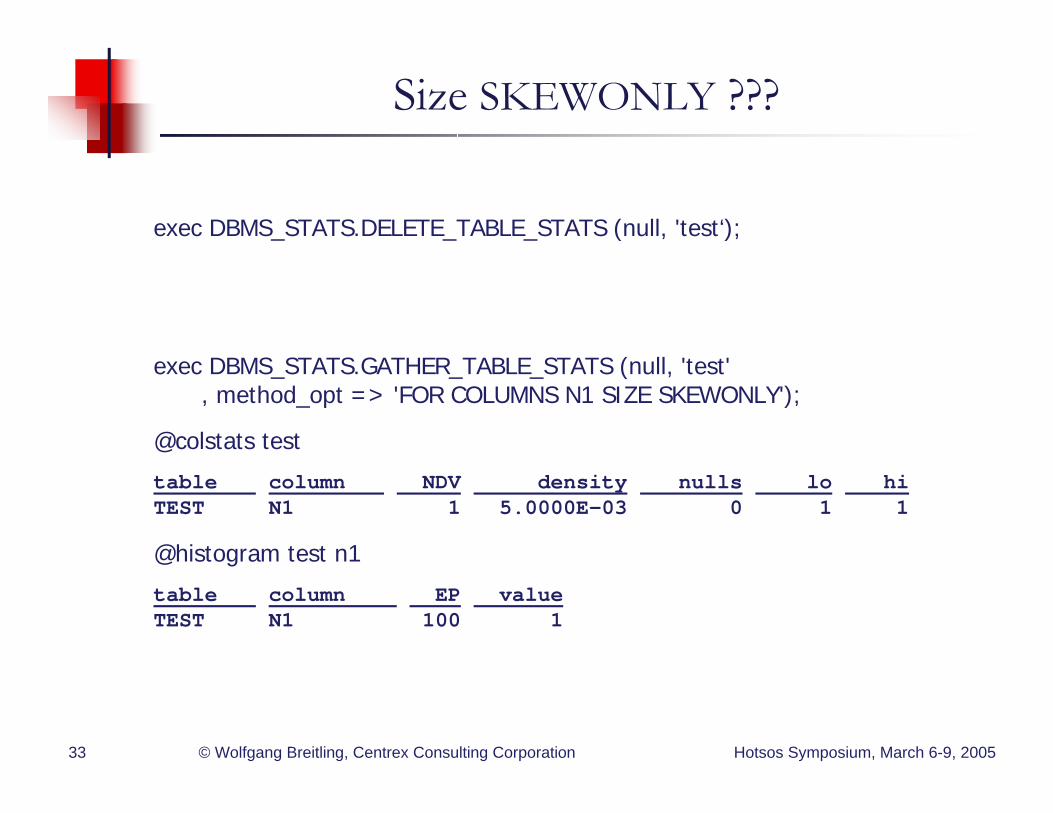
exec DBMS_STATS.DELETE_TABLE_STATS (null, 'test‘);
exec DBMS_STATS.GATHER_TABLE_STATS (null, 'test', method_opt => 'FOR COLUMNS N1 SIZE SKEWONLY');
@colstats test
table column NDV density nulls lo hiTEST N1 1 5.0000E-03 0 1 1
@histogram test n1
table column EP valueTEST N1 100 1
Size SKEWONLY ???
Hotsos Symposium, March 6-9, 2005© Wolfgang Breitling, Centrex Consulting Corporation34
Size REPEAT ?
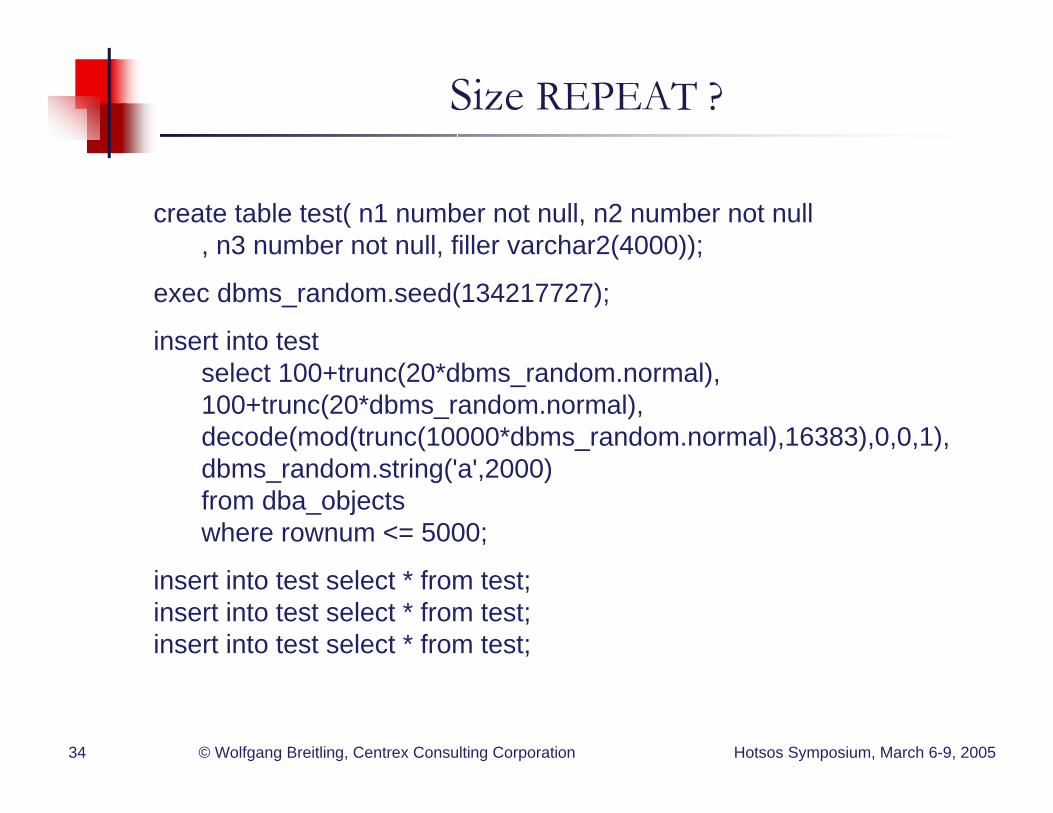
create table test( n1 number not null, n2 number not null, n3 number not null, filler varchar2(4000));
exec dbms_random.seed(134217727);
insert into testselect 100+trunc(20*dbms_random.normal),100+trunc(20*dbms_random.normal),decode(mod(trunc(10000*dbms_random.normal),16383),0,0,1),dbms_random.string('a',2000)from dba_objectswhere rownum <= 5000;
insert into test select * from test;insert into test select * from test;insert into test select * from test;
Hotsos Symposium, March 6-9, 2005© Wolfgang Breitling, Centrex Consulting Corporation35
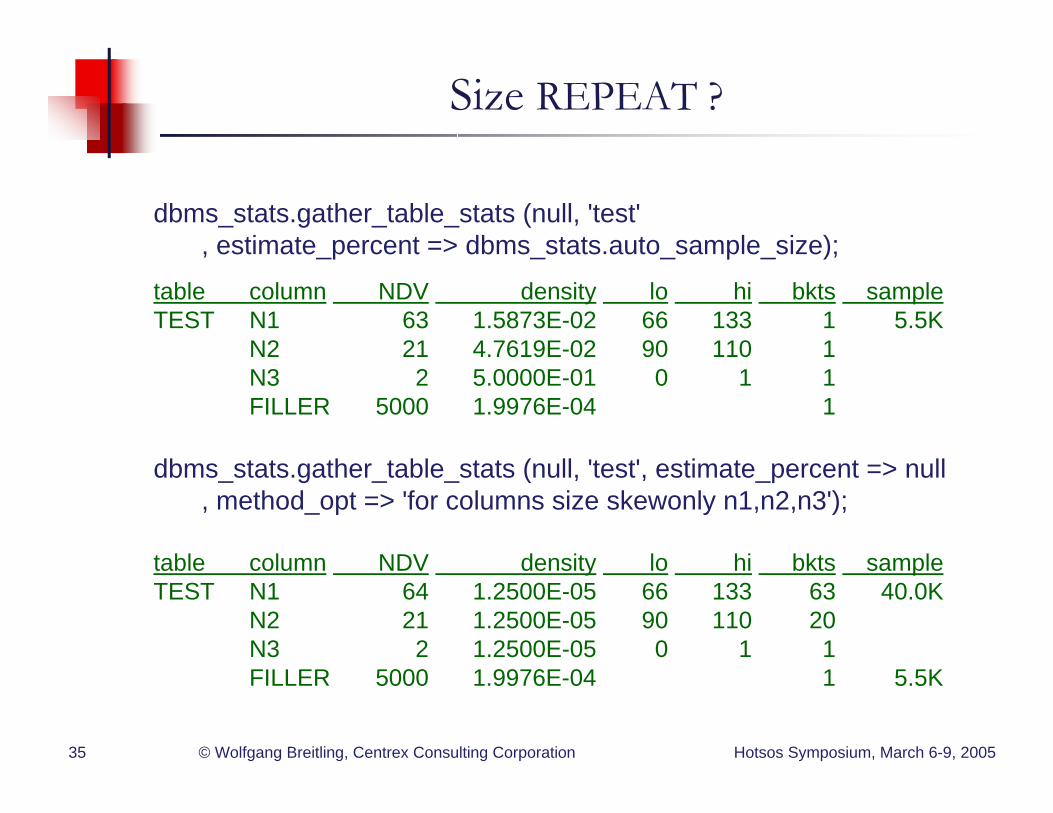
Size REPEAT ?
dbms_stats.gather_table_stats (null, 'test', estimate_percent => dbms_stats.auto_sample_size);
table column NDV density lo hi bkts sampleTEST N1 63 1.5873E-02 66 133 1 5.5K
N2 21 4.7619E-02 90 110 1N3 2 5.0000E-01 0 1 1FILLER 5000 1.9976E-04 1
dbms_stats.gather_table_stats (null, 'test', estimate_percent => null, method_opt => 'for columns size skewonly n1,n2,n3');
table column NDV density lo hi bkts sampleTEST N1 64 1.2500E-05 66 133 63 40.0K
N2 21 1.2500E-05 90 110 20N3 2 1.2500E-05 0 1 1FILLER 5000 1.9976E-04 1 5.5K
Hotsos Symposium, March 6-9, 2005© Wolfgang Breitling, Centrex Consulting Corporation36
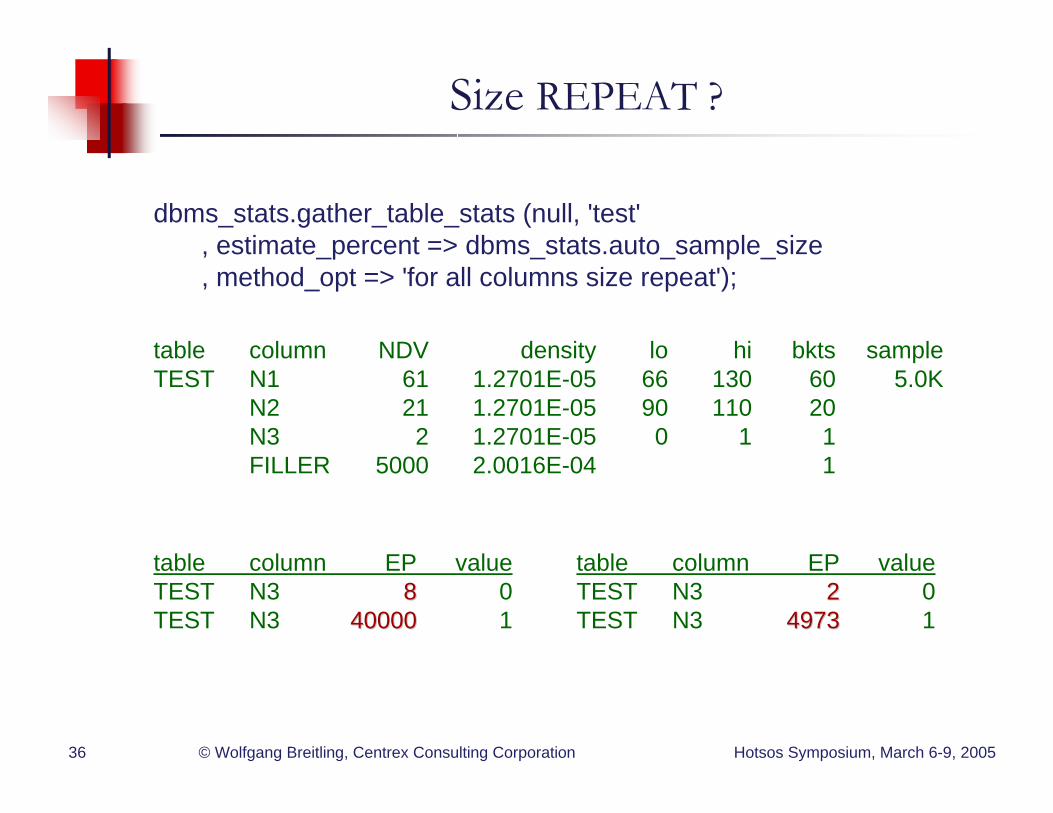
Size REPEAT ?
dbms_stats.gather_table_stats (null, 'test', estimate_percent => dbms_stats.auto_sample_size, method_opt => 'for all columns size repeat');
table column NDV density lo hi bkts sampleTEST N1 61 1.2701E-05 66 130 60 5.0K
N2 21 1.2701E-05 90 110 20N3 2 1.2701E-05 0 1 1FILLER 5000 2.0016E-04 1
table column EP valueTEST N3 88 0TEST N3 4000040000 1
table column EP valueTEST N3 22 0TEST N3 49734973 1

Hotsos Symposium, March 6-9, 2005© Wolfgang Breitling, Centrex Consulting Corporation37
Size REPEAT ?
Hotsos Symposium, March 6-9, 2005© Wolfgang Breitling, Centrex Consulting Corporation38
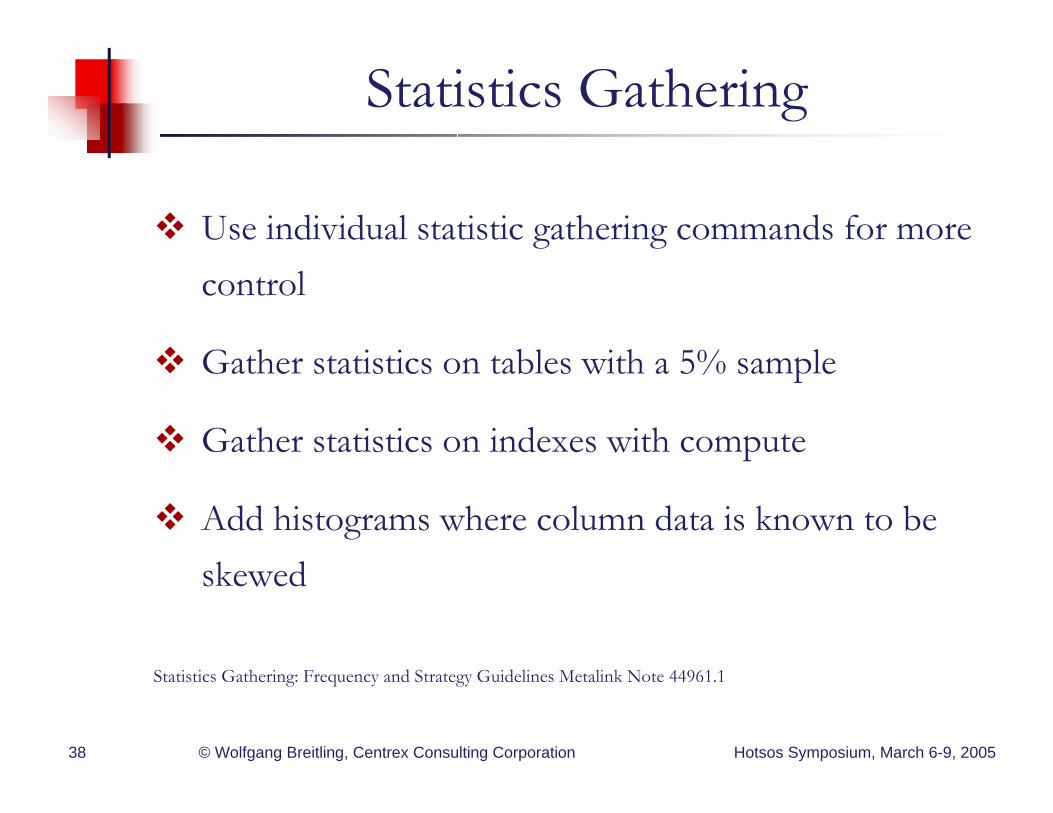
Statistics Gathering
Use individual statistic gathering commands for more control
Gather statistics on tables with a 5% sample
Gather statistics on indexes with compute
Add histograms where column data is known to be skewed
Statistics Gathering: Frequency and Strategy Guidelines Metalink Note 44961.1
Hotsos Symposium, March 6-9, 2005© Wolfgang Breitling, Centrex Consulting Corporation39
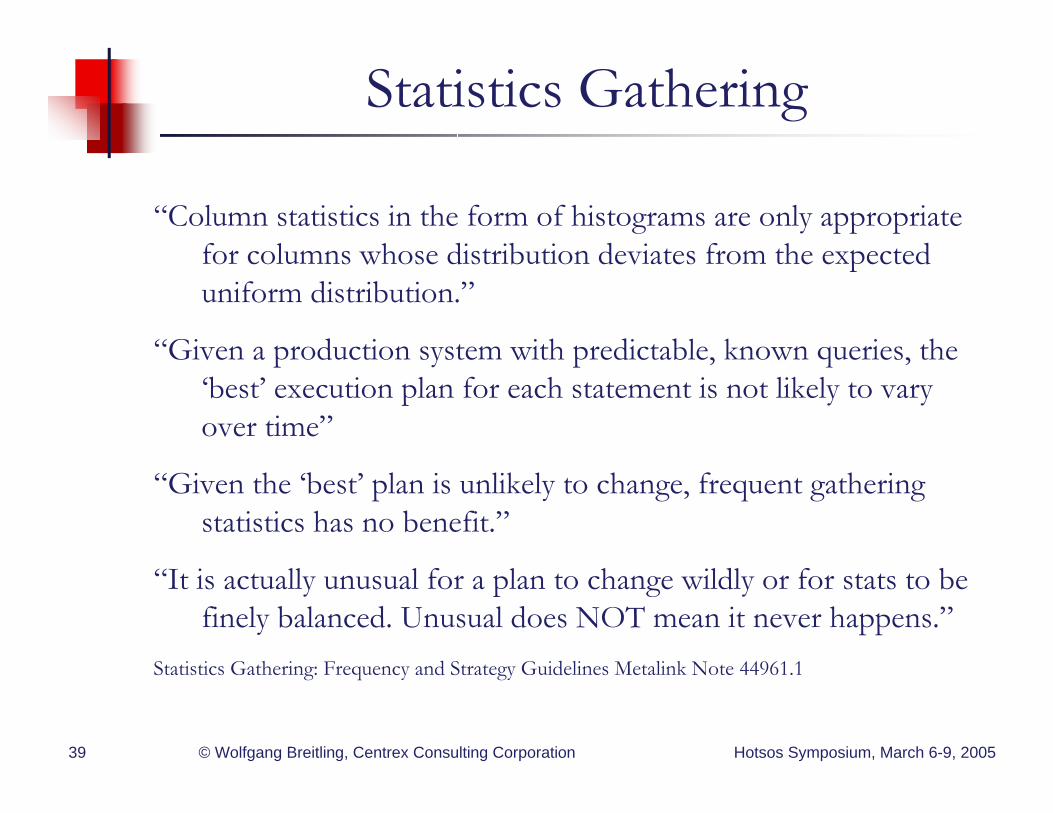
Statistics Gathering
“Column statistics in the form of histograms are only appropriate for columns whose distribution deviates from the expected uniform distribution.”
“Given a production system with predictable, known queries, the ‘best’ execution plan for each statement is not likely to vary over time”
“Given the ‘best’ plan is unlikely to change, frequent gatheringstatistics has no benefit.”
“It is actually unusual for a plan to change wildly or for stats to be finely balanced. Unusual does NOT mean it never happens.”
Statistics Gathering: Frequency and Strategy Guidelines Metalink Note 44961.1
Hotsos Symposium, March 6-9, 2005© Wolfgang Breitling, Centrex Consulting Corporation40
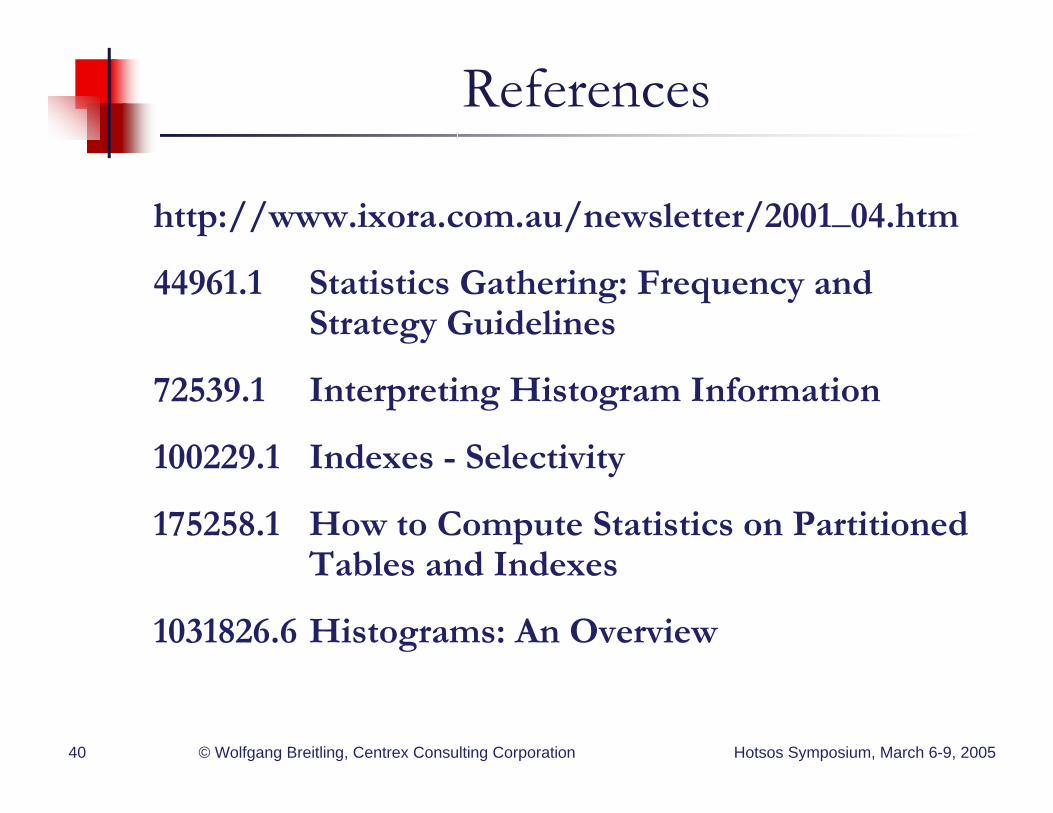
References
http://www.ixora.com.au/newsletter/2001_04.htm
44961.1 Statistics Gathering: Frequency and Strategy Guidelines
72539.1 Interpreting Histogram Information
100229.1 Indexes - Selectivity
175258.1 How to Compute Statistics on Partitioned Tables and Indexes
1031826.6 Histograms: An Overview
Hotsos Symposium, March 6-9, 2005© Wolfgang Breitling, Centrex Consulting Corporation41
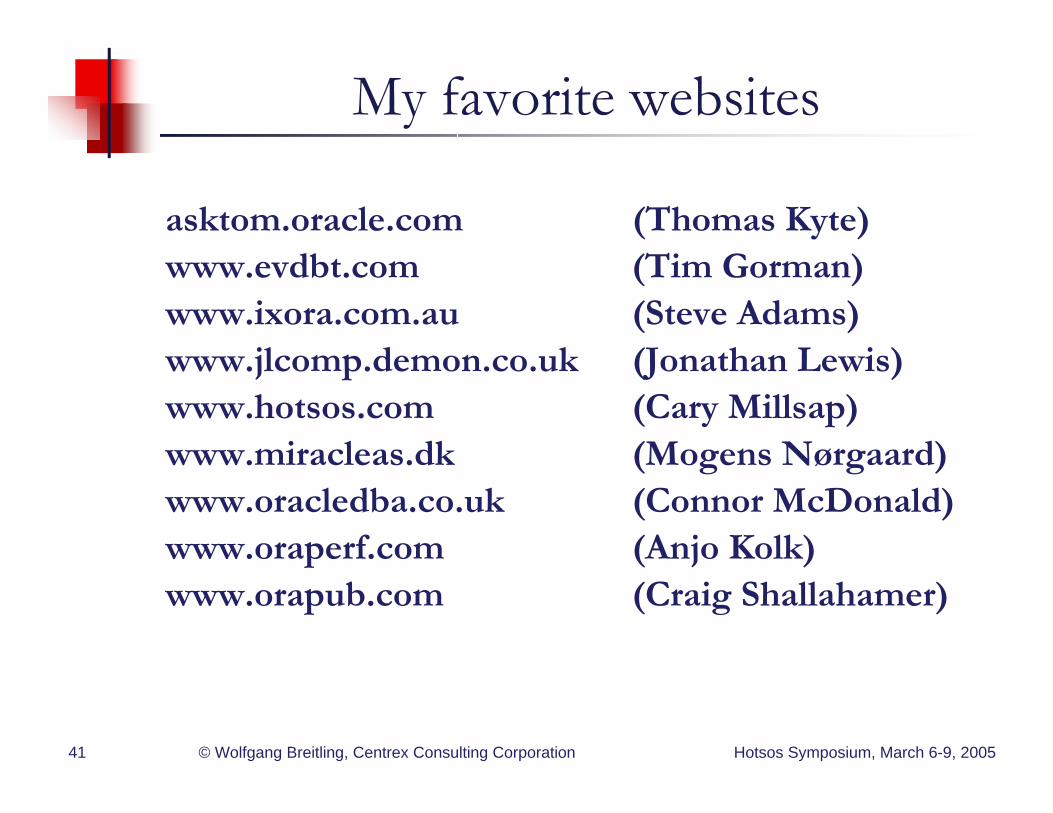
My favorite websites
asktom.oracle.com (Thomas Kyte)www.evdbt.com (Tim Gorman)www.ixora.com.au (Steve Adams)www.jlcomp.demon.co.uk (Jonathan Lewis)www.hotsos.com (Cary Millsap)www.miracleas.dk (Mogens Nørgaard)www.oracledba.co.uk (Connor McDonald)www.oraperf.com (Anjo Kolk)www.orapub.com (Craig Shallahamer)