breaking bad – how not to do analysis: context, interpretation & exposure rates rsa team
TRANSCRIPT

Breaking Bad – How not to do analysis: context, interpretation & exposure ratesRSA Team

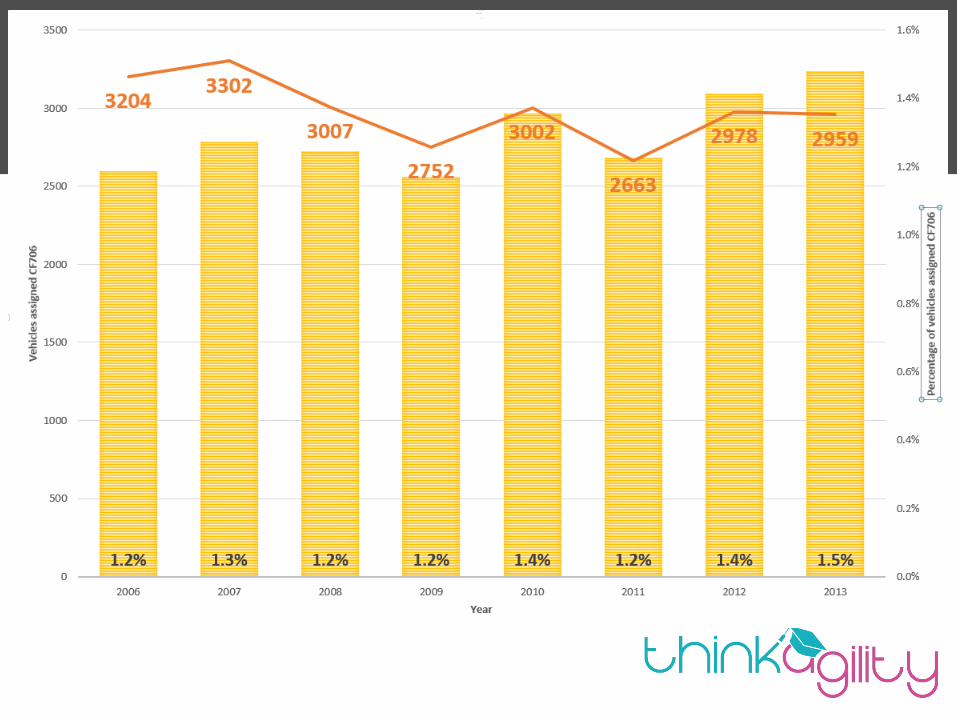
Does autumn sun ‘kill 28 drivers per year’
• Used CF706 ‘Dazzling Sun’• Headline was that the percentage of collisions were increasing
(1.2% to 1.31%)• No other information was presented, speculated that
‘Autumn’ and ‘Evenings’ were the problem

Are men twice as likely to speed as women?
• Story in The Telegraph – November 2014• One man in 15 has points • Compared to one woman in 30 • Based on stats from DVLA on total numbers of men
and women caught speeding

Speeding points by exposure
• Didn’t account for Speed Awareness Course attendance• More importantly, didn’t account for exposure!• We used RAC Foundation ‘On the Move’ report from Dec
2012 for• DID show that men had twice as many points per licence
holders• BUT we calculated:Points per miles driven=(Licence*Mileage)/(Drivers with Points/3 years)• Women = 140,420 and Men = 141,506 – Almost the same!

Where do Britain’s Most Dangerous Drivers Live?
• Published by Brake.• Using DVLA data from 2013 to show numbers of
offending drivers by home postcode district e.g. OX17.• ‘Top 10’ table created showing highest offender
numbers.• SL6 highest numbers of offenders with 1,847,
followed by NG5 (1,543), SL1 (1,537), ST5 (1,516) and BH23 (1,503).

Offenders by population
• Nearly 3,000 postcode districts in Great Britain of varying population.
• Average of around 22,000 people, ranging from 12 to over 150,000.
• Population data for postcode districts taken from the data behind MAST to create offence rate (offenders per 1,000 population).
Postcode District
Population (over 17)
Offences Offence Rate
SL6 61,592 1,847 30.0
NG5 69,330 1,543 22.3
SL1 53,874 1,537 28.5
ST5 67,336 1,516 22.5
BH23 44,057 1,503 34.1
LE2 94,153 1,459 15.5
NG16 52,077 1,411 27.1
NE3 42,181 1,371 32.5
LE3 78,838 1,341 17.0
KY11 47,256 1,331 28.2
Brake ‘Top 10’Postcode District
Population (over 17)
Offences Offence Rate
OX49 3,361 202 60.1
WR6 9,930 585 58.9
NE41 1,680 98 58.3
SL0 8,842 509 57.6
B96 4,165 233 55.9
SA3 21,773 1,166 53.6
RM19 4,925 256 52.0
RG9 18,431 943 51.2
ST12 3,016 151 50.1
NE20 9,600 475 49.5
Our ‘Top 10’

Where are Britain’s Most Dangerous Roads – Swiftcover – February 2015

AXA “Schools Road Safety Index”
• The Proposal• Compare road safety trends for communities located near schools
• The Analysis• Identify crashes in 500m radius of each school, on non-motorway roads• Scope of six years, allowing identification of changes between three
year periods• Express as rates per km of each road class (A, B, unclassified)• Identify broad comparability by network density and rurality
• The Caveats• Most urban roads are within 500m of a school (and often more than
one) - so the data cannot be aggregated• Most collisions are not related to the presence of schools - so the data
measures road safety trends in the community, not the school itself

Example – a school radius

Distortion upon distortion
• This school radius happened to have the highest absolute number of crashes involving child casualties in its region• To a journalist, this apparently proves that it is “the worst area for road
accidents”
• Adding up separate numbers of crashes within 500 metres of each school inevitably results in ‘double counting’• A journalist adds them together anyway, then inaccurately claims that
“More than 1,100 crashes happened outside [local] secondary schools over five [sic] years”
• What’s in a name?• “Schools Road Safety Index” is not principally relevant to schools, and is
not indexed
• There is substantial disconnect between proposal and outcome