break from the pack with data visualization & infographics
TRANSCRIPT

PROPRIETARY & CONFIDENTIAL @sandrafathi March 4, 2010 Affect Strategies
PROPRIETARY & CONFIDENTIAL @sandrafathi March 4, 2010 Affect Strategies
PR News: Big 4 Social Media Summit
Break From the Pack with Data Visualization & Infographics
Sandra Fathi President, Affect [email protected] www.affect.com @sandrafathi Slideshare.net/sfathi
San Francisco, Aug. 9, 2016 #social16

PROPRIETARY & CONFIDENTIAL @sandrafathi
DATA VISUALIZATION & INFOGRAPHICS
#social16
1. Data Goals: Scientific Research or Headlines
2. Finding Diamonds in the Data
3. Meeting Media Expectations
4. Telling a Story or Going on a Journey

PROPRIETARY & CONFIDENTIAL @sandrafathi
DATA GOALS: SCIENTIFIC RESEARCH
#social16
“Pure Science”
Explaining the world around us and trying to understand how it operates
Looking for answers to specific questions that help humanity
The purpose of research is really an ongoing process of correcting and refining hypotheses, which should lead to
the acceptance of certain scientific truths
Source: Explorable.com
PROPRIETARY & CONFIDENTIAL @sandrafathi
DATA GOALS: PUBLIC RELATIONS
#social16
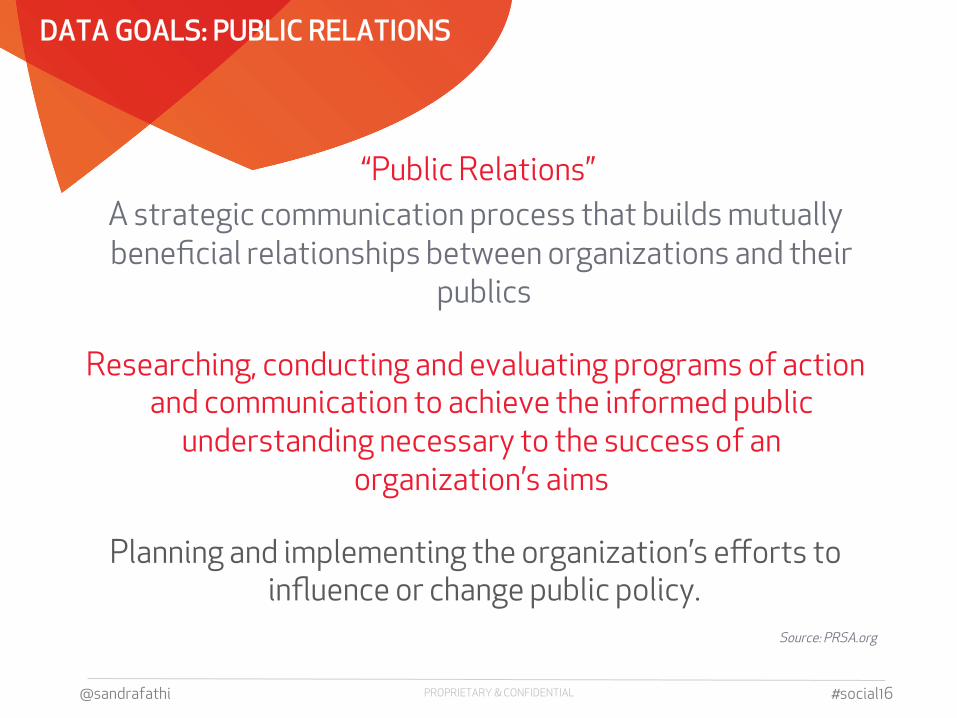
“Public Relations”
A strategic communication process that builds mutually beneficial relationships between organizations and their
publics
Researching, conducting and evaluating programs of action and communication to achieve the informed public
understanding necessary to the success of an organization’s aims
Planning and implementing the organization’s efforts to influence or change public policy.
Source: PRSA.org

PROPRIETARY & CONFIDENTIAL @sandrafathi
DATA GOALS
#social16
Scientific Approach:
What is the status of water in the glass?
PR Approach:
How can I prove the glass is half full?
PROPRIETARY & CONFIDENTIAL @sandrafathi
DATA VISUALIZATION & INFOGRAPHICS
#social16
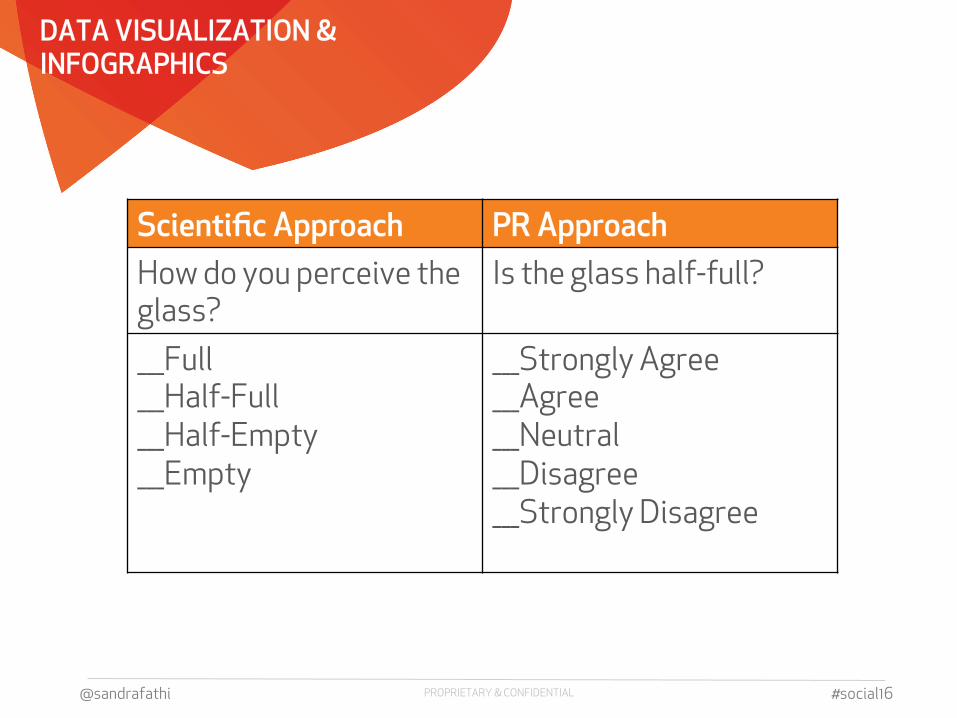
Scientific Approach PR Approach
How do you perceive the glass?
Is the glass half-full?
___Full ___Half-Full ___Half-Empty ___Empty
___Strongly Agree ___Agree ___Neutral ___Disagree ___Strongly Disagree

PROPRIETARY & CONFIDENTIAL @sandrafathi
DATA VISUALIZATION & INFOGRAPHICS
#social16
Scientific Approach PR Approach
How do you perceive the glass?
Is the glass half-full?
___Full 50% Half-Full 50% Half-Empty ___Empty
50% Strongly Agree 50% Agree ___Neutral ___Disagree ___Strongly Disagree
50% of People Say Glass is Half-Full
100% of People Say Glass is Half-Full

PROPRIETARY & CONFIDENTIAL @sandrafathi
DATA VISUALIZATION & INFOGRAPHICS
#social16
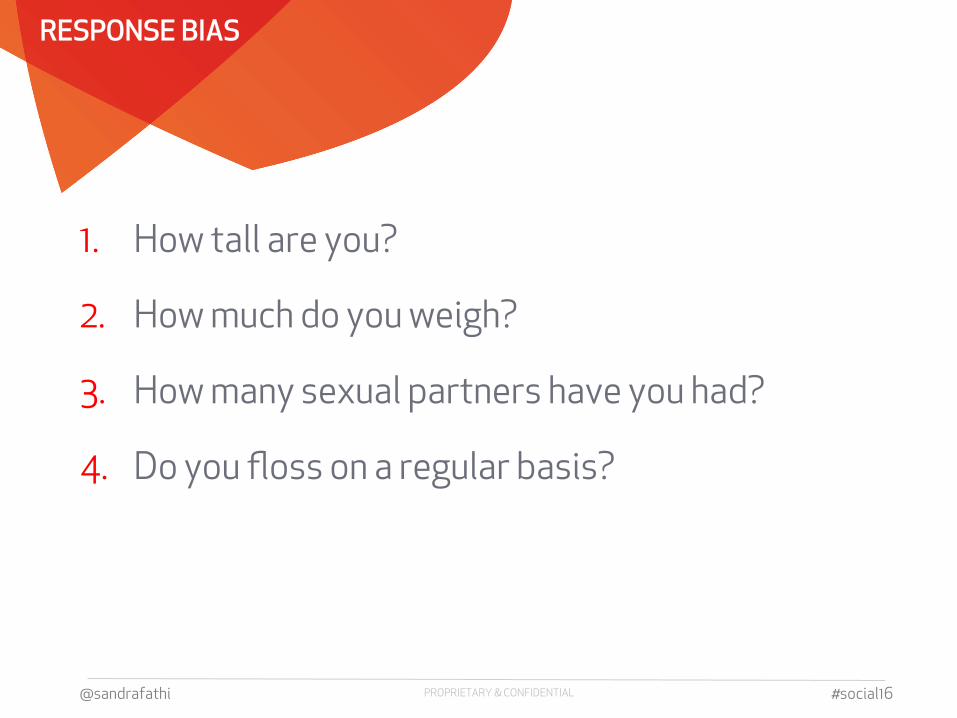
Response Bias:
A wide range of cognitive biases that influence the responses of participants away from accurate or
truthful responses
• Phrasing of a question
• Demeanor of researcher
• Experiment/survey structure
• Compliance/desired outcome
PROPRIETARY & CONFIDENTIAL @sandrafathi
RESPONSE BIAS
#social16
1. How tall are you?
2. How much do you weigh?
3. How many sexual partners have you had?
4. Do you floss on a regular basis?

PROPRIETARY & CONFIDENTIAL @sandrafathi
POLLING & SURVEYS: MISLEADING RESULTS
#social16
1. Leading questions
2. Question order
3. Non-exclusive responses, missing options
forced answers
4. Ignoring the margin of error
5. Random sample or fish in a barrel
6. Unbalanced scale

PROPRIETARY & CONFIDENTIAL @sandrafathi #social16
DIAMONDS IN THE DATA
Elicit an Emotional Response
PROPRIETARY & CONFIDENTIAL @sandrafathi #social16
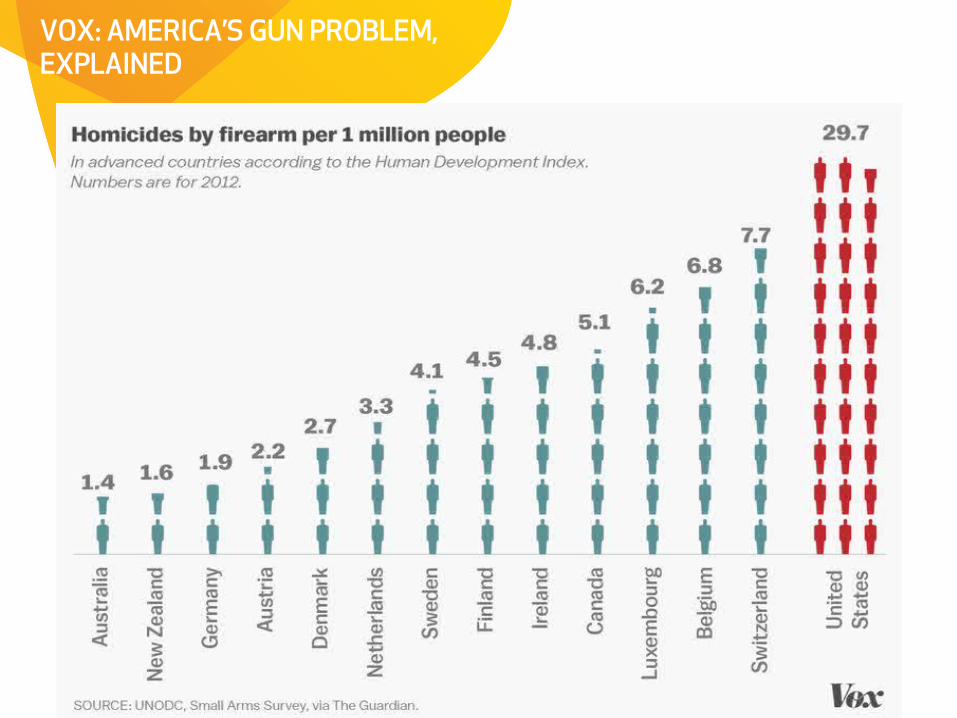
VOX: AMERICA’S GUN PROBLEM, EXPLAINED
PROPRIETARY & CONFIDENTIAL @sandrafathi #social16
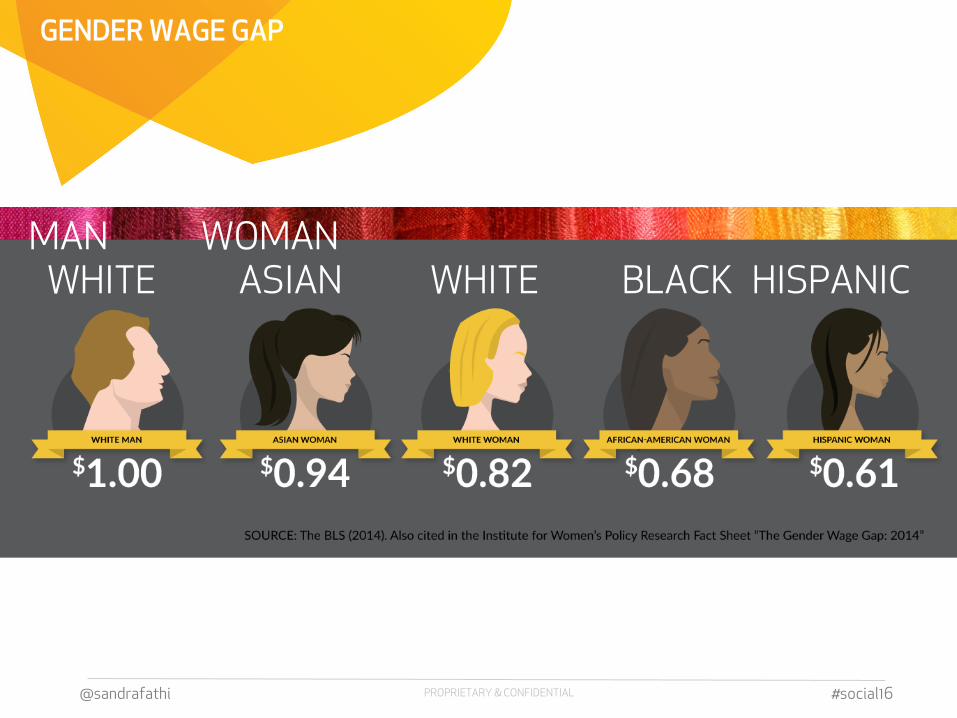
GENDER WAGE GAP
MAN WOMAN WHITE ASIAN WHITE BLACK HISPANIC

PROPRIETARY & CONFIDENTIAL @sandrafathi #social16
ODDS OF DYING FROM X

PROPRIETARY & CONFIDENTIAL @sandrafathi #social16
POKEMON DIET

PROPRIETARY & CONFIDENTIAL @sandrafathi #social16
MEETING MEDIA EXPECTATIONS
1. Statistical Significance
2. Exclusivity
3. Objectivity
4. Methodology
5. Access to Raw Data
6. Opinion/Analysis

PROPRIETARY & CONFIDENTIAL @sandrafathi #social16
WSJ: SURVEY ROUNDUP BEN PIETRO
- 644 Ethics and compliance professionals
- 600 Corporate Executives
- 200 Lawyers, in-house counsel and corporate executives
- 354 Board directors and general counsel

PROPRIETARY & CONFIDENTIAL @sandrafathi #social16
MEETING MEDIA EXPECTATIONS
1. Methodology Matters – No Survey Monkey or self-administered surveys
2. Accepts Reputable/Objective Partners – Analyst firms, renown research firms
3. Quotes Public, Government or Association Sources
4. Prefers its Own Research
5. Larger Data Pools (500+)
6. Examines Raw Data

PROPRIETARY & CONFIDENTIAL @sandrafathi #social16
MEETING MEDIA EXPECTATIONS

PROPRIETARY & CONFIDENTIAL @sandrafathi #social16
MEETING MEDIA EXPECTATIONS

PROPRIETARY & CONFIDENTIAL @sandrafathi #social16
MEETING MEDIA EXPECTATIONS
Sample Size: 29
Sample Size: 110,000

PROPRIETARY & CONFIDENTIAL @sandrafathi
TELLING A STORY, GOING ON A JOURNEY
#social16
• Know Your Target – Who is your target audience? (Reader and outlet)
• Keep It Simple - Communicate more, in less time, with less effort
• Create a Storyline – Where are you taking the reader? Begin with the end in mind.
• Eliminate the Answer Key – no need for translation
• Demonstrate Relationships – Comparison data, comparison visuals

PROPRIETARY & CONFIDENTIAL @sandrafathi
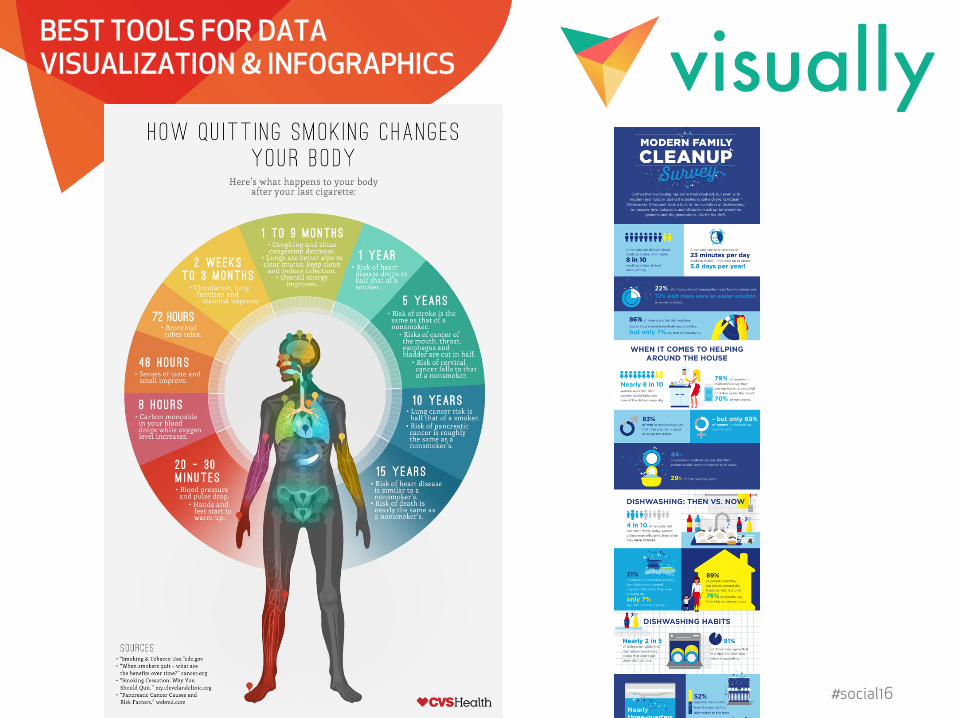
BEST TOOLS FOR DATA VISUALIZATION & INFOGRAPHICS
#social16
1. Word
2. Excel
3. PowerPoint
4. Variety of free and nearly free tools
5. Custom design

PROPRIETARY & CONFIDENTIAL @sandrafathi
BEST TOOLS FOR DATA VISUALIZATION & INFOGRAPHICS
#social16

PROPRIETARY & CONFIDENTIAL @sandrafathi
BEST TOOLS FOR DATA VISUALIZATION & INFOGRAPHICS
#social16

PROPRIETARY & CONFIDENTIAL @sandrafathi
BEST TOOLS FOR DATA VISUALIZATION & INFOGRAPHICS
#social16

PROPRIETARY & CONFIDENTIAL @sandrafathi
BEST TOOLS FOR DATA VISUALIZATION & INFOGRAPHICS
#social16
PROPRIETARY & CONFIDENTIAL @sandrafathi
BEST TOOLS FOR DATA VISUALIZATION & INFOGRAPHICS
#social16

PROPRIETARY & CONFIDENTIAL @sandrafathi
TAKEAWAYS
#social16
1. Good research is like a good bra: It’s the foundation - looks good, supports your thesis
2. Devil is in the data: Grabs your soul, elicits an emotion
3. Know your audience: methodology and medium matter to media
4. Tell a story: Take the reader on a journey, have a destination

PROPRIETARY & CONFIDENTIAL @sandrafathi March 4, 2010 Affect Strategies
PR News: Big 4 Social Media Summit
Break From the Pack with Data Visualization & Infographics
Sandra Fathi President, Affect [email protected] www.affect.com @sandrafathi Slideshare.net/sfathi
San Francisco, Aug. 9, 2016 #social16