break even analysis
DESCRIPTION
Break Even AnalysisTRANSCRIPT

_______ Professo Copyrig7685, wdigitized
T H O M A
J I L L A V
Ma
Intro
Macost mgettinlead tpoint.the co-- it isvolum
MaOnce will b
Maprogrsell tomanya firmof losalso bbefore
The
Thbreakgenerthe fir
Thequat
_______________
or Thomas Steenbu
ght © 2010, 2011 Prrite Harvard Busind, photocopied, or
A S S T E E N B U R G H
V E R Y
arketin
oduction
arketing manmoney to impng a return onto incrementa. The breakev
ost of the progs not selling e
me, then it is m
anagers use a breakeven
be able to sell
arketing manrams. For exao recoup the y incremental m may want to
t sales of an ebe used to dete the firm rea
Breakeve
he breakeven ks even on itrates sales revrm.
he key to bretion and Tota
_______________
urgh and Professor
esident and Fellowness School Publishotherwise reprodu
H
g Anal
nagers are ofteplement. Befon their investmal profits for ven point calcgram. If the fenough to remaking mone
breakeven a point is calcuthat quantity
nagers use bample, a firmcost of a $10
units of prodo assess how existing prodtermine how alizes a profi
n Formula
point is the ts fixed cost venues comin
akeven analyal Costs on t
________________
Jill Avery (Simmon
ws of Harvard Collehing, Boston, MA
uced, posted, or tran
ysis To
en called upoore expenditument; they wthe firm. Onculates the nufirm sells less coup its inve
ey -- it is sellin
nalysis to asulated, mana of product.
breakeven am may want t0 million advduct it must semany incremuct due to int many purchait, given the c
a
unit quantitinvestment.
ng into the fir
ysis is settingthe other sid
_______________
ns School of Manag
ege. To order copi02163, or go to wwnsmitted, without t
oolkit:
on to make recures are madewant to ensure
ne way of asumber of incr than the brea
estment. If thng more than
ssess the finaagers need to
nalysis to ao assess how
vertising campell to recoup
mental units oftra-firm prodases a customcosts of acqu
ty that yields Hence, the
rm that are ex
g up an equate, such that
_______________
gement) prepared t
ies or request permww.hbsp.harvard.ethe permission of H
Breake
commendatioe, managers we that the mossessing this iremental unitakeven point he firm sells m enough to co
ancial feasibi evaluate wh
assess many w many increm
paign. Or, a the cost of a $f a new produ
duct cannibalimer (or customuiring that cu
s zero profits breakeven pxactly equal t
tion with TotTotal Revenu
_______________
this note as the bas
mission to reproducedu/educators. ThHarvard Business S
even A
ons for or agawant to be suroney will be wis by calculatts the firm ne volume, thenmore than th
over its invest
ility of markehether it is fea
different tymental units a firm may w$5 million saluct it must seization. Breakmer segment)ustomer (or cu
s to the firm point is the to the total co
tal Revenue ue = Total C
9-51R E V : J U L Y
________________
is for class discussi
ce materials, call 1-his publication maySchool.
Analysis
ainst programre that they wwell spent anting the breakeds to sell to
n it is losing mhe breakeven tment.
eting investmasible that the
ypes of markof product it
want to assessles promotionell to cover thkeven analys will have to ustomer segm
-- where theunit quantity
osts being spe
on one side oCosts. In ord
10-080Y 2 6 , 2 0 1 1
______
ion.
-800-545-y not be
s
ms that will be d will keven cover
money point
ments. e firm
keting t must s how n. Or,
he cost sis can make ment).
e firm y that ent by
of the der to

510-080 Marketing Analysis Toolkit: Breakeven Analysis
2
calculate the breakeven point, one has to find a unit quantity that makes both sides of the equation equal. Remember that the unit quantity sold affects both sides of the equation because total revenue is calculated by multiplying the quantity sold by the selling price per unit and because total costs are calculated by first multiplying the quantity sold by the variable cost per unit, and then adding fixed costs. Hence, the breakeven equation looks like this:
Total Revenue = Total Costs
Price per unit * BEQ = (Variable Costs per unit * BEQ) + Fixed Costs
(where BEQ is the breakeven quantity)
*Note that the price per unit which goes into the Total Revenue calculation is not necessarily the price at which a consumer purchases the product (i.e. the retail price). For firms who do not sell directly to consumers, the price per unit received by the firm is the price at which the firm sells the product to its distribution channel partners.
We can reorder the above equation to solve for the break-even point algebraically.
BEQ = Fixed Costs Price per unit - Variable Costs per unit
Or, since Price per unit - Variable Costs per unit = Contribution Margin per unit:
BEQ = Fixed Costs Contribution Margin per unit
Hence, to calculate a break-even point to understand how many units of a product we need to sell to cover our costs, we need to know the fixed costs of the program and the amount of profit we make from each unit we sell.
Graphical Representation of the Breakeven Point
Graphically, the break-even point is the point where the Total Revenue curve intersects the Total Cost curve. Let's take a look at how the curves are built. Imagine a company that makes flip flops. The company sells the flip flops at a price of $24.00. The variable costs to make the flip flops are $14.00. The fixed costs to advertise the flip flops on campus are $2,000. What is the breakeven quantity of flip flops the company must sell to breakeven on its advertising expense?
First, determine the fixed costs. No matter how many flip flops are sold, the cost of advertising remains the same. Thus, the company’s fixed costs are $2,000.
Second, build the Variable Cost curve. Draw this curve by multiplying the potential number of flip flops sold by $14.00.
Third, draw the Total Cost curve by adding the fixed costs to the variable costs. Thus, the Total Costs curve is parallel to the Variable Costs curve, and the distance between the curves at any point is equal to the fixed costs.
Fourth, build the Total Revenue curve. Draw this curve by multiplying the potential number of flip flops sold by $24.00.
Marketing Analysis Toolkit: Breakeven Analysis 510-080
3
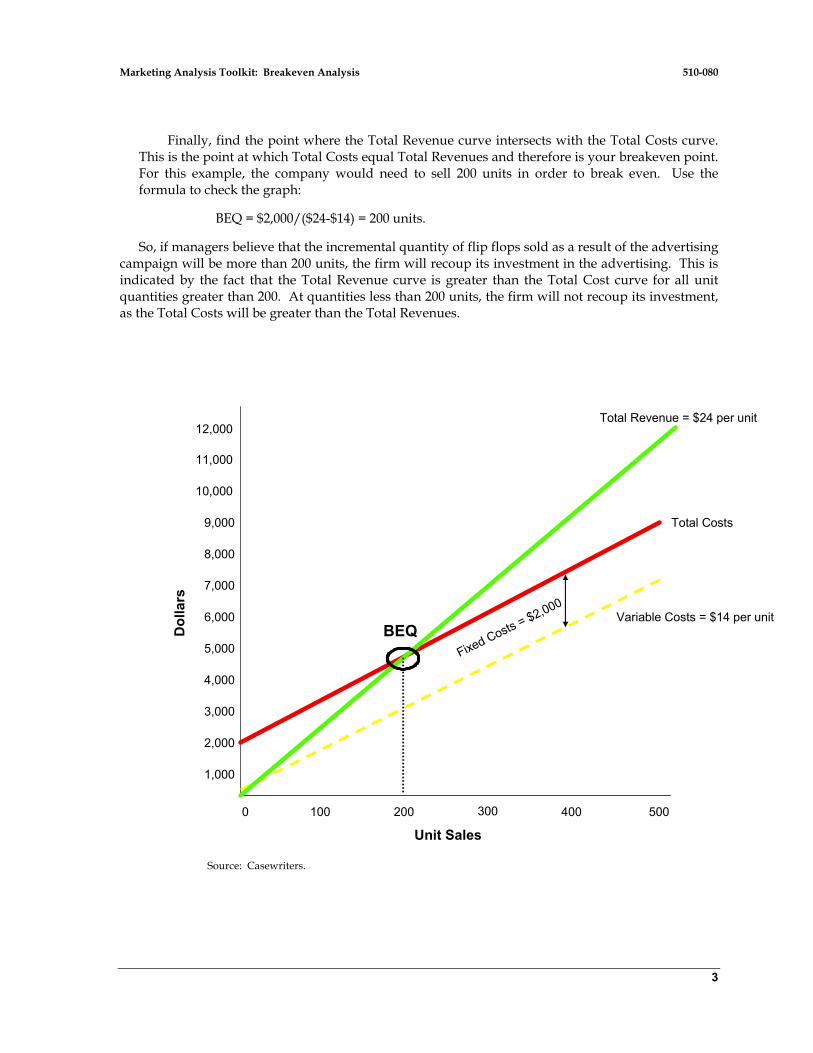
Finally, find the point where the Total Revenue curve intersects with the Total Costs curve. This is the point at which Total Costs equal Total Revenues and therefore is your breakeven point. For this example, the company would need to sell 200 units in order to break even. Use the formula to check the graph:
BEQ = $2,000/($24-$14) = 200 units.
So, if managers believe that the incremental quantity of flip flops sold as a result of the advertising campaign will be more than 200 units, the firm will recoup its investment in the advertising. This is indicated by the fact that the Total Revenue curve is greater than the Total Cost curve for all unit quantities greater than 200. At quantities less than 200 units, the firm will not recoup its investment, as the Total Costs will be greater than the Total Revenues.
Source: Casewriters.
Unit Sales
Do
llars
0 100 200 300 400 500
12,000
11,000
10,000
9,000
8,000
7,000
6,000
5,000
4,000
3,000
2,000
1,000
Fixed Costs = $2,000Variable Costs = $14 per unit
Total Costs
Total Revenue = $24 per unit
BEQ

510-080 Marketing Analysis Toolkit: Breakeven Analysis
4
Calculating the breakeven point is only a first step in any decision analysis. The more important (and often more difficult) step is to determine how the numbers influence the decision that needs to be made. After a breakeven quantity is calculated, managers need to assess how feasible it is that the firm will sell that incremental quantity as a result of the planned investment. A risk assessment should be conducted to calculate the probability that the firm will be successful in selling the incremental units and to identify stumbling blocks that may constrain the firm from achieving its goal. Managers can also assess how long it will take to achieve breakeven, by relating the break-even quantity to time. If you calculate your breakeven point to be 10,000 units and, based on historical estimates, you know that your customers will buy 5,000 additional units per year given the additional investment, you can calculate the time it will take for your firm to breakeven – 2 years. This is sometimes called the “payback period”, as it calculates the period of time the firm needs to pay back its investment. Some firms establish an internal benchmark for payback periods; for example, a firm could mandate that no investments will be made unless they payback within three years. The longer the payback period, the more risky it becomes for the firm to achieve the incremental sales necessary to breakeven.
Using Breakeven Analysis to Guide Marketing Decision Making
Marketers use breakeven analysis to help evaluate different types of marketing decisions. The most common uses are:
1.) To assess the feasibility of proposed fixed marketing expenditures, such as the cost of an advertising campaign. Here, breakeven analysis is used to determine the incremental number of units the company must sell to recoup its investment in the marketing expenditure. If I am going to spend $10 million on a new advertising campaign, how many additional units of product do I need to sell to breakeven on my investment? What the breakeven formula is calculating is how many units of product generate $10 million in profits for the company.
2.) To assess the feasibility of a permanent pricing change. Before a manager recommends cutting or raising the price of her products, she should understand the impact that her pricing change will have on customers' demand for the product. For most products, when prices go up, the quantity customers demand goes down; and when prices go down, the quantity customers demand goes up. Hence, pricing revisions not only affect the price received for each unit sold, but also may affect unit volume, which makes the problem more complex.
In the case of a price decrease, a manager can use breakeven analysis to calculate how many more units of the product must be sold to compensate for the lower price. When a price is reduced, the firm loses money on each unit sold -- but may gain incremental unit volume, given the inverse relationship between price and demand. This increase in unit volume may compensate for the lost revenue on the existing demand. For example, suppose that demand for a product is 100 units if the price is $10.00. A breakeven analysis can be used to determine how much additional demand must be generated to compensate for a $2.00 price decrease. If the product has a contribution margin of $5.00 at the $10.00 price (and thus, a contribution margin of $3.00 at the $8.00 price), then the breakeven point is calculated as follows:
Contribution Margin (at existing price) = Contribution Margin (at new price)
$5.00 * (100 units) = $3.00 * (100 + BEQ)

Marketing Analysis Toolkit: Breakeven Analysis 510-080
5
BEQ = 66.7 units
So, the firm must be confident that it can sell at least 66.7 additional units at the lower price to justify the price decrease. (The total number of units that would need to be sold at the lower price is 166.7 units.) Looking at the problem another way, the price reduction causes the company to lose $200 on the products that it would have sold at the higher price. So, we can think of $200 as the fixed cost of the price decrease. Therefore, the company needs to sell an additional 66.7 units at a contribution margin of $3.00 per unit to make up for this loss, as shown in the BEQ calculation below: BEQ = Fixed Cost = $200 = 66.7 units Contribution Margin $3.00
In the case of a price increase, a manager can use breakeven analysis to calculate the amount of unit sales that can be sacrificed given the higher price point. When a price is increased, the firm gains money on each unit sold -- but may lose some of its existing unit volume, given the inverse relationship between price and demand. This decrease in unit volume may not compensate for the gained revenue on the existing demand. For example, suppose demand for a product is 100 units if the price is $10.00. A breakeven analysis can be used to determine how much demand can be lost if the price is increased to $12.00. If the product has a contribution margin of $5.00 at the $10.00 price (and thus a contribution margin of $7.00 at the $12.00 price), then the breakeven point is:
Contribution Margin (at existing price) = Contribution Margin (at new price)
$5.00 * (100 units) = $7.00 * (100 units + BEQ)
BEQ = -28.6 units
So, the firm must be confident that it will lose fewer than 28.6 units to justify the price increase. (The total number of units that would need to be sold at the higher price is 71.4.)
Looking at the problem another way, if the company is able to sell all of the original 100 units at the higher price, it would realize an additional $200 in profits (we can think of this as a negative fixed cost which means we can plug -$200 as the fixed cost of the program into the breakeven formula). But, the higher price will lead it to sacrifice some unit sales. The company would breakeven if it sacrificed 28.6 units; if the sales decrease was less than 28.6 units, the firms would make incremental profit from the price increase. BEQ = Fixed Cost = ($5.00-$7.00) * (100 units) = -28.6 units Contribution Margin $7.00
3.) To assess the feasibility of proposed short–term variable marketing expenditures, such as the cost of a coupon promotion. Here, breakeven analysis is used to determine the incremental number of units the company must sell to recoup its loss of profits from the sale of each product bought at a discounted price. If I am going to sell my products with a coupon that reduces the

510-080 Marketing Analysis Toolkit: Breakeven Analysis
6
retail price by $1.00, how many additional units of product do I need to sell to breakeven on my coupon program investment? What the breakeven formula is calculating here is how many units of product generate enough profit to cover the cost associated with the $1.00 price break on the number of units sold with a coupon. For example, if I estimate that I will sell 50,000 units with a coupon, then I need to sell enough units to cover a $50,000 marketing investment.
4.) To assess the feasibility of a new product introduction that will cannibalize existing product sales. Many new products a firm introduces to the market not only steal sales from competitors, but also steal sales from the firm’s current offerings, a process known as cannibalization. Here, the cost of cannibalization is the decrease in profits the firm realizes as unit volume of the existing products goes down. Breakeven analysis is used to determine the incremental number of units of the new product the firm must sell in order to recoup the cost of cannibalization.