brazilian tax system - iep.ru · pis/pasep value added 1,65% cofins value added 7,60% inss payroll...
TRANSCRIPT

Brazilian Tax System
Brazilian Tax System
March/2013

Brazilian Tax System
General Features Brazilian Federation
Brazil is a federation composed of three highly decentralized government levels, each of them has its political, finance and administrative autonomy established by the Federal Constitution.

Brazilian Tax System
- Political Division: Central Government, States (26) and Federal District(1) and more than 5,000 municipalities
- Regional Inequalities: The three wealthiest States with 53% of GDP; the three poorest with 0.63% of GDP
- Population: 190 million inhabitants, more than 4 million formal companies
- Multiple Tax Administration (TA): federal, state and local.
General Features National Particularities

Brazilian Tax System
TAXES
TAXES and CONTRIBUTIONS

Brazilian Tax System
TAXES Competence
Union (Federal
Government) - Secretariat of
the Federal Revenue of Brazil
Taxes on Foreing Trade
- Tax on Import of goods and services - II - Tax on export of goods and services - IE
Taxes on Income and Earnings - IR
- Personal Income Tax - IRPF - Corporate Income Tax - IRPJ
- Tax on Manufactured Goods - IPI - Tax on Financial Operations - IOF - Tax on Property Land - ITR
States and Federal District
- Tax on the Circulation of Goods and transportation and communication Services – ICMS - Tax on Ownership of Motor Vehicles – IPVA - Inheritance and Gift Tax - ITCD
Municipalities (Local) and FD
- Urban Real Estate Tax – IPTU - Tax on Services – ISS - Tax on Real Estate Conveyance - ITBI

Brazilian Tax System
CONTRIBUTIONS
- Contribution for the Financing of Social Security - COFINS - Contribution to Social Integration Program and for Public Employee´s Asset Formation Program - PIS/PASEP Social Contribution on Net Profit of Enterprise – CSLL - Contribution for Intervention in the Economic Order - CIDE - Social Security Contribution on payroll (employee / employer) and self-employed
Union (Federal
Government) - Secretariat of
the Federal Revenue of Brazil
States and Federal District
- Contribution for Security of Public Employee
- Contribution for Security of Public Employee - Public Lighting Contribution
Municipalities (Local) and FD
Competence

Brazilian Tax System
MAIN TAX RATES
TAX TAX BASE RATEIRPJ Profit 15%/25%IPI Value Added 10% (Average)CSLL Profit 9%PIS/PASEP Value Added 1,65%COFINS Value Added 7,60%INSS Payroll 20%ICMS Value Added 9%, 17%, 25% and OthersISS Turnover 5%I.I. Imports (FOB Value) 14% (Average)CIDE Import/Prodution Value of Fue Ad Rem*
* Ad Rem: Specific rate per unit of product

Brazilian Tax System
PERSONAL INCOME TAX
Allowed Deductions
- Social Security : 9% to 11%; - Dependents : US$ 1.080 per dependent; - Instruction : up to US$ 1.690; - Health Care : Unlimited and; - Domestic Employee Social Contribution
Until 10.742 -From 10.742 to 16.099 7,5From 16.099 to 21.466 15From 21.466 to 26.822 22,5Over 26.822 27,5
Anual Net Income Tax Brackets (US$)
Tax Rates %

Brazilian Tax System
TAX BURDEN – 2011 R$ MILLION
TAX TAX COLLECTION PART. % ON GDP
UNION 1.024.710 24,73 - INCOME TAX 255.333 6,16
Personal Income Tax 20.438 0,49 Corporate Income Tax 94.797 2,29 Withholding (Personal and Corporate) 140.098 3,38
- IPI 41.207 0,99 - COFINS 164.814 3,98 - PIS/PASEP 42.840 1,03 - Contribution on payroll 246.031 5,94 - CSLL 58.594 1,41 - OTHERS 215.891 5,22
STATES 357.507 8,63 - ICMS 297.299 7,18 - OTHERS 60.208 1,45
MUNICIPALITIES 80.734 1,95 - ISS 38.516 0,93 - IPTU 19.334 0,47 - OTHERS 22.884 0,55
TOTAL 1.462.951 35,31
GDP 4.143.166

Brazilian Tax System
Union 70,04%
States
24,44%
Municipalities
5,52%
TAX BURDEN – 2011
Level of Government - % Participation

Brazilian Tax System
TAX BURDEN – 2011
18,40%
26,15%
3,52%
2,15% 1,22%
48,57% Social Security
Property
Consumption
Financial Operations Others Income Tax
Bases of Taxation R$ million % Tax Collection % GDP
Income Tax 278.321 19,02% 6,72%Social Security 376.849 25,76% 9,10%Property 54.143 3,70% 1,31%Consumption 720.098 49,22% 17,38%Financial Operations 32.027 2,19% 0,77%Others 1.461 0,10% 0,03%TOTAL 1.462.951 100,00% 35,31%

Brazilian Tax System
18,1% 20,9%
24,8% 26,0%
28,0% 28,1% 29,8% 31,3% 31,7% 32,4%
33,5% 33,9%
35,0% 36,3% 36,7% 37,6%
42,8% 42,9% 43,0% 43,8%
45,8% 48,2%
Mex
ico
Chi
le
USA
Turk
ey
Irel
and
Japa
n
Swis
s
New
Zea
land
Spai
n
Isra
el
Bra
zil
OC
DE
ave
rage
Uni
ted
Kin
gdom
Ger
man
y
Lux
embo
urg
Hun
gary
Nor
way
Fran
ce
Ital
y
Bel
gium
Swed
en
Den
mar
k
TAX BURDEN – 2010
Source: RFB and OECD. 1. Preliminary Data. Japan´s data refers to 2009. 2. Average of OECD countries listed on graph.
Brazilian Tax System
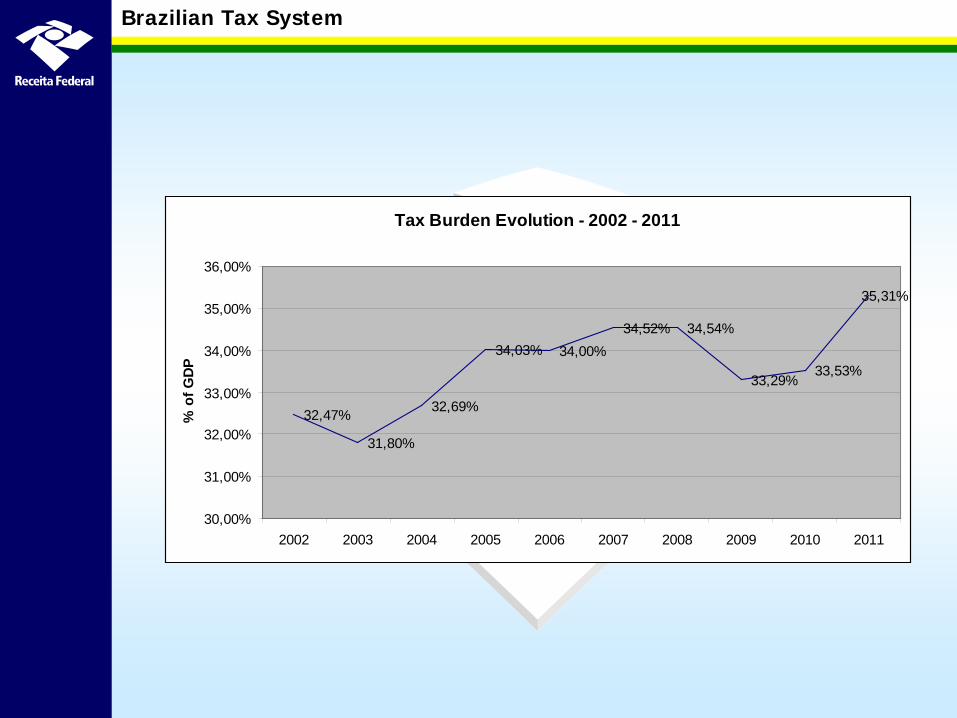
Tax Burden Evolution - 2002 - 2011
32,47%
31,80%
32,69%
34,03% 34,00%34,52% 34,54%
33,29%33,53%
35,31%
30,00%
31,00%
32,00%
33,00%
34,00%
35,00%
36,00%
2002 2003 2004 2005 2006 2007 2008 2009 2010 2011
% o
f GDP

Brazilian Tax System
States Municipalities
Region Development
Funds
Union
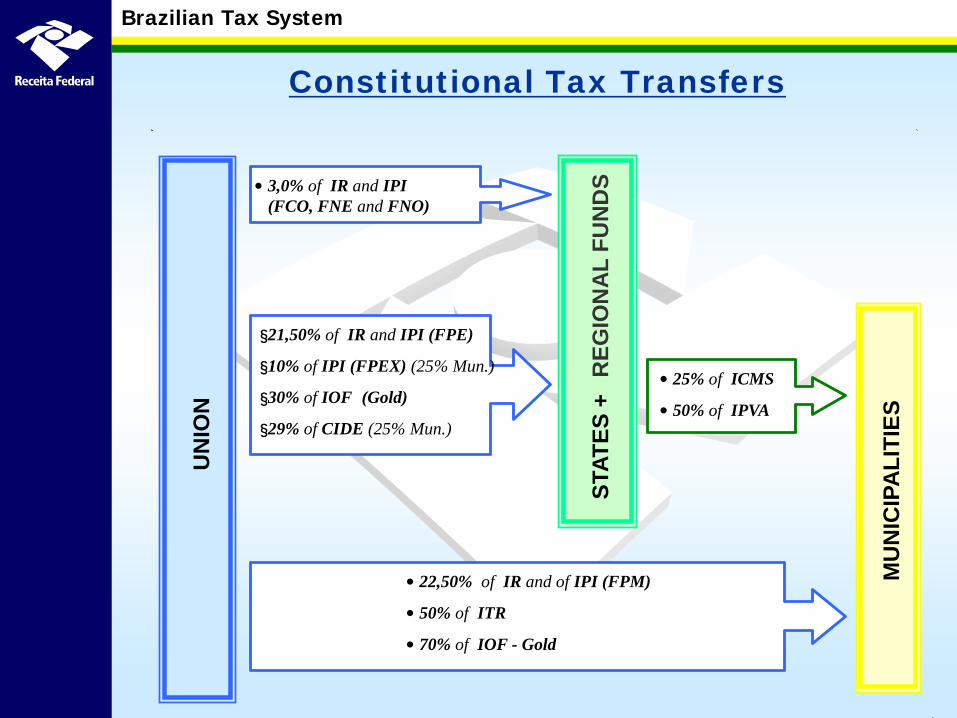
Constitutional Tax Transfers
IOF IR IPI ITR CIDE
NO 0,6
NE 1,8
CO 0,6
Gold
3,%
IPIex
CIDE
25%
25%
ICMS 25%
IPVA 50%
ISS
IPTU
ITBIv
Brazilian Tax System
UN
ION
STAT
ES +
R
EGIO
NA
L FU
ND
S
• 22,50% of IR and of IPI (FPM)
• 50% of ITR
• 70% of IOF - Gold
MU
NIC
IPA
LITI
ES
• 25% of ICMS
• 50% of IPVA
§ 21,50% of IR and IPI (FPE)
§ 10% of IPI (FPEX) (25% Mun.)
§ 30% of IOF (Gold)
§ 29% of CIDE (25% Mun.)
• 3,0% of IR and IPI (FCO, FNE and FNO)
Constitutional Tax Transfers

Brazilian Tax System
21,50%
22,50%
3,00%
53,00%
States
Municipalities
Regional Funds
Union
Income Tax
Income Tax 21,50% 22,50% 3,00% 47,00% 53,00%IPI 31,50% 22,50% 3,00% 57,00% 43,00%ITR - 50,00% - 50,00% 50,00%IOF-Gold 30,00% - - 30,00% 70,00%CIDE 29,00% - - 29,00% 71,00%
Remain with
UnionTotalUnion Taxes
Transfered States Municipalities Regional Funds
Constitutional Tax Transfers

Brazilian Tax System
31,50%
22,50% 3,00%
43,00%
States
Municipalities Regional Funds
Union
Tax on Manufactured Goods - IPI
Income Tax 21,50% 22,50% 3,00% 47,00% 53,00%IPI 31,50% 22,50% 3,00% 57,00% 43,00%ITR - 50,00% - 50,00% 50,00%IOF-Gold 30,00% - - 30,00% 70,00%CIDE 29,00% - - 29,00% 71,00%
Remain with
UnionTotalUnion Taxes
Transfered States Municipalities Regional Funds
Constitutional Tax Transfers

Brazilian Tax System
Tax on Property Land - ITR
50,00% 50,00% Municipalities Union
Income Tax 21,50% 22,50% 3,00% 47,00% 53,00%IPI 31,50% 22,50% 3,00% 57,00% 43,00%ITR - 50,00% - 50,00% 50,00%IOF-Gold 30,00% - - 30,00% 70,00%CIDE 29,00% - - 29,00% 71,00%
Remain with
UnionTotalUnion Taxes
Transfered States Municipalities Regional Funds
Constitutional Tax Transfers

Brazilian Tax System
Tax on Financial Operations/Gold – IOF-Gold
30,00%
70,00%
States
Union
Income Tax 21,50% 22,50% 3,00% 47,00% 53,00%IPI 31,50% 22,50% 3,00% 57,00% 43,00%ITR - 50,00% - 50,00% 50,00%IOF-Gold 30,00% - - 30,00% 70,00%CIDE 29,00% - - 29,00% 71,00%
Remain with
UnionTotalUnion Taxes
Transfered States Municipalities Regional Funds
Constitutional Tax Transfers

Brazilian Tax System
Contribution for Intervention in the Economic Order - CIDE
29,00%
71,00%
States
Union
Income Tax 21,50% 22,50% 3,00% 47,00% 53,00%IPI 31,50% 22,50% 3,00% 57,00% 43,00%ITR - 50,00% - 50,00% 50,00%IOF-Gold 30,00% - - 30,00% 70,00%CIDE 29,00% - - 29,00% 71,00%
Remain with
UnionTotalUnion Taxes
Transfered States Municipalities Regional Funds
Constitutional Tax Transfers

Brazilian Tax System
Tax Policy 2010- 2012
• Tax relief – Payroll – Consumer goods and credit – Capital goods
• Increased tariff protection

Brazilian Tax System
Tax relief
– Payroll
Economic activities 2011 2012 2013 2014Furniture, apparel, leather goods 74 974 1.067 1.067 Information Technology 80 1.058 1.159 1.159 Hospitality 1.790 5.221 5.534 Road transport of passenger, Air and maritime cargo and passenger transport 2.582 2.861 Building 1.900 3.157 Retail 1.273 2.116 Other transformation industries 2.290 2.539 Total 2.165 5.834 17.505 20.447 % of Social Security Contributions on the Payroll 0,9% 2,4% 7,1% 8,3%
Tax Relief - R$ million

Brazilian Tax System
Tax relief
– Capital goods Economic activities 2010 2011 2012 2013 2014Building material 723 1.597 1.865 2.538 2.028 Trucks 385 915 922 1.358 1.141 Others 390 1.047 985 1.090 1.199 Total 3.508 5.570 5.784 6.999 6.382 % of IPI 8,5% 13,5% 14,0% 17,0% 15,5%
Tax Relief - R$ million

Brazilian Tax System
Tax relief
– Consumer goods and credit
Economic activities 2010 2011 2012 2013 2014Furniture 288 431 1.219 255 255 Appliances ("white goods") 1.174 874 872 Cars 2.850 1.648 Others 223 38
Credit (IOC) 2.806 3.600 3.600 Total 288 431 5.466 2.815 1.127 % of IPI 0,7% 1,0% 13,3% 6,8% 2,7%% of IOC 8,8% 11,3% 11,3%
Tax Relief - R$ million

Brazilian Tax System
Tariff Protection
Tariff Level (% of imports) Commom Tariff Regime
5,98% 5,80%5,28%
5,58% 5,48% 5,65% 5,71%
6,58%7,00%
7,50% 7,64%
3,00%
4,00%
5,00%
6,00%
7,00%
8,00%
9,00%
2002 2003 2004 2005 2006 2007 2008 2009 2010 2011 2012
