brazilian sugarcane sector: recent developments and the ... · 23/02/2018 · brazilian sugarcane...
TRANSCRIPT

Brazilian Sugarcane Sector: Recent Developments and the Path Ahead
Leticia PhillipsRepresentative - North America
USDA’s 94th Annual Agriculultural Outlook Forum
Arlington, February 23, 2018

About UNICA
The Brazilian Sugarcane Industry Association (UNICA) is the leading sugarcane industry association in Brazil. Its more than 120 membercompanies, voluntarily engaged, represent over 50% of the ethanol and 60% of the sugar produced in Brazil.
Representing the sector with public entities in Brazil and abroad, establishing a constructive dialogue with stakeholders, monitoring(and influencing) legislation related to biofuels, sugar and bioelectricity, promoting the Brazilian ethanol image as a clean and renewableand sustainable energy abroad.
It has offices in four locations: São Paulo (headquarters), Brasília, Washington DC and Brussels
8 billion gallons2nd world largest producer:25% of production and 20%of world exports
15 million MWh4% of Brazilian electricity consumption
40 million tonsLargest producer and exporter in the world: 20% of global production and more than 40% of exports

Breakdown of Sugarcane’s Energy
Energy equivalent of 1 ton of sugarcane
= 1.2 oil barrel
Source: UNICA
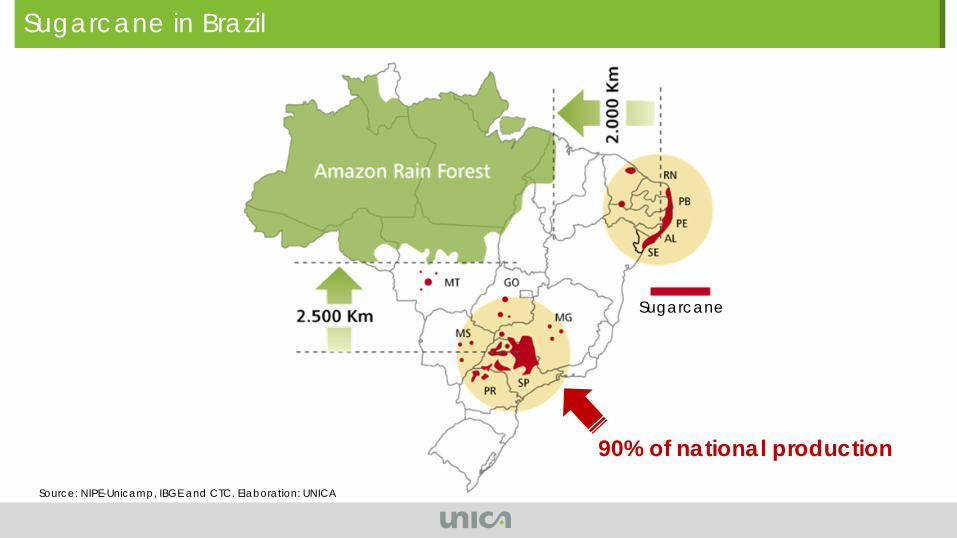
Exportação de açúcar pela região Centro-SulSugarcane in Brazil
Source: NIPE-Unicamp, IBGE and CTC. Elaboration: UNICA
90% of national production
Sugarcane

The Brazilian Sugar Market:
An overview
0
10
20
30
40
1989
/90
1990
/91
1991
/92
1992
/93
1993
/94
1994
/95
1995
/96
1996
/97
1997
/98
1998
/99
1999
/00
2000
/01
2001
/02
2002
/03
2003
/04
2004
/05
2005
/06
2006
/07
2007
/08
2008
/09
2009
/10
2010
/11
2011
/12
2012
/13
2013
/14
2014
/15
2015
/16
2016
/17
2017
/18
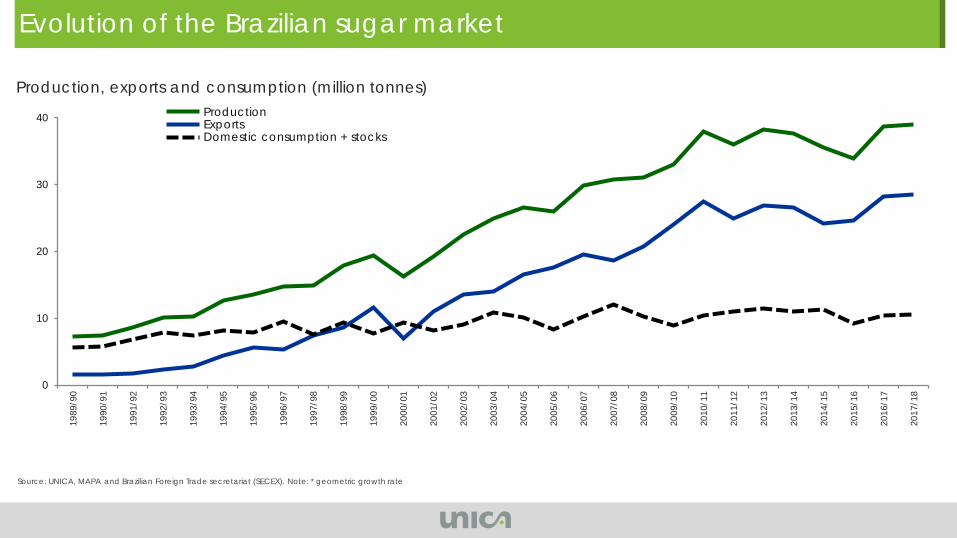
ProductionExportsDomestic consumption + stocks
Source: UNICA, MAPA and Brazilian Foreign Trade secretariat (SECEX). Note: * geometric growth rate
Production, exports and consumption (million tonnes)
Evolution of the Brazilian sugar market

0%
15%
30%
45%
60%19
59/1
960
1963
/196
4
1967
/196
8
1971
/197
2
1975
/197
6
1979
/198
0
1983
/198
4
1987
/198
8
1991
/199
2
1995
/199
6
1999
/200
0
2003
/200
4
2007
/200
8
2011
/201
2
2015
/201
6
Brazilian market-share in the world market

Source: LMC. Note: e – estimative; p-preliminary.
0
10
20
30
40
1997
1998
1999
2000
2001
2002
2003
2004
2005
2006
2007
2008
2009
2010
2011
2012
2013
2014
2015
2016
2017
Asia Africa America Europe Oceania
Brazilian participation into the world market
Brazil is one of the leaders of a world
market that includes:
• 100 producing countries
• 70 exporting countries
In 2017 Brazil exported sugar to 121
countries
Brazilian sugar exports by continents (million tonnes)
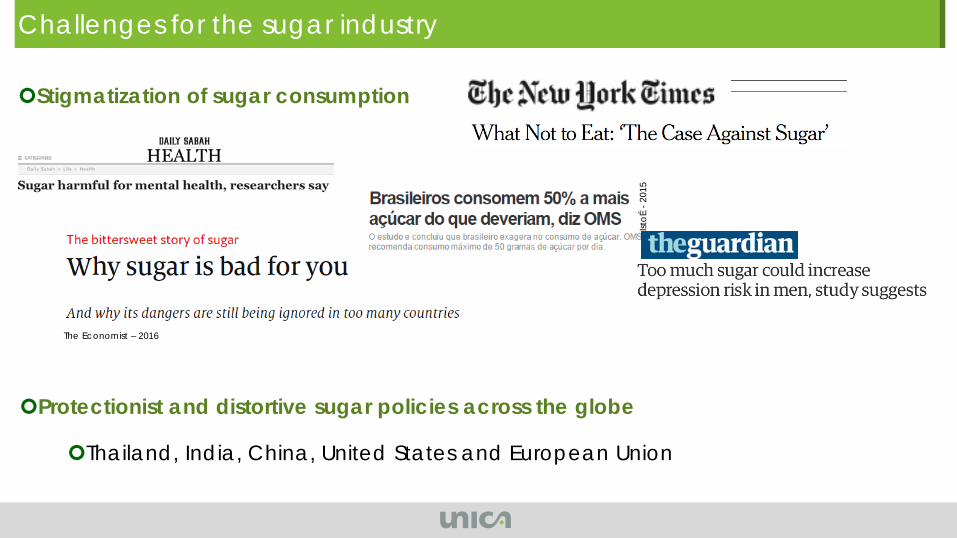
Challenges for the sugar industry
IstoÉ
-20
15
Stigmatization of sugar consumption
The Economist – 2016
Protectionist and distortive sugar policies across the globe
Thailand, India, China, United States and European Union

Região Centro-Sul: produtividade agrícola média na safraChallenges: Trade Issues
As of January 15th, 2018 the Thai government adopted a new regime, as a result of achallenge by Brazil. Brazilian government is analyzing the changes to ensure that it iscompliant with WTO rules
Brazil will defend its interest with respect to the safeguard measures promoted byChina - Brazil represented 60% of Chinese imports, Brazil the most affected country.
Continuous monitoring of potentially distortive public policies, by sugar producingcountries.
Brazil’s sugar quota in the US is smaller than DR’s
Quota established based on trade flows in the 80s
US sugar TRQ represents 0.5% of BR exports

The Brazilian Ethanol Market:
An overview

0
10
20
30
40
73/7
4
75/7
6
77/7
8
79/8
0
81/8
2
83/8
4
85/8
6
87/8
8
89/9
0
91/9
2
93/9
4
95/9
6
97/9
8
99/0
0
01/0
2
03/0
4
05/0
6
07/0
8
09/1
0
11/1
2
13/1
4
15/1
6
17/1
8
GOVERNMENT-DRIVEN
Elaborated by UNICA with data from MAPA and UNICA
19731st oil price shock
1975Proálcool LaunchHigh governmental intervention
Late 80’sReversion in oil priceDeregulation of the sector
2003Flex Fuel Vehicles were launched
MARKET-DRIVEN
The evolution of ethanol production in Brazil
Brazilian ethanol production (billion liters)
2,000
3,000
4,000
5,000
6,000
7,000
1976
1980
1984
1988
1992
1996
2000
2004
2008
2012
2016
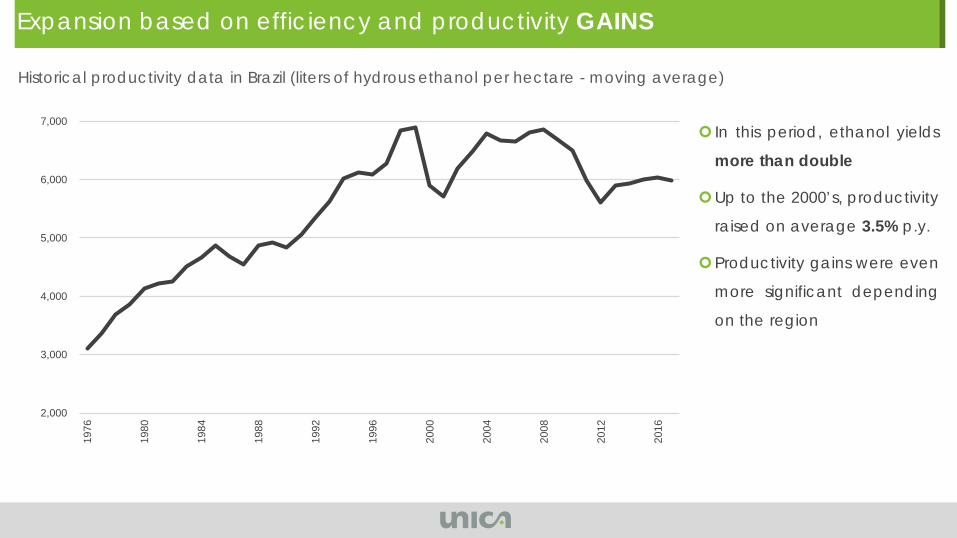
Historical productivity data in Brazil (liters of hydrous ethanol per hectare - moving average)
Expansion based on efficiency and productivity GAINS
In this period, ethanol yields
more than double
Up to the 2000’s, productivity
raised on average 3.5% p.y.
Productivity gains were even
more significant depending
on the region

With the RIGHT INCENTIVES, from both public policies and from the market, the
sugarcane sector responded POSITIVELY and TIMELY
Flex Fuel technology
Federal tax differential between fossil and renewable fuels
Reduction of VAT over hydrous ethanol
Rising oil prices
Competitive production costs
Global interest on biofuels and emission reduction alternatives
How did we get there?
What lays ahead?

2018/2019 Harvest
• UNICA still analyzing data to do a forecast
•Harvest update will be published in April, coinciding with the beginning of our harvest
•What we know so far?
•Harvest will favor ethanol production
•Sugar production will likely decrease

Recent Policy Changes

Trade Policy - Ethanol Tariff Rate Quota
• China and EU closed their markets to the US ethanol making Brazil the only market available to receive excess ethanol supplies
• US exported 660 MG to Brazil in 2017, three times more than 2016 exports (220MG) and five-times more than 2015 exports (135MG)
• UNICA acted to moderate the positions in the industry and produce a fair compromise -maintaining ethanol in MERCOSUR’s exception list
• August 2017 Brazilian government approved an import tariff of 20% on any import volume exceeding 158.5MG/year - quota is average annual import volume from 2014 - 2016
• Brazil’s TRQ represents about 16% of US ethanol exports.
• Tariff is valid for 2 years, starting September 2017. Temporary solution to what we hope is a temporary problem
• In Brazil sugar and ethanol are the same industry - NE producers are the most affected by lack of access to larger sugar quotas in markets like US and by imports of ethanol!

RenovaBio
Program promoted by the Department of Biofuels (DBIO)
of the Ministry of Mines and Energy (MME)
Highly important initiative to ensure emissions reduction
through the sustainable expansion of biofuels supply in
the country, guaranteeing the fulfillment of the
commitments signed in the Paris Climate Agreement and
increasing the guarantee of supply
43% reduction of GHG emissions by 2030 when
compared to 2005 levels

Mandate to reduce emissions
Today 2030
g CO2eq/MJ
Maximum level of GHG EMISSION BY ENERGY UNIT commercialized in
the form of fuels for the Brazilian fleet“x” grams of CO2eq. per
MegajouleGuarantee of supply
and in a sustainable manner
Establishment of PERIODIC DECARBONIZATION TARGETS for the fuel
sector
PREVISIBILITYand CLEAR RULES
Vital to promote INVESTIMENTS in the production and for development of other
government programs
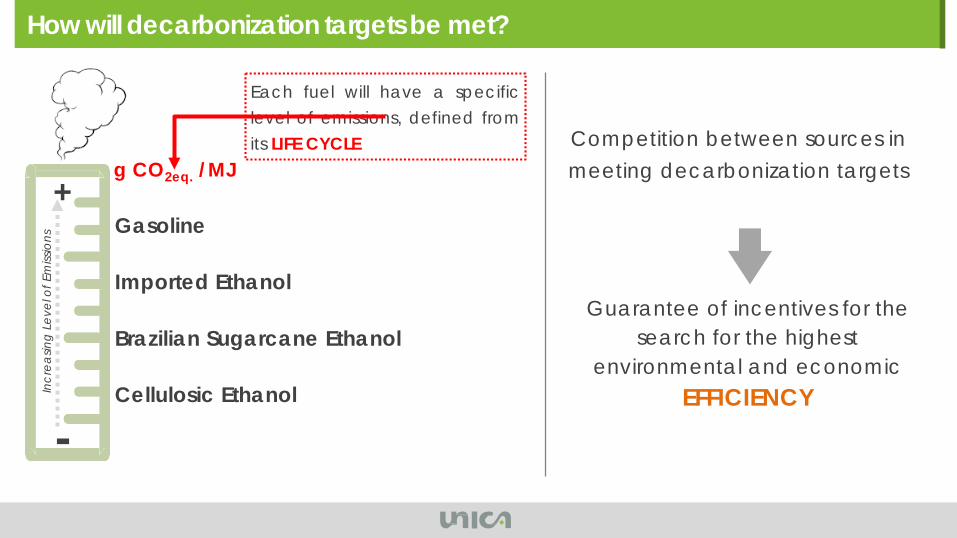
How will decarbonization targets be met?
Each fuel will have a specificlevel of emissions, defined fromits LIFE CYCLE
Gasoline
Imported Ethanol
Brazilian Sugarcane Ethanol
Cellulosic Ethanol
Guarantee of incentives for the search for the highest
environmental and economic EFFICIENCY
g CO2eq. /MJCompetition between sources in meeting decarbonization targets
+
-
Incr
easin
g Le
vel o
f Em
issio
ns

How the RenovaBio works
Producer
Trade of CBio via Stock Exchange
Distributor Fueling Stations Consumer
Ethanol Gallons Ethanol Gallons Ethanol Gallons
MarketEmmission of Cbio 1 Cbio = reduction 1 t CO2eq
Acquisition of CBio
Individual TargetgCO2eq/MJ converted into the number of Cbios to be
acquired per unit of fossil fuel sold
Brazil’s Decarbonization
Target (gCO2eq/MJ)

� Next Steps
� Up to 6 months after sanction (June 2018): definition of targets
� 18 months after definition of targets: regulatory completion
� Effective from the beginning of 2020
Next Steps
