brayton cycle baseload power tower csp system · 1 “brayton cycle baseload power tower csp system...
TRANSCRIPT
1
“Brayton Cycle Baseload Power Tower CSP System”
Bruce N. Anderson, CEO
Wilson Solarpower Corporation 617-290-9913
DOE SunShot Program Review April 23, 2013
Project Start Date: September 1, 2010
Potential for 5, not just 4, approaches to CSP:
1. Troughs 2. Central power towers 3. Linear fresnel 4. Dishes 5. And now modular Brayton towers with dry storage
Presenting: Bruce N. Anderson, CEO & Chairman
• Began solar career in 1973 with Masters degree at MIT • 1980 Advisory Board Member of NREL (then SERI – Solar Energy Research
Institute) • 1982 First recipient “Lifetime Achievement Award,” American Solar Energy Society • Twice testified to US Congress on energy matters • 35-year career CEO
PI: Bill Treece, Vice President Engineering
• 45-year veteran of microturbine and related technology development & project management
• SVP, Capstone Turbine, Strategic Technology (2003-2009); SVP, Engineering (2001-2003)
• Director, Sundstrand Turbomach’s APU Division • Solar Turbines, Gas Turbine Product Engineering Manager • Holds seven U.S. patents, four patents pending in gas turbines and four in CSP
P roject Leadership

Concept and Project Phase 1 results Phase 2 SOPO Zero pressure solar receiver Thermal energy storage High-temperature heat exchanger
Path forward
3
P resentation Outline
4
Thank you to our team members
• German Aerospace Center (DLR)
• Saint-Gobain
• Brayton Energy
• WorleyParsons
• Solaflect Energy
• EZKlein
• Oak Ridge National Laboratory
• Sandia National Laboratory
• US Department of Energy funding (of course!)
Including both Phase 1 and Phase 2
Project Team Members
5
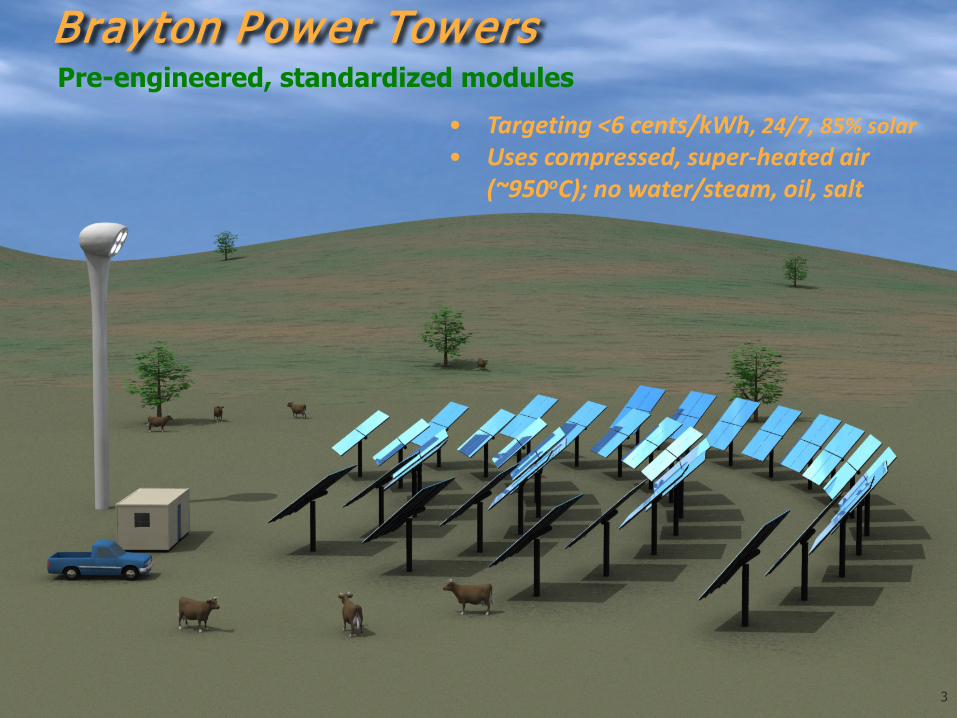
Brayton Power Towers
3
Pre-engineered, standardized modules
• Targeting <6 cents/kWh, 24/7, 85% solar • Uses compressed, super-heated air
(~950oC); no water/steam, oil, salt
6
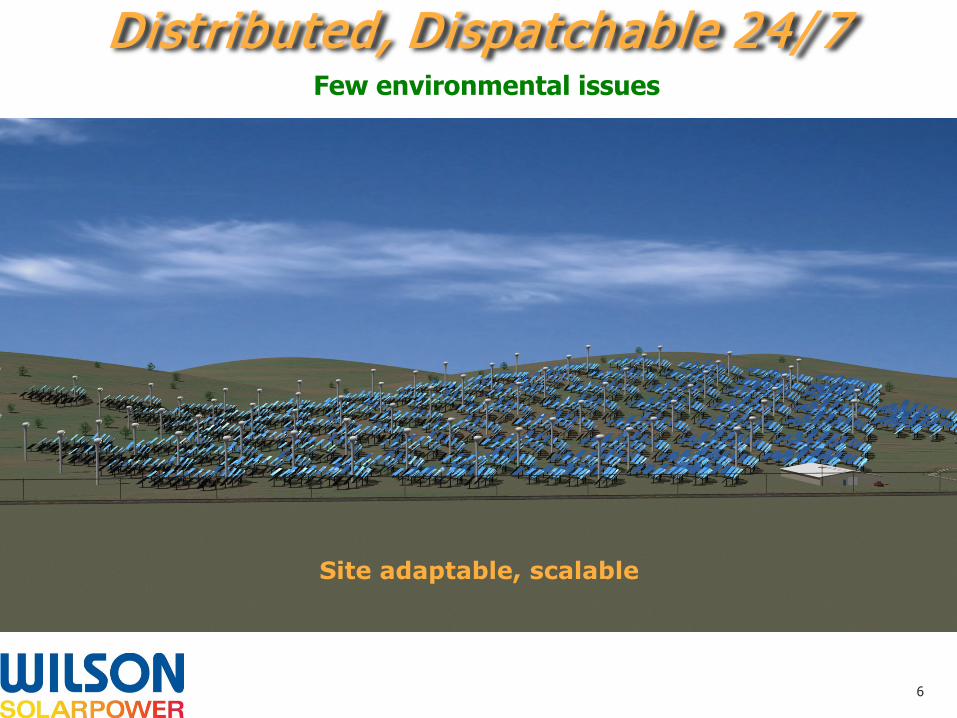
Distributed, Dispatchable 24/ 7
Site adaptable, scalable
Few environmental issues
7
PHASE 1 through August 2011 Identify a utility-scale Brayton-cycle baseload power tower system with a
>75% capacity factor, >85% solar fraction, and LCOE of <9 ¢/kWh.
PHASE 2 through mid 2013 Develop, build, test, and evaluate an innovative solar receiver and engineer
a dry thermal storage system.
PHASE 3 through mid 2015 Engineer, build, test, and evaluate a single baseload 300-kWe power plant
module.
Project Objectives Baseload CSP competitive with conventional power
8
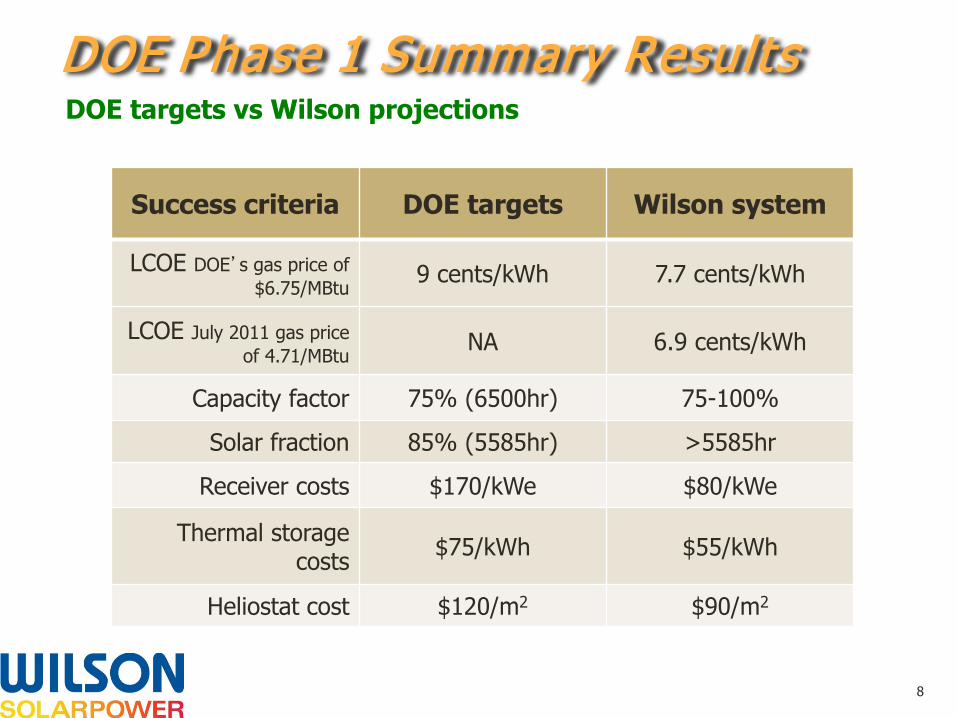
Success criteria DOE targets Wilson system
LCOE DOE’s gas price of $6.75/MBtu
9 cents/kWh 7.7 cents/kWh
LCOE July 2011 gas price of 4.71/MBtu
NA 6.9 cents/kWh
Capacity factor 75% (6500hr) 75-100%
Solar fraction 85% (5585hr) >5585hr
Receiver costs $170/kWe $80/kWe
Thermal storage costs $75/kWh $55/kWh
Heliostat cost $120/m2 $90/m2
DOE Phase 1 Summary Results DOE targets vs Wilson projections
9
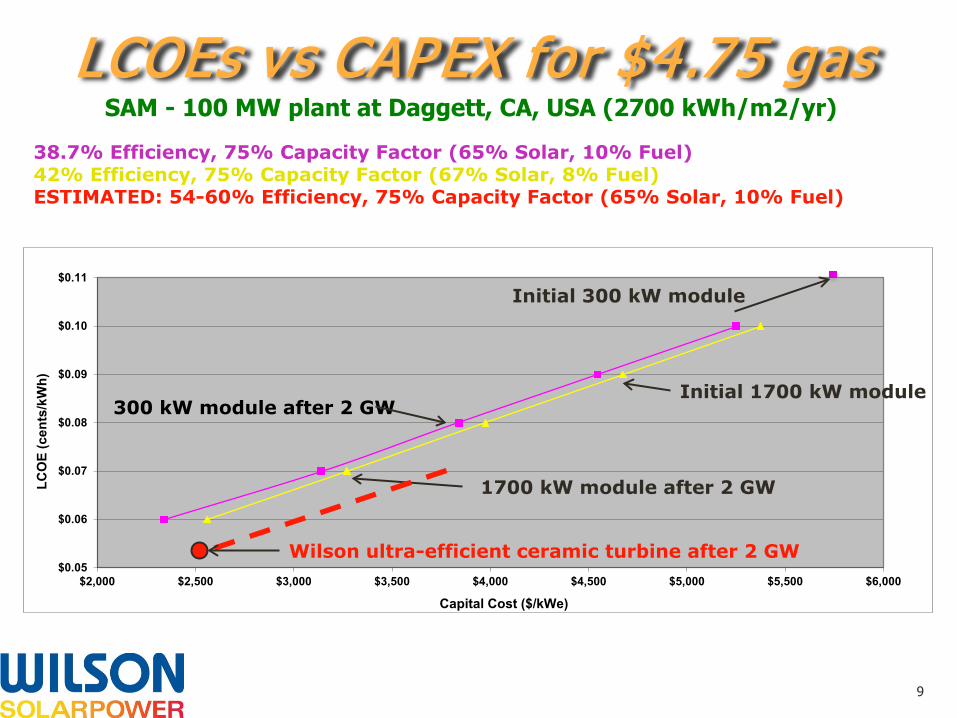
LCOEs vs CAPEX for $4.75 gas 38.7% Efficiency, 75% Capacity Factor (65% Solar, 10% Fuel) 42% Efficiency, 75% Capacity Factor (67% Solar, 8% Fuel) ESTIMATED: 54-60% Efficiency, 75% Capacity Factor (65% Solar, 10% Fuel)
$0.05
$0.06
$0.07
$0.08
$0.09
$0.10
$0.11
$2,000 $2,500 $3,000 $3,500 $4,000 $4,500 $5,000 $5,500 $6,000
LCO
E (c
ents
/kW
h)
Capital Cost ($/kWe)
300 kW module after 2 GW
Initial 300 kW module
Initial 1700 kW module
1700 kW module after 2 GW
Wilson ultra-efficient ceramic turbine after 2 GW
SAM - 100 MW plant at Daggett, CA, USA (2700 kWh/m2/yr)
10
Compressor Turbine
Booster combustor
Thermal storage
Low tempRecuperator
Valve 1
Air intake
To stack
Blow
er
ṁ1
ṁ1 +ṁ2
ṁ1
High tempRecuperator
ṁ1
ṁ1
ṁ2
ṁ1
ṁ1
ṁ1 +ṁ2
Low pressureSolar
receiver
Valve 2
ṁ2
Valve 3
ṁ1
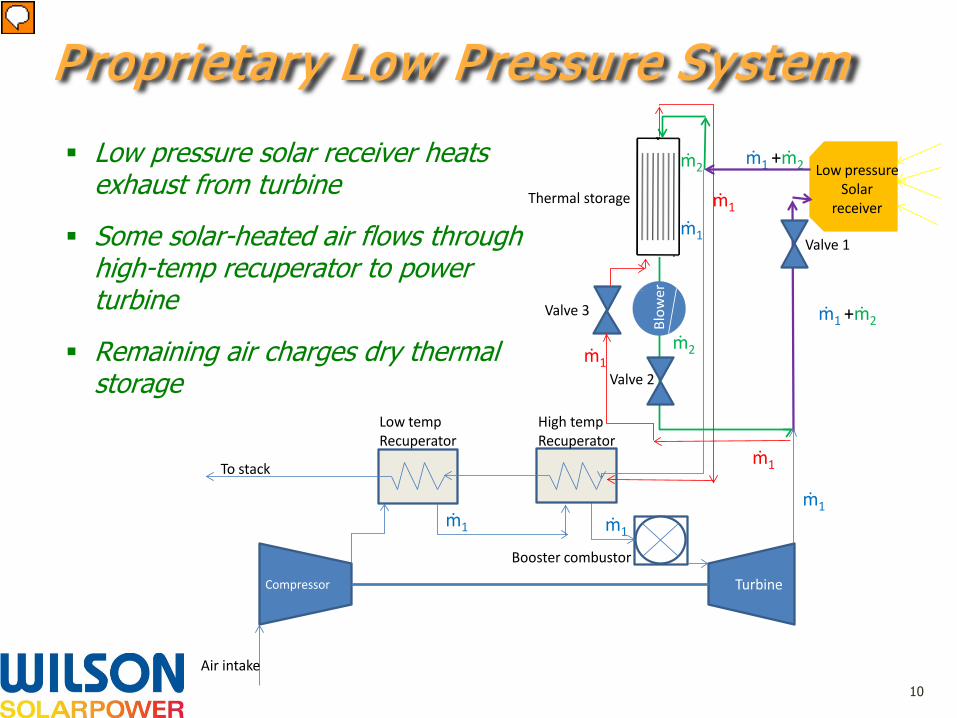
Low pressure solar receiver heats exhaust from turbine
Some solar-heated air flows through high-temp recuperator to power turbine
Remaining air charges dry thermal storage
Proprietary Low Pressure System
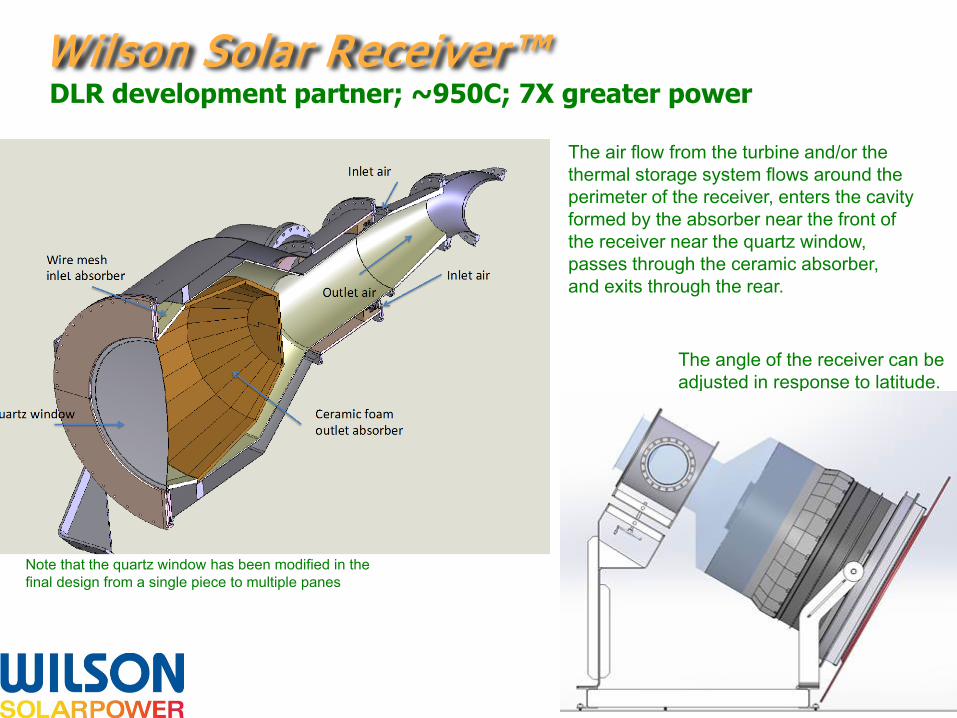
Wilson Solar Receiver™
11
The air flow from the turbine and/or the thermal storage system flows around the perimeter of the receiver, enters the cavity formed by the absorber near the front of the receiver near the quartz window, passes through the ceramic absorber, and exits through the rear.
The angle of the receiver can be adjusted in response to latitude.
Note that the quartz window has been modified in the final design from a single piece to multiple panes
DLR development partner; ~950C; 7X greater power
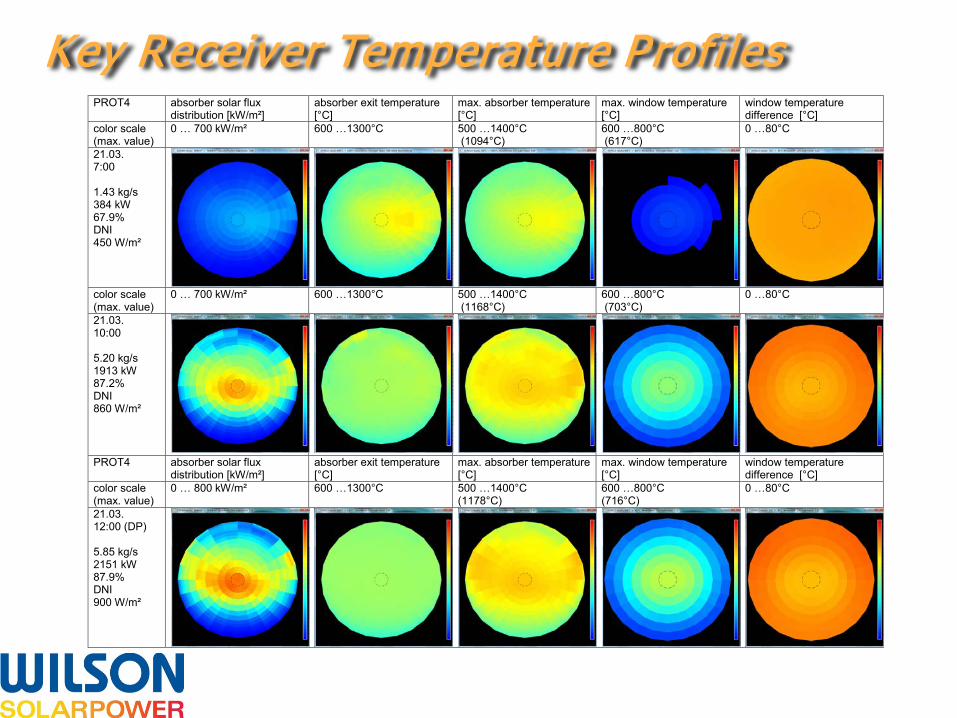
PROT4 absorber solar flux distribution [kW/m²]
absorber exit temperature [°C]
max. absorber temperature [°C]
max. window temperature [°C]
window temperature difference [°C]
color scale (max. value)
0 … 700 kW/m² 600 …1300°C 500 …1400°C (1094°C)
600 …800°C (617°C)
0 …80°C
21.03. 7:00 1.43 kg/s 384 kW 67.9% DNI 450 W/m²
color scale (max. value)
0 … 700 kW/m² 600 …1300°C 500 …1400°C (1168°C)
600 …800°C (703°C)
0 …80°C
21.03. 10:00 5.20 kg/s 1913 kW 87.2% DNI 860 W/m²
PROT4 absorber solar flux
distribution [kW/m²] absorber exit temperature [°C]
max. absorber temperature [°C]
max. window temperature [°C]
window temperature difference [°C]
color scale (max. value)
0 … 800 kW/m² 600 …1300°C 500 …1400°C (1178°C)
600 …800°C (716°C)
0 …80°C
21.03. 12:00 (DP) 5.85 kg/s 2151 kW 87.9% DNI 900 W/m²
Key Receiver Temperature Profiles
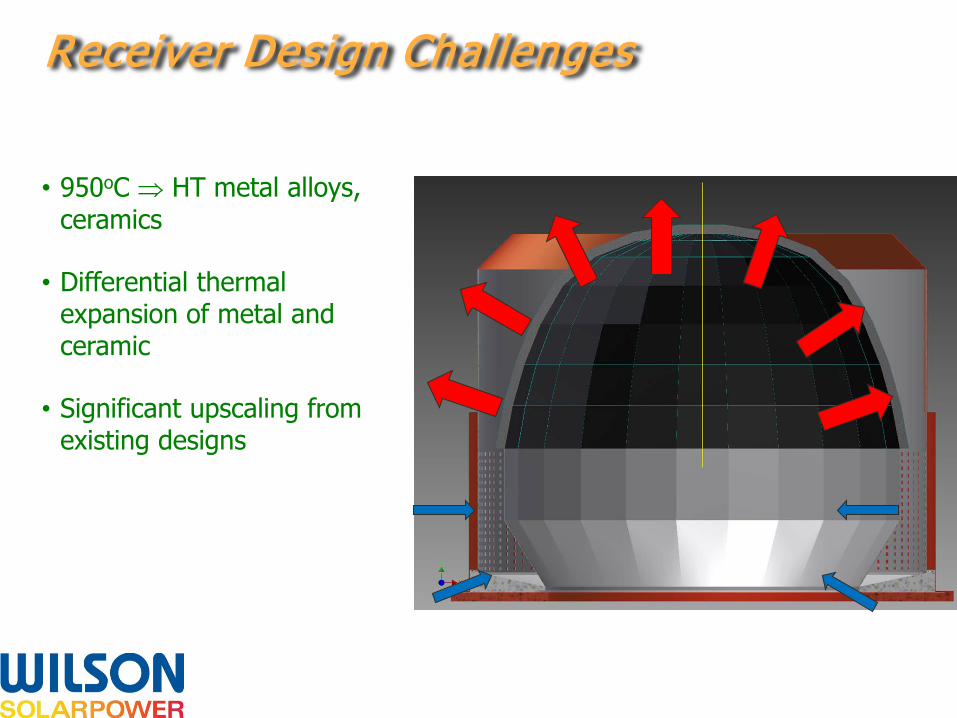
• 950oC ⇒ HT metal alloys, ceramics
• Differential thermal expansion of metal and ceramic
• Significant upscaling from existing designs
Receiver Design Challenges

14
P roprietary Zero Pressure System
Add small blower at system exhaust
Near-zero receiver pressure

Whole Absorber Assembly

Efficiencies up to 88%
Low pressure drop
Mass flow regulation significantly improves temperature distribution
Absorber temperatures acceptable
Window temperatures acceptable
Flux distribution varies with sun position
Zero Pressure Solar Receiver Performance summary

Cold test
Hot test on Sandia power tower
Begin life test as part of full 300-kWe pilot power plant module
Zero Pressure Solar Receiver Next Steps
18
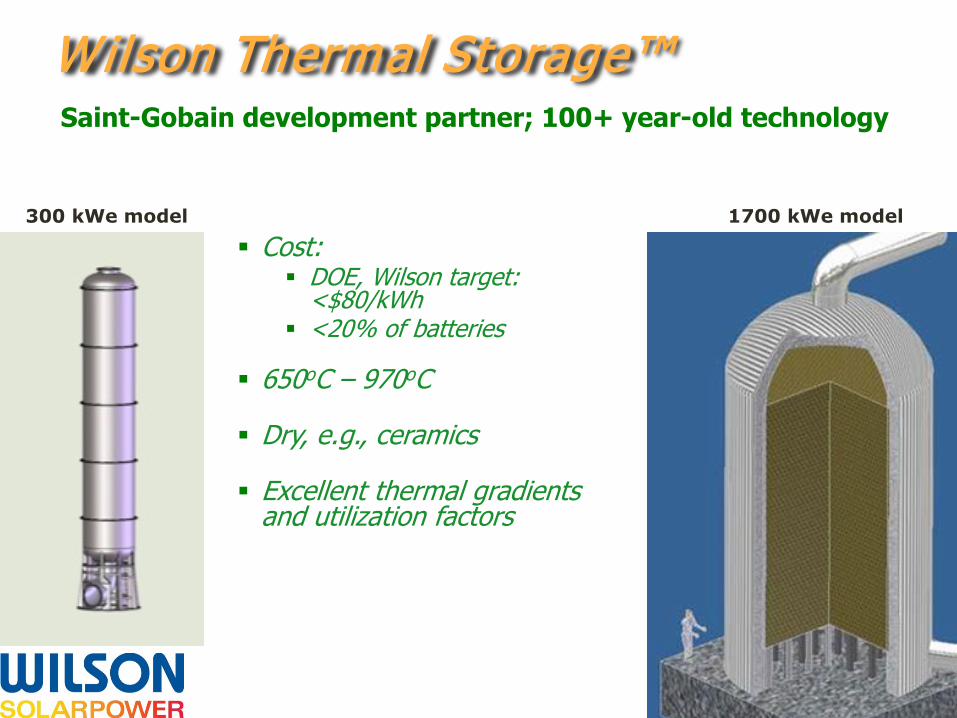
W ilson Thermal Storage™ Saint-Gobain development partner; 100+ year-old technology
Cost: DOE, Wilson target:
<$80/kWh <20% of batteries
650oC – 970oC
Dry, e.g., ceramics
Excellent thermal gradients and utilization factors
300 kWe model 1700 kWe model
19
Pressure drop/parasitic losses
Interior insulation
Storage media support grate
Principal Thermal Storage Issue Areas

Charge and Discharge Operation

21
Charge Mode Typical Thermal Profile Evolution during 9.0 hrs of sun
The receiver-heated air flows from left (tank top) to right (tank bottom). Variable speed flow enables near-constant inlet temperatures. In this analysis, the outlet temperature is allowed to rise to as high as 750C.
22
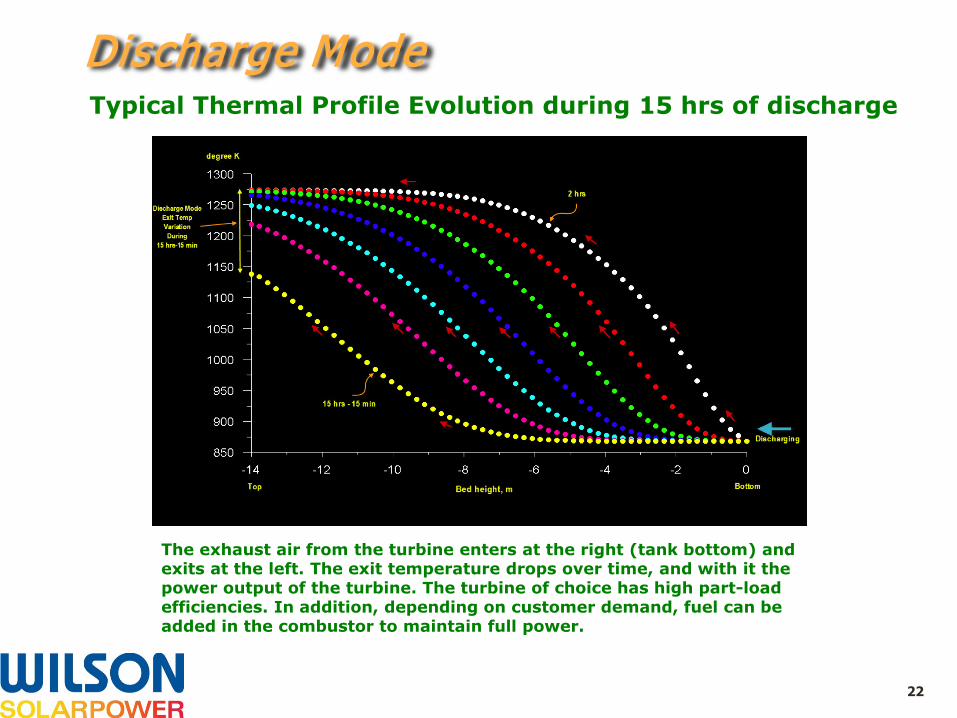
Discharge Mode Typical Thermal Profile Evolution during 15 hrs of discharge
The exhaust air from the turbine enters at the right (tank bottom) and exits at the left. The exit temperature drops over time, and with it the power output of the turbine. The turbine of choice has high part-load efficiencies. In addition, depending on customer demand, fuel can be added in the combustor to maintain full power.
23
Optimize between 10ft and 12ft systems for lowest LCOE
Finalize the engineering of the system that yields the lowest LCOE.
Prepare drawings, price, select suppliers, issue POs
Build and test as part of a full 300-kWe pilot power plant module
Thermal Energy Storage System Next steps
• Testing by Dr. Bruce Pint, ORNL
• Test Haynes 214 alloy
• Test 2 mil, 4 mil, 5 mil, 6 mil and 10 mil thicknesses
• Test up to 8000 hours: 9 hours hot, 1 hour cold, 800 cycles
• Test specimens at 950C, 1000C, and 1050C
High Temperature Heat Exchanger Testing program
• No samples of any thickness successfully cycled at 1050C
• Most foil thicknesses survive nicely at 950C
• 5 mil and especially 6 mil thickness are best performing thicknesses at 1000C
High Temperature Heat Exchanger Principal test results

26
Test results at 950oC
High Temperature Heat Exchanger
27
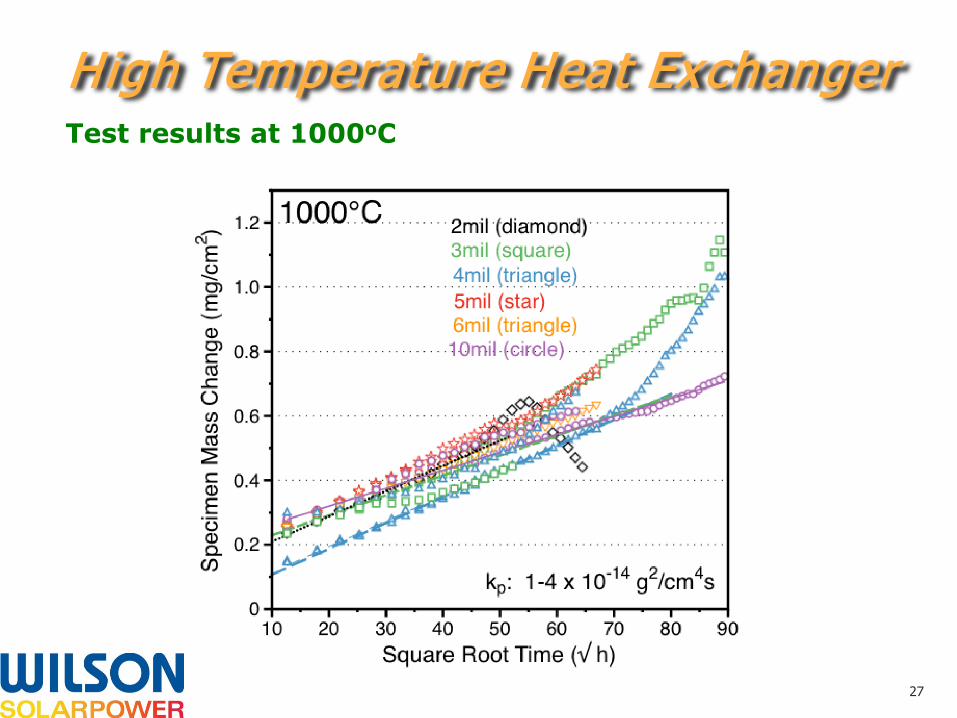
Test results at 1000oC
High Temperature Heat Exchanger
28
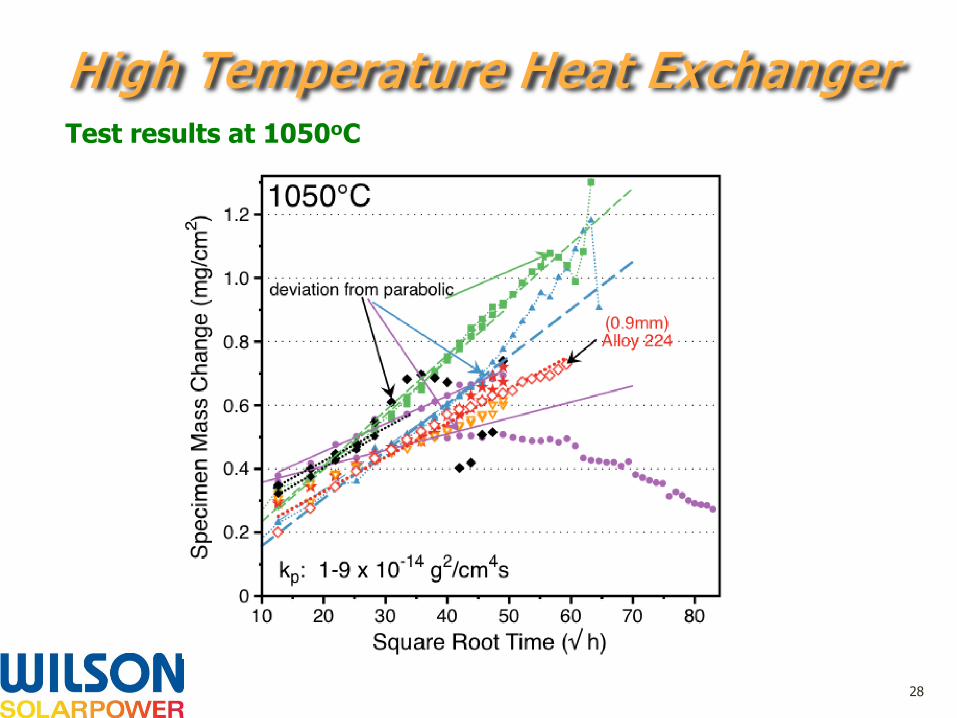
Test results at 1050oC
High Temperature Heat Exchanger
29
Based on initial lifetime modeling using actual test results:
6 mil HR214 foil “optimistically can make 100,000h operating at 975°C.” - Bruce Pint, ORNL
Major takeaway of the testing results
High Temperature Heat Exchanger
• Measure the remaining Al content in the specimens for the life prediction. This requires metallography and microprobe.
• Secure a supplier and fabricate/test prototype heat exchanger
• Begin life test as part of full 300-kWe pilot power plant module
High Temperature Heat Exchanger Next Steps
31
• Essential next step: engineer, deploy and test full 300-kWe pilot power plant module with storage
• Parallel continued developments for higher efficiency, lower cost Brayton CSP: • Smaller, lighter weight storage at ~950oC and hotter • Wilson’s ultra-efficient ceramic microturbine (~50% efficiency) • Low cost, narrow focus heliostats • Particle receivers • Super-critical CO2 • Low emissivity coatings for absorber • Low reflectivity coatings for window
Path Forward for Brayton CSP
32
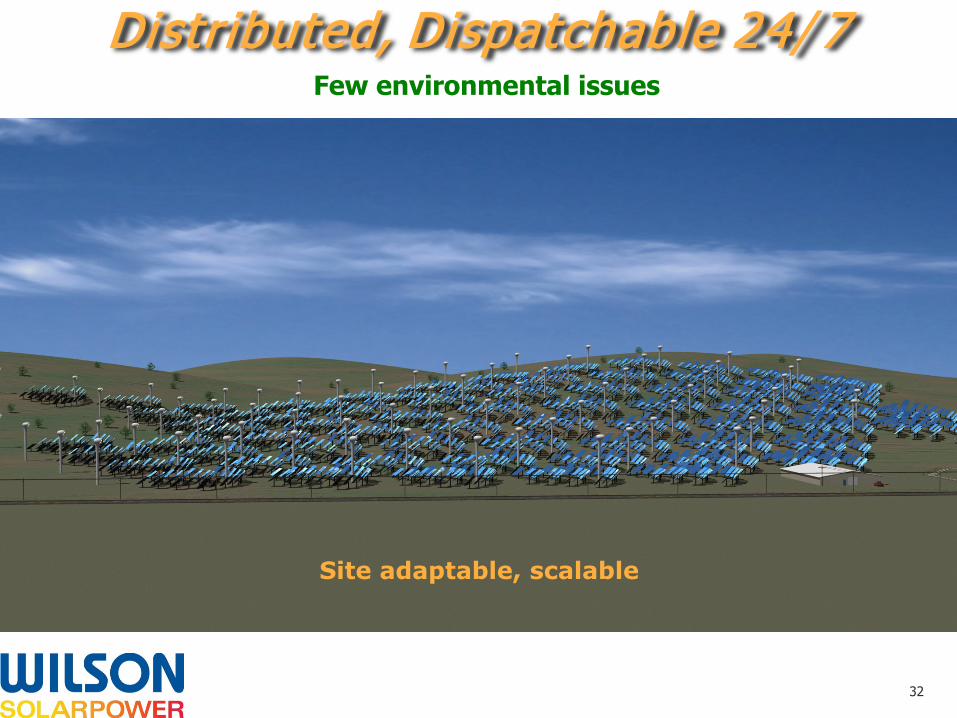
Distributed, Dispatchable 24/ 7
Site adaptable, scalable
Few environmental issues
33
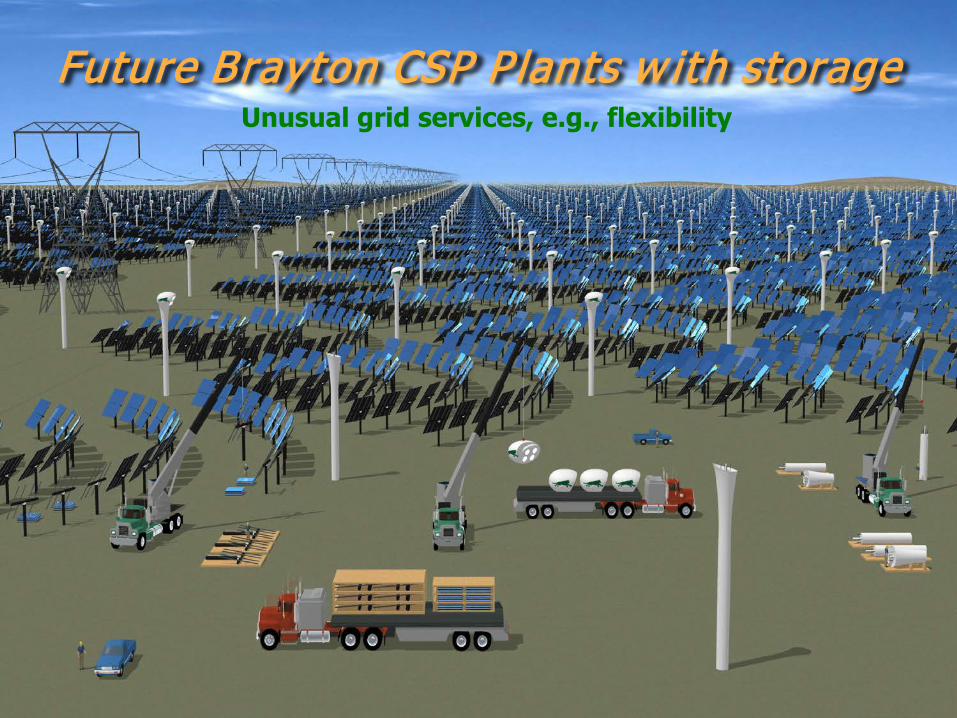
Future Brayton CSP Plants w ith storage Unusual grid services, e.g., flexibility