brand equity development in college football - · pdf filebrand equity development in college...
TRANSCRIPT
1
Brand Equity Development in College Football
While the marketing literature contains a substantial body of research focused on the benefits of
strong brands, there is less research focused on the processes by which strong brands are created.
In this research, the authors focus on the development of brand equity in the realm of college
football. This non-traditional branding application provides an opportunity to study brand
equity formation because data is available both on performance and consumer demand over time.
College football is also of interest because of its cultural importance, and because organizational
elements such as conference affiliations and the Bowl Championship Series may influence
schools’ brand building investments. The authors investigate the influence of brand equity and
customer base on investments in college football programs using a structural dynamic
programming model. It is found that brand equity is primarily created through participation in
BCS bowls. Notably, the authors find that after controlling for level of investment, small
conference schools actually have preferred access to major bowl games.
2
How the Bowl Championship Series Influences Brand Development and Investment
Decisions
1. Introduction
Major college football is a business that inspires both fanatical passion among fans and
significant controversy. In 2010, attendance at Football Bowl Subdivision (FBS) games
exceeded 37 million, and over 100 million Americans identified themselves as college football
fans (Rovell 2011). However, college football and the Bowl Championship Series (BCS) have
also been a frequent source of controversy.1 Academics (Zimbalist 2009), journalists, and
politicians have all attacked the BCS system. The BCS has been criticized as unfair to teams
who are not members of the major or Automatic Qualifying (AQ) conferences, and on the
grounds that the system harms consumers. Over the period from 2003 to 2009, congressional
hearings focused on the BCS system were held by committees such as the Senate Judiciary
Committee on Anti-trust, Competition Policy and Consumer Rights (2005) and the House
Energy and Commerce Subcommittee on Commerce, Trade and Consumer Protection (2009).
The legal arguments advanced in opposition to the BCS system claimed that the BCS acts as a
cartel that limits the ability of non-automatic qualifying (Non-AQ) conference schools to
compete by limiting access to high profile bowl slots (Grow 2011) and harms consumer welfare
by restricting output (Zimbalist 2009).
While the legal arguments lodged against the BCS have been framed in terms of anti-
trust, the arguments do not explicitly consider key underlying marketing issues. For example,
the complaints that the BCS system is anti-competitive, due to the asymmetric bowl selection
process, may be inadequate because they fail to explicitly consider significant branding issues.
1 The BCS system was used for the final time in 2013. A 4 team playoff system is scheduled for the 2014 season.

3
The fundamental branding questions relate to the processes by which brand equity is created and
the value provided by a strong brand. Critics claim that the BCS system provides greater access
to major bowl games to schools from historically-stronger conferences. In other words, the BCS
provides greater access to prestigious bowl games to schools with well established brands. This
is, however, appropriately considered as a dynamic branding issue if schools’ brands are largely
built through on field success and participation in high profile bowl games. If this is the case, the
manner in which the BCS regulates access to these games has implications for both current
season results and also for school’s opportunities to develop strong brands.2
The consumer protection issues are grounded in the notion that fans are harmed because
the BCS creates a price structure that is unresponsive to consumer demand and fails to maximize
consumer welfare. The crux of this argument is that by limiting competition the BCS system
restricts output and harms consumers. However, the issue of consumer welfare is complicated
by the strength of established college football brands and the arbitrary and extreme nature of fan
loyalty. Unlike most categories, fandom or brand loyalty is often based on considerations such
as geographical locations (e.g., where individuals live or went to college) rather than traditional
brand characteristics. Despite the relatively large number of schools that are in AQ conferences,
arguments have been made that consumer protection acts are violated because relatively less
popular teams (brands) do not have equal access to the BCS games. This type of complaint
implicitly assumes that consumer preferences (fan loyalty) are largely fixed and that the BCS
system needs to be adjusted in order to improve consumer welfare. However, these arguments
fail to fully consider the nature of consumer loyalty and preference in college football. For
instance, these arguments do not consider the possibility that overall fan interest in college
2 Brand equity may also be built through other means such as advertising campaigns or even high profile uniform
changes (eg Oregon and Maryland).
4
football is driven by the brand equity of already established teams and that fans prefer matchups
between high brand equity teams. In this case, the asymmetric structure of the BCS selection
process might plausibly have a positive impact on consumer demand.
In sum, the complaints and controversies surrounding the BCS are at heart related to the
dynamics of brand development and the structure of consumer preferences. In order to evaluate
the claim that the BCS harms the ability of Non-AQ schools to compete, it is necessary to show
that the BCS both unjustifiably limits access to high profile bowl games and that participation in
these games creates brand equity. Existing analyses of the BCS have used anecdotal results,
such as Boise State’s and TCU’s victories in BCS bowl games, to critique the current system.
The small sample size used in these analyses and the plausible counter-explanation that these
results are non-diagnostic as playing in these non-championship games can be a letdown for the
AQ schools, limits the utility of these studies. Our conjecture is that an analysis of the
discriminatory effects of the BCS system should be based on a systematic analysis of how
schools vary their decisions based on their respective, unique circumstances.
Our primary goal is to increase our understanding of how the BCS system influences the
dynamics of spending or investment behavior of schools that vary in their current fan base and
historical success. These are fundamentally marketing issues as the fan base relates to market
potential and customer loyalty, and historical successes relate to brand equity. We devote
particular attention to the process by which brand equity is created over time. This is a salient
aspect of the analysis since the sports entertainment context allows for the observation of
investments, objective measures of quality and consumer demand. In particular, our study
examines the process whereby investments in product lead to quality that contributes to brand
equity. We investigate aspects of brand equity creation and measurement, using two methods.
5
In the first method, we relate historical successes to each football program’s revenues in order to
determine which types of events create equity. In the second approach, we infer the value of
brand equity based on schools’ dynamic investment patterns. This approach places a joint
emphasis on the trade-off between short-term expenses and revenues, and long-term
development of marketing assets such as brand equity and customer loyalty. The analysis
employs a structural dynamic programming model of school’s investment decisions where
investments are moderated by environmental and historical factors such as market potential and
past success.
The paper is structured as follows: We begin with a review of literature related to the key
business and marketing concepts that motivate our analysis. Next, we discuss the context for our
study and provide a description of the available data. We then present several correlation-based
analyses that highlight the relationships between past achievements and current team
performance. We then present an analysis that estimates the brand equity of specific schools,
using a revenue premium based approach. As part of this analysis we demonstrate that brand
equity is largely a function of past participation in major bowl games. Finally, we develop a
structural dynamic programming model of schools’ investment decisions. The results from this
model reveal how differences in institutional history and access to brand building opportunities
influence investment. We use the structural model to conduct policy experiments that illustrate
the impact of BCS restrictions on different types of schools’ investment strategies. The paper
concludes with a summary of key findings, limitations and opportunities for future research.
2. Background
Our research begins from the premise that the structure of the FBS division of college football
6
has an asymmetric impact on the ability of different teams to compete and develop brand equity.
We therefore begin with a brief review of literature related to brand equity. Next, because the
BCS essentially provides rules by which teams compete and interact with each other, we
consider research on asymmetric alliances. Within this sub-section we also consider literature
focused on the topic of tournament design. The review is designed to provide a conceptual
foundation for our research and to motivate several research questions that we address through a
combination of descriptive statistics, a revenue premium analysis of brand equity and a dynamic
programming model of investment.
Brand Equity
The starting assumption of our research is that on-field achievements, such as bowl participation,
are key factors in the development of team-level brand equity Keller and Lehmann 2006). The
term brand equity is used in the marketing literature to describe the value that brands provides to
firms through factors such as increase customer loyalty or diminished price sensitivity. The
literature on brand equity development is grounded in models of advertising dynamics (Nerlove
and Arrow 1962). Nerlove and Arrow (1962) consider the advertising decision of a forward-
looking firm. In this model, the firm invests to build a stock of goodwill that may provide future
benefits through attracting new customers, lowering price sensitivity and other mechanisms. The
benefits of advertising conjectured by Nerlove and Arrow are largely consistent with the factors
such as loyalty, awareness, brand associations and perceived quality that are the foundation of
Aaker’s model of brand equity (1991). In addition to studying the process by which advertising
creates brand equity, the marketing literature has occasionally considered the impact of other
marketing activities on brand equity formation. For example, Simon and Sullivan (1993) use an
event study methodology to study how the introductions of Diet Coke and New Coke, and the
7
approval of aspartame, impacted the brand equity of Coca-Cola and Pepsi.
There is a limited literature focused specifically on brand equity in sports. This literature
has mainly focused on applying concepts from the brand equity literature to the domain of sports.
For example, Gladden et al. (1998) discuss how certain factors (e.g., team success and
conference affiliation) impact brand equity elements such as perceived quality (Aaker 1991),
awareness (Keller 1993), associations (Park and Srinivasan 1994) and loyalty (Aaker 1991). The
sports marketing literature also includes case studies of brand equity at specific schools.
Robinson and Miller (2003) report on Texas Tech’s decision to hire Bobby Knight, and how that
decision impacted local retail sales of licensed apparel and home game sellouts. Bruening and
Lee (2007) evaluated the impact of Notre Dame’s decision to hire Tyrone Willingham through
metrics such as team GPA, recruiting results and student applications. Given that brand
preference is a major component of brand equity, there are elements of the economics literature
focused on consumer demand for sports that are relevant to our study (Rottenberg 1956; Fort and
Quirk 1995). Aggregate consumer demand has been found to be influenced by factors such as
market size, product quality, consumer loyalty and the marketing mix selected by the firm.
Studying brand equity dynamics requires a method for measuring brand equity that links
outcomes to changes in brand equity. The marketing literature contains a significant body of
research focused on brand equity measures. Keller and Lehmann (2001) categorized brand
equity measures based on whether the unit of analysis is customer mind-set, product market
outcomes, or financial market outcomes. Consumer mind-set includes measures such as
awareness, loyalty and attitudinal associations with a brand (Aaker 1991). Financial market
outcomes measure brand equity based on financial market activity and transactions (Simon and
Sullivan 1993). Product market outcomes measure equity in terms of observable performance
8
metrics such as price premiums, market share and revenue premiums (Ailawadi et al. 2003).
Ailawadi et al. (2003) advocate for revenue premium measures because revenue involves
price premiums and market share performance. Ailawadi et al. (2003) identify challenges and
limitations of their revenue premium approach. One challenge is to define a particular brand as a
baseline, against which revenue premiums can be assessed. Another limitation is that the
revenue premium approach does not directly address the dynamic processes by which brand
equity is created.
Alliance Design & Distribution Constraints
The organizational structure of the BCS system represents an alliance of FBS schools. The BCS
alliance is interesting in several respects. First, because athletic contests require the participation
of two teams and a system of interrelated leagues, college football involves co-production and
multiple alliances that operate at different levels. Similar to the alliances between AQ and Non-
AQ, schools also band together in conferences, and these conferences form alliances with each
other. Second, the BCS system includes an explicitly asymmetric structure in terms of bowl
eligibility and financial payouts. Third, if our speculation that post season participation impacts
brand equity formation, then the structure of the BCS alliance may impact not just short-term
returns but also teams’ abilities to develop brand equity.
The marketing literature includes a stream of research that examines alliances between
unequal partners. Kalaignanam et al. (2007) investigate asymmetric new product development
alliances. This study is interesting because the authors find that these asymmetric alliances can
be win-win opportunities for both partners. Venkatesh et al. (2000) analytically examine
alliances between players (e.g. boxers or entertainers) with different levels of market sizes (or
fan followings). A fascinating aspect of this study is that co-production of the event provides an

9
opportunity for consumers to shift preferences. This is a relevant study as the unequal market
sizes are consistent with the BCS system since AQ schools in the larger conferences have greater
fan bases and may therefore wish to deny Non-AQ schools the opportunity to shift consumer
preferences. However, Venkatesh et al. find that both large and small market players can benefit
from cooperation. From our perspective, these findings speak to the possibility that asymmetric
rules may be mutually beneficial, in that inequality can benefit stronger and weaker partners.
An additional issue when considering “sports alliances” is that the structure of the league
may directly impact the utility provided to consumers. For example, the “uncertainty of
outcome” hypothesis advanced by Rottenberg (1956) claims that fans prefer contests between
balanced opponents. Quinn and Bursik (2007) examine how expansion and relocation impact
overall attendance trends. Our focus is on a specific aspect of league design: the structure of the
post season. The literature focused on tournament theory (Lazear and Rosen 1981; Rosen 1986)
is relevant to our topic. Lazear and Rosen (1981) develop a theoretical model that shows how
the differences in rewards to winners and losers can be set to optimize participant’s efforts. In
contrast to our interest in the feedback effects of post season tournaments, this literature has been
concerned with the role of tournaments on current period efforts by participants and on the
ability of the tournament to identify the best participant (Rosen 1986).
However, tournament design can have more complex and dynamic effects. For example,
Taylor and Trogdon (2002) examine the case of the NBA playoffs and find that teams have both
positive incentives associated with tournament success-- but also negative incentives --due to the
structure of the NBA draft which provides more favorable picks to less successful teams. An
open question remains: how does the BCS impact schools’ efforts to field competitive teams?
To our knowledge, the impact of league and tournament design has not been considered in terms
10
of team level brand building. If past success is a major determinant of fan base size and loyalty
this is a significant gap in the literature.
Synthesis
The preceding discussion separates issues related to brand equity and alliance design. However,
these two issues are intimately related in the case of the BCS, since the distribution constraints
directly impact access to brand equity building opportunities. As noted, the challenges to the
BCS have been framed as antitrust issues related to boycotts and consumer welfare. However,
given the relationship between alliance constraints and brand building opportunities, our view is
that the BCS is best analyzed in terms of its dynamic implications for different classes of
schools. We next briefly review the antitrust arguments made regarding the BCS, and relate
these arguments to the preceding marketing issues. We then formulate several dynamically
oriented research questions that guide our subsequent analyses.
The BCS has been challenged by a number of politicians, academics and other
commentators on antitrust grounds. For example, Grow (2011) claims that the BCS is
susceptible to antitrust actions for two main reasons. The first reason is that the BCS represents
a group boycott. The FTC defines a group boycott as “an agreement among competitors not to
do business with targeted individuals or businesses.” Considering this definition, the AQ
conference members discriminate against Non-AQ schools by placing restrictions on these
schools’ access to high profile games. Grow further bolsters this argument with dynamic
implications by stating “because teams in the BCS conferences compete annually for a spot in in
one of the highest profile post-season bowl games, they tend to receive greater media attention
throughout the season, leading to significant season ticket sales, television contracts, sponsorship
agreements and alumni and fan donations” (2011, p. 76). As a result, BCS schools are able to

11
invest greater resources into their athletic programs. Although Grow’s statements do not use the
language of marketing, these arguments are closely related to brand equity development.
The second reason for antitrust actions, as noted by Grow, is that the BCS represents an
illegal price fixing scheme. The logic of this complaint is that the BCS provides a mechanism
for allowing formerly independent conferences and bowl games to collectively create a pay scale
for participation in these games. An argument is also made that the BCS fixes prices by jointly
selling broadcast rights to networks. The claim is made that BCS payouts are therefore
determined “without regard to the competitive strength or marketability of any individual
participating university” (page 89). This argument again includes elements of both marketing
issues related to branding structures and economic arguments based on competition levels. In
the case of the “marketability” of chosen schools, two branding issues need to be considered.
First, the structure of fandom needs to be considered. If fans root for teams first but also have
affinity for conferences, then selecting a member of a major conference may be viewed as a
means to create a highly marketable contest. Second, the agreements to take major conference
champions might also be viewed as a means to reduce the risk of failing to land a highly
marketable team in a more open system.
The BCS has also been attacked it terms of its impact on consumer welfare (Allred 2010,
Zimbalist 2009). For example, Allred (2010) claims the lack of a true tournament means that the
BCS “championship game” is false advertising. Zimbalist (2009) raises the issue of whether the
BCS harms consumer welfare by restricting output and distorting prices. Zimbalist suggests that
the key issue is whether the adoption of a playoff would reduce or expand the total audience for
college football. This is an open empirical issue, as arguments have been made that a
tournament would drive a great deal of fan interest while a counter argument has been made that
12
the creation of a tournament would lessen interest in the regular season.
While many antitrust arguments are beyond the scope of our research, such as the
tradeoff between incremental tournament revenues and potential lower interest in the regular
season, the arguments related to branding issues suggests three research questions and guides the
development of our empirical investigations. Our first research question is concerned with the
dynamics of brand equity creation. We are interested in the links between investments, team
success and brand equity:
What is the causal process by which investments translate into different levels of post-
season participation, and how does this form of “quality” impact brand equity?
Our second and third research questions are focused on understanding the investment decisions
made by schools. If we assume that schools are rational, forward-looking decision makers, then
schools’ observed investment decisions provide a better indication of the true effects of
environmental variables and the BCS system. Our second question focuses on how schools
moderate their investment policies based on marketing assets such as brand equity and customer
loyalty impact return on investment:
Based on observed investment behavior, do schools operate as if return on investment is
moderated by marketing assets?
The first two research questions are necessary to address our focal question of how the structure
of the BCS system impacts AQ and Non-AQ schools. Our second research question is explicitly
focused on how marketing assets impact return on investment. A natural extension to this
question is whether these marketing assets have asymmetrical effects based on conference status
(AQ versus Non-AQ). These potential asymmetries, combined with the dynamics of brand
equity formation, are needed to address the current controversies regarding the BCS system, and
are addressed in our third question:
13
Does the BCS system restrain the ability of Non-AQ schools to develop brand equity? In
particular, does the system unduly constrain Non-AQ schools when post-season
opportunities are considered in terms of programs’ brand equity and investment?
3. Empirical Context
In this section, we provide details on the empirical context for our investigation. We begin with
a brief discussion of the structure and history of the BCS and then present descriptive statistics
that highlight the differences across AQ and Non-AQ schools. We also conduct several analyses
that address the relationships between school decisions, characteristics and market outcomes.
History of the BCS
College (and professional) athletics almost exclusively rely on playoff tournaments to establish
champions. The only exception to this is the Football Bowl Subdivision (FBS). This dichotomy
is striking given that other levels of college football (Football Championship Subdivision,
Division II, and Division III) all rely on playoff systems to determine champions. In contrast,
the FBS schools use a system of exhibition games that vary in prestige and a recently created
championship game.
The current BCS system has its roots in the traditional bowl games and human poll based
determination of champions. Historically, national championships in Division 1 football have
been determined by polling organizations. The use of polls rather than a playoff often resulted in
split championships whereby disagreement across the various polls led to multiple national
champions in a single season. An initial step towards a playoff occurred in 1992 with the
formation of the College Bowl Coalition. This “Bowl Coalition” was based on a set of
agreements between five major conferences (ACC, Big East, Big Eight, SEC and the
Southwestern Conference) and four major bowl games with the goal of pairing the top two

14
ranked teams. However, the Bowl Coalition failed to consistently create games between the top
ranked teams. Pre-existing contractual obligations, such as the SEC champion being committed
to the Sugar Bowl, eliminated the possibility of a true championship game if one of the top two
teams was from the SEC. The lack of participation by the Big Ten and the Pac 10 also
constrained the Bowl Coalition. To address several of these constraints, the “Bowl Alliance”
was formed in 1994, which removed the obligations of conference champions to play in specific
bowl games. The champions of the ACC, BIG East, Big Twelve and SEC were guaranteed slots
in one of the Orange, Sugar or Fiesta Bowls. However, the Bowl Alliance still did not include
agreements with the Pac 10 and the Big Ten. The Bowl Alliance was therefore unable to create a
true championship game in 1997 when Michigan and Nebraska both completed undefeated
seasons.
The Bowl Championship Series was formed in 1998, which extended the Bowl Alliance
by gaining the participation of the Big Ten and Pac 10. The BCS again guaranteed participation
in the major bowls (Orange, Fiesta, Sugar and Rose) to the champion of each of the six member
(AQ) conferences. Teams from non-BCS conferences were guaranteed a slot in a BCS bowl if
they were ranked in the top 6 in the BCS standings.3 However, while the BCS was able to assure
a championship game between the two top ranked teams, the method by which the top teams
were determined remained controversial. The original method used to construct the BCS
rankings involved a combination of four components: (i) the AP and coaches polls, (ii) computer
polls, (iii) won-loss records and (iv) strength of schedule. By design, the BCS structure thereby
grants differential access to college football’s most prestigious and lucrative bowls. Also, teams
in AQ conferences receive much larger post-season revenues. For example, in the 2010-2011
3 Notre Dame would qualify if it won at least 9 games or was ranked in the top 10 in the BCS standings.
15
BCS, each member of the ACC, Big East and Big 12 received $21.2 million, while members of
the Big Ten, SEC and Pac 10 received $27.2 million each. In contrast, members of the non AQ
conferences split $24.72 million (http://www.bcsfootball.org/).
There are several important takeaways from the preceding discussion. Most obviously,
the BCS system differentiates between AQ and Non-AQ schools in terms of access and
revenues. However, the summary also suggests significant complexity. For example, the
failures of the previous bowl alliances were largely due to the lack of participation of key
conferences, such as the Big Ten and The Pac 10. This is important because it suggests that the
members of these two conferences are viewed as necessary by college football fans for the
system to be legitimate. In other words, the members of certain conferences possess sufficient
“brand equity,” that they must be included to ensure fan interest. There is also a trend towards
adopting more of a standard playoff structure. The 2014 season is schedule to include a 4 game
playoff. Future research may look into how this playoff structure impacts brand building
opportunities.
Descriptive Statistics
We next present several descriptive analyses using data for the time period from 2001 to 2010.
Table 1 presents descriptive statistics for members of the AQ and Non-AQ conferences for this
period.4 The first two rows of the table list relative expenditures on football programs and
relative revenues. These are given as percentages of overall average spending and revenue each
year. In terms of expenditures, the AQ schools spend 134% of the average while the Non-AQ
schools spend 56%. For example, in 2010 the overall average spending was $13.5 million while
average revenues were $23.2 million. In 2010, the AQ schools average $18.2 million in
4 For the descriptive statistics and all subsequent analyses we treat Notre Dame as an AQ school.
16
spending and $34.7 million in revenues, compared to $7.3 million in spending and $8.1 million
in revenues for the Non-AQ schools. The comparison between spending levels is apt as AQ
schools invest more than twice the level of the Non-AQ schools.
In terms of winning rates, the AQ schools average 7.1 wins and 5.4 losses per year,
compared to 5.6 wins and 6.6 losses per year for the Non-AQs. Members of AQ conferences
participated in post-season bowls 57.6% of the time and were selected to play in major bowls at
an 11.6% rate. In contrast, Non-AQ schools participated in the post season 30.2% of the time
and made entry into a major bowl in 1.2% of seasons. The AQ schools also possess larger
stadiums and fan bases, as evidenced by average attendance and student populations. In terms of
attendance, AQ schools average about 60,000 fans at each game, compared to 22,500 for the
Non-AQ schools.5 These descriptive statistics reveal important differences between AQ and
Non-AQ schools. First, the AQ schools spend substantially more on their programs. This is
important given that we anticipate a significant relationship between investment and program
quality. Differences in student body size and stadium capacity suggest that AQ schools have
larger fan bases and market potentials.
--- Insert Table 1 about here---
The preceding descriptive statistics report investment decisions and outcomes for the
period between 2001 and 2010. Prior to this time period, the schools also varied in terms of past
successes. Given the consensus that brand equity in sports is developed through on-field success
(Gladden et al. 1998), differences across AQ and Non-AQ schools are pertinent as they suggest
differences in initial brand equity. Table 2 reports several measures of post season success. In
terms of “claimed” national championships, AQ schools average 2.06 as of 2000 while Non-AQ
5 Attendance is moderated by capacity, with the average AQ school stadium having a capacity about 67,000 fans,
and the Non-AQ schools 37,000.
17
schools average .08 championships. In terms of major bowls, AQ schools had on average played
in 7.92 versus just .67 for the Non-AQs. Notably, the probability that an AQ school had never
played in a major bowl was 11.1% versus 83.3% for the Non-AQs. The key implication of these
differences is that BCS conference schools are likely to have significantly greater brand equity
than the Non-AQs at the beginning of the data sample. An additional implication is that it may
be inappropriate to just examine raw bowl game participation results when evaluating the BCS.
While the NAQ schools have lower participation rates, the higher participation rates of the AQ
schools may be justified by these schools’ larger investments and brand equities.
--- Insert Table 2 about here---
4. Past Performance, Relative revenue and Bowl Participation
Table 3 lists correlations between metrics such as investment, revenues, win percentage,
attendance, and previous bowls. Investment is highly correlated with revenue (.831) and
attendance (.795), while the correlation with winning percentage (.42) is lower. Investment is
also highly correlated with measures of past success such as previous major bowl games (.66)
and previous minor bowls (.61). The correlations between past performance and current revenues
are larger. The table also includes two variables, students and local population, which relate to
schools’ market potentials. Population is negatively related to revenue and attendance, while
student body size is positively correlated with investment, revenue and attendance.
--- Insert Table 3 about here ---
Table 4 presents results from regressions that estimate attendance and relative revenue as
a function of current season success (winning percentage, post season game, etc.), historical
success (cumulative bowl appearances) and market potential measures (student body size,
stadium capacity and population). Attendance is positively related to winning rate, playing in a
18
minor bowl game, previous bowl games, capacity and students. Population has a negative effect.
This effect may be due to larger markets having more entertainment options. The R-square for
this equation is .89. The positive relationship between attendance and previous post-season
achievement is consistent with the conjecture that bowl participation creates brand equity that
leads to greater fan loyalty.
--- Insert Table 4 about here---
The results of the relative revenue regression suggest that revenue is positively related to
winning percentage, bowl game participation, historical success, stadium capacity, and student
body size. Revenue is negatively related to market population. Table 4 includes two
specifications for relative revenue. The first version includes the previous variables and yields
an R2 of .78. The second specification is labeled “Revenue w/AQ” and includes the same set of
variables but also includes a binary variable that indicates membership in an AQ conference.
Including the AQ dummy variable increases the R2 metric to .81. Notably, including the AQ
dummy does not change the sign or significance of any of the other variables.
We next evaluated the relationship between on-field success as evidenced by the level of
bowl game achieved in a season and variables such as investment, AQ status, attendance and
previous bowl participation. For this analysis, we use an ordered logit model and define 4 levels
of post-season participation: no bowl game, minor bowl game, major bowl game, and national
championship game. The logic of each of the explanatory variables is as follows: 1. Investment
is included to control for team quality level. 2. Attendance is used as a measure of the team’s fan
base(an important factor, in case bowls prefer teams with large fan bases that are more likely to
travel to the bowl site). 3. Previous bowl participation reflects the brand equity or appeal of the
team. 4. AQ status is included to capture the influence of the BCS structure on bowl
19
participation. Given the concerns expressed about limited access for non-AQs this term is
directly related to the controversial nature of the BCS.
--- Insert Table 5 about here---
Table 5 reports the estimation results for the model. The parameter estimates show that bowl
participation and higher level bowls are more likely for teams that invest more, have higher
attendance and have participated in more minor bowls. The most dramatic finding from the
analysis is the significance of the AQ term. In this formulation, the positive sign indicates that
AQ membership reduces teams’ post season opportunities. Figure 1 shows the relationship
between investment and major bowl participation for an AQ and Non-AQ school. The figures
are for a school that has participated in 12 minor bowls, 4 major bowls, has won a single national
championship and has attendance of 60,000. For the NAQ school, the figure shows the
probability of achieving a major bowl for investment levels ranging from 50% to 150% of the
overall FBS. For the AQ schools, we plot the probabilities for investments ranging from 100%
of the average to 250%. The figure shows that when investment in a football program is
controlled for, the probability of playing in a major bowl is significantly greater for Non-AQ
schools. At a spending level equal to the overall FBS average, the model predicts the Non-AQ
school has a 14.4% chance at a major bowl, versus just 5% for the AQ school.
--- Insert Figure 1 about here ---
5. Revenue Premium Based Brand Equity Estimation
The sports category possesses properties that facilitate a revenue premium based approach to
brand equity estimation. First, reporting requirements force college athletic programs to provide
details on the expenditures and revenues of individual sports. More importantly, current and past
20
measures of quality are readily and objectively measurable. This enables the analysis to go
beyond simple measurement of equity and to identify the historical drivers of brand equity
creation.
For our application we develop two measures of brand equity. The first is based on
financial results relative to investments and the second on the relationship between revenues and
on-field performance. Equation (1) models revenue as a function of only AQ status and relative
investment. This equation is used to develop a measure of brand equity based on whether the
school’s revenues exceed what is expected based on level of investment. Equation (2) treats
revenue as a function of on-field success. In this equation, revenue is forecasted based on the
team’s AQ status, current season winning percentage and bowl results. This equation is used to
develop a measure of brand equity that reflects whether fan loyalty allows a team to financially
outperform what would be expected from current season quality levels.
(1)
(2)
In these equations INVi,t is relative investment of team i year season t, Minor indicates a minor
bowl game, Major indicates a BCS level bowl game and NCG indicates that the team played in
the National Championship Game. We use the revenue forecasts from equations (1) and (2) to
estimate brand equity (BE). Specifically, we subtract the forecasted revenue from the actual
revenue, as in equation (3). This difference between actual and forecasted revenues represents a
premium (or deficit) relative to expected performance.
(3) ̂
The two measures of brand equity have different interpretations. The BE estimate based on the
investment based forecast (Equation 1) reflects the athletic department’s ability to exceed the
21
financial returns of institutions that invest similar amounts. We term this measure as BEROI to
reflect the greater returns to investment. The logic of this measure is that high brand equity
should enable schools to generate higher returns through activities such as higher prices. The
second revenue forecast is used to develop a measure of brand equity that is based on the loyalty
and size of the customer base. Equation (2) predicts revenue as a function of solely the on-field
product quality in a given season. The logic for this metric is that the residual is the difference
between the revenues that are expected based on on-field success or product quality and the
revenue actually achieved. This type of premium is likely due to size and loyalty of the fan base.
We term this measure as BECL.
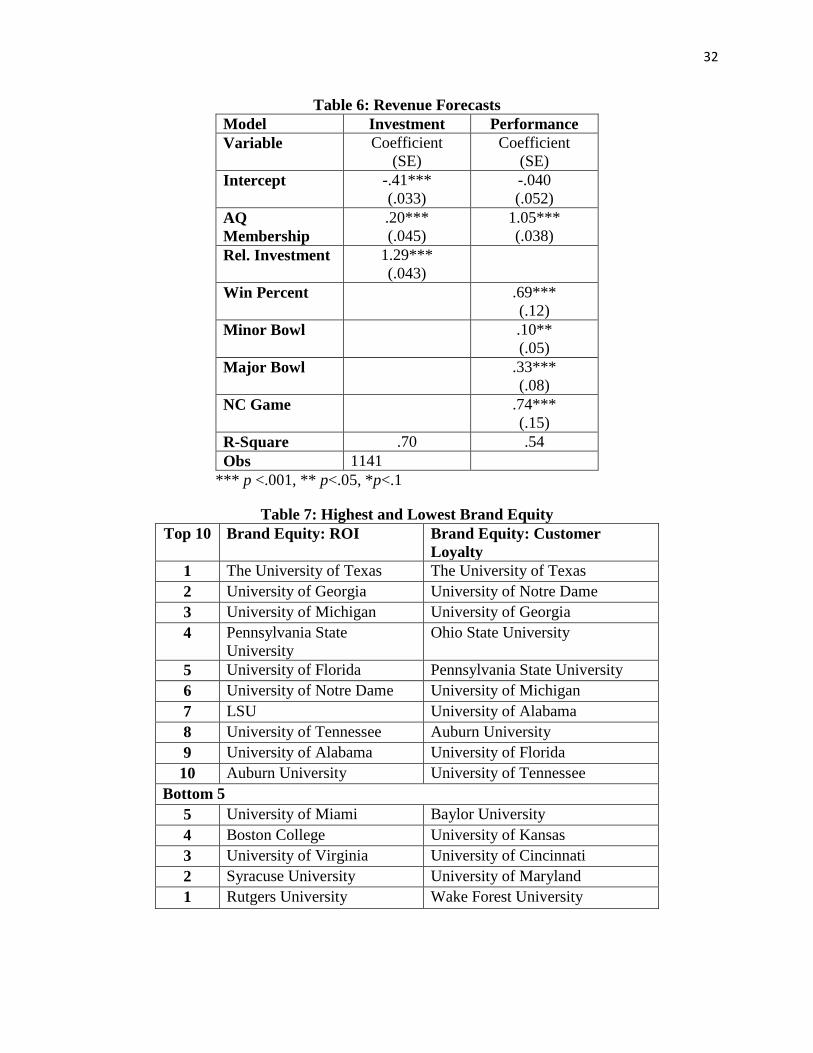
Table 6 presents estimation results for the revenue forecasts described in equations (1)
and (2). In the investment based revenue forecast, the AQ indicator and relative investment both
yield positive coefficients. In the performance based forecast, AQ membership, winning
percentage and the various bowl participation levels are all positive and significant.
--- Insert Table 6 about here ---
Table 7 provides a listing of the best and worst performing schools according to each measure of
brand equity. In the case of the ROI measure, the best performing schools are Texas, Georgia,
Michigan, Penn State and Florida. When the metric evaluated is the customer loyalty based
brand equity measure, the top performing schools are Texas, Notre Dame, Georgia, Ohio State
and Penn State. The top schools are fairly similar for both methods. LSU appears only in the
ROI list while Ohio State is only in the top ten of the customer loyalty based measure.6
--- Insert Table 7 about here ---
We next examined the drivers of brand equity by regressing the brand equity estimates
6 We also conducted the brand equity analysis with models that controlled for conferences rather than just AQ
membership. When conference membership is controlled, we found similar schools at the top of the list. For the
ROI measure, the top schools were Texas, Georgia, Michigan, Penn State and Florida.
22
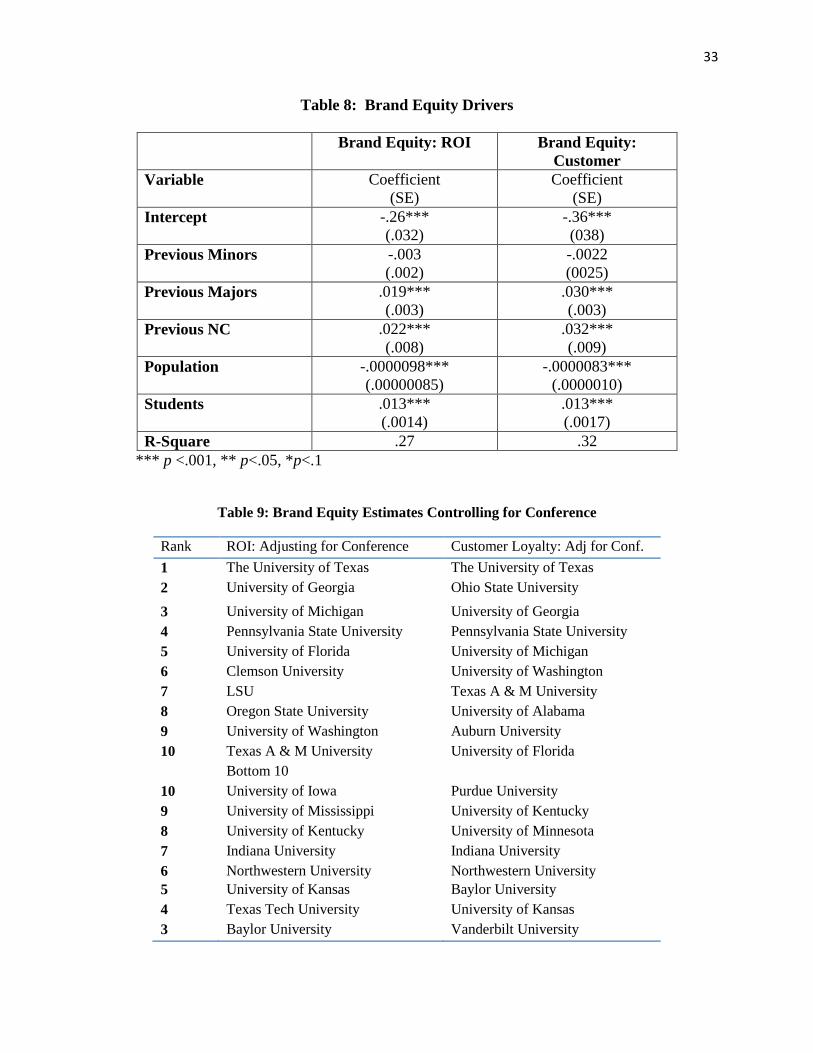
against measures of historical success and market characteristics. The estimation results are
reported in Table 8. The pattern of results is the same for each brand equity measure. In both
cases, the number of previous major bowls and past championships yield positive significant
effects, while the estimate for minor bowls is insignificant. In terms of the market
characteristics, we find that having a larger student body is associated with greater brand equity,
while a larger population has a negative effect on brand equity.
--- Insert Table 8 about here ---
We also repeated the preceding analysis with conference level dummies rather than a
single indicator for AQ conference membership. The brand equity rankings from the models that
control for conference affiliation are listed in Table 9. The main differences between the results
that control for conference affiliation and the preceding results are the schools that end up with
very low rankings. In the model that only controls for AQ affiliation the bottom of the list is
mainly comprised of ACC and Big east members. When the AQ members are modeled using
conference specific dummies the bottom of the list is then dominated by members of the SEC
and Big Ten. While this may seem counter intuitive given the prominence of these two
conferences there is logic to this finding. In the AQ only model the weakness of these lower tier
members is disguised by the payouts received by these schools.
6. Discussion
The sports business has much in common with other sectors but also possesses several key points
of differentiation. In terms of similarities, brand equity development and customer loyalty
maintenance are key marketing objectives. Perhaps the most important point of differentiation
between sports and other categories is that sports franchises must simultaneously compete and
cooperate with their rivals. Managing the conflicting forces of individual team’s pursuit of on-
23
field success with the need to maintain a set of viable and balanced opponents is an important
consideration in the design of sports alliances or leagues. The importance of balance may or
may not be an issue in the discussion of the BCS. At first glance, it might be suggested that an
asymmetric post season structure is counter-productive, but it could also be argued that the major
six conferences provide enough balanced teams that competitive balance is not an issue.
In terms of our research question regarding how levels of bowls impact brand equity, we
find evidence that schools pursue dynamically oriented brand building strategies and that
different levels of bowl games have differential effects on brand equity. Specifically, in our
quadratic specification, we find that the first major bowl creates two times the equity of the first
minor bowl, and the first championship creates three times the equity of a minor bowl. This
finding is broadly consistent with other results from entertainment marketing. For instance,
Shugan and Mitra (2009) found that in the movie industry that an actor’s maximum financial
performance is a better predictor of film results than the actor’s mean performance. In our case,
Major Bowls and National Championships are the primary means for building brand equity. It
would be interesting to examine if cumulative extreme performances are the key to building
equity in other entertainment categories.
For our second research question, concerning how marketing assets impact investment,
we find a significant difference across classes of schools. While both AQ and Non-AQ schools
behave as though brand equity impacts return on investment, only the AQ schools invest based
on customer base strength. This finding suggests a possible relationship between brand equity
and customer base characteristics. It may be that Non-AQ schools do not invest based on current
attendance because they fear that the loyalty of the customer base is tenuous. The lack of a
relationship between customer base and investment for the Non-AQ schools suggests that these

24
schools do not base investments on short term revenue changes.
Our third research question addresses whether the BCS system restricts the ability of the
Non-AQ schools to build brand equity. A particularly notable element of both our descriptive
analyses and our dynamic structural model is the finding that, after controlling for investment,
Non-AQ schools actually have preferred access to BCS games. Despite the greater access to
major bowls, the unequal distribution of funds to AQ conferences arguably restricts the ability of
Non-AQ schools to invest in their programs. However, this argument is debatable. Because the
AQ schools possess much greater brand equity on average and invest substantially more in their
programs, a case can be made that those schools deserve to collect the vast majority of the bowl
system revenues. In other words, the value of the BCS games is driven by fan interest in college
football, and this interest is based on the histories and brand equities of teams such as Texas,
Alabama and Notre Dame, rather than Utah and Boise State.
A possible criticism of our research is that the classification of schools into AQ and non-
AQ is not sufficiently granular. Relatedly, a current issue of interest in college football is
conference realignment. Over the past few years, schools such as Colorado and Nebraska have
left the Big Twelve conference in order to join the Pac 10 and the Big Ten, respectively. The
movement of schools between conferences suggests that schools’ decisions are based on factors
beyond AQ conference membership. In another interesting development, schools such as Utah
and the University of Central Florida were able to transition from non-AQ to AQ conferences.
One interpretation is that these schools were able to build up sufficient brand equity and fan
bases to become attractive to AQ conferences.
A limitation of our study is that we do not explicitly consider broader consequences of
brand equity such as the potential relationship between athletic success and outcomes related to
25
student demand (Chung 2012; Bouchet and Hutchinson 2012) and alumni giving. Our modeling
approach assumes that investments are made optimally based on customer base characteristics
and a desire to build brand equity through post-season participation. It is entirely possible that
investment decisions should also consider the impact of the football program on application
levels. While our approach implicitly considers these broader effects, future research should
explicitly consider broader institutional objectives.
Related to broader brand effects, an additional factor to consider is the objective of
individual bowl games. Selections of teams for bowl games may be based on economic
considerations in addition to desires for a competitive game. As a preliminary investigation into
this issue, we estimated an OLS model of bowl ratings as a function of whether the bowl is a
Major Bowl or the National Championship Game and the season attendances of the teams
playing using data from 2003 to 2010. This model also includes the previously used brand
equity data. Specifically, we include the maximum of the two team’s customer loyalty brand
equity and the absolute difference between the brand equities.
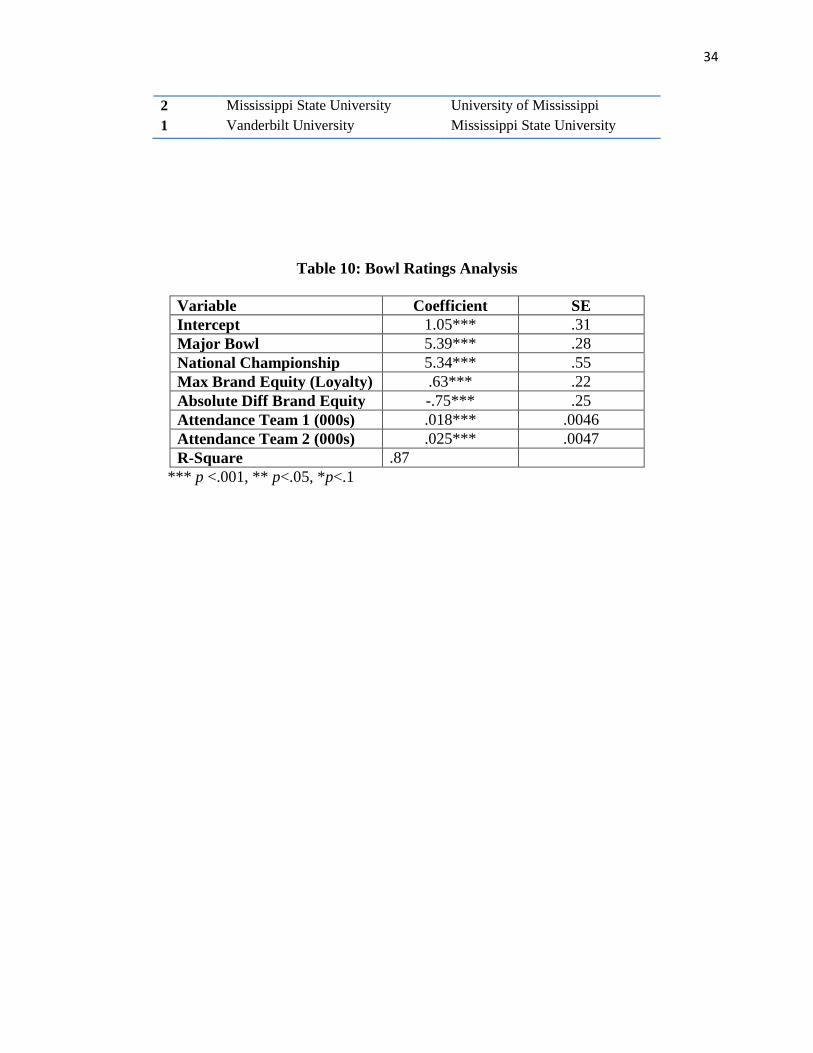
The results of the model are given in Table 13. In addition to the prestige and
significance of the game, we find a positive effect for team’s attendance and for the maximum
brand equity. These results suggest that the interest in bowl games is higher when customer
equity and brand equity are higher. Given that the AQ schools dominate the customer equity
rankings; this indicates that college football fans overall interest levels are driven by the high
equity teams. The difference term also suggests that fans have a preference for teams of equal
brand equity. These results reinforce our conclusions that college football is driven by “star
teams.” This finding has implications for how revenue should be shared (or not shared) between
AQ and Non-AQ conferences. Fan preference for high brand equity teams in bowl games
26
suggests that the claims that the BCS is unresponsive to consumer demand are unwarranted.
Finally, there has been movement to the adoption of a four-team seeded playoff. The
adoption of this type of system would motivate additional research. While a playoff system is
broadly supported by college football fans (Dinich 2012), studying the brand equity
ramifications of such a system would be interesting. Such a study might reveal whether
participation in major bowl games would create the same level of brand equity. It is possible that
fans would only view participation in the four-team playoff as equivalent to a “major” bowl. If
this were the case, then opportunities for brand building would become even more limited.
27
References
Aaker, David (1991), Managing Brand Equity, New York, The Free Press.
Ailawadi, K., D. Lehmann and S. Neslin (2003), “Revenue Premium as an Outcome Measure of
Brand Equity,” Journal of Marketing, 67(October), 1-17.
Allred, Parker (2010), “From the BCS to the BS: Why “Championship” Must be Removed from
the Bowl Championship Series,” Utah Law Review, No 1, 2010, 183-199.
Becker, Brian and Mark Huselid (1992), “The incentive Effects of Tournament Compensation
Systems,” Administrative Science Quarterly, 37(2), 336-350.
Bouchet, Adrien and Michael Hutchinson (2012), “Brand establishment at the University of
Chicago: An Investigation of De-escalation of Commitment in University Athletics,” Journal of
Sport Administration & Supervision, 4(1), 97-113.
Bruening, Jennifer and Min Lee (2007), “The University of Notre Dame: An Examination of the
Impact and Evaluation of Brand Equity in NCAA Division I Football,” Sport Marketing
Quarterly, 16(1), 38-48.
Chintagunta, Pradeep and Naufel Vilcassim, (1992), “An Empirical Investigation of Advertising
Strategies in a Dynamic Duopoly,” Management Science, 38(9), 1230-1244.
Chung, Doug (2012), “The Dynamic Advertising Effect of Collegiate Athletics,” working paper.
Cialdini, Robert B., Richard Borden and Avril Thorne (1976), “Basking in Reflected Glory:
Three (Football) Field Studies,” Journal of Personality and Social Psychology, 34(3), 366-375.
Dinich, Heather (2012),”Playoff Plan to Run Through 2025,” ESPN.com,
http://espn.go.com/college-football/story/_/id/8099187/ncaa-presidents-approve-four-team-
college-football-playoff-beginning-2014, retrieved 7/16/2012.
Gladden, James, George Milne and W. Sutton (1998), “A Conceptual Framework for Assessing
Brand Equity in Division I College Athletics,” Journal of Sports Management, 12, 1-19.
Grimshaw, Scott, Paul Sabin and Keith Willes (2013), “Analysis of the NCAA Men’s Final Four
TV Audience,” Journal of Quantitative Analysis in Sport, 9(2), 115-126.
Grow, Nathaniel (2011), “Antitrust & the Bowl Championship Series,” Harvard Journal of
Sports and Entertainment Law, 2(1), 53-98.
Fort, Rodney and James Quirk (1995), “Cross-Subsidization, Incentives and Outcomes in
Professional Team Sports Leagues,” Journal of Economics Literature, Sept., 1265-1299.
Harville, David (2011), “The Selection or seeding of College Basketball or Football Teams for

28
Postseason Competition,” Journal of the American Statistical Association, 98(461), 17-27.
Holt, Douglas (1995), “How Consumers Consume: A Typology of Consumption Practices,”
Journal of Consumer Research, 22(1), 1-16.
Jensen, Jonathan and Brain Turner (2014), “What if statisticians ran college football? A
reconceptualization of the football bowl subdivision,” Journal of Quantitative Analysis in Sport,
10(1), 37-48.
Kalaignanam, Kartik, Venkatesh Shankar and Rajan Varadarajan (2007), “Asymmetric New
Product Development Alliances: Win-Win or Win-Lose Partnerships?” Management Science,
53(3), 357-374.
Keller, Kevin Lane and Donald Lehmann (2006), “Brands and Branding: Research Findings and
Future Priorities,” Marketing Science, 25(6), 740-759.
Keller, Kevin Lane (1993), “Conceptualizing, Measuring, and Managing Customer-Based Brand
Equity,” Journal of Consumer Research, 57 (January), 1-22.
Koenker, Roger and Gilbert Bassett (2010), “March Madness, Quantile Regression Bracketology
and the Hayek Hypothesis,” Journal of Business and Economic Statistics, 28(1), 26-35.
Lazear, Edward and Sherwin Rosen (1981), “Rank-Order Tournaments as Optimum Labor
Contracts,” Journal of Political Economy,” 89(5), 841-864.
Lewis, Michael (2008), “Individual Team Incentives and Managing Competitive Balance in
Sports Leagues: An Empirical Analysis of Major League Baseball,” J. of Marketing Research,
45(5), 535-549.
Miller, Joanne and Jon Krosnick (1998), “The Impact of Candidate Name Order on Election
Outcomes,” Public Opinion Quarterly, 62(2), 291-330.
Quinn, Kevin and Bursik, Paul (2007), “Growing and Moving the Game: Effects of MLB
Expansion and Team Relocation 1950-2004,” Journal of Quantitative Analysis in Sport, 3(2),
Article 4.
Quirk, James (2004), “College Football Conferences and Competitive Balance,” Managerial and
Decision Economics, 25(2), 63-75.
Robinson, Matthew and John Miller (2003), “Assessing the Impact of Bobby Knight on the
Brand Equity of the Texas Tech Basketball Program,” Sport Marketing Quarterly, 12(1), 56-59.
Rosen, Sherwin (1986), “The Theory of Equalizing Differences,” in Handbook of Labor
Economics, edited by O. Ashenfelter and R. Layard, Elsevier Science Publishers, Volume 1,
641-692.
29
Rottenberg, Simon (1956), “The Baseball Player’s Labor Market,” Journal of Political Economy,
June, 242-258.
Rovell, (2011), “Behind the Numbers: College Football Business Grows Exponentially,”
http://www.cnbc.com/id/42340628
Shugan, Steven M. and Debanjan Mitra (2009), “Metrics – When and Why Nonaveraging
Statistics Work”, Management Science, 55 (1), 4-15
Stern, H.S. (2006), “In Favor of a Quantitative Boycott of the Bowl Championship Series,”
Journal of Quantitative Analysis in Sport, 2(1), Article 4.
Taylor, Beck and Justin Trogdon (2002), “Losing to Win: Tournament Incentives in the National
Basketball Association,” Journal of Labor Economics, 20(1), 23-41.
Vogel, Harold (2010), Entertainment Industry Economics: A Guide for Financial Analysis, 8th
Edition, Cambridge University Press, Cambridge.
Zimbalist, Andrew (2009), “The BCS, Antitrust and Public Policy,” The Antitrust Bulletin, 54(4),
823-855.

30
Tables
Table 1: Comparison of AQ and Non-AQ Schools
Metric AQ Conferences Non-AQ Conferences
Mean Expendituresa 134% 56%
Mean Revenuesa 154% 30%
Wins 7.1 5.6
Losses 5.4 6.6
Bowl Participation Rate 57.6% 30.2%
Major Bowl Rate 11.6% 1.2%
Attendance 60,138 22,449
Stadium Capacity 66,795 37,047
Students 22,408 17,546
a Relative to all FBS teams
Table 2: Performance Histories as of the 2000-1 Season
AQ Non AQ
Cumulative National
Champs*
2.06 .08
Bowls Played 19.65 4.94
Major Bowls Played 7.92 0.67
Cumulative Wins 552 399
Cumulative Losses 400 367
Never Played in a “Major” 11.1% 83.33% aNeed to know what it means
Table 3: Correlations
Expense Revenue Win % Attend Majors Minors Population
Expense 1.0
Revenue .831 1.0
Win % .417 .425 1.0
Attend .795 .901 .470 1.0
Majors .659 .759 .347 .736 1.0
Minors .607 .649 .388 .748 .515 1.0
Population .040 -.108 -.017 -.104 .009 -.079 1.0
Student .279 .370 .150 .418 .161 .289 .154

31
Table 4: Attendance and Relative Revenue Regression Results
Attendance Revenue Revenue w/AQ
Variable Coefficient
(SE)
Coefficient
(SE)
Coefficient
(SE)
Intercept -10,040***
(1029.6)
-.48***
(.050)
-.44***
(.047)
Win Percent 9884.1***
(1718.6)
.14*
(.08)
.21***
(.078)
Bowl Game 2111.0***
(727.9)
.10***
(.04)
.075**
(.033)
Major Bowl 1426.7
(1209.6)
.16***
(.06)
.13**
(.055)
NC Game -241.4
(2226.6)
.22**
(.11)
.26**
(.10)
Previous
Minors
838.3***
(50.8)
.017***
(.0024)
.010***
(.002)
Previous
Majors
457.0***
(67.5)
.035***
(.003)
.033***
(.003)
Previous NCs 567.8***
(567.8)
.023***
(.008)
.025***
(.007)
Capacity (000s) 610.9***
(20.6)
.016***
(.0010)
.012***
(.001)
Population
(000s)
-1.65***
(-1.65)
-.000067***
(.000008)
-.00007***
(.000008)
Students (000s) 263.1***
(263.1)
.010***
(.0016)
.011***
(.015)
AQ Conference .38***
(.032)
R_Square .89 .78 .81
Observations 1141
*** p <.001, ** p<.05, *p<.1
Table 5: Ordered Logistic Regression for Bowl Participation
Variable Coefficient SE
Intercept 1 2.56*** .17
Intercept 2 5.56*** .35
Intercept 3 7.31*** .34
AQ Status 1.00*** .20
Relative Investment -1.57*** .22
Previous Minors -.042*** .013
Previous Majors .029* .015
Previous NC -.030 .037
Attendance (000s) -.030*** .0054
*** p <.001, ** p<.05, *p<.1
32
Table 6: Revenue Forecasts
Model Investment Performance
Variable Coefficient
(SE)
Coefficient
(SE)
Intercept -.41***
(.033)
-.040
(.052)
AQ
Membership
.20***
(.045)
1.05***
(.038)
Rel. Investment 1.29***
(.043)
Win Percent .69***
(.12)
Minor Bowl .10**
(.05)
Major Bowl .33***
(.08)
NC Game .74***
(.15)
R-Square .70 .54
Obs 1141
*** p <.001, ** p<.05, *p<.1
Table 7: Highest and Lowest Brand Equity
Top 10 Brand Equity: ROI Brand Equity: Customer
Loyalty
1 The University of Texas The University of Texas
2 University of Georgia University of Notre Dame
3 University of Michigan University of Georgia
4 Pennsylvania State
University
Ohio State University
5 University of Florida Pennsylvania State University
6 University of Notre Dame University of Michigan
7 LSU University of Alabama
8 University of Tennessee Auburn University
9 University of Alabama University of Florida
10 Auburn University University of Tennessee
Bottom 5
5 University of Miami Baylor University
4 Boston College University of Kansas
3 University of Virginia University of Cincinnati
2 Syracuse University University of Maryland
1 Rutgers University Wake Forest University
33
Table 8: Brand Equity Drivers
Brand Equity: ROI Brand Equity:
Customer
Variable Coefficient
(SE)
Coefficient
(SE)
Intercept -.26***
(.032)
-.36***
(038)
Previous Minors -.003
(.002)
-.0022
(0025)
Previous Majors .019***
(.003)
.030***
(.003)
Previous NC .022***
(.008)
.032***
(.009)
Population -.0000098***
(.00000085)
-.0000083***
(.0000010)
Students .013***
(.0014)
.013***
(.0017)
R-Square .27 .32
*** p <.001, ** p<.05, *p<.1
Table 9: Brand Equity Estimates Controlling for Conference
Rank ROI: Adjusting for Conference Customer Loyalty: Adj for Conf.
1 The University of Texas The University of Texas
2 University of Georgia Ohio State University
3 University of Michigan University of Georgia
4 Pennsylvania State University Pennsylvania State University
5 University of Florida University of Michigan
6 Clemson University University of Washington
7 LSU Texas A & M University
8 Oregon State University University of Alabama
9 University of Washington Auburn University
10 Texas A & M University University of Florida
Bottom 10
10 University of Iowa Purdue University
9 University of Mississippi University of Kentucky
8 University of Kentucky University of Minnesota
7 Indiana University Indiana University
6 Northwestern University Northwestern University
5 University of Kansas Baylor University
4 Texas Tech University University of Kansas
3 Baylor University Vanderbilt University
34
2 Mississippi State University University of Mississippi
1 Vanderbilt University Mississippi State University
Table 10: Bowl Ratings Analysis
Variable Coefficient SE
Intercept 1.05*** .31
Major Bowl 5.39*** .28
National Championship 5.34*** .55
Max Brand Equity (Loyalty) .63*** .22
Absolute Diff Brand Equity -.75*** .25
Attendance Team 1 (000s) .018*** .0046
Attendance Team 2 (000s) .025*** .0047
R-Square .87
*** p <.001, ** p<.05, *p<.1

35
Figures
Figure 1: Probability of a Major Bowl versus Investment
Figure 2: Expectation of Major Bowl versus Investment
0
0.05
0.1
0.15
0.2
0.25
0.3
0.35
0.4
0.45
50% 70% 90% 110% 130% 150% 170% 190% 210% 230% 250%
AQ School NAQ School
0.0%
10.0%
20.0%
30.0%
40.0%
50.0%
60.0%
50% 70% 90% 110% 130% 150% 170% 190%
AQ NAQ