brainstorm cell therapeutics
TRANSCRIPT
Brainstorm Cell Therapeutics August 2020 I NASDAQ: BCLI

2020 Corporate Presentation I 2
Forward-Looking Statements
Statements in this announcement other than historical data and information constitute "forward-looking statements" and involve risks and
uncertainties that could cause BrainStorm Cell Therapeutics Inc.'s actual results to differ materially from those stated or implied by such
forward-looking statements. Terms and phrases such as "may", "should", "would", "could", "will", "expect", "likely", "believe", "plan", "estimate",
"predict", "potential", and similar terms and phrases are intended to identify these forward-looking statements. The potential risks and
uncertainties include, without limitation, risks associated with BrainStorm's limited operating history, history of losses; minimal working capital,
dependence on its license to Ramot's technology; ability to adequately protect the technology; dependence on key executives and on its
scientific consultants; ability to obtain required regulatory approvals; and other factors detailed in BrainStorm's annual report on Form 10-K and
quarterly reports on Form 10-Q available at http://www.sec.gov.
These factors should be considered carefully, and readers should not place undue reliance on BrainStorm's forward-looking statements. The
forward-looking statements contained in this press release are based on the beliefs, expectations and opinions of management as of the date of
this press release. We do not assume any obligation to update forward-looking statements to reflect actual results or assumptions if
circumstances or management's beliefs, expectations or opinions should change, unless otherwise required by law. Although we believe that
the expectations reflected in the forward-looking statements are reasonable, we cannot guarantee future results, levels of activity, performance
or achievements.
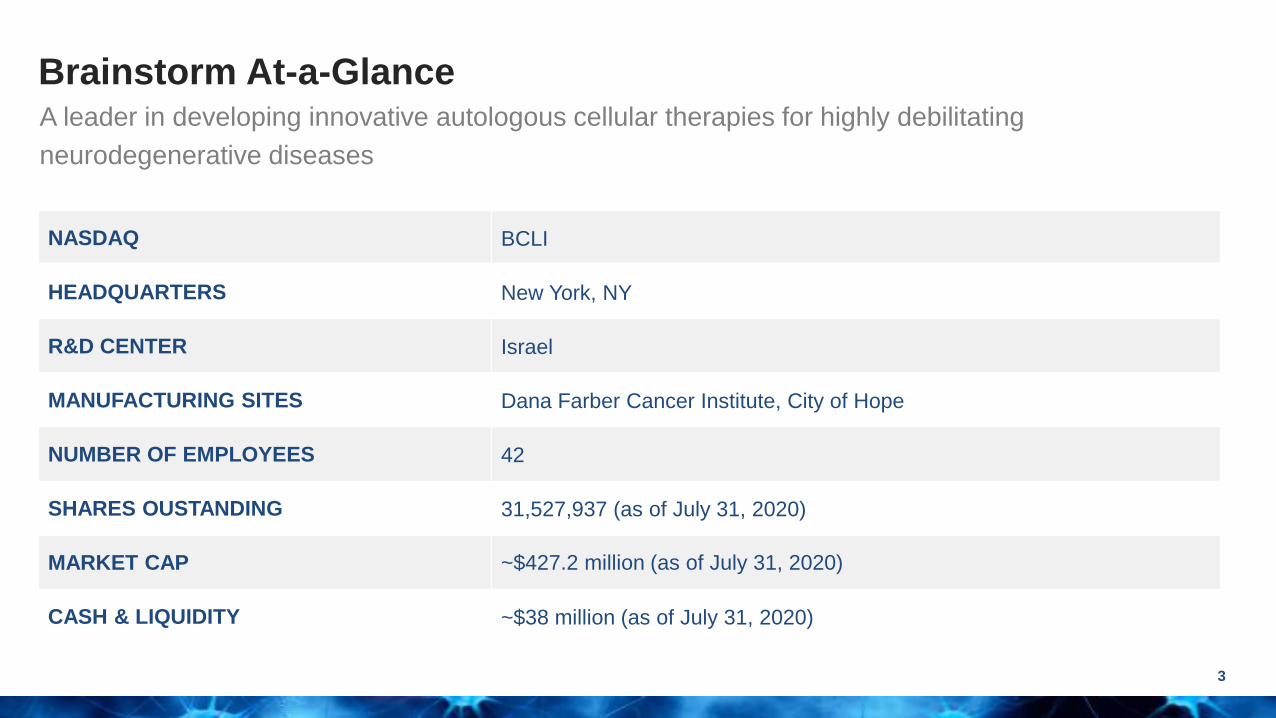
NASDAQ BCLI
HEADQUARTERS New York, NY
R&D CENTER Israel
MANUFACTURING SITES Dana Farber Cancer Institute, City of Hope
NUMBER OF EMPLOYEES 42
SHARES OUSTANDING 31,527,937 (as of July 31, 2020)
MARKET CAP ~$427.2 million (as of July 31, 2020)
CASH & LIQUIDITY ~$38 million (as of July 31, 2020)
Brainstorm At-a-Glance
3
A leader in developing innovative autologous cellular therapies for highly debilitating
neurodegenerative diseases

Brainstorm Senior Leadership Team
4
Chaim Lebovits
Chief Executive Officer
Ralph Kern, MD, MHSc
President & Chief Medical Officer
Arturo Araya, MBA
Chief Commercial Officer
David Setboun, PharmD, MBA
EVP & Operating Officer
Preetam Shah, PhD, MBA
EVP & Chief Financial Officer
Uri Yablonka
EVP & Chief Business Officer
Stacy Lindborg, PhD
EVP & Head of Global Clinical Research
Revital Aricha, PhD
VP Research & Development
Yael Gothelf, PhD
VP Scientific & Regulatory Affairs
Yossef Levy, PhD
VP Cell Production
Mary Kay Turner
VP Patient Advocacy & Gov. Affairs
Susan Ward, PhD
Head of Clinical Operations

NurOwn®
5
A unique cell therapy product
Autologous and convenient
NurOwn® autologous cell therapy
uses the patient’s own cells
• Safety and cell persistence
Cryopreservation creates an ‘off-the-
shelf’ product for each patient
A single bone marrow harvest
creates several years of therapy
Short cycle time, 7 days from
thawing to injection in the clinic
Consistent and reliable
No animal proteins, antibiotics,
genetic modifications or viral
vectors are used in the
manufacturing process
NurOwn® is culture-rescued
creating very high cell viability
and consistent performance
characteristics
Cell potency release criteria
Consistent biology observed in-
vitro and in-vivo
• Neurodegenerative disease animal models
• Human biomarker studies
Neuroprotection, neurotrophic
support and immunomodulation
confirmed in phase 2 ALS trial
Safety experience is growing
across indications
Platform technology
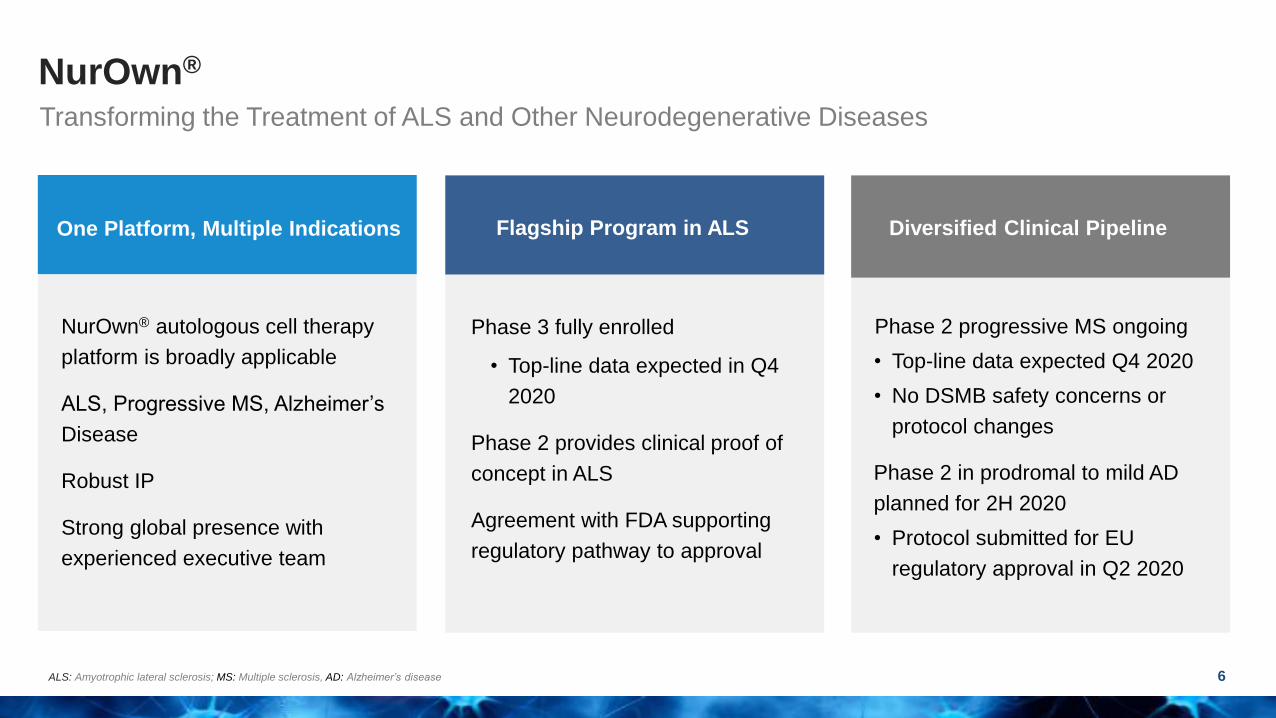
NurOwn®
6
Transforming the Treatment of ALS and Other Neurodegenerative Diseases
One Platform, Multiple Indications
NurOwn® autologous cell therapy
platform is broadly applicable
ALS, Progressive MS, Alzheimer’s
Disease
Robust IP
Strong global presence with
experienced executive team
Flagship Program in ALS
Phase 3 fully enrolled
• Top-line data expected in Q4
2020
Phase 2 provides clinical proof of
concept in ALS
Agreement with FDA supporting
regulatory pathway to approval
Phase 2 progressive MS ongoing
• Top-line data expected Q4 2020
• No DSMB safety concerns or
protocol changes
Phase 2 in prodromal to mild AD
planned for 2H 2020
• Protocol submitted for EU
regulatory approval in Q2 2020
Diversified Clinical Pipeline
ALS: Amyotrophic lateral sclerosis; MS: Multiple sclerosis, AD: Alzheimer’s disease

Brainstorm’s Growing Pipeline
7
Indication Preclinical IND Enabling Phase 1 Phase 2 Phase 3 Next Milestones
NurOwn® MSC-NTF Cells Platform
ALSQ4’20E
Top-line data
Progressive MS Q4’20E
Top-line data
Alzheimer’s DiseaseCTA: Q2’20E
Phase 2: 2H’20E
Parkinson’s Disease
Huntington’s Disease
Autism Spectrum Disorder
Peripheral Nerve Injury
MSC-NTF Cell Exosome Platform
ARDS
ARDS: Acute respiratory distress syndrome

NurOwn® Technology Platform
Best-in-class autologous cell therapy
8

NurOwn® Manufacturing: Fast, Consistent and Reproducible
9
1. Harvesting: Outpatient procedure for collection of patient’s
bone marrow sample
2. Isolation & Expansion: Mesenchymal stem cells (MSCs)
isolated from the total bone marrow sample and MSCs
expanded ex-vivo (12 days)
3. Cryopreservation: Creates an off the shelf product for each
patient, enabling retreatment for up to 3 years.
4. NurOwn Production: MSCs are thawed, expanded, and
induced to differentiate into MSC-NTF cells optimized to
secrete neurotrophic factors. (7 days)
5. NurOwn Administration: MSC-NTF cells are CSF delivered
back into patient at or near the site of damage
Total time from harvest to treatment is 19 daysCSF: Cerebrospinal fluid

-3000
300600900
120015001800
GD
NF
(p
g/1
06
ce
lls
)
GDNF
MSC MSC-NTF 0
1000
2000
3000
4000
5000
BD
NF
(p
g/1
06
ce
lls
)
BDNF
MSC MSC-NTF
0
20
40
60
80
VE
GF
(n
g/1
06
ce
lls
)
VEGF
MSC MSC-NTF
0
20
40
60
80
100
HG
F (
ng
/10
6c
ell
s)
HGF
MSC MSC-NTF
NurOwn® Effect on MSC-NTF Neurotrophic Factors
GDNF: Glial cell line derived neurotrophic factor; BDNF: Brain-derived neurotrophic factor; VEGF: Vascular Endothelial Growth Factor; HGF: Hepatocyte growth factor.
Data from ALS Phase 1/2 and Phase 2a studies.
n=28 ALS Patients
10

NurOwn® Promotes Expansion of Anti-inflammatory Treg Cells
11JAMA Neurol. 2016;73(3):337-344.
© 2015 American Medical Association. All rights reserved.
eFigure 4. Longitudinal Follow-up of the Changes in Volume of the Muscles of the
Arms by 3D Volumetric Analysis Using MRI
Mean percentage ± SEM of peripheral blood lymphocytes stained positive for CD4 and CD25 surface
markers (double staining) using FACS analysis, in ALS patients treated with MSC-NTF cells, in the
Phase1/2 trial (A) and in the Phase 2a (B) study at the indicated pre- (baseline) and post-treatment time-
points.
0.0
0.2
0.4
0.6
0.8
1.0
1.2
1.4
1.6
1.8
2.0
2.2
Baseline 4h 1 day 1 month 3 months 6 months
%C
D4
+C
D2
5+
lym
ph
oc
yte
s
Mean percentage of CD4+CD25+ lymphocytes
Post-transplant
0.0
0.2
0.4
0.6
0.8
1.0
1.2
1.4
1.6
1.8
2.0
2.2
Baseline 4h 1 day 1 month 3 months 6 months
%C
D4
+C
D2
5+
lym
ph
oc
yte
s
Mean percentage of CD4+CD25+ lymphocytes
Post-transplantA B
Downloaded From: http://archneur.jamanetwork.com/ by a Tel-Aviv University User on 01/11/2016
T Regulatory Cells Increased in Phase 1/2a
Mean percentage ± SEM of peripheral blood lymphocytes stained positive for CD4 and CD25 surface markers (double staining) using FACS analysis, in ALS
patients treated with MSC-NTF cells, in the Phase1/2 trial (A) and in the Phase 2a (B) study at the indicated pre- (baseline) and post-treatment time-points.
© 2015 American Medical Association. All rights reserved.
eFigure 4. Longitudinal Follow-up of the Changes in Volume of the Muscles of the
Arms by 3D Volumetric Analysis Using MRI
Mean percentage ± SEM of peripheral blood lymphocytes stained positive for CD4 and CD25 surface
markers (double staining) using FACS analysis, in ALS patients treated with MSC-NTF cells, in the
Phase1/2 trial (A) and in the Phase 2a (B) study at the indicated pre- (baseline) and post-treatment time-
points.
0.0
0.2
0.4
0.6
0.8
1.0
1.2
1.4
1.6
1.8
2.0
2.2
Baseline 4h 1 day 1 month 3 months 6 months
%C
D4
+C
D2
5+
lym
ph
oc
yte
s
Mean percentage of CD4+CD25+ lymphocytes
Post-transplant
0.0
0.2
0.4
0.6
0.8
1.0
1.2
1.4
1.6
1.8
2.0
2.2
Baseline 4h 1 day 1 month 3 months 6 months
%C
D4
+C
D2
5+
lym
ph
oc
yte
s
Mean percentage of CD4+CD25+ lymphocytes
Post-transplantA B
Downloaded From: http://archneur.jamanetwork.com/ by a Tel-Aviv University User on 01/11/2016
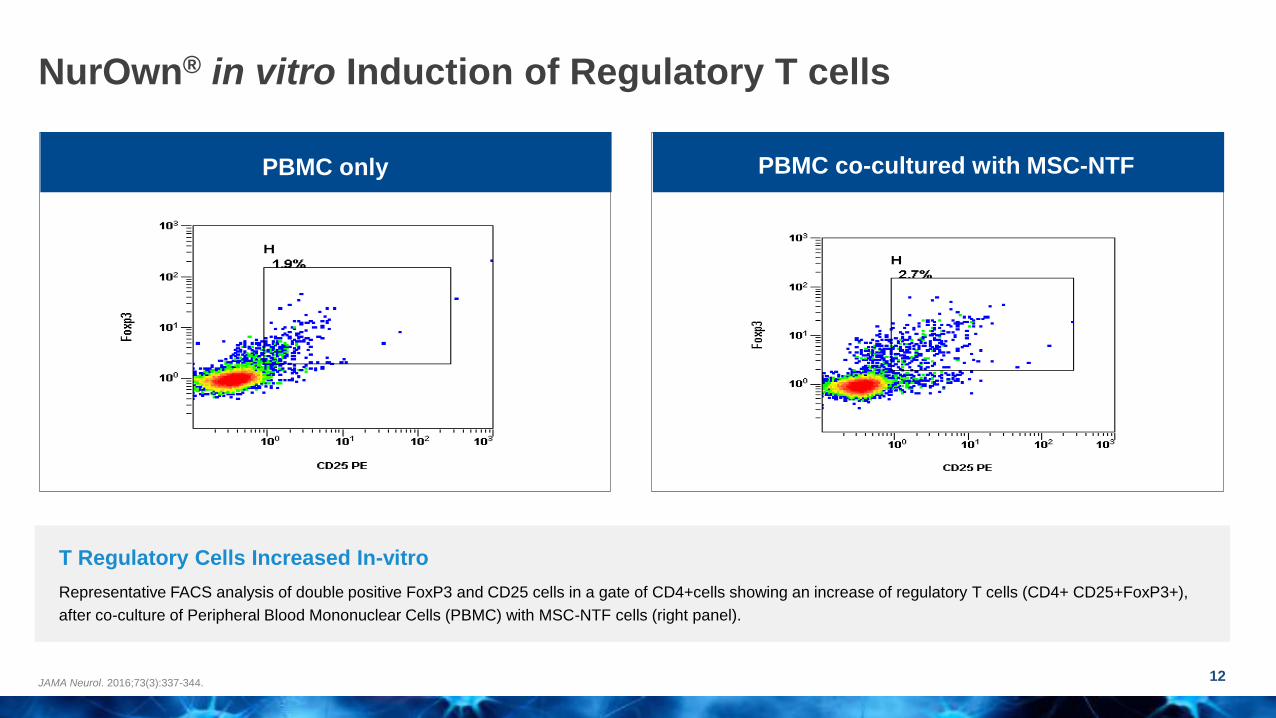
NurOwn® in vitro Induction of Regulatory T cells
12JAMA Neurol. 2016;73(3):337-344.
PBMC onlyPBMC co-cultured with
MSC-NTF
T Regulatory Cells Increased In-vitro
Representative FACS analysis of double positive FoxP3 and CD25 cells in a gate of CD4+cells showing an increase of regulatory T cells (CD4+ CD25+FoxP3+),
after co-culture of Peripheral Blood Mononuclear Cells (PBMC) with MSC-NTF cells (right panel).
PBMC only PBMC co-cultured with MSC-NTF
PBMC onlyPBMC co-cultured with
MSC-NTF

NurOwn® MOA: Broadly Applicable Across Neurodegenerative Diseases
13
ALS: Amyotrophic lateral sclerosis; pMS: Progressive multiple sclerosis; AD: Alzheimer’s Disease; MOAs: Mechanisms of action; Sources: Prion. 2013 Jan 1; 7(1): 47–54. Front Immunol. 2018; 9: 217. J Neurosci Res 2017 Dec
95(12):2430-2447. Brain. 2018 Sep 1;141(9):2561-2575. Curr Neuropharmacol. 2011 Dec; 9(4): 559–573. Front Neurosci. 2010; 4: 32. Int J Mol Sci. 2012; 13(10): 13713–13725. Lancet Neurol. 2015 Apr; 14(4): 388–405. Curr Pharm Des.
2017 23(5):693-730. Front Immunol. 2017; 8: 1005. J Neuroinflammation. 2019 Feb 21 16(1):46.
Neuronal Degeneration
Astrocyte Dysfunction and Loss of
Neurotrophic Support
Neuroinflammation and
Microglial Activation
Underlying pathologies
of ALS, MS, and AD
Neuroprotection
Reduces CSF Caspase-3
Enhanced delivery of NTFs
Increases CSF VEGF, HGF, LIF, BDNF, GDNF
Immunomodulation
Reduces CSF MCP-1, SDF-1, CHIT-1
NurOwn MSC-NTF MOAs

NurOwn® for the Treatment of
Amyotrophic Lateral Sclerosis (ALS)
14
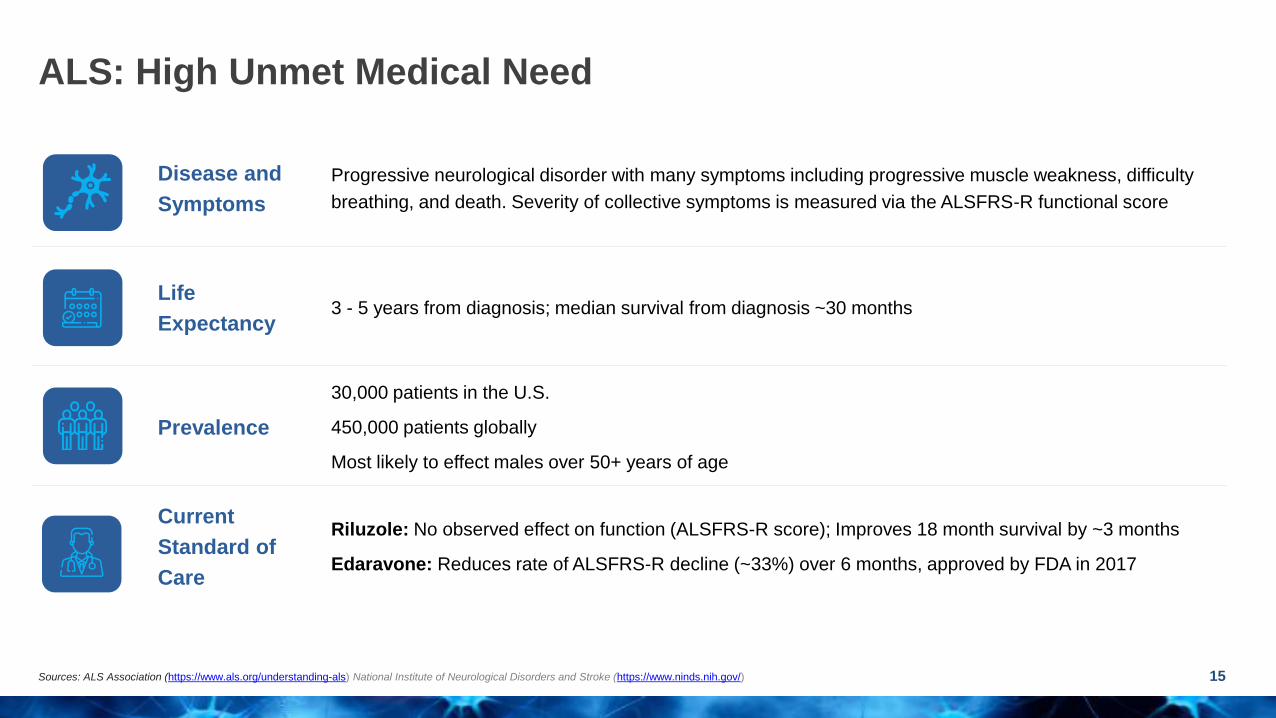
Disease and
Symptoms
Progressive neurological disorder with many symptoms including progressive muscle weakness, difficulty
breathing, and death. Severity of collective symptoms is measured via the ALSFRS-R functional score
Life
Expectancy3 - 5 years from diagnosis; median survival from diagnosis ~30 months
Prevalence
30,000 patients in the U.S.
450,000 patients globally
Most likely to effect males over 50+ years of age
Current
Standard of
Care
Riluzole: No observed effect on function (ALSFRS-R score); Improves 18 month survival by ~3 months
Edaravone: Reduces rate of ALSFRS-R decline (~33%) over 6 months, approved by FDA in 2017
ALS: High Unmet Medical Need
15Sources: ALS Association (https://www.als.org/understanding-als) National Institute of Neurological Disorders and Stroke (https://www.ninds.nih.gov/)

Q4 2020
ALS US Phase 3
Topline Data
Readout2007
NurOwn
Preclinical
Development
2010
ALS
Phase 1/2a
Open label
2014
ALS
US Phase 2
Randomized trial
2017
ALS
US Phase 3
Randomized trial
2019
ALS
US Phase 3
Fully Enrolled
2648
200
Phase 1/2 Phase 2 Phase 3
NurOwn® in ALS: 10+ Years Clinical Development
16
# o
f S
tud
y P
art
icip
an
ts
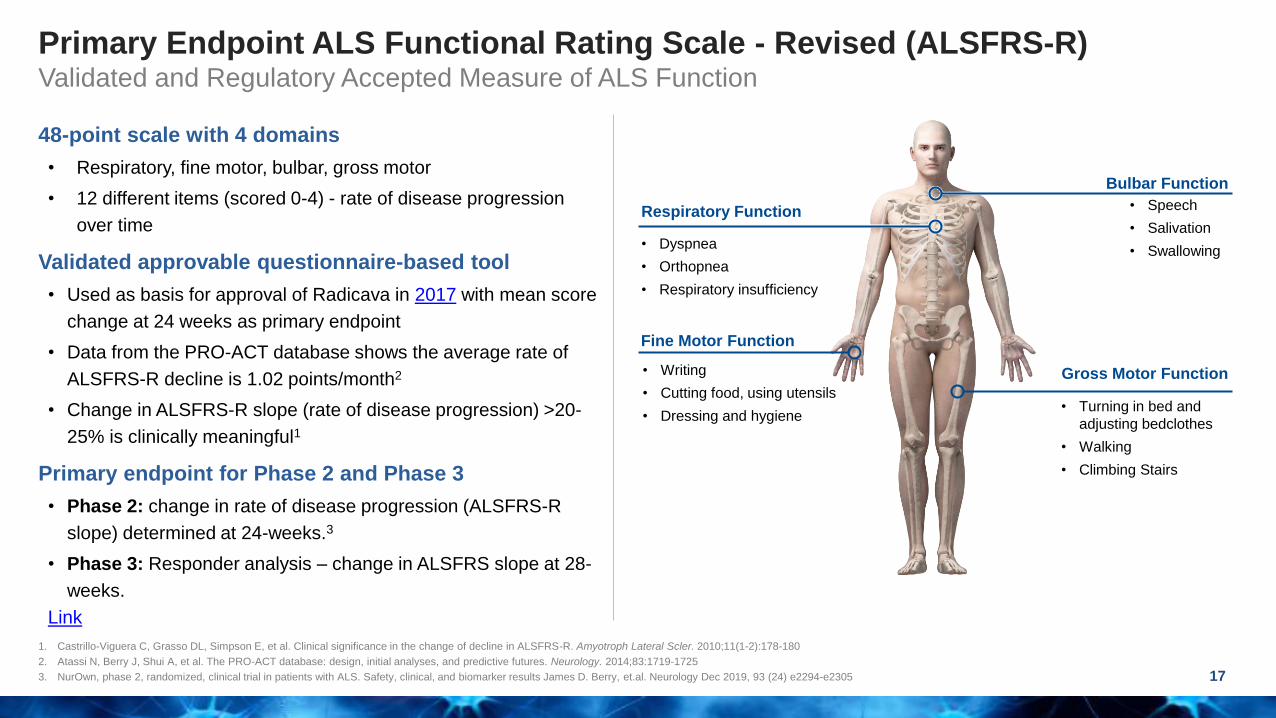
Primary Endpoint ALS Functional Rating Scale - Revised (ALSFRS-R)Validated and Regulatory Accepted Measure of ALS Function
17
1. Castrillo-Viguera C, Grasso DL, Simpson E, et al. Clinical significance in the change of decline in ALSFRS-R. Amyotroph Lateral Scler. 2010;11(1-2):178-180
2. Atassi N, Berry J, Shui A, et al. The PRO-ACT database: design, initial analyses, and predictive futures. Neurology. 2014;83:1719-1725
3. NurOwn, phase 2, randomized, clinical trial in patients with ALS. Safety, clinical, and biomarker results James D. Berry, et.al. Neurology Dec 2019, 93 (24) e2294-e2305
Respiratory Function
• Dyspnea
• Orthopnea
• Respiratory insufficiency
Bulbar Function
• Speech
• Salivation
• Swallowing
Gross Motor Function
• Turning in bed and
adjusting bedclothes
• Walking
• Climbing Stairs
Fine Motor Function
• Writing
• Cutting food, using utensils
• Dressing and hygiene
48-point scale with 4 domains
• Respiratory, fine motor, bulbar, gross motor
• 12 different items (scored 0-4) - rate of disease progression
over time
Validated approvable questionnaire-based tool
• Used as basis for approval of Radicava in 2017 with mean score
change at 24 weeks as primary endpoint
• Data from the PRO-ACT database shows the average rate of
ALSFRS-R decline is 1.02 points/month2
• Change in ALSFRS-R slope (rate of disease progression) >20-
25% is clinically meaningful1
Primary endpoint for Phase 2 and Phase 3
• Phase 2: change in rate of disease progression (ALSFRS-R
slope) determined at 24-weeks.3
• Phase 3: Responder analysis – change in ALSFRS slope at 28-
weeks.
Link

NurOwn® ALS Phase 2 Trial Design
18ClinicalTrials.gov identifier NCT02017912
Berry et al Neurology 2019
• No deaths or treatment related serious adverse events (SAEs)
• No dropouts related to SAEs
• Most common adverse events transient and mild/moderate severity and procedure related
24-26-week post-treatment follow up
R3:1
12-week run-in
Bone Marrow
Aspiration
• CSF collection pre-treatment and 2 weeks post-treatment
• Follow up visits on week 4, 8, 16
• Patient phone calls weeks 12 and 20
• Final visit week 24-26
Collect CSF,
Treatment
Collect
CSF
N = 48
Placebo (N=10)
MSC-NTF Treated (N=33)
R
3:1
Treatment vs. placebo changes in:
ALSFRS-R slope
Slow Vital Capacity
Patients completing follow up
Primary Endpoint
Secondary Endpoint
43
Safety & Tolerability
Fast progressor criteria:
Pre-specified as participants
with > 2-point decrease in the 3
months lead-in period

-2
-1
0
1
2
3
4
2wks 4wks 8wks 12wks 16wks 24wks
AL
SF
RS
-R L
S m
ea
n c
ha
ng
e in
slo
pe
MSC-NTF Placebo
Change from post-treatment to pre-treatment slopeA
-2
-1
0
1
2
3
4
2wks 4wks 8wks 12wks 16wks 24wks
MSC-NTF Placebo
Change from post-treatment to pre-treatment slope
*
*
B
0%
10%
20%
30%
40%
50%
60%
70%
80%
90%
2wks 4wks 8wks 12wks 16wks 24wks
% o
f p
ati
en
ts w
ith
≥1.5
po
ints
ch
an
ge
/mo
nth
MSC-NTF Placebo
*
C
0%
10%
20%
30%
40%
50%
60%
70%
80%
90%
2wks 4wks 8wks 12wks 16wks 24wks
MSC-NTF Placebo
*
D
*
Phase 2 Outcomes: Greater Efficacy Observed in Rapid Progressors
19Berry et al Neurology 2019, * for p < 0.05
Phase 3 has enrolled only rapidly progressing patients
*p<0.05
All n = 46 Rapid progressors n=21
-2
-1
0
1
2
3
4
2wks 4wks 8wks 12wks 16wks 24wks
AL
SF
RS
-R L
S m
ea
n c
ha
ng
e in
slo
pe
MSC-NTF Placebo
Change from post-treatment to pre-treatment slopeA
-2
-1
0
1
2
3
4
2wks 4wks 8wks 12wks 16wks 24wks
MSC-NTF Placebo
Change from post-treatment to pre-treatment slope
*
*
B
0%
10%
20%
30%
40%
50%
60%
70%
80%
90%
2wks 4wks 8wks 12wks 16wks 24wks
% o
f p
ati
en
ts w
ith
≥1.5
po
ints
ch
an
ge
/mo
nth
MSC-NTF Placebo
*
C
0%
10%
20%
30%
40%
50%
60%
70%
80%
90%
2wks 4wks 8wks 12wks 16wks 24wks
MSC-NTF Placebo
*
D
*
MSC-NTF Placebo
• Primary safety
endpoint met
• Efficacy demonstrated
in ALSFRS-R, a
measure of ALS
function
• Multiple doses will be
needed
A Change from post-treatment to pre-treatment slope B Change from post-treatment to pre-treatment slope
Single dose NurOwn® slowed the rate of disease progression by improving the ALSFRS-R LS mean change in slope vs. pre-treatment slope
*p<0.05
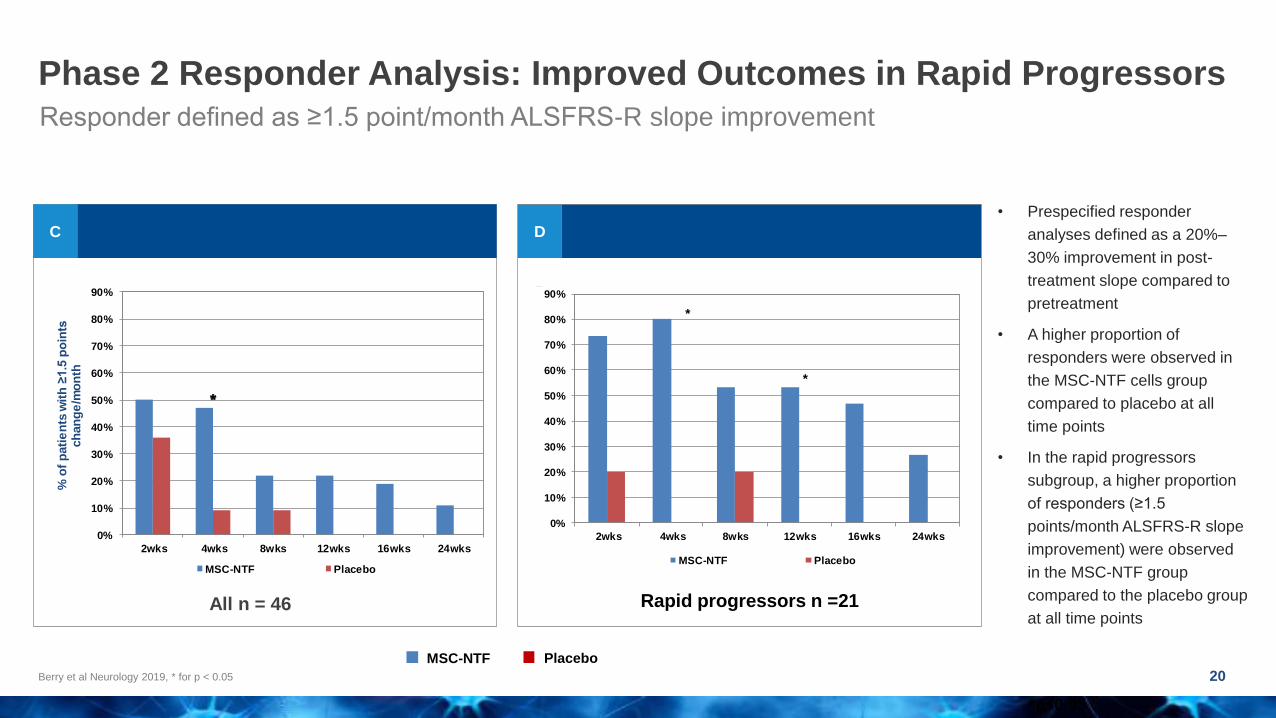
Phase 2 Responder Analysis: Improved Outcomes in Rapid Progressors
20Berry et al Neurology 2019, * for p < 0.05
Responder defined as ≥1.5 point/month ALSFRS-R slope improvement
-2
-1
0
1
2
3
4
2wks 4wks 8wks 12wks 16wks 24wks
AL
SF
RS
-R L
S m
ea
n c
ha
ng
e in
slo
pe
MSC-NTF Placebo
Change from post-treatment to pre-treatment slopeA
-2
-1
0
1
2
3
4
2wks 4wks 8wks 12wks 16wks 24wks
MSC-NTF Placebo
Change from post-treatment to pre-treatment slope
*
*
B
0%
10%
20%
30%
40%
50%
60%
70%
80%
90%
2wks 4wks 8wks 12wks 16wks 24wks
% o
f p
ati
en
ts w
ith
≥1.5
po
ints
ch
an
ge
/mo
nth
MSC-NTF Placebo
*
C
0%
10%
20%
30%
40%
50%
60%
70%
80%
90%
2wks 4wks 8wks 12wks 16wks 24wks
MSC-NTF Placebo
*
D
*
C D
-2
-1
0
1
2
3
4
2wks 4wks 8wks 12wks 16wks 24wks
AL
SF
RS
-R L
S m
ea
n c
ha
ng
e in
slo
pe
MSC-NTF Placebo
Change from post-treatment to pre-treatment slopeA
-2
-1
0
1
2
3
4
2wks 4wks 8wks 12wks 16wks 24wks
MSC-NTF Placebo
Change from post-treatment to pre-treatment slope
*
*
B
0%
10%
20%
30%
40%
50%
60%
70%
80%
90%
2wks 4wks 8wks 12wks 16wks 24wks
% o
f p
ati
en
ts w
ith
≥1.5
po
ints
ch
an
ge
/mo
nth
MSC-NTF Placebo
*
C
0%
10%
20%
30%
40%
50%
60%
70%
80%
90%
2wks 4wks 8wks 12wks 16wks 24wks
MSC-NTF Placebo
*
D
*
All n = 46
MSC-NTF Placebo
Rapid progressors n =21
• Prespecified responder
analyses defined as a 20%–
30% improvement in post-
treatment slope compared to
pretreatment
• A higher proportion of
responders were observed in
the MSC-NTF cells group
compared to placebo at all
time points
• In the rapid progressors
subgroup, a higher proportion
of responders (≥1.5
points/month ALSFRS-R slope
improvement) were observed
in the MSC-NTF group
compared to the placebo group
at all time points
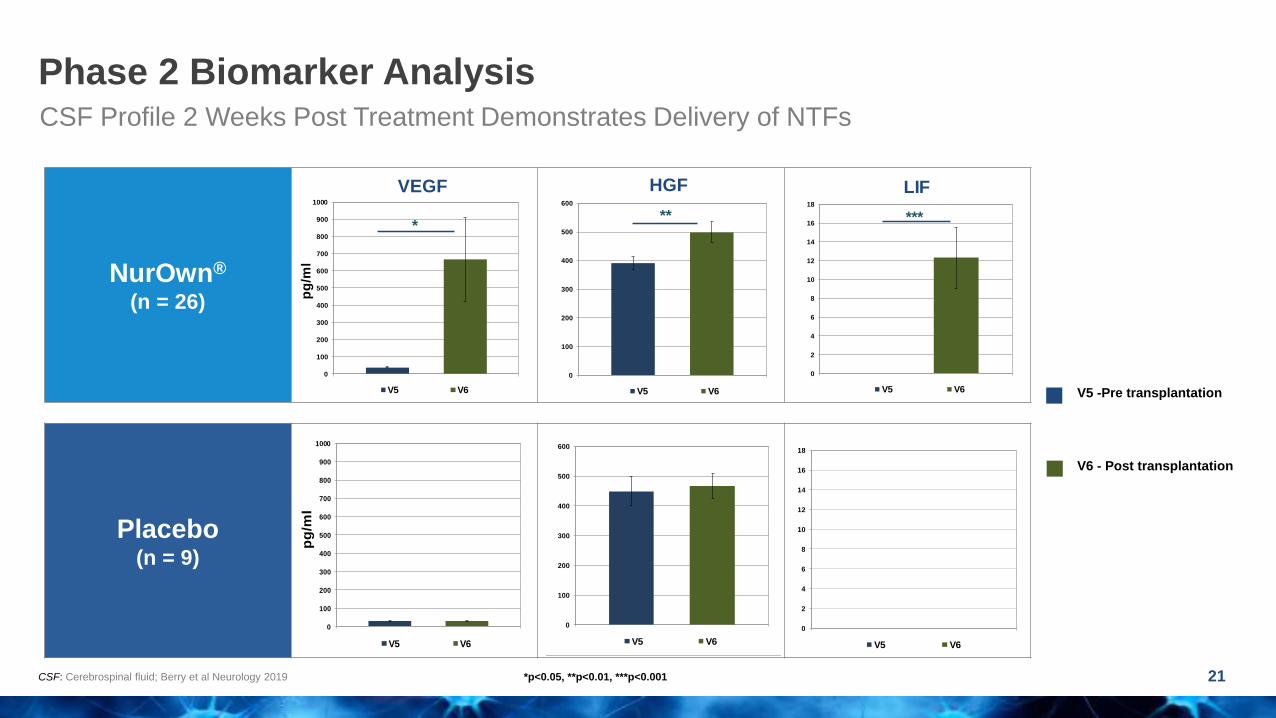
NurOwn®
(n = 26)
Placebo(n = 9)
Phase 2 Biomarker Analysis
21CSF: Cerebrospinal fluid; Berry et al Neurology 2019
CSF Profile 2 Weeks Post Treatment Demonstrates Delivery of NTFs
*p<0.05, **p<0.01, ***p<0.001
V5 -Pre transplantation
V6 - Post transplantation
0
100
200
300
400
500
600
700
800
900
1000
pg
/ml
VEGF
V5 V6
*
0
100
200
300
400
500
600
700
800
900
1000
pg
/ml
V5 V6
0
100
200
300
400
500
600
HGF
V5 V6
**
0
100
200
300
400
500
600
V5 V6
0
2
4
6
8
10
12
14
16
18
LIF
V5 V6
***
0
2
4
6
8
10
12
14
16
18
V5 V6
0
100
200
300
400
500
600
700
800
900
1000
pg
/ml
VEGF
V5 V6
*
0
100
200
300
400
500
600
700
800
900
1000
pg
/ml
V5 V6
0
100
200
300
400
500
600
HGF
V5 V6
**
0
100
200
300
400
500
600
V5 V6
0
2
4
6
8
10
12
14
16
18
LIF
V5 V6
***
0
2
4
6
8
10
12
14
16
18
V5 V6
0
100
200
300
400
500
600
700
800
900
1000
pg
/ml
VEGF
V5 V6
*
0
100
200
300
400
500
600
700
800
900
1000
pg
/ml
V5 V6
0
100
200
300
400
500
600
HGF
V5 V6
**
0
100
200
300
400
500
600
V5 V6
0
2
4
6
8
10
12
14
16
18
LIF
V5 V6
***
0
2
4
6
8
10
12
14
16
18
V5 V6
0
100
200
300
400
500
600
700
800
900
1000
pg
/ml
VEGF
V5 V6
*
0
100
200
300
400
500
600
700
800
900
1000
pg
/ml
V5 V6
0
100
200
300
400
500
600
HGF
V5 V6
**
0
100
200
300
400
500
600
V5 V6
0
2
4
6
8
10
12
14
16
18
LIF
V5 V6
***
0
2
4
6
8
10
12
14
16
18
V5 V6
0
100
200
300
400
500
600
700
800
900
1000
pg
/ml
VEGF
V5 V6
*
0
100
200
300
400
500
600
700
800
900
1000
pg
/ml
V5 V6
0
100
200
300
400
500
600
HGF
V5 V6
**
0
100
200
300
400
500
600
V5 V6
0
2
4
6
8
10
12
14
16
18
LIF
V5 V6
***
0
2
4
6
8
10
12
14
16
18
V5 V6
0
100
200
300
400
500
600
700
800
900
1000
pg
/ml
VEGF
V5 V6
*
0
100
200
300
400
500
600
700
800
900
1000
pg
/ml
V5 V6
0
100
200
300
400
500
600
HGF
V5 V6
**
0
100
200
300
400
500
600
V5 V6
0
2
4
6
8
10
12
14
16
18
LIF
V5 V6
***
0
2
4
6
8
10
12
14
16
18
V5 V6
NurOwn®
(n = 26)
Placebo(n = 9)
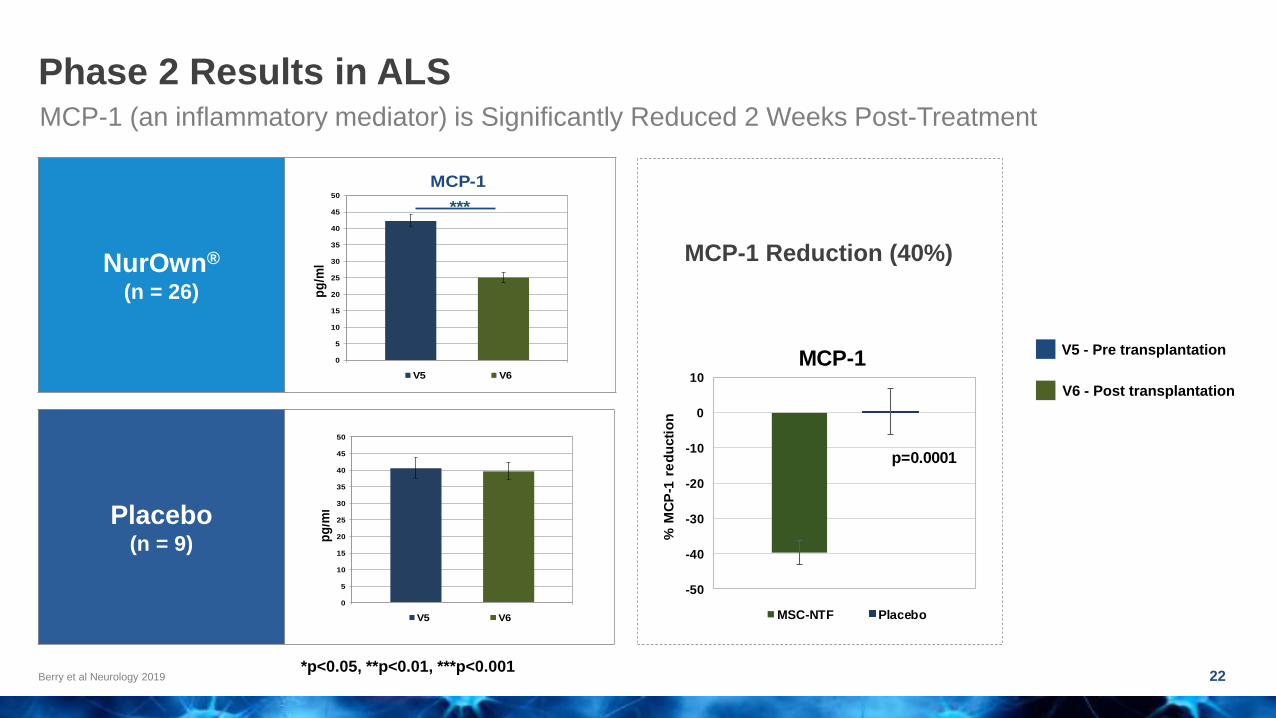
Phase 2 Results in ALS
22Berry et al Neurology 2019
MCP-1 (an inflammatory mediator) is Significantly Reduced 2 Weeks Post-Treatment
*p<0.05, **p<0.01, ***p<0.001
0
5
10
15
20
25
30
35
40
45
50
pg
/ml
MCP-1
V5 V6
***
0
5
10
15
20
25
30
35
40
45
50
pg
/ml
V5 V6
0
50
100
150
200
250
SDF-1
V5 V6
**
0
50
100
150
200
250
V5 V6
0
5,000
10,000
15,000
20,000
25,000
30,000
35,000
40,000
45,000
50,000CHIT-1
V5 V6
*
0
5,000
10,000
15,000
20,000
25,000
30,000
35,000
40,000
45,000
50,000
V5 V6
V5 - Pre transplantation
V6 - Post transplantation
-50
-40
-30
-20
-10
0
10
% M
CP
-1 r
ed
ucti
on
MCP-1
MSC-NTF Placebo
p=0.0001
-60
-50
-40
-30
-20
-10
0
10
20
30
40
% C
asp
ase
-3 r
ed
ucti
on
Caspase-3
MSC-NTF Placebo
p=0.096
-50
-40
-30
-20
-10
0
10
% S
DF
-1 r
ed
ucti
on
SDF-1
MSC-NTF Placebo
p=0.001
MCP-1 Reduction (40%)
0
5
10
15
20
25
30
35
40
45
50
pg
/ml
MCP-1
V5 V6
***
0
5
10
15
20
25
30
35
40
45
50
pg
/ml
V5 V6
0
50
100
150
200
250
SDF-1
V5 V6
**
0
50
100
150
200
250
V5 V6
0
5,000
10,000
15,000
20,000
25,000
30,000
35,000
40,000
45,000
50,000CHIT-1
V5 V6
*
0
5,000
10,000
15,000
20,000
25,000
30,000
35,000
40,000
45,000
50,000
V5 V6

Phase 2 CSF Biomarker Results in ALS
23Berry et al Neurology 2019; Nagata Neurol Res 2007
Post-Treatment CSF MCP-1 Shows Inverse Correlation with CSF VEGF and with ALSFRS-R slope improvement
CSF MCP-1 inverse
correlation with
CSF VEGF
CSF MCP-1 inverse
correlation with
ALSFRS-R Slope
Improvement
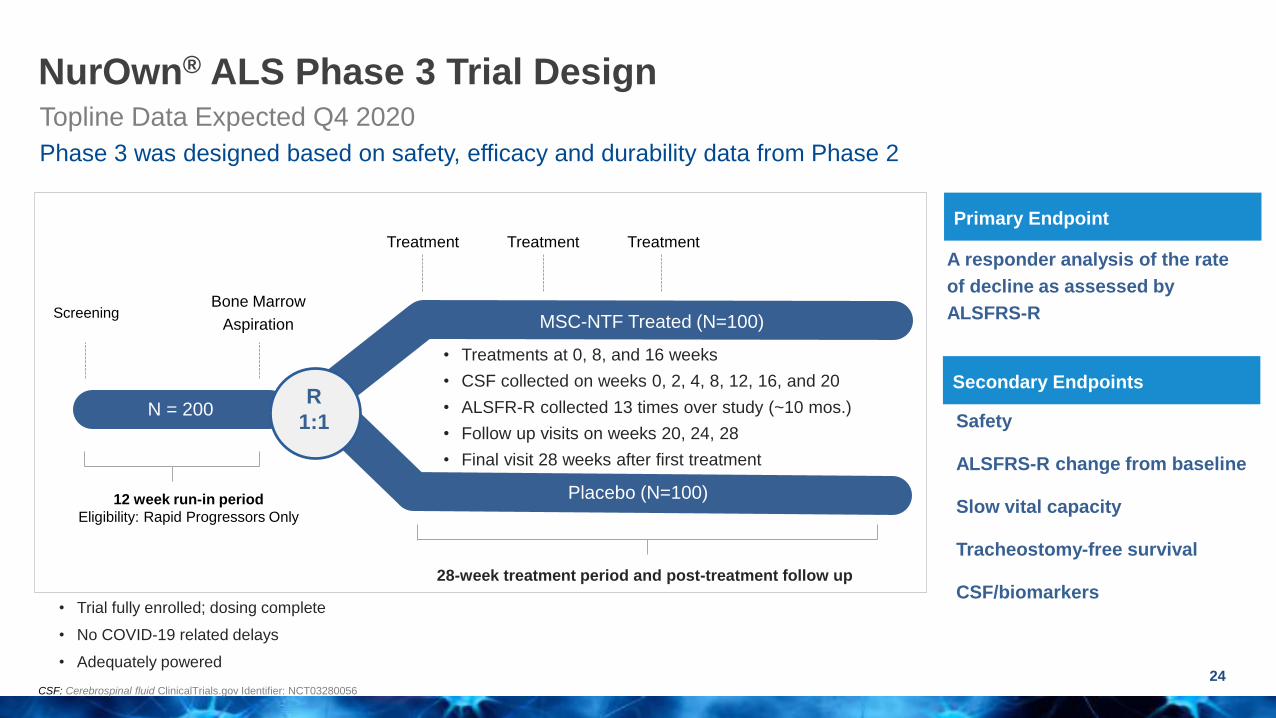
• Trial fully enrolled; dosing complete
• No COVID-19 related delays
• Adequately powered
NurOwn® ALS Phase 3 Trial Design
24CSF: Cerebrospinal fluid ClinicalTrials.gov Identifier: NCT03280056
Topline Data Expected Q4 2020
Phase 3 was designed based on safety, efficacy and durability data from Phase 2
Treatment
(0,8,16 weeks)
3 doses
R3:1
12 week run-in period
Eligibility: Rapid Progressors Only
Bone Marrow
Aspiration
• Treatments at 0, 8, and 16 weeks
• CSF collected on weeks 0, 2, 4, 8, 12, 16, and 20
• ALSFR-R collected 13 times over study (~10 mos.)
• Follow up visits on weeks 20, 24, 28
• Final visit 28 weeks after first treatment
N = 200
Treatment
Placebo (N=100)
MSC-NTF Treated (N=100)
R
1:1 Safety
ALSFRS-R change from baseline
Slow vital capacity
Tracheostomy-free survival
CSF/biomarkers
Primary Endpoint
Secondary Endpoints
A responder analysis of the rate
of decline as assessed by
ALSFRS-R
28-week treatment period and post-treatment follow up
Treatment Treatment
Screening
25
25
27
29
31
33
35
37
39
0 10 20 30 40
Patient 2 (Placebo)
Pre-trt.
Post-trt.
Pre-trt. projection
25
27
29
31
33
35
37
39
0 10 20 30 40
Patient 1 (NurOwn®)
Pre-trt.
Post-trt.
Pre-trt. projection
AL
SF
RS
-R
Weeks from Screening
Weeks from Screening
Pre-treatment Post-treatment
Pre-treatment Post-treatment
Slope = -0.57
Slope = 0.4
Slope = -1.08
Slope = -1.05
AL
SF
RS
-R
Patient TreatmentPre-trt
Slope
Post-trt
Slope
Diff. in Post
vs. Pre-trt
Slope
Responder
(Diff. 1.25)
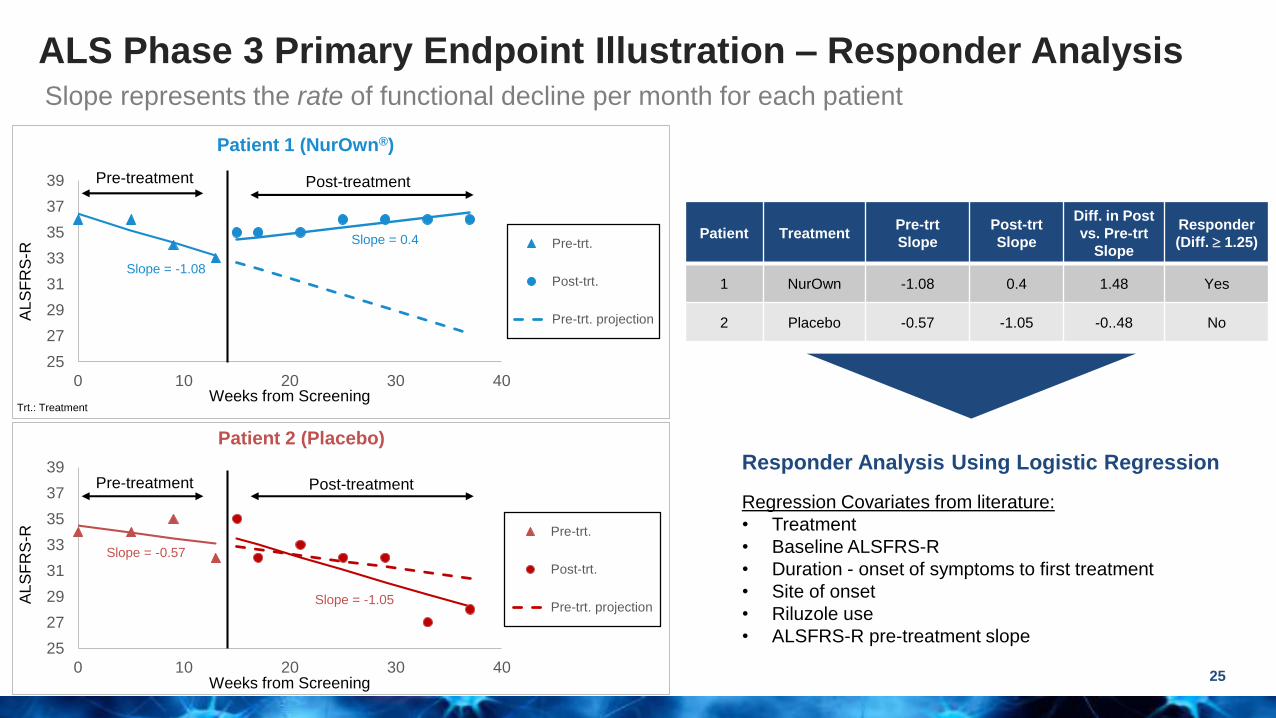
1 NurOwn -1.08 0.4 1.48 Yes
2 Placebo -0.57 -1.05 -0..48 No
Responder Analysis Using Logistic Regression
Regression Covariates from literature:
• Treatment
• Baseline ALSFRS-R
• Duration - onset of symptoms to first treatment
• Site of onset
• Riluzole use
• ALSFRS-R pre-treatment slope
Trt.: Treatment
Slope represents the rate of functional decline per month for each patient
ALS Phase 3 Primary Endpoint Illustration – Responder Analysis

Manufacturing Sites
City of Hope Center for Biomedicine &
Genetics
Dana-Farber Harvard Cancer Center
Cell Manipulation Core
Treatment Centers
Phase 3 ALS Trial: Two Manufacturing Sites, Six Treatment Centers
26
NurOwn® for the Treatment of
Progressive Multiple Sclerosis

toxtoDisease and
Symptoms
Progressive neurological disorder with the brain’s inability to control one’s body. Symptoms include pain,
electric shock sensations, muscle weakness, trouble walking, vision problems, numbness, dizziness,
balance etc.
Life
Expectancy
5-10 years lower than average; diagnosis with progressive MS sets you on a lifelong journey with one or
more of the above listed symptoms
Prevalence
500,000 patients in the U.S.
1,250,000 patients globally
Women are more likely to be diagnosed with MS than men
Current
Treatment
Progressive MS is less studied with only one approved drug - Ocrelizumab (Ocrevus)
• Ocrevus reduces disability from getting worse on average by 25% vs placebo which shows the
remaining high unmet need and need for additional treatments
• Ocrevus is an immunosuppressor: Increases the risk of infection and increases risk of cancer in a
smaller proportion of patients
• Several other chemotherapeutic agents available, but have significant toxic side-effects
Progressive MS: High Unmet Medical Need
28Sources: Multiple Sclerosis: Facts, Statistics, and You, https://www.healthline.com/health/multiple-sclerosis/facts-statistics-infographic#1); National Multiple Sclerosis Society https://www.nationalmssociety.org/
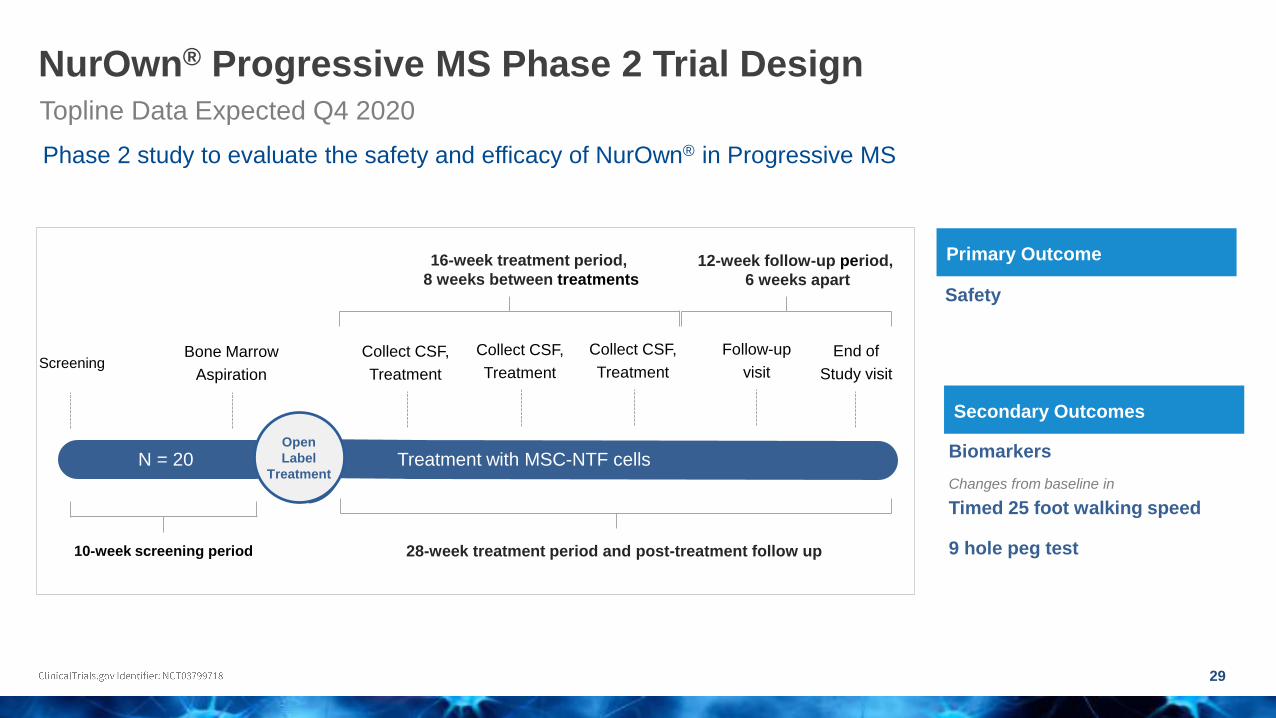
NurOwn® Progressive MS Phase 2 Trial Design
29
Topline Data Expected Q4 2020
Phase 2 study to evaluate the safety and efficacy of NurOwn® in Progressive MS
28-week treatment period and post-treatment follow up
R3:1
10-week screening period
Bone Marrow
Aspiration
Collect CSF,
Treatment
N = 20Open
Label
Treatment
Biomarkers
Changes from baseline in
Timed 25 foot walking speed
9 hole peg test
Primary Outcome
Secondary Outcomes
Safety
Collect CSF,
Treatment
Collect CSF,
Treatment
16-week treatment period,
8 weeks between treatments
Follow-up
visit
End of
Study visit
12-week follow-up period,
6 weeks apart
Treatment with MSC-NTF cells
Screening
NurOwn® for the Treatment of
Prodromal to Mild Alzheimer’s Disease
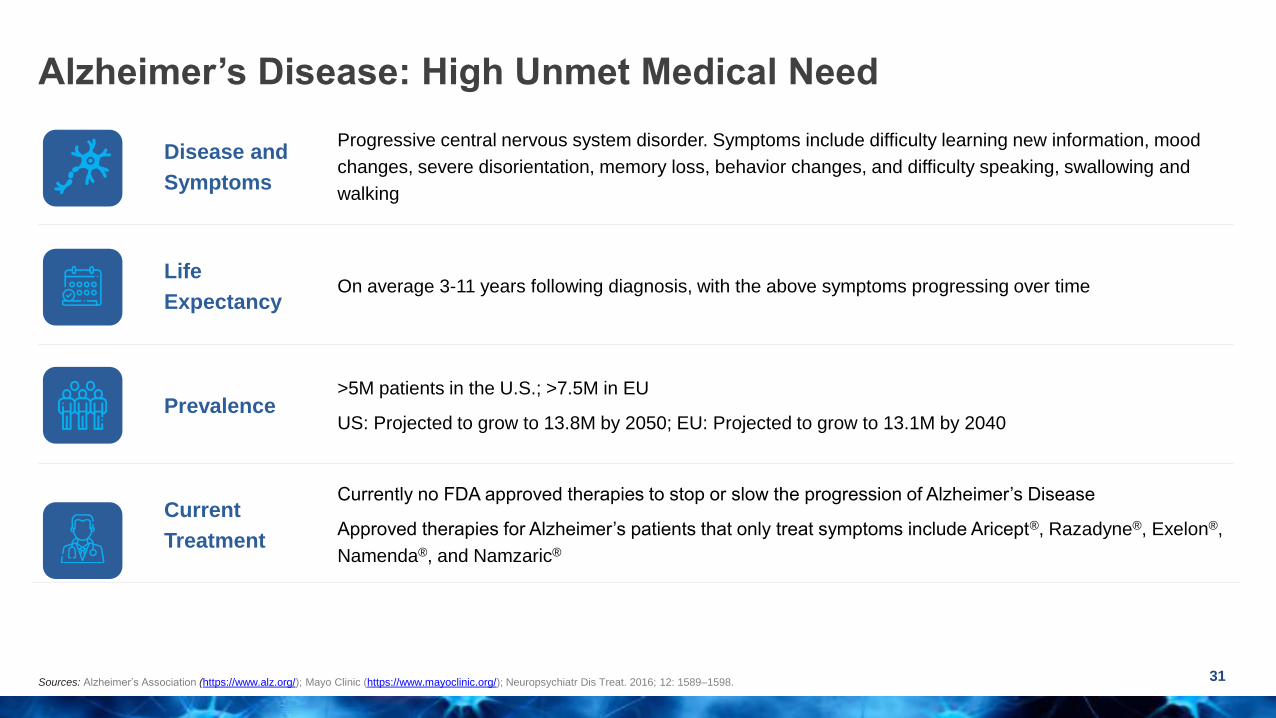
toxtoDisease and
Symptoms
Progressive central nervous system disorder. Symptoms include difficulty learning new information, mood
changes, severe disorientation, memory loss, behavior changes, and difficulty speaking, swallowing and
walking
Life
ExpectancyOn average 3-11 years following diagnosis, with the above symptoms progressing over time
Prevalence>5M patients in the U.S.; >7.5M in EU
US: Projected to grow to 13.8M by 2050; EU: Projected to grow to 13.1M by 2040
Current
Treatment
Currently no FDA approved therapies to stop or slow the progression of Alzheimer’s Disease
Approved therapies for Alzheimer’s patients that only treat symptoms include Aricept®, Razadyne®, Exelon®,
Namenda®, and Namzaric®
Alzheimer’s Disease: High Unmet Medical Need
31Sources: Alzheimer’s Association (https://www.alz.org/); Mayo Clinic (https://www.mayoclinic.org/); Neuropsychiatr Dis Treat. 2016; 12: 1589–1598.

NurOwn® induced decrease in MCP-1 may address AD pathology
32
Single NurOwn treatment decreased CSF MCP-1 by 40% in Phase 2 ALS study
Increased CSF MCP-1 correlates with cognitive declineCSF MCP-1 is increased in AD1
MCP-1 in CSF (pg/mL)
An
nu
al
Dec
rease in
MM
SE
Sc
ore
NurOwn® treatment decreases CSF MCP-1, which increases with disease severity in AD patients
An
nu
al
Dec
rease in
MM
SE
Sc
ore
MCP-1 in CSF
AD: Alzheimer’s disease; ADAS: Alzheimer’s disease assessment scale; CSF: Cerebrospinal fluid; MMSE: Mini-mental state exam; MCP-1: Monocyte chemoattractant protein-1; Sources: 1. PLoS One 2012, 7(1):e30525.

miR-132 is
downregulated in
AD1
Decreased miR-
132 correlates
with AD Severity2
NurOwn® delivery of miR-132 may address the pathology of AD
33AD: Alzheimer’s disease; NCI: No cognitive impairment; AD-MCI: Mild cognitive impairment due to Alzheimer’s disease; FC: Fold change Sources: 1. Front Neurosci. 2019; 13: 1208; 2. Sci Rep. 2018; 8: 8465.
3. Stem Cell Res Ther. 2017 Nov 7; 8(1):249.
NurOwn MSC-NTF cells express and deliver miR-132, which is downregulated in AD
Lo
g2
F
old
Ch
an
ge
o
f m
ir-1
32
-3p
NCI AD-MCI AD
miR
-13
2E
xp
res
sio
n (
2-
ct )
ADAS Score
Phase 2 ALS:
Single NurOwn
treatment
increased CSF
miR-132 in
responders
miR-132 is
upregulated in
MSC-NTF cells3
MSC MSC-NTF
No
rma
lize
d R
ela
tive
Q
ua
nti
les
miR-132-3p Expression
FC = +4.06

Phase 2 AD trial enrollment will be driven by biomarkers
Biomarker driven approach facilitates patient selection and improves chances of trial success
Trial biomarkers are predictive of clinical declineCSF amyloid and tau are linked to cognitive decline in AD
CSF: Cerebrospinal fluid; MMSE: Mini-mental state exam; Source: Sci. Rep. 2019 Dec 13;9(1):19024.

Rationale for NurOwn® in Alzheimer’s
35
*p<0.05CSF: Cerebrospinal fluid; MCP-1/CCL2: Monocyte chemoattractant protein 1/Chemokine (C-C motif) ligand 2
• Targeting neuroinflammation offers an exciting and not yet
fully evaluated therapeutic approach in Alzheimer’s disease
• Robust effect on CSF biomarkers in Phase 2 ALS study
▪ Robust effect on MCP-1/CCL2
o MCP-1/CCL2 is associated with faster clinical progression
▪ Increased neurotrophic factors in CSF
▪ Increased miR-132 in CSF
o Lower miR-132 correlates with reduced cognition
• Strong and consistent safety profile from 10 years in ALS

Principal Investigator French National Coordinator
Philip Scheltens, MD, PhD (Principal Investigator)
Professor of Cognitive Neurology: Amsterdam UMC
Director of the Alzheimer Centre: Amsterdam UMC
Extensive experience as PI of international AD trials
Bruno Dubois, MD, PhD
Professor of Neurology: Salpétrière University Hospital
President: Scientific Committee of France-Alzheimer
President: International Fund Raising for Alzheimer's Disease
36
Phase 2 AD Trial: Led by Two World Renowned Investigators
PI: Principal investigator

37
42-week treatment period and post-treatment follow up
R3:1
10-week run-in
Bone Marrow
Aspiration
Collect CSF,
Treatment
N = 40Open
Label
Treatment
To evaluate the modulation of
CSF and blood biomarkers
To evaluate clinical outcomes
measures to assess efficacy
(cognition and function)
Primary Objective
Secondary Objectives
To evaluate safety and
tolerability of 3 intrathecal
administrations of
MSC-NTF cellsCollect CSF,
Treatment
Collect CSF,
Treatment
16-week treatment period,
8 weeks between treatments
In person
Visit
In person
Visit
26-week follow-up period,
12 & 14 weeks apart
Treatment with MSC-NTF cells
Clinical outcome measures: Cognition and activities of daily livingClinical Dementia Rating Scale, Sum of Boxes
Neuropsychological Test Battery
Mini Mental State Examination
Amsterdam Instrumental Activities of Daily Living Questionnaire - Short Version
Biomarkers: paired serum and CSF samples
Neurotrophic, neurodegenerative and inflammatory factors
Markers associated with amyloid deposition
Markers of tau protein levels
BCT-201-EU, AD Phase 2a Trial Design52 week clinical trial
CSF: Cerebrospinal fluid

Brainstorm Cell Therapeutics NASDAQ: BCLIwww.brainstorm-cell.comLinkedinTwitter