brain food - environmental working group
TRANSCRIPT

What women should know aboutmercury contamination of fish
W O R K I N G G R O U P T M
E N V I R O N M E N T A L
Jane HoulihanRichard Wiles
Jeremiah BaumannJulie Wolk
BRAIN FOOD

AcknowledgmentsThis report was written by Jane Houlihan and Richard Wiles of the Environmental Working Group and Julie
Wolk and Jeremiah Baumann of the U.S. Public Interest Research Group Education Fund, with research contribu-tions from Graham Porell. Thanks to John Coequyt and Chris Campbell for their assistance on report production.This report was reviewed by Philip J. Landrigan, MD, M.Sc., Director of the Center for Children’s Health and theEnvironment of the Mount Sinai School of Medicine, J. Routt Reigart, II MD of the Medical University of SouthCarolina, and Robert A. Goyer, MD, Chair, Committee on the Toxicological Effects of Mercury, National ResearchCouncil 1999 - 2000.
This report was made possible by a grant from The Pew Charitable Trusts. Environmental Working Group alsoused funding from W. Alton Jones, the Joyce Foundation, and the Turner Foundation. The U.S. PIRG EducationFund's toxics, right-to-know, and other environmental health programs are additionally supported by the BaumanFoundation and the Beldon Fund. The opinions expressed in this report are those of the authors and do not nec-essarily reflect the views of funders.
Copyright © April 2001 by Environmental Working Group. All rights reserved. Manufactured in the UnitedStates of America. Printed on recycled paper.
Environmental Working Group
The Environmental Working Group (EWG) is a nonprofit environmental research organization based in Wash-ington, D.C. Through analysis of government and private sector databases, environmental monitoring programs,and scientifically grounded research, EWG develops high-profile publications, computer databases and Internetresources that consistently create public awareness and concern about high priority environmental problems andsolutions.
Kenneth A. Cook, PresidentRichard Wiles, Senior Vice PresidentMike Casey, Vice President for Public AffairsAnne Keys, Vice President for Policy
U.S. PIRG Education Fund and the State PIRGs
The U.S. PIRG Education Fund is the research and public education center for the U.S. Public Interest ResearchGroup (U.S. PIRG), the national advocacy office of the State PIRGs. The State PIRGs are a nationwide network ofnonprofit, nonpartisan, state-based public interest advocacy organizations. Through U.S. PIRG and the U.S. PIRGEducation Fund, they promote a national agenda of environmental and consumer protection and good govern-ment.
Gene Karpinski, Executive DirectorLiz Hitchcock, Communications DirectorKimberly Larson, Assistant Field DirectorJeremiah Baumann, Environmental Health AdvocateJulie Wolk, Environmental Health Associate
To order a copy
Copies of this report may be ordered for $25.00 each (plus 6% sales tax or $1.50 for Washington, DC residents)and $3.00 for postage and handling. Payment must accompany all orders. Please make checks payable to either:
Environmental Working Group U.S. PIRG Education Fund1718 Connecticut Avenue, N.W. Suite 600 218 D St. SEWashington, D.C. 20009 Washington, DC 20003(202) 667-6982 (phone)(202) 232-2592 (fax)

Contents
Brain Food
Foreword ......................................................................................... i
Executive Summary ......................................................................... 1
Introduction .................................................................................... 9
Chapter 1: Health Effects of Mercury ............................................ 11
Chapter 2: Inadequate Government Protections from Mercury in Fish ................................................... 17
Chapter 3: The Fish we Eat ........................................................... 25
Chapter 4: The Chaotic Web of State Mercury Advisories ............ 33
Chapter 5: Health Tracking Recommendations ............................ 39
Appendix A: Exposure Assessment Methodology.......................... 41
Appendix B: State Survey Method ................................................ 49
Appendix C: Notes on Individual Fish Species ............................. 51
Appendix D: State Survey Results ................................................. 61
References .................................................................................... 64

iENVIRONMENTAL WORKING GROUP AND THE STATE PIRGS
Foreword
Brain Food
Fish is beyond compare as asource of many nutrients vital tothe developing infant, some ofwhich may actually enhancedevelopment of the nervoussystem in babies and youngchildren.
Widespread contamination offish with toxic mercury, how-ever, has cast a shadow over thenutritional benefits of fish.
Exposure to mercury in thewomb can cause learning defi-cits, delay the mental develop-ment of children, and causeother neurological problems.Mercury consumed by a preg-nant woman through contami-nated fish can cross her placentato damage the brain of her baby.As a National Academy of Sci-ences panel definitively warnedlast year, some children exposedin utero by their mothers’ fishconsumption are at risk of fallingin the group of children "whohave to struggle to keep up inschool and who might requireremedial classes of specialeducation.”
Combustion in power plantsof coal containing mercury is themajor source of environmentalpollution. Mercury pollutionfrom coal-fired power plants
moves through the air, is depos-ited in water and finds its wayinto fish, accumulating especiallyin fish that are higher up the foodchain. Fish like tuna, sea bass,marlin and halibut show some ofthe worst contamination, butdozens of species and thousandsof water bodies have been seri-ously polluted.
As a result, women who eat alot of fish during pregnancy, oreven as little as a single serving ofa highly contaminated fish, canexpose their developing child toexcessive levels of mercury. Thetoxic metal can cross the placentato harm the rapidly developingnervous system, including thebrain.
In this report, EWG researchersfor the first time attempt to char-acterize just how common suchexposures are in the U.S. popula-tion, and the associated risks.One key to the analysis is a muchmore refined representation ofdifferences among women – theirsize, metabolism of mercury,blood volume, and many otherbiological variables. Governmentassessments use “averages” orconstants for all of these factors,missing profound differencesacross the population of womenof child bearing age.
ii BRAIN FOOD
EWG analysts also assembledthe most extensive database everdeveloped on mercury levels invarious species of fish, drawingon federal, state and other gov-ernment sources, some 56,000records in all. That exerciserevealed major variations inmercury contamination acrossfish species, yielding vital, highlypractical information women canuse while pregnant to reducemercury exposure dramatically,while still enjoying the nutritionalbenefits of fish. Earlier this year,the Food and Drug Administra-tion came up with its own list offish that pregnant and nursingwomen, along with infants,should avoid. Based on ouranalysis of much more extensivefish contamination records, thelist presented in this report ismore complete.
By analyzing these two datasources in combination, the studyis able to provide new insightsinto how women can avoidexcessive mercury exposuresduring pregnancy.
Researchers at U.S. PIRGEducation Fund, co-authors ofthis study, made another vitalcontribution. PIRG painstakinglycombed through hundreds of“fish advisories” issued by stateagencies to warn people aboutmercury levels in sport and gamefish in literally thousands of U.S.lakes and rivers. What theyfound is disturbing: while somestates are doing a better job thanothers, virtually no fish advisoriesfor mercury contamination areadequately protective of human
health when judged againstcurrent scientific knowledge.
The importance of this newunderstanding about mercuryrisks was evidenced in a land-mark study on blood levels ofmercury and other toxins, re-leased by the federal Centers forDisease Control and Prevention(CDC) in March, 2001. While“average” blood mercury levelsamong women were not ofconcern, the data indicate that infully 10 percent of Americanwomen ––roughly 7 millionwomen––mercury levels wereabove the dose that may put afetus at risk for adverse nervoussystem effects. Those womensurely don’t need more mercuryin their system, least of all if theyare already pregnant or nursing.As this report recommends, thegovernment must start monitoringsuch exposures, and any possibleeffects, much more energetically.This is a simple, common sensematter of public health.
In the longer term, the solutionis to halt mercury pollution fromcoal-burning power plants andother sources so the contamina-tion of fish is avoided in the firstplace. Fuel switching––from coalto renewable energy sources––along with aggressive deploy-ment of conservation measures,makes sense for any number ofreasons. Fish free of mercury—the way they used to be—is justanother one.
Kenneth A. CookPresidentEnvironmental Working Group

1ENVIRONMENTAL WORKING GROUP AND THE STATE PIRGS
Executive Summary
Brain Food
On January 12, 2001, governmenthealth officials issued new advisorieswarning women to limit fish con-sumption during pregnancy to avoidexposing their unborn children tounsafe levels of methylmercury.Methylmercury can cross the pla-centa and cause learning deficits anddevelopmental delays in childrenwho are exposed even to relativelylow levels in the womb. The princi-pal exposure route for the fetus isfish consumption by the mother.
The Food and Drug Administra-tion (FDA), which regulates commer-cially sold fish, recommends thatpregnant and nursing women andyoung children not eat any shark,swordfish, tilefish, or king mackerel,but then recommends 12 ounces perweek of any other fish. The Envi-ronmental Protection Agency (EPA),which makes recommendations tostates about safe mercury levels insport fish, allows up to 8 ounces ofany fish per week for pregnantwomen with no prohibitions onconsumption of any individual fishcaught recreationally.
These restrictions are steps in theright direction, but they need to betightened significantly to adequatelyprotect women and their unbornchildren from the toxic effects ofmethylmercury.
The nutritional benefits of fishcomplicate the task faced by health
officials when protecting the publicfrom methylmercury. Protein,omega-3 fatty acids, Vitamin D, andother nutrients make fish an excep-tionally good food for pregnantmothers and their developing babies.At the same time, there is no doubtthat methylmercury is toxic to thefetal brain and nervous system, andthat many beneficial fish species arecontaminated. EPA’s safe exposureestimate for methylmercury hasdropped twice in the past 16 years,as new science has identified adverseeffects in children exposed in thewomb at lower and lower doses.Emerging evidence indicates that thesafe dose may drop even lower inthe future (NAS 2000). Just how longa fetus can tolerate a dose of meth-ylmercury above a “safe level” withno observable adverse effects is amatter of ongoing debate.
Compounding this uncertainty isthe lack of effective education andoutreach to pregnant women aboutmethylmercury risks and the neartotal absence of information forpregnant women on the levels ofmercury in the fish they buy. Newdata from the Centers for DiseaseControl and Prevention (CDC) showthat about 10 percent of all womenof childbearing age have bloodmethylmercury levels above the dosethat may put their fetus at risk foradverse neurological effects (CDC2001). If these women were toincrease their consumption of certain
New data from theCenters for DiseaseControl andPrevention (CDC)show that about 10percent of all womenof childbearing agehave bloodmethylmercury levelsabove the dose thatmay put their fetus atrisk for adverseneurological effects.
If these women wereto increase theirconsumption ofcertain fish species inhopes of benefitingtheir babies duringpregnancy, they couldexpose their fetuses topotentially hazardouslevels ofmethylmercury.

2 BRAIN FOOD
fish species in hopes of benefitingtheir babies during pregnancy, theycould expose their fetuses to poten-tially hazardous levels of methylmer-cury.
FDA’s protections fall short
FDA’s methylmercury safeguardsare designed to protect an average-sized woman eating an average fishcontaminated with an averageamount of methylmercury that decaysin her body at an average rate.These assumptions rarely apply to therisks faced by any individual. In-stead, risks are unevenly distributedthroughout the population, with asmall but significant number ofpregnancies exposed to far higherand potentially unsafe levels ofmethylmercury than the averagefetus. The 10 percent most-heavilyexposed American women alreadyhave blood methylmercury levels thatwould increase health risks to theirfetuses if they became pregnant (CDC2001). FDA’s health advisory, basedon average exposures, does little toprotect these children.
The Environmental WorkingGroup assessed fetal exposure tomethylmercury taking into account ahost of real world differences inindividual exposure, including amother’s body weight and bloodvolume, varying methylmercuryabsorption and distribution rates, andvariable rates of methylmercurydecay in different pregnant women(Stern 1997, CDC 2001, NAS 2000).These biological differences werematched up with a unique databaseof fish contamination that contains56,000 records of methylmercury testresults from seven different govern-ment sources. Fish consumption, fishcontamination levels, and biologicalvariables were matched thousands of
times to create a distribution ofblood methylmercury levels inwomen similar to that occurring inthe general population.
This distribution was comparedto the benchmark dose of methylm-ercury recommended by the Com-mittee on the Toxicological Effectsof Methylmercury of the NationalAcademy of Sciences (NAS 2000).
Conclusions
EWG’s analysis shows that:
• FDA’s recommendation of 766-ounce fish meals duringpregnancy could actually bedetrimental to the health ofunborn children. Fish are animportant part of a healthydiet and women should beencouraged to eat fish withlow methylmercury levelsduring pregnancy. But ifAmerican women ate a varieddiet of FDA’s recommended12 ounces of fish a week (andnone of the four prohibitedfish) they would expose morethan one-fourth of all babiesborn each year (1 millioninfants) to a potentiallyharmful dose of methylmer-cury for at least one monthduring pregnancy. About20,000 of these childrenwould be exposed to a doseof methylmercury that in-creases the risk of adverseneurological effects for theentire pregnancy.
The EPA and state fish advisoriesfor sport fish
EPA provides guidance on safemethylmercury exposure levels to
FDA’s methylmercurysafeguards aredesigned to protect anaverage-sized womaneating an average fishcontaminated with anaverage amount ofmethylmercury thatdecays in her body atan average rate.These assumptionsrarely apply to therisks faced by anyindividual.

3ENVIRONMENTAL WORKING GROUP AND THE STATE PIRGS
state officials who in turn issueconsumption advisories for sportfish caught by recreational anglers.State authorities typically post fishadvisories for individual waterbodies where fish are contaminatedwith methylmercury at a level thatthey deem unsafe for women ofchildbearing age.
Some states have done a betterjob than others in protecting theirpopulations from methylmercury,but an analysis by U.S. PIRG andthe State PIRGs shows that onlyMassachusetts has adopted healthsafeguards that protect all womenand children.
The broader issue with recre-ational fish, however, is whetherthese advisories translate intoconscious choices by pregnantmothers to avoid eating contami-nated fish. There is a substantialbody of evidence indicating thatthey do not (Golden et al 2001).
Recommendations
Fish provide important healthbenefits to the developing fetus, andpregnant women should be encour-aged to eat fish with consistentlylow methylmercury levels. With toomany species, however, thesenutritional pluses are outweighed bythe hazards of methylmercury.
Federal health authorities need totake much stronger steps to protecta far greater portion of the popula-tion. They must move beyond theirantiquated safeguards designed toprotect an average woman from anaverage amount of methylmercuryin fish and take a realistic andprotective stance against dietaryexposure to methylmercury.
Fish advisories
FDA
There are three ways that theFDA methylmercury health advisorymust be improved:
1. The list of fish to avoid duringpregnancy must be expanded. Byadvising against the consumption ofjust four types of fish, FDA allowsheavy consumption of many fishthat have unacceptably highmethylmercury levels. To protectwomen and their babies frommethylmercury, the FDA must addthe following species to the list ofseafood that should not be eaten bypregnant women, nursing women,and women considering pregnancy:
Tuna steaksSea bassOysters (Gulf of Mexico)MarlinHalibutPikeWalleyeWhite croakerLargemouth bass
While not every serving of any ofthese fish is contaminated withdangerous levels of methylmercury,the odds are greater than one in1,000 that consumption of a singlemeal of these fish will expose thefetus to a potentially hazardousamount of methylmercury for longerthan 30 days.
2. FDA’s recommendation thatpregnant women eat 12 ounces aweek of any fish (except the fourthat are not allowed) must beradically revised. Ten percent ofAmerican women enter pregnancywith elevated methylmercury levels,and current FDA safeguards, which
If American womenate a varied diet ofFDA’s recommended12 ounces of fish aweek (and none of thefour prohibited fish)they would exposemore than one fourthof all fetuses (onemillion babies) to apotentially harmfuldose ofmethylmercury for atleast one monthduring pregnancy.
The issue withrecreational fish iswhether advisoriestranslate intoconscious choices bypregnant mothers toavoid eatingcontaminated fish.There is a substantialbody of evidenceindicating that they donot.

4 BRAIN FOOD
are based on average exposures, doalmost nothing to protect these highexposure pregnancies. If thesewomen follow FDA’s advice of 12ounces of any fish a week, theycould easily expose their fetuses toa level of methylmercury thatpresents a real risk of adverseneurological effects. To protectwomen and children, FDA mustrestrict consumption of the follow-ing fish to no more than one mealper month, for all species combined:
Canned tunaMahi mahiBlue musselsEastern oysterCodPollockSalmon from the Great LakesBlue crab from the Gulf of
MexicoChannel catfish (wild)Lake whitefish
3. Women who want to eat fishduring pregnancy must have infor-mation about which species areleast contaminated with methylmer-cury. Pregnant women have a rightto this information, and FDA has aduty to provide it. In addition tostrengthening restrictions on fishconsumption by pregnant women,FDA should promote the followingfish as safe options for pregnantwomen:
Trout (farmed)Catfish (farmed)Shrimp * (see sidebar)Fish SticksFlounder (summer)Salmon (wild Pacific)CroakerBlue crab (mid Atlantic)Haddock
Freshwater Sport Fish
It was not possible for EWG toassess the methylmercury risk fromevery recreational fish caught inevery lake in every state in thecountry. A review of the availabledata, however, shows that severallarge predator sport fish are souniversally contaminated that FDAshould add them to the list of fishthat women should completelyavoid during pregnancy. Afteranalyzing the results of more than10,000 samples from 792 lakes andrivers nationwide, we recommendthat FDA add the following speciesto thier health advisory: walleye,northern pike, and largemouth bass.While FDA has no authority toregulate methylmercury levels infreshwater fish, they do have aresponsibility to provide criticalhealth information to the public. It isimportant that women receive aconsistent message from one source,and the FDA is the appropriateagency to deliver this message.
Improve monitoring of fish formethylmercury contamination
A major flaw in FDA’s system isthe agency’s own lack of compre-hensive data on methylmercury infish. In January 2001, FDA recom-mended that pregnant women avoidconsumption of king mackerelbased on methylmercury levels froma study published in 1979. Thereare many other species where thedata on methylmercury contamina-tion are similarly outdated, butwhere the available informationindicates a potential problem.
FDA must immediately expand itsmethylmercury sampling program toinclude a host of fish where the data
Ten percent ofAmerican womenenter pregnancy withelevated mercurylevels, and currentFDA safeguards,which are based onaverage exposures, doalmost nothing toprotect these highexposure pregnancies.
5ENVIRONMENTAL WORKING GROUP AND THE STATE PIRGS
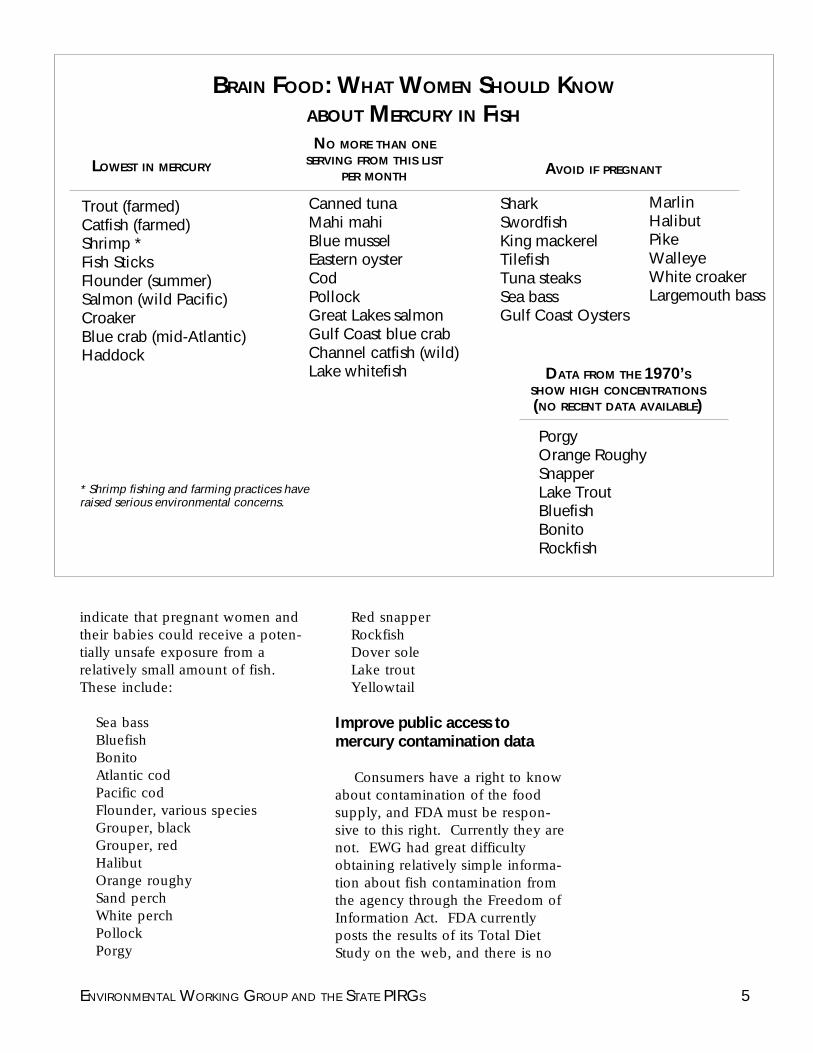
indicate that pregnant women andtheir babies could receive a poten-tially unsafe exposure from arelatively small amount of fish.These include:
Sea bassBluefishBonitoAtlantic codPacific codFlounder, various speciesGrouper, blackGrouper, redHalibutOrange roughySand perchWhite perchPollockPorgy
Red snapperRockfishDover soleLake troutYellowtail
Improve public access tomercury contamination data
Consumers have a right to knowabout contamination of the foodsupply, and FDA must be respon-sive to this right. Currently they arenot. EWG had great difficultyobtaining relatively simple informa-tion about fish contamination fromthe agency through the Freedom ofInformation Act. FDA currentlyposts the results of its Total DietStudy on the web, and there is no
BRAIN FOOD: WHAT WOMEN SHOULD KNOW
ABOUT MERCURY IN FISH
LOWEST IN MERCURY
SharkSwordfishKing mackerelTilefishTuna steaksSea bassGulf Coast Oysters
Canned tunaMahi mahiBlue musselEastern oysterCodPollockGreat Lakes salmonGulf Coast blue crabChannel catfish (wild)Lake whitefish
Trout (farmed)Catfish (farmed)Shrimp *Fish SticksFlounder (summer)Salmon (wild Pacific)CroakerBlue crab (mid-Atlantic)Haddock
NO MORE THAN ONESERVING FROM THIS LIST
PER MONTH AVOID IF PREGNANT
DATA FROM THE 1970’SSHOW HIGH CONCENTRATIONS(NO RECENT DATA AVAILABLE)
PorgyOrange RoughySnapperLake TroutBluefishBonitoRockfish
MarlinHalibutPikeWalleyeWhite croakerLargemouth bass
* Shrimp fishing and farming practices haveraised serious environmental concerns.

6 BRAIN FOOD
reason that all of the agency’smercury contamination informationcould not be posted as well.
Improve risk assessments
FDA needs to move beyond itsantiquated and biologically implau-sible risk assessment methodsbased on average people andaverage fish and adopt state-of-the-art risk assessment techniques thatprovide a much more realisticpicture of mercury exposure andrisk as it is distributed throughoutthe population.
It is not sufficient to protect thepopulation from average exposureswhen it is clear that many individu-als have far greater than averageexposures for extended periods oftime.
Reduce Mercury Pollution at itsSource
Mercury emissions from coal-fired power plants, the largest man-made source of environmentalmercury, are currently completelyunregulated. Federal decision-makers should require powerplants to reduce their mercurypollution by 90% and ultimatelymove away from polluting sourcesof power.
Monitor human exposure andhealth
The U.S. lacks a comprehensiveprogram to track disease andexposure to environmental con-taminants like methylmercury. Thisstudy is only one of many demon-strating the need for a nationwidecomprehensive environmentalhealth tracking network. Such a
network would be our country’sfirst step toward assessing impactsof a range of environmental haz-ards on public health. In addition,it would provide a wealth of infor-mation to health care providers andhealth officials working to protecthealth. Specific recommendationsinclude:
• The network should begin inall 50 states by tracking:asthma and chronic respira-tory diseases, birth defects,developmental and neuro-logical conditions like thoselinked to methylmercuryexposure, and cancers. Thetracking of human exposuresto hazards would start withpriorities including PCBs anddioxin; heavy metals such asmercury and lead, pesticides,and water and air contami-nants.
• An Early Warning Systemwould alert communities toimmediate health crises suchas heavy metal and pesticidepoisonings. Similar to themonitoring currently in placefor an outbreak of an infec-tious disease, this alert wouldhelp local communitiesidentify more quickly and actimmediately on health crisesfrom environmental expo-sures.
• Pilot Programs would allow20 different regional and stateinitiatives to investigate localenvironmental health priori-ties, provide flexibility forlocal officials, allow commu-nity groups to gather moreinformation and serve as amodel for potential inclusionin the nationwide network.
FDA mustimmediately post theresults of all of itsmethylmercury testingon the web.
FDA mustimmediately expandits methylmercurysampling program toinclude a host ofimportant fish wherethe data indicate thatpregnant women andtheir babies couldreceive a potentiallyunsafe exposure froma relatively smallamount of fish.

7ENVIRONMENTAL WORKING GROUP AND THE STATE PIRGS
• Federal, state and local rapidresponse capability wouldenable health officials toinvestigate clusters, outbreaksand emerging threats. Torespond effectively andprotect the public fromillness, health officials mustbe well-equipped and trained,and the network must besupported through state andfederal resources. Steps takento improve states’ capacityshould include placing anEnvironmental Health Investi-gator in every state andtraining health officials inenvironmental epidemiology.
• Support of community inter-ests and scientific researchwill be crucial to furtherhealth tracking efforts. FiveCenters of Excellence shouldbe federally funded forenvironmental health research
and training, and partneringwith communities. Communi-ties and the public have theright to know information thatcould improve their health;the information made avail-able through the trackingnetwork should be accessibleto the public. Input from localgroups on the design andimplementation of the track-ing and monitoring of chronicdisease and environmentalhazards will be needed toensure the success of theNationwide Health TrackingNetwork.
A nationwide comprehensiveenvironmental health trackingnetwork would be our country’s firststep toward assessing impacts of arange of environmental hazards onpublic health. In addition, it wouldprovide a wealth of information tohealth care providers and healthofficials working to protect health.

8 BRAIN FOOD
9ENVIRONMENTAL WORKING GROUP AND THE STATE PIRGS
Introduction
Power plants are contaminatingthe U.S. seafood supply
Nearly all of the coal burned inthe United States is contaminatedwith trace levels of merucry. As aresult, coal-fired power plants,municipal incinerators, industrialboilers, and medical waste combus-tors discharge more than 150 tonsof mercury into the atmosphereeach year (EPA 1997). Most of thismercury falls back down to theearth in rainwater, accumulating insediment and plants, and thenconcentrating up the food chain infish, other wildlife and ultimately, inpeople.
The top four sources of mercurypollution in the U.S. account fornearly 80 percent of total mercuryemissions. Coal-fired power plantstop the list, contributing 33 percentof the total emissions, but thispercentage is expected to rise in thenear future as the other sources ofmercury pollution are controlled.Utilities have escaped regulation ofmercury emissions due to specificexemptions in the Clean Air Act.Municipal waste combustors,commercial and industrial boilers,and medical waste incineratorscollectively contribute the remain-ing 47 percent of mercury emissionsfrom these top four sources (at 19,18, and 10 percent, respectively)(EPA 1997).
According to the National Acad-emy of Sciences (NAS), industrialmercury is responsible not only forpolluted waterways, but for wide-spread mercury exposure for hu-mans. According to the NAS Com-mittee on the Toxicological Effectsof Methylmercury, every year anestimated 60,000 children are bornat a significantly increased risk ofadverse neurological effects frommercury they were exposed to inthe womb when their mothers atefish contaminated with mercury(NAS 2000).
The damage from mercurypolluters is widespread, yet littlerecognized. More than two thou-sand (2,073) water bodies in 41states are polluted with mercury atlevels that compel health depart-ments to issue fish consumptionwarnings (EPA 2000). In 11 states,including Ohio, New Jersey, NorthCarolina, and Maine, mercurycontamination in fish across allwater bodies of the state is sopervasive that blanket, state-wideadvisories have been issued toprotect pregnant women and theirbabies. Four commercially soldspecies of marine fish are contami-nated with mercury at levels highenough that FDA tells pregnant andnursing women and young childrento avoid eating them altogether.These four -- swordfish, shark,tilefish, and king mackerel -- are
The damage frommercury polluters iswidespread, yet littlerecognized.
Brain Food

10 BRAIN FOOD
officially off the menu because ofthe damage mercury can cause tothe developing brain (FDA 2000).Beyond these four fish, many otherspecies routinely eaten by pregnantwomen are contaminated at levelsthat are potentially dangerous.
11ENVIRONMENTAL WORKING GROUP AND THE STATE PIRGS
Health Effects of Mercury
Chapter 1
When a pregnant woman eats aserving of mercury-contaminatedfish, methylmercury crosses theplacenta and enters her baby’sbrain within a matter of hours. It isstored there, where it blocks thenatural formation and migration ofnerve cells and slows the growth ofthe brain. There is no amount ofmercury known to be harmless.The only limiting factor in ourunderstanding of mercury’s toxicityis scientists’ ability to measure theeffects (subtle neurological deficitsfrom low-level exposures to mer-cury), like those of a baby in thewomb whose mother eats a tunafish sandwich once a week.
A mass poisoning in Minamata,Japan that began in the 1950sprovided the first evidence that thefetal brain is particularly sensitive tomethylmercury. Brain autopsiesfrom victims of the poisoningelucidated differences betweenadults and children. In adults, thebrain lesions caused by methylmer-cury were found to be concentratedin only a few areas of the brain. Inthe fetus, lesions were seen overnearly the entire cortex of thebrain. Babies died within days ofbirth from symptoms of methylmer-cury poisoning, while their motherswere free of symptoms.
The physical effects of highdoses of methylmercury on brain
structure are extensive. In 1965,scientists studied segments from thebrains of two children, ages 2.5 and6, among the victims of theMinamata poisoning. They foundthese brains abnormal, characterizedby a low brain cell density, clustersof brain cells growing outside thebrain, and incomplete electricalinsulation layers (myelin sheaths)around the nerve cells. They foundevidence that these children’s brainshad stopped growing prematurely.Yet the mothers of these twochildren reported no symptoms ofmercury poisoning (Weiss 1990).
Two child brain autopsies pub-lished in 1978 after a poisoning inIraq confirmed the Minamata re-sults. One of these children died atbirth; the other died 33 days afterappearing perfectly healthy at birth.Both brains were smaller thannormal, and showed evidence thatbrain cells, once formed, had failedto migrate to their proper locationsin the brain (a process calledneuronal migration) (Weiss 1990).
More recent studies of childrenexposed to lower levels of mercuryhave found toxic effects at levelspreviously thought to be safe.These studies have focused onfinding measures sensitive enoughto quantify developmental delaysand neurological deficits in childrenexposed to relatively low levels of
There is no amount ofmercury known to beharmless. The onlylimiting factor in ourunderstanding ofmercury’s toxicity isscientists’ ability tomeasure the effects.

12 BRAIN FOOD
methylmercury in utero. For ex-ample, scientists have measureddelays in walking and talking, ortone and reflex abnormalities.These studies, conducted primarilyover the past 10 years, have eluci-dated the exquisite sensitivity of thefetal brain to low levels of methylm-ercury.
The National Academy of Sci-ences (NAS) Committee on theToxicological Effects of Methylmer-cury summarizes the findings of thisnew body of work: "Chronic, low-dose prenatal [methylmercury]exposure from maternal consump-tion of fish has been associated withmore subtle endpoints of neurotox-icity in children. Those end pointsinclude poor performance onneurobehavioral tests, particularlyon tests of attention, fine-motorfunction, language, visual-spatialabilities (e.g., drawing), and verbalmemory" (NAS 2000).
The Committee speaks to thepotential societal impacts that stemfrom contaminated seafood, sayingthat some children exposed in uteroby their mothers’ fish consumptionare at risk of falling in the group ofchildren "who have to struggle tokeep up in school and who mightrequire remedial classes of specialeducation." The Committee esti-mates that 60,000 children born inthe U.S. each year are at risk ofsome level of brain damage fromtheir exposures to methylmercury inthe womb.
Mass poisoning in Japan
By 1953 the first cases ofMinamata Disease were surfacingamong Japanese living in communi-ties on the Shiranui Sea. At thetime, the cause of the disease was
unknown. The disease was namedafter the bay where the first victimslived.
Cases among adults were diag-nosed first, children later. Thecardinal features of adult exposuresin Minamata included tingling andnumbness, sensory impairment, lossof speech and muscle control,visual-field constriction, and hearingloss. All the children who wereidentified with the most severe formof the disease were mentally re-tarded, had primitive reflexes,experienced loss of speech andmuscle control, or had limb defor-mities.
After several years of intensestudy, the cause was pinpointed. In1959, scientists from KumamotoUniversity reported to the JapaneseMinistry of Health and Welfare thatMinamata Disease stems frommethylmercury poisoning. Thescientists also found that the mer-cury originated from industrialwastewater of an acetaldehydefacility called Chisso Co. Ltd. Noth-ing was done. A 1960 report by avisiting U.S. scientist recommendedthat fishing in Minamata Bay shouldbe banned. This was not done,exposures continued for years, anddisease rates climbed.
Decades after people finallystopped fishing in the bay, healtheffects still linger, and new casesare emerging among those exposedyears ago. As of 1995, those diag-nosed with the disease numbered2252, of which about half had died,with many deaths being directlycaused by methylmercury poisoning(Harada 1995).
Remarkably, Chisso Co. Ltd. hadknown of contamination of marine
Some childrenexposed in utero bytheir mothers’ fishconsumption are atrisk of falling in thegroup of children"who have to struggleto keep up in schooland who mightrequire remedialclasses of specialeducation."
Committee on theToxicological Effects ofMethylmercury, July 2000

13ENVIRONMENTAL WORKING GROUP AND THE STATE PIRGS
life close to the plant three decadesbefore the first confirmed cases ofMinamata Disease. The companycompensated the fishermen’s unionwhenever complaints were lodged,but did nothing to reduce themercury in the plant’s wastestream.A comment made by a companyofficial reflects the company’spriorities: "[the] chemical industryis essential to Japan today andsome damage to marine life shouldbe tolerated" (Harada 1995).
Although the scale of currentexposures in the U.S. is muchdifferent from Minamata, withlower levels of exposure over amuch broader population, thecorporate influence over publichealth policies first seen inMinamata continues today. InFDA’s 1979 revisions to its mercuryaction level, the agency wrote thatits new, less stringent action levelwould "provide a significant eco-nomic benefit to those industriesmost seriously affected by regula-tory actions under the [previous]guideline and would enhance thefuture development of a number ofpresently underutilized fisheries"(Federal Register Vol 44 No 14,January 19, 1979).
Mass poisoning in Iraq providesfirst clues of harmful dose
In the winter of 1971-1972, theIraqi government distributed 88,000tons of seed grain to Iraqi farmers,to be used for the spring planting.The farmers were warned that thegrain was contaminated withmethylmercury fungicide, but adrought the previous summer haddepleted grain stores, and manyignored the warnings and bakedthe wheat into bread.
Three months later, the hospital-izations began. By the time theepisode had ended, official hospitaldeaths numbered about 400. Amore complete estimate incorporat-ing unreported cases from thecountryside puts the full number offatalities at close to 5000 (Green-wood 1985).
A team of scientists from theUniversity of Rochester and Iraqcoordinated an investigation of thedisaster. Although today theirconclusions seem almost common-place, at the time their work repre-sented the most comprehensive dataavailable on the increase in theseverity and number of healtheffects that can occur as exposure toa toxic chemical increases. Thiskind of data is now used to con-struct what is called a dose-responsecurve, used as the basis for manysafety standards in the U.S.
The key to their work was thediscovery that methylmercury in hairreflects blood concentrations at thetime the hair was formed, and canbe used to reconstruct an ingesteddose of methylmercury. Thistechnique has since been used inepidemiological studies of popula-tions in the Faroe Islands,Seychelles, and New Zealand, in thecontinuing body of work that findsever lower levels of methylmercuryassociated with subtle neurologicaldeficits and developmental delays ininfants and children.
New studies focus on low-leveleffects to fetal brain whenmothers eat fish
Two recent major epidemiologi-cal studies have expanded scientists’current understanding of the sensi-tivity of the fetal brain to methylm-
In FDA’s 1979revisions to itsmercury action level,the agency wrote thatits new, less stringentaction level would"provide a significanteconomic benefit tothose industries mostseriously affected byregulatory actionsunder the [previous]guideline and wouldenhance the futuredevelopment of anumber of presentlyunderutilizedfisheries."

14 BRAIN FOOD
ercury. These studies, conducted inNew Zealand and in the FaroeIslands (in the North Sea, betweenScotland and Ireland), includeprenatal methylmercury exposuresthat fall within the range of someU.S. exposures. The NationalAcademy of Sciences methylmercurycommittee, which published itsfindings last June, found low-leveleffects displayed most clearly in theFaroe Islands studies:
"The [methylmercury]-associ-ated performance decrements onthe neuropsychological testsadministered in the Faroe Islandsand New Zealand studies suggestthat prenatal [methylmercury]exposure is likely to be associ-ated with poorer school perfor-mance. In the Faroe Islandssample, [methylmercury]-relateddeficits were seen across a broadrange of specific domains, in-cluding vocabulary, verballearning, visuospacial attention,and neuromotor function. Defi-cits of the magnitude reported inthese studies are likely to beassociated with increases in thenumber of children who have tostruggle to keep up in a normalclassroom or who might requireremedial classes or specialeducation." (NAS 2000).
Methylmercury exposuresthrough fish consumption and thesubtle effects manifested in infancyand childhood are extraordinarilydifficult to measure. Each fish eatenhas a unique concentration ofmethylmercury. Each woman eatinga fish has a unique ability to absorband excrete methylmercury. Eachchild in the womb has a uniquesusceptibility to the harmful effectsof mercury. Given the tremendousvariability inherent in these studies,
the true surprise is that scientistsare able to measure an effect at all.
According to the NAS, uncer-tainties have the potential to maskeffects, making it more difficult forscientists to find statistically signifi-cant results. That is one reasonthat the committee recommendedthat public health protections notbe based on studies like that in theSeychelles off the coast of Tanzaniathat fail to find significant effects ininfants and children exposed inutero. The committee writes:"because there is a large body ofscientific evidence showing ad-verse neurodevelopmental effects,including well-designed epidemio-logical studies, the committeeconcludes that an RfD [referencedose, or government’s acceptedintake level for a substance] shouldnot be derived from a study, suchas the Seychelles study, that didnot observe any associations with[methylmercury]" (NAS 2000). NASrecommended instead, that areference dose be derived from astudy that did find associations,such as the study that took place inthe Faroe Islands.
The Faroe Islands study focusedon 1022 babies born over a 21-month period. Each baby’s inutero exposures to methylmercurywas estimated from their mother’shair and blood concentrations, andfrom the concentration of methylm-ercury in the blood of the umbilicalcord at birth. When the childrenreached age 7, they each wentthrough 5 hours of detailed neuro-psychological tests. A total of 917children completed the examina-tions.
The tests given to the childrenranged from simple tests designed
“[B]ecause there is alarge body ofscientific evidenceshowing adverseneurodevelopmentaleffects, including well-designedepidemiologicalstudies, the committeeconcludes that an RfD[reference dose, orgovernment’saccepted intake levelfor a substance]should not be derivedfrom a study, such asthe Seychelles study,that did not observeany associations with[methylmercury]."

15ENVIRONMENTAL WORKING GROUP AND THE STATE PIRGS
to measure motor skills (such as thestandard Finger Tapping Test,which measures how many times achild can repeatedly tap a key in 15seconds), to complex tests ofintelligence such as the BostonNaming Test, in which a child ispresented with line drawings ofobjects that they then are asked toname, first without and then withclues if the child cannot answerwithin 20 seconds.
The scientists’ conclusionsencompass specific results of theirstudies as well as possible societalimpacts of low-level mercuryexposures: "Overall, the resultssuggest that several domains ofbrain function may be affected byprenatal methylmercury exposure.The findings (especially thoseinvolving language) suggest thatthis exposure has widespreadeffects on cerebral function, andthey are consistent with the litera-ture reporting widespread neuro-pathological involvement in prena-tal methylmercury poisoning. Adiscernible, insidious effect seemsto be present below a limit of 10[parts per million] for mercury inmaternal hair" (Grandjean et al1997). In other words, at low levelsof prenatal mercury exposure,widespread impacts are seen on achild’s neurological development.
Broad societal impacts ofmercury exposure
The scientists in the FaroeIslands study go on to postulatethat the statistically significantdevelopmental delays seen betweenhigh and low exposure groupscould affect society as a whole:"Such decrements in average cogni-tive function, especially if perma-nent, could well be of societal
significance in the populationsaffected" (Grandjean et al 1997).
For a particular child born to amother who eats fish with el-evated methylmercury levels, likecanned tuna, the effects of meth-ylmercury would likely go unno-ticed. For instance, a doubling ina mother’s dose of mercury isassociated with about a two-monthdelay in walking and talking, wellwithin the normal range of differ-ences among children. An in-crease in dose by a factor of 10 isassociated with a developmentaldelay of four to seven months(NAS 2000, citing data fromGrandjean et al 1997).
But these differences becomeextremely important when consid-ered in the context of the fourmillion pregnant women exposedto methylmercury every year.What this broad, low-level expo-sure would do, in effect, would beto push a greater percentage ofthe population into the group ofchildren who struggle to keep upin school, or who require remedialeducation (NAS 2000). Apart froman unknown number of childrenwho are severely affected bymethylmercury, either because ofthe unusually high exposures oftheir mothers or their particularsensitivity, it is the broad impact ofdevelopmental delays that be-comes the significant effect tosociety when millions of babiesare exposed to low doses of adevelopmental toxin like methylm-ercury every year.
Adults at risk decades afterexposures
Even for adults, the assumedsafe dose continues to decrease as
Overall, the resultssuggest that severaldomains of brainfunction may beaffected by prenatalmethylmercuryexposure.
Faroe Island researchers1997

16 BRAIN FOOD
more is learned about the toxicity ofmethylmercury.
FDA’s safety standard formethylmercury has its roots in aSwedish analysis of data from the1950s mass poisoning episode inMinamata, Japan. In their analysis,the Swedish Commission on Evalu-ating the Toxicity of Mercury in Fishderived a "no effect" level of 200parts per billion (ppb) of mercury inblood.
In 1990, the World Health Orga-nization (WHO) found that thissame "no effect" concentration, 200ppb, would cause five percent ofadults to manifest neurologicaleffects like tingling and numbness.But an analysis done six years laterby independent scientists found thata concentration of 200 ppb would,in fact, cause neurological effects inanywhere from 11 to 31 percent ofthe adult population (WHO 1990and Kosatsky and Foran 1996,referenced in NAS 2000).
Furthermore, it appears thatsmall amounts of methylmercurycan damage the adult brain throughwhat has been called an "erosion ofnerve cells" that "silently and gradu-ally narrows the plastic potential ofthe brain" (Weiss 1996). Newevidence from victims of MinamataDisease shows that relative neuro-logical deficits, like those indicatedby an older person requiring helpdressing or bathing, can emergedecades after exposure and appearto increase with age, long afterexposures have ended. One theoryis that the brain may age anddegenerate more quickly because ofa stressed neuronal structure in-duced by chemical exposures whenthe brain is developed in the womb
and early childhood (Weiss 1996).A more recent study has linkedmercury with Alzheimers disease(Leong 2001).
Mercury appears toxic to theimmune system and the heart
Studies are beginning to showthat the heart and the developingimmune system are possibly evenmore sensitive to low doses ofmethylmercury than is the fetalbrain.
In general, regular consumptionof fish seems to provide protectionfrom heart disease. Researchers inFinland were surprised, therefore,to find that high fish consumptionamong a study of 1,833 fishermenwas associated with a doubling ortripling of the risk of dying from aheart attack. In this case, the riskwas correlated to methylmercuryingestion. Damage to the heartmuscle from methylmercury ap-peared to outweigh the beneficialeffects of fish consumption(Salonen 1995).
In reviewing this study, NASnotes that the mercury exposure inthis study is the lowest that hasbeen associated with any otherhealth effect, even developmentaleffects among children. Preliminaryresearch on the developing im-mune system shows the same result– the immune system may becompromised at even lower levelsthan the fetal brain is. While publichealth agencies alter their safetylevels to be consistent with thebody of literature on fetal braineffects, research on the heart andimmune system will continue andmay eventually drive the safetystandards even lower.
It appears that smallamounts of methyl-mercury can damagethe adult brainthrough what hasbeen called an"erosion of nervecells" that "silently andgradually narrows theplastic potential of thebrain"

17ENVIRONMENTAL WORKING GROUP AND THE STATE PIRGS
Inadequate GovernmentProtections from Mercury in Fish
Chapter 2
Utilities fend off controls on theirmercury pollution
If political contributions are anyindication of political influence,electric utilities have significantmuscle in Washington. Between1990 and 2000, electric utilitiescontributed more than $53 millionto political campaigns and parties,with their overall annual contribu-tions skyrocketing 340% over thatsame period. Republicans reapedmost of the benefits, receiving twiceas much money as Democratsduring the last election cycle.
The top givers among utilitiesduring the 1999-2000 election cyclewere the National Rural ElectricCooperative Association ($4.5million), Southern Company ($3.9million), Entergy Corporation ($2.4million), Edison International ($2million), PG&E and Edison ElectricInstitute both at $1.9 million, andTexas Utilities at $1.8 million(Center for Responsive Politics2000). (Table 1)
Delay as an art form
The history of failure to controlmercury pollution reads like atextbook on the art of regulatorydelay. This art can be viewed as acircle that the utilities carefullynavigate in three steps. The first
step is pushing for studies, thesecond step is arguing that thestudies’ recommendations will betoo expensive, particularly if theyinvolve participation by the utilitiesthemselves, and the third step, isarguing that the first round ofstudies are inconclusive and that yetfurther study is needed.
The first step is well illustratedby an industry-motivated, 1998congressional mandate for a studyof mercury toxicity by the NationalAcademy of Sciences. This requestfollowed immediately on the heelsof a 5-year study of the same issueby EPA, previously mandated byCongress in the 1990 Clean Air Act.Both studies reached the sameconclusion that mercury is ex-
Donations to
campaigns and candidates
Electric Utility 1990-2000
National Rural Electric Cooperative Assoc. $4.5 millionSouthern Company $3.9 millionEntergy Corporation $2.4 millionEdison International $2.0 millionPG&E $1.9 millionEdison Electric Institute $1.9 millionTexas Utilities $1.8 million
Table 1. Electric utilities maintain control of theiremissions through generous political contributions.
Source: Center for Responsive Politics. Compiled from FEC Data.
The history of failureto control mercurypollution reads like atextbook on the art ofregulatory delay.
18 BRAIN FOOD
tremely toxic and that currentsafeguards are inadequate.
The second step, criticizing thecost of the study recommendations,is well illustrated by the NationalRural Electric Cooperative Associa-tion (NRECA) in response to EPA’srequest for mercury testing byutilities: "To summarize, NRECA isvery disappointed with this pro-posed ICR [Information CollectionRule]. EPA should reconsider andrepropose an ICR that wouldsignificantly reduce the overallinformational requirements and costburdens placed on electric utilityowners and operators…" (NRECA,1998). Here, electric utilities aredecrying the cost of simply monitor-ing their own emissions.
Wisconsin Electric gives us agreat example of step three. After adecade of unprecedented review ofmercury toxicity and exposure byboth the EPA and the NationalAcadamy of Sciences, WisconsinElectric is still calling for more study(Wisconsin Electric 2001): "Whilemuch has been learned aboutmercury behavior in the environ-ment, Wisconsin Electric believesthat it is wise to allow the EPA andother research groups sufficienttime to complete ongoing andplanned research… We firmlybelieve that wise decision-making ispossible only when all stakeholdershave a clear understanding of thismultifaceted problem and its pos-sible solutions."
During the past two decades theelectric utility lobby has wonnotable victories amending twomajor environmental statutes. Eachhamstrung EPA’s ability to controlmercury pollution and protect thepublic health.
Under the Emergency Planningand Community Right to KnowAct, passed in 1986, the electricutilities avoided requirements toreport their mercury emissions tothe Toxics Release Inventory (TRI),our country’s best source of publicinformation on toxic pollution formore than a decade. This movenot only kept the public in thedark about their emissions, butdeprived regulators at the Environ-mental Protection Agency ofspecific plant-by-plant data onmercury emissions (until 1997,when EPA finally required electricutilities to report their emissions tothe TRI).
But the coup de gras was underthe Clean Air Act, the electricutilities have managed to com-pletely avoid any limit on theirmercury emissions. In 1990,members of Congress sympatheticto utilities attached an amendmentto the Clean Air Act that prohibitedEPA from controlling mercuryemissions at power plants. Othersources of airborne mercury didnot receive this immunity, andultimately were controlled.
Even more delays were builtinto the 1990 Clean Air Act, despitethe fact that at the time of the bill’spassage mercury was one of thebest-understood chemicals in therealm of human toxicology. Thelaw directed EPA to summarize thehealth effects of mercury and tosubmit this report to Congress.This study was finalized in 1996,but was held internally by theagency for months while the 1996election and budget were finalized.When EPA finally released itsreport to Congress in 1997, itconcluded that mercury wasprobably more toxic than previ-
In 1990, members ofCongress sympatheticto utilities attached anamendment to theClean Air Act thatprohibited the EPAfrom controllingmercury emissions atpower plants. Othersources of airbornemercury did notreceive this immunity,and ultimately werecontrolled.
19ENVIRONMENTAL WORKING GROUP AND THE STATE PIRGS
ously thought. This was not theconclusion the electric utilities hadsought.
After a year in which their politi-cal contributions were higher thanfor any other period - $11 million toall political campaigns and parties -the utilities won another delay in1998. Congress required EPA tocontract with the National Academyof Sciences to conduct (yet another)comprehensive review of the scienceon mercury’s risk to human health.In particular, the NAS was instructedto resolve the controversy onwhether to use the results of epide-miological studies in the SeychellesIslands or the Faroe Islands as thebasis for federal health protectionsfrom mercury.
The NAS panel concluded unani-mously that the Faroe Island data arethe most appropriate for settinghealth safeguards. The committeealso concluded that 60,000 childreneach year may get a potentiallyunsafe dose of mercury in the wombduring development. The utilitylobby once again found itself withan unpalatable conclusion.
Only days before PresidentClinton left office, EPA announcedthat it finally had the data in hand toregulate mercury from power plantemissions (Browner, December 14,2001), and that these regulationswould be moving forward. With anew President and Administration,however, it remains to be seenwhether regulations will indeed beforthcoming.
FDA’s failure to regulatemethylmercury in fish
FDA has a 32-year history offailed health advisories and nonen-
forceable mercury contaminationguidelines. The agency’s seafoodmonitoring programs do almostnothing to test the most commonlyeaten fish, and then fail to act onthe results even when testingshows mercury contamination forsome species consistently above itsown health advisory levels.
FDA’s mercury action levelstands out among a long list ofquestionable policies. The actionlevel is the level of mercury in fishabove which FDA recommendsthat the fish not be sold. Underlaw, an action level is not enforce-able, but it does represent theagency’s best judgment of a safelevel of mercury contamination infish.
FDA’s action level: Take 1
In 1969, FDA established anonenforceable "action level" of 0.5parts per million (ppm) of mercuryin seafood set to protect adult menfrom mercury poisoning. In itsdescription of the action level in a1974 rulemaking, the agencyexplained: "The 0.5 ppm actionlevel for mercury in fish andshellfish established by the Foodand Drug Administration in 1969incorporated all the significantaspects of the mercury-in-fishproblem known at the time of itsestablishment."
The significant aspects of thedangers of mercury exposure weredrawn from a 20-year mass poison-ing episode in Minimata, Japan thatsurfaced in the 1950s. FDA scien-tists relied on calculations by aSwedish Commission finding thatthe lowest blood mercury concen-trations associated with toxiceffects in Minimata would be
The NAS panelconcludedunanimously that theFaroe Island data arethe most appropriatefor setting healthsafeguards. Thecommittee alsoconcluded that 60,000children each yearmay get a potentiallyunsafe dose ofmercury in the wombduring development.

20 BRAIN FOOD
achieved by a 150-pound maneating a pound of fish every eightdays (2 ounces per day) containing0.5 ppm mercury (Federal RegisterVol. 39, No. 236, December 6,1974).
FDA adopted the results of thiscalculation as their action level –0.5 ppm mercury in fish. Thisoutdated method of exposureassessment specifically excludesconsideration of the populationmost at risk – pregnant women andtheir babies. In spite of majoradvancements made by otherfederal agencies in exposure assess-ments that consider the uniquevulnerability of babies, FDA contin-ues to resist this concept. Instead,the agency falls back, by default, oncalculations that assume a 150pound man and a 1 pound fetus tobe essentially the same in theirresponse to mercury.
FDA’s action level: Take 2
In 1974, FDA reevaluated itsmercury action level in light of newdata from another mercury poison-ing episode, this one in Iraq in1972. The agency found that thethreshold exposure level for theonset of poisoning symptoms,which appeared to be about 25 to40 milligrams of mercury, wassimilar to that seen in the Minimatapoisonings. The agency concludedthat its action level, set to protect a150-pound adult male, was appro-priate.
The agency further defended itsaction level by pointing out thatonly about two percent of thepopulation eats more than a poundof fish every eight days – theconsumption rate that forms thebasis of their action level. The FDA
Commissioner found that "it is notpossible… to provide this samehigh level of protection to everyperson without excluding a greatamount of fish and shellfish fromthe market." The Commissioneradded that "it would be inappro-priate to exclude a vast amount offish and shellfish from the marketin order to provide a large marginof safety for those who consumefar more than the average person."(Federal Register Vol. 29, No. 236,December 6, 1974).
One could argue with thesuperlatives, but the concept isclear: FDA’s action level is set toprotect an average person, in thiscase an average 150-pound adultmale. Even more importantly, theCommissioner makes it clear thatthis public health agency consid-ers the commercial interests of theseafood industry to be an integralpart of their public health mission.
Even in 1974 FDA recognizedthat it might at some point beappropriate to replace the nonen-forceable action level with anenforceable limit that the Agencycalls a tolerance level. "Becausethis important Iraqi study isincomplete and other mercurystudies are in progress, the Com-missioner concludes that it wouldbe inappropriate to set a formaltolerance at this time. When thestudy of the Iraqi poisoningepisode is fully developed andpublished, the Commissioner willreevaluate it and all other avail-able information and considerwhether to establish a formaltolerance for mercury in fish andshellfish" (Federal Register Vol. 29,No. 236, December 6, 1974).Twenty-seven years later, FDA isstill reevaluating.
The agency falls back,by default, oncalculations thatassume a 150-poundman and a 1-poundfetus to be essentiallythe same in theirresponse to mercury.
What little publichealth protection isprovided by FDA’scurrent action levelhas its origins in acalculation provided21 years ago by acircuit court judge.

21ENVIRONMENTAL WORKING GROUP AND THE STATE PIRGS
Commercial break: The seafoodindustry fights back
The seafood industry wantedmore than FDA’s official declara-tion of its goal to support thecommercial interests of the sea-food industry. They wanted the(nonenforceable) action levelrescinded. So in 1977, AndersonSeafoods, Inc. and a coalition ofseafood distributors sued FDAover their finding that swordfishcontaminated with mercury abovethe action level of 0.5 ppm wasunsafe (United States v. AndersonSeafoods, Inc., 622F.2d157, 1980).
What little public health protec-tion is provided by FDA’s currentaction level has its origins in acalculation provided 21 years agoby the circuit judge presiding overthis case, Chief Judge Arnow. Inthe trial, Anderson Seafood pre-sented calculations to the judgeshowing that swordfish contami-nated with mercury at up to 2ppm is safe. Judge Arnow, inturn, calculated his own actionlevel of 1 ppm based on evidencepresented in the trial. The judge’scalculations are presented in thesummary judgment and remain thebasis of the action level in effecttoday.
In his written memorandumdecision, Judge Arnow describesthe findings of the court used asthe basis for his calculations. First,he writes that the court found thatAnderson Seafoods’ swordfishcontains mercury at levels up to 1ppm. Second, the court agreedwith Anderson Seafood’s assess-ment that the harmful level ofmercury in the blood is 400 ppb.This is twice the level decided inthe 1970s by scientific consensus
based on the Minimata and Iraqipoisonings. It is 69 times the safelevel of 5.8 ppb recommended lastyear by the National Academy ofSciences based on recent studiesfocused on fetal brain damage (NAS2000).
The court then multiplied by twoand found that, since AndersonSeafood showed that 300 micro-grams (ug) of mercury ingested perday gives a blood level of 200 partsper billion (ppb), then 600 ug ofmercury gives a blood level of 400ppb (the court’s "effects" level).
The court then agreed withAnderson Seafood that a safetyfactor of 5, not 10, is sufficient toaccount for possible differencesbetween a 150-pound adult manand other affected populations,such as a 1-pound fetus in the firsttrimester of development. TheNational Academy of Sciences, twodecades later, would recommend asafety factor of 10.
Then the judge divided hisallowable ingestion level, 600 ug ofmercury, by his new safety factor of5, to get his allowable intake of 120ug of mercury per day per person.Next the judge had to decide howmuch fish people eat. For this, heagain turned to Anderson Seafood.The company cited a study ofpeople eating fish from Lake Michi-gan where, at most, people wereeating 5.5 ounces of fish per day(157 grams per day). The judgethen calculated that this personwould be ingesting 157 ug per daywere the mercury concentration inthe fish 1 ppm.
Since this dose of 157 ug per dayis higher than the judge’s allowabledose of 120 ug per day, the judge
FDA data shows thatswordfish samplesroutinely fail the1 ppm action level,with single samplescontaining mercury atlevels as high as 2.9,2.94, and 3.22 ppm.

22 BRAIN FOOD
recalculated the exposure assumingthat all swordfish with mercuryconcentrations greater than 1 ppmwere removed from the market.With this maneuver, he found that a150-pound man from Michiganeating 6 ounces of swordfish perday with an average mercuryconcentration of 0.8 ppm would fallwithin the level the judge haddecided was safe.
Through these various calcula-tions, the judge found that "sword-fish poses no reasonable possibilityof injury to anyone’s health," basedon a safe dose an order of magni-tude higher than what is nowknown to damage the fetal brain.American taxpayers covered thecost of the trial. Judge Arnow’shealth limit for mercury in fish, 1ppm, is now FDA’s action level, stillin effect 21 years after his decision.
FDA’s action level: Take 3
While the Anderson case waspending, and presumably whileFDA experts were attempting todefend the Agency’s action level of0.5 ppm, FDA published a noticestating that an action level of 1 ppmwould provide adequate protectionto consumers (Federal Register Vol44 No 14, January 19, 1979). Theybased this level on a new study bythe National Marine FisheriesService (NMFS) showing essentiallythat an average person does notnormally eat fish contaminated athigh levels.
In this proposed rulemakingFDA concurs with the NMFS findingthat a higher action level (1 ppminstead of 0.5 ppm) would "providea significant economic benefit tothose industries most seriouslyaffected by regulatory actions under
the 0.5 ppm guideline and wouldenhance the future development of anumber of presently underutilizedfisheries." FDA reiterates the NMFSconclusion that a less restrictiveregulatory approach would signifi-cantly increase consumer confidencein seafood.
The sequel: FDA’s new advisoryfor pregnant women
After consulting extensively withkey state officials and seafood indus-try representatives over the past year,FDA doubled the number of fish ontheir warning list for pregnantwomen. To their standing advicethat pregnant women avoid sharkand swordfish, FDA added kingmackerel and tilefish.
To arrive at these new listingsFDA scientists did not comprehen-sively review mercury contaminationin fish. Instead, apparently, theystumbled onto a recent EPA docu-ment. In the document, EPA summa-rized a 1978 FDA analysis of datafrom a National Oceanic andAtmopheric Administration (NOAA)survey which showed average mer-cury levels in king mackerel andtilefish higher than FDA’s actionlevel. Based on this EPA summary ofan FDA analysis of NOAA data now25 years old, FDA added these twofish to the advisory list.
As it stands now, FDA’s advice topregnant women is to avoid eatingthe four species of fish for which atleast half the fish seem to haveaverage methylmercury levels above1 ppm.
FDA claims that the odds ofsomeone eating a contaminated fishare slim, which is the justification theagency uses for its lax action level
Full compliance withFDA’s seafood safetyprogram does notinclude any testing formethylmercury.

23ENVIRONMENTAL WORKING GROUP AND THE STATE PIRGS
and nonexistent testing require-ments. Yet FDA’s own testingproves them wrong. For swordfish,for instance, FDA data shows thatsamples routinely fail the actionlevel, with single samples contain-ing mercury at levels as high as 2.9,2.94, and 3.22 ppm (FDA SeafoodSurveillance Monitoring data).
FDA blasted in recentgovernment review
The most recent attack on FDA’smethylmercury policies came fromthe General Accounting Office(GAO) on January 31, 2001 (GAO,2001). In its report to SenatorsRichard Lugar and Tom Harkin ofthe Committee on Agriculture,Nutrition, and Forestry, GAO foundthat FDA fails on multiple fronts toprotect consumers from mercury.
First, the GAO analysis foundthat FDA’s broad seafood safetyprogram – which relies on indi-vidual seafood firms to write andimplement their own safety pro-grams – is failing. As of 1999, 56percent of seafood firms were notfollowing FDA’s requirements toensure the safety of their seafood --even for pathogens for whichhealth risks can be immediate andlife-threatening.
In the case of methylmercury,the situation is even worse. GAO
found that in FDA’s guidancedocuments to the seafood indus-try, the Agency neglects to men-tion methylmercury testing evenonce. The effect of the omissionis that full compliance with FDA’sseafood safety program does notinclude any testing for methylm-ercury.
This omission is bewilderinggiven that FDA’s own testing ofseafood shows routinely highmethylmercury levels in a numberof species. FDA testing of sharkand swordfish in 1998 and 1999found methylmercury above theAgency’s action level (1 ppm) in8 of 19 samples.
The effects of FDA’s methylm-ercury policies are far-reaching.Any fish can go into the market-place at any time, regardless ofthe mercury level. This situationis made even more hopeless byFDA’s scant methylmercurytesting program that fails to fullycharacterize methylmercury levelsin many of the most commonlyeaten fish. For instance, FDA’s 10tests of methylmercury in sea bassindicate it may be among themost contaminated fish on themarket. Yet the Agency has noplans to warn consumers of apotential concern, let alone tofurther test this increasinglypopular fish.

24 BRAIN FOOD

25ENVIRONMENTAL WORKING GROUP AND THE STATE PIRGS
The Fish We Eat
Chapter 3
FDA and EPA use flawedmethods to assess the risk frommethylmercury in fish
The subtle effects of methylmer-cury are inextricably linked to theamount of the metal in a fish eatenby a pregnant woman, and to theunique biology of an individualwoman and her baby.
Every fish eaten has its ownconcentration of methylmercury.Every woman eating a fish has adifferent ability to absorb andexcrete methylmercury based onher size and a set of unique physi-ologic and metabolic factors. Everychild in the womb has a uniquesusceptibility to the harmful effectsof methylmercury. Scientists haveshown that these biological differ-ences matter tremendously. Arecent study found that two womeneating the exact same fish could geta dose of mercury different by afactor of 70, and that one in every100 women would be expected toretain in her body three times themethylmercury that an averagewoman would retain (Stern 1997).
Remarkably, though, both FDAand EPA use an average person as astand-in for all women in the U.S.when they assess the risk thedeveloping fetus faces when itsmother eats contaminated fish(Table 2).
A better alternative
To better represent variability infetal exposure to methylmercury theEnvironmental Working Groupdeveloped a probabilistic methodfor assessing methylmercury risk.
Probabilistic risk assessmentssimulate the distribution of real-world exposures that occur withinlarge populations. To do this, acomputer program generates hun-dreds of thousands of virtualwomen based on the range ofbiological variability known to existwithin the population. Our modelsimulates the dose of methylmer-cury each of these women wouldreceive from a given fish that she isassumed to eat. Mercury concentra-tions in fish in our analyses aredrawn from federal databases ofmeasured mercury concentrations infish tissue. How much of eachindividual type of fish a woman eatsis scaled to match actual fishconsumption data maintained bythe National Marine FisheriesService. For example, in our modela woman is 34 times more likely toeat canned tuna than tuna steak.
The distribution of data resultingfrom the model represents hundredsof thousands of methylmercuryexposures, each one correspondingto one of the model’s biologicallyunique women, and each one
Both FDA and EPA usean average person as astand-in for all womenin the U.S. when theyassess the risk thedeveloping fetus faceswhen its mother eatscontaminated fish.
26 BRAIN FOOD
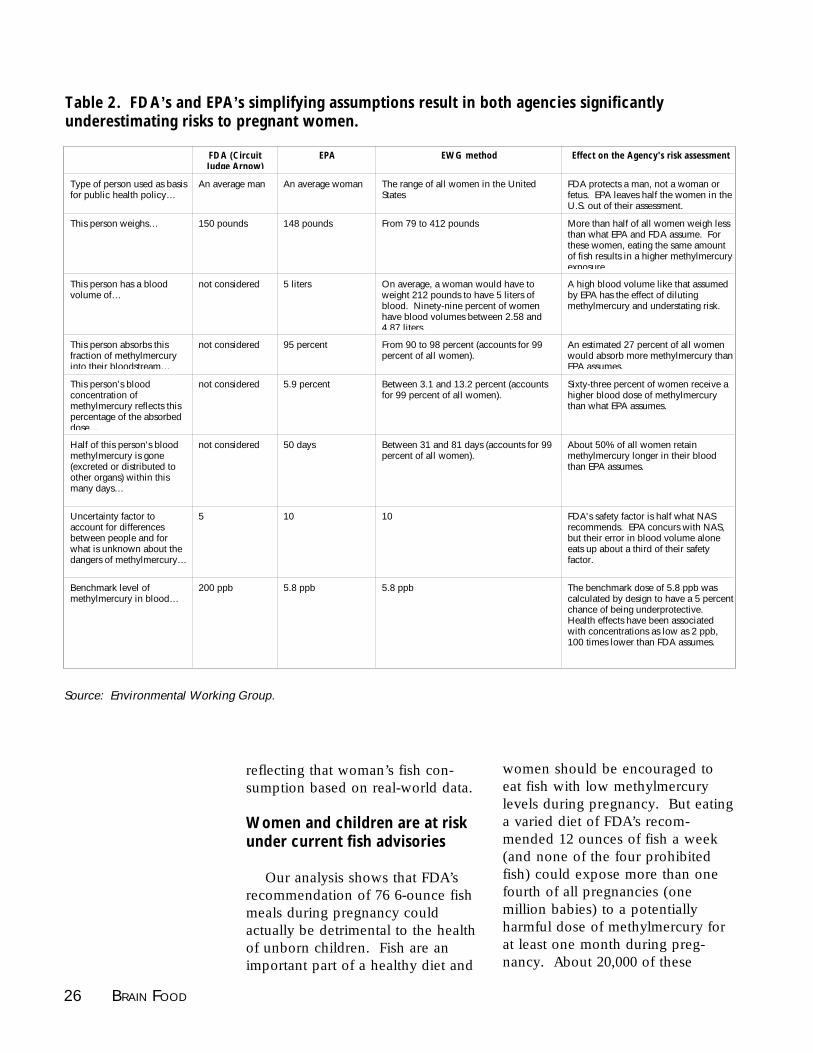
Table 2. FDA’s and EPA’s simplifying assumptions result in both agencies significantlyunderestimating risks to pregnant women.
Source: Environmental Working Group.
reflecting that woman’s fish con-sumption based on real-world data.
Women and children are at riskunder current fish advisories
Our analysis shows that FDA’srecommendation of 76 6-ounce fishmeals during pregnancy couldactually be detrimental to the healthof unborn children. Fish are animportant part of a healthy diet and
women should be encouraged toeat fish with low methylmercurylevels during pregnancy. But eatinga varied diet of FDA’s recom-mended 12 ounces of fish a week(and none of the four prohibitedfish) could expose more than onefourth of all pregnancies (onemillion babies) to a potentiallyharmful dose of methylmercury forat least one month during preg-nancy. About 20,000 of these
FDA (Circuit Judge Arnow)
EPA EWG method Effect on the Agency's risk assessment
Type of person used as basis for public health policy…
An average man An average woman The range of all women in the United States
FDA protects a man, not a woman or fetus. EPA leaves half the women in the U.S. out of their assessment.
This person weighs… 150 pounds 148 pounds From 79 to 412 pounds More than half of all women weigh less than what EPA and FDA assume. For these women, eating the same amount of fish results in a higher methylmercury exposure.
This person has a blood volume of…
not considered 5 liters On average, a woman would have to weight 212 pounds to have 5 liters of blood. Ninety-nine percent of women have blood volumes between 2.58 and 4.87 liters.
A high blood volume like that assumed by EPA has the effect of diluting methylmercury and understating risk.
This person absorbs this fraction of methylmercury into their bloodstream…
not considered 95 percent From 90 to 98 percent (accounts for 99 percent of all women).
An estimated 27 percent of all women would absorb more methylmercury than EPA assumes.
This person's blood concentration of methylmercury reflects this percentage of the absorbed dose…
not considered 5.9 percent Between 3.1 and 13.2 percent (accounts for 99 percent of all women).
Sixty-three percent of women receive a higher blood dose of methylmercury than what EPA assumes.
Half of this person's blood methylmercury is gone (excreted or distributed to other organs) within this many days…
not considered 50 days Between 31 and 81 days (accounts for 99 percent of all women).
About 50% of all women retain methylmercury longer in their blood than EPA assumes.
Uncertainty factor to account for differences between people and for what is unknown about the dangers of methylmercury…
5 10 10 FDA's safety factor is half what NAS recommends. EPA concurs with NAS, but their error in blood volume alone eats up about a third of their safety factor.
Benchmark level of methylmercury in blood…
200 ppb 5.8 ppb 5.8 ppb The benchmark dose of 5.8 ppb was calculated by design to have a 5 percent chance of being underprotective. Health effects have been associated with concentrations as low as 2 ppb, 100 times lower than FDA assumes.

27ENVIRONMENTAL WORKING GROUP AND THE STATE PIRGS
children would be exposed to adose of methylmercury that in-creases the risk of adverse neuro-logical effects for the entire preg-nancy (Figure 1).
Antiquated risk assesments
FDA’s reliance on outdated riskassessment methods results in twofundamental errors in their seafoodadvisory to pregnant women. First,their list of four prohibited fish isfar too short. Many other com-monly-eaten fish (tuna steaks andhalibut, to name just two) also havemethylmercury levels that may beunsafe for pregnant women.
The second and perhaps moreserious error is encouraging womento eat 12 ounces of essentially anyother fish throughout pregnancy.Notably, the Agency does notadvise women to eat up to 12ounces of fish per week. Instead,the Agency uses this portion of itsadvisory as a public health an-nouncement, in which they tellwomen to eat 12 ounces of fish perweek because of the known healthbenefits of fish consumption (vita-min D, omega-3 fatty acids, andprotein, for example). The benefi-cial effects of fish consumptionunder this scenario, however, couldvery easily be outweighed by therisk to the fetus, as a mother-to-beeats methylmercury-contaminatedfish from FDA’s "safe" menu.
In order to examine the extent ofmethylmercury exposure womenand developing fetuses couldexperience, and the margin bywhich FDA’s and EPA’s advisorieserr, we simulated several differentscenarios using the computermodel. Four scenarios are repre-sented in Figure 2. The first repre-
sents the doses that real women,not just the average woman, wouldget if they ate 12 ounces of fish perweek (except for the banned four)throughout pregnancy. Over 28percent of women would have ablood methylmercury level exceed-ing NAS’s recommended benchmarklevel of 5.8 ppb – for at least 30days during pregnancy. Thisanalysis incorporates mercuryexposure from 9 of the top 10 fishand shellfish consumed in the U.S.and 10 additional species consumedless frequently.
The second scenario assumesthat a woman starts her pregnancywith no methylmercury in her body.This assumption is widely known tobe false (CDC 2001), but it is usedby the Agencies to simplify theiranalyses. The effect is to signifi-cantly understate the risk.
When background blood con-centrations are not considered inthe analysis, 24 percent of women,as opposed to 28 percent, exceedthe benchmark blood methylmer-cury level for 30 days during preg-nancy. This four percent differencerepresents 200,000 of the approxi-mately four million women whogive birth in the U.S. each year.
The third scenario is anotherreflection of the importance ofcurrent blood methylmercury levels.It represents the hypothetical caseof women beginning pregnancywith methylmercury levels in theirblood that reflect measured distribu-tions in normal people (Stern 1997and Nixon 1996), and then consum-ing no fish whatsoever. This caseshows that even if pregnant womeneat absolutely no fish throughoutpregnancy, nearly five percent ofthese women would be over the
The beneficial effectsof fish consumptionfrom FDA’s advisorycould easily beoutweighed by therisk to the fetus, as amother-to-be eatsmethylmercury-contaminated fishfrom FDA’s "safe"menu.

28 BRAIN FOOD
safe level of blood mercury for partof their pregnancy just by virtue ofthe fish they ate in the monthsbefore conception (and othersources of methylmercury exposureless significant than fish consump-tion). A new study of a much largerpopulation of women from theCenters for Disease Control andPrevention shows that about 10percent of all women have bloodmethylmercury levels above thebenchmark dose recommended bythe NAS (CDC 2001). The raw datafrom their study, however, are notyet publicly available and are notanalyzed here.
The fourth scenario shows howthe average woman fails to repre-sent the diverse population ofwomen in the U.S. Under EPA’s riskassumptions (Table 2) the averagewoman eating FDA’s 12 ounces offish per week has only a twopercent chance of exceeding thesafe blood level of mercury for anyperiod of time during her preg-nancy. In contrast, when the realworld variability among women isfactored in, a woman has a 44percent chance of exceeding thesafe blood level at some pointduring her pregnancy.
Figure 1. At FDA’s recommended fish consumption levels, about20,000 pregnant women each year would have high mercury bloodlevels for 9 months of their pregnancy.
1 2 3 4 5 6 7 8 90
200,000
400,000
600,000
800,000
1,000,000
1,200,000
Total months during her pregnancy a woman's bloodmercury would exceed the safe level (5.8 ppb)
Num
ber
of p
regn
anci
es e
ach
year
for
whi
ch m
ater
nal
bloo
d m
ercu
r y le
vel w
ould
exc
eed
5.8
ug/L
Source: Environmental Working Group.
Women have a 44percent chance ofexceeding the safeblood level at somepoint during herpregnancy eatingFDA’s recommended12 ounces of fish perweek.

29ENVIRONMENTAL WORKING GROUP AND THE STATE PIRGS
Which fish are safe for pregnantwomen?
How much fish can a woman eatthrough pregnancy if she wants toplay it safe? That depends on thefish she eats, her size, and weight,and a host of biological factorsdescribed above (Table 2).
To gauge which fish are rela-tively more dangerous than others,we calculated the number of mealsa woman could eat of each fish andstill avoid having an unsafe meth-ylmercury level for a month ofpregnancy. We estimated thepercent increase in the number ofwomen whose blood methylmer-cury level would exceed the bench-mark rose for more than 30 daysduring pregnancy, as the number offish meals eaten throughout preg-nancy increase from one, to FDA’srecommendation of 76. The resultsshow that the type and amount offish a woman chooses to eat mat-ters tremendously.
If pregnant women limit theirconsumption of the fish known tobe low in methylmercury, womencan get the nutritional benefits offish consumption without the riskof adverse neurological fetal effects.For the following fish, data fromgovernment and university studiesshow that methylmercury levels areconsistently low:
Trout (farmed)Catfish (farmed)Shrimp * (see endnote)Fish SticksFlounderSalmon (wild Pacific)CroakerBlue crab (mid Atlantic)Haddock
Which fish are not safe forpregnant women?
For more than half of the fish westudied in detail (10 out of 19species), between one 6 ounce fishmeal per pregnancy, and one 6ounce meal a month during preg-nancy, presents an unacceptablelevel of risk. Unacceptable isdefined here as a rate of consump-tion that will cause more than oneout of every 1,000 pregnant womento exceed the NAS benchmarkblood level of methylmercury (5.8ppb) for more than 30 days duringpregnancy.
Four fish species; sea bass, tuna(steaks), halibut, and white croaker,were added to our list of speciesthat pregnant women should avoidcompletely during pregnancy. Forall of these species it is clear that 6ounces of consumption presents asignificant risk of elevated methyl-mercury exposure across the gen-eral population (Figure 3). Asshown in figure 3, by the sixthmonth of pregnancy or sooner,monthly consumption of these fishtranslates into sharply rising risk.Marlin and three fresh watersportfish (pike, largemouth bass,and walleye) were added to our listpregnant women should avoid dueto their very high mercury concen-tration levels.
Ten other species were placedon a "eat with caution" list, whereconsumption must be restricted tono more than one fish on the listper month to keep population-widerisks in the acceptable range. Forsome species on this list, particu-larly tuna (canned), risk starts to riseacross the population after aboutseven months of even this severelyrestricted level of intake.
The type and amountof fish a womanchooses to eat matterstremendously.

30 BRAIN FOOD
Improving FDA’s informationbase
The Environmental WorkingGroup submitted a Freedom ofInformation Act request to the FDAnine months before the release ofthis study (June 2000), requestingmercury testing data in electronicform. Our request was denied forbeing too broad.
As a result, we have no way ofknowing what data the FDA actu-ally has in its files to assess the risksof methylmercury in fish. After athorough review of the literature,numerous conversations and ameeting with FDA staff, however,we must conclude that the Agency'sinformation on methylmercurycontamination for many fish speciesis neither current nor complete.For example, in January 2001, FDAadded king mackerel to the list of
0
5
10
15
20
25
30
35
40
45EWG method with nationally representativefish consumption and biological variabilityconsidering normal mercury backgroundlevels in blood
EWG method with initial blood concentrationsset at zero - fish consumption only source ofHg
Background blood concentrations only - nofish consumption
EPA's scenario (an average woman) - withinitial blood concentrations set at zero
Figure 2. If FDA’s advice to eat 12 ounces of fish per week were adhered, over 28percent of American women would have a blood mercury level that exceeded NAS’srecommended benchmark level of 5.8 ppb – for an entire month of pregnancy.
After a thorough reviewof the literature,numerous conversationsand a meeting with FDAstaff, however, we mustconclude that theAgency's informationon methylmercurycontamination for manyfish species is neithercurrent nor complete.
Source: Environmental Working Group. Note: all scenarios assume consumption of 12 ounces of fishper week.
Months a fetus is exposed to methyl mercury above the NAS benchmark level
Perc
ent o
f bab
ies
expo
sed
in-u
tero
to m
ethy
lmer
cury
leve
ls a
bove
the
benc
hmar
k do
se
1 2 3 4 5 6 7 8 9

31ENVIRONMENTAL WORKING GROUP AND THE STATE PIRGS
fish pregnant women should not eatbased on information from a 1979study of mercury contaminationlevels.
Apparently FDA scientists haveno more recent information onwhich to judge contamination levelsin king mackerel. Based on ourconversation with Agency staff wemust conclude that this absence ofcurrent data applies to many otherspecies as well.
EWG did ultimately receivepaper copies of FDA data – 132pages of mercury testing results –from Michael Bender of the MercuryPolicy Project, who had receivedpaper copies of the data from theAgency a year ago.
EWG analysts hand-entered these132 pages of test results into anelectronic database. They wereused along with thousands of othermethylmercury test results from
In January 2001, FDAadded king mackerelto the list of fishpregnant womenshould not eat basedon information from a1979 study ofmercurycontamination levels.
Figure 3. A number of fish on FDA’s safe list present unacceptable risk to pregnant women andtheir babies.
Source: Environmental Working Group.
Number of six ounce meals eaten throughout pregnancy
Perc
ent I
ncre
ase
in th
e nu
mbe
r of
wom
en w
hose
blo
od m
ercu
ry le
vel
wou
ld e
xcee
d th
e be
nchm
ark
dose
for
mor
e th
an a
mon
th o
f pre
gnan
cy
One mealper month
Two mealsper month
1 2 3 4 5 6 7 8 9 10 11 12 13 14 15 16 17 18 19 200.0
0.2
0.4
0.6
0.8
1.0
1.2
1.4
1.6
1.8
2.0
Salmon
Catfish (farmed)
Fish Sticks
Trout (farmed)
Atlantic Crab
Summer Flounder
Shrimp
Atlantic Croaker
Haddock
Pollock
Cod
Oyster
Mahi mahi
Blue Mussel
Canned Tuna
White Croaker
Halibut
Tuna steaks
Sea Bass

32 BRAIN FOOD
other agencies in the exposureanalyses presented in this study.
Priorities for monitoring
A 1997 analysis published byFDA scientists lists 13 fish with anaverage mercury concentration at orabove that for canned tuna (Cramer1997) (Table 3).
Our analyses show that fish withthis amount of mercury pose anunacceptable level of risk across thepopulation for adverse neurologicaleffects to the fetus if consumed justonce a month. These data, however,are now over 20 years old. Twenty-five years has brought significantincreases in global mercury emis-sions and significant increases infish consumption. As a first step inprotecting women from methylmer-cury, FDA must improve monitoringof these potentially contaminatedfish and make the results availableto the public.
Atlantic codPacific codFlounder, various speciesGrouper, blackGrouper, redHalibutSand perchWhite perchPollockRed snapperDover soleTuna, various speciesYellowtail
Table 3. Mercury contaminatedfish identified more than 20years ago.
Endnote
* Shrimp fishing and farming practices haveraised serious environmental concerns.)
33ENVIRONMENTAL WORKING GROUP AND THE STATE PIRGS
Fifteen states do nothave a routinemonitoring programin place to testmercury levels in fishtissue.
The Chaotic Web of State MercuryAdvisories
Chapter 4
U.S. PIRG compared differentsystems used by the states to issuefish consumption advisories. Thesesystems vary widely from state tostate, resulting in a situation that isboth confusing to consumers and,in many cases, inadequately protec-tive of the health of a growingfetus or child. These systems varyin several key elements. Manystates do not monitor their waterbodies routinely for mercurycontamination in fish. If a state isnot testing for mercury contamina-tion in fish, they cannot be protect-ing residents from mercury expo-sure. A further inconsistency is thatthe levels of mercury contaminationthat trigger advisories vary by afactor of more than 10 among thestates, so that residents of somestates can be exposed to signifi-cantly higher levels of mercurythan others before the state issuesan advisory. Finally, the advicethat states give their consumersabout how much fish should beconsumed at a given contaminationlevel varies widely as well.
Inadequate monitoring
Fifteen states do not have aroutine monitoring program inplace to test mercury levels in fishtissue, and five states monitormercury contamination somewhatroutinely, meaning that sometesting is performed, although not
on a consistent basis. Thus, even ifa state has a system for issuingadvisories at reasonably low levelsof mercury contamination, scores ofwater bodies will not be tested forcontamination.
It is important to note that moststates with no routine monitoringalso have very few fish consump-tion advisories – some of thesestates might find mercury contami-nation that merits issuing an advi-sory if they implemented routinemonitoring programs. There are afew states listed as having “no orsomewhat routine monitoring” thatdo have active advisories based onmonitoring performed in the past.In addition, a few states have erredon the side of caution by issuingstatewide advisories even though amonitoring system is not in place,or not all waters have been tested.New Jersey and Massachusetts aretwo states taking this precautionarymeasure and advising their residentsto avoid potential harm. Thefollowing states do not monitor fishfor mercury contamination: Ari-zona, Arkansas, Colorado, Connecti-cut, Hawaii, Idaho, Nevada, NorthDakota, Oregon, Rhode Island,Texas, Utah, Washington, WestVirginia, and Wyoming. The fol-lowing states perform somewhatroutine monitoring: Alaska, Califor-nia, Massachusetts, Montana, andNew Mexico.

34 BRAIN FOOD
EPA should determinethe level of mercurycontamination in fishthat will protect atleast 999 out of every1,000 pregnantwomen exposed, andrecommend this levelas the trigger for fishadvisories.
Varying threshold levels
Much of the inconsistencyamong the state advisory systemscomes from the different levels ofmercury contamination in fish thatstates use to determine when toissue an advisory. Most states followeither FDA’s or EPA’s guidance,although some have performedtheir own scientific assessments toset thresholds of mercury contami-nation (Table 4).
Nine states issue advisories whenmercury contamination reachesFDA’s action level of one ppm.FDA’s action level is inadequate toprotect public health, and particu-larly the health of a growing fetusor child (see Chapter 3).
Other states follow EPA’s guid-ance, which advise limiting mercuryintake to 0.1 micrograms of mercuryper kilogram of body weight perday. States use assumptions or dataon fish consumption rates and bodyweights to determine how muchmercury can be “safely” present infish in order to avoid exceeding thereference dose. This is intended toprovide flexibility for states todetermine action levels based onthe characteristics of their popula-tion, on the notion that people whoweigh more can “safely” ingestmore mercury, or that people whoeat fish less often can ingest moremercury when they do eat fish. Inpractice, however, the flexibilitymodel has resulted in inappropriateadvisory systems in many states.These arise from a variety of flawsin implementation – states may basetheir extrapolations on assumptionsabout body weight or fish consump-tion from national averages ratherthan state-specific data. The more astate uses factors like average
consumption rates for a given bodyof water or species of fish to tailorconsumption advice, the less theadvisory will protect someone towhom the average does not apply.The person who eats the speciesmost others do not or who con-sumes fish more often from bodiesof water that few others consumefrom will not be protected by theadvisory.
While FDA’s recommendedthreshold of one ppm of mercuryin fish tissue is too high to beprotective of fetal health and child-hood development, its one virtue isits simplicity and, in theory, itsconsistency. If the threshold werean enforceable tolerance, any fishabove the threshold, regardless ofspecies or where it was caught,would be under an advisory forhuman consumption. EPA’s advisedreference dose for mercury inges-tion, on the other hand, results in asystem where different levels ofmercury contamination in fish willbe considered safe or unsafe bydifferent states. To make advisoriessimpler and more protective, EPAshould determine the level ofmercury contamination in fish thatwill protect at least 999 out of every1,000 pregnant women exposed,and recommend this level as thetrigger for fish advisories. Cur-rently, no state fish advisory meetsthis standard of public healthprotection except Massachusetts,which advises pregnant women toavoid all fish from state waters.This level should trigger an advi-sory regardless of location orspecies.
Other states follow neither EPA’snor FDA’s advice, but rather usetheir own scientists and risk assess-ments to determine the level at
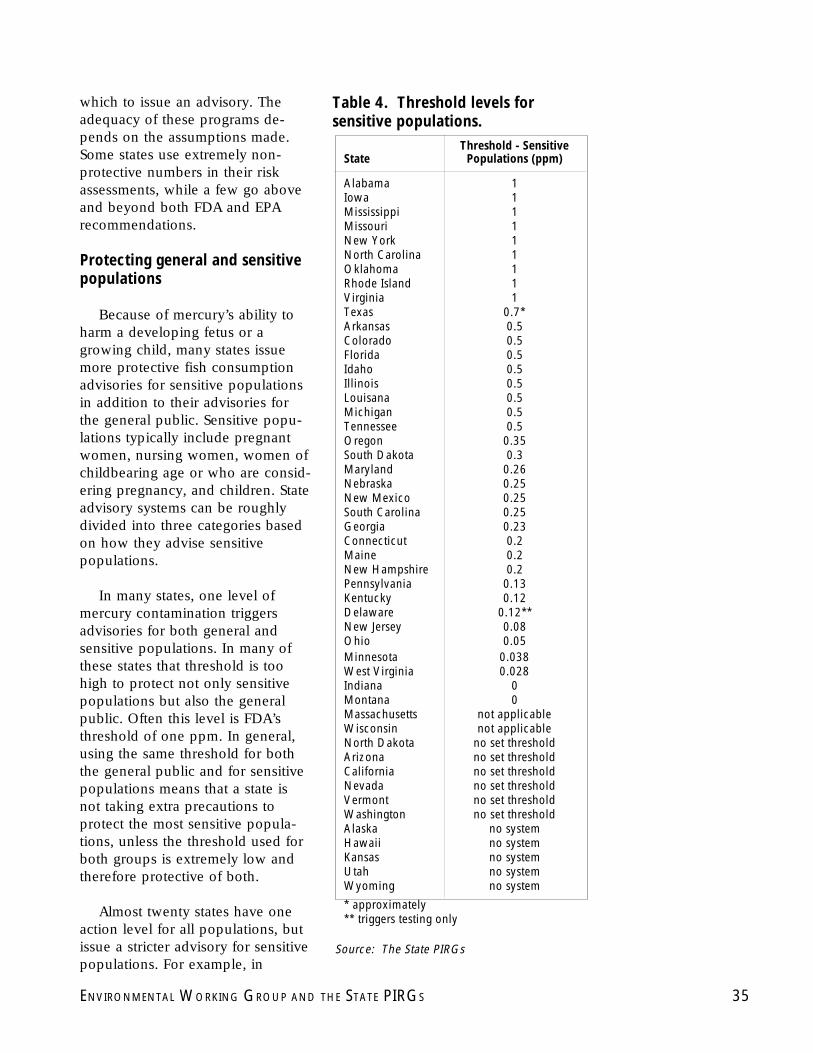
35ENVIRONMENTAL WORKING GROUP AND THE STATE PIRGS
StateThreshold - Sensitive Populations (ppm)
Alabama 1Iowa 1Mississippi 1Missouri 1New York 1North Carolina 1Oklahoma 1Rhode Island 1Virginia 1Texas 0.7*Arkansas 0.5Colorado 0.5Florida 0.5Idaho 0.5Illinois 0.5Louisana 0.5Michigan 0.5Tennessee 0.5Oregon 0.35South Dakota 0.3Maryland 0.26Nebraska 0.25New Mexico 0.25South Carolina 0.25Georgia 0.23Connecticut 0.2Maine 0.2New Hampshire 0.2Pennsylvania 0.13Kentucky 0.12Delaware 0.12**New Jersey 0.08Ohio 0.05Minnesota 0.038West Virginia 0.028Indiana 0Montana 0Massachusetts not applicableWisconsin not applicableNorth Dakota no set thresholdArizona no set thresholdCalifornia no set thresholdNevada no set thresholdVermont no set thresholdWashington no set thresholdAlaska no systemHawaii no systemKansas no systemUtah no systemWyoming no system
* approximately** triggers testing only
Source: The State PIRGs
Table 4. Threshold levels forsensitive populations.
which to issue an advisory. Theadequacy of these programs de-pends on the assumptions made.Some states use extremely non-protective numbers in their riskassessments, while a few go aboveand beyond both FDA and EPArecommendations.
Protecting general and sensitivepopulations
Because of mercury’s ability toharm a developing fetus or agrowing child, many states issuemore protective fish consumptionadvisories for sensitive populationsin addition to their advisories forthe general public. Sensitive popu-lations typically include pregnantwomen, nursing women, women ofchildbearing age or who are consid-ering pregnancy, and children. Stateadvisory systems can be roughlydivided into three categories basedon how they advise sensitivepopulations.
In many states, one level ofmercury contamination triggersadvisories for both general andsensitive populations. In many ofthese states that threshold is toohigh to protect not only sensitivepopulations but also the generalpublic. Often this level is FDA’sthreshold of one ppm. In general,using the same threshold for boththe general public and for sensitivepopulations means that a state isnot taking extra precautions toprotect the most sensitive popula-tions, unless the threshold used forboth groups is extremely low andtherefore protective of both.
Almost twenty states have oneaction level for all populations, butissue a stricter advisory for sensitivepopulations. For example, in

36 BRAIN FOOD
Nine states continueto issue advisories atFDA’s extremely highmercurycontamination level ofone ppm: Alabama,Iowa, Mississippi,Missouri, New York,North Carolina,Oklahoma, RhodeIsland, and Virginia.
A complete review ofall state fishconsumption advisorysystems shows thatwhile some states arefar better than others,nearly all (49 out of50) statesinadequately protectthe health of sensitivepopulations frommethylmercury.
Florida, mercury contamination at0.5 ppm triggers an advisory forboth populations. However, theadvisory for the general populationis one meal per week, and theadvisory for sensitive populationsis one meal per month. WhileFlorida’s system and others like itare an improvement over across-the-board thresholds, they will notbe protective of fetal health unlessthe single threshold is set ex-tremely low to protect sensitivepopulations. In Florida’s case,although one meal per month is astep in the right direction, 0.5 ppmis too high a level of mercurycontamination to protect a devel-oping fetus or growing child.
Some states increase protectionfor sensitive populations by usinga separate threshold to issueadvisories for sensitive popula-tions. This system can be protec-tive if thresholds are low enough.For example, New Jersey uses a0.35 ppm threshold for the generalpopulation and 0.08 ppm forsensitive populations. New Jersey’sthreshold for sensitive populations(and general populations) isamong the lowest in the country,meaning New Jersey’s residents areamong the first in the country toknow if mercury levels in fish startto rise. By contrast, however,Oklahoma uses a 1.5 pppm thresh-old for the general population, andone ppm for sensitive populations.Oklahoma’s thresholds allow amuch higher level of mercurycontamination in fish beforewarning residents of the hazardand are clearly less protective.Although Oklahoma has no fishconsumption advisories at all formercury, it should be noted thatmercury would have to reachextremely high levels of contami-
nation before Oklahoma wouldissue an advisory.
How the states stack up
A complete review of all statefish consumption advisory systemsshows that while some states are farbetter than others, nearly all (49 outof 50) states inadequately protectthe health of sensitive populationsfrom methylmercury. See AppendixD for more detail. Adequate pro-tection is defined here as no morethan 1 in 1,000 women exceedingthe NAS benchmark dose formethylmercury in maternal bloodfor 30 days during pregnancy.Based on the level of methylmer-cury contamination at which statesbegin to issue advisories, in allstates, with the exception of Massa-chusetts, women will exceed thislevel of risk.
Nine states continue to issueadvisories at FDA’s extremely highmercury contamination level of oneppm: Alabama, Iowa, Mississippi,Missouri, New York, North Carolina,Oklahoma, Rhode Island, andVirginia. While the amount ofconsumption recommended underthese advisories ranges from noconsumption to four 8-ounce mealsper month, allowing this level ofmercury in fish before issuing anadvisory is not protective of fetalhealth or childhood development.
A few states issue advisories thatrecommend no fish consumption atrelatively low levels of mercurycontamination. For example,Connecticut advises sensitivepopulations to avoid consumptionof fish completely when mercurycontamination in fish tissue reaches0.2 ppm. However, consumptionof even one 8-ounce meal per

37ENVIRONMENTAL WORKING GROUP AND THE STATE PIRGS
month of fish contaminated at thislevel (or just below it) can exposethe developing fetus to harmfullevels of mercury. In fact, unless astate issues advisories recommend-ing that sensitive populationsconsume no fish above a mercurycontamination level of approxi-mately 0.05 ppm, more than 1 in1,000 pregnancies could be ex-posed to unacceptably high levelsof mercury.
Some states begin to issueadvisories at levels low enough topotentially protect fetal health andchildhood development, but thesedo not recommend that womenavoid fish consumption completelywhen levels rise above 0.05 ppm.States issuing limited consumptionadvisories at levels at or below 0.05ppm include: Montana and Indiana(both begin to issue advisories atthe lowest detectable level ofmercury contamination), WestVirginia, Minnesota, and Ohio.
Arizona, California, Delaware,Nevada, Vermont, and Washingtonissue advisories using risk assess-ments on a case-by-case basis,meaning that there is no set level ofmercury contamination that triggersan advisory. North Dakota has noset level at which it issues anadvisory, but employs a statewideadvisory based on EPA’s referencedose. In many of these states,
officials take into account not onlythe level of contamination, but alsoother variables like the degree towhich a body of water is used forrecreational fishing or the frequencythat a given species is caught oreaten.
While some variables do changewith respect to water body orspecies, the amount of mercury thatcan do harm to human health doesnot.
Five states, Alaska, Hawaii,Kansas, Utah, and Wyoming, cur-rently have no system for issuingadvisories. For certain states, mer-cury contamination may not be amajor problem. For others, there issimply no routine monitoring formercury contamination. Of thesefive states, only Kansas routinelymonitors mercury contamination inwater.
Massachusetts is the only statethat adequately protects fetal healthand childhood development. Massa-chusetts’ statewide advisory advisesno consumption for all lakes andrivers in the state no matter whatlevel of mercury is present. Thissends a straightforward messageand does not require consumers toknow which species are on whattype of limited consumption advi-sory and which water body theadvisory applies to.

38 BRAIN FOOD
39ENVIRONMENTAL WORKING GROUP AND THE STATE PIRGS
Health TrackingRecommendations
Chapter 5
When the first cases of West Nilevirus were discovered on the EastCoast, one of the first actions takenby health officials was to establishmulti-state tracking and monitoringso that they would immediatelyknow when and where West Nilevirus was occurring. But when itcomes to most chronic diseases andpotentially related environmentalexposures to toxic substances wehave not made the same connom-sense investment.
The Centers for Disease Controland Prevention (CDC) has justbegun to track Americans’ exposureto methylmercury throughbiomonitoring, the testing of tissuesamples for the metal. But, this islimited to a broad federal surveyand there are no state or local datato inform health officials wheremercury levels are highest or lowestin the American population. Simi-larly, there is no comprehensivetracking of when and where chil-dren experience developmental andneurological deficits that have beenlinked to mercury exposure. Know-ing when and where Americans areexposed to the highest levels ofmercury and other neurological anddevelopmental toxicants and whenand where American childrendisplay health impacts that could berelated is a basic step in fightingenvironmental impacts on health.
The State PIRGs, EWG, and agrowing coalition of health andenvironmental organizations arecalling on Congress and the CDC toestablish a comprehensive nation-wide health tracking network withseveral key components, listedbelow.
A comprehensive nationwideenvironmental health trackingnetwork is a key first step towardassessing the impacts of a range ofenvironmental hazards on publichealth. Such a system wouldprovide vital information to healthcare providers and agencies work-ing to protect public health.
• The network should begin inall 50 states by tracking:asthma and chronic respira-tory diseases, birth defects,developmental and neurologi-cal conditions like thoselinked to mercury exposure,and cancers. The tracking ofhuman exposures to hazardswould start with prioritiesincluding PCBs and dioxin,heavy metals such as mercuryand lead, pesticides, andwater and air contaminants.
• An Early Warning Systemwould alert communities toimmediate health crises suchas heavy metal and pesticide
A comprehensivenationwideenvironmental healthtracking network is akey first step towardassessing the impactsof a range ofenvironmentalhazards on publichealth.

40 BRAIN FOOD
poisonings. Similar to themonitoring currently in placefor an outbreak of an infec-tious disease, this alert wouldhelp local communitiesidentify more quickly and actimmediately on health crisesfrom environmental expo-sures.
• Pilot Programs would allow20 different regional and stateinitiatives to investigate localenvironmental health priori-ties, provide flexibility forlocal officials, allow commu-nity groups to gather moreinformation and serve as amodel for potential inclusionin the nationwide network.
• Federal, state and local rapidresponse capability wouldenable health officials toinvestigate clusters, outbreaksand emerging threats. Torespond effectively andprotect the public fromillness, health officials mustbe well-equipped and trained,and the network must besupported through state and
federal resources. Steps takento improve states’ capacityshould include placing anEnvironmental Health Investi-gator in every state andtraining health officials inenvironmental epidemiology.
• Support of community inter-ests and scientific researchwill be crucial to furtherhealth tracking efforts. FiveCenters of Excellence shouldbe funded for environmentalhealth research and training,and partnering with commu-nities. Communities and thepublic have the right to knowinformation that could safe-guard their health; the infor-mation made availablethrough the tracking networkshould be accessible to thepublic. Input from localgroups on the design andimplementation of the track-ing and monitoring of chronicdisease and environmentalhazards will be needed toensure the success of theNationwide Health TrackingNetwork.

41ENVIRONMENTAL WORKING GROUP AND THE STATE PIRGS
Appendix AExposure Assessment Methodology
Appendix A
Summary
The Environmental Working Group (EWG) has developed a computationalprocedure that allows for the calculation of time-dependent mercury concentra-tions in the blood of a woman who eats seafood during her pregnancy.
These procedures combine work done by Stern (1997) on biological variabil-ity and Ginsberg and Toal (2000) on non-steady state modeling of mercury inblood. On top of these two pieces of work, we add a new piece: the concen-trations of mercury in fish from a compilation of seven government databasescompiled by EWG. With these three components, we are able to estimate theconcentrations of mercury in a woman’s blood, with time, throughout a preg-nancy, after each meal of fish she eats.
The procedure is a probabilistic model based on Monte Carlo methodswhich incorporate measured variability in body weight, background levels ofmercury in blood (used as initial concentrations in the model), the body’sabsorption of mercury, and the decay rate of mercury in blood. Monte Carlotechniques are also used to account for variability of mercury in fish. Themercury data used are 52,395 records compiled by EWG that comprise publicly-available fish tissue data from seven government databases maintained by theEnvironmental Protection Agency (EPA), the Food and Drug Administration(FDA), and the National Oceanic and Atmospheric Administration (NOAA).These concentrations in fish tissue serve as exposure concentrations for apregnant woman eating one or more servings of fish throughout her pregnancy.
In the model, mercury from fish is absorbed through the gut, distributed tothe blood, and is subsequently redistributed in and excreted from the bodyconsistent with the National Academy of Science’s recent review of the toxicityof methylmercury (NAS, 2000). Biological variability in absorption, distribution,and decay of mercury in blood is represented by the statistical distributionspresented in Stern (1997).
Our model allows us to calculate the probability that the concentration ofmercury in the blood of a pregnant woman would be above a level of concernfor a specified period of time, and for a specified amount of fish eaten duringpregnancy. Model parameters used in the model are summarized in Table 5.
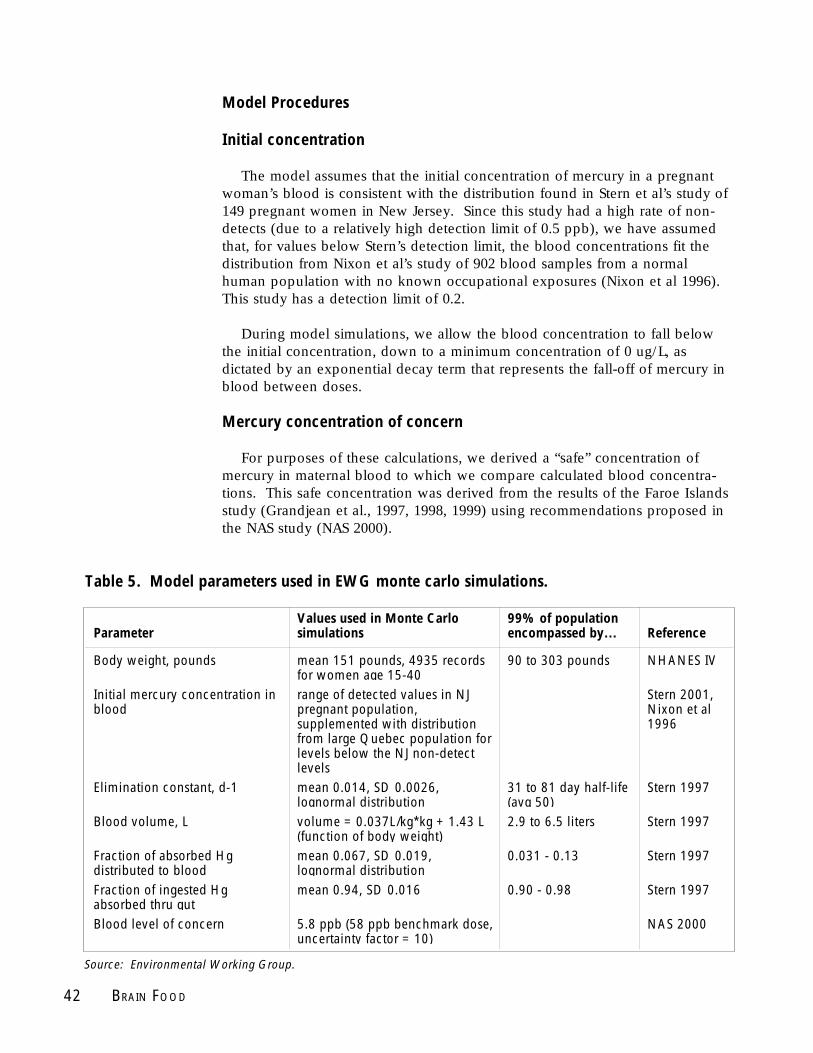
42 BRAIN FOOD
ParameterValues used in Monte Carlo simulations
99% of population encompassed by… Reference
Body weight, pounds mean 151 pounds, 4935 records for women age 15-40
90 to 303 pounds NHANES IV
Initial mercury concentration in blood
range of detected values in NJ pregnant population, supplemented with distribution from large Quebec population for levels below the NJ non-detect levels
Stern 2001, Nixon et al 1996
Elimination constant, d-1 mean 0.014, SD 0.0026, lognormal distribution
31 to 81 day half-life (avg 50)
Stern 1997
Blood volume, L volume = 0.037L/kg*kg + 1.43 L (function of body weight)
2.9 to 6.5 liters Stern 1997
Fraction of absorbed Hg distributed to blood
mean 0.067, SD 0.019, lognormal distribution
0.031 - 0.13 Stern 1997
Fraction of ingested Hg absorbed thru gut
mean 0.94, SD 0.016 0.90 - 0.98 Stern 1997
Blood level of concern 5.8 ppb (58 ppb benchmark dose, uncertainty factor = 10)
NAS 2000
Model Procedures
Initial concentration
The model assumes that the initial concentration of mercury in a pregnantwoman’s blood is consistent with the distribution found in Stern et al’s study of149 pregnant women in New Jersey. Since this study had a high rate of non-detects (due to a relatively high detection limit of 0.5 ppb), we have assumedthat, for values below Stern’s detection limit, the blood concentrations fit thedistribution from Nixon et al’s study of 902 blood samples from a normalhuman population with no known occupational exposures (Nixon et al 1996).This study has a detection limit of 0.2.
During model simulations, we allow the blood concentration to fall belowthe initial concentration, down to a minimum concentration of 0 ug/L, asdictated by an exponential decay term that represents the fall-off of mercury inblood between doses.
Mercury concentration of concern
For purposes of these calculations, we derived a “safe” concentration ofmercury in maternal blood to which we compare calculated blood concentra-tions. This safe concentration was derived from the results of the Faroe Islandsstudy (Grandjean et al., 1997, 1998, 1999) using recommendations proposed inthe NAS study (NAS 2000).
Source: Environmental Working Group.
Table 5. Model parameters used in EWG monte carlo simulations.
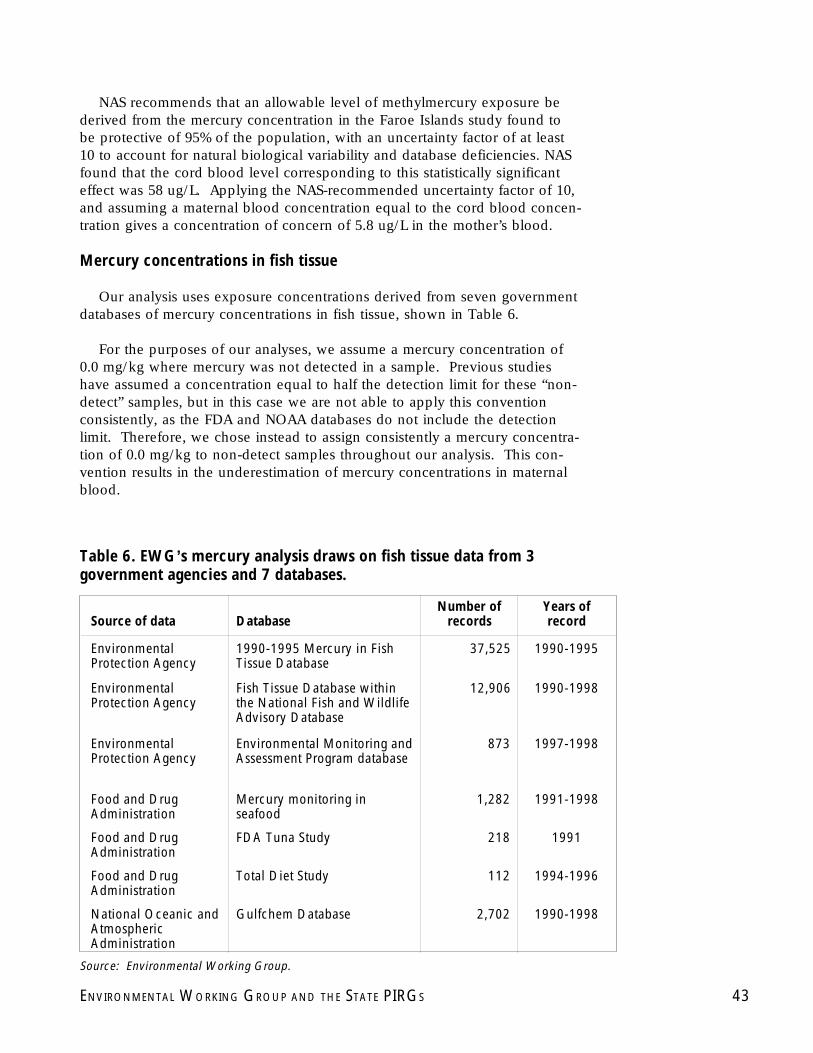
43ENVIRONMENTAL WORKING GROUP AND THE STATE PIRGS
NAS recommends that an allowable level of methylmercury exposure bederived from the mercury concentration in the Faroe Islands study found tobe protective of 95% of the population, with an uncertainty factor of at least10 to account for natural biological variability and database deficiencies. NASfound that the cord blood level corresponding to this statistically significanteffect was 58 ug/L. Applying the NAS-recommended uncertainty factor of 10,and assuming a maternal blood concentration equal to the cord blood concen-tration gives a concentration of concern of 5.8 ug/L in the mother’s blood.
Mercury concentrations in fish tissue
Our analysis uses exposure concentrations derived from seven governmentdatabases of mercury concentrations in fish tissue, shown in Table 6.
For the purposes of our analyses, we assume a mercury concentration of0.0 mg/kg where mercury was not detected in a sample. Previous studieshave assumed a concentration equal to half the detection limit for these “non-detect” samples, but in this case we are not able to apply this conventionconsistently, as the FDA and NOAA databases do not include the detectionlimit. Therefore, we chose instead to assign consistently a mercury concentra-tion of 0.0 mg/kg to non-detect samples throughout our analysis. This con-vention results in the underestimation of mercury concentrations in maternalblood.
Source of data DatabaseNumber of
recordsYears of record
Environmental Protection Agency
1990-1995 Mercury in Fish Tissue Database
37,525 1990-1995
Environmental Protection Agency
Fish Tissue Database within the National Fish and Wildlife Advisory Database
12,906 1990-1998
Environmental Protection Agency
Environmental Monitoring and Assessment Program database
873 1997-1998
Food and Drug Administration
Mercury monitoring in seafood
1,282 1991-1998
Food and Drug Administration
FDA Tuna Study 218 1991
Food and Drug Administration
Total Diet Study 112 1994-1996
National Oceanic and Atmospheric Administration
Gulfchem Database 2,702 1990-1998
Source: Environmental Working Group.
Table 6. EWG’s mercury analysis draws on fish tissue data from 3government agencies and 7 databases.

44 BRAIN FOOD
Consumption of fish
We look at two major scenarios – one to simulate FDA’s advisory statingthat women can safely eat 12 ounces of fish per week as long as those fish donot include shark, swordfish, king mackerel and tilefish; and another to simu-late EPA’s advisory that pregnant women can safely eat one gamefish perweek.
For the FDA scenario, we assume a pregnant women eats two six-ounceservings of fish per week. For the EPA scenario, we assume a woman eats one8-ounce portion of fish each week. In both scenarios, the mercury concentra-tion in fish is chosen randomly from our fish concentration database.
EPA reports an 8 ounce portion of fish to be the 95th percentile consump-tion quantity for females age 19 through 34, based on their analysis of theUnited States Department of Agriculture’s (USDA’s) Continuing Survey of FoodIntake by Individuals (CSFII) database (EPA 1997). Their estimates, however,include meals for which fish is not necessarily the main course, and alsoinclude data on consumption of canned tuna fish, which is typically packagedin six-ounce portions. In fact, canned tuna consumption, plain or as tunasalad, accounts for 30% of the available fish consumption data for women ofchildbearing age in the CSFII database, and the quantities consumed tend to beless than those corresponding to fish fillets. EPA’s estimates are, therefore,strong indicators of canned tuna consumption, but not necessarily consumptionof fish fillets.
Using CSFII data, we calculated consumption numbers corresponding to fishfillets only, exclusive of canned tuna and other types of seafood. We includedin our analysis fish fillets for which the cooking method was recorded assteamed, poached, broiled, or baked, as these methods of cooking would tendto add little weight to the fish (relative to breading or frying). From this analy-sis, we find that the 95th percentile consumption amount for women of child-bearing age (ages 13 through 50, inclusive), is about 11 ounces, or about 40%greater than EPA’s estimate. The 8 ounce serving we have assumed for thesepreliminary analysis corresponds to about the 91st percentile consumption forwomen of childbearing age – in other words, women eat more than 8 ouncesof fish in nearly 1 of every 10 meals of fish.
Absorption and distribution of methylmercury
The fraction of ingested mercury absorbed from the gut to the blood is arandom variable in our model which fits the normal distribution given in Stern(1997) – with mean of 0.94 and a standard deviation of 0.016.
The amount of the absorbed mercury that is distributed to the blood is alsotreated as a random variable in the model, using the log-normal distributionpresented by Stern (1997) – with mean of 0.067 and a standard deviation of0.019. In our model absorption and distribution to the blood occurs instanta-neously.

45ENVIRONMENTAL WORKING GROUP AND THE STATE PIRGS
A woman’s blood volume is also treated as a random variable in this model.Using all weight data for women of childbearing age from NHANES IV, wecalculate a blood volume from the equation given in Stern (1997):
BV = 0.037*weight + 1.43 (Equation 1)
where: BV = blood volume in liters; weight = body weight in kilograms
In our model, then, the concentration of mercury in a woman’s blood imme-diately after she eats a fish is calculated as:
Ct = Co + (CfishW/BV)K1K2 (Equation 2)
where: Ct and Co = concentrations of mercury in blood immediately followingand immediately prior to ingestion of contaminated seafood, respectively (ug/L), where ingestion occurs at time t; W = weight of fish portion consumed (g) –assumed in this analysis to be 8 ounces, or 227 g; BV = blood volume (L) –random variable in our analysis; K1 = fraction of methylmercury absorbed bygut; and K2 = fraction of absorbed methylmercury that is distributed to blood.
Decay of mercury concentrations in blood
In our model, we assume mercury in blood decays in time with half-lifeconsistent with the distribution presented in Stern (1997). Stern calculates adecay constant represented by a lognormal distribution with a mean of 0.014 d-1
and a standard deviation of 0.0026 d-1. This decay constant is a randomvariable in our model.
The concentration of mercury in blood following ingestion of fish is there-fore calculated as:
Ct = Coexp(-kt) (Equation 3)
where: Ct = concentration of mercury in blood at time t (ug/L); Co = concentra-tion of mercury in blood immediately following ingestion of seafood (this termis represented as Ct in Equation 2); k = decay constant chosen randomly fromthe assumed lognormal distribution; and t = time over which mercury is al-lowed to decay, or in our case, time between fish consumption (days). Notethat Ct is constrained in our analysis by a lower bound of 0.0 ug/L.
Calculation of probability of exceeding blood mercury level of concern
The probability of exceeding blood mercury levels of concern throughout awoman’s pregnancy is calculated using Monte Carlo techniques to chooseconcentrations of mercury corresponding to meals of fish a pregnant woman isassumed to eat.
The model pulls records from the fish tissue database compiled by EWGaccording to the individual or group of species we specify as input data for
46 BRAIN FOOD
each model run. These records contain mercury concentrations in fish tissuethat, in the Monte Carlo portion of the analysis, serve as exposure concentra-tions for individual meals.
If a group of species is selected, the model will, during the simulation, eithergive equal weight to the individual species when randomly choosing a tissueconcentration to serve as an exposure dose, or will weight the species accord-ing to parameters in the input file, if we know the relative consumption ofindividual species among the general population and can provide this data.(We know, for example, the relative frequency with which various species ofsalmon are eaten, and can therefore provide weighting factors in a salmonconsumption analysis that cause the model to choose samples consistent withthose weighting factors.)
A “simulation” of this model refers to a scenario in which the mercuryconcentration in a pregnant woman’s blood is modeled through the entireperiod of gestation, given a particular species or group of fish she will consumeduring her pregnancy, and given a specified number of evenly-spaced (in time)meals of fish she will eat throughout her pregnancy.
The answers from the model are a sequence of probabilities that, given acertain number of fish and type of fish eaten throughout pregnancy, a woman’sblood mercury level would exceed the level of concern for at least x days, withx ranging from less than 1 day up to the entire period of gestation (265 days).
The total time of exceedence in any given simulation is the sum of all indi-vidual exceedence times that follow each meal of fish:
Etotal = Σ Ei (Equation 4)
where: Etotal = total time during pregnancy for which mercury blood concentra-tion exceeds the level of concern (days); and Ei = total time immediately follow-ing an individual meal of fish for which mercury blood concentration exceedsthe level of concern (days); and i = the number of meals of fish consumed by awoman during the length of her pregnancy – set as a basic input parameter foreach simulation. Meals of fish are assumed in the model to be evenly-spacedthroughout pregnancy.
47ENVIRONMENTAL WORKING GROUP AND THE STATE PIRGS
The probability of exceedence is initially calculated after a large number ofMonte Carlo-based simulations are completed for a given simulation:
Pi = (Σ i n Et>i)/ntotal (Equation 5)
where: Pi = the probability that a woman’s blood mercury concentration willbe above the level of concern for at least i days during her pregnancy, given aspecified number of meals and types of fish eaten through pregnancy;
Σ i n Et>i is the total number of Monte Carlo runs for which the simulatedexceedence time Et (calculated as Etotal in equation 4) is greater than i days; andntotal = the total number of Monte Carlo runs completed.
A new probability array is calculated after another sequence of Monte Carlo-based simulations. The new probability array is compared to the previous arrayuntil convergence, with new sequences of Monte Carlo-based simulationsconducted as many times as necessary. When subsequent solutions are foundto be essentially the same, the simulation is complete. We find that a conver-gence criteria of 0.1 percent between the old and the updated probability arraysis sufficient for these simulations.
FDA’s New Advisory
FDA’s updated fish advisory states that pregnant women can safely eat 12ounces of fish per week if the species of fish eaten exclude all shark, swordfish,king mackerel, and tilefish. This is the model scenario we have constructed.
This scenario includes canned tuna, tuna steaks, shrimp, crab, salmon,pollock including fishsticks, haddock, channel catfish and lake trout. In thisscenario, fish consumption – that is, the type of fish chosen for a particular runin the Monte Carlo simulation — is weighted by the actual amount of each typeof fish eaten per year in the U.S. So, for instance, canned tuna is much morelikely to be chosen in a particular model run than is tuna steak, which is eatenmuch less frequently.
Model results are described in the main body of this report.

48 BRAIN FOOD

49ENVIRONMENTAL WORKING GROUP AND THE STATE PIRGS
Appendix B:State Survey Method
Appendix B
State Surveys
The raw data used for this report comes from a phone survey of each of thefifty states. State contacts at Departments of Health or Departments of Environ-mental Protection, depending on who was responsible in each state for issuingthe advisories, were asked the following questions:
• How many fish consumption advisories for mercury are there in the state?
• Is there a statewide advisory?
• What is the threshold (in parts per million) used to issue a fish consump-tion advisory for the general population?
• What is the threshold (in parts per million) used to issue a fish consump-tion advisory for sensitive populations?
• How is that threshold decided upon?
• Does that threshold trigger NO or LIMITED consumption? If limited,
Please describe what level of fish consumption is recommended at thethreshold level indicated above for both sensitive and general populations(i.e., how many ounces of fish is a person advised to consume at theindicated threshold level?).
Also, if there is a statewide advisory, what level of fish consumption isrecommended at the threshold for the statewide advisory?
• Are advisories issued based on average fish tissue data, highest concen-tration, or another method?
• How are advisories publicized?
• Is there a routine monitoring system in place in the state for testing waterfor mercury contamination?
The surveyor contacted the appropriate officials in each state. The data wasthen summarized state by state, and each official was contacted again for

50 BRAIN FOOD
verification of the information given. Information from approved fact sheets wasput into shorter form for the purposes of this report.
Number of Advisories and Statewide Advisories
The figures listed for number of advisories and statewide advisories comefrom data given to U.S. PIRG by Jeffrey Bigler at U.S. EPA. It is also available onEPA’s 1999 National Listing of Fish Consumption Advisories, http://www.epa.gov/ost/fish. For purposes of consistency, data given to us by EPAwas used, although there were some slight changes in the year following therelease of the most recent data, and data given to us by the states may havediffered slightly.
Evaluating State Advisory Systems
Evaluations of state advisory systems were based on the level of mercurycontamination at which the state advises sensitive populations to avoid fishconsumption completely. Fish advisories in 49 states do not protect the healthof sensitive populations based on a probabilistic assessment of the risks allowedunder each advisory. Fish advisories are considered adequate when they allowno more than one of every 1,000 pregnancies to exceed the NAS benchmarkblood level for mercury for 30 days. Eleven states do not have a set thresholdfor issuing advisories or do not have a fish consumption advisory system inplace.

51ENVIRONMENTAL WORKING GROUP AND THE STATE PIRGS
Blue mussel
Domestic blue mussel comes primarily from Maine, and to a lesser extent from Washington. Of the 979metric tons landed in 1999, 84 percent (821 metric tons) came from Maine, and 15 percent (94 metrictons) came from Washington.
Imports dominate the market. In 1999 less than one percent of the mussels consumed in the U.S. weredomestic. In 1999 U.S. landings were 979 metric tons; imports were 15862 metric tons; exports were 844metric tons. Imports come primarily from Canada (as live, farmed mussels), and from New Zealand (in aform NMFS designates as frozen/dried/salted/brine).
FDA has not tested any blue mussel for methylmercury, imported or domestic. In our analysis, weassume the domestic blue mussel data apply only to the market represented by domestic landings lessexports.
Our data: 269 samples from NOAA Gulfchem relational database. Average concentration is 0.144 ppmMeHg (Table 7).
Consumption: Calculated based on total domestic landings less exports. Assume meat is 25% of landingweight minus export weight. Gives 0.00014 lb/person/year = 1 pound (live weight) for every 7100people. This represents consumption of domestic mussels only – Maine and to a lesser extent Washing-ton are the states that are most likely affected.
Appendix C:Notes on Individual Fish Species
Appendix C
Average MeHg Minimum MeHg Maximum MeHg Samples Water bodiesState (ppm) (ppm) (ppm) represented
California 0.180 0.003 0.909 41 8Connecticut 0.081 0.015 0.153 12 1Delaware 0.107 0.051 0.162 4 1Maine 0.190 0.030 0.507 16 3Massachusetts 0.174 0.042 0.492 50 7New Jersey 0.219 0.075 0.336 20 5New York 0.167 0.012 0.543 38 4Oregon 0.069 0.000 0.123 16 4Rhode Island 0.111 0.045 0.168 13 2Washington 0.090 0.033 0.210 51 10Alaska 0.064 0.000 0.090 8 2
Table 7. Contamination of Blue Mussels with methyl mercury.
Source: Environmental Working Group.

52 BRAIN FOOD
Catfish, Farmed
Nearly all catfish eaten in the U.S. are raised on farms. In 1999, 270,856 metric tons of catfish were soldfrom farms (live weight, from Johnson 2000). The commercial catch of catfish and bullheads in 1999was 3798 metric tons, or about one percent of the farmed catfish amount. Catfish caught commerciallyhave much higher levels of mercury than farmed catfish.
Our data represent mercury concentrations in farmed catfish: generated data distribution from statisticspresented in (Santerre 2001): mean = 0.00841 ppm, standard deviation = 0.01401 ppm, from 196 filletsamples collected from channel catfish producers.
FDA has sampled 12 domestic catfish – not designed if farmed or wild. Some of the concentrations arean order of magnitude higher than the maximum concentration found in (Santerre 2001) – these highconcentrations might represent wild catfish. The FDA data were not used in our analyses.
Consumption: 1.16 pounds/person/year, from NMFS Top 10 list.
Cod
1999 domestic landings: 247,409 mtonsPacific cod accounted for 96.1% of total landings (247,409 mtons)Alaska is the source of 99.9% of the Pacific cod (237,259 mtons)
1999 cod imports: 73,992 mtons1999 cod exports: 68,729 mtons
Imports are 42% Atlantic cod, remainder is “other” cod. Primary importing countries are Canada andIceland.
Imports are significant. They accounted for an estimated 29% of consumption in the U.S. in 1999 (basedon mass balance of landings, imports, and exports).
Nearly all domestic cod eaten is Pacific cod from Alaska. Imported cod could be Atlantic cod (42%chance), or some other cod (58% chance).
Overall chances:
71% chance of eating domestic cod (Pacific cod from Alaska)12% chance of eating imported Atlantic cod17% chance of eating imported “other” cod
Our data:18 samples from FDA’s seafood surveillance programdomestic: 3 Atlantic cod, 12 Pacific codimport: one black cod, with the highest mercury level in the data set (0.42 ppm), 2 samples called“Cod.” The black cod sample was not used in our analyses.
Sampling needs: This fish is eaten frequently – it falls sixth on the top ten list. FDA has tested only 18of these fish. The single sample they have called “Black cod” has a very high concentration – 0.42 ppm.
53ENVIRONMENTAL WORKING GROUP AND THE STATE PIRGS
Crab, blue
1999 landings: 88,671 mtons, led by North Carolina, Maryland, Virginia, Louisiana1999 imports: 69,562 metric tons imported for all crabs (blue crab data not given separately)1999 exports: 27,825 metric tons exported for all crabs (blue crab data not given separately)
Blue crab accounted for 42 percent of crabs landed in the U.S. in 1999, with 77 percent from the Atlan-tic, and 23 percent from the Gulf of Mexico.
Our data: From EPA’s Environmental Monitoring and Assessment Program tissue database. 20 samplesfrom Atlantic states (Maryland – 15; New Jersey – 2; Virginia – 2; and Delaware – 1). NOAA’s Gulfchemdatabase contains blue crab data from the Gulf of Mexico, but the majority of samples are from LavacaBay, and average concentrations in that data set are an order of magnitude higher than samples from theAtlantic. Data from the Gulf of Mexico were not used in our analyses. FDA has tested 3 crab samplesfor mercury in their seafood surveillance program. Two of these samples had results an order of magni-tude higher than the EMAP data. These three samples were not used in our analyses.
Consumption: 0.54 lb/person/year for all crab (NMFS Top Ten list). Blue crab consumption assumed tobe 42% of that, based on relative domestic landings. This gives total blue crab consumption of 0.23 lb/person/yr. This is divided between the Gulf and Atlantic data sets, again based on relative landings.Gulf landings account for 23 percent of total blue crab catch, and Atlantic landings account for 77percent. This gives Gulf of Mexico blue crab consumption as 0.05 lb/person/year, and Atlantic bluecrab consumption as 0.18 lb/person/yr.
Data needs: FDA should test crab, all species, domestic and imported.
Croaker (Atlantic and Pacific White)
Two croakers are caught commercially in the U.S. – Atlantic croakers and the Pacific white croaker.
Atlantic croakers dominate the commercial landings. They accounted for 99 percent (12,177 metric tons)of the 12,250 metric tons of croakers landed in 1999. (NMFS, commercial landings data available online).White croakers account for less than one percent (74 metric tons) of the 12,250 metric tons of croakerslanded in 1999 (NMFS, commercial landings data available online).
Croakers are not imported in any significant amount – NMFS does not maintain data on croaker imports.
Atlantic croakers are caught in the Southeast drum and croaker fisheries. Landings in Virginia accountfor 48% of total Atlantic croaker landings, and North Carolina accounts for 38%. White croaker is caughtoff the coast of California.
Our Atlantic croaker data: 202 samples from EPA’s Environmental Monitoring and Assessment Program.Samples collected from 1991-1994. Nine samples are from the Chesapeake Bay – these may bestrepresent what is caught from the major croaker states (Virginia and North Carolina). The averagemethylmercury concentration in the Chesapeake Bay samples is 0.01 ppm. These nine samples weresupplemented with 193 samples from the Atlantic Ocean between Texas and the Southern tip of Florida.The average concentration of methylmercury in these samples is higher than the average from the nineChesapeake Bay samples (0.05 ppm vs 0.01 ppm), but even with these higher concentrations included inEWG’s exposure analysis, the data indicate that Atlantic croaker appears to be a safe fish for pregnantwomen to eat.

54 BRAIN FOOD
Our white croaker data: White croaker are the only croaker that FDA has tested for mercury in theirseafood monitoring program. They have tested 15 samples. The average methylmercury from thesesamples is 0.258 ppm, or about an order of magnitude higher than the concentrations in Atlantic croakerfrom EPA data.
Atlantic croaker consumption: Calculated based on total domestic landings. 0.052 lb/person/year = 1pound (live weight) for every 19 people.
White croaker consumption: Calculated based on total domestic landings. 0.00032 lb/person/year = 1pound (live weight) for every 3,125 people.
Fish Sticks
1999 production: 29,510 metric tons (NMFS 1999 summary report)1999 imports: 11,908 metric tons1999 exports: 9,992 metric tons
Balance in U.S. in 1999: 31,426 metric tons. Imports account for 38% of supply.
Our data: FDA Total Diet Study contains mercury data for 16 samples of fish sticks.
Consumption: scaled to catfish consumption. 0.13 lb/person/yr. No adjustment made for breading andoil weight.
Flounder, Summer
1999 landings: 4,761 metric tons1999 imports: 9,762 metric tons (all flounder)1999 exports: no record in NMFS online database
Summer flounder accounts for 15 percent of all domestic flounder landings. For all flounder, importsrepresent 27 percent of the flounder supply (based on 1999 mass balance of landings, exports, andimports).
Our data: 30 samples from EPA’s Environmental Monitoring and Assessment Program database. (Mary-land – 17; Virginia – 11; Delaware – 2).
Consumption: Scale to catfish based on total U.S. landings. Gives 0.02 lb/person/year.
Data needs: FDA’s seafood surveillance program has 9 samples, for yellowtail, winter, and unspecifiedflounder. Of these nine samples, 2 are very high (0.43, 0.4 ppm). These data were not used in ouranalysis because they were so few and so different from the summer flounder data. Yellowtail andwinter flounder are both significant in the U.S. seafood supply. FDA needs to sample all species offlounder eaten in the U.S.

55ENVIRONMENTAL WORKING GROUP AND THE STATE PIRGS
Haddock
1999 landings: 3,146 mtons1999 imports: 25,219 mtons1999 exports: 157 mtons
Imports are dominant. They accounted for an estimated 89% of consumption in the U.S. in 1999 (basedon mass balance of landings, imports, and exports). Norway, Iceland, Faroe Islands, and Canada aremajor importers.
Our data: 23 samples altogether. 20 samples of pan-cooked haddock from FDA’s Total Diet Study. 3samples of haddock from FDA’s domestic seafood surveillance program. It is likely that the 20 samplesfrom the TDS program are primarily imported, since imports dominate the market. The 3 domesticsamples and the 20 TDS samples have comparable methylmercury concentrations.
Consumption: scaled from catfish data. 0.12 lb/person/yr
Halibut (Pacific and Atlantic)
1999 landings: 36,600 mtons, 98% (35,970 mtons) is Pacific Halibut nearly all from Alaska1999 imports: 11,920 mtons, approx 7% Atlantic, 93% Pacific (breakdown from NMFS Imports andExports of Fishery Products Annual Summary, 1999).1999 exports: 9,442 mtons
Imports accounted for an estimated 31% of consumption in the U.S. in 1999 (based on mass balance oflandings, imports, and exports). Canada is the dominant importer. China and Japan are also significant.On balance, chances are good in the U.S. that the halibut on a plate is a Pacific halibut (about a 98%chance).
Our data: 33 samples from FDA’s seafood surveillance monitoring program.Two samples for which “whole” fish was indicated: methylmercury in fillet = methylmercury in wholebody divided by 0.7 (based on EPA 1999).Two samples from California are probably California halibut – not used.23 domestic samples, 8 import samples. The highest concentration (1.52 ppm) was from an importedsample – not designated if this was an Atlantic or Pacific halibut.
Consumption: scaled from catfish data. 0.16 lb/person/year
Mahi mahi
1999 landings: 534 metric tons (Florida and North Carolina)1999 imports: 4,299 metric tons (more than half from Taiwan; Japan and Costa Rica also significant)1999 exports: 0
Imports accounted for 89% of U.S. supply last year.
Our data: 18 samples from FDA’s seafood surveillance program. One domestic sample from Hawaii, 17import samples.
Consumption: scaled to catfish. 0.02 lb/person/year.

56 BRAIN FOOD
Oyster, Eastern
1999 landings: 8,501 metric tons (11749 metric tons for all oysters)1999 imports: 8,312 metric tons (all oysters)1999 exports: 1,237 metric tons (all oysters)
Domestic Eastern oysters are primarily from Louisiana, Texas, Florida, and Maryland. Eastern oystersaccount for 72% of all domestic oysters. For all oysters, imports account for 44% of consumption (1999mass balance based on landings, exports, and imports).
Our data: 396 samples from NOAA Gulfchem database (Table 8).
StateWater bodies represented
Number of samples
Average MeHg
Minimum MeHg
Maximum MeHg
Alabama 1 9 0.085 0.057 0.126Delaware 1 3 0.07 0.063 0.084Florida 18 112 0.152 0 0.477Georgia 3 11 0.077 0.036 0.129Louisiana 11 58 0.079 0.03 0.246Maryland 2 17 0.036 0.018 0.066Mississippi 1 10 0.102 0.072 0.189New Jersey 1 8 0.093 0.063 0.15North Carolina 4 27 0.113 0.024 0.882South Carolina 3 15 0.085 0.036 0.126Texas 16 102 0.117 0 1.392Virginia 5 24 0.078 0 0.177
Table 8. Contamination of eastern oysters with methyl mercury.
Source: Environmental Working Group.
Assume these data are representative of concentrations in domestic Eastern oyster supply. Oysterswere #10 on NMFS Top Ten list in 1998 at 0.23 lb/person/year, but fell off the list in 1999, replaced byscallops. Assume oyster consumption in 1999 is 0.19 lb/person/year, just below 1999 scallop con-sumption, which was 0.20 lb/person/year. Then assume that 72% of the total oyster supply in the U.S.is Eastern oyster (based on domestic catch ratio). This gives consumption of 0.19*0.72 = 0.14 lb/person/year.
Pollock, pacific
1999 landings: 1,055,016 metric tons1999 imports: 100,329 metric tons1999 exports: 20,996 metric tons
Domestic Pacific pollock are from Alaska. Most imported pollock are from China and Russia to a lesserextent. Imports account for about 9 percent of pollock consumption in the U.S. (based on 1999 massbalance between landings, exports, and imports). Of the imports, about 99% is Pacific pollock, 1% isAtlantic pollock.
57ENVIRONMENTAL WORKING GROUP AND THE STATE PIRGS
Our data: 32 samples from FDA seafood surveillance program. 24 domestic samples, 8 importedsamples (unknown if imported samples are Atlantic or Pacific pollock). High value of 0.78 ppm inimported samples was retained for our analysis.
Data needs: This fish is widely consumed in the U.S. – falls as #4 on NMFS’s Top Ten list. Mercury inone of the eight imported samples was quite high. More sampling is needed to fully characterize vari-ability.
Consumption: 1.57 pounds/person/year (NMFS Top Ten list). Did not correct for fish stick consump-tion, which might reduce that figure by about 10% if we assume all fish sticks are pollock.
Salmon
1999 landings: 369,744 metric tons, 98 percent from Alaska1999 imports: 131,991 metric tons, primarily Atlantic salmon from Canada and Chile (farmed).1999 exports: 153,593 metric tons1999 U.S. farmed: 18,659 metric tons (Johnson 2000)
In the U.S. for any given time a person eats salmon, there is about a 38 percent chance it will be adomestic pink salmon, and a 30 percent chance it will be an imported Atlantic salmon. Domestic chumand sockeye salmon are the next most common, with a relative chance of about 12 percent for each(calculated from landing, import, and export data compiled by NMFS).
Some chinook and coho salmon are caught commercially from the Great Lakes. Concentrations ofmercury appear to be much higher in these fish than in Alaska and imported salmon (EPA fish tissuedatabases). These salmon account for 0.03 percent of the commercial catch. These data were not usedin our calculations.
Our data: 51 samples from FDA seafood surveillance program.
Domestic samples: Atlantic – 4, Chum – 8, Coho – 2, Pink – 8, “Salmon” – 4, Canned salmon – 20
Imported samples: “Salmon” – 4, Sockeye - 1
These 51 samples were equally weighted, and used together in exposure assessments for salmon, sincethe data for individual species are insufficient for species-specific analyses.
Consumption: 1.7 lb/person/yr (NMFS Top 10 seafood list)
Shrimp
1999 landings: 142144 metric tons1999 imports: 331706 metric tons1999 exports: 12138 metric tons
U.S. landings are primarily from Louisiana and Texas. Imported shrimp (Asia, South America, CentralAmerica) accounts for 72% of the shrimp consumed in the U.S. (based on mass balance of landings,imports, and exports).

58 BRAIN FOOD
We have EPA mercury data for brown and white shrimp. Brown shrimp accounts for 44 percent of U.S.landings. White shrimp accounts for 33 percent of U.S. landings.
Our data:
FDA’s Total Diet Study includes 16 samples of shrimp tested for mercury. In our analyses, these concen-trations are assumed to represent imported shrimp.
Brown and white shrimp: EPA’s Environmental Monitoring and Assessment Program (EMAP) data.Brown shrimp are caught primarily in the Gulf of Mexico (Texas and Louisiana). White shrimp arecaught primarily in Louisiana, with minor landings in the southern Atlantic states. In our analyses, datafor brown and white shrimp are taken to represent concentrations in all domestic shrimp (Table 9).Consumption: 3.00 pounds per person (NMFS Top Ten list). 72% assumed to be from imported shrimp(2.16 pounds/person/yr), and the remaining 28% split between brown and white shrimp based on theirrelative 1999 landings (0.48 and 0.36 pounds per person per year, respectively).
Water bodies
Number of samples
Average MeHg
Minimum MeHg
Maximum MeHg
Shrimp - Total Diet Study N/A 16 0.022 0 0.048Brown shrimp - Gulf of Mexico 9 15 0.028 0 0.177White shrimp - FL, GA, LA, NC, SC 20 28 0.043 0 0.126
Table 9. Contamination of shrimp with methyl mercury.
Source: Environmental Working Group.
Trout, Rainbow, farmed
Nearly all trout eaten in the U.S. are farm-raised. In 1999, 27,376 metric tons were produced. In con-trast, the commercial catch of lake and rainbow trout in 1999 was 613 metric tons, or about two percentof the farmed weight. Trout are caught commercially in Michigan, Oregon, Washington, and Wisconsin.
Our data represent mercury concentrations in farmed rainbow trout: generated data distribution fromstatistics presented in (Santerre 2001): mean = 0.00954 ppm, standard deviation = 0.00923 ppm, from 33fillet samples collected from rainbow trout producers.
FDA has not tested trout.
Consumption: scaled from catfish numbers. 0.12 lb/person/yr.
Tuna, canned
Imports account for 34% of the U.S. canned tuna supply. Of the 76 percent canned in the U.S., 45% islightmeat, and 21% is albacore.
FDA’s Tuna Study (Yess, 1993) included the following samples with corresponding mercury concentra-tions:
Chunk light: 106 samples, 0.1 ppm MeHg, standard deviation 0.11 ppmSolid white: 71 samples, 0.26 ppm MeHg, standard deviation 0.16 ppm

59ENVIRONMENTAL WORKING GROUP AND THE STATE PIRGS
Chunk white: 19 samples, 0.31 ppm MeHg, standard deviation 0.17 ppmChunk: 14 samples, 0.10 ppm MeHg, standard deviation 0.12 ppm
Our data: 219 samples from the Yess study (Yess, 1993) – samples collected in 1991; 115 additionalsamples from FDA’s seafood surveillance program (1992 and later), and 27 samples from FDA’s TotalDiet Study. Average of these 361 samples is 0.166 ppm MeHg. For most samples, the type of tuna (e.g.,chunk light or solid white) was not available. Therefore, we were not able to segregate the data byproduct type.
Tuna, Steaks
The data below are for all tuna consumed in the U.S. – canned and steaks. Of the per-capita average of3.5 pounds of tuna consumed per year in 1999, 3.4 pounds per year was canned, and 0.1 pounds peryear was steaks (Johnson, 2000).
1999 landings: 26,806 metric tons1999 imports: 308,493 metric tons, primarily from1999 exports: 12,770 metric tons
Imports account for 96 percent of the supply in the U.S. In 1999 the biggest importers were Thailand,Taiwan, Phillipines, Ecuador, and Indonesia. Albacore and yellowfin are imported in the greatestquantities. Albacore is the most frequently landed tuna domestically, followed by yellowfin and skip-jack. About forty percent of domestic tuna comes through California. Tuna imports on the NMFS onlineimport database are not given in sufficient detail to allow an assessment of relative consumption of eachspecies of tuna eaten in the U.S.
Our data: 122 samples from FDA’s seafood surveillance program, 85 imported, 38 domestic.
Domestic data, methylmercury:Ahi tuna: 1 sample, 0.2 ppmAlbacore tuna: 6 samples, average 0.347 ppm, range 0.036 – 0.510Bigeye tuna: 3 samples, average 0.739 ppm, range 0.550 – 0.936“Tuna” 19 samples, average 0.272 ppm, range 0.030 – 0.540Yellowfin tuna: 8 samples, average 0.377 ppm, range 0.19 – 0.75
Import data, methylmercury:Albacore tuna: 7 samples, average 0.363 ppm, range 0 – 0.82Bigeye tuna: 2 samples, average 0.875 ppm, range 0.369 – 1.38“Tuna” 63 samples, average 0.489 ppm, range 0 – 1.46Yellowfin tuna: 13 samples, average 0.234 ppm, range 0.06 – 0.65
We treated all these data equally in our analysis, as methylmercury concentrations were not numerousenough to allow for species-specific analyses.

60 BRAIN FOOD
number of samples
average MeHg,
ppm
median MeHg,
ppm
range, ppm
Lake Whitefish 88 0.051 0.045 .018 - .126
Gulf Coast Oysters 396 0.123 0.09 0 - 1.55
Gulf Coast Crabs 47 0.228 0.047 1 - 2.18
Great Lakes Salmon 88 0.173 0.09 0.05 - 0.43
Tuna steaks 122 0.417 0.34 0 - 1.46
Smelt 16 0.097 0.054 0.036 - 0.45
Shrimp 59 0.033 0.023 1 - 0.177
Sea bass 10 0.606 0.529 0.1 - 1.27
Salmon 51 0.008 0 0 - 0.18
Pollock 32 0.063 0 0 - 0.78
Oyster 396 0.111 0.083 0 - 1.392
Marlin 15 0.467 0.39 0.1 - 0.92
Mahi mahi 18 0.164 0.18 0 - 0.245
Halibut 31 0.273 0.214 0 - 1.52
Hake 9 0.062 0 0 - 0.48
Haddock 23 0.056 0.053 0 - 0.14
Fish sticks 16 0.008 0.008 0 - .03
Blue crab - Atlantic 20 0.021 0.018 0.006 - 0.059
Cod 17 0.099 0.1 0 - 0.17
Canned tuna 361 0.166 0.13 0 - 0.852
Blue mussel 269 0.144 0.108 0 - 0.909
Atlantic croaker 202 0.044 0.015 0 - 0.529
Flounder 39 0.047 0.029 0 - 0.43
White croaker 15 0.258 0.252 0.162 - 0.369-1
21
0 0.2 0.4 0.6 0.8 1 1.2 1.4 1.6 1.8 2 2.2 2.4
012345
0 0.5 1
FDA seafood surveillance program
FDA Total Diet Study
NOAA Gulfchem relational database
EPA Environmental Monitoring and Assessment Program
Median methylmercury, ppm
Source: Environmental Working Group.
Table 10. Distribution of methyl mercury detections in different fish species.

61ENVIRONMENTAL WORKING GROUP AND THE STATE PIRGS
Appendix D:State Survey Results
Appendix D
State NUMBER OF ADVISORIES
STATEWIDE ADVISORY DUE TO MERCURY CONTAMINATION
THRESHOLD-GENERAL
POPULATION (PPM)
THRESHOLD-SENSITIVE
POPULATION (PPM)
CONSUMPTION RECOMMENDATION - SENSITIVE POPULATIONS
ROUTINE MONITORING FOR
MERCURY
Alabama 4 Coastal marine 1.00 1.0* No consumption; statewide advisory recommends no consumption of one species YES
Alaska 0 NO No system No system No system in place SOMEWHAT
Arizona 2 NO No set threshold
No set threshold
Case-by-case approach, existing advisories recommend no consumption NO
Arkansas 19 NO 1.00 0.5 Ranges from two 8-ounce meals per month to no consumption NO
California 12 NO No set threshold
No set threshold
Case-by-case approach, ranges from four 8-ounce meals per month to no consumption SOMEWHAT
Colorado 8 NO 0.50 0.5 Advisories triggered at 0.5 ppm, state performs additional testing and issues more advisories starting at 0.2 ppm NO
Connecticut 6 Lake and river 0.20 0.2* No consumption; statewide advisory recommends one 8-ounce meal per month NO
Delaware 5 NO 0.22*** 0.12*** Case-by-case approach, limits vary, 0.12 ppm triggers further testing YES
Florida 97 Coastal marine 0.50 0.5*One 8-ounce meal per month, no consumption at 1.5 ppm; statewide recommends one 8-ounce meal per month of one
species and no consumption of one speciesYES
Georgia 84 NO 0.23 0.23 Ranges from four 8-ounce meals per month to no consumption (at 2.0 ppm) depending on level of mercury contamination YES
Hawaii 0 NO No system No system No system in place NO
Idaho 1 NO 0.50 0.5* One 4-ounce meal per month for three species, one 7-ounce meal per month of two species NO
Illinois 2 NO 0.50 0.5 No consumption YES
Indiana 136 Lake and river 0.16 0Ranges from four 8-ounce meals per month to no consumption (at 0.65 ppm) depending on level of mercury contamination;
statewide advisory recommends one 8-ounce meal per month (all freshwaters not under a specific advisory)
YES
Iowa 0 NO 1.00 1.0 Consumption limits not defined YES
* consumption limits more stringent for sensitive populations** not recognized by EPA*** triggers further study
Source: The State PIRGs.
Results of state survey of fish advisory systems.

62 BRAIN FOOD
State NUMBER OF ADVISORIES
STATEWIDE ADVISORY DUE TO MERCURY CONTAMINATION
THRESHOLD-GENERAL
POPULATION (PPM)
THRESHOLD-SENSITIVE
POPULATION (PPM)
CONSUMPTION RECOMMENDATION - SENSITIVE POPULATIONS
ROUTINE MONITORING FOR
MERCURY
Kansas 0 NO No system No system No system in place YES
Kentucky 1 All waters** None 0.12 Statewide advisory recommends four 8-ounce meals per month, no consumption at 1.0 ppm YES
Louisiana 17 Coastal marine 0.50 0.5*Case-by-case approach, limits vary; statewide advisory
recommends between one 8-ounce meal per month and no consumption of one species
YES
Maine 2 Lake, river, coastal marine 0.60 0.2 One 8-ounce meal per month of two species, consumption of all other species not recommended YES
Maryland 0 NO 0.40 0.26 Would range from four 8-ounce meals per month to one 8-ounce meal per month, no consumption at 0.7 ppm YES
Massachusetts 84 Lake and river 1.00 0.5* Ranges from no consumption to two 8-ounce meals per month; statewide advisory recommends no consumption SOMEWHAT
Michigan 71 Lake 0.50 0.5One 8-ounce meal per month, no consumption at 1.5 ppm;
statewide advisory recommends one 8-ounce meal per month of eight species from all inland lakes
YES
Minnesota 850 Lake 0.16 0.038Ranges from unlimited consumption to no consumption (at 2.8 ppm) depending on level of mercury contamination; statewide
advisory recommends same range YES
Mississippi 8 Coastal marine 1.00 1.0*One 4-ounce meal per month, no consumption at 1.5 ppm; statewide advisory recommends between one 4-ounce meal
per month and no consumption of one speciesYES
Missouri 0 NO 1.00 1.0*If less than half of samples tested exceed 1.0 ppm, advisory would recommend four 8-ounce meals per month, if greater than half of samples tested exceed 1.0 ppm, no consumption
would be recommendedYES
Montana 22 NO 0.16 0.0 Ranges from unlimited consumption to no consumption (at 2.8 ppm) depending on level of mercury contamination SOMEWHAT
Nebraska 13 NO 0.35 0.25 Four 5-ounce meals per month, no upper limit for no consumption YES
Nevada 2 Carson River watershed below Dayton** 1.00 No set
thresholdCase-by-case, no consumption at 1.0 ppm, current advisory
recommends no consumption NO
New Hampshire 2 Lake and river 0.50 0.2 One 8-ounce meal per month, no consumption at 0.85 ppm; statewide advisory recommends one 8-ounce meal per month YES
New Jersey 30 Lake and river 0.35 0.08Ranges from four 8-ounce meals per month to no consumption (at 0.55 ppm) depending on level of mercury contamination; statewide advisory recommends one 8-ounce meal per month
of two speciesNO
New Mexico 26 NO 0.50 0.25 One 4-ounce meal per month, no consumption at 0.5 ppm SOMEWHAT
New York 18 Freshwaters, portion of New York City Harbor** 1.00 1.0* No consumption; statewide advisory recommends four 8-
ounce meals per month YES
North Carolina 10 Lake and river 1.00 1.0*No consumption; statewide advisory recommends no
consumption of two species and limits consumption to one 8-ounce meal per month of one species
YES
North Dakota 1 All tested waters** no set threshold
no set threshold
Statewide advisory recommends eight 8-ounce meals per month to no consumption of eight species depending on species and type of sensitive population (woman or child)
NO
* consumption limits more stringent for sensitive populations** not recognized by EPA*** triggers further study
Source: The State PIRGs.
Results of state survey of fish advisory systems - continued.

63ENVIRONMENTAL WORKING GROUP AND THE STATE PIRGS
* consumption limits more stringent for sensitive populations** not recognized by EPA*** triggers further study
Source: The State PIRGs.
State NUMBER OF ADVISORIES
STATEWIDE ADVISORY DUE TO MERCURY CONTAMINATION
THRESHOLD-GENERAL
POPULATION (PPM)
THRESHOLD-SENSITIVE
POPULATION (PPM)
CONSUMPTION RECOMMENDATION - SENSITIVE POPULATIONS
ROUTINE MONITORING FOR
MERCURY
Ohio 22 All freshwaters 0.05 0.05Ranges from four 8-ounce meals per month to no consumption
(at 1.0 ppm) depending on level of mercury contamination; statewide advisory recommends four 8-ounce meals per month
for waters not under a specific advisoryYES
Oklahoma 0 NO 1.50 1.0 No consumption would be recommended YES
Oregon 9 NO 0.35 0.35* Case-by-case approach, ranges from four 8-ounce meals per month to no consumption, no upper limit for no consumption NO
Pennsylvania 1 NO 0.13 0.13 Ranges from four 8-ounce meals per month to no consumption (at 1.9 ppm) depending on level of mercury contamination YES
Rhode Island 1 NO 1.00 1.0* No consumption NO
South Carolina 58 Coastal marine** 0.25 0.25No consumption; statewide advisory recommends between one 8-ounce meal per month and no consumption of one
speciesYES
South Dakota 1 NO 0.30 0.3* One 7-ounce meal per month of two species, no upper limit for no consumption YES
Tennessee 2 NO 1.00 0.5 No consumption YES
Texas 9 Coastal marine Approx. 0.7 Approx. 0.7 Case-by case approach, limits vary NO
Utah 0 NO No system No system No system in place NO
Vermont 3 Lake and river No set threshold
No set threshold
Case-by-case approach, ranges from two 8-ounce meals per month to no consumption; statewide advisories limits different species at varying levels from four 8-ounce meals per month to
no consumptionYES
Virginia 3 NO 1.00 1.0* No consumption YES
Washington 1 NO No set threshold
No set threshold
Case-by-case approach, ranges from four 8-ounce meals per month to 2 8-ounce meals per month NO
West Virginia 0 NO 0.028 0.028Would range from four 8-ounce meals per month to no
consumption (at 1.036 ppm) depending on level of mercury contamination
NO
Wisconsin approx. 140 All waters** Not applicable Not applicableStatewide advisory recommends four 8-ounce meals per month of six species and one 8-ounce meal per month of other sport
fish, no consumption at 1.0 ppmYES
Wyoming 0 NO No system No system No system in place NO
Results of state survey of fish advisory systems - continued.

64 BRAIN FOOD
References
References
Ache, BW, Boyle, JD, and Morse, CE. 2000. A Survey of the Occurrence of Mercury in the Fishery Resources of the Gulf ofMexico. Prepared by Battelle for the U.S. EPA Gulf of Mexico Program, Stennis Space Center, MS. January 2000.
Browner, C. 2000. EPA decides mercury emissions from power plants must be reduced. Released December 14, 2000. Pressrelease online at http://www.epa.gov/mercury/actions.htm.
Brune, D, GF Nordberg, et al. 1991. A review of normal concentration of mercury in human blood. Sci. Total Environ. 100:235-282.
Centers for Disease Control and Prevention (CDC). 2001. Blood and hair mercury levels in young children and women ofchildbearing age – United States, 1999. Morbidity and Mortality Weekly. 50(08):140-3.
CDC National Health and Nutrition Examination Survey (NHANES) IV. 2001. Available online at http://www.cdc.gov/nchs/nhanes.htm.
Cramer, GM. 1994. Exposure of U.S. consumers to methylmercury from fish. FDA Office of Seafood. In DOE/FDA/EPAWorkshop on Methylmercury and Human Health. March 22-23, 1994. Bethesda, Maryland. Ed Moskowitz, PD, LSaroff, M Bolger, J Cicmanec, and S Durkee.
Ginsberg GL and Toal BE. 2000. Development of a single-meal fish consumption advisory for methyl mercury. Risk Analysis.20(1): 41-47.
Glass, GE and JA Sorensen. 1999. Six-year trend (1990-1995) of wet mercury deposition in the upper Midwest, U.S.A. Environ.Sci. Technol. 33: 3303-3312.
Golden, AL, G Berkowitz, MS Wolff, JH Godbold, A Afilaka, SN Chillrud, RF Bopp, HJ Simpson, PJ Landrigan. 2001. Bodyburdens of persistent pollutants in Hudson River anglers. Submitted to Environmental Health Perspectives.
Grandjean, P, E Budtz-Jorgensen, RF White, P Weihe, F Debes, and N Keiding. 1999. Methylmercury exposure biomarkers asindicators of neurotoxicity in children aged 7 years. Am. J. Epidemiol. 150(3): 301-305.
Grandjean, P, P Weihe, RF White, F Debes, S Araki, K Yokoyama, K Murata, N Sorensen, R Dahl, and PJ Jorgensen. 1997.Cognitive deficits in 7-year-old children with prenatal exposure to methylmercury. Neurotoxicol. Teratol. 19(6):417-428.
Grandjean, P, P Weihe, RF White, N Keiding, E Budtz-Jorgensen, K Murato, and L Needham. 1998. Prenatal exposure tomethylmercury in the Faroe Islands and neurobehavioral performance at age seven years. Response to workgroupquestions for presentation on 18-20 November, 1998. In: Sicentific Issues Relevant to Assessment of Health Effectsfrom Exposure to Methylmercury. Appendix II-B. – Faroe Islands Studies. National Institute for Environmental HealthSciences. Available online at http://ntp-server.niehs.nih.gov/Main_Pages/PUBS/MethMercWkshpRpt.html.
Greenwood, MR. 1985. Methylmercury poisoning in Iraq: an epidemiological study of the 1971-72 outbreak. J. AppliedToxicology. 5(3): 148-159.
Gulf of Mexico Program (GulfChem). 2001. Occurrence of Mercury in the Fishery Resources of the Gulf of Mexico Data.Available online at http://pelican.gmpo.gov/spotlite.html.

65ENVIRONMENTAL WORKING GROUP AND THE STATE PIRGS
Harada, M. 1995. Minamata disease: methylmercury poisoning in Japan caused by environmental pollution. Crit. Rev.Toxicology. 25(1): 1-24.
Johnson, H.M. 2000. Annual Report on the United States Seafood Industry. Eighth Edition.
Kosatsky, T and P Foran. 1996. Do historic studies of fish consumers support the widely accepted LOEL for methylmercury inadults. Neurotoxicology. 17(1),:177-186.
Leong, CCW, NL Syed, and FL Lorscheider. 2001. Retrograde degeneration of neurite membrane structural integrity of nervegrowth cones following in vitro exposure to mercury. NeuroReport. 12(4): 733-737.
National Academy of Sciences (NAS), National Research Council. 2000. Toxicological Effects of Methylmercury. NationalAcademy Press, Washington, DC.
National Marine Fisheries Service (NMFS). 2000. Fisheries of the United States – 1999. Available online at http://www.st.nmfs.gov/st1/fus/fus99/index.html.
National Marine Fisheries Service (NMFS). 2000. Top Ten List.
National Rural and Electric Cooperative Association (NRECA). 1998. Letter from Rae E. Cronmiller, Environmental Counselrepresenting NRECA, to U.S. EPA. June 8, 1998. Available online at http://www.nreca.org/.
Nixon DE, GV Mussmann, TP Moyer. 1996. Inorganic, organic, and total mercury in blood and urine: Cold vapor analysis withautomated flow injection sample delivery. J. Analytical Toxicology. 20: 17-22.
Salonen, JT, K Seppanen, et al. 1995. Intake of mercury from fish, lipid peroxidation, and the risk of myocardial infarction andcoronary, cardiovascular, and any death in eastern Finnish men. Circulation. 91(3): 645-655.
Santerre, CR, PB Bush, et al. 2001. Metal residues in farm-raised channel catfish, rainbow trout and red swamp crayfish fromthe Southern U.S. To be published in J. Food Science – Food Chemistry and Toxicology. Manuscript No. 2000-0628.
Stern, Alan H. 1997. Estimation of the interindividual variability in the one-compartment pharmacokinetic model formethylmercury: Implications for the derivation of a Reference Dose. Regulatory Toxicology and Pharmacology. Vol25. P 277-288.
Stern, A, M Gochfeld, et al. 2001. Mercury and methylmercury exposure in the New Jersey pregnant population. To bepublished in Arch. Environ. Health.
The Center for Responsive Politics. 2000. Information on campaign and party contributions from electric utilities. Availableonline at http://www.opensecrets.org.
United States Environmental Protection Agency (EPA). 1996. Exposure Factors Handbook. Volume II – Food Ingestion Factors..Office of Research and Development, National Center for Environmental Assessment, U.S. EPA. August 1997.
United States Environmental Protection Agency (EPA), 1997. Mercury Study Report to Congress. Volume V: Health Effects ofMercury and Mercury Compounds. EPA Office of Air Quality Planning & Standards and Office of Research andDevelopment. EPA-452/R-97-007. December 1997.
United States Environmental Protection Agency (EPA). 1999. The National Survey of Mercury Concentrations in Fish. Data BaseSummary 1990-1995. EPA-823-R-99-014. Office of Water. September 1999.
United States Environmental Protection Agency (EPA). 2000. National Listing of Fish and Wildlife Advisories (NLFWA)Database. Available online at http://www.epa.gov/ost/fish.
United States Environmental Protection Agency (EPA). Environmental Monitoring and Assessment Program (EMAP). Availableonline at http://www.epa.gov/emap/.
United States Food and Drug Administration (FDA). Seafood Surveillance Program Data.

66 BRAIN FOOD
United States Food and Drug Administration (FDA). 1974. Mercury action level rulemaking. Federal Register. 39(236).December 6, 1974.
United States Food and Drug Administration (FDA). 1979. Revisions to the mercury action level. Federal Register. 44(14).
United States Food and Drug Administration (FDA). 1991-1999. Total Diet Study. Available online at http://vm.cfsan.fda.gov/~comm/tds-toc.html.
United States Food and Drug Administration (FDA). 2001. An important message for pregnant women and women ofchildbearing age who may become pregnant about the risks of mercury in fish. March 2001. Available online at http://vm.cfsan.fda.gov/~dms/admehg.html.
United States General Accounting Office (GAO). 2001. Federal oversight of seafood does not sufficiently protect consumers.Food Safety. Report to the Committee on Agriculture, Nutrition and Forestry, U.S. Senate. GAO-01-204. January 31,2001.
United States v. Anderson Seafoods, Inc. 1980. 622 F.2d 157 (5th Cir. 1980).
Weiss, B. 1990. The Developmental Neurotoxicity of Methyl Mercury. In Toxicants Well Studied in Humans.
Weiss, B. 1996. Long ago and far away: a retrospective on the implications of Minamata. Neurotoxicology. 17(1): 257-264.
Wisconsin Electric. 2001. Mercury in the environment. Available online at http://www.wisconsinelectric.com/pages/p_issues12.html.
World Health Organisation (WHO). 1990. Environmental Health Criteria 101: Methylmercury. Geneva.
Yess, NJ. 1993. US Food and Drug Administration survey of methyl mercury in canned tuna. J. AOAC Int. 76(1): 36-38.

W O R K I N G G R O U P T M
E N V I R O N M E N T A L
Environmental Working Group1718 Connecticut Avenue, N.W. Suite 600
Washington, D.C. 20009
U.S. PIRG Education Fund218 D St. SE
Washington, DC 20003