brain edema predicts outcome after nonlacunar ischemic...
TRANSCRIPT

3643
Neurological deterioration is a well-described complica-tion of large hemispheric stroke, principally caused by
the formation of cerebral edema.1,2 The disease is associated with high morbidity and mortality,3–5 with limited medical and surgical treatment options available.6–8 Edema typically peaks 3 to 5 days after stroke onset,9 although a malignant form can present within 24 hours and leads to precipitous decline.3,10
In this study, we sought to characterize the extent to which swelling or infarct growth contributed to neurological out-come in a broader range of stroke severity. Imaging markers of swelling were established in 2 cohorts with serial research MRI during the first 2 to 5 days after stroke. We also inves-tigated the relationship of swelling to lesional tissue proper-ties that characterize brain injury and swelling,11,12 including
apparent diffusion coefficient (ADC) values representing early cytotoxic injury,13,14 and hyperintensity on T2 fluid-attenuated inversion recovery (FLAIR) imaging, a putative tissue clock for ischemia15 that may also reflect the degree of blood–brain barrier disruption.12,16 We hypothesized that brain edema is relevant to outcome in a broad stroke population, potentially making it an attractive therapeutic target.
MethodsPatient CharacteristicsBrain MRI scans were retrospectively analyzed in 2 cohorts of sub-jects with acute stroke: the placebo arm of the Normobaric Oxygen Therapy in Acute Ischemic Stroke Trial cohort (NBO, NCT00414726) and the Echoplanar Imaging Thrombolysis Evaluation Trial cohort
Background and Purpose—In malignant infarction, brain edema leads to secondary neurological deterioration and poor outcome. We sought to determine whether swelling is associated with outcome in smaller volume strokes.
Methods—Two research cohorts of acute stroke subjects with serial brain MRI were analyzed. The categorical presence of swelling and infarct growth was assessed on diffusion-weighted imaging (DWI) by comparing baseline and follow-up scans. The increase in stroke volume (∆DWI) was then subdivided into swelling and infarct growth volumes using region-of-interest analysis. The relationship of these imaging markers with outcome was evaluated in univariable and multivariable regression.
Results—The presence of swelling independently predicted worse outcome after adjustment for age, National Institutes of Health Stroke Scale, admission glucose, and baseline DWI volume (odds ratio, 4.55; 95% confidence interval, 1.21–18.9; P<0.02). Volumetric analysis confirmed that ∆DWI was associated with outcome (odds ratio, 4.29; 95% confidence interval, 2.00–11.5; P<0.001). After partitioning ∆DWI into swelling and infarct growth volumetrically, swelling remained an independent predictor of poor outcome (odds ratio, 1.09; 95% confidence interval, 1.03–1.17; P<0.005). Larger infarct growth was also associated with poor outcome (odds ratio, 7.05; 95% confidence interval, 1.04–143; P<0.045), although small infarct growth was not. The severity of cytotoxic injury measured on apparent diffusion coefficient maps was associated with swelling, whereas the perfusion deficit volume was associated with infarct growth.
Conclusions—Swelling and infarct growth each contribute to total stroke lesion growth in the days after stroke. Swelling is an independent predictor of poor outcome, with a brain swelling volume of ≥11 mL identified as the threshold with greatest sensitivity and specificity for predicting poor outcome. (Stroke. 2014;45:3643-3648.)
Key Words: brain edema ◼ magnetic resonance imaging ◼ stroke ◼ swelling
Brain Edema Predicts Outcome After Nonlacunar Ischemic Stroke
Thomas W.K. Battey, BS; Mahima Karki, BA; Aneesh B. Singhal, MD; Ona Wu, PhD; Saloomeh Sadaghiani, BA; Bruce C.V. Campbell, MBBS, PhD; Stephen M. Davis, MD;
Geoffrey A. Donnan, MD; Kevin N. Sheth, MD; W. Taylor Kimberly, MD, PhD
Received July 24, 2014; final revision received August 28, 2014; accepted September 22, 2014.From the Center for Human Genetic Research (T.W.K.B., M.K., W.T.K.), Division of Neurocritical Care and Emergency Neurology (T.W.K.B., M.K.,
W.T.K.), J. Philip Kistler Stroke Research Center (T.W.K.B., M.K., A.B.S., O.W., S.S., W.T.K.), and Athinoula A. Martinos Center for Biomedical Imaging, Department of Radiology (O.W.), Massachusetts General Hospital, Boston; Department of Radiology, Royal Melbourne Hospital, Parkville, Victoria, Australia (B.C.V.C., S.M.D.); Florey Institute of Neuroscience and Mental Health, University of Melbourne, Parkville, Victoria, Australia (B.C.V.C., G.A.D.); and Division of Neurocritical Care and Emergency Neurology, Yale New Haven Hospital, CT (K.N.S.).
Guest Editor for this article was Steven C. Cramer, MD, MMSc.The online-only Data Supplement is available with this article at http://stroke.ahajournals.org/lookup/suppl/doi:10.1161/STROKEAHA.114.
006884/-/DC1.Correspondence to W. Taylor Kimberly, MD, PhD, Massachusetts General Hospital, 55 Fruit St, Lunder 644, Boston, MA 02114. E-mail wtkimberly@
mgh.harvard.edu© 2014 American Heart Association, Inc.
Stroke is available at http://stroke.ahajournals.org DOI: 10.1161/STROKEAHA.114.006884
by guest on January 24, 2017http://stroke.ahajournals.org/
Dow
nloaded from
by guest on January 24, 2017http://stroke.ahajournals.org/
Dow
nloaded from
by guest on January 24, 2017http://stroke.ahajournals.org/
Dow
nloaded from
by guest on January 24, 2017http://stroke.ahajournals.org/
Dow
nloaded from
by guest on January 24, 2017http://stroke.ahajournals.org/
Dow
nloaded from
by guest on January 24, 2017http://stroke.ahajournals.org/
Dow
nloaded from

3644 Stroke December 2014
(EPITHET, NCT00238537). The NBO study enrolled patients from 2007 to 2009 who were treated with room air and acquired brain MRI within the first 9 hours of stroke symptom onset and again 4, 24, and 48 hours later. Subjects with baseline diffusion-weighted imag-ing (DWI) volumes of <10 mL were excluded in this study to avoid the risk of classifying volume averaging artifacts.12 Imaging markers were also investigated in the EPITHET cohort to perform association testing with clinical outcome. The full details of the EPITHET co-hort are described elsewhere.17 Briefly, the EPITHET study enrolled patients from 2001 to 2007 with baseline MRI within 3 to 6 hours of stroke onset and follow-up MRI 3 to 5 days later.
For both cohorts, subjects were included in the present study if they had baseline and ≥1 follow-up DWI scan available along with clinical data. Subjects without clinical data, DWI at either baseline or follow-up, or DWI of insufficient quality (attributable to excessive motion) were excluded from the study. Clinical outcome data were obtained via standard assessment 90 days after stroke using the modified Rankin Scale (mRS) score. A good outcome was defined as an mRS of 0 to 2 and a poor outcome as an mRS of 3 to 6. No subjects in either cohort had a lacunar stroke subtype or were treated with endovascular therapy. This study was approved by the Institutional Review Board, and all subjects or their legally authorized representative originally provided informed consent before participation in each study.
Imaging AnalysisRegion-of-interest analysis was conducted using a semiautomated method in Analyze 11.0 (Biomedical Imaging Resource, Mayo Clinic, Rochester, MN), based on our prior methods.11 Briefly, the stroke lesion and normal contralateral hemisphere regions of interest were initially defined on DWI, transferred to the ADC map for removal of cerebro-spinal fluid and calculation of ADC ratio (ADCr), and then applied to a coregistered FLAIR sequence when available to calculate FLAIR ra-tio (FLAIRr) (please see Figure I in the online-only Data Supplement). Stroke volume and intensity ratios were calculated on baseline and fol-low-up MRI for all subjects. Imaging analyses were performed by trained readers (T.W.K.B., M.K.) blinded to clinical and outcome data and sepa-rately reviewed by another blinded reader (W.T.K.). For additional qual-ity control, stroke volumes generated in this study were compared with prior values obtained as part of the original trial analyses. Similar to our prior experience, the intraclass correlation coefficient was 0.97.11
Stroke lesion expansion (∆DWI) was defined as the change in lesion volume between baseline and follow-up DWI.17–20 The pres-ence or absence of swelling and infarct growth was assessed by 2 readers (T.W.K.B. and W.T.K.) blinded to clinical and outcome data. Designations were made by comparing baseline and follow-up MRI scans side-by-side simultaneously in the axial, sagittal, and coro-nal planes using the Analyze 11.0 3D Voxel Registration module. Swelling was determined to be present if ≥2 of the following criteria were met on ≥2 axial DWI slices: (1) direct evidence of mass effect of affected gyri or (2) indirect evidence based on new distortion of ad-jacent tissue, new midline shift, or new effacement of sulci or lateral ventricle (see Figure 1 ). This 2-by-2 method was used to reduce the chance of misclassifying infarct growth as swelling. The inter-rater agreement of this method had a κ of 0.41 (fair agreement), which is similar to hemorrhagic transformation designation,21–23 and the final assignment was determined by consensus.
Infarct growth was defined as involvement of new anatomic ter-ritory either adjacent to or distinct from the baseline lesion, using the Alberta Stroke Program Early CT Score (ASPECTS).24 The ASPECTS was used because it is a validated and reproducible method of quantifying the neuroanatomic territories involved in a stroke le-sion. Infarct growth was defined as an increase in affected ASPECTS regions ≥1 from baseline to follow-up imaging. In an exploratory analysis, we reasoned that infarct growth defined by a change in ASPECTS regions ≥1 may include subjects with small amounts of infarct growth of limited clinical significance. Therefore, we assessed different cutoff points for the change in ASPECTS regions (changes in ASPECTS ≥2, ≥3).
The volumes of swelling and infarct growth were then determined for each subject on coregistered images using the Analyze 11.0
Volume Edit and Region-of-Interest modules. New neuroanatomic areas of infarction not present on the baseline MRI were first identi-fied on the follow-up MRI in the axial, sagittal, and coronal planes and then outlined in the Volume Edit module (see Figure 1 for ex-amples). Hemorrhage was excluded, although its exclusion did not alter the final analysis. The final volumes were determined based on the relationship: ∆DWI=infarct growth+swelling.
Statistical AnalysisOutcome testing with swelling and infarct growth was conducted in the EPITHET cohort, and analysis of lesional tissue properties was conducted in the NBO cohort. Descriptive statistics of base-line variables and outcomes are reported as mean±SD (for normally distributed continuous data), median with interquartile range (for non-normal or ordinal data), and proportions (for binary data). Inter-rater agreement was assessed for stroke volume using intra-class correlation coefficient and Bland–Altman analyses. The re-lationships between imaging and clinical covariates were assessed using Pearson or Spearman correlation testing, as appropriate. Univariate logistic regression was performed to investigate the asso-ciation of clinical and imaging variables with outcome. Multivariate logistic regression models were developed to test for independent effects. All tests were 2 sided, with the threshold of significance set at P<0.05. Statistical analyses were performed using JMP Pro 11.0 (SAS Institute, Cary, NC).
ResultsClinical CharacteristicsThe clinical characteristics of the 2 study populations are shown in Table 1. The cohorts were similar in age and
Figure 1. Examples of swelling, infarct growth, and both. Base-line diffusion-weighted imaging (DWI) was compared with the coregistered follow-up DWI to assess the presence of swelling or infarct growth. A, A patient who developed swelling between baseline and follow-up scan, demonstrating ventricular efface-ment and expansion of the caudate head (solid arrows) and loss of sulci (dotted arrows). B, An example of both swelling (solid arrows) and infarct growth (dashed arrows). C, An example of infarct growth (dashed arrows). The right-hand most images in each panel demonstrate the volumes attributed to either swelling or infarct growth. BL indicates baseline; FU, follow-up; and ROI, region of interest on the follow-up scan.
by guest on January 24, 2017http://stroke.ahajournals.org/
Dow
nloaded from

Battey et al Swelling Predicts Outcome After Stroke 3645
comorbidities. Of 20 subjects from the placebo arm of the NBO cohort, 1 was excluded because there was no follow-up MRI. Of 101 original subjects in the EPITHET cohort, 12 did not have DWI of sufficient quality for interpretation, 10 had no follow-up MRI, and 1 subject had no available scans. Nineteen NBO subjects and 78 EPITHET subjects constituted the final study populations. Based on the exclusion criteria of the original trial, the NBO cohort did not include patients treated with intravenous tissue-type plasminogen activator.
Swelling Predicts Outcome After StrokeThe EPITHET cohort had a baseline MRI and follow-up MRI obtained during the period of peak swelling 3 to 5 days after
stroke onset. Evidence of swelling was present in 67% of subjects, with infarct growth present in 43% (Table 1). The distribution of mRS scores for subjects dichotomized into the presence or absence of swelling (univariate P<0.002) and infarct growth (univariate P=0.33) is shown in Figure 2.
Next, we performed univariate regression to identify addi-tional predictors of poor 90-day functional outcome. Baseline National Institutes of Health Stroke Scale score, admission glucose level, swelling, and admission DWI volume were all associated with poor outcome (Table 2). After adjustment, the presence of swelling remained an independent predictor of poor 90-day outcome (P=0.02), whereas infarct growth did not (P=0.64). The inclusion of sex in the model did not alter the independent association of swelling with poor outcome.
Evaluation of incremental changes in the magnitude of infarct growth demonstrated that large infarct growth was asso-ciated with outcome in both univariate and multivariate analy-ses (please see Table I in the online-only Data Supplement). Importantly, swelling remained an independent predictor of poor outcome in each of the models tested.
Volumetric Lesion AnalysisThe change in stroke lesion volume between baseline and follow-up scans (∆DWI) has previously been reported as a marker for lesion growth.18–20 We confirmed that ∆DWI rep-resents a composite measure that encompasses both infarct growth into new anatomic territory and space-occupying brain edema by testing the association of the binary variables for swelling and infarct growth with ∆DWI. Both were indepen-dently associated with ΔDWI, confirming that each contrib-uted to lesion expansion (both P<0.0001). Moreover, when ∆DWI was substituted for swelling and infarct growth in the multivariate regression model, it was independently associ-ated with poor 90-day outcome (Table 3).
Next, we tested the relationship between the volumetric contributions of swelling and infarct growth and outcome. In
Table 1. Clinical and Imaging Characteristics of the Patients
NBO Cohort (n=19)
EPITHET Cohort (n=78)
Age, y, mean±SD 73±13 72±13
Sex, male, n (%) 15 (78) 42 (53)
Comorbidities, n (%)
Diabetes mellitus 4 (21) 19 (24)
Hypertension 14 (74) 55 (71)
Hyperlipidemia 13 (63) 33 (42)
Atrial fibrillation 10 (53) 33 (42)
IV tPA, n (%)* 0 (0) 36 (46)
Admission NIHSS score, median (IQR) 14 (7–19) 13 (8–17)
Time from LSW to MRI, h, mean±SD* 7.0±3.0 4.1±0.9
Admission DWI volume, mL, median (IQR)† 33 (14–77) 21 (9–51)
Admission PWI volume, mL, median (IQR) 140 (85–189) 157 (95–239)
Admission FLAIR ratio, mean±SD 1.21±0.12 …
Admission ADC ratio, mean±SD 0.693±0.067 0.685±0.075
∆DWI volume, mL, median (IQR) 25 (10–51) 14 (5–66)
Swelling, n (%) 13 (68) 53 (67)
Infarct growth, n (%) 7 (39) 34 (43)
Modified Rankin Scale score, median (IQR) 3 (2–6) 3 (1–4)
ADC indicates apparent diffusion coefficient; DWI, diffusion-weighted imaging; EPITHET, Echoplanar Imaging Thrombolysis Evaluation Trial; FLAIR, fluid-attenuated inversion recovery; IQR, interquartile range; IV tPA, intravenous tissue-type plasminogen activator; LSW, last seen well; NBO, Normobaric Oxygen Therapy in Acute Ischemic Stroke Trial; NIHSS, National Institutes of Health Stroke Scale; and PWI, perfusion-weighted imaging.
*P<0.001.†P<0.05.
90-day mRS score
Infarct Growth
No Infarct Growth
Swelling
No Swelling
0
1
2
3
4
5
6
Figure 2. Distribution of 90-day modified Rankin Scale (mRS) scores for subjects with and without swelling or infarct growth. The right-hand key represents each category of mRS as labeled. The height of each bar represents the percentage of the cohort with each score.
Table 2. Univariate and Multivariate Predictors of Poor Outcome After Stroke
mRS, 0–2 mRS, 0–2
OR 95% CI P ValueAdjusted
OR 95% CI P Value
Age 1.02 0.99–1.06 0.13 1.07 1.02–1.14 0.01
Sex (female) 0.80 0.36–1.79 0.59 … … …
Admission glucose 4.09 1.15–17.6 0.029 3.88 0.55–36.9 0.20
Admission NIHSS score
1.17 1.08–1.28 <0.001 1.18 1.03–1.39 0.02
Admission DWI volume
5.79 2.25–17.3 <0.001 4.67 1.13–24.0 0.03
Swelling 7.18 2.48–23.3 <0.002 4.55 1.21–18.9 0.02
Infarct growth (ΔASPECTS ≥1)
1.59 0.63–4.16 0.33 1.35 0.38–4.82 0.64
Admission glucose and DWI volume were log-transformed before inclusion in the regression model. Data are from the Echoplanar Imaging Thrombolysis Evaluation Trial (EPITHET) cohort. ASPECTS indicates Alberta Stroke Program Early CT Score; CI, confidence interval; DWI, diffusion-weighted imaging; mRS, modified Rankin Scale; NIHSS, National Institutes of Health Stroke Scale; and OR, odds ratio.
by guest on January 24, 2017http://stroke.ahajournals.org/
Dow
nloaded from

3646 Stroke December 2014
univariate analysis, the volume of swelling was associated with poor outcome (Figure 3A; P<0.001), whereas infarct growth volume demonstrated a trend (P=0.11). In multivariable regres-sion analysis, replacement of ΔDWI volume with swelling and infarct growth volumes confirmed that swelling was an inde-pendent predictor of outcome (P=0.003; Table 3). Importantly, because the baseline DWI lesion volume predicted the devel-opment of swelling (P<0.01), the inclusion (or removal) of the baseline DWI volume in the multivariable model did not alter the independent association between swelling and out-come. Receiver operating characteristic curve analysis showed that 11 mL of swelling volume had the highest sensitivity and specificity for distinguishing good versus poor outcome (Figure 3B; sensitivity, 77%; specificity, 75%; area under the curve=0.798). A similar receiver operating characteristic curve analysis for the prediction of swelling from the baseline DWI scan revealed that a volume ≥13 mL had the greatest sensitivity (81%) and specificity (67%) for identifying subjects who later developed swelling (area under the curve=0.790).
Tissue Properties Associated With SwellingNext, we investigated whether tissue properties of the stroke lesion assessed by MRI were associated with swelling or infarct
growth. First, we confirmed that admission perfusion deficit volume was associated with infarct growth (P<0.001). Next, we hypothesized that the degree of cytotoxic injury or blood–brain barrier breakdown may predict subsequent swelling.13,25 In addition to analyzing MRI scans in the EPITHET cohort, we extended our analysis to include the NBO cohort which had the added advantage of increased frequency, timing, and type of sequences available for analysis. This permitted detailed analysis of the time course of the lesional tissue characteristics (please see Figure II in the online-only Data Supplement).
We first evaluated the relative signal intensity of ADC (ADCr), which is considered a marker for cytotoxic injury.13,14 In the EPITHET cohort, a lower baseline ADCr was associ-ated with swelling volume (r=−0.31; P=0.006). Similarly, in the NBO cohort, ADCr was associated with the presence of swelling (P=0.04). On the contrary, and in both cohorts, ADCr was not associated with outcome (P=0.32 and P=0.25 for NBO and EPITHET cohorts, respectively).
Next, we evaluated the signal intensity ratio of T2 FLAIR (FLAIRr), which is hypothesized to reflect the degree of blood–brain barrier breakdown12,16 potentially leading to extravasation of fluid into the infarct.25 FLAIR sequences were only available in the NBO cohort, and consistent with prior reports,11 FLAIRr increased progressively during the first 2 days. In addition, the baseline FLAIRr was associated with the 48-hour FLAIRr (r=0.54; P=0.03), suggesting intrasubject differences that persist over time. Nevertheless, neither was FLAIRr predictive of swelling (P=0.51) nor was it associated with outcome (P=0.76).
DiscussionBrain edema is a well-recognized secondary complication of stroke; yet, the deleterious effect of swelling is only recog-nized in cases of malignant infarction. The main treatment option for malignant edema is surgical decompression,7,8 and existing evidence supports the conclusion that swelling is causally related to outcome, at least in large hemispheric stroke. In this study, we investigated the relationship between imaging markers of cerebral edema and clinical outcome in patients with a wider range of stroke severity. Our data pro-vide evidence for an association between swelling and poor functional outcome in moderately sized stroke, highlighting the broader clinical relevance of brain edema in stroke popu-lations. Although our data do not address causality of edema in this patient population, its well-defined role in malignant
Figure 3. Greater swelling is associated with poor neurological outcome. A, The volume of swelling in subjects with modi-fied Rankin Scale (mRS) score of 3 to 6 was higher than those with a 90-day mRS score of 0 to 2 (P<0.001). B, Receiver operating characteristic curve analysis shows that swelling of 11 mL predicts poor outcome with a sensitivity of 77% and a specificity of 75%, identified by the arrow. The area under the curve was 0.798.
Table 3. Multivariable Modeling of the Volume of Swelling and Infarct Growth With Poor Outcome
mRS, 0–2 mRS, 0–2
Adjusted OR 95% CI P Value
Adjusted OR 95% CI P Value
Age 1.07 1.02–1.13 0.01 1.10 1.03–1.18 0.001
Admission glucose 4.47 0.57–49.4 0.18 6.58 0.64–103 0.12
Admission NIHSS score
1.13 0.99–1.30 0.07 1.18 1.02–1.39 0.03
Admission DWI volume
2.41 0.56–11.3 0.24 1.46 0.26–9.33 0.67
ΔDWI volume 4.29 2.00–11.5 <0.001 … …
Volume of swelling … … 1.09 1.03–1.17 0.003
Volume of infarct growth
… … 1.08 0.68–1.78 0.74
Admission glucose, DWI volume, ΔDWI volume, and infarct growth volume were log-transformed before inclusion in the regression model in the Echoplanar Imaging Thrombolysis Evaluation Trial (EPITHET) cohort. CI indicates confidence interval; DWI, diffusion-weighted imaging; mRS, modified Rankin Scale; NIHSS, National Institutes of Health Stroke Scale; and OR, odds ratio.
by guest on January 24, 2017http://stroke.ahajournals.org/
Dow
nloaded from

Battey et al Swelling Predicts Outcome After Stroke 3647
edema suggests that it may be causally relevant in patients with stroke across the spectrum of stroke severity.
Our analysis also demonstrated that lesional volume mea-sures such as ΔDWI seem to represent a composite imaging measure that comprised infarct growth and edema. Although each was independently associated with ΔDWI, infarct growth had a more nuanced association with outcome. This some-what unexpected finding might be attributable to the fact that the mRS scoring system may not discriminate differences in patients with smaller amounts of infarct growth, or that our power for detection was limited by sample size. Notably, a recent study evaluated changes in ASPECTS in an endovascu-lar population and also found that large changes were predictive of poor outcome.26 Future work on ΔDWI may yield further insight into the relationships of infarct growth and swelling to ΔDWI and particularly whether there is a time-dependent effect of each. Validation in additional cohorts as well as prospective study will aid in more precisely defining their respective roles.
Our analysis also explored imaging determinants of swell-ing and found that baseline DWI volume and ADCr predicted swelling. The finding that larger strokes are associated with greater swelling is not surprising and is consistent with the malignant course that accompanies many large strokes.27 However, it is interesting that ADC signal intensity is associ-ated with swelling, because ADC is sensitive to the early cyto-toxic ischemia that develops minutes after stroke onset.13,14 Preclinical studies have demonstrated that the severity of the initial cytotoxic injury influences the volume of subsequent brain swelling in the days thereafter,28–30 a finding that is reca-pitulated here. Taking preclinical and clinical studies together, this raises the possibility that osmotic forces may be a primary contributor to brain swelling.31
We also explored the relationship with a marker of blood–brain barrier breakdown, FLAIRr.12,16 Our rationale for doing so was that physical leakage of fluid through degraded blood–brain barrier may contribute to brain swelling, a process sometimes termed hydrostatic edema.25 Although we cannot exclude a small association, we did not find any correlation with swelling in our study. As such, FLAIRr may serve as a risk marker for hemorrhagic transformation12,32 or to esti-mate the onset of hyperacute infarction,15 rather than risk of swelling.
Finally, the imaging biomarkers described here may prove useful for clinical application. First, ADCr may be used to iden-tify patients at risk for clinically meaningful swelling. Patients with lower ADCr may warrant not only closer observation for secondary neurological decline, but also careful avoidance of factors that may exacerbate swelling, such as administration of hypotonic solutions. Second, ADCr could be used to select patients for inclusion in clinical trials targeting novel anti-edema therapies. Although prospective study would be nec-essary, it may also be of interest to determine whether ADCr could be used to select patients for osmotherapy treatment.
However, our data also highlight the potential challenges associated with the use of surrogate imaging markers in clini-cal trial design. Although strongly associated with 90-day neu-rological outcome, we show that ΔDWI is a composite marker for both swelling and infarct growth. Apportioning the total ΔDWI into swelling and infarct growth volumes may provide
a more precise approach and provide greater usefulness as sur-rogate imaging markers. Our study has limitations. This was a retrospective analysis. However, it was performed in 2 cohorts with serial research brain MRIs and showed similar results. Nevertheless, the sample size was relatively small and included only moderate to severe infarction. It is not certain whether these data can be generalized to mild strokes with infarct vol-umes <10 mL or a National Institutes of Health Stroke Scale score <4. It is also possible that misclassification bias may exist in separating infarct growth and swelling, although we used conservative definitions to minimize this potential risk. The strengths of the study include the timing and frequency of brain MRI in 2 separate and well-defined study cohorts.
SummaryTaken together, these data demonstrate that brain edema mea-sured on MRI is associated with poor outcome after moder-ate to severe stroke. Future prospective study is warranted to assess the potential causative role of edema in influencing out-come in this population.
Sources of FundingThe original funding for the NBO trial was from the National Institutes of Health (NIH) R01NS051412 (Dr Singhal). The analysis performed for this study was funded in part by the NIH K23NS076597 (Dr Kimberly).
DisclosuresDr Wu received research grants from NIH R01NS059775, P50 NS051343, and R01 NS051412. Dr Singhal received research grants from NIH R01NS051412, P50NS051343, and R21NS077442. Dr Davis received honoraria from Boehringer Ingelheim, BMS Pfizer, Allergan, Covidien, and EVER Neuropharma and serves as a con-sultant for Boehringer Ingelheim. Dr Sheth received research grant from Remedy Pharmaceuticals, Inc. Dr Kimberly received research grants from NIH K23NS076597 and Remedy Pharmaceuticals, Inc. The other authors report no conflicts.
References 1. Wijdicks EF, Diringer MN. Middle cerebral artery territory infarction
and early brain swelling: progression and effect of age on outcome. Mayo Clin Proc. 1998;73:829–836.
2. Wijdicks EF, Sheth KN, Carter BS, Greer DM, Kasner SE, Kimberly WT, et al; American Heart Association Stroke Council. Recommendations for the management of cerebral and cerebellar infarction with swell-ing: a statement for healthcare professionals from the American Heart Association/American Stroke Association. Stroke. 2014;45:1222–1238.
3. Hacke W, Schwab S, Horn M, Spranger M, De Georgia M, von Kummer R. ‘Malignant’ middle cerebral artery territory infarction: clinical course and prognostic signs. Arch Neurol. 1996;53:309–315.
4. Berrouschot J, Sterker M, Bettin S, Köster J, Schneider D. Mortality of space-occupying (‘malignant’) middle cerebral artery infarction under conservative intensive care. Intensive Care Med. 1998;24:620–623.
5. Kimberly WT, Sheth KN. Approach to severe hemispheric stroke. Neurology. 2011;76(7 suppl 2):S50–S56.
6. Hofmeijer J, van der Worp HB, Kappelle LJ. Treatment of space-occupy-ing cerebral infarction. Crit Care Med. 2003;31:617–625.
7. Vahedi K, Hofmeijer J, Juettler E, Vicaut E, George B, Algra A, et al; DECIMAL, DESTINY, and HAMLET investigators. Early decompressive surgery in malignant infarction of the middle cerebral artery: a pooled anal-ysis of three randomised controlled trials. Lancet Neurol. 2007;6:215–222.
8. Jüttler E, Unterberg A, Woitzik J, Bösel J, Amiri H, Sakowitz OW, et al; DESTINY II Investigators. Hemicraniectomy in older patients with exten-sive middle-cerebral-artery stroke. N Engl J Med. 2014;370:1091–1100.
9. Shaw CM, Alvord EC Jr, Berry RG. Swelling of the brain following isch-emic infarction with arterial occlusion. Arch Neurol. 1959;1:161–177.
by guest on January 24, 2017http://stroke.ahajournals.org/
Dow
nloaded from

3648 Stroke December 2014
10. Qureshi AI, Suarez JI, Yahia AM, Mohammad Y, Uzun G, Suri MF, et al. Timing of neurologic deterioration in massive middle cerebral artery infarction: a multicenter review. Crit Care Med. 2003;31:272–277.
11. Kimberly WT, Battey TW, Pham L, Wu O, Yoo AJ, Furie KL, et al. Glyburide is associated with attenuated vasogenic edema in stroke patients. Neurocrit Care. 2014;20:193–201.
12. Jha R, Battey TW, Pham L, Lorenzano S, Furie KL, Sheth KN, et al. Fluid-attenuated inversion recovery hyperintensity correlates with matrix metalloproteinase-9 level and hemorrhagic transformation in acute ischemic stroke. Stroke. 2014;45:1040–1045.
13. Ayata C, Ropper AH. Ischaemic brain oedema. J Clin Neurosci. 2002;9:113–124.
14. Neumann-Haefelin T, Moseley ME, Albers GW. New magnetic reso-nance imaging methods for cerebrovascular disease: emerging clinical applications. Ann Neurol. 2000;47:559–570.
15. Thomalla G, Rossbach P, Rosenkranz M, Siemonsen S, Krützelmann A, Fiehler J, et al. Negative fluid-attenuated inversion recovery imag-ing identifies acute ischemic stroke at 3 hours or less. Ann Neurol. 2009;65:724–732.
16. Ostwaldt AC, Rozanski M, Schmidt WU, Nolte CH, Hotter B, Jungehuelsing GJ, et al. Early time course of FLAIR signal inten-sity differs between acute ischemic stroke patients with and with-out hyperintense acute reperfusion marker. Cerebrovasc Dis. 2014;37:141–146.
17. Davis SM, Donnan GA, Parsons MW, Levi C, Butcher KS, Peeters A, et al; EPITHET investigators. Effects of alteplase beyond 3 h after stroke in the Echoplanar Imaging Thrombolytic Evaluation Trial (EPITHET): a placebo-controlled randomised trial. Lancet Neurol. 2008;7:299–309.
18. Barrett KM, Ding YH, Wagner DP, Kallmes DF, Johnston KC; ASAP Investigators. Change in diffusion-weighted imaging infarct volume predicts neurologic outcome at 90 days: results of the Acute Stroke Accurate Prediction (ASAP) trial serial imaging substudy. Stroke. 2009;40:2422–2427.
19. Kimura K, Sakamoto Y, Iguchi Y, Shibazaki K. Serial changes in isch-emic lesion volume and neurological recovery after t-PA therapy. J Neurol Sci. 2011;304:35–39.
20. Cho KH, Kwon SU, Lee DH, Shim W, Choi C, Kim SJ, et al. Early infarct growth predicts long-term clinical outcome after thrombolysis. J Neurol Sci. 2012;316:99–103.
21. Wardlaw JM, Sellar R. A simple practical classification of cerebral infarcts on CT and its interobserver reliability. AJNR Am J Neuroradiol. 1994;15:1933–1939.
22. Motto C, Aritzu E, Boccardi E, De Grandi C, Piana A, Candelise L. Reliability of hemorrhagic transformation diagnosis in acute ischemic stroke. Stroke. 1997;28:302–306.
23. Arnould MC, Grandin CB, Peeters A, Cosnard G, Duprez TP. Comparison of CT and three MR sequences for detecting and categorizing early (48 hours) hemorrhagic transformation in hyperacute ischemic stroke. AJNR Am J Neuroradiol. 2004;25:939–944.
24. Barber PA, Demchuk AM, Zhang J, Buchan AM. Validity and reli-ability of a quantitative computed tomography score in predicting outcome of hyperacute stroke before thrombolytic therapy. ASPECTS Study Group. Alberta Stroke Programme Early CT Score. Lancet. 2000;355:1670–1674.
25. Simard JM, Kent TA, Chen M, Tarasov KV, Gerzanich V. Brain oedema in focal ischaemia: molecular pathophysiology and theoretical implica-tions. Lancet Neurol. 2007;6:258–268.
26. Liebeskind DS, Jahan R, Nogueira RG, Jovin TG, Lutsep HL, Saver JL; SWIFT Investigators. Serial Alberta Stroke Program early CT score from baseline to 24 hours in Solitaire Flow Restoration with the Intention for Thrombectomy study: a novel surrogate end point for revascularization in acute stroke. Stroke. 2014;45:723–727.
27. Thomalla G, Hartmann F, Juettler E, Singer OC, Lehnhardt FG, Köhrmann M, et al; Clinical Trial Net of the German Competence Network Stroke. Prediction of malignant middle cerebral artery infarction by magnetic resonance imaging within 6 hours of symptom onset: A prospective mul-ticenter observational study. Ann Neurol. 2010;68:435–445.
28. Todd NV, Picozzi P, Crockard A, Russell RW. Duration of ischemia influ-ences the development and resolution of ischemic brain edema. Stroke. 1986;17:466–471.
29. Bell BA, Symon L, Branston NM. CBF and time thresholds for the for-mation of ischemic cerebral edema, and effect of reperfusion in baboons. J Neurosurg. 1985;62:31–41.
30. Crockard A, Iannotti F, Hunstock AT, Smith RD, Harris RJ, Symon L. Cerebral blood flow and edema following carotid occlusion in the gerbil. Stroke. 1980;11:494–498.
31. Mintorovitch J, Yang GY, Shimizu H, Kucharczyk J, Chan PH, Weinstein PR. Diffusion-weighted magnetic resonance imaging of acute focal cerebral ischemia: comparison of signal intensity with changes in brain water and Na+,K(+)-ATPase activity. J Cereb Blood Flow Metab. 1994;14:332–336.
32. Kufner A, Galinovic I, Brunecker P, Cheng B, Thomalla G, Gerloff C, et al. Early infarct FLAIR hyperintensity is associated with increased hemorrhagic transformation after thrombolysis. Eur J Neurol. 2013;20:281–285.
by guest on January 24, 2017http://stroke.ahajournals.org/
Dow
nloaded from

KimberlyBruce C.V. Campbell, Stephen M. Davis, Geoffrey A. Donnan, Kevin N. Sheth and W. Taylor
Thomas W.K. Battey, Mahima Karki, Aneesh B. Singhal, Ona Wu, Saloomeh Sadaghiani,Brain Edema Predicts Outcome After Nonlacunar Ischemic Stroke
Print ISSN: 0039-2499. Online ISSN: 1524-4628 Copyright © 2014 American Heart Association, Inc. All rights reserved.
is published by the American Heart Association, 7272 Greenville Avenue, Dallas, TX 75231Stroke doi: 10.1161/STROKEAHA.114.006884
2014;45:3643-3648; originally published online October 21, 2014;Stroke.
http://stroke.ahajournals.org/content/45/12/3643World Wide Web at:
The online version of this article, along with updated information and services, is located on the
http://stroke.ahajournals.org/content/suppl/2014/10/21/STROKEAHA.114.006884.DC1.htmlData Supplement (unedited) at:
http://stroke.ahajournals.org//subscriptions/
is online at: Stroke Information about subscribing to Subscriptions:
http://www.lww.com/reprints Information about reprints can be found online at: Reprints:
document. Permissions and Rights Question and Answer process is available in the
Request Permissions in the middle column of the Web page under Services. Further information about thisOnce the online version of the published article for which permission is being requested is located, click
can be obtained via RightsLink, a service of the Copyright Clearance Center, not the Editorial Office.Strokein Requests for permissions to reproduce figures, tables, or portions of articles originally publishedPermissions:
by guest on January 24, 2017http://stroke.ahajournals.org/
Dow
nloaded from

SUPPLEMENTAL MATERIAL
Brain edema predicts outcome after non-lacunar ischemic stroke
Thomas W.K. Battey, BS1-3, Mahima Karki, BA1-3, Ona Wu, PhD3,4, Saloomeh Sadaghiani, BA3, Aneesh B. Singhal, MD3, Bruce C.V. Campbell, MBBS, PhD5,6, Stephen M. Davis, MD5, Geoffrey A. Donnan, MD6, Kevin N. Sheth, MD7, W. Taylor Kimberly, MD, PhD1-3
1. Center for Human Genetic Research, Massachusetts General Hospital, Boston, USA 2. Division of Neurocritical Care and Emergency Neurology, Massachusetts General Hospital,
Boston, USA 3. J. Philip Kistler Stroke Research Center, Massachusetts General Hospital, Boston, USA 4. Athinoula A. Martinos Center for Biomedical Imaging, Department of Radiology,
Massachusetts General Hospital, Boston, USA 5. Department of Medicine and Neurology, Royal Melbourne Hospital, Parkville, Australia 6. Florey Institute of Neuroscience and Mental Health, University of Melbourne, Parkville,
Victoria, Australia 7. Division of Neurocritical Care and Emergency Neurology, Yale New Haven Hospital, New
Haven, USA Correspondence: W. Taylor Kimberly, MD, PhD 55 Fruit Street, Lunder 644 Boston, MA 02114 USA [email protected]

Figure I. Method and quantitative time course for the stroke imaging metrics. (A) Method
for generating the region of interest (ROI) corresponding to the stroke lesion and contralateral
hemisphere. The lesion was first defined on diffusion weighted imaging (DWI), then transferred
to the ADC maps to exclude cerebrospinal fluid (CSF) and applied to a co-registered FLAIR
sequence. Stroke = red, CSF = aqua, Contralateral Hemisphere = green.
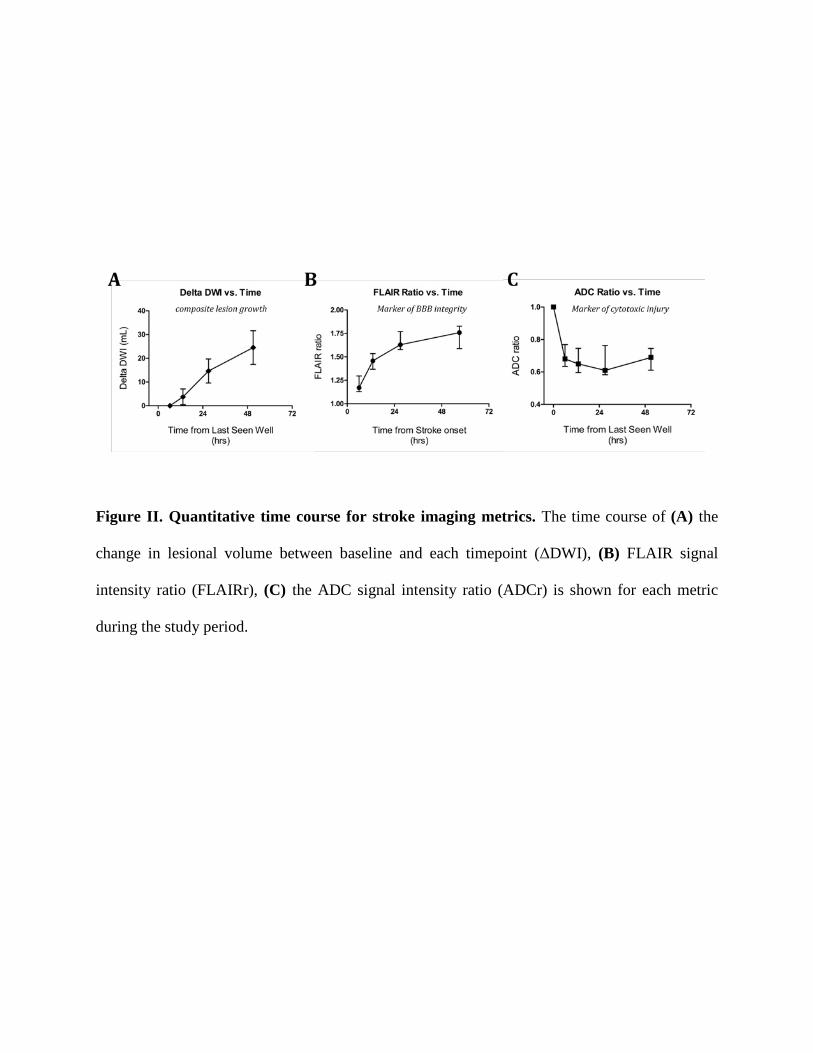
Figure II. Quantitative time course for stroke imaging metrics. The time course of (A) the
change in lesional volume between baseline and each timepoint (ΔDWI), (B) FLAIR signal
intensity ratio (FLAIRr), (C) the ADC signal intensity ratio (ADCr) is shown for each metric
during the study period.

Table I. Multivariable modeling of large infarct growth with poor outcome after stroke
Model 1
Model 2
Adjusted OR 95% CI P-value
Adjusted OR 95% CI P-value
Age 1.07 (1.02-1.14) 0.01
1.07 (1.02-1.14) 0.01 Admission glucose 4.00 (0.56-37.9) 0.17
4.31 (0.59-42.9) 0.15
Admission NIHSS 1.17 (1.01-1.38) 0.03
1.17 (1.01-1.39) 0.03 Admission DWI volume 4.42 (1.09-22.6) 0.04
4.25 (1.04-21.7) 0.04
Swelling 4.36 (1.14-18.3) 0.03
4.13 (1.07-17.5) 0.04 Infarct growth (ΔASPECTS ≥2) 1.65 (0.37-8.26) 0.51
- - -
Infarct growth (ΔASPECTS ≥3) - - - 7.05 (1.04-143) 0.045