brain correlates of phonological recoding of visual symbols
TRANSCRIPT
HAL Id: hal-02001154https://hal.archives-ouvertes.fr/hal-02001154
Submitted on 16 Apr 2019
HAL is a multi-disciplinary open accessarchive for the deposit and dissemination of sci-entific research documents, whether they are pub-lished or not. The documents may come fromteaching and research institutions in France orabroad, or from public or private research centers.
L’archive ouverte pluridisciplinaire HAL, estdestinée au dépôt et à la diffusion de documentsscientifiques de niveau recherche, publiés ou non,émanant des établissements d’enseignement et derecherche français ou étrangers, des laboratoirespublics ou privés.
Brain correlates of phonological recoding of visualsymbols
Sylvain Madec, Kévin Le Goff, Jean-Luc Anton, Marieke Longcamp, Jean-LucVelay, Bruno Nazarian, Muriel Roth, Pierre Courrieu, Jonathan Grainger,
Arnaud Rey
To cite this version:Sylvain Madec, Kévin Le Goff, Jean-Luc Anton, Marieke Longcamp, Jean-Luc Velay, et al.. Braincorrelates of phonological recoding of visual symbols. NeuroImage, Elsevier, 2016, 132, pp.359-372.�10.1016/j.neuroimage.2016.02.010�. �hal-02001154�
BRAIN CORRELATES OF PHONOLOGICAL RECODING OF VISUAL SYMBOLS
Sylvain Madec1,4*, Kévin Le Goff1,4, Jean-Luc Anton2,4, Marieke Longcamp3,4,
Jean-Luc Velay3,4, Bruno Nazarian2,4, Muriel Roth2,4,
Pierre Courrieu1,4, Jonathan Grainger1,4 and Arnaud Rey1,4
1. Laboratoire de Psychologie Cognitive – CNRS Aix-Marseille University, Marseille, France
2. Centre IRM Fonctionnelle, Institut des Neurosciences de la Timone – CNRS
Aix-Marseille University, Marseille, France
3. Laboratoire de Neurobiologie de la Cognition – CNRS Aix-Marseille University, Marseille, France
4. Brain and Language Research Institute,
Aix-Marseille University, Marseille, France
Running Head: PHONOLOGICAL RECODING
* Corresponding author:
Arnaud Rey Laboratoire de Psychologie Cognitive – CNRS Université Aix-Marseille 3, place Victor Hugo - Case D 13331 Marseille Cedex 03 – France E-mail: [email protected]

PHONOLOGICAL RECODING
2
Abstract
Learning to read involves setting up associations between meaningless visual inputs
(V) and their phonological representations (P). Here, we recorded the brain signals (ERPs and
fMRI) associated with phonological recoding (i.e., V-P conversion processes) in an artificial
learning situation in which participants had to learn the associations between 24 unknown
visual symbols (Japanese Katakana characters) and 24 arbitrary monosyllabic names. During
the learning phase on Day 1, the strength of V-P associations was manipulated by varying the
proportion of correct and erroneous associations displayed during a two-alternative forced
choice task. Recording event related potentials (ERPs) during the learning phase allowed us
to track changes in the processing of these visual symbols as a function of the strength of V-P
associations. We found that, at the end of the learning phase, ERPs were linearly affected by
the strength of V-P associations in a time-window starting around 200 ms post-stimulus onset
on right occipital sites and ending around 345 ms on left occipital sites. On Day 2,
participants had to perform a matching task during an fMRI session and the strength of these
V-P associations was again used as a probe for identifying brain regions related to
phonological recoding. Crucially, we found that the left fusiform gyrus was gradually affected
by the strength of V-P associations suggesting that this region is involved in the brain network
supporting phonological recoding processes.
PHONOLOGICAL RECODING
3
Introduction
Several studies have explored the physiological basis of reading by using functional
magnetic resonance imaging (fMRI) and have emphasized the contribution of a brain region
located on the left ventral occipitotemporal cortex (left vOT), sometimes designated as the
“visual word form area” (VWFA, see Cohen et al., 2000; McCandliss, Cohen, & Dehaene,
2003). These studies have reported invariance of this region’s activity to case and letter fonts
(Dehaene et al., 2001; Dehaene, Le Clec’H, Poline, Le Bihan, & Cohen, 2002), invariance to
the spatial location of the stimuli (Cohen et al., 2002), differential activities for letters and
their mirror images (Pegado, Nakamura, Cohen, & Dehaene, 2011), and similar functional
properties for this region across various cultures and writing systems (Bolger, Perfetti, &
Schneider, 2005; Liu et al., 2008). On the basis of these results, it has been suggested that the
VWFA would code for abstract representations involved in orthographic processing (Polk &
Farah, 2002; for a review, see Dehaene & Cohen, 2011).
This proposition is consistent with general properties of the ventral visual system. It
has indeed been proposed that the anterior part of left VOT would code for visual information
that is invariant to low-level visual factors and that, from posterior to anterior regions, it
would be organized hierarchically with neural detectors coding for increasingly larger
receptive fields and tuned to increasingly complex and abstract representations (for reviews,
see Logothetis & Sheinberg, 1996; Grill-Spector & Malach, 2004; Rolls, 2000). Within a
neurobiological model assuming a central role of the VWFA (i.e., the local combination
detector model, Dehaene et al., 2005) it has been suggested that word recognition would be
organized in sequential computational steps that would be activated in a purely feed-forward
fashion and that would depend on neural detectors hierarchically organized along the visual
stream. In this framework, non-orthographic representations (i.e., phonological or semantic)
would not be triggered as long as orthographic processing would not be completed. Therefore,
PHONOLOGICAL RECODING
4
none of these higher-level representations would contribute to orthographic processing
(Simos et al., 2002; for a discussion, see Carreiras, Armstrong, Perea, & Frost, 2014).
However, the functional role of left vOT (or VWFA) is still actively debated (e.g.,
Dehaene & Cohen, 2011; Price & Devlin, 2011). First, specificity of left vOT to orthographic
processing is contested by studies showing that left vOT is equally activated by pictures of
objects and by words (Sevastianov et al., 2002; Wright et al. 2008; Vogel, Petersen, &
Schlaggar, 2012; Kherif, Josse, & Price, 2011). Second, meta-analyses have shown that
several other language-related brain regions localized in the left hemisphere are also activated
during reading (Turkeltaub, Eden, Jones, & Zeffiro, 2002; Jobard, Crivello, & Tzourio-
Mazoyer, 2003; Vigneau et al., 2006). These regions include the temporo-parietal cortex,
including inferior parietal and superior temporal regions, as well as the inferior frontal cortex.
Concerning the inferior parietal regions, the supramarginal gyrus (SMG) has been associated
with phonological processing (Church, Balota, Petersen, & Schlagaar, 2011; Stoeckel, Gough,
Watkins, & Devlin, 2009; Price, Moore, Humphreys, & Wise, 1997; Wilson, Tregellas,
Slason, Pasko, & Rojas, 2011) while the angular gyrus (AG) has been associated with
semantic processing (Price et al., 1997). Concerning the superior temporal regions, the
superior temporal gyrus (STG) has also been associated with phonological processing (Price,
Wise, & Frackowiak, 1996; Rumsey et al.,1997; Simos et al., 2002). The inferior frontal gyrus
(IFG), and specifically its opercular part, has been considered as being implicated in
articulatory representations (Gitelman, Nobre, Sonty, Parrish, & Mesulam, 2005; Klein et al.,
2015; Mainy et al., 2008; Pugh et al., 1996; Sandak et al., 2004). Contributions of these brain
regions are consistent with early neurological models of reading (e.g., Ben-Shachar et al.,
2007) proposing that visual processing in the occipital cortex is relayed to the AG before
converging to the left posterior superior temporal cortex (for a contrasting view concerning
AG, see Price, 2000; Price & Mechelli, 2005).
PHONOLOGICAL RECODING
5
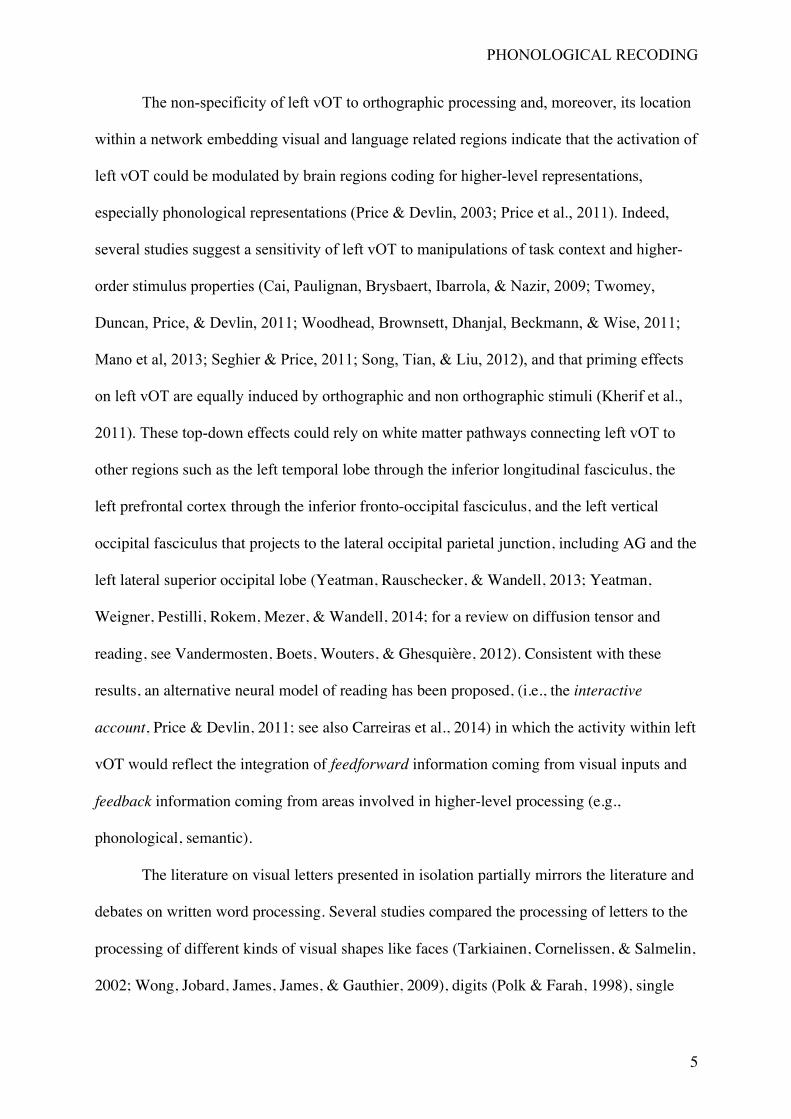
The non-specificity of left vOT to orthographic processing and, moreover, its location
within a network embedding visual and language related regions indicate that the activation of
left vOT could be modulated by brain regions coding for higher-level representations,
especially phonological representations (Price & Devlin, 2003; Price et al., 2011). Indeed,
several studies suggest a sensitivity of left vOT to manipulations of task context and higher-
order stimulus properties (Cai, Paulignan, Brysbaert, Ibarrola, & Nazir, 2009; Twomey,
Duncan, Price, & Devlin, 2011; Woodhead, Brownsett, Dhanjal, Beckmann, & Wise, 2011;
Mano et al, 2013; Seghier & Price, 2011; Song, Tian, & Liu, 2012), and that priming effects
on left vOT are equally induced by orthographic and non orthographic stimuli (Kherif et al.,
2011). These top-down effects could rely on white matter pathways connecting left vOT to
other regions such as the left temporal lobe through the inferior longitudinal fasciculus, the
left prefrontal cortex through the inferior fronto-occipital fasciculus, and the left vertical
occipital fasciculus that projects to the lateral occipital parietal junction, including AG and the
left lateral superior occipital lobe (Yeatman, Rauschecker, & Wandell, 2013; Yeatman,
Weigner, Pestilli, Rokem, Mezer, & Wandell, 2014; for a review on diffusion tensor and
reading, see Vandermosten, Boets, Wouters, & Ghesquière, 2012). Consistent with these
results, an alternative neural model of reading has been proposed, (i.e., the interactive
account, Price & Devlin, 2011; see also Carreiras et al., 2014) in which the activity within left
vOT would reflect the integration of feedforward information coming from visual inputs and
feedback information coming from areas involved in higher-level processing (e.g.,
phonological, semantic).
The literature on visual letters presented in isolation partially mirrors the literature and
debates on written word processing. Several studies compared the processing of letters to the
processing of different kinds of visual shapes like faces (Tarkiainen, Cornelissen, & Salmelin,
2002; Wong, Jobard, James, James, & Gauthier, 2009), digits (Polk & Farah, 1998), single
PHONOLOGICAL RECODING
6
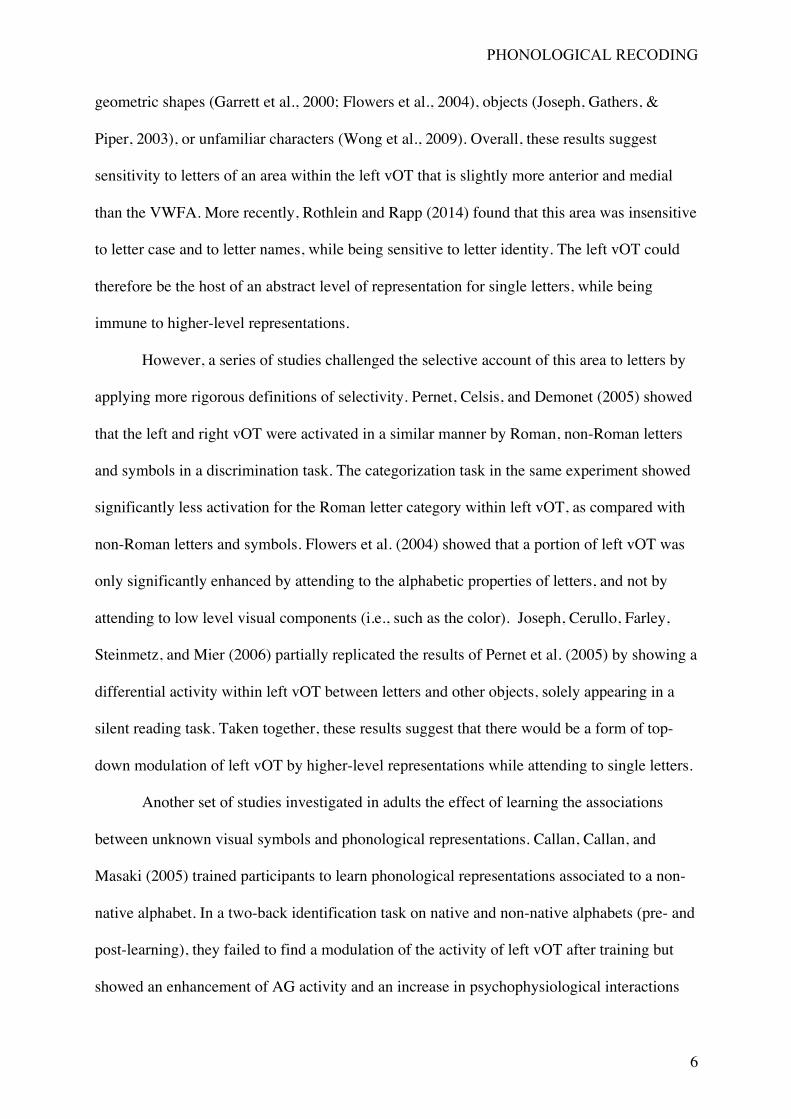
geometric shapes (Garrett et al., 2000; Flowers et al., 2004), objects (Joseph, Gathers, &
Piper, 2003), or unfamiliar characters (Wong et al., 2009). Overall, these results suggest
sensitivity to letters of an area within the left vOT that is slightly more anterior and medial
than the VWFA. More recently, Rothlein and Rapp (2014) found that this area was insensitive
to letter case and to letter names, while being sensitive to letter identity. The left vOT could
therefore be the host of an abstract level of representation for single letters, while being
immune to higher-level representations.
However, a series of studies challenged the selective account of this area to letters by
applying more rigorous definitions of selectivity. Pernet, Celsis, and Demonet (2005) showed
that the left and right vOT were activated in a similar manner by Roman, non-Roman letters
and symbols in a discrimination task. The categorization task in the same experiment showed
significantly less activation for the Roman letter category within left vOT, as compared with
non-Roman letters and symbols. Flowers et al. (2004) showed that a portion of left vOT was
only significantly enhanced by attending to the alphabetic properties of letters, and not by
attending to low level visual components (i.e., such as the color). Joseph, Cerullo, Farley,
Steinmetz, and Mier (2006) partially replicated the results of Pernet et al. (2005) by showing a
differential activity within left vOT between letters and other objects, solely appearing in a
silent reading task. Taken together, these results suggest that there would be a form of top-
down modulation of left vOT by higher-level representations while attending to single letters.
Another set of studies investigated in adults the effect of learning the associations
between unknown visual symbols and phonological representations. Callan, Callan, and
Masaki (2005) trained participants to learn phonological representations associated to a non-
native alphabet. In a two-back identification task on native and non-native alphabets (pre- and
post-learning), they failed to find a modulation of the activity of left vOT after training but
showed an enhancement of AG activity and an increase in psychophysiological interactions
PHONOLOGICAL RECODING
7
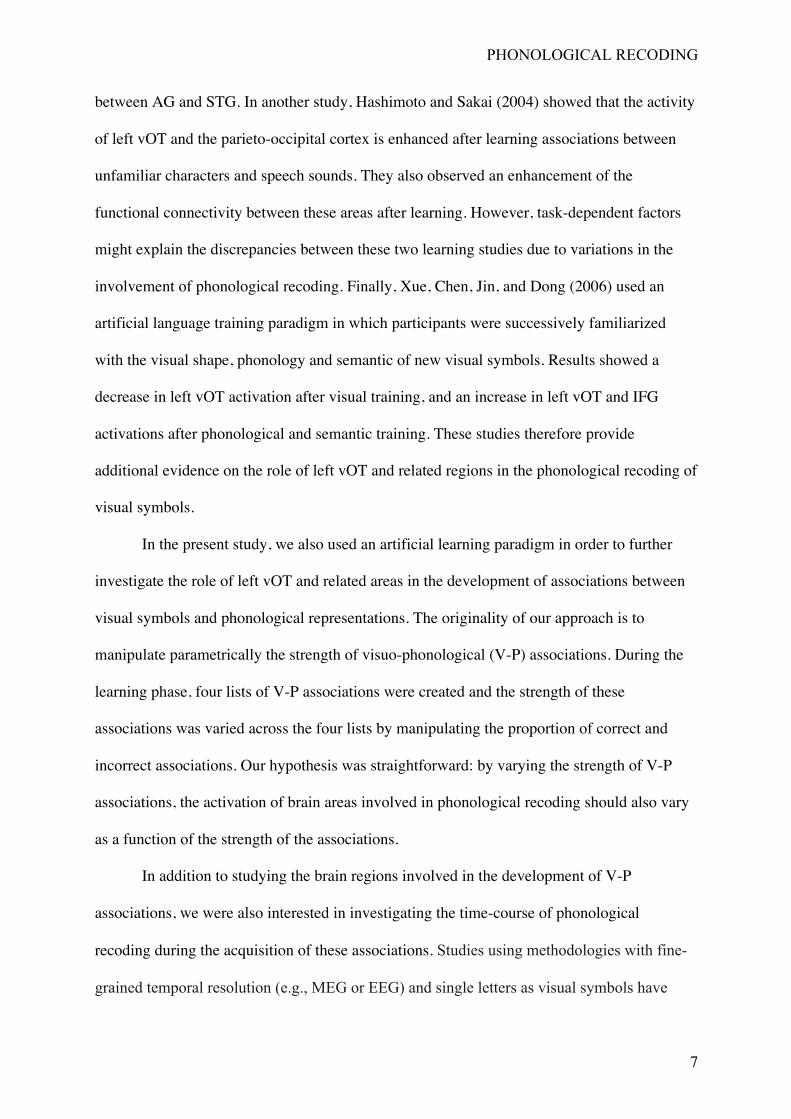
between AG and STG. In another study, Hashimoto and Sakai (2004) showed that the activity
of left vOT and the parieto-occipital cortex is enhanced after learning associations between
unfamiliar characters and speech sounds. They also observed an enhancement of the
functional connectivity between these areas after learning. However, task-dependent factors
might explain the discrepancies between these two learning studies due to variations in the
involvement of phonological recoding. Finally, Xue, Chen, Jin, and Dong (2006) used an
artificial language training paradigm in which participants were successively familiarized
with the visual shape, phonology and semantic of new visual symbols. Results showed a
decrease in left vOT activation after visual training, and an increase in left vOT and IFG
activations after phonological and semantic training. These studies therefore provide
additional evidence on the role of left vOT and related regions in the phonological recoding of
visual symbols.
In the present study, we also used an artificial learning paradigm in order to further
investigate the role of left vOT and related areas in the development of associations between
visual symbols and phonological representations. The originality of our approach is to
manipulate parametrically the strength of visuo-phonological (V-P) associations. During the
learning phase, four lists of V-P associations were created and the strength of these
associations was varied across the four lists by manipulating the proportion of correct and
incorrect associations. Our hypothesis was straightforward: by varying the strength of V-P
associations, the activation of brain areas involved in phonological recoding should also vary
as a function of the strength of the associations.
In addition to studying the brain regions involved in the development of V-P
associations, we were also interested in investigating the time-course of phonological
recoding during the acquisition of these associations. Studies using methodologies with fine-
grained temporal resolution (e.g., MEG or EEG) and single letters as visual symbols have
PHONOLOGICAL RECODING
8
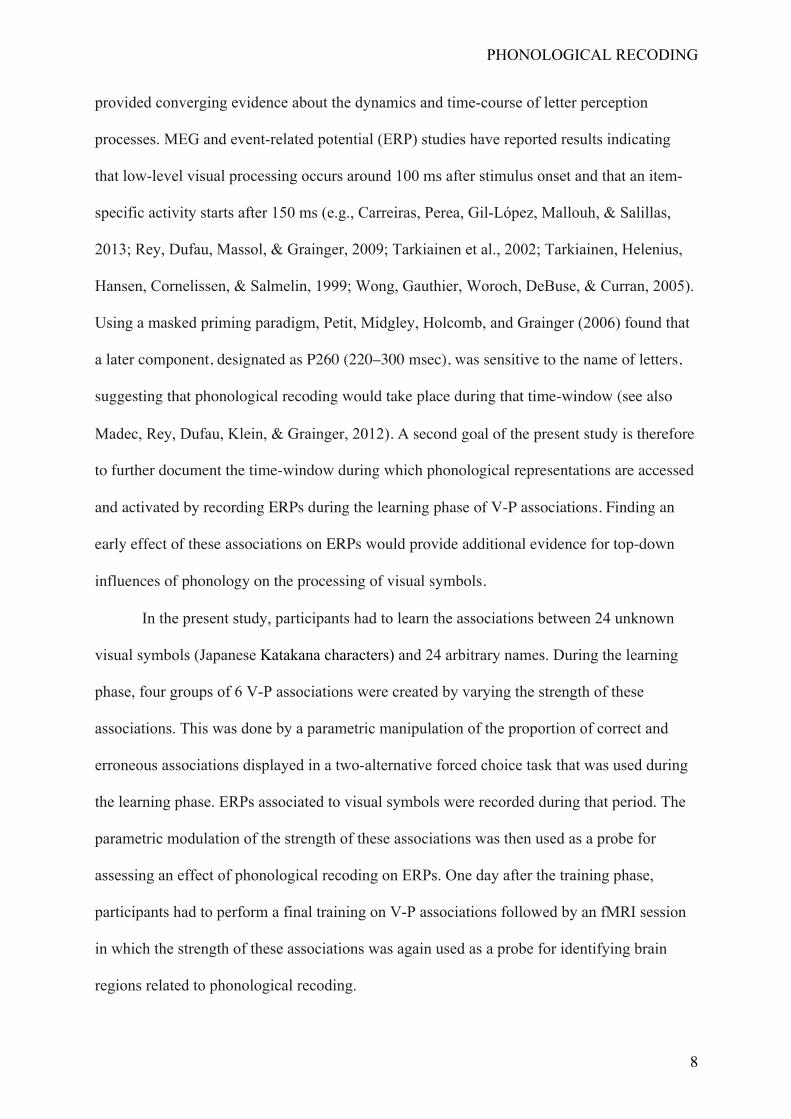
provided converging evidence about the dynamics and time-course of letter perception
processes. MEG and event-related potential (ERP) studies have reported results indicating
that low-level visual processing occurs around 100 ms after stimulus onset and that an item-
specific activity starts after 150 ms (e.g., Carreiras, Perea, Gil-López, Mallouh, & Salillas,
2013; Rey, Dufau, Massol, & Grainger, 2009; Tarkiainen et al., 2002; Tarkiainen, Helenius,
Hansen, Cornelissen, & Salmelin, 1999; Wong, Gauthier, Woroch, DeBuse, & Curran, 2005).
Using a masked priming paradigm, Petit, Midgley, Holcomb, and Grainger (2006) found that
a later component, designated as P260 (220–300 msec), was sensitive to the name of letters,
suggesting that phonological recoding would take place during that time-window (see also
Madec, Rey, Dufau, Klein, & Grainger, 2012). A second goal of the present study is therefore
to further document the time-window during which phonological representations are accessed
and activated by recording ERPs during the learning phase of V-P associations. Finding an
early effect of these associations on ERPs would provide additional evidence for top-down
influences of phonology on the processing of visual symbols.
In the present study, participants had to learn the associations between 24 unknown
visual symbols (Japanese Katakana characters) and 24 arbitrary names. During the learning
phase, four groups of 6 V-P associations were created by varying the strength of these
associations. This was done by a parametric manipulation of the proportion of correct and
erroneous associations displayed in a two-alternative forced choice task that was used during
the learning phase. ERPs associated to visual symbols were recorded during that period. The
parametric modulation of the strength of these associations was then used as a probe for
assessing an effect of phonological recoding on ERPs. One day after the training phase,
participants had to perform a final training on V-P associations followed by an fMRI session
in which the strength of these associations was again used as a probe for identifying brain
regions related to phonological recoding.
PHONOLOGICAL RECODING
9
Experiment
Participants
Twenty-four participants (14 females), with age ranging from 21 to 36, (mean age =
26.6, σ = 3.6) participated in the experiment. All participants were right-handed native
speakers of French with normal or corrected-to-normal vision. None of the participants were
familiar with Katakana characters and none of them reported history of psychiatric or
neurological disorders. All participants received a financial compensation for their
participation. This study received a prior approval from the Ethics Committee of Aix-
Marseille University and the CNRS (N° RCB 2010-A00155-34) and all participants signed a
written informed consent before starting the experiment.
Overview of the experiment (Figure 1a)
The entire experiment was planned on 2 consecutive days. During the first day, in the
afternoon, participants learned the associations between 24 Katakana symbols and their
corresponding names. After being exposed initially to these 24 V-P associations, participants
performed a two-alternatives forced choice (2AFC) task in which, on each trial, a visual
symbol was displayed and followed by one of the 24 possible names. Participants simply had
to produce a yes-response if the displayed V-P association was correct and a no-response
otherwise.
During this learning phase, Katakana symbols were divided into 4 groups
corresponding to the 4 learning conditions that were obtained by varying gradually the
exposure to correct associations during the 2AFC task. Out of 6 presentations of each visual
symbol, the correct association was presented 5 times in the easiest learning condition, and 4,
2, and 1 times in the other learning conditions, respectively. Therefore, in the most difficult
learning condition, participants saw the correct association only once out of 6 presentations of
the same visual symbol.
PHONOLOGICAL RECODING
10
During the 2 AFC task, Event-Related Potentials (ERPs) were recorded and epoched
to the visual presentation of Katakana symbols in order to track ERP modifications related to
the development of these gradual V-P associations. This learning phase was organized in 12
sessions of 92 trials and every two learning sessions, participants had to perform a naming
task on the 24 Katakana symbols in order to directly test their acquisition of these V-P
associations. There were no ERP recording during the naming task.
During the second day, in the morning, participants started with two learning sessions
(identical to the ones done on Day 1) with no ERP recording. They also had to perform one
naming task. This initial testing guaranteed that participants correctly learned the V-P
associations. Participants were then tested within the MRI and had to perform a matching
task.
< insert Figure 1 around here >
Material
Stimuli consisted in 24 Katakana symbols (Figure 1b). An arbitrary name
corresponding to a Consonant-Vowel syllable was given to each of the 24 symbols. This
arbitrary name prevented participants from learning these associations at home between Day 1
and Day 2 (by searching on the web, for example). Two sets of phonemes, 6 consonants and 4
vowels, were used to create each name by combining all the consonants to all the vowels.
These phonemes were chosen to generate names that could be easily perceived and produced
by native French speakers. These 24 Katakana symbols were divided into 4 groups of 6
symbols corresponding to the 4 learning conditions (i.e., Group 1: /ka/, /la/, /ti/, /bi/, /me/, /re/;
Group 2: /ki/, li/, /te/, /be/, /mo/, /ro/; Group 3: /ke/, /le/, /to/, /bo/, /ma/, /ra/; Group 4: /ko/,
/lo/, /ta/, /ba/, /mi/, /ri/). We controlled for the influence of low-level visual factors, possibly
differing between the 4 groups of Katakana symbols, by associating each of the 24 (4!)
permutations of the four groups to the 4 learning conditions (L1, L2, L3 and L4). Therefore,
PHONOLOGICAL RECODING
11
each participant had a unique association between each group of Katakana symbols and each
learning condition, and every group of Katakana symbols was associated with every learning
condition 6 times on the whole group of participants.
A set of 26 uppercase Roman letters, displayed in the Inconsolata font, was used as a
behavioral baseline condition in order to compare response times and accuracies for the four
learning conditions to the performance on overlearned V-P associations (i.e., letters with their
names). Six Roman letters were used in this baseline condition (D, F, L, P, R and V) and the
remaining letters were used as fillers.
Sound files corresponding to the names of all stimuli (24 Katakana and 26 alphabetical
letters) were recorded by one of the experimenters (AR) and digitized at 44100 Hz in a single
channel. Mean durations of the names were 449 ms and 442 ms, for Katakana and letter
names respectively (range and standard deviation for Katakana: [357 429] ms and 47 ms; for
letters: [322 606] ms and 78 ms).
During the 2AFC and naming tasks, all stimuli were presented on a 17" cathode ray
tube (CRT) monitor, with a refresh rate of 60 Hz, as white signs on an 800 x 600 pixels black
background (32 x 24 cm). Participants were seated at 80 cm from the screen. These tasks were
controlled by a personal computer using E-Prime (Psychology Software Tools, Pittsburgh,
PA). During the learning phase and the 2AFC task, all names were presented through in-ears
headphones. During the matching task (on Day 2, within the MRI), stimulus presentation and
response recording were monitored by a specific software using the National Instruments
LabVIEWVR environment and a digital hardware.
Learning phase: 2AFC task, ERP recording and preprocessing
On Day 1, after completing informed consent, participants seated comfortably in a
sound-attenuated and dimly lit room. At the beginning of the learning phase, participants were
first presented all the 24 V-P associations. During this initial exposure phase, a trial started
PHONOLOGICAL RECODING
12
with a fixation cross (‘+’) for 200 ms, followed by an empty screen for 500 ms. A Katakana
symbol was then presented in the middle of the screen for 700 ms together with its associated
name. It was followed by an empty screen of 500 ms. All Katakana symbols were presented at
this stage in a random order.
After this initial exposure to the 24 V-P associations, participants had to learn these
associations while performing a 2AFC task during which the EEG signal was recorded. In this
task, each trial started with a fixation cross ('+') for 200 ms, followed by an empty screen
during a randomized duration ranging from 400 to 600 ms (see Figure 2a). The visual
stimulus (Katakana symbol or alphabetic letter) was then presented in the middle of the
screen. After a randomized duration ranging from 500 to 700 ms, an auditory name was orally
presented and the visual stimulus remained on the screen until the participant’s response.
Response times were recorded from the onset of the auditory name. Feedback was finally
provided during 300 ms (green checklist symbol for correct responses and red cross for
errors). Each trial ended with an inter-trial interval that consisted in an empty screen for a
randomized duration ranging from 400 to 600 ms. Participants were requested to be as
accurate and as fast as possible. They were also asked to remain as relaxed as possible in
order to avoid movements that could generate artifacts on the EEG recording (e.g., eye blinks
during the visual presentation of the stimuli or frowning movements).
< insert Figure 2 around here >
By manipulating the amount of exposure to the correct associations during the 2AFC
task, 4 learning conditions were created. The 4 groups of Katakana symbols were assigned to
each of these conditions. Out of 6 presentations of each Katakana symbol, the correct V-P
association was presented 1, 2, 4 or 5 times in the L1, L2, L3 and L4 learning conditions,
respectively. Due to this experimental manipulation, participants had therefore more
opportunities to learn the correct association in the L4 condition (by seeing 5 times the correct
PHONOLOGICAL RECODING
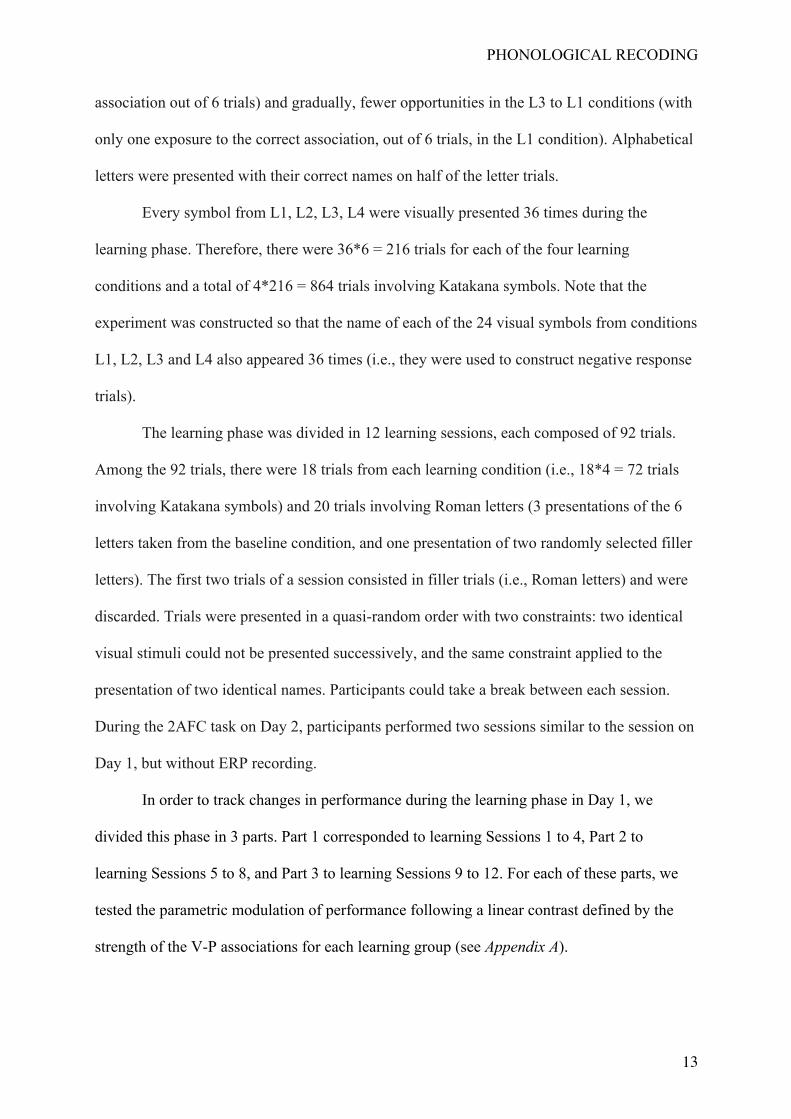
13
association out of 6 trials) and gradually, fewer opportunities in the L3 to L1 conditions (with
only one exposure to the correct association, out of 6 trials, in the L1 condition). Alphabetical
letters were presented with their correct names on half of the letter trials.
Every symbol from L1, L2, L3, L4 were visually presented 36 times during the
learning phase. Therefore, there were 36*6 = 216 trials for each of the four learning
conditions and a total of 4*216 = 864 trials involving Katakana symbols. Note that the
experiment was constructed so that the name of each of the 24 visual symbols from conditions
L1, L2, L3 and L4 also appeared 36 times (i.e., they were used to construct negative response
trials).
The learning phase was divided in 12 learning sessions, each composed of 92 trials.
Among the 92 trials, there were 18 trials from each learning condition (i.e., 18*4 = 72 trials
involving Katakana symbols) and 20 trials involving Roman letters (3 presentations of the 6
letters taken from the baseline condition, and one presentation of two randomly selected filler
letters). The first two trials of a session consisted in filler trials (i.e., Roman letters) and were
discarded. Trials were presented in a quasi-random order with two constraints: two identical
visual stimuli could not be presented successively, and the same constraint applied to the
presentation of two identical names. Participants could take a break between each session.
During the 2AFC task on Day 2, participants performed two sessions similar to the session on
Day 1, but without ERP recording.
In order to track changes in performance during the learning phase in Day 1, we
divided this phase in 3 parts. Part 1 corresponded to learning Sessions 1 to 4, Part 2 to
learning Sessions 5 to 8, and Part 3 to learning Sessions 9 to 12. For each of these parts, we
tested the parametric modulation of performance following a linear contrast defined by the
strength of the V-P associations for each learning group (see Appendix A).

PHONOLOGICAL RECODING
14
During the 2AFC task on Day 1, the EEG was recorded from 64 Ag/AgCl Active-2
pre-amplified electrodes (BIOSEMI, Amsterdam; 10–20 system positions). The vertical
electro-oculogram (EOG) was recorded by mean of one electrode (Ag/AgCl) just below the
right eye. The horizontal EOG was recorded with two electrodes (Ag/AgCl) positioned over
the two outer canthi. Analog signal was digitized at 1024 Hz. Electrode offsets were kept
below ±25 μV. Offline, data were referenced on the mean of mastoid electrodes. Continuous
signals were band-pass filtered by using a butterworth filter of order 4 between 0.02Hz and 40
Hz. The resulting signals were then epoched between -300 and 1000 ms before and after the
presentation of the visual symbol. We relied on an independent components analysis (Makeig,
Bell, Jung, & Sejnowski, 1996), as implemented in the runica EEGLAB function (Delorme
& Makeig, 2004; Delorme, Sejnowski, & Makeig, 2007), to identify artefactual ocular
components related to blink activities. They were identified and removed by visual inspection
of their scalp topographies, time-courses and activity spectra. Subsequently, we re-epoched
signals between -100 and 500 ms before and after the presentation of the visual symbol, and
subtracted the average baseline between -100 and 0 ms from each time-point, electrode-by-
electrode. We excluded all trials with abnormal activities after a trial-by-trial visual
inspection. Finally, a Laplacian transformation (Perrin, Pernier, Bertrand, & Echallier, 1989;
as implemented by Cohen, 2014) was applied to the epoched signal (maximum degree of
Legendre polynomial: 10, order of splines: 4, smoothing parameter = 10-5). Thereby we
obtained ERPs evoked by the presentation of visual symbols for each of the learning
conditions L1, L2, L3 and L4.
As for the behavioral results, ERPs at the individual level were analyzed by estimating
the linear contrast with weights [-2 -1 1 2] associated to L1, L2, L3 and L4 (see Appendix A).
At the group level, we computed a one-sample t-test through a bootstrap t-approach, by
relying on the LIMO toolbox (Pernet, Chauveau, Gaspard, & Rousselet, 2011), for every pair
PHONOLOGICAL RECODING
15
(e, t) defined in the spatial (e) and temporal (t) dimensions. We corrected for multiple
comparisons by relying on spatio-temporal clustering (2D clustering; for additional
information see Pernet et al., 2011; Maris & Oostenveld, 2007).
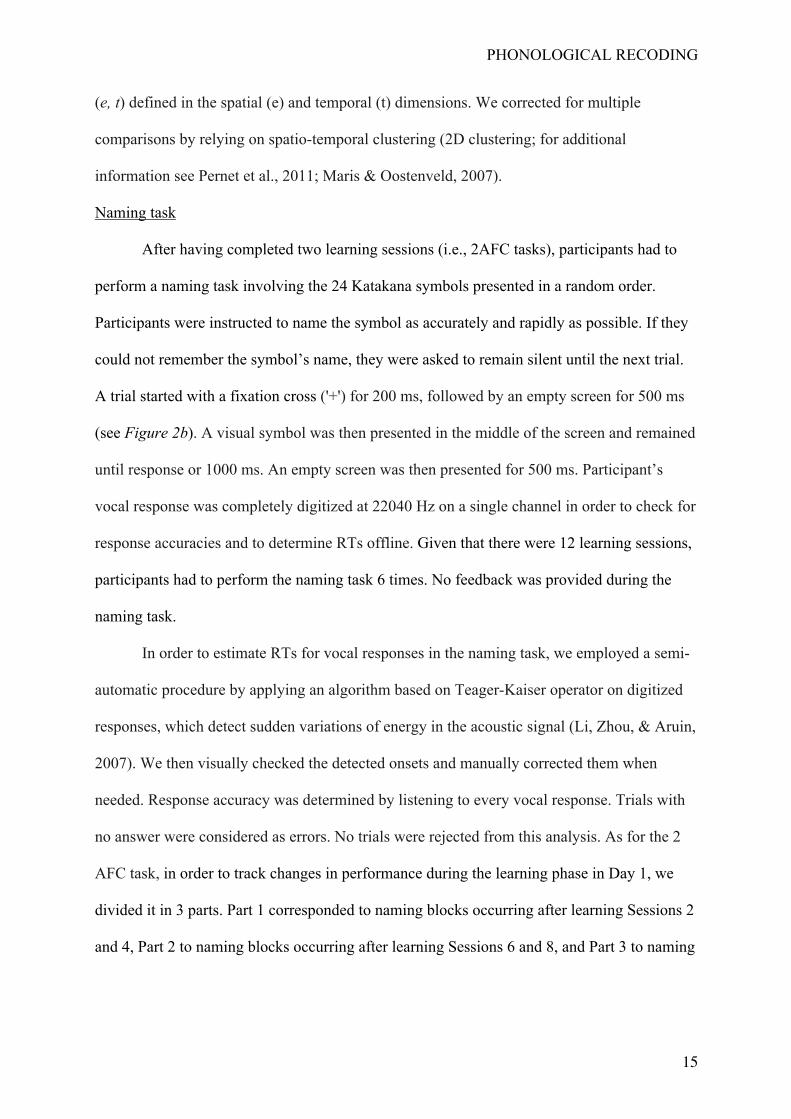
Naming task
After having completed two learning sessions (i.e., 2AFC tasks), participants had to
perform a naming task involving the 24 Katakana symbols presented in a random order.
Participants were instructed to name the symbol as accurately and rapidly as possible. If they
could not remember the symbol’s name, they were asked to remain silent until the next trial.
A trial started with a fixation cross ('+') for 200 ms, followed by an empty screen for 500 ms
(see Figure 2b). A visual symbol was then presented in the middle of the screen and remained
until response or 1000 ms. An empty screen was then presented for 500 ms. Participant’s
vocal response was completely digitized at 22040 Hz on a single channel in order to check for
response accuracies and to determine RTs offline. Given that there were 12 learning sessions,
participants had to perform the naming task 6 times. No feedback was provided during the
naming task.
In order to estimate RTs for vocal responses in the naming task, we employed a semi-
automatic procedure by applying an algorithm based on Teager-Kaiser operator on digitized
responses, which detect sudden variations of energy in the acoustic signal (Li, Zhou, & Aruin,
2007). We then visually checked the detected onsets and manually corrected them when
needed. Response accuracy was determined by listening to every vocal response. Trials with
no answer were considered as errors. No trials were rejected from this analysis. As for the 2
AFC task, in order to track changes in performance during the learning phase in Day 1, we
divided it in 3 parts. Part 1 corresponded to naming blocks occurring after learning Sessions 2
and 4, Part 2 to naming blocks occurring after learning Sessions 6 and 8, and Part 3 to naming
PHONOLOGICAL RECODING
16
blocks occurring after learning Sessions 10 and 12. Statistical analyses (RTs and ACCs) relied
on the same procedure as the one used for the 2AFC task.
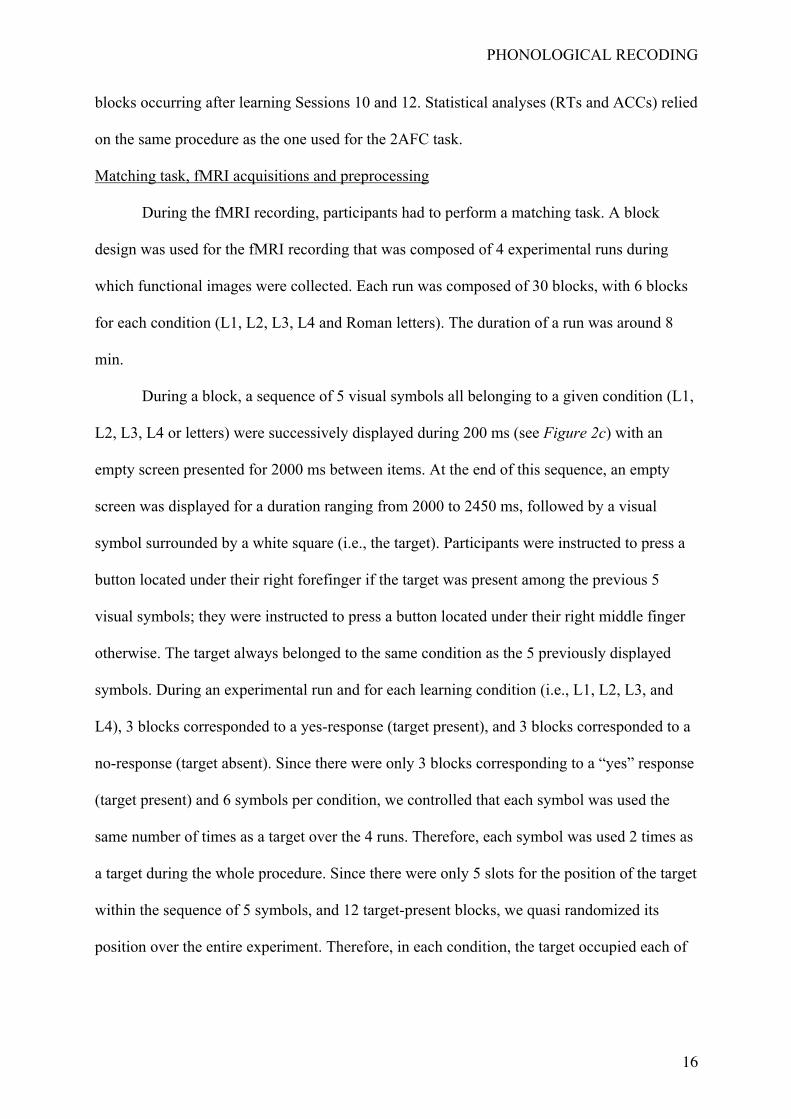
Matching task, fMRI acquisitions and preprocessing
During the fMRI recording, participants had to perform a matching task. A block
design was used for the fMRI recording that was composed of 4 experimental runs during
which functional images were collected. Each run was composed of 30 blocks, with 6 blocks
for each condition (L1, L2, L3, L4 and Roman letters). The duration of a run was around 8
min.
During a block, a sequence of 5 visual symbols all belonging to a given condition (L1,
L2, L3, L4 or letters) were successively displayed during 200 ms (see Figure 2c) with an
empty screen presented for 2000 ms between items. At the end of this sequence, an empty
screen was displayed for a duration ranging from 2000 to 2450 ms, followed by a visual
symbol surrounded by a white square (i.e., the target). Participants were instructed to press a
button located under their right forefinger if the target was present among the previous 5
visual symbols; they were instructed to press a button located under their right middle finger
otherwise. The target always belonged to the same condition as the 5 previously displayed
symbols. During an experimental run and for each learning condition (i.e., L1, L2, L3, and
L4), 3 blocks corresponded to a yes-response (target present), and 3 blocks corresponded to a
no-response (target absent). Since there were only 3 blocks corresponding to a “yes” response
(target present) and 6 symbols per condition, we controlled that each symbol was used the
same number of times as a target over the 4 runs. Therefore, each symbol was used 2 times as
a target during the whole procedure. Since there were only 5 slots for the position of the target
within the sequence of 5 symbols, and 12 target-present blocks, we quasi randomized its
position over the entire experiment. Therefore, in each condition, the target occupied each of
PHONOLOGICAL RECODING
17
the 5 slots at least two times (10 blocks). For the 2 remaining blocks, the slot of the target was
randomized between slots 2, 3 and 4. No feedback was provided during the matching task.
Before entering the MRI scanner, participants were trained to the matching task using
only letter stimuli and for 4 experimental blocks. After training, participants entered the MRI
body scanner and performed the 4 functional runs. At the end of the session, a whole brain
anatomical MRI data was acquired.
Functional and anatomical data were collected on a 3-Telsa MRI body scanner
(Bruker, Medspec, Germany) using a 2-channel head coil. Participants laid in supine position
on the scanner bed, with foam padding applied between the participant’s head and the coil, to
help constrain head movement. Stimuli were projected centrally at the back of the magnet
bore, and participants viewed the projected stimuli through a head-coil mounted mirror placed
in front of their eyes.
For functional neuroimaging, functional slices acquisition was axial oblique, angled
−20° relative to AC-PC plane in order to cover the whole brain. Functional T2*-weighted
images were acquired using a gradient echo-planar imaging sequence, with 36 sequential
slices of 3 mm-thick/0 mm-gap (repetition time = 2400 ms, echo time = 30 ms, flip angle =
81.6 °, field of view = 192 mm, 64×64 matrix of 3×3×3 mm voxels). Whole brain anatomical
MRI data was acquired using high-resolution structural T1-weighted image (MPRAGE
sequence, resolution 1×1×1 mm) in the sagittal plane after the functional runs. Prior to the
functional runs, a fieldmap acquisition (3D FLASH sequence inter-echo time 4.552 ms) was
collected in order to estimate the B0 inhomogeneity and correct the spatial distortions of
functional volumes.
Concerning fMRI pre-processing, four dummy scans in each run were discarded in
order to ensure that the longitudinal relaxation time equilibration was achieved. Data was pre-
processed and analyzed using SPM8 (Wellcome Department of Cognitive Neurology,
PHONOLOGICAL RECODING
18
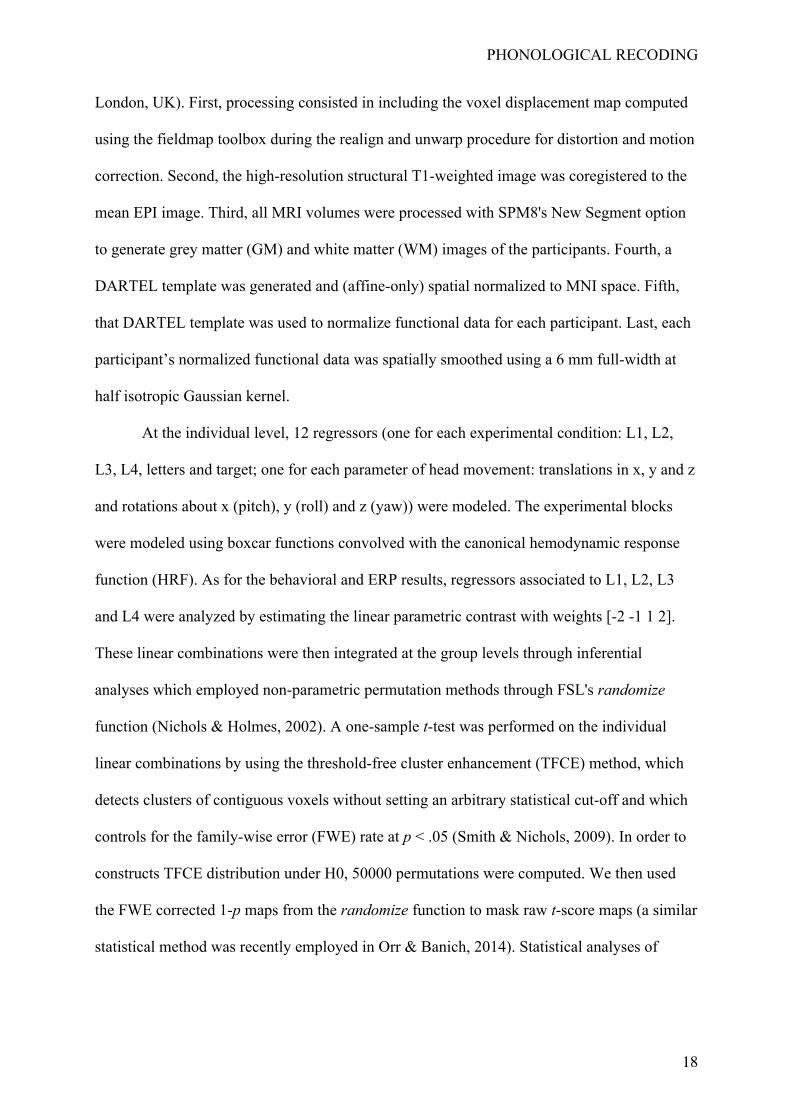
London, UK). First, processing consisted in including the voxel displacement map computed
using the fieldmap toolbox during the realign and unwarp procedure for distortion and motion
correction. Second, the high-resolution structural T1-weighted image was coregistered to the
mean EPI image. Third, all MRI volumes were processed with SPM8's New Segment option
to generate grey matter (GM) and white matter (WM) images of the participants. Fourth, a
DARTEL template was generated and (affine-only) spatial normalized to MNI space. Fifth,
that DARTEL template was used to normalize functional data for each participant. Last, each
participant’s normalized functional data was spatially smoothed using a 6 mm full-width at
half isotropic Gaussian kernel.
At the individual level, 12 regressors (one for each experimental condition: L1, L2,
L3, L4, letters and target; one for each parameter of head movement: translations in x, y and z
and rotations about x (pitch), y (roll) and z (yaw)) were modeled. The experimental blocks
were modeled using boxcar functions convolved with the canonical hemodynamic response
function (HRF). As for the behavioral and ERP results, regressors associated to L1, L2, L3
and L4 were analyzed by estimating the linear parametric contrast with weights [-2 -1 1 2].
These linear combinations were then integrated at the group levels through inferential
analyses which employed non-parametric permutation methods through FSL's randomize
function (Nichols & Holmes, 2002). A one-sample t-test was performed on the individual
linear combinations by using the threshold-free cluster enhancement (TFCE) method, which
detects clusters of contiguous voxels without setting an arbitrary statistical cut-off and which
controls for the family-wise error (FWE) rate at p < .05 (Smith & Nichols, 2009). In order to
constructs TFCE distribution under H0, 50000 permutations were computed. We then used
the FWE corrected 1-p maps from the randomize function to mask raw t-score maps (a similar
statistical method was recently employed in Orr & Banich, 2014). Statistical analyses of
PHONOLOGICAL RECODING
19
behavioral results (RTs and ACCs) of the matching task relied on the same procedure than the
one used for the 2AFC and naming tasks.
Results
Behavioral results
Learning task: 2AFC
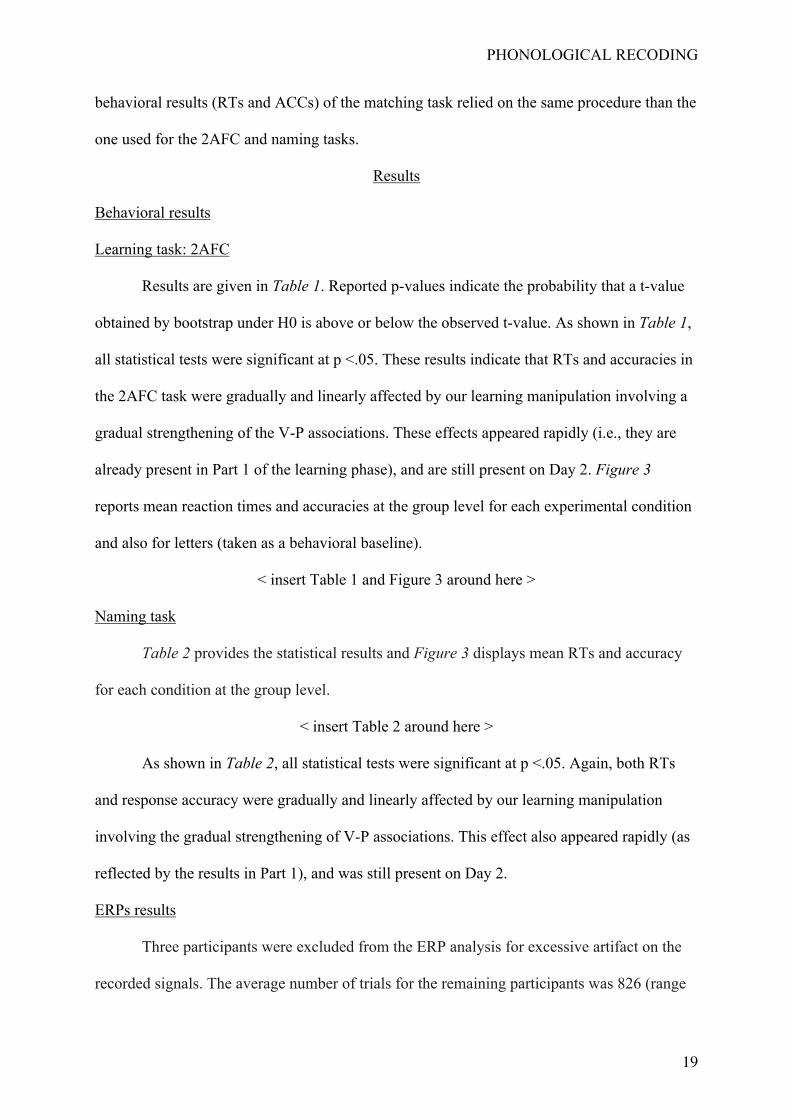
Results are given in Table 1. Reported p-values indicate the probability that a t-value
obtained by bootstrap under H0 is above or below the observed t-value. As shown in Table 1,
all statistical tests were significant at p <.05. These results indicate that RTs and accuracies in
the 2AFC task were gradually and linearly affected by our learning manipulation involving a
gradual strengthening of the V-P associations. These effects appeared rapidly (i.e., they are
already present in Part 1 of the learning phase), and are still present on Day 2. Figure 3
reports mean reaction times and accuracies at the group level for each experimental condition
and also for letters (taken as a behavioral baseline).
< insert Table 1 and Figure 3 around here >
Naming task
Table 2 provides the statistical results and Figure 3 displays mean RTs and accuracy
for each condition at the group level.
< insert Table 2 around here >
As shown in Table 2, all statistical tests were significant at p <.05. Again, both RTs
and response accuracy were gradually and linearly affected by our learning manipulation
involving the gradual strengthening of V-P associations. This effect also appeared rapidly (as
reflected by the results in Part 1), and was still present on Day 2.
ERPs results
Three participants were excluded from the ERP analysis for excessive artifact on the
recorded signals. The average number of trials for the remaining participants was 826 (range
PHONOLOGICAL RECODING
20
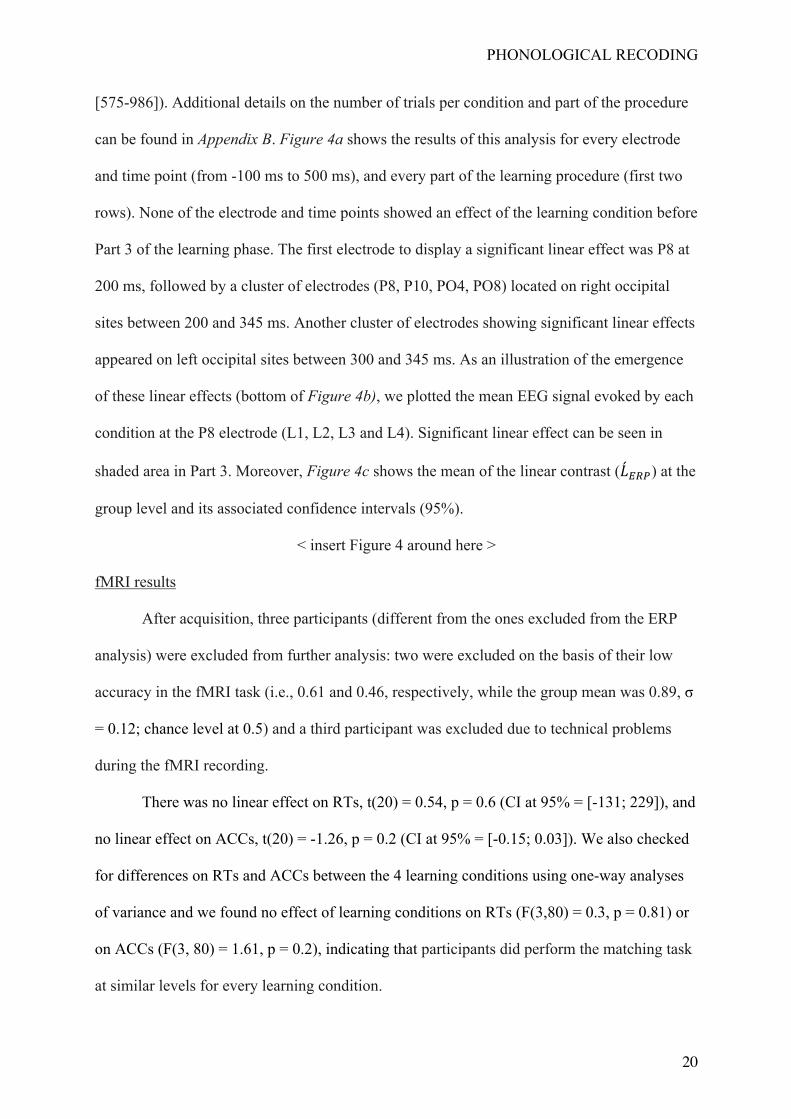
[575-986]). Additional details on the number of trials per condition and part of the procedure
can be found in Appendix B. Figure 4a shows the results of this analysis for every electrode
and time point (from -100 ms to 500 ms), and every part of the learning procedure (first two
rows). None of the electrode and time points showed an effect of the learning condition before
Part 3 of the learning phase. The first electrode to display a significant linear effect was P8 at
200 ms, followed by a cluster of electrodes (P8, P10, PO4, PO8) located on right occipital
sites between 200 and 345 ms. Another cluster of electrodes showing significant linear effects
appeared on left occipital sites between 300 and 345 ms. As an illustration of the emergence
of these linear effects (bottom of Figure 4b), we plotted the mean EEG signal evoked by each
condition at the P8 electrode (L1, L2, L3 and L4). Significant linear effect can be seen in
shaded area in Part 3. Moreover, Figure 4c shows the mean of the linear contrast (�́�#$%) at the
group level and its associated confidence intervals (95%).
< insert Figure 4 around here >
fMRI results
After acquisition, three participants (different from the ones excluded from the ERP
analysis) were excluded from further analysis: two were excluded on the basis of their low
accuracy in the fMRI task (i.e., 0.61 and 0.46, respectively, while the group mean was 0.89, σ
= 0.12; chance level at 0.5) and a third participant was excluded due to technical problems
during the fMRI recording.
There was no linear effect on RTs, t(20) = 0.54, p = 0.6 (CI at 95% = [-131; 229]), and
no linear effect on ACCs, t(20) = -1.26, p = 0.2 (CI at 95% = [-0.15; 0.03]). We also checked
for differences on RTs and ACCs between the 4 learning conditions using one-way analyses
of variance and we found no effect of learning conditions on RTs (F(3,80) = 0.3, p = 0.81) or
on ACCs (F(3, 80) = 1.61, p = 0.2), indicating that participants did perform the matching task
at similar levels for every learning condition.
PHONOLOGICAL RECODING
21
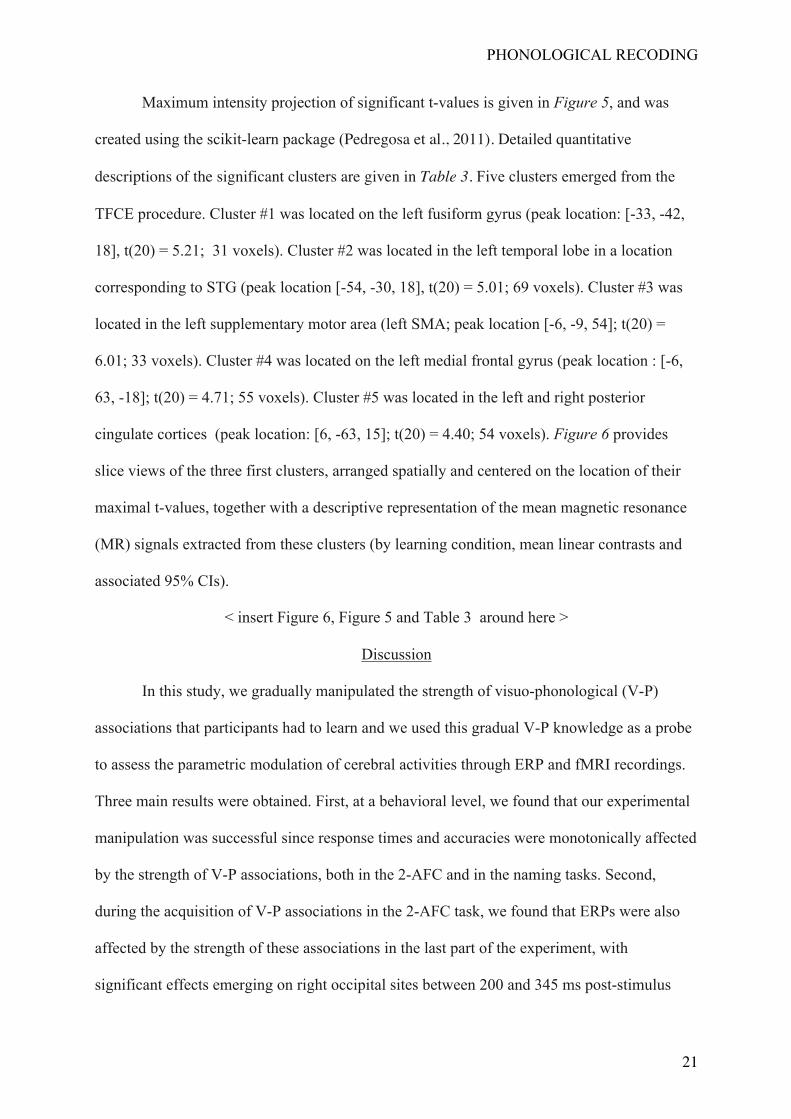
Maximum intensity projection of significant t-values is given in Figure 5, and was
created using the scikit-learn package (Pedregosa et al., 2011). Detailed quantitative
descriptions of the significant clusters are given in Table 3. Five clusters emerged from the
TFCE procedure. Cluster #1 was located on the left fusiform gyrus (peak location: [-33, -42,
18], t(20) = 5.21; 31 voxels). Cluster #2 was located in the left temporal lobe in a location
corresponding to STG (peak location [-54, -30, 18], t(20) = 5.01; 69 voxels). Cluster #3 was
located in the left supplementary motor area (left SMA; peak location [-6, -9, 54]; t(20) =
6.01; 33 voxels). Cluster #4 was located on the left medial frontal gyrus (peak location : [-6,
63, -18]; t(20) = 4.71; 55 voxels). Cluster #5 was located in the left and right posterior
cingulate cortices (peak location: [6, -63, 15]; t(20) = 4.40; 54 voxels). Figure 6 provides
slice views of the three first clusters, arranged spatially and centered on the location of their
maximal t-values, together with a descriptive representation of the mean magnetic resonance
(MR) signals extracted from these clusters (by learning condition, mean linear contrasts and
associated 95% CIs).
< insert Figure 6, Figure 5 and Table 3 around here >
Discussion
In this study, we gradually manipulated the strength of visuo-phonological (V-P)
associations that participants had to learn and we used this gradual V-P knowledge as a probe
to assess the parametric modulation of cerebral activities through ERP and fMRI recordings.
Three main results were obtained. First, at a behavioral level, we found that our experimental
manipulation was successful since response times and accuracies were monotonically affected
by the strength of V-P associations, both in the 2-AFC and in the naming tasks. Second,
during the acquisition of V-P associations in the 2-AFC task, we found that ERPs were also
affected by the strength of these associations in the last part of the experiment, with
significant effects emerging on right occipital sites between 200 and 345 ms post-stimulus
PHONOLOGICAL RECODING
22
onset and on left occipital sites between 300 and 345 ms. Finally, during the matching task in
the fMRI experiment, we found that five brain regions were affected by the strength of V-P
associations: the left fusiform gyrus (left vOT), the left temporal lobe (including STG), the
left supplementary motor area (left SMA), the left medial frontal gyrus, and the left and right
posterior cingulate cortices.
Behavioral results
The results from the 2-AFC and the naming tasks showed that our experimental
manipulation indeed allowed us to create four levels of V-P associations. By controlling the
number of times correct associations were presented to participants during the 2-AFC task, we
were able to create arbitrary V-P associations varying gradually in their strength. In the 2-
AFC and naming tasks, this graded effect appeared both on RTs and accuracies, and it was
present from the first part of the experiment until the last experimental session, on Day 2.
Overall, performance in the four experimental conditions increased progressively during the
experiment but never reached the performance obtained on Roman letters. Although accuracy
on Day 2 was almost as good in the L4 condition (i.e., the strongest V-P associations) as for
Roman letters, RTs in the naming task were still much slower for the learned associations and
were still on average greater than 1 second. This indicates that participants would likely need
more training in order to reach the same level of performance as obtained for over-learned
associations like familiar letters. Crucially, however, the fact that graded performance was
obtained as a function of V-P association strength indicates that our manipulation was
successful and can therefore be used as a probe for tracking the time-course of phonological
recoding in ERPs and the underlying neural generators revealed in the MRI signal.
ERPs results
ERPs were recorded during the 2-AFC task and we found a significant linear
relationship between ERPs and the strength of V-P associations during the last part of the
PHONOLOGICAL RECODING
23
experiment. This linear effect emerged on right occipital sites around 200 ms post-stimulus
onset and on left occipital sites around 300 ms. This finding is consistent with previous
studies on letter perception indicating that phonological recoding starts on average around 220
ms post-stimulus onset and lasts until response selection at around 300 ms (Petit et al., 2006;
Madec et al., 2012; Madec et al., submitted).
One can note, however, that the onset of the linear effect appears on right occipital
sites at around 200 ms (occurring slightly later than the N170 component, see Figure 3b).
Since we applied a Laplacian filter on the data, which improved spatial resolution for the
collected ERPs (e.g., Nunez & Srinivasan, 2006; Cohen, 2014), the generators of this linear
effect are likely localized in the right hemisphere. This right lateralization does not seem
consistent with a straightforward interpretation related to phonological recoding, given that
structures supporting phonological processing have been previously localized in the left
hemisphere (e.g., Vigneau et al., 2006).
Interestingly, this result can be related to ERPs studies reporting lateralization of the
N170 component depending on reading expertise (i.e., Maurer, Brem, Buscher, & Brandeis,
2005; Yum, Holcomb, & Grainger, 2011). For example, Maurer et al. (2005) found a right
occipito-temporal N170 component differing between words and symbol strings, but only for
children with a high knowledge about letters. On the contrary, Yum et al. (2011) reported that
the same contrast on adult participants revealed a N170 effect localized on left occipito-
temporal sites. The right lateralized effect in children was interpreted as a precursor of literacy
linked to visual familiarity with print. This right lateralization of the N170 effect would then
be present at the early stages of the acquisition of V-P associations and would reflect a
predominance of visual processing. The left lateralization would come later during learning
and would be associated with the maturation and stabilization of phonological recoding.
Moreover, in pre-literate children, the N170 has been proposed as a potential biomarker that
PHONOLOGICAL RECODING
24
could predict later reading ability, with a positive correlation between the N170 amplitude
over the right hemisphere at preschool age and the number of words read two years later
(Brem et al., 2013).
In a later study, Maurer, Blau, Yoncheva, and McCandliss (2010) trained adult
participants to associate symbol-word pairs (i.e., ortho-phonological associations) and
compared ERPs pre- and post-training in the context of a one-back task. They observed a pre-
/post-training difference on the N170 emerging solely on right occipital sites that was
interpreted in terms of visual familiarity with the novel learned symbols. The combination of
the one-back task, which does not necessarily require phonological recoding, along with the
short training duration could indeed limit the access to phonological representations and
enhance visual processing.
In two other studies (Yoncheva, Blau, Maurer, & McCandliss, 2010; Yoncheva, Wise,
& McCandliss, 2015), adults had to learn new visual symbols and their names in the context
of a reading verification task (by matching these visual symbols to their auditory
representations, which requires greater phonological recoding than a one-back task). These
studies reported that the laterality of the N170 effect depended on learning instructions.
Participants who had to associate holistically these symbols to phonological representations
(as in a logographic language, see Mei et al., 2013) displayed a larger N170 component on
right occipital sites, while participants who had to associate parts of these symbols to
phonemes (like grapheme-to-phoneme associations in alphabetic languages, see also Mei et
al., 2013) displayed a larger N170 component on left occipital sites. These results suggest
greater recruitment of left-lateralized networks would occur when processing is directed
toward grapheme-to-phoneme mapping.
Similarly, Stevens, McIlraith, Rusk, Niermeyer, and Waller (2013) tested participants
in a one-back task with letters and pseudo-letters. They found a larger N170 in the left
PHONOLOGICAL RECODING
25
hemisphere for letters (relative to pseudo-letters) when participants tended to retrieve letter
names and a larger N170 in the right hemisphere when participants tended to perform the one-
back task on a visual basis. This result suggests that lateralization of the N170 for single
letters varied according to the degree of phonological retrieval.
Taken together, these variations in the lateralization of the N170 could account for the
right hemisphere localization of the present linear effect of V-P associations. Indeed, instead
of considering that the effect starting around 200 ms is directly due to the strengths of V-P
associations, the right lateralization of this effect could be interpreted as a side effect of
phonological recoding. Because phonological recoding is still weak for some of these
associations, participants would have to allocate more resources to visual processing in order
to compensate for the weaker V-P associations. The fact that mean naming times were twice
as long for Katakana symbols relative to Roman letters also indicates that phonological
recoding was not yet automatized.
Our results thereby complement the findings of Maurer et al. (2010) and Yoncheva et
al. (2010; 2015). Consistent with Maurer et al. (2010), we found differential activities on right
occipital sites after learning to associate visual symbols to their names. In line with Yoncheva
et al. (2010; 2015), this right hemisphere activity could be interpreted as a by-product of weak
V-P associations that would lead to greater visual processing. The later linear effect obtained
around 300-330 ms on left occipital sites would more likely reflect phonological recoding
processes that would be delayed in time relative to overlearned symbols such as Roman
letters.
fMRI results
In the fMRI experiment, the main result concerns the activation of the left fusiform
region that varied linearly with the strength of V-P associations (see Figure 5). Its location, in
left vOT at MNI coordinates (-33, -42, -18) is slightly more medial than the reported locations
PHONOLOGICAL RECODING
26
of the VWFA (e.g., Cohen et al., 2002) but is consistent with the results of several fMRI
studies on isolated letters (e.g., James & Gauthier, 2006; Rothlein & Rapp, 2014)1. This
observed sensitivity to the strength of V-P associations suggests that this area is not only
affected by purely visual factors but also by higher-level representations involving phonology
(Price & Devlin, 2011; see also Carreiras et al., 2014). This result is also consistent with
several other studies reporting an effect of phonological processing on activity in the left
fusiform gyrus (e.g., Pugh et al., 1996; Hagoort et al., 1999; Paulesu et al., 2000; Levy et al.,
2008). It indicates that activity within the left fusiform gyrus could benefit from top-down
influences coming from regions involving phonological representations (Price & Devlin,
2011).
Note that this particular pattern of BOLD responses that increase with the strength of
V-P associations might be enhanced by the matching task used in the present experiment.
Indeed, Mano et al. (2013) recently showed that left vOT responses associated to words and
pseudowords, as compared to consonants strings, were enhanced, but only in the context of an
overt naming task and not in a nonlinguistic visual task (for a similar account on single letters,
see also Flowers et al., 2004). These task dependent variations might explain previous
inconsistent findings obtained in studies using a similar experimental learning paradigm (i.e.,
Callan et al., 2006; Hashimoto & Sakai, 2004). Indeed, while Callan et al. (2006) did not find
any difference on left vOT when employing a 2-back task, Hashimoto and Sakai (2004), by
asking participants to perform an audiovisual matching task, found an effect on left vOT.
1 One can note that the coordinates of the region in left vOT varying with the strength of V-P association are more medial than coordinates of the location reported in Hashimoto and Sakai (2004), who showed that learning affected the left posterior inferior temporal gyrus (left PITG) at coordinates (-54, -51, -18) that was dissociated from an area insensitive to learning at coordinates (-36, -42, -24). The authors interpreted this dissociation as reflecting differential functional roles between these regions, with activity in left PITG reflecting the integration of newly learned visual and phonological associations, while activity in the other region reflecting the processing of already acquired associations. The discrepancy with our results could be inherent to our manipulation of V-P associations that could recruit regions involved both in new and already acquired associations.

PHONOLOGICAL RECODING
27
Therefore, tasks involving greater phonological processing could induce stronger modulations
of left vOT activity.
Computation of phonological information is also considered to rely on temporal
regions that were significantly activated in the present study (e.g., Simos et al., 2002), with a
linear effect observed in a cluster of large size (69 voxels) encompassing STG at MNI
coordinates (-54, -30, 18). The STG, located in the left posterior superior temporal area
(mainly Wernicke area), has been associated with an increase of activity when a task requires
phonological processing, in the presence (Moore & Price, 1999) and absence of orthographic
stimuli (Demonet et al., 1992; Demonet, Price, Wise, & Frackowiak, 1994). It has been shown
that STG is more responsive to orthographic stimuli than objects, with an enhanced activity
when the orthographic stimuli had to be read aloud (Moore & Price, 1999). Moreover,
Graves, Grabowski, Mehta, and Gupta (2008) suggested that STG was implicated in accessing
lexical phonology. Therefore, the linear effect observed in this cluster likely reflects a form of
phonological recoding of visual stimuli.
However, we did not find any evidence for a linear effect on SMG, despite the fact
that this structure has been reported as showing an increasing activity during the acquisition
of new languages (Cornelissen et al., 2004; Breitenstein et al., 2005) and an increase of its
white matter when learning novel speech sounds (Golestani, Paus, & Zatorre, 2007). This
absence of activity related to SMG is probably due to the difference in time-scale between
these studies and the present one. In the present work, the acquisition of V-P associations was
achieved in a short time-window (i.e., less than a day) while language acquisition usually
takes place over much longer periods of time.
Activation of Cluster 3, peaking within SMA at coordinate (-6, -9, 54) was
unexpected, mainly because the present fMRI task did not require overt production of the
displayed visual symbols. However, meta-analyses (Indefrey & Level, 2004; see also
PHONOLOGICAL RECODING
28
Indefrey, 2011) indicate that SMA is active both in covert and overt word-reading tasks.
Although its specific role in covert reading is not totally clear, Carreiras, Mechelli and Price
(2006) showed that low-frequency words induced more activity in left SMA than high
frequency words in a lexical decision task, and interpreted this effect as reflecting greater
demands on phonological processing. Therefore, because participants in the present study had
to actively maintain visual symbols in short-term memory until the presentation of the target,
it is very likely that participants relied on phonological recoding and on some form of covert
articulation. Results from the working memory literature also suggest that inner
phonological/articulatory rehearsal increases activity of left SMA (Jonides et al., 1997).
Therefore, the observed activity of left SMA in the present study likely reflects a form of
inner speech (or the involvement of the phonological loop) allowing participants to actively
maintain in working memory previously encountered visual symbols during a trial.
It is also interesting to note that we did not find any differential activity in the pars
orpercularis of IFG, which has been reported multiple times in studies involving phonological
recoding (e.g., Woodhead et al., 2014; Cai et al., 2010) and which seems to be also involved
in encoding articulatory information (Klein et al., 2014). However, because participants only
had to read aloud every visual symbol 7 times, this might not be sufficient enough to develop
distinct articulatory representations corresponding to our four levels of phonological recoding.
This could explain why we did not find a linear effect in the pars orpercularis of IFG.
Two unexpected brain regions were also active in the present experiment: the left
medial frontal gyrus and the left and right posterior cingulate cortices. Previous studies have
not particularly linked these regions to phonological processing or to variations in V-P
associations. Their activation is therefore more likely related to the paradigm used in the
fMRI experiment. Indeed, this task can be considered as a typical working memory task that
requires maintaining and processing a sequence of stimuli. Variations in the strength of V-P
PHONOLOGICAL RECODING
29
associations may therefore be related to variations in working memory load affecting the left
medial frontal gyrus (e.g., O’Hare, Lu, Houston, Bookheimer, & Sowell, 2008). Similarly, it
has been suggested that the posterior cingulate cortex and a medial frontal region
incorporating portions of the medial frontal gyrus and ventral anterior cingulate cortex are
components in a default mode network that is engaged during rest and disengaged during
cognitive tasks (e.g., Hampson, Driesen, Skudlarski, Gore, & Constable, 2006). In the present
situation, engagement of these regions could be associated with variations in processing V-P
associations.
Finally, we found an effect of the strength of V-P associations mainly located in
the left hemisphere in the fMRI study, while this effect appeared in the ERP study on right
occipital sites between 200 and 345 ms, and on left occipital sites between 300 and 345 ms.
Two lines of arguments may account for this apparent inconsistency. First, discrepancies
between ERP and fMRI results are frequently reported and attributed to the specific
sensitivity of each brain imaging methodology. Due to the different nature and time-scales of
the recorded signals in fMRI and ERPs, the two methods do not necessarily converge
(Vitacco, Brandeis, Pascual-Marqui, & Martin, 2002). While the ERP method is efficient in
detecting rapid, transient and synchronous activities requiring small metabolic demands
(Furey et al., 2006), fMRI is efficient in detecting sustained activities (Vitacco et al., 2002).
Therefore, it has been suggested that fMRI might not be sensitive enough to detect transient
activities (e.g., the N170 component, see Brem et al., 2009). Second, there are important
differences in the experimental procedures used in the ERP and fMRI studies. For example,
the fMRI experiment was a working memory task requiring participants to memorize series of
five Katakana symbols that were presented for short durations (i.e., 200 ms per item;
see Figure 2c) and that were separated by a blank screen for 2000 ms. These experimental
parameters were chosen intentionally to force participants to recode phonologically the
PHONOLOGICAL RECODING
30
Katakana symbols. This might explain why we observed a clearer pattern of activity mainly
located in the left hemisphere in the fMRI experiment.
To conclude, the present set of results is consistent with Price and Devlin’s (2011)
interactive account, according to which left vOT is a brain region in which visual
representations and higher-level representations (i.e., phonological representations in the
present study) are integrated in the processing of visual symbols. Because STG has been
previously linked to phonological recoding and is also sensitive to our present manipulation of
V-P associations, it is likely that phonological recoding occurs within this region and
subsequently affects activity in left vOT through top-down influences.

PHONOLOGICAL RECODING
31
Acknowledgements
This study was funded by the European Research Council (ERC Advanced Grant
230313) and carried out within the Labex BLRI (ANR-11-LABX-0036). It has benefited from
support from the French government, managed by the French National Agency for Research
(ANR), under the project title Investments of the Future A*MIDEX (ANR-11-IDEX-0001-
02).
PHONOLOGICAL RECODING
32
References
Aboitiz, F., Aboitiz, S., & Garcìa, R. R. (2010). The phonological loop: A key innovation in
human evolution. Current Anthropology, 51, S55-S65.
Ben-Shachar, M., Dougherty, R. F., & Wandell, B. A. (2007). White matter pathways in
reading. Current Opinion in Neurobiology, 17(2), 258–270.
Ben-Shachar, M., Dougherty, R. F., Deutsch, G. K., & Wandell, B. A. (2011). The
development of cortical sensitivity to visual word forms. Journal of Cognitive
Neuroscience, 23(9), 2387-2399.
Bolger, D. J., Perfetti, C. A., & Schneider, W. (2005). Cross‐cultural effect on the brain
revisited: Universal structures plus writing system variation. Human Brain Mapping,
25(1), 92-104.
Breitenstein, C., Jansen, A., Deppe, M., Foerster, A.-F., Sommer, J., Wolbers, T., & Knecht,
S. (2005). Hippocampus activity differentiates good from poor learners of a novel
lexicon. Neuroimage, 25(3), 958–968.
Brem, S. Bach, S. Kujala, J. V., Maurer, U., Lyytinen, H., Richardson, U., Brandeis, D.
(2013). An Electrophysiological Study of Print Processing in Kindergarten: The
Contribution of the Visual N1 as a Predictor of Reading Outcome. Developmental
Neuropsychology, 38(8), 567-594.
Cai, Q., Paulignan, Y., Brysbaert, M., Ibarrola, D., & Nazir, T. A. (2010). The left ventral
occipito-temporal response to words depends on language lateralization but not on
visual familiarity. Cerebral Cortex, 20(5), 1153–1163.
Callan, A. M., Callan, D. E., & Masaki, S. (2005). When meaningless symbols become
letters: neural activity change in learning new phonograms. Neuroimage, 28(3), 553–
562.
Carreiras, M., Armstrong, B. C., Perea, M., & Frost, R. (2014). The what, when, where, and
PHONOLOGICAL RECODING
33
how of visual word recognition. Trends in Cognitive Sciences, 18(2), 90–98.
Carreiras, M., Perea, M., Gil-López, C., Mallouh, R. A., & Salillas, E. (2013). Neural
Correlates of Visual versus Abstract Letter Processing in Roman and Arabic Scripts.
Journal of Cognitive Neuroscience, 25(11), 1975-1985.
Carreiras, M., Mechelli, A., & Price, C. J. (2006). Effect of word and syllable frequency on
activation during lexical decision and reading aloud. Human Brain Mapping, 27(12),
963-972.
Church, J. A., Balota, D. A., Petersen, S. E., & Schlaggar, B. L. (2011). Manipulation of
Length and Lexicality Localizes the Functional Neuroanatomy of Phonological
Processing in Adult Readers. Journal of Cognitive Neuroscience, 23(6), 1475–1493.
Cohen, L., Dehaene, S., Naccache, L., Lehéricy, S., Dehaene-Lambertz, G., Hénaff, M. A., &
Michel, F. (2000). The visual word form area Spatial and temporal characterization of
an initial stage of reading in normal subjects and posterior split-brain patients. Brain,
123(2), 291-307.
Cohen, L., Lehericy, S., Chochon, F., Lemer, C., Rivaud, S., & Dehaene, S. (2002).
Language- specific tuning of visual cortex? Functional properties of the visual word
form area. Brain, 125, 1054–1069.
Cohen, M. X. (2014). Analyzing neural time series data: theory and practice. MIT Press.
Cornelissen, K., Laine, M., Renvall, K., Saarinen, T., Martin, N., & Salmelin, R. (2004).
Learning new names for new objects: Cortical effects as measured by
magnetoencephalography. Brain and Language, 89(3), 617–622.
Dehaene, S., & Cohen, L. (2011). The unique role of the visual word form area in reading.
Trends in Cognitive Sciences, 15(6), 254-262.
Dehaene, S., Cohen, L., Sigman, M., & Vinckier, F. (2005). The neural code for written
words: a proposal. Trends in Cognitive Sciences, 9(7), 335-341.
PHONOLOGICAL RECODING
34
Dehaene, S., Le Clec'H, G., Poline, J. B., Le Bihan, D., & Cohen, L. (2002). The visual word
form area: a prelexical representation of visual words in the fusiform gyrus.
Neuroreport, 13(3), 321-325.
Dehaene, S., Naccache, L., Cohen, L., Le Bihan, D., Mangin, J. F., Poline, J. B., & Rivière, D.
(2001). Cerebral mechanisms of word masking and unconscious repetition priming.
Nature Neuroscience, 4(7), 752-758.
Delorme, A., & Makeig, S. (2004). EEGLAB: an open source toolbox for analysis of single-
trial EEG dynamics including independent component analysis. Journal of
Neuroscience Methods, 134(1), 9-21.
Delorme, A., Sejnowski, T., & Makeig, S. (2007). Enhanced detection of artifacts in EEG
data using higher-order statistics and independent component analysis. Neuroimage,
34(4), 1443-1449.
Demonet, J. F., Chollet, F., Ramsay, S., Cardebat, D., Nespoulous, J. L., Wise, R., Rascol, A.,
& Frackowiak, R. (1992). The anatomy of phonological and semantic processing in
normal subjects. Brain, 115(6), 1753-1768.
Demonet, J. F., Price, C., Wise, R., & Frackowiak, R. S. J. (1994). Differential activation of
right and left posterior sylvian regions by semantic and phonological tasks: a positron-
emission tomography study in normal human subjects. Neuroscience Letters, 182(1),
25-28.
Flowers, D. L., Jones, K., Noble, K., VanMeter, J., Zeffiro, T. A., Wood, F. B., & Eden, G. F.
(2004). Attention to single letters activates left extrastriate cortex. Neuroimage, 21(3),
829–839.
Foulin, J.-N. (2005). Why is letter-name knowledge such a good predictor of learning to read?
Reading and Writing,18(2), 129-155.
Garrett, A. S., Flowers, D. L., Absher, J. R., Fahey, F. H., Gage, H. D., Keyes, J. W., Porrino,
PHONOLOGICAL RECODING
35
L. J., et al. (2000). Cortical activity related to accuracy of letter recognition.
Neuroimage, 11(2), 111–123.
Gitelman, D. R., Nobre, A. C., Sonty, S., Parrish, T. B., & Mesulam, M.-M. (2005). Language
network specializations: An analysis with parallel task designs and functional magnetic
resonance imaging. Neuroimage, 26(4), 975–985.
Golestani, N., Paus, T., & Zatorre, R. J. (2002). Anatomical correlates of learning novel
speech sounds. Neuron, 35(5), 997-1010.
Grainger, J. Kiyonaga, K., & Holcomb, P.J. (2006). The time-course of orthographic and
phonological code activation. Psychological Science, 17, 1021-1026.
Grainger, J., Rey, A., & Dufau, S. (2008). Letter perception: from pixels to pandemonium.
Trends in Cognitive Sciences, 12(10), 381–387.
Graves, W. W., Grabowski, T. J., Mehta, S., & Gupta, P. (2008). The left posterior superior
temporal gyrus participates specifically in accessing lexical phonology. Journal of
Cognitive Neuroscience, 20(9), 1698–1710.
Grill-Spector, K., & Malach, R. (2004). The human visual cortex. Annual Review of
Neuroscience, 27, 649–677.
Hagoort, P., Indefrey, P., Brown, C., Herzog, H., Steinmetz, H., & Seitz, R. (1999). The
neural circuitry involved in the reading of German words and pseudowords: a PET
study. Journal of Cognitive Neuroscience, 11(4), 383-398.
Hampson, M., Driesen, N. R., Skudlarski, P., Gore, J. C., & Constable, R. T. (2006). Brain
connectivity related to working memory performance. The Journal of Neuroscience,
26(51), 13338-13343.
Hashimoto, R., & Sakai, K. (2004). Learning letters in adulthood: Direct visualization of
cortical plasticity for forming a new link between orthography and phonology. Neuron,
42(2), 311–322.
PHONOLOGICAL RECODING
36
Indefrey, P. (2011) The spatial and temporal signatures of word production components: A
critical update. Frontiers in Psychology, 2:255. doi:10.3389/fpsyg.2011.00255.
Indefrey, P., & Levelt, W. J. (2004). The spatial and temporal signatures of word production
components. Cognition, 92(1), 101-144.
James, K. H., & Gauthier, I. (2006). Letter processing automatically recruits a sensory–motor
brain network. Neuropsychologia, 44(14), 2937–2949.
Jobard, G., Crivello, F., & Tzourio-Mazoyer, N. (2003). Evaluation of the dual route theory of
reading: a metanalysis of 35 neuroimaging studies. Neuroimage, 20(2), 693–712.
Jonides, J., Schumacher, E., Smith, E., Lauber, E., Awh, E., Minoshima, S., & Koeppe, R.
(1997). Verbal working memory load affects regional brain activation as measured by
PET. Journal of Cognitive Neuroscience, 9(4), 462-475.
Joseph, J. E., Cerullo, M. A., Farley, A. B., Steinmetz, N. A., & Mier, C. R. (2006). fMRI
correlates of cortical specialization and generalization for letter processing.
Neuroimage, 32(2), 806-820.
Joseph, J. E., Gathers, A. D., & Piper, G. A. (2003). Shared and dissociated cortical regions
for object and letter processing. Cognitive Brain Research, 17(1), 56-67.
Kherif, F., Josse, G., & Price, C. J. (2011). Automatic top-down processing explains common
left occipito-temporal responses to visual words and objects. Cerebral Cortex, 21(1),
103–114.
Klein, M., Grainger, J., Wheat, K. L., Millman, R. E., Simpson, M. I. G., Hansen, P. C., &
Cornelissen, P. L. (2015). Early activity in Broca’s Area during reading reflects fast
access to articulatory codes from print. Cerebral Cortex. doi.org/10.1093/cercor/bht350
Levy, J., Pernet, C., Treserras, S., Boulanouar, K., Berry, I., Aubry, F., Demoulins, T., &
Celsis, P. (2008). Piecemeal recruitment of left-lateralized brain areas during reading: A
spatio-functional account. Neuroimage, 43(3), 581–591.
PHONOLOGICAL RECODING
37
Liu, C., Zhang, W. T., Tang, Y. Y., Mai, X. Q., Chen, H. C., Tardif, T., & Luo, Y. J. (2008).
The visual word form area: evidence from an fMRI study of implicit processing of
Chinese characters. Neuroimage, 40(3), 1350-1361.
Li, X., Zhou, P., & Aruin, A. S. (2007). Teager–Kaiser energy operation of surface EMG
improves muscle activity onset detection. Annals of Biomedical Engineering, 35(9),
1532-1538.
Logothetis, N. K., & Sheinberg, D. L. (1996). Visual object recognition. Annual review of
neuroscience, 19(1), 577-621.
Madec, S., Rey, A., Dufau, S., Klein, M., & Grainger, J. (2012). The time course of visual
letter perception. Journal of Cognitive Neuroscience, 24(7), 1645-1655.
Mainy, N., Jung, J., Baciu, M., Kahane, P., Schoendorff, B., Minotti, L., Hoffmann, D.,
Bertrand, O., & Lachaux, J.P. (2008). Cortical dynamics of word recognition. Human
Brain Mapping, 29(11), 1215–1230.
Makeig, S., Bell, A. J., Jung, T. P., & Sejnowski, T. J. (1996). Independent component
analysis of electroencephalographic data. Advances in Neural Information Processing
Systems, 145-151.
Mano, Q. R., Humphries, C., Desai, R. H., Seidenberg, M. S., Osmon, D. C., Stengel, B. C.,
& Binder, J. R. (2013). The role of left occipitotemporal cortex in reading: reconciling
stimulus, task, and lexicality effects. Cerebral Cortex, 23(4), 988–1001.
Maris, E., & Oostenveld, R. (2007). Nonparametric statistical testing of EEG-and MEG-data.
Journal of Neuroscience Methods, 164(1), 177-190.
Maurer, U., Blau, V. C., Yoncheva, Y. N., & McCandliss, B. D. (2010). Development of
visual expertise for reading: rapid emergence of visual familiarity for an artificial script.
Developmental Neuropsychology, 35(4), 404-422.
Maurer U, Brem S, Bucher K, Brandeis D. Emerging neurophysiological specialization for
PHONOLOGICAL RECODING
38
letter strings. Journal of Cognitive Neuroscience. 2005; 17(10):1532–1552.
McCandliss, B. D., Cohen, L., & Dehaene, S. (2003). The visual word form area: expertise for
reading in the fusiform gyrus. Trends in Cognitive Sciences, 7(7), 293-299.
Mei, L., Xue, G., Lu, Z. L., He, Q., Zhang, M., Xue, F., Chen, C., & Dong, Q. (2013).
Orthographic transparency modulates the functional asymmetry in the fusiform cortex:
an artificial language training study. Brain and Language, 125(2), 165-172.
Moore, C. J., & Price, C. J. (1999). Three distinct ventral occipitotemporal regions for reading
and object naming. Neuroimage, 10(2), 181-192.
Nichols, T. E., & Holmes, A. P. (2002). Nonparametric permutation tests for functional
neuroimaging: a primer with examples. Human Brain Mapping, 15(1), 1-25.
Nunez, P. L., & Srinivasan, R. (2006). Electric fields of the brain: the neurophysics of EEG.
Oxford university press.
O’Hare, E. D., Lu, L. H., Houston, S. M., Bookheimer, S. Y., & Sowell, E. R. (2008).
Neurodevelopmental changes in verbal working memory load-dependency: An fMRI
investigation. Neuroimage, 42(4), 1678–1685.
Olulade, O. A., Flowers, D. L., Napoliello, E. M., & Eden, G. F. (2013). Developmental
differences for word processing in the ventral stream. Brain and Language, 125(2),
134–145.
Orr, J. M., & Banich, M. T. (2014). The neural mechanisms underlying internally and
externally guided task selection. Neuroimage, 84, 191-205.
Paulesu, E., McCrory, E., Fazio, F., Menoncello, L., Brunswick, N., Cappa, S. F., Cotelli M.,
Cossu G., Corte F., Lorusso M., Pesenti S., Gallagher A., Perani D., Price C., Frith
C.D., Frith U. (2000). A cultural effect on brain function. Nature Neuroscience, 3(1),
91-96.
Pedregosa, F., Varoquaux, G., Gramfort, A., Michel, V., Thirion, B., Grisel, O., Blondel, M.,
PHONOLOGICAL RECODING
39
Prettenhofer, P., Weiss, R., Dubourg, V., Vanderplas, J., Passos, A., Cournapeau, D.,
Brucher, M., Perrot, M., & Duchesnay, E. (2011). Scikit-learn: Machine learning in
Python. Journal of Machine Learning Research, 12, 2825–2830.
Pegado, F., Nakamura, K., Cohen, L., & Dehaene, S. (2011). Breaking the symmetry: mirror
discrimination for single letters but not for pictures in the Visual Word Form Area.
Neuroimage, 55(2), 742-749.
Perrin, F., Pernier, J., Bertrand, O., & Echallier, J. F. (1989). Spherical splines for scalp
potential and current density mapping. Electroencephalography and clinical
Neurophysiology, 72(2), 184-187.
Pernet, C., Celsis, P., & Demonet, J.-F. (2005). Selective response to letter categorization
within the left fusiform gyrus. Neuroimage, 28(3), 738–744.
Pernet, C. R., Chauveau, N., Gaspar, C., & Rousselet, G. A. (2011). LIMO EEG: a toolbox
for hierarchical LInear MOdeling of ElectroEncephaloGraphic data. Computational
Intelligence and Neuroscience, 2011, 3.
Petit, J. P., Midgley, K. J., Holcomb, P. J., & Grainger, J. (2006). On the time course of letter
perception: A masked priming ERP investigation. Psychonomic Bulletin & Review,
13(4), 674-681.
Polk, T. A., & Farah, M. J. (1998). The neural development and organization of letter
recognition: Evidence from functional neuroimaging, computational modeling, and
behavioral studies. Proceedings of the National Academy of Sciences, 95(3), 847-852.
Polk, T. A., & Farah, M. J. (2002). Functional MRI evidence for an abstract, not perceptual,
word-form area. Journal of Experimental Psychology: General, 131(1), 65-72.
Price, C. J. (2000). The anatomy of language: contributions from functional neuroimaging.
Journal of Anatomy, 197(3), 335-359.
Price, C. J. (2013). Current themes in neuroimaging studies of reading. Brain and Language,
PHONOLOGICAL RECODING
40
125(2), 131–133.
Price, C. J., & Devlin, J. T. (2003). The myth of the visual word form area. Neuroimage,
19(3), 473–481.
Price, C. J., & Devlin, J. T. (2011). The Interactive Account of ventral occipitotemporal
contributions to reading. Trends in Cognitive Sciences, 15(6), 246–253.
Price, C. J., & Mechelli, A. (2005). Reading and reading disturbance. Current Opinion in
Neurobiology, 15(2), 231-238.
Price, C. J., Moore, C. J., Humphreys, G. W., & Wise, R. J. S. (1997). Segregating semantic
from phonological processes during reading. Journal of Cognitive Neuroscience, 9(6),
727-733.
Price, C. J., Wise, R. J., & Frackowiak, R. S. (1996): Demonstrating the implicit processing of
visually presented words and pseudowords. Cerebral Cortex, 6, 62–70.
Pugh, K. R., Shaywitz, B. A., Shaywitz, S. E., Constable, R. T., Skudlarski, P., Fulbright, R.
K., Bronen, R. A., Shankweiler, D. P., Katz, L., Fletcher, J. M., & Gore, J. C. (1996).
Cerebral organization of component processes in reading. Brain, 119(4), 1221-1238.
Rey, A., Dufau, S., Massol, S., & Grainger, J. (2009). Testing computational models of letter
perception with item-level event-related potentials. Cognitive Neuropsychology, 26(1),
7-22.
Rolls, E. T. (2000). Functions of the primate temporal lobe cortical visual areas in invariant
visual object and face recognition. Neuron, 27(2), 205-218.
Rumsey, J. M., Horwitz, B., Donohue, B. C., Nace, K., Maisog, J. M., & Andreason, P.
(1997). Phonological and orthographic components of word recognition. A PET-rCBF
study. Brain, 120(5), 739-759.
Rothlein, D., & B. Rapp (2014). The similarity structure of distributed neural responses
reveals the multiple representations of letters. Neuroimage,89, 331-344.
PHONOLOGICAL RECODING
41
Sandak, R., Mencl, W. E., Frost, S. J., Rueckl, J. G., Katz, L., Moore, D. L., Mason, S. A.,
Fulbright, R. K., Constable, T., & Pugh, K. R. (2004). The neurobiology of adaptive
learning in reading: A contrast of different training conditions. Cognitive, Affective, &
Behavioral Neuroscience, 4(1), 67-88.
Schlaggar, B. L., & McCandliss, B. D. (2007). Development of neural systems for reading.
Annual Review of Neuroscience, 30(1), 475–503.
Seghier, M. L., & Price, C. J. (2011). Explaining left lateralization for words in the ventral
occipitotemporal cortex. The Journal of Neuroscience, 31(41), 14745-14753.
Sevostianov, A., Horwitz, B., Nechaev, V., Williams, R., Fromm, S., & Braun, A. R. (2002).
fMRI study comparing names versus pictures of objects. Human brain mapping, 16(3),
168-175.
Simos, P. G., Breier, J. I., Fletcher, J. M., Foorman, B. R., Castillo, E. M., & Papanicolaou, A.
C. (2002). Brain mechanisms for reading words and pseudowords: an integrated
approach. Cerebral Cortex, 12(3), 297-305.
Simos, P. G., Rezaie, R., Fletcher, J. M., & Papanicolaou, A. C. (2013). Time- constrained
functional connectivity analysis of cortical networks underlying phonological decoding
in typically developing school-aged children: A magnetoencephalography study. Brain
& Language, 125(2), 156–164.
Smith, S. M., & Nichols, T. E. (2009). Threshold-free cluster enhancement: addressing
problems of smoothing, threshold dependence and localisation in cluster inference.
Neuroimage, 44(1), 83-98.
Song, Y., Tian, M., & Liu, J. (2012). Top-down processing of symbolic meanings modulates
the visual word form area. The Journal of Neuroscience, 32(35), 12277-12283.
Stoeckel, C., Gough, P. M., Watkins, K. E., & Devlin, J. T. (2009). Supramarginal gyrus
involvement in visual word recognition. Cortex, 45(9), 1091–1096.
PHONOLOGICAL RECODING
42
Tarkiainen, A., Cornelissen, P. L., & Salmelin, R. (2002). Dynamics of visual feature analysis
and object‐level processing in face versus letter‐string perception. Brain, 125(5), 1125-
1136.
Tarkiainen, A., Helenius, P., Hansen, P. C., Cornelissen, P. L., & Salmelin, R. (1999).
Dynamics of letter string perception in the human occipitotemporal cortex. Brain,
122(11), 2119-2132.
Treiman, R., & Kessler, B. (2004). The role of letter names in the acquisition of literacy.
Advances in child development and behavior, 31, 105-135.
Turkeltaub, P. E., Eden, G. F., Jones, K. M., & Zeffiro, T. A. (2002). Meta-Analysis of the
Functional neuroanatomy of single-word reading: method and validation. Neuroimage,
16(3), 765–780.
Twomey, T., Duncan, K. J. K., Price, C. J., & Devlin, J. T. (2011). Top-down modulation of
ventral occipito-temporal responses during visual word recognition. Neuroimage, 55(3),
1242–1251.
Vandermosten, M., Boets, B., Wouters, J., & Ghesquière, P. (2012). A qualitative and
quantitative review of diffusion tensor imaging studies in reading and dyslexia.
Neuroscience and Biobehavioral Reviews, 36(6), 1532–1552.
Van Essen, D. C., Glasser, M. F., Dierker, D. L., Harwell, J., & Coalson, T. (2012).
Parcellations and hemispheric asymmetries of human cerebral cortex analyzed on
surface-based atlases. Cerebral Cortex, 22(10), 2241-2262.
Vigneau, M., Beaucousin, V., Hervé, P. Y., Duffau, H., Crivello, F., Houdé, O., Mazoyer, B.,
Tzourio-Marzoyer, N. (2006). Meta-analyzing left hemisphere language areas:
phonology, semantics, and sentence processing. Neuroimage, 30(4), 1414–1432.
Vogel, A. C., Petersen, S. E., & Schlaggar, B. L. (2012). The left occipitotemporal cortex
does not show preferential activity for words. Cerebral Cortex, 22(12), 2715–2732.
PHONOLOGICAL RECODING
43
Wilcox, R. (2011). Modern statistics for the social and behavioral sciences: A practical
introduction. CRC press.
Wilson, L. B., Tregellas, J. R., Slason, E., Pasko, B. E., & Rojas, D. C. (2011). Implicit
phonological priming during visual word recognition. Neuroimage, 55(2), 724–731.
Wong, A. C., Gauthier, I., Woroch, B., Debuse, C., & Curran, T. (2005). An early
electrophysiological response associated with expertise in letter perception. Cognitive,
Affective, & Behavioral Neuroscience, 5(3), 306-318.
Wong, A. C. N., Jobard, G., James, K. H., James, T. W., & Gauthier, I. (2009). Expertise with
characters in alphabetic and nonalphabetic writing systems engage overlapping
occipito-temporal areas. Cognitive Neuropsychology, 26(1), 111–127.
Woodhead, Z. V. J., Barnes, G. R., Penny, W., Moran, R., Teki, S., Price, C. J., & Leff, A. P.
(2014). Reading front to back: MEG evidence for early feedback effects during word
recognition. Cerebral Cortex, 24(3), 817–825.
Woodhead, Z. V., Brownsett, S. L., Dhanjal, N. S., Beckmann, C., & Wise, R. J. (2011). The
visual word form system in context. The Journal of Neuroscience, 31(1), 193-199.
Woodhead, Z. V. J., Penny, W., Barnes, G. R., Crewes, H., Wise, R. J. S., Price, C. J., & Leff,
A. P. (2013). Reading therapy strengthens top-down connectivity in patients with pure
alexia. Brain, 136(8), 2579–2591.
Wright, N. D., Mechelli, A., Noppeney, U., Veltman, D. J., Rombouts, S. A. R. B., Glensman,
J., Haynes, J. D., & Price, C. J. (2008). Selective activation around the left occipito-
temporal sulcus for words relative to pictures: Individual variability or false positives?
Human Brain Mapping, 29(8), 986–1000.
Xue, G., Chen, C., Jin, Z., & Dong, Q. (2006). Language experience shapes fusiform
activation when processing a logographic artificial language: An fMRI training study.
Neuroimage, 31(3), 1315–1326.
PHONOLOGICAL RECODING
44
Yeatman, J. D., Rauschecker, A. M., & Wandell, B. A. (2013). Anatomy of the visual word
form area: Adjacent cortical circuits and long-range white matter connections. Brain
and Language, 125(2), 146–155.
Yeatman, J. D., Weiner, K. S., Pestilli, F., Rokem, A., Mezer, A., & Wandell, B. A. (2014).
The vertical occipital fasciculus: A century of controversy resolved by in vivo
measurements. Proceedings of the National Academy of Sciences, 111, 5214–5223.
Yoncheva, Y. N., Blau, V. C., Maurer, U., & McCandliss, B. D. (2010). Attentional focus
during learning impacts N170 ERP responses to an artificial script. Developmental
Neuropsychology, 35(4), 423-445.
Yum, Y.N., Holcomb, P.J., & Grainger, J. (2011). Words and pictures: An
electrophysiological investigation of domain specific processing in native Chinese and
English speakers. Neuropsychologia, 49, 1910-1922.
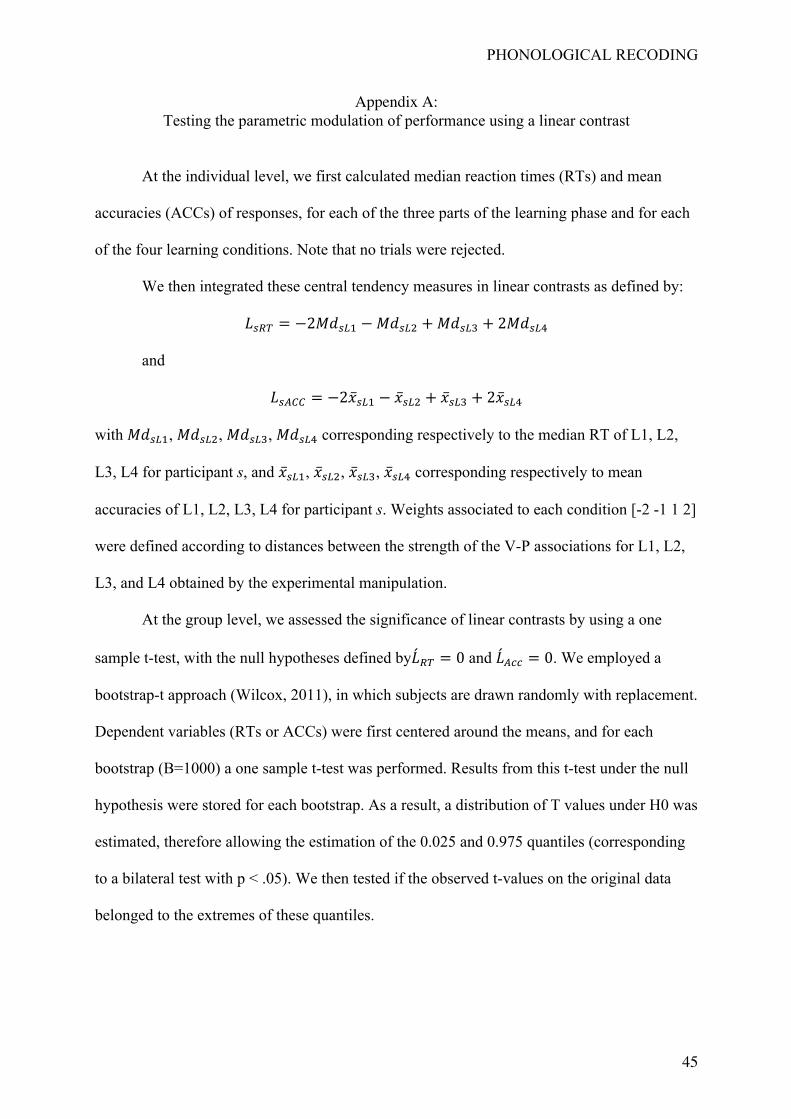
PHONOLOGICAL RECODING
45
Appendix A: Testing the parametric modulation of performance using a linear contrast
At the individual level, we first calculated median reaction times (RTs) and mean
accuracies (ACCs) of responses, for each of the three parts of the learning phase and for each
of the four learning conditions. Note that no trials were rejected.
We then integrated these central tendency measures in linear contrasts as defined by:
𝐿&$' = −2𝑀𝑑&-. − 𝑀𝑑&-/ + 𝑀𝑑&-1 + 2𝑀𝑑&-2
and
𝐿&344 = −2�̅�&-. − �̅�&-/ + �̅�&-1 + 2�̅�&-2
with 𝑀𝑑&-., 𝑀𝑑&-/, 𝑀𝑑&-1, 𝑀𝑑&-2 corresponding respectively to the median RT of L1, L2,
L3, L4 for participant s, and �̅�&-., �̅�&-/, �̅�&-1, �̅�&-2 corresponding respectively to mean
accuracies of L1, L2, L3, L4 for participant s. Weights associated to each condition [-2 -1 1 2]
were defined according to distances between the strength of the V-P associations for L1, L2,
L3, and L4 obtained by the experimental manipulation.
At the group level, we assessed the significance of linear contrasts by using a one
sample t-test, with the null hypotheses defined by�́�$' = 0 and �́�388 = 0. We employed a
bootstrap-t approach (Wilcox, 2011), in which subjects are drawn randomly with replacement.
Dependent variables (RTs or ACCs) were first centered around the means, and for each
bootstrap (B=1000) a one sample t-test was performed. Results from this t-test under the null
hypothesis were stored for each bootstrap. As a result, a distribution of T values under H0 was
estimated, therefore allowing the estimation of the 0.025 and 0.975 quantiles (corresponding
to a bilateral test with p < .05). We then tested if the observed t-values on the original data
belonged to the extremes of these quantiles.
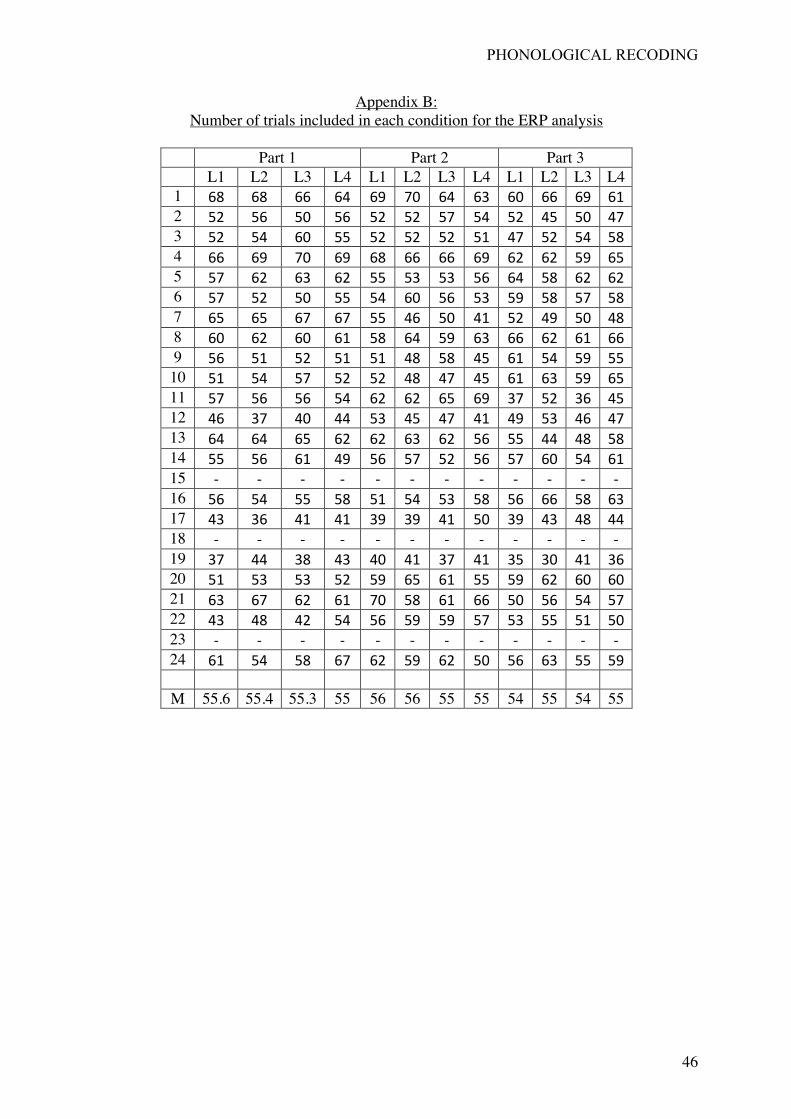
PHONOLOGICAL RECODING
46
Appendix B: Number of trials included in each condition for the ERP analysis
Part 1 Part 2 Part 3 L1 L2 L3 L4 L1 L2 L3 L4 L1 L2 L3 L4
1 68 68 66 64 69 70 64 63 60 66 69 61 2 52 56 50 56 52 52 57 54 52 45 50 47 3 52 54 60 55 52 52 52 51 47 52 54 58 4 66 69 70 69 68 66 66 69 62 62 59 65 5 57 62 63 62 55 53 53 56 64 58 62 62 6 57 52 50 55 54 60 56 53 59 58 57 58 7 65 65 67 67 55 46 50 41 52 49 50 48 8 60 62 60 61 58 64 59 63 66 62 61 66 9 56 51 52 51 51 48 58 45 61 54 59 55 10 51 54 57 52 52 48 47 45 61 63 59 65 11 57 56 56 54 62 62 65 69 37 52 36 45 12 46 37 40 44 53 45 47 41 49 53 46 47 13 64 64 65 62 62 63 62 56 55 44 48 58 14 55 56 61 49 56 57 52 56 57 60 54 61 15 - - - - - - - - - - - - 16 56 54 55 58 51 54 53 58 56 66 58 63 17 43 36 41 41 39 39 41 50 39 43 48 44 18 - - - - - - - - - - - - 19 37 44 38 43 40 41 37 41 35 30 41 36 20 51 53 53 52 59 65 61 55 59 62 60 60 21 63 67 62 61 70 58 61 66 50 56 54 57 22 43 48 42 54 56 59 59 57 53 55 51 50 23 - - - - - - - - - - - - 24 61 54 58 67 62 59 62 50 56 63 55 59
M 55.6 55.4 55.3 55 56 56 55 55 54 55 54 55
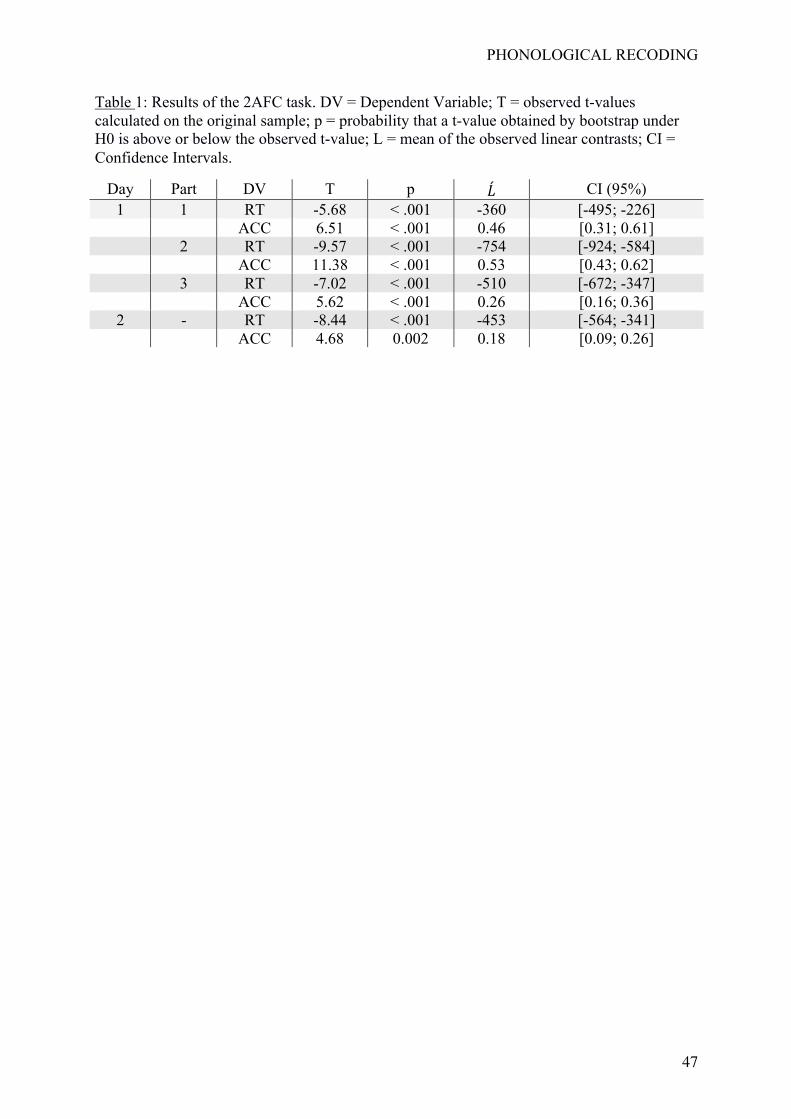
PHONOLOGICAL RECODING
47
Table 1: Results of the 2AFC task. DV = Dependent Variable; T = observed t-values calculated on the original sample; p = probability that a t-value obtained by bootstrap under H0 is above or below the observed t-value; L = mean of the observed linear contrasts; CI = Confidence Intervals.
Day Part DV T p �́� CI (95%) 1 1 RT -5.68 < .001 -360 [-495; -226] ACC 6.51 < .001 0.46 [0.31; 0.61] 2 RT -9.57 < .001 -754 [-924; -584] ACC 11.38 < .001 0.53 [0.43; 0.62] 3 RT -7.02 < .001 -510 [-672; -347] ACC 5.62 < .001 0.26 [0.16; 0.36] 2 - RT -8.44 < .001 -453 [-564; -341] ACC 4.68 0.002 0.18 [0.09; 0.26]
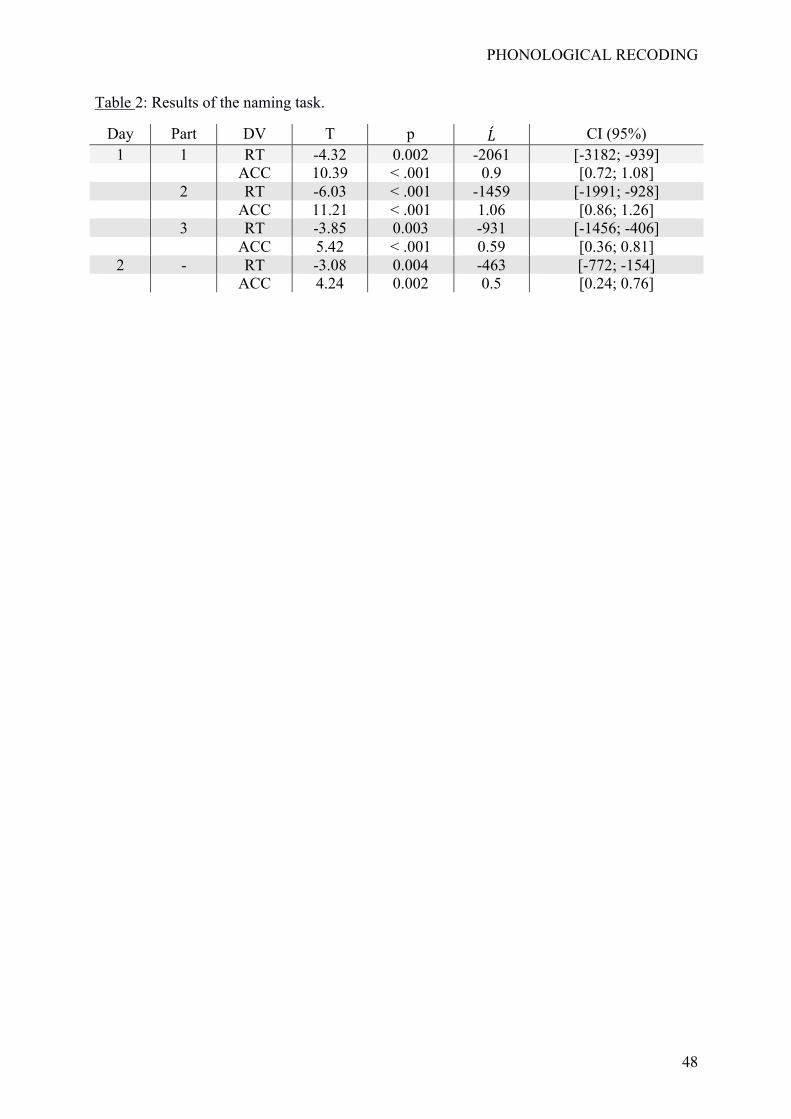
PHONOLOGICAL RECODING
48
Table 2: Results of the naming task.
Day Part DV T p �́� CI (95%) 1 1 RT -4.32 0.002 -2061 [-3182; -939] ACC 10.39 < .001 0.9 [0.72; 1.08] 2 RT -6.03 < .001 -1459 [-1991; -928] ACC 11.21 < .001 1.06 [0.86; 1.26] 3 RT -3.85 0.003 -931 [-1456; -406] ACC 5.42 < .001 0.59 [0.36; 0.81] 2 - RT -3.08 0.004 -463 [-772; -154] ACC 4.24 0.002 0.5 [0.24; 0.76]
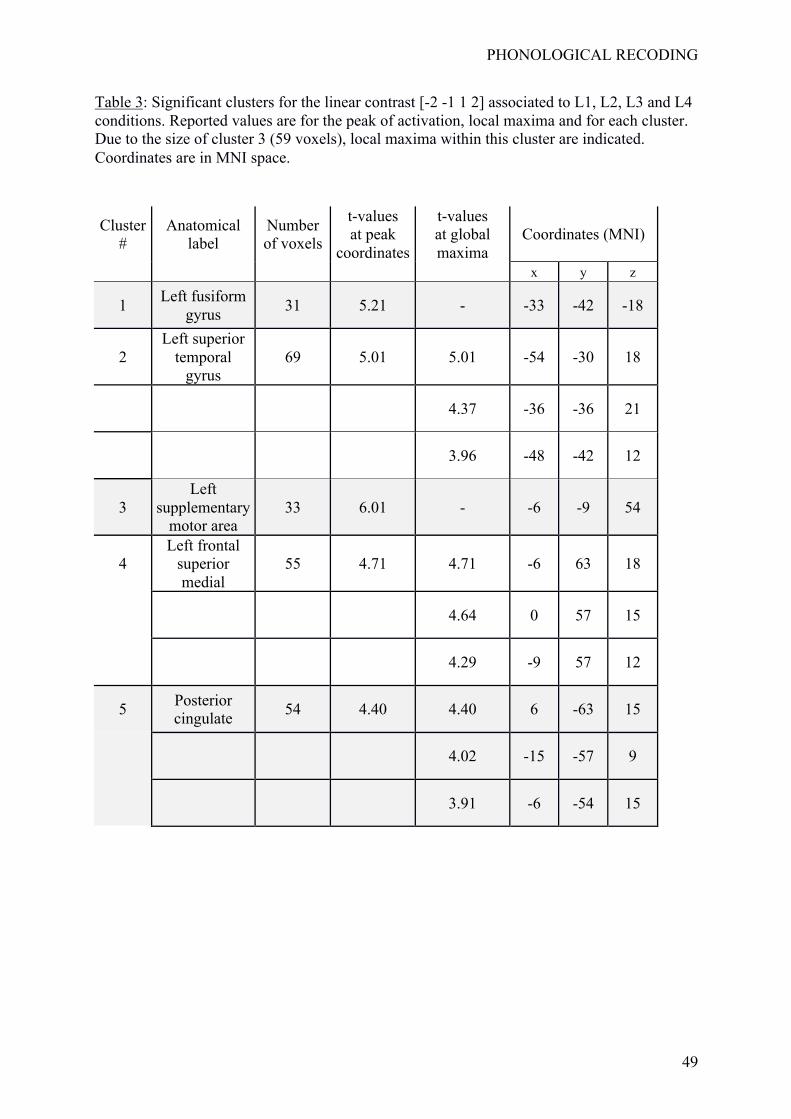
PHONOLOGICAL RECODING
49
Table 3: Significant clusters for the linear contrast [-2 -1 1 2] associated to L1, L2, L3 and L4 conditions. Reported values are for the peak of activation, local maxima and for each cluster. Due to the size of cluster 3 (59 voxels), local maxima within this cluster are indicated. Coordinates are in MNI space.
Cluster #
Anatomical label
Number of voxels
t-values at peak
coordinates
t-values at global maxima
Coordinates (MNI)
x y z
1 Left fusiform gyrus 31 5.21 - -33 -42 -18
2 Left superior
temporal gyrus
69 5.01 5.01 -54 -30 18
4.37 -36 -36 21
3.96 -48 -42 12
3 Left
supplementary motor area
33 6.01 - -6 -9 54
4 Left frontal
superior medial
55 4.71 4.71 -6 63 18
4.64 0 57 15
4.29 -9 57 12
5 Posterior cingulate 54 4.40 4.40 6 -63 15
4.02 -15 -57 9
3.91 -6 -54 15
PHONOLOGICAL RECODING
50
Figure captions
Figure 1: a) Overview of the experiment over Day 1 and Day 2. b) Katakana symbols used in
the experiment, with their associated sound composed of a consonant (in row) and a vowel (in
column). Shades of gray differentiate the four groups of Katakana symbols.
Figure 2: a) Trial description for the 2AFC task. ERP recording involved 12 learning sessions
of 92 trials (for a duration of approximately 5 to 6 minutes), in which participants learned the
names of visual symbols through this 2AFC task. Over the 12 learning sessions, every visual
symbol from L1, L2, L3 and L4 was presented in 36 trials. b) Trial description for the naming
task. Naming task occurred after learning sessions 2, 4, 6, 8, 10 and 12. Every visual symbol
was presented once during this task. c) Block description for the matching task during the
fMRI experiment. The fMRI procedure involved 4 functional runs. Each functional run
embedded 6 blocks, half of them corresponding to a target present block. Duration of each
functional run was approximately 8 minutes.
Figure 3: Descriptive behavioral results for the 2AFC and naming tasks. L1, L2, L3 and L4
correspond to the various learning conditions as defined by the strengths of V-P associations
(see Method for additional information). C corresponds to the letter condition. Part (1, 2, and
3) and Day (1 and 2) of the experiment are indicated in column. Mean RTs and mean ACCs
for the 2AFC are provided in Row 1 and 2, and mean RTs and mean ACCs for the naming
task are provided in Row 3 and 4. All CI are given at the alpha level 95%.
Figure 4: ERPs results. a) Uncorrected and corrected results testing for a linear effect of the
learning conditions on ERPs, on the entire spatial and temporal dimensions. Time 0
corresponds to the visual presentation of Katakana symbols. b) Illustration of the linear effect
on electrode P8. c) Mean linear effect at the group level and its associated CI at 95% for
electrode P8.
PHONOLOGICAL RECODING
51
Figure 5: fMRIs results for a linear effect of the learning conditions, with maximum intensity
projection of significant t-values. Circled numbers correspond to clusters showing significant
linear effects.
Figure 6: fMRIs results. Slice view of the peak activations for the three main significant
clusters (from Figure 5 and Table 3), displayed on the T1 underlay from the Conte69 Atlas
(Van Essen, Glasser, Dierker, Harwell, & Coalson, 2012; implemented on the Connectome
workbench software version 1.0). Cluster 1 corresponds to left fusiform gyrus, Cluster 2
corresponds to left superior temporal gyrus, and Cluster 3 corresponds to left supplementary
motor area. For descriptive purposes, we also represented the mean MR signals extracted
from whole clusters by condition. Additionally, mean linear contrasts values computed over
clusters are given. All CI are given at the alpha level 95%.
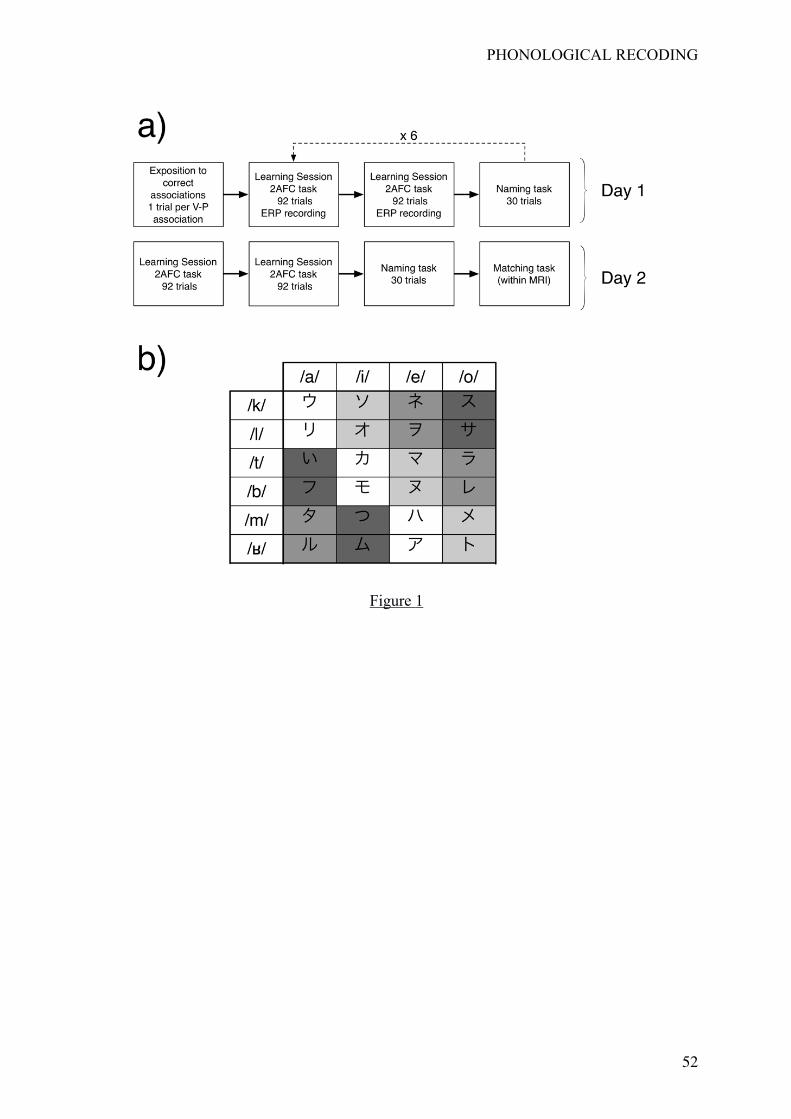
PHONOLOGICAL RECODING
52
Figure 1
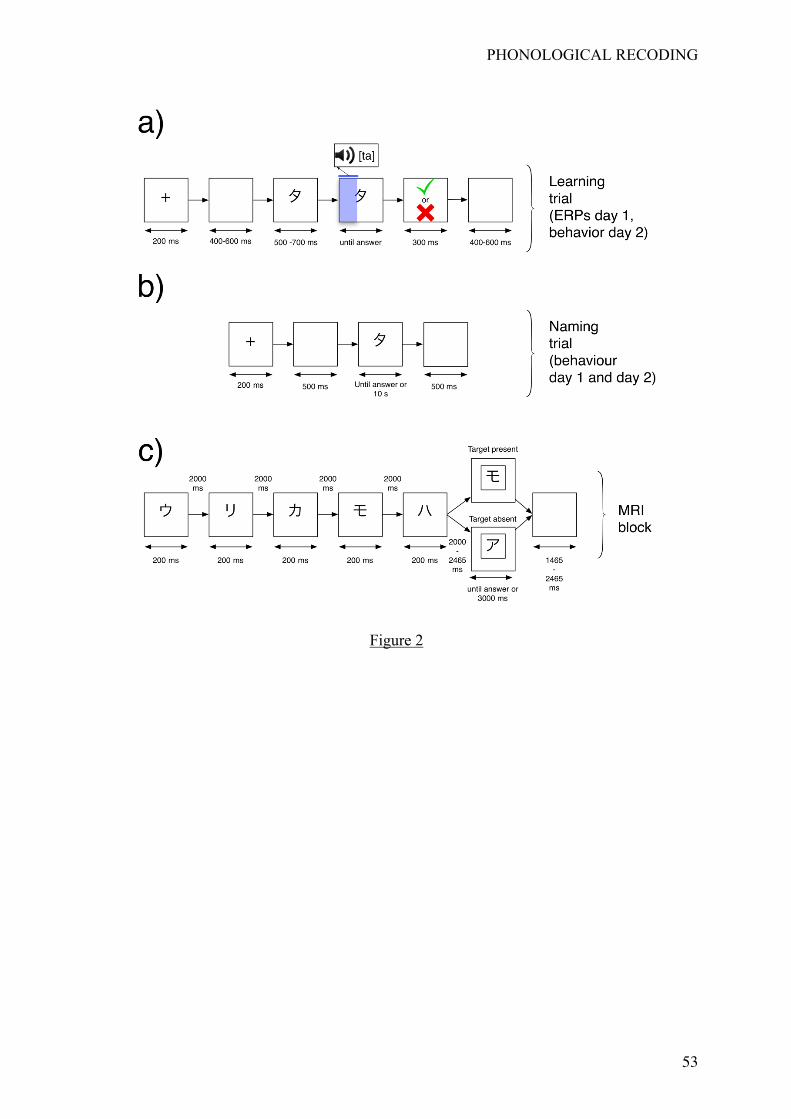
PHONOLOGICAL RECODING
53
Figure 2
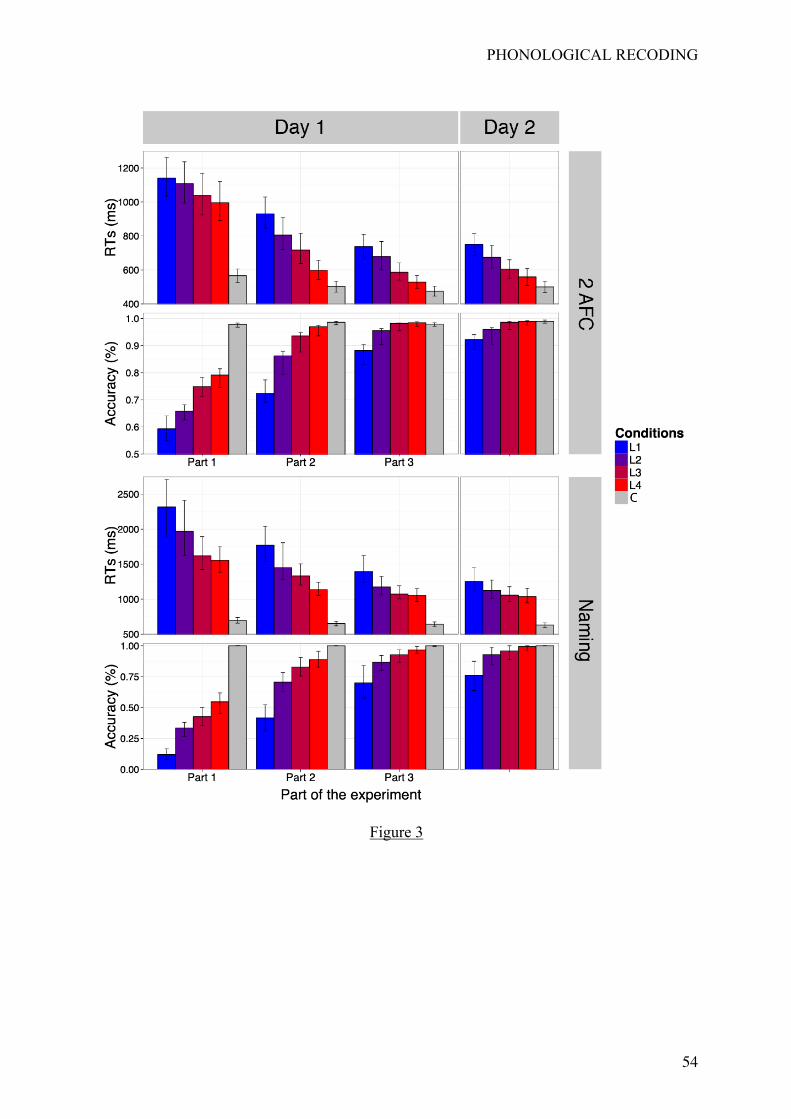
PHONOLOGICAL RECODING
54
Figure 3
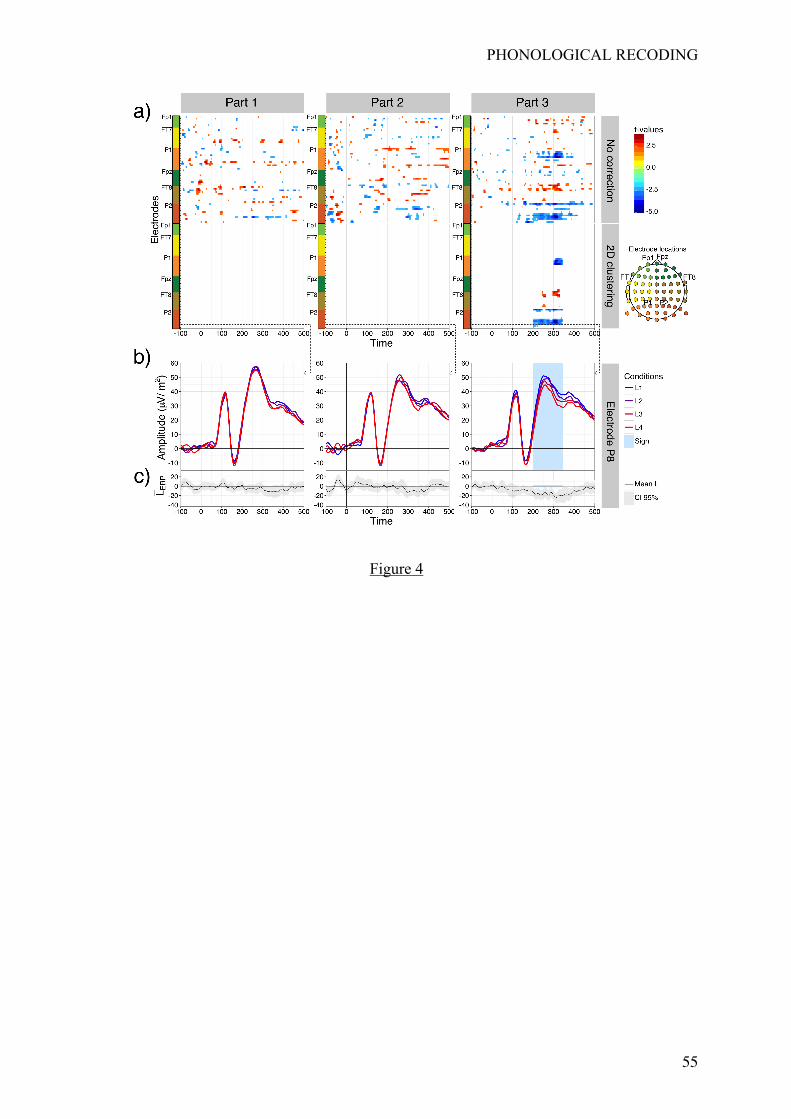
PHONOLOGICAL RECODING
55
Figure 4
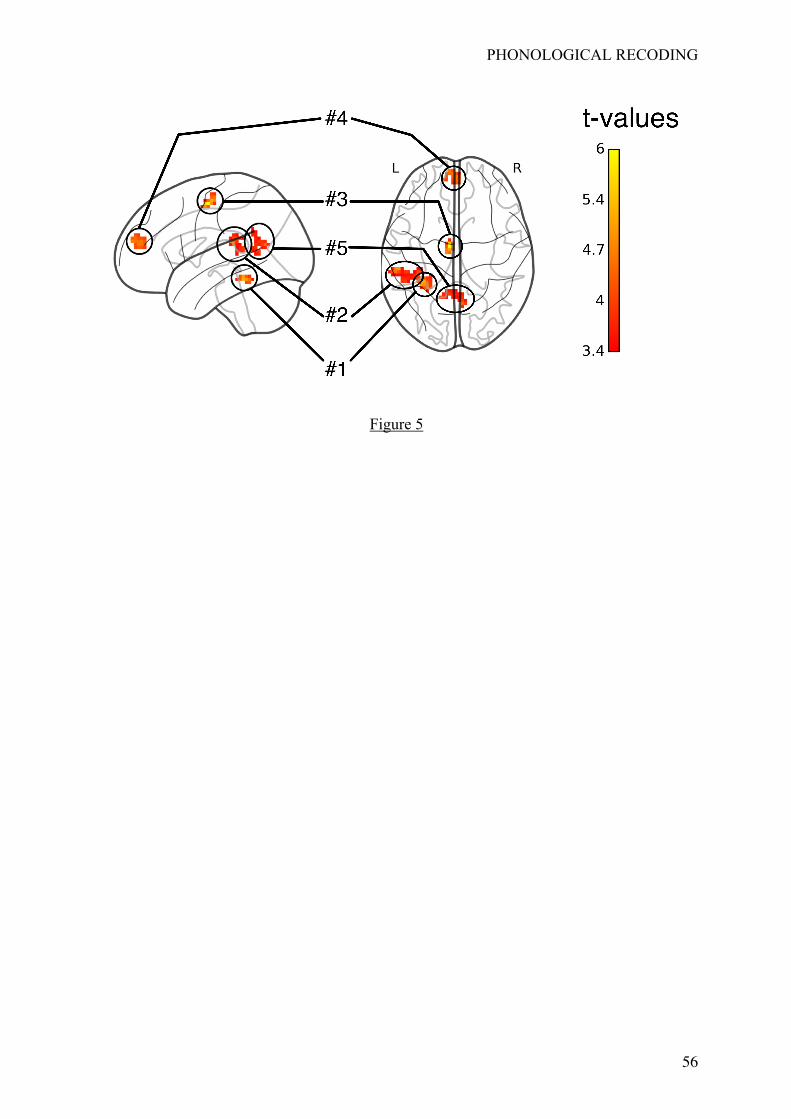
PHONOLOGICAL RECODING
56
Figure 5
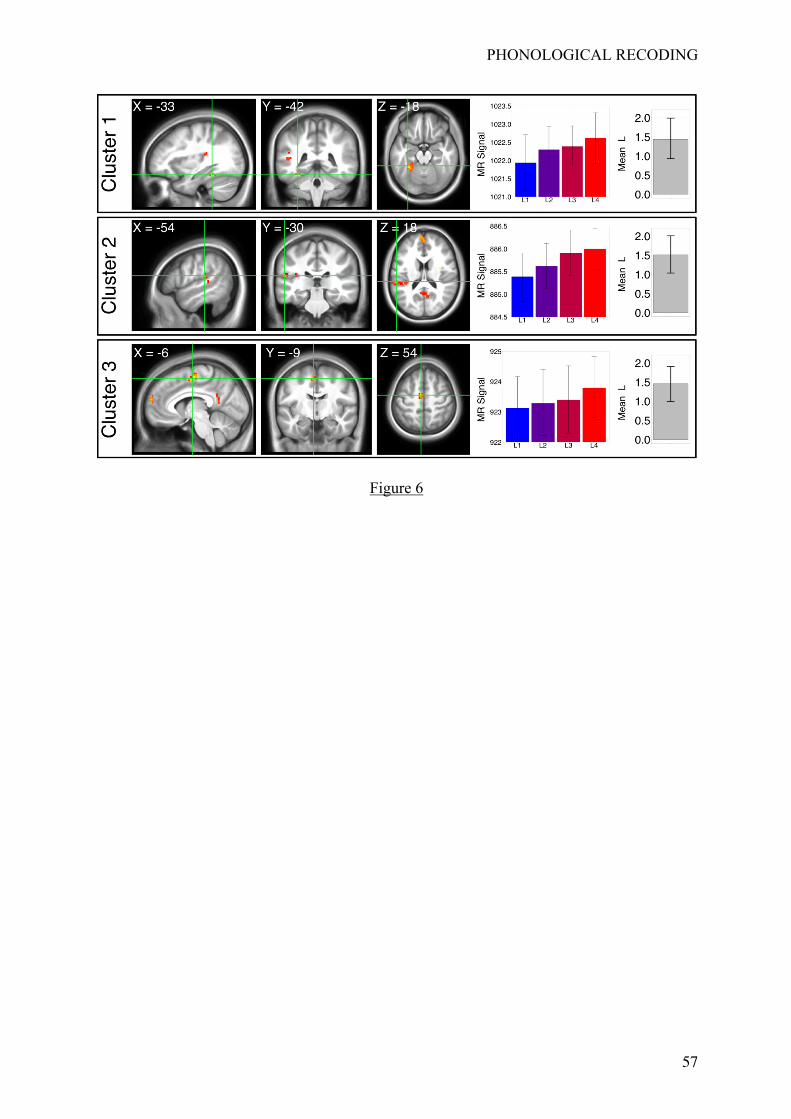
PHONOLOGICAL RECODING
57
Figure 6