brahmin left versus merchant right: changing political
TRANSCRIPT

HAL Id: halshs-03226118https://halshs.archives-ouvertes.fr/halshs-03226118
Preprint submitted on 14 May 2021
HAL is a multi-disciplinary open accessarchive for the deposit and dissemination of sci-entific research documents, whether they are pub-lished or not. The documents may come fromteaching and research institutions in France orabroad, or from public or private research centers.
L’archive ouverte pluridisciplinaire HAL, estdestinée au dépôt et à la diffusion de documentsscientifiques de niveau recherche, publiés ou non,émanant des établissements d’enseignement et derecherche français ou étrangers, des laboratoirespublics ou privés.
Brahmin Left versus Merchant Right: Changing PoliticalCleavages in 21 Western Democracies, 1948-2020
Amory Gethin, Clara Martínez-Toledano, Thomas Piketty
To cite this version:Amory Gethin, Clara Martínez-Toledano, Thomas Piketty. Brahmin Left versus Merchant Right:Changing Political Cleavages in 21 Western Democracies, 1948-2020. 2021. �halshs-03226118�

Brahmin Left versus Merchant Right: Changing Political Cleavages in 21 Western
Democracies, 1948-2020
Amory Gethin Clara Martínez-Toledano
Thomas Piketty
May 2021
World Inequality Lab – Working Paper N° 2021/15

1
Brahmin Left versus Merchant Right:
Changing Political Cleavages in 21 Western Democracies, 1948-2020
Amory Gethin
Clara Martínez-Toledano
Thomas Piketty
May 5, 2021
Amory Gethin, Thomas Piketty: Paris School of Economics – World Inequality Lab; Clara Martínez-Toledano:
Imperial College London – World Inequality Lab. We are grateful to Luis Bauluz, Carmen Durrer de la Sota, Fabian
Kosse, Marc Morgan, and Alice Sodano for their help in building the dataset exploited in this paper. We thank
Thomas Blanchet, Lucas Chancel, Ignacio Flores, Javier Padilla, Tom Raster, Till Weber, and seminar and
conference participants from the Paris School of Economics Applied Economics Lunch Seminar and the CUNY
Graduate Center Comparative Politics Workshop for helpful comments.
Abstract
This paper provides new evidence on the long-run evolution of political cleavages in 21 Western
democracies by exploiting a new database on the vote by socioeconomic characteristic covering
over 300 elections held between 1948 and 2020. In the 1950s-1960s, the vote for democratic,
labor, social democratic, socialist, and affiliated parties was associated with lower-educated and
low-income voters. It has gradually become associated with higher-educated voters, giving rise
to “multi-elite party systems” in the 2000s-2010s: high-education elites now vote for the “left”,
while high-income elites continue to vote for the “right”. This transition has been accelerated
by the rise of green and anti-immigration movements, whose key distinctive feature is to
concentrate the votes of the higher-educated and lower-educated electorate, respectively.
Combining our database with historical data on political parties’ programs, we provide evidence
that the reversal of the educational cleavage is strongly linked to the emergence of a new
“sociocultural” axis of political conflict. We also discuss the evolution of other political
cleavages related to age, geography, religion, gender, and the integration of new ethnoreligious
minorities.
2
I. Introduction
Economic inequalities have increased significantly in the Western world since the 1980s,
although at different speeds (Alvaredo et al., 2018). Given this recent evolution, one might have
expected to observe rising political demand for redistribution and the return of class-based
(income-based or wealth-based) politics. Instead, Western democracies seem to have shifted to
new forms of identity-based conflicts in recent decades, embodied by the increasing salience of
environmental issues and the growing prosperity of anti-establishment authoritarian movements
(Trump, Brexit, Le Pen, etc.). Often drawing on a common agenda of economic protectionism,
restrictions to immigration flows, and conservative social policies, these movements have
successfully fed into sociocultural and economic anxieties triggered by globalization and
economic insecurity (Colantone & Stanig, 2019).
Yet, much remains to be understood about the origins and nature of these political upheavals. Is
the rise of xenophobic “populism” the outcome of recent trends (such as the 2007-2008 crisis,
immigration waves, or globalization), or can we trace it back to longer-run structural changes?
Beyond country-specific factors, such as the racial divide in the United States or supranational
integration in the European Union, can we find evolutions that are common to all Western
democracies? On what dimensions of political conflict (income, education, age, region, etc.)
have such transformations aligned?
This paper attempts to make some progress in answering these questions by exploiting a new
dataset on the long-run evolution of electoral behaviors in 21 democracies. Drawing on nearly
all electoral surveys ever conducted in these countries since the end of World War II, we
assemble microdata on the individual determinants of the vote for over 300 elections held
between 1948 and 2020. Together, these surveys provide unique insights into the evolution of
political preferences in Western democracies. The contribution of this paper is to establish a
new set of stylized facts on these preferences, as well as to explore some mechanisms underlying
their transformation in the past decades.
The most striking result that emerges from our analysis is what we propose to call the transition
from “class-based party systems” to “multi-elite party systems”. In the 1950s-1960s, the vote

3
for democratic, labor, socialist, social democratic, and other left-wing parties in Western
democracies was “class-based”, in the sense that it was strongly associated with the lower-
income and lower-educated electorate. It has gradually become associated with higher-educated
voters, giving rise in the 2010s to a remarkable divergence between the effects of income
(economic capital) and education (human capital) on the vote: high-income elites continue to
vote for the “right”, while high-education elites have shifted to supporting the “left”. This
separation between a “Merchant right” and a “Brahmin left”1 is visible in nearly all Western
democracies, despite their major political, historical, and institutional differences (e.g., the two-
party systems of the United States or Britain versus the highly fragmented multi-party systems
of France or Denmark). We also find that the rise of both green and anti-immigration parties
since the 1980s-1990s has strongly accelerated this transition: while income continues to
differentiate social democratic and affiliated parties from conservative and Christian democratic
parties, it is education that most clearly distinguishes green and anti-immigration movements
today.
To shed light on the factors underlying the emergence of multi-elite party systems, we match
our dataset with the Comparative Manifesto Project database, the most comprehensive available
data source on the evolution of political parties’ programs since the end of World War II.
Drawing on two indicators of party ideology from the political science literature (Bakker &
Hobolt, 2012), corresponding to parties’ relative positions on an “economic-distributive” axis
and a “sociocultural” axis, we provide evidence that the separation between these two
dimensions of political conflict and the divergence of income and education are tightly related
phenomena. Specifically, we document that the correlation between parties’ income gradient
and their position on the economic-distributive dimension has remained very stable since the
1960s, that is, parties emphasizing “pro-free-market” issues receive disproportionately more
votes from high-income voters today, just as they used to sixty years ago. Meanwhile, the
1 In India’s traditional caste system, upper castes were divided into Brahmins (priests, intellectuals) and
Kshatryas/Vaishyas (warriors, merchants, tradesmen), a division that modern political conflicts in Western
democracies therefore seem to follow to some extent.
4
correlation between the education gradient and parties’ positions on the sociocultural axis has
dramatically increased over time, from 0 in the 1960s to nearly 0.5 in the 2010s. In other words,
parties promoting “liberal” policies (green and to lower extent traditional left-wing parties) have
seen their electorate become increasingly restricted to higher-educated voters, while parties
upholding more “conservative” views (anti-immigration and to a lower extent traditional right-
wing parties) have on the contrary concentrated a growing share of the lower-educated
electorate. We also find a strong and growing cross-country association between ideological
polarization on sociocultural issues and the reversal of the educational cleavage. In particular,
the two countries in our dataset where this reversal has not yet occurred, Portugal and Ireland,
are also those where partisan divides over “identity-based” politics remain the weakest today.
We should stress however that the limitations of available information on party manifestos and
policies (as well as on voters’ perceptions of these manifestos and policies) constrain to some
extent our ability to fully test the various hypotheses behind the evolutions that we uncover. In
particular, the sociocultural axis puts together many different items that ideally should be
analyzed separately and also involve various forms of class conflict. There are, for instance,
different ways to design environmental policies, migration policies, cultural or education
policies which can be more or less favorable to lower class, middle class or upper class voters.
Generally speaking, one key limitation is that we are not able to distinguish between different
dimensions of redistributive policies, for example income transfers versus education policy. One
possible interpretation of our findings is that left-wing parties have gradually developed a more
elitist approach to education policy, in the sense that they have increasingly been viewed by less
well-off voters as parties defending primarily the winners of the higher education competition.
This risk was identified as early as in 1958 by Michael Young in his famous dystopia about “the
rise of the meritocracy”. In this book, Young expresses doubts about the ability of the British
Labour Party (of which he was a member) to keep the support of lower educated classes in case
the party fails to combat what he describes as the rise of “meritocratic ideology” (a strong view
held by higher education achievers about their own merit, which Young identifies as a major
5
risk for future social cohesion).2 Unfortunately, the data at our disposal makes it difficult to
provide a direct test for this hypothesis. In particular, we do not have long-run, comparative
survey data about how voters perceive the fairness of the education system and the education
policies advocated by the various political parties. The fact that participation rates have fallen
sharply among bottom 50% voters (both in terms of education and income) in a number of
countries (including the UK and France), but not among upper 50% voters, can be interpreted
as a sign that socially disadvantaged voters have felt left aside by the rise of “multi-elite” party
systems.3 But it is difficult with the data at hand to determine the extent to which different
redistributive policy platforms might have led to different electoral attitudes.4
We also exploit the other variables in our dataset to study cleavages related to age, geography,
religion, immigration, and gender. In contrast to studies emphasizing the role of the generational
divide in explaining political change in Western democracies (e.g. Inglehart, 1977; Inglehart &
Norris, 2019), we find no evidence that younger generations have become more left-wing than
they were in the 1950s. However, we document a striking reversal of the educational cleavage
2 For a simple theoretical model along these lines, see Piketty (2018, section 5). It is based upon a two-dimensional
extension of Piketty (1995)’s model about learning the role of effort and a distinction between education-related
effort and business-related effort. The model can account for the simultaneous existence of “Brahmin left” voters
(i.e., dynasties believing strongly in the role of education-related effort) and “Merchant right” voters (i.e., dynasties
believing strongly in the role of business-related effort). This “multi-elite” pattern differs from Young’s predictions,
who anticipated that the Conservative Party would become the “Brahmin” party (supported by top Oxbridge
graduates), closely followed by the Labour Party (who would become the party of “Technicians”), while the mass
of voters with lower education achievement would join the “Populists”. The dystopia ends up in riots in 2033 where
the sociologist writing the book is being killed.
3 See Piketty (2018), figures A1-A2. Participation rates among bottom 50% voters have always been relatively low
in the US (at least during the post-World War II period). To some extent the British and French pattern has moved
toward the US pattern since the 1970s-1980s. Unfortunately the surveys at our disposal do not allow us to analyze
in a consistent manner the evolution of participation rates in our sample of 21 countries, so we do not push any
further our analysis of turnout.
4 See Piketty (2020) for further discussion along these lines.

6
within generations: older lower-educated voters continue to vote “along class lines” and thus to
support the left, while social democratic and green parties have attracted a growing share of the
higher-educated electorate among the youth. Similarly, we show that rural-urban and religious
cleavages have remained stable or have decreased in most countries in our dataset: rural areas
and religious voters continue to be more supportive of conservative parties, just as they were in
the 1950s-1960s. In other words, while green parties find greater support among young, urban,
and non-religious voters, this does not make them fundamentally different from the traditional
left. Education, not age, geography or religion, appears to have been a more fundamental source
of realignment.
The only other variable in our dataset for which we find a clear reversal of electoral divides is
gender: in nearly all countries, women used to be more conservative than men and have
gradually become more likely to vote for left-wing parties. This can be explained by the
combination of several factors, including the secularization of Western societies, the rising
salience of gender equality issues, economic insecurity associated to the decline in marriage,
and the growing concentration of women in the public sector. Lastly, we exploit data on voters’
religion and country of birth to study “nativist” cleavages related to the integration of new
ethnoreligious minorities. We find that immigrants are generally much more supportive of social
democratic and affiliated parties than natives, but that this gap varies substantially across
countries. This divide is most pronounced in the case of Muslims, who overwhelmingly support
social democratic and affiliated parties in all countries for which data is available, and is highest
in countries with powerful anti-immigration movements. This points to the role of political
supply and sociocultural factors in shaping conflicts over national identity and the integration
of new minorities.
This paper directly relates to the growing literature on the sources of political change and the
rise of “populism” in Western democracies. Recent studies have emphasized the roles of various
economic and sociocultural factors, including globalization and trade exposure (Autor et al.,
2020; Colantone & Stanig, 2018a, 2018b; Malgouyres, 2017), economic insecurity and
unemployment (Algan et al., 2017; Becker et al., 2017; Becker & Fetzer, 2018; Dehdari, 2021;
Fetzer, 2019; Funke et al., 2016; Guiso et al., 2020; Liberini et al., 2019), immigration (Becker
& Fetzer, 2017; Dustmann et al., 2019; Halla et al., 2017; Tabellini, 2020), and cultural and
7
moral conflicts (Enke, 2020; Gennaioli & Tabellini, 2019; Inglehart & Norris, 2019). We
contribute to this body of evidence by adopting a broader, long-run historical perspective on the
evolution of political cleavages since the end of World War II.
We also contribute to the literature on multidimensional political competition and its impact on
redistribution and inequality. A key result from this literature is that political support for
redistribution should be inversely proportional to the strength of other political cleavages
crosscutting class divides (Alesina et al. 1999a, 1999b; Gennaioli & Tabellini, 2019; Roemer,
1998; Roemer et al., 2007). The divergence of the effects of income and education on the vote
documented in this paper, two strongly correlated measures of inequality, could in this context
contribute to explaining why the rise of economic disparities in the past decades has not been
met by greater redistribution or renewed class conflicts.
Finally, this paper relates to the large political science literature on the determinants of the vote
in comparative and historical perspective. Numerous studies have highlighted that Western
democracies have undergone a process of growing polarization over a new “sociocultural” or
“universalistic-particularistic” dimension of political conflict in the past decades (e.g.
Bornschier, 2010; Dalton, 2018; Evans & De Graaf, 2012; Inglehart, 1977; Kitschelt, 1994;
Kriesi et al., 2008). We contribute to this literature by gathering the largest dataset ever built on
the socioeconomic determinants of the vote in Western democracies5; by focusing explicitly on
income and education, two variables rarely studied in comparative political science research;
and by directly matching this dataset with historical data on party ideology to document the
dynamic links between political supply and demand. In particular, we provide for the first time
cross-country, long-run historical evidence that education has gradually become the key variable
structuring a new dimension of political conflict. These results are in line with recent studies,
focusing on specific countries or on recent decades, which have suggested education could be
5 Our work directly draws on previous data collection and harmonization efforts. See in particular Bosancianu
(2017), Franklin et al. (1992), Evans & De Graaf (2012), Önudottir et al. (2017), Thomassen (2005), and the
remarkable collections of post-electoral surveys compiled by the Comparative Study of Electoral Systems
(http:///cses.org) and the Comparative National Elections Project (https://u.osu.edu/cnep/).

8
playing a renewed role in determining electoral behaviors (see Bovens & Wille, 2012;
Bornschier, 2010b; Dolezal, 2010; Kitschelt & Rehm, 2019; Stubager, 2010; Van der Waal et
al., 2010). This new dimension does not fully coincide with the traditional economic dimension
(income and wealth) and appears to be related to a large and complex set of policy issues,
including the environment, migration, gender, education, and merit.
Section II presents the new dataset exploited in this paper. Section III documents the emergence
of multi-elite party systems and discusses the role of green and anti-immigration parties in
explaining the reversal of the educational cleavage. Section IV matches our survey dataset with
manifesto data to study the link between multi-elite party systems and the emergence of a new
axis of political conflict. Section V explores the evolution of other determinants of electoral
behaviors. Section VI concludes. All the data series, computer codes, and microfiles used in this
article can be publicly accessed online as part of the World Political Cleavages and Inequality
Database (http://wpid.world).
II. Data and Methodology
II.A. A New Dataset on Political Cleavages in Western Democracies, 1948-2020
The dataset we exploit in this paper consists in a unique collection of electoral surveys conducted
between 1948 and 2020 in Western democracies.6 These surveys have one main point in
common: they contain information on the electoral behaviors of a sample of voters in the last
(or forthcoming) election, together with data on their main sociodemographic characteristics
such as income, education, or age. While they suffer from limitations typical to surveys (in
6 Previous case studies focused on specific countries covered in our dataset can be found in Piketty (2018); Kosse
& Piketty (2020); Martínez-Toledano & Sodano (2021); Gethin (2021); Bauluz, Gethin, Martínez-Toledano, and
Morgan (2021); and Durrer de la Sota, Gethin, and Martínez-Toledano (2021). Although the focus of this paper is
on Western democracies, it is part of a broader project dedicated to tracking political cleavages in other democracies
throughout the world: see Gethin, Martínez-Toledano, and Piketty (forthcoming 2021).
9
particular small sample sizes), they provide an invaluable source for studying the long-run
evolution of political preferences in contemporary democracies.
Universe. Our area of study encompasses 21 countries commonly referred to as “Western
democracies”, for which we can cover a total of about 300 national elections held between 1948
and 2020 (see Table 1). These include 17 Western European countries, the United States,
Canada, Australia, and New Zealand. For seven countries in our dataset (France, Germany, Italy,
Norway, Sweden, the UK, and the US), available surveys allow us to go back as early as the
1950s. The majority of remaining countries have data going back to the 1960s or the early 1970s,
with the exception of Spain and Portugal, which did not held democratic elections between the
1940s and the late 1970s.
The focus of this paper is on national (general or presidential) elections, which determine the
composition of government and the head of the State.7 In the majority of Western democracies,
they have been held on a regular basis every four or five years since at least the end of World
War II. Depending on their frequency and the availability of electoral surveys, we are able to
cover political attitudes in 9 to 21 of these elections in each country.
Data sources. The primary data source used in this paper consists in so-called National Election
Studies, most of which have been conducted by a consortium of academic organizations (see
Table 1). The vast majority of these surveys are post-electoral surveys: they are fielded shortly
after the corresponding national election has been held, with sample sizes generally varying
between 2,000 and 4,000 respondents, and they collect detailed and consistent information on
voting behaviors and the sociodemographic characteristics of voters.
[Table 1 here]
7 We focus on general or legislative elections for all countries in our dataset except the United States, for which we
study presidential elections. Our results are strongly robust to considering presidential elections in countries where
they are held (e.g. France), as well as to including midterm elections in US series (see Piketty, 2018).
10
In all Western democracies except Austria, Ireland, and Luxembourg, we have been able to get
access to such high-quality data sources. For these three countries, we rely instead on more
general political attitudes surveys, which were not specifically conducted in the context of a
given election but did ask respondents to report their previous voting behaviors: the
Eurobarometers, the European Social Survey, and the European Election Studies. Furthermore,
in a few countries such as Australia or Belgium, where national election studies were not
conducted prior to the 1970s or 1980s, we complement them with a number of other political
attitudes surveys conducted in earlier decades. While these sources do not allow us to accurately
track election-to-election changes, they are sufficient to grasp long-run changes in party
affiliations, which is the objective of this paper. A complete list of all data sources used by
country can be found in appendix Table A3.
Harmonization. Starting from raw data files, we extract in each survey all sociodemographic
characteristics that are sufficiently common and well-measured to be comparable across
countries and over time. Based on these criteria, we were able to build a harmonized dataset
covering the following variables: income, education, age, gender, religious affiliation, church
attendance, race or ethnicity (for a restricted number of countries), rural-urban location, region
of residence, employment status, marital status, union membership, self-perceived social class,
and (in recent years) country of birth.8
Income and education, the two variables that form the core part of our analysis in section III,
deserve special attention. Indeed, one reason why income and education variables are not often
exploited in comparative research on electoral behaviors is that they tend to be difficult to
harmonize. Education systems and educational attainments vary significantly across countries
and over time, and they are not always perfectly comparable across surveys. The same
8 A key variable for understanding political cleavages is wealth, yet data on asset ownership was only available in
a handful of countries, which is why we do not consider it in this paper: see Piketty (2018) and Martínez-Toledano
& Sodano (2021) for results on France, the UK, the US, and Sweden.
11
limitations apply to income, which is only collected in discrete brackets in the vast majority of
the sources used in this paper.
We address this shortcoming by normalizing these two variables and focusing on specific
education and income deciles. We introduce in appendix A the simple method we use to move
from discrete categories (education levels or income brackets) to deciles. In broad strokes, our
approach consists in allocating individuals to the potentially multiple income or education
deciles to which they belong, in such a way that average decile-level vote shares are computed
assuming a constant vote share within each education- or income-year cell. This is a
conservative assumption, as vote shares for specific parties are likely to also vary within
education groups or income brackets. The levels and changes in educational and income
cleavages documented in this paper should thus be considered as lower bounds of the true effects
of education and income on the vote.
Lastly, for consistency and in order to make surveys more representative of election outcomes,
we systematically reweigh respondents’ answers to match official election results. In the vast
majority of cases, given that post-electoral surveys capture relatively well variations in support
for the different parties, this correction leaves our results unchanged.
II.B. Classifying the parties
Our objective is to compare the evolution of electoral cleavages in Western democracies. This
requires grouping political parties in such a way that the size of the coalitions considered and
their historical affiliations are as comparable and meaningful as possible. To do so, we choose
for our main specification to focus on a distinction between two large groups of parties (see
appendix Tables A1 and A2).
On one side of the political spectrum are democratic, labor, socialist, social democratic, green,
and communist parties, often classified as “left-wing” and that we also refer to as “social
democratic and affiliated parties” in what follows. These include the Democratic Party in the
US, labor parties in countries such as the UK, Australia, or Norway, as well as various parties
affiliated to socialist and social democratic traditions in Western European countries. It also
includes environmental parties in their various forms, together with parties of the “new left” that

12
mostly emerged after the 2008 crisis (such as Podemos in Spain or La France Insoumise in
France).9
On the other side are conservative, Christian democratic, and anti-immigration parties, often
classified as “right-wing” and that we also refer to as “conservative and affiliated parties”. These
include the Republican Party in the US and other conservative parties such as those of the UK,
Norway or Spain; Christian democratic parties, which are common in Western European multi-
party systems such as those of Austria, Belgium or Switzerland; and anti-immigration parties
such as the French Rassemblement National or the Danish People’s Party.
This binary classification has one major advantage: it allows us to directly compare electoral
divides in two-party systems, such as the UK or the US, to those observed in highly fragmented
party systems such as France or the Netherlands. However, this does not mean that these groups
are ideologically or programmatically homogeneous in any way, neither internally nor over
time. Our objective is, on the contrary, to document how such large families or parties have
aggregated diverse and changing coalitions of voters in the past decades. In section III, we thus
consider in greater detail how specific subfamilies of parties, in particular green and anti-
immigration movements, have contributed to reshaping electoral divides in countries with multi-
party systems.
II.C. Empirical Strategy
In the rest of the paper, we present results from simple linear probability models of the form:
𝑦𝑖𝑐𝑡 = 𝛼 + 𝛽𝑥𝑖𝑐𝑡 + 𝐶𝑖𝑐𝑡𝛾 + 𝜀𝑖𝑐𝑡
9 We also include in this group a few parties clearly not affiliated with socialist or social democratic traditions, such
as the Liberal Party in Canada or Fianna Fáil in Ireland. Our choice is above all motivated by our objective to
compare large electoral coalitions across countries, obtaining at least 30 percent of the vote in most elections, but
the transformations we document are robust to alternative specifications.

13
Where 𝑦𝑐𝑖𝑡 is a binary outcome variable of interest (e.g. voting for left-wing parties) for
individual 𝑖 in country 𝑐 in election 𝑡, 𝑥𝑖𝑐𝑡 is a binary explanatory variable of interest (e.g.
belonging to top 10% educated voters), and 𝐶𝑖𝑐𝑡 is a vector of controls.
In the absence of controls, the coefficient 𝛽 simply equals the difference between the share of
top 10% educated voters voting for left-wing parties and the share of other voters (bottom 90%
educated voters) voting for left-wing parties:
𝛽 = 𝐸(𝑦𝑖𝑐𝑡 = 1, 𝑥𝑖𝑐𝑡 = 1) − 𝐸(𝑦𝑖𝑐𝑡 = 1, 𝑥𝑖𝑐𝑡 = 0)
With controls, the interpretation is also straightforward: all things being equal, belonging to the
top 10% of educated voters increases one’s propensity to vote for left-wing parties by 𝛽
percentage points. All control variables in our dataset are specified as dummy variables, so that
the model is fully saturated and can be estimated by OLS using heteroscedasticity-robust
standard errors.10
III. The Reversal of the Educational Cleavage and the Emergence of Multi-Elite Party
Systems
This section presents our main results on the evolution of cleavages related to income and
education. Section III.A documents the emergence of multi-elite party systems in Western
democracies. Section III.B studies how the fragmentation of party systems and the rise of green
and anti-immigration parties has contributed to this transformation.
III.A. The Emergence of Multi-Elite Party Systems
To document the origination of multi-elite party systems, we rely on a very simple indicator:
the difference between the share of 10 percent most educated voters and the share of the 90
percent least educated voting for democratic, labor, social democratic, socialist, communist, and
10 See for instance Wooldridge (2002), chapter 15.
14
green parties. This difference is negative when highest-educated voters have a lower likelihood
to vote for these parties, and positive when they have a higher likelihood to do so. It is equal to
zero if they have exactly the same likelihood to support the left as the rest of the electorate. We
use the same indicator for income, defined as the difference between the share of richest 10
percent voters and the share of poorest 90 percent voters voting for social democratic and
affiliated parties.
Figure 1 depicts the average quinquennial evolution of these two indicators, after controls, in
the twelve Western democracies for which data is available since the 1960s.11 As shown in the
upper line, highest-educated voters were less likely to vote for social democratic parties than
lowest-educated voters by 15 percentage points in the 1960s. This gap has shifted very gradually
from being negative to becoming positive, from -10 in the 1970s to -5 in the 1980s, 0 in the
1990s, +5 in the 2000s, and finally +10 in 2015-2020. Higher-educated voters have thus moved
from being significantly more right-wing than lower-educated voters to significantly more left-
wing, leading to a striking reversal in the educational divide.
[Figure 1 here]
In contrast, the evolution has been dramatically different in the case of income. The bottom line
shows that top-income voters have always been less likely to vote for social democratic and
affiliated parties and more likely to vote for conservative and affiliated parties. In the 1960s, the
indicator was equal to -15, that is, top-income voters had a probability to vote for social
democratic parties lower than that of low-income voters by 15 percentage points. This gap has
decreased slightly until reaching about -10 in the past decade, but it remains significantly
11 See appendix Figure A3 for the same figure averaged over all 21 democracies (unbalanced panel).

15
negative. High-income voters have thus remained closer to conservative parties than low-
income voters over the past fifty years.12
Combining these two evolutions, a striking long-run evolution in the structure of political
cleavages emerges. In the early postwar decades, the party systems of Western democracies
were “class-based”, that is, social democratic and affiliated parties represented both the low-
education and the low-income electorate, whereas conservative and affiliated parties represented
both high-education and high-income voters. These party systems have gradually evolved
towards what we propose to call “multi-elite party systems”: higher-educated elites now vote
for the “left”, while high-income elites still vote for the “right”.
Note that the two indicators shown in the figure control for all available variables at the micro
level (education/income, age, gender, religion, church attendance, rural/urban location, region,
race/ethnicity, employment status, and marital status). The evolution of these two indicators
without controls displays a stronger decline in the influence of income on the vote, from nearly
-20 in the 1960s to about -5 in 2015-2020 (see appendix Figure A1). The main reason is that
higher-educated voters have on average higher incomes, so that the reversal of the educational
divide has mechanically led to a reduction in the difference between top-income and low-income
voters. Nonetheless, what is important for our analysis is that the transition towards a multi-elite
party system is robust to the inclusion or exclusion of controls.
It is also important to stress that the divergence of the effects of income and education cannot
be explained by changes in the composition of income or educational groups. In fact, the
correlation between income and education has remained largely stable since the 1950s,
fluctuating between 0.2 and 0.4 depending on the country considered and the quality of the data
available (i.e., the number of income brackets and educational categories available in post-
electoral surveys): see appendix Figure A17. We also perform a two-way Oaxaca-Blinder
12 We focus here on differences between the top 10 percent and the bottom 90 percent, but the evolutions observed
are similar when comparing other groups such as the bottom 50 percent and top 50 percent (see appendix Figures
A2 and A4).
16
decomposition of the educational cleavage and find that changes in the composition of
educational groups played no significant role in the transition observed (see appendix Figure
A18).
The emergence of a multi-elite party system is common to nearly all Western democracies, but
it has happened at different speeds and with different intensities. Figure 2 shows that support of
higher-educated voters for social democratic parties was lowest in Norway, Sweden, and
Finland between the 1950s and 1970s, three democracies well known for having stronger
historical class-based party systems than most Western democracies. The reversal of the
education cleavage has not yet been fully completed in these countries, as social democratic
parties have managed to keep a non-negligible fraction of the low-income and lower-educated
electorate (Martínez-Toledano and Sodano, 2021).
[Figure 2 here]
This delay is also common to recent democracies such as Spain or Portugal or late industrialized
countries such as Ireland, where left-wing parties continue to be more class-based. Portugal and
to a lesser extent Ireland represent two major exceptions in our dataset, where we do not observe
a clear tendency towards a reversal of the educational divide. Among several factors, this unique
trajectory can be explained by the polarization of mainstream parties and the success of new
left-wing parties after the onset of the 2008 financial crisis (Bauluz et al., 2021). In contrast, the
gap in left votes between higher-educated voters and lower-educated voters is today highest in
countries such as the United States, Switzerland, and Netherlands, due largely to the particular
salience of identity-based concerns and the strength of anti-immigration and green movements
in the latter two countries (Durrer et al., 2021).
Figure 3 shows that top-income voters have also remained significantly more likely than low-
income voters to vote for conservative and affiliated parties in nearly all Western democracies,
but with significant variations. The influence of income on the vote was strongest in Northern
European countries, Britain, Australia, and New Zealand in the 1950s and 1960s, consistently
with their histories of early industrialization and strong class polarization. As traditional class
divides have collapsed in these countries in the past decades, so has the relationship between
income and the vote.

17
[Figure 3 here]
Meanwhile, low-income voters have supported less decisively left-wing parties in countries with
weak historical class cleavages and strong crosscutting religious (Italy) or ethnolinguistic
(Canada) cleavages (Bauluz et al., 2021; Gethin, 2021). Despite these variations, the tendency
of high-income voters to support the right in contemporary Western democracies has proved
remarkably resilient over time, pointing to the persistence of conflicts over economic issues and
redistributive policy. The only country where a complete reversal of the income effect could
well be underway is the United States (and to a lesser extent Italy, due to the recent success of
the Five Star Movement among the low-income electorate), where in 2016 and 2020 top 10
percent earners became more likely to vote for the Democratic Party for the first time since
World War II (Piketty, 2018).13
III.B. The Fragmentation of Political Cleavage Structures
The emergence of multi-party systems has come together with a significant reshuffling of
political forces in most Western democracies.14 As shown in Figure 4, traditional socialist and
social democratic parties have seen their average vote share across Western democracies decline
from about 40 percent to 34 percent since the end of World War II, while that received by
Christian and conservative parties has decreased from 38 percent to 30 percent. Communist
parties, who used to gather 7 percent of the vote in the 1940s, have almost completely
disappeared from the political scene. Green and anti-immigration parties made their entry in the
13 We also present in the appendix results on the evolution of the vote by subjective social class, based on questions
asking respondents to self-identify as belonging to the “working class” or “lower class” as compared to “the middle
class” or “the upper class”. In all countries with available data, self-perceived working class voters were
substantially more likely to vote for left-wing parties in the 1950s and 1960s. These divides have monotonically
declined since then, even after controlling for income, education, and other available sociodemographics (see
appendix Figures CF1 and CF2).
14 The United States and the United Kingdom are two exceptions, where the emergence of multi-elite party systems
has entirely occurred within existing parties.
18
political landscape in the 1970s and 1980s and have progressed uninterruptedly since then,
reaching on average 8 percent and 11 percent of votes in the past decade. Support for social-
liberal and liberal parties has remained more stable, even though there are important variations
across countries.
[Figure 4 here]
Figure 5 decomposes our previous income and education indicators for each of these families
of parties in the past decades, revealing the profound transformation in the structure of political
cleavages that took shape between the 1960-1980 period (panel A) and the 2000-2020 period
(panel B). As shown in panel A, in 1960-1980 both top 10% educated voters and top 10%
income voters were significantly less likely to vote for social democratic and socialist parties
and more likely to vote for conservative and Christian parties. By 2000-2020, income continues
to clearly distinguish these two families of parties, but their education gradient has now reached
an average close to zero. Meanwhile, support for anti-immigration and green parties does not
differ significantly across income groups, but it does vary substantially across educational
categories: top 10% educated voters are more likely to vote for green parties by 5 percentage
points and less likely to vote for anti-immigration parties by a comparable amount (out of total
vote shares averaging 8-11%, as shown in Figure 4).
If we combine social democratic, socialist, and green parties on one side and conservative,
Christian, and anti-immigration parties on the other, we get back to our multi-elite party system,
with higher-educated, low-income voters supporting the former and lower-educated, high-
income voters supporting the latter. In other words, the increasing support for green and anti-
immigration parties has clearly contributed to the emergence of multi-elite party systems.
[Figure 5 here]
Figure 6 displays these same indicators for each of the countries in our dataset over the 2010-
2020 period, distinguishing between traditional right-wing and left-wing parties in panel A and
between anti-immigration and green parties in panel B. Two facts clearly stand out from these
figures. First, the two-dimensional structure of political conflict previously documented can be
seen in nearly all countries in our dataset: social democratic and socialist parties systematically

19
make better relative scores among low-income voters, conservative and Christian parties among
high-income voters, anti-immigration parties among lower-educated voters, and green parties
among higher-educated voters.
Secondly, despite these commonalities, there are large differences across countries in these two
indicators. In particular, while nearly all green parties make better scores among higher-
educated voters than among the lower educated, they differ in their tendency to attract low- or
high-income voters. Similarly, anti-immigration parties have attracted a particularly high share
of the lower-educated vote in several Western democracies in the past decade, but we also
observe significant variations in the income profile of far-right voting. These variations are
likely to reflect cross-country differences in political fragmentation and voting systems, which
create different incentives for parties of the traditional left or the traditional right to adapt their
policy proposals in the face of growing electoral competition from new political movements. To
better understand these dynamics and the role of political supply in shaping multi-elite party
systems, we now turn to manifesto data.
[Figure 6 here]
IV. The Origins of Multi-Elite Party Systems: Evidence from Manifesto Data
This section investigates the relationship between the emergence of multi-elite party systems
and ideological polarization by matching our survey dataset with manifesto data. Section IV.A
introduces the Comparative Manifesto Project data and the indicators we consider. Section IV.B
presents our results on the link between political supply and demand.
IV.A. Manifesto Project Data and Methodology
Manifesto Data. To make a first step towards understanding the mechanisms underlying the
emergence of multi-elite party systems, we match our survey dataset with the Comparative
Manifesto Project (CMP: Volkens et al., 2020), a hand-coded historical database on the
programmatic supply of political parties. The CMP is the result of a collective effort to collect
and code the manifestos published by parties just before general elections. Each manifesto is

20
first divided into “quasi-sentences” conveying a specific claim or policy proposal. These quasi-
sentences are then assigned to broad ideological or policy categories using a common coding
scheme. The resulting dataset presents itself in the form of items (such as “social justice” or
“law and order”), with scores corresponding to the share of quasi-sentences dedicated to a
specific issue in a party’s manifesto. The CMP is the largest available database on political
programs in contemporary democracies at the time of writing, and the only one covering nearly
all elections held in our 21 countries of interest since the end of World War II.15
Combination of Manifesto and Survey Data. We proceed by matching one by one every
single party reported in both the CMP and our dataset. This was possible for a total of 459
parties, allowing us to cover over 90% of votes cast in nearly all elections contained in the
survey data (see appendix Figure B1). The remaining correspond either to independent
candidates, or to small parties for which data was not available in the CMP. To the best of our
knowledge, this represents the most comprehensive mapping between political supply and
demand ever built in comparative research.
Indicators of Interest. Following the political science literature, we consider two main
indicators of political supply proposed by Bakker & Hobolt (2013). The indicators correspond
to parties’ positions on two axes of political cleavages: an “economic-distributive” axis
representing class-based divides over economic policy and inequality, and a “sociocultural” axis
mapping conflicts over issues such as law and order, the environment, multiculturalism, or
immigration.
The economic-distributive indicator is equal to the difference between the percentage of “pro-
free-market” statements and “pro-redistribution” statements in a given party’s manifesto. Pro-
redistribution emphases include, among others, the regulation of capitalism, nationalization, or
15 Other available datasets on political supply, such as the Chapel Hill Expert Survey (https://www.chesdata.eu/),
sometimes contain more detailed questions on parties’ orientations. However, they unfortunately do not cover the
decades preceding the 1990s or the 2000s, which is why we do not exploit them in this paper.
21
social justice. Meanwhile, pro-free-market statements encompass references to the limitation of
social services, anti-protectionism, and free enterprise (see appendix Table B1, panel A).
Conversely, the sociocultural indicator is defined as the difference between the percentage of
“liberal” emphases and “conservative” emphases. Conservative emphases include categories
such as political authority, positive evaluations of traditional morality, or negative attitudes
towards multiculturalism; liberal emphases cover issues related to environmentalism, the
protection of underprivileged minority groups, or favorable mentions of multiculturalism (see
appendix Table B1, panel B).
Given that manifesto items sum by definition to 100%, both indicators theoretically range from
-1 to 1, with 1 representing a case of a party exclusively emphasizing pro-free-
market/conservative values, and -1 that of a party exclusively emphasizing pro-
redistribution/liberal values. While these measures of political ideology remain relatively broad
and are not exempt from measurement error given the nature of political manifestos, they
represent the best data at our disposal to study the link between political supply and demand in
the long run.
Let us also stress at this stage that by operating this distinction between economic and
sociocultural dimensions of political conflict, we are not suggesting in any way that
sociocultural divides are purely conflicts over identity or morality, which would be exempt from
material concerns and would naturally oppose “conservative” lower-educated voters to “liberal”
higher-educated individuals. Immigration, environmental, or cultural policies are not only the
subject of conflicts over values: they also have strong distributional implications, for instance
by disproportionally affecting low-skilled workers or by mostly benefitting residents of large
cities, who tend to concentrate a larger share of the higher-educated electorate. In that respect,
the emergence of a secondary dimension of political conflict linked to education should also be
understood as incorporating new cleavages over inequality (including inequalities within the
education system itself, which as we suggested in the introduction could play a key role in
explaining the divergence between a “Brahmin left” and a “Merchant right”).
IV.B. The Evolution of Ideological Polarization

22
How has the structure of economic and sociocultural conflicts changed in Western democracies
since the end of World War II, and to what extent can this account for the emergence of multi-
elite party systems? Table 2 provides a first answer to this question by displaying the evolution
of the average economic-distributive and sociocultural scores of specific families of parties
between 1945 and 2020 (see appendix Figures B2 to B8 for a complete representation of the
political space by decade). Indices are normalized by the average score by decade so as to better
highlight the dynamics of polarization.
Polarization on economic issues has remained remarkably stable in the past decades. The
economic-distributive score of social democratic and socialist parties has remained 9 to 14
points below average, while that of conservative parties has fluctuated between +8 and +11.
Green parties, which started gaining electoral significance at the beginning of the 1980s, have
held economic positions that are comparable to that of traditional left-wing parties. Anti-
immigration parties have moved closer to the average position of conservative parties, after a
period of particularly strong emphasis on pro-free-market policies. This is consistent with
qualitative accounts on the ideological transformation of far-right movements in Western
Europe, from the Freedom Party of Austria (Durrer de la Sota et al., 2021) to the French
Rassemblement National (Piketty, 2018) and the True Finns (Martínez-Toledano & Sodano,
2021), which have increasingly shifted to defending economic redistributive policies in recent
years.
Meanwhile, polarization on the sociocultural axis of political conflict has dramatically risen
since the 1970s, after a brief period of convergence in the early postwar decades. This
polarization has been driven by both old and new parties. Between 1970 and 2020, social
democratic and socialist parties increasingly emphasized liberal issues, as their deviation from
the mean sociocultural score declined linearly from -0.6 to -5.4, while conservative parties
shifted to more conservative positions. Green parties have consistently emphasized liberal issues
to much greater extent than other parties since their emergence in the 1980s, with a stable score
of about -25. Finally, anti-immigration parties have seen their score on the sociocultural axis
surge, from +4 in the 1970s to +20 in the 2010s.
In summary, looking at the supply side suggests that the rise of green and anti-immigration
parties since the 1970s-1980s has not substantially altered the structure of economic conflict in

23
Western democracies, given that these parties have adopted positions on distributive issues that
are comparable to that of the traditional left and the traditional right. It is on the sociocultural
axis that polarization has deepened, as green and anti-immigration parties have emphasized
sociocultural divides to a much greater extent than preexisting political forces.
IV.C. Ideological Polarization and Multi-Elite Party Systems
The stability of economic-distributive conflicts and the rise of sociocultural divides resonates
well with our finding on the stability of the income gradient and the reversal of the educational
cleavage. In particular, if the two phenomena are related, one might expect to observe that (1)
parties with more liberal positions attract a relatively higher share of higher-educated voters, (2)
this relation should rise over time as the sociocultural axis of political conflict gained
prominence, and (3) countries that are more polarized on sociocultural issues should have higher
education gradients, thereby accounting for the cross-country variations documented in section
III.
Figure 7, Panel A provides strong descriptive evidence that the emergence of multi-elite party
systems and the rise of a second dimension of political conflict are tightly associated. The upper
line represents the party-level correlation between the education gradient and the sociocultural
index by decade. This correlation was close to zero and not statistically significant in the 1960s.
It has risen monotonically since then, from 0.1 in the 1970s to 0.3 in the 1990s and finally 0.46
in the past decade (see also appendix Figures B9 to B13, which plot the associated scatter plot
by decade and decompose specific families of parties). Meanwhile, as represented in the bottom
line, the correlation between the income gradient and the position of a given party on the
economic-distributive axis has remained very stable and negative over the entire period.16 In
other words, higher-educated voters have gradually converged in supporting parties with liberal
positions, while high-income voters continue to vote for parties with pro-free-market positions
just as much as they used to in the immediate postwar era. We show in the appendix that this
16 The economic-distributive is reverted here, so as to better highlight its similarity with Figure 1.

24
transformation is robust to controlling for the composition of parties’ electorates in terms of
other variables (age, gender, etc.), as well as to accounting for country, year, and election fixed
effects (see appendix Table B2).
Figure 7, Panel B plots the cross-country relation between a simple measure of ideological
polarization, defined as the standard deviation of the sociocultural index across all parties in a
given election, and the education gradient in the past decade. The relation between the two
indicators is strongly positive: countries in which parties compete more on sociocultural issues
also display a greater propensity of higher-educated voters to support social democratic,
socialist, green, and affiliated parties. In particular, we see that Portugal and Ireland, which were
identified as two exceptions showing no clear trend towards a reversal of the educational
cleavage, are the two countries where sociocultural polarization is today the lowest.17 While the
small number of countries makes it difficult to precisely identify the evolution of this
relationship over time, we also find that it has grown over time, in line with our party-level
analysis (see appendix Figure B14).
[Figure 7 here]
Results combining data on political supply and demand therefore suggest that the emergence of
a new sociocultural axis of political conflict has strongly contributed to the move from “class-
based” to “multi-elite” party systems in Western democracies. As parties have progressively
come to compete on sociocultural issues, electoral behaviors have become growingly clustered
by education group. This relation holds at the country level, with the divergence between
education and income being more pronounced in democracies where parties compete more
fiercely on this new dimension of electoral divides.
17 Notice that the indicator mechanically “overestimates” polarization in highly fragmented party systems such as
that of Denmark, while it underestimates it in countries with few parties such as the United Kingdom, New Zealand,
or the United States. This may explain why these countries have lower levels of sociocultural polarization than one
might expect.

25
V. Electoral Change in Western Democracies: Alternative Explanations and Other
Dimensions of Political Conflict
This section builds on our new dataset on political cleavages in Western democracies to study
alternative explanations of the changing relationship between socioeconomic characteristics and
the vote and analyze other dimensions of political conflict. In particular, we successively
consider generational (section V.I), rural-urban (V.II), religious (V.III), immigration (V.IV),
and gender (V.V) cleavages.
V.I. Generational Cleavages
We first analyze the evolution of the vote by age in the past six decades. We do not find any
evidence that older generations have become more conservative than younger generations.
While there are fluctuations across countries and over time, the gap between the share of young
and old voters supporting left-wing parties has remained remarkably stable on average (see
appendix Figures CA1 to CA4). Nonetheless, we do identify interesting variations in the case
of specific families of parties. The share of votes received by green and new left-wing parties
(such as Die Linke in Germany or Podemos in Spain) is clearly decreasing with age, consistently
with the idea that new generations give greater weight to environmentalism and social-liberal
values (see Figure 8, Panel A). However, we find no evidence of an equally systematic
generational divide when it comes to voting for anti-immigration parties. The share of votes
received by anti-immigration parties increases with age in Denmark, Italy, Norway, New
Zealand, Switzerland, and Sweden, but it clearly decreases in Austria, Spain, Finland, and
France (also see appendix Figures CA5 and CA6).
[Figure 8 here]
These results put into question a strand of the political science literature, first formulated by
Inglehart (1977) and most recently reasserted by Inglehart and Norris (2019), which argues that
political change in Western democracies would have a strong generational dimension. In
particular, Inglehart (1977) developed the “silent revolution” theory according to which new
generations born in the second half of the twentieth century in Western democracies would give

26
greater importance to liberal “post-materialist” values, having been socialized in an era of
unprecedented affluence. Older generations, by contrast, would have remained more likely to
continue upholding conservative values. The replacement of old generations by new ones would
thus lead to a progression in the share of social-liberal citizens and an ever-shrinking share of
conservatives in Western societies. The emergence of populist authoritarian leaders in recent
years would have accordingly represented a conservative response to this sociopolitical
transformation, fueled by feelings of sociocultural anxiety and reinforced by growing material
insecurity linked to globalization and rising inequality (Inglehart & Norris, 2019). Our findings
cast doubt on the idea of a generalized backlash against current social change among older
generations common to all Western democracies. As Figure 8, Panel A shows, nativist parties
have disproportionately attracted younger voters in a number of European countries in the past
decade.
While differences in left-right voting behaviors across cohorts have not changed significantly
in the past decades, political cleavages within cohorts do seem to have played an important role
in generating the reversal of the educational cleavage in Western democracies. Figure 8, Panel
B shows that higher-educated voters have been more likely to vote for social democratic and
affiliated parties than lower-educated voters within generations born after the 1940s, while the
opposite is true among generations born before World War II. New generations have thus
become increasingly divided along educational lines, suggesting that the educational cleavage
is likely to continue rising in the future, as old generations voting along historical class lines
gradually disappear from the political scene. The reversal of the educational cleavage has,
however, also taken place within recent cohorts, which points to the role of other factors
potentially related to political supply or ideological change as documented in Section IV.
[Figure 8 here]
V.II. Rural-Urban Cleavages
We also find that rural-urban divides have remained remarkably stable in the past seven decades.
Despite significant realignments in other dimensions of political conflict, rural areas continue
to be more likely to vote for conservative and affiliated parties by 5 to 15 percentage points in

27
most Western democracies (Figure 9, Panel A). Accordingly, the fragmentation of the political
space in multi-party systems has been associated with a reshuffling of rural-urban divides within
left-right blocs. Historically, left-wing movements arising from the industrial revolution were
more popular among urban manual workers, while farmers remained more faithful to existing
conservative forces; today, support for green parties tends to be concentrated in cities, while
anti-immigration parties generally fare better in rural areas (see appendix Figures CB1 and
CB2). The stability of the rural-urban cleavage thus rules out this regional dimension as an
important driver of the changing relationship between the vote and socioeconomic inequalities
since the end of World War II.
[Figure 9 here]
Several Western democracies, however, seem to have witnessed a significant transformation of
center-periphery cleavages in recent years, as socialist, social-democratic, and green parties
have concentrated a growing share of the vote of capital cities (see appendix Figures CB3 to
CB7). These findings are consistent with the urban economics literature on agglomeration
economies, which documents an increasing concentration of high-skilled individuals in larger
cities and emphasizes the importance of the spatial sorting of talented individuals for overall
welfare and wage inequality (Baum Snow and Pavan, 2013; Baum-Snow et al., 2018; Behrens
et al., 2014; Diamond, 2016; Duranton and Puga, 2004). If this transition were to continue,
cleavages between big cities and peripheral regions could accentuate in the future, as urban areas
continue to concentrate a growing share of the higher-educated electorate.
V.III. Religious-Secular Cleavages
Social democratic and affiliated parties were historically more favorable to preserving the
secular aspect of the State, while conservative and Christian parties traditionally represented the
interests of the Church and religious voters. As secularization advanced in the decades following
World War II, traditional religious affiliations progressively lost importance, leading to the
collapse of Christian Democratic parties in many countries.
Figure 9, Panel B depicts the difference in the share of voters belonging to the religious
majority—Protestants in historically Protestant countries, Catholics in historically Catholic

28
countries, and both Catholics and Protestants in mixed countries—and the share of non-religious
voters or religious minorities voting for left-wing parties between the 1950s and the 2010s. In
all Western democracies with available data, this difference has remained consistently negative:
voters belonging to the religious majority have always been significantly less likely to vote for
left-wing parties. However, this gap has declined, suggesting a gradual weakening of traditional
religious-secular divides. The difference was historically larger in Catholic countries and in
countries with both Catholics and Protestants, but it has also declined faster than in Protestant-
majority countries. These historical differences have been explained by the establishment of
national Churches under state authority in Protestant countries, which limited the importance of
religion as a source of political conflict (Dalton, 1996; Knutsen, 2004).
These results suggest that religious-secular divides have not been a major source of political
realignment in the past decades. While green movements often disproportionately attract non-
religious individuals (see appendix Figure CC4), this does not make them different from
traditional left-wing parties, which have always found greater support among secular voters too.
On the right of the political spectrum, support for anti-immigration parties appears to vary little
across religious groups in most countries (see appendix Figure CC5), so that their progression
in recent decades has further contributed to the weakening of the religious cleavage.
V.IV. Nativist Cleavages: Immigrants and the Muslim Vote
Following the decolonization process, the opening of international borders, the shocks induced
by globalization, and the influx of refugees from war-ridden countries, Western democracies
have seen a gradual increase in migration inflows in the past decades. Many of these immigrants
and their descendants acquired citizenship, allowing them to vote in national elections.
Figure 10, Panel A shows that social democratic and affiliated parties have attracted a significant
share of these new minorities in many Western democracies, but with substantial variations. In
particular, the strength of this new “nativist” cleavage strongly correlates to the salience of
immigration issues and the way they are represented politically. Many of the countries at the top
of the figure have seen the emergence of powerful anti-immigration parties in the past decades,
including Austria, Denmark, France, and Switzerland. Meanwhile, countries with the weakest
29
differences in voting behaviors between natives and immigrants from non-Western
democracies, notably Iceland, Portugal, Australia, and New Zealand, have seen anti-
immigration parties make lower scores at the national level or simply have no such party at all.
Together, these results point to the role of the politicization of immigration in generating new
cleavages over national identity.
[Figure 10 here]
Following 9/11 and the rise of Islamist extremism in the Middle East and other parts of the
world, many anti-immigration and conservative parties gradually shifted at the same time from
opposing immigration in general terms to emphasizing the specific threat that Islam and Muslim
minorities would represent to Western culture (Kallis, 2018). Consistently with the idea that
Muslim voters perceive conservative and anti-immigration parties as particularly hostile to their
integration, we find that they have been substantially more likely to vote for social democratic
and affiliated parties than other voters in the past decade (Figure 10, Panel B). The gap is much
larger than for immigrants as a whole, exceeding 40 percentage points in several countries,
which points to the particular strength of cleavages linked to Muslim communities. Despite low
sample sizes, there are significant variations across countries, which broadly follow the ranking
observed in the case of the immigrant-native cleavage. In France, the only country for which
data on Muslims allows us to go back to the mid-1980s, we find that this divide has dramatically
risen over time (Piketty, 2018: Figure 2.6h).
V.V. Gender Cleavages
Studies carried out through the 1950s to 1970s found that women were more supportive of
conservative parties and less likely to participate in politics than men in Western democracies
(Duverger, 1955; Lipset, 1960). However, this “traditional gender cleavage” has disappeared since
the 1980s and a “modern gender gap” has emerged according to which women have become closer
to social democratic and affiliated parties than men (Inglehart and Norris, 2000). We corroborate
these findings by plotting the difference between the fraction of women and the fraction of men
voting for left-wing parties for each country in our dataset (Figure 11). Whereas this difference
was negative in all countries in the 1950s, it has become gradually positive until reaching 5

30
percentage points on average in the 2010s. Gender differences in voting behavior have thus
progressively realigned in Western democracies.
[Figure 11 here]
The traditional gender gap has been related to structural gender differences in religiosity and
societal assignations, as well as women having more conservative values. (Blondel, 1970;
Goot & Reid, 1984). Figure 11 indeed shows that the traditional gender cleavage was stronger
is countries with pronounced religious cleavages such as France, Spain, and in particular Italy.
After controlling for religiosity and religious affiliation, the traditional gender cleavage shrinks
from -32 percent to -11 percent in the 1950s in Italy and completely disappears in France in the
1960s (see appendix Figure CE1). In contrast, the gender cleavage barely changes after controls
in countries with less important historical religious cleavages, such as Britain and Switzerland,
or with strong class cleavages such as Norway or Finland.
While the dealignment of gender divides has been associated with the weakening of class and
religious cleavages (Dalton, 1996), most explanations of the realignment of women towards
left-wing parties have emphasized structural and sociocultural factors. In the US and Western
Europe, the decline of marriage, the rise of divorce, and the economic fragility of women have
been shown to be important drivers behind the emergence of the modern gender gap
(Abendschön & Steinmetz, 2014; Edlund & Pande, 2002). In Northern Europe, the expansion
of women’s employment in the public sector has also been an important factor behind the
increase in the vote for the left among women in recent decades (Knutsen, 2001; see appendix
Figure CE2). Women have also been more attracted by environmental issues, which have
spurred women’s support for green parties, while anti-immigration parties have generally found
greater support among men (Givens, 2004; see appendix Figures CE3 and CE4). The recent
gender alignment has thus mirrored the reversal of the education cleavage.
VI. Conclusion
The new historical database on political cleavages in 21 Western democracies introduced in this
article reveals some striking facts. In the early postwar decades, social democratic and affiliated

31
parties represented both the low-education and the low-income electorate, while conservative
and affiliated parties represented both high-education and high-income voters. These party
systems have gradually evolved towards “multi-elite party systems” in most Western
democracies, in which higher-educated elites vote for the left, whereas high-income elites still
vote for the right.
Results combining our database on political demand with political supply data from the
Comparative Manifesto Project suggest that the emergence of a new sociocultural axis of
political conflict has strongly contributed to the move from “class-based” to “multi-elite” party
systems in Western democracies. As parties have progressively come to compete on
sociocultural issues, electoral behaviors have become increasingly clustered by education group.
This divergence between education and income has been most pronounced in democracies
where parties compete most fiercely on this new dimension of electoral divides.
While multiple lessons have emerged from this new database, we acknowledge the analysis
remains insufficient and is not exempted from limitations. First, the indicators of political supply
used in this paper and more generally the CMP data capture the tendency of parties to emphasize
specific issues and are therefore unable to perfectly measure their position on these issues.
Moreover, the policy categories coded in the CMP database unfortunately remain very broad,
which precludes us from analyzing in greater detail more specific types of issues such as gender
equality, immigration, trade protectionism, or education policy. Addressing these two
shortcomings would require going back to the original manifestos and derive new indicators
from text analysis or alternative coding techniques.
Secondly, while our descriptive analysis has provided strong suggestive evidence that the
emergence of multi-elite party systems and the rise of a new sociocultural axis of political
conflict were interrelated phenomena, much remains to be understood when it comes to the
mechanisms underlying this transformation. In particular, a promising avenue for future
research lies in establishing more directly the causal impact of political supply on the
transformation of political cleavages. This would require identifying quasi-experimental
settings in which parties exogenously change position on specific issues or suddenly shift to
emphasizing new concerns.

32
Finally, the electoral surveys exploited in this paper rely on samples of a few thousands of voters
available since the end of World War II that are sufficient to reveal major trends at the national
level, but prevent us from carrying more refined and long-run analyses. Other sources and
methods, such as localized election results linked to census data, could be mobilized to broaden
the historical perspective and perform more granular analyses.
All of these issues raise important challenges that we hope will contribute to simulating new
research in these multiple directions.

33
References
S. Abendschön and S. Steinmetz, “The Gender Gap in Voting Revisited: Women's Party
Preferences in a European Context,” Social Politics 21, no. 2 (2014): 315–344.
A. Alesina, R. Baqir, and W. Easterly, “Public Goods and Ethnic Divisions,” The Quarterly
Journal of Economics 114, no. 4 (1999): 1243-1284.
A. Alesina, E. Glaeser, and B. Sacerdote, “Why Doesn’t the United States Have a European-
Style Welfare State?,” Brookings Papers on Economic Activity 2 (2001): 187-278.
Y. Algan, S. Guriev, E. Papaioannou, and E. Passari, “The European Trust Crisis and the Rise
of Populism,” Brookings Papers on Economic Activity (2017): 309-382.
F. Alvaredo, L. Chancel, T. Piketty, E. Saez, and G. Zucman, World Inequality Report 2018
(Harvard University Press, 2018).
D. Autor, D. Dorn, G. Hanson, and K. Majlesi, “Importing Political Polarization? The Electoral
Consequences of Rising Trade Exposure”, American Economic Review 110, no. 10 (2020):
3139-3183.
L. Bauluz, A. Gethin, C. Martínez-Toledano, and M. Morgan, “Historical Political Cleavages
and Post-Crisis Transformations in Italy, Spain, Portugal and Ireland, 1953-2020” (WID.world
Working Paper, 2021).
N. Baum-Snow, and R. Pavan, “Inequality and City Size”, Review of Economics and Statistics
95, no. 5 (2013): 1535-1548.
N. Baum-Snow, M. Freedman, and R. Pavan, “Why has Urban Inequality Increased?,”
American Economic Journal: Applied Economics 10, no. 4 (2018): 1-42.
R. Bakker and S. B. Hobolt, “Measuring Party Positions,” in G. Evans and N. D. de Graaf (ed.),
Political Choice Matters: Explaining the Strength of Class and Religious Cleavages in Cross-
National Perspective (Oxford University Press, 2013).
34
S. O. Becker and T. Fetzer, “Does Migration Cause Extreme Voting?” (CAGE Working Paper,
2016).
S. O. Becker and T. Fetzer, “Why an EU Referendum? Why in 2016?” (Warwick Economics
Research Paper Series, 2018).
S. O. Becker, T. Fetzer, and D. Novy, “Who Voted for Brexit? A Comprehensive District-Level
Analysis,” Economic Policy 32, no. 92 (2017): 601-650.
K. Behrens, G. Duranton, and F. Robert-Nicoud, “Productive cities: Sorting, Selection, and
Agglomeration”, Journal of Political Economy 122, no. 3 (2014): 507-553.
J. Blondel, Votes, Parties and Leaders (Penguin, 1970).
S. Bornshier, Cleavage Politics and the Populist Right (Temple University Press, 2010).
S. Bornschier, “The New Cultural Divide and the Two-Dimensional Political Space in Western
Europe,” West European Politics 33, no. 3 (2010): 419–444.
C. M. Bosancianu, True OECD Voter, 2017, https://cmbosancianu.github.io/data/tov.html.
M. Bovens and A. Wille, “Education: The Contours of a New Cleavage? Comparing 23
European Countries,” in Stabiliteit en verandering in Europa, ed. K. Aarts and M. Wittenberg
(DANS, 2012).
I. Colantone and P. Stanig, “Global Competition and Brexit,” American Political Science
Review 112, no. 2 (2018): 201-218.
I. Colantone and P. Stanig, “The Trade Origins of Economic Nationalism: Import Competition
and Voting Behavior in Western Europe,” American Journal of Political Science 62, no. 4
(2018): 936-953.
I. Colantone and P. Stanig, “The Surge of Economic Nationalism in Western Europe,” Journal
of Economic Perspectives 33, no. 4 (2019): 128-151.

35
R. J. Dalton, “Political Cleavages, Issues, and Electoral Change,” in Comparing Democracies:
Elections and Voting in Global Perspective, ed. L. LeDuc, R. G. Niemi, and P. Norris (Sage,
1996).
R. J. Dalton, Political Realignment: Economics, Culture, and Electoral Change (Oxford
University Press, 2018).
S. H. Dehdari, “Economic Distress and Support for Radical Right Parties - Evidence from
Sweden,” Comparative Political Studies, forthcoming 2021.
R. Diamond, “The Determinants and Welfare Implications of US Workers’ Diverging Location
Choices by Skill: 1980-2000”, American Economic Review 106, no. 3 (2016): 479-524.
M. Dolezal, “Exploring the Stabilization of a Political Force: The Social and Attitudinal Basis
of Green Parties in the Age of Globalization,” West European Politics 33, no. 3 (2010): 534–
552.
G. Duranton, and D. Puga, “Micro-Foundations of Urban Agglomeration Economies,” in
Handbook of regional and urban economics, vol. 4 (Elsevier, 2004): 2063-2117.
C. Durrer, A. Gethin, and C. Martínez-Toledano, “Party System Transformation and the
Structure of Political Cleavages in Austria, Belgium, the Netherlands and Switzerland, 1967-
2019” (WID.world Working Paper, 2021).
C. Dustmann, K. Vasiljeva, and A. P. Damm, “Refugee Migration and Electoral Outcomes,”
The Review of Economic Studies 86, no. 5 (2019): 2035-2091.
M. Duverger, The Political Role of Women (Unesco, 1955).
L. Edlund and R. Pande, “Why have Women become Left-wing? The Political Gender Gap and
the Decline in Marriage,” The Quarterly Journal of Economics 117, no. 3 (2002): 917–961.
B. Enke, “Moral Values and Voting,” Journal of Political Economy 128, no. 10 (2020): 3679-
3729.

36
G. Evans and J. Tilley (ed.), Political Choice Matters: Explaining the Strength of Class and
Religious Cleavages in Cross-National Perspective (Oxford University Press, 2013).
T. Fetzer, “Did Austerity Cause Brexit?,” American Economic Review 109, no. 11 (2019): 3849-
3886.
M. Franklin, T. Hackie, H. Valen, et al., Electoral Change: Responses to Evolving Attitudinal
Structures in Western Countries (Cambridge University Press, 1992).
M. Funke, M. Schularick, and C. Trebesh, “Going to Extremes: Politics after Financial Crises,
1870–2014,” European Economic Review 88 (2016): 227-260.
N. Gennaioli and G. Tabellini, “Identity, Beliefs, and Political Conflict” (SSRN Working Paper,
2019).
A. Gethin, “Political Cleavages, Class Structures and the Politics of Old and New Minorities in
Australia, Canada, and New Zealand 1963-2019” (WID.world Working Paper, 2021).
A. Gethin, C. Martínez-Toledano, and T. Piketty, Political Cleavages and Social Inequalities.
A Study of 50 Democracies, 1948-2020 (Harvard University Press, forthcoming 2021).
T. E. Givens, “The Radical Right Gender Gap,” Comparative Political Studies 37, no. 1 (2004):
30-54.
M. Goot and E. Reid, “Women: If Not Apolitical, Then Conservative,” in Women and the Public
Sphere, ed. J. Siltanen and M. Stanworth (Hutchinson, 1984).
L. Guizo, H. Herrera, M. Morelli, and T. Sonno, “Economic Insecurity and the Demand of
Populism in Europe” (Working Paper, 2020).
M. Halla, A. F. Wagner, and J. Zweimüller, “Immigration and Voting for the Far Right,” Journal
of the European Economic Association 15, no. 6 (2017): 1341-1385.
R. Inglehart, Culture Shift in Advanced Industrial Society (Princeton University Press, 1990).
37
R. Inglehart, The Silent Revolution: Changing Values and Political Styles Among Western
Publics (Princeton University Press, 1977).
R. Inglehart and P. Norris, “The Developmental Theory of the Gender Gap: Women’s and
Men’s Voting Behavior in Global Perspective,” International Political Science Review 21, no.
4 (2000): 441–463.
A. Kallis, “The Radical Right and Islamophobia,” in The Oxford Handbook of the Radical Right,
ed. J. Rydgren (Oxford University Press, 2018).
H. Kitschelt, The Transformation of European Social Democracy (Cambridge University Press,
1994).
O. Knutsen, “Social Class, Sector Employment, and Gender as Party Cleavages in the
Scandinavian Countries: A Comparative Longitudinal Study, 1970–95,” Scandinavian Political
Studies 24, no. 4 (2001): 311–350.
O. Knutsen, Social Structure and Party Choice in Western Europe: A Comparative Longitudinal
Study (Springer, 2004).
F. Kosse and T. Piketty, “Electoral Cleavages and Socioeconomic Inequality in Germany 1949-
2017” (WID.world Working Paper, 2020).
H. Kriesi, E. Grande, R. Lachat, M. Dolezal, S. Bornschier, and T. Frey, West European Politics
in the Age of Globalization (Cambridge University Press, 2008).
F. Liberini, A. J. Oswald, E. Proto, and M. Redoano, “Was Brexit Triggered by the Old and
Unhappy? Or by Financial Feelings?,” Journal of Economic Behavior & Organization 161
(2019): 287-302.
S. M. Lipset, Political Man: the Social Bases of Politics (Doubleday, 1960).
C. Malgouyres, “Trade Shocks and Far-Right Voting: Evidence from French Presidential
Elections” (EUI Working Paper, 2017).
38
C. Martínez-Toledano and A. Sodano, “Changing Party Systems, Socioeconomic Cleavages,
and Nationalism in Northern Europe, 1956-2017” (WID.world Working Paper, 2021).
P. Norris and R. Inglehart, Cultural Backlash. Trump, Brexit, and Authoritarian Populism
(Cambridge University Press, 2019).
E. Önudottir, H. Schmitt, F. Vegetti et al., The New European Voter database, GESIS Data
Archive, 2017.
T. Piketty, “Social Mobility and Redistributive Politics,” Quarterly Journal of Economics 110,
no. 3 (1995): 551-584.
T. Piketty, “Brahmin Left vs Merchant Right: Rising Inequality & the Changing Structure of
Political Conflict (Evidence from France, Britain and the US, 1948-2017)” (WID.world
Working Paper, 2018).
T. Piketty, Capital and Ideology, Harvard University Press, 2020.
J. E. Roemer, “Why the Poor do not Expropriate the Rich: An Old Argument in New Garb,”
Journal of Public Economics 70, no. 3 (1998): 399-424.
J. E. Roemer, W. Lee, and K. Van der Straeten, Racism, Xenophobia, and Distribution. Multi-
Issue Politics in Advanced Democracies (Harvard University Press, 2007).
R. Stubager, “The Development of the Education Cleavage: Denmark as a Critical Case,” West
European Politics 33, no. 3 (2010): 505–533.
M. Tabellini, “Gifts of the Immigrants, Woes of the Natives: Lessons from the Age of Mass
Migration,” The Review of Economic Studies 87, no. 1 (2020): 454-486.
J. Thomassen (ed.), The European Voter: A Comparative Study Of Modern Democracies
(Oxford University Press, 2005).
J. van der Wall, P. Achterberg, and D. Houtman, “Class Is Not Dead—It Has Been Buried Alive:
Class Voting and Cultural Voting in Postwar Western Societies (1956–1990),” Politics and
Society 35, no. 3 (2007): 403–426.

39
M. Young, The Rise of the Meritocracy, 1870-2033: An Essay on Education and Inequality,
Penguin, 1958
A. Volkens, T. Burst, W. Krause, P. Lehmann, T. Matthieß, N. Merz, S. Regel, B. Weßels, and
L. Zehnter, The Manifesto Data Collection. Manifesto Project (MRG/CMP/MARPOR), Version
2020b, https://manifesto-project.wzb.eu/datasets, 2020.
J. M. Wooldridge, Econometric Analysis of Cross Section and Panel Data, MIT Press, 2002.

Time period Elections Main data source Data qualityAvg. sample
size
Australia 1963-2019 18 Australian Election Studies High 2382
Austria 1971-2017 10 Eurobarometers, European Social Survey Medium 3831
Belgium 1971-2014 14 Belgian National Election Study High 4817
Canada 1963-2019 17 Canadian Election Studies High 3302
Denmark 1960-2015 21 Danish Election Studies High 2819
Finland 1972-2015 11 Finnish Voter Barometers High 2452
France 1956-2017 17 French Election Studies High 3208
Germany 1949-2017 19 German Federal Election Studies High 2782
Iceland 1978-2017 12 Icelandic National Election Studies High 1488
Ireland 1973-2020 13 Eurobarometers, European Social Survey Medium 7115
Italy 1953-2018 14 Italian National Election Studies High 2147
Luxembourg 1974-2018 9 Eurobarometers, European Election Studies Low 3890
Netherlands 1967-2017 15 Dutch Parliamentary Election Studies High 2068
New Zealand 1972-2017 16 New Zealand Election Studies High 2555
Norway 1957-2017 15 Norwegian Election Studies High 1964
Portugal 1983-2019 10 Portuguese Election Studies High 1822
Spain 1979-2019 14 CIS Election Surveys High 8996
Sweden 1956-2014 19 Swedish National Election Studies High 3088
Switzerland 1967-2019 14 Swiss Election Studies High 3328
United Kingdom 1955-2017 16 British Election Studies High 5262
United States 1948-2020 18 American National Election Studies High 2179
Table 1 - A New Dataset on Political Cleavages in Western Democracies, 1948-2020
Source: authors' elaboration.
Note: the table presents, for each country, the time coverage of the dataset, the number of elections covered, the main data source used, the
quality of electoral surveys, and the average sample size of these surveys.

Social
DemocratsConservatives Anti-immigration Greens
Social
DemocratsConservatives Anti-immigration Greens
1945-59 -12,3 11,2 -2,2 2,2
1960-69 -9,1 9,2 -1,1 0,9
1970-79 -9,3 8,8 17,6 -0,6 0,6 3,9
1980-89 -10,9 10,9 15,8 -8,5 -1,9 2,5 3,4 -24,1
1990-99 -9,9 8,2 11,6 -11,5 -3,6 5,2 7,1 -25,4
2000-09 -9,4 8,1 10,4 -6,8 -4,9 6,3 11,2 -24,8
2010-20 -13,5 11,2 8,7 -11,2 -5,4 4,4 20,4 -25,1
Economic-distributive index Sociocultural index
Table 2 - Ideological polarization in Western democracies, 1945-2020
Source: authors' computations using the Comparative Manifesto Project database.
Note: the table displays the average economic-distributive and sociocultural scores by decade for four families of parties across all Western
democracies: social democratic, socialist and other left-wing parties; conservative, Christian democratic, and liberal parties; anti-immigration parties;
and green parties. Negative values on the economic-distributive index correspond to greater proportions of pro-redistribution emphases relatively to
pro-free-market emphases in party manifestos. Negative values on the sociocultural index correspond to greater proportions of liberal emphases
relatively to conservative emphases. Indices are normalized by the average score by decade so as to better highlight the dynamics of polarization.

-18-16-14-12-10-8-6-4-202468
1012141618
1960-64 1965-69 1970-74 1975-79 1980-84 1985-89 1990-94 1995-99 2000-04 2005-09 2010-14 2015-20
Figure 1 - The emergence of multi-elite party systems in Western democracies
Difference between (% of top 10% educated voting left) and(% of bottom 90% educated voting left)
Difference between (% of top 10% earners voting left) and(% of bottom 90% earners voting left)
Source: authors' computations using the World Political Cleavages and Inequality Database.Note: in the 1960s, both higher-educated and high-income voters were less likely to vote for left-wing (democratic / labor / social-democratic / socialist / green) parties than lower-educated and low-income voters by more than 10 percentage points. The left vote hasgradually become associated with higher education voters, giving rising to a "multi-elite party system". Figures correspond to five-yearaverages for Australia, Britain, Canada, Denmark, France, Germany, Italy, the Netherlands, Norway, Sweden, Switzerland, and the US.Estimates control for income/education, age, gender, religion, church attendance, rural/urban, region, race/ethnicity, employmentstatus, and marital status (in country-years for which these variables are available).
Higher-educated voters voting for left-wing parties (democratic, labor, social-democratic, socialist, green, etc.)
Top-income voters voting for right-wingparties (other parties)

-40
-35
-30
-25
-20
-15
-10
-5
0
5
10
15
20
25
30
1950-59 1960-69 1970-79 1980-89 1990-99 2000-09 2010-20
Figure 2 - The reversal of educational divides in Western democracies.Panel A. English-speaking and Northern European countries
Australia Britain Canada
Denmark Finland Iceland
Ireland New Zealand Norway
Sweden United States Average
Source: authors' computations using the World Political Cleavages and Inequality Database.Note: the figure represents the difference between the share of higher-educated (top 10%) and lower-educated (bottom 90%) votersvoting for democratic / labor / social democratic / socialist / green parties in English-speaking and Northern European countries. Innearly all countries, higher-educated voters used to be significantly more likely to vote for conservative parties and have graduallybecome more likely to vote for these parties. Estimates control for income, age, gender, religion, church attendance, rural/urban,region, race/ethnicity, employment status, and marital status (in country-years for which these variables are available).
Ireland
United States
Canada

-40
-35
-30
-25
-20
-15
-10
-5
0
5
10
15
20
25
30
1950-59 1960-69 1970-79 1980-89 1990-99 2000-09 2010-20
Figure 2 - The reversal of educational divides in Western democracies.Panel B. Continental and Southern European countries
Austria Belgium France
Germany Italy Luxembourg
Netherlands Portugal Spain
Switzerland Average
Source: authors' computations using the World Political Cleavages and Inequality Database.Note: the figure represents the difference between the share of higher-educated (top 10%) and lower-educated (bottom 90%) votersvoting for democratic / labor / social democratic / socialist / green parties in Continental and Southern European countries. In nearly allcountries, higher-educated voters used to be significantly more likely to vote for conservative parties and have gradually become morelikely to vote for these parties. Estimates control for income, age, gender, religion, church attendance, rural/urban, region,race/ethnicity, employment status, and marital status (in country-years for which these variables are available).
Switzerland
Portugal
Spain
France
Netherlands

-30
-25
-20
-15
-10
-5
0
5
10
15
1950-59 1960-69 1970-79 1980-89 1990-99 2000-09 2010-20
Figure 3 - The stability/decline of income divides in Western democracies.Panel A. English-speaking and Northern European countries
Australia Britain Canada Denmark
Finland Iceland Ireland New Zealand
Norway Sweden United States Average
Source: authors' computations using the World Political Cleavages and Inequality Database.Note: the figure represents the difference between the share of high-income (top 10%) and low-income (bottom 90%) voters voting fordemocratic / labor / social democratic / socialist / green parties in English-speaking and Northern European countries. In all countries,top-income voters have remained significantly less likely to vote for these parties than low-income voters. Estimates control foreducation, age, gender, religion, church attendance, rural/urban, region, race/ethnicity, employment status, and marital status (incountry-years for which these variables are available).
UnitedStates
SwedenAustralia
United States

-30
-25
-20
-15
-10
-5
0
5
10
15
1950-59 1960-69 1970-79 1980-89 1990-99 2000-09 2010-20
Figure 3 - The stability/decline of income divides in Western democracies.Panel B. Continental and Southern European countries
Austria Belgium France Germany Italy Luxembourg
Netherlands Portugal Spain Switzerland Average
Source: authors' computations using the World Political Cleavages and Inequality Database.Note: the figure represents the difference between the share of high-income (top 10%) and low-income (bottom 90%) voters voting fordemocratic / labor / social democratic / socialist / green parties in Continental and Southern European countries. In all countries, top-income voters have remained significantly less likely to vote for these parties than low-income voters. Estimates control for education,age, gender, religion, church attendance, rural/urban, region, race/ethnicity, employment status, and marital status (in country-years forwhich these variables are available).
Germany
Italy
Germany

0%
10%
20%
30%
40%
50%
60%
70%
80%
90%
100%
1945-49 1950-59 1960-69 1970-79 1980-89 1990-99 2000-09 2010-20
Figure 4 - The transformation of Western party systems, 1945-2020
Source: authors' computations using official election results data.Note: the figure represents the average share of votes received by selected families of political parties in Western democracies betweenthe 1940s and the 2010s. Communist parties saw their average scores collapse from 7% to less than 0.5%, while green and anti-immigration parties have risen until reaching average vote shares of 8% and 11% respectively. Decennial averages over all Westerndemocracies except Spain and Portugal (no democratic elections before 1970s) and the United States and the United Kingdom (two-party systems).
Social Democrats / Socialists / Other left
Conservatives / Christian Democrats
Communists
Liberals / Social-liberals
Greens
Anti-immigration
Other
8%
11%
7%
10%
34%
30%

-15
-10
-5
0
5
10
15
-15 -10 -5 0 5 10 15
Re
lative
su
pp
ort
am
on
g to
p-in
co
me
vo
ters
Relative support among higher-educated voters
Figure 5 - The fragmentation of Western cleavage structures.Panel A. 1960-1980
Source: authors' computations using the World Political Cleavages and Inequality Database.Note: the figure represents the difference between the share of high-income (top 10%) and low-income (bottom 90%) voters voting forselected groups of parties on the y-axis, and the same difference between higher-educated (top 10%) and lower-educated (bottom90%) voters on the x-axis. In the 1960s-1980s, socialist and social democratic parties were supported by both low-income and lower-educated voters, while conservative, Christian, and liberal parties were supported by both high-income and higher-educated voters.Averages over all Western democracies. Estimates control for income/education, age, gender, religion, church attendance, rural/urban,region, race/ethnicity, employment status, and marital status (in country-years for which these variables are available).
ConservativesChristian DemocratsLiberals / Social-liberals
High incomeLow education
Low incomeLow education
High incomeHigh education
Low incomeHigh education
Social DemocratsSocialistsOther left

-15
-10
-5
0
5
10
15
-15 -10 -5 0 5 10 15
Re
lative
su
pp
ort
am
on
g to
p-in
co
me
vo
ters
Relative support among higher-educated voters
Figure 5 - The fragmentation of Western cleavage structures.Panel B. 2000-2020
Source: authors' computations using the World Political Cleavages and Inequality Database.Note: the figure represents the difference between the share of high-income (top 10%) and low-income (bottom 90%) voters voting forselected groups of parties on the y-axis, and the same difference between higher-educated (top 10%) and lower-educated (bottom90%) voters on the x-axis. Education most clearly distinguishes anti-immigration from green parties, while income most clearlydistinguishes conservative and Christian parties from socialist and social-democratic parties. Averages over all Western democracies.Estimates control for income/education, age, gender, religion, church attendance, rural/urban, region, race/ethnicity, employment status,and marital status (in country-years for which these variables are available).
Social Dem.SocialistsOther left
ConservativesChristian DemocratsLiberals / Social-liberals
GreensAnti-immigration
ConservativesChristian DemocratsLiberals / Social-lib.Anti-immigration
Social Dem.SocialistsGreens
Other left
High incomeLow education
Low incomeLow education
High incomeHigh education
Low incomeHigh education
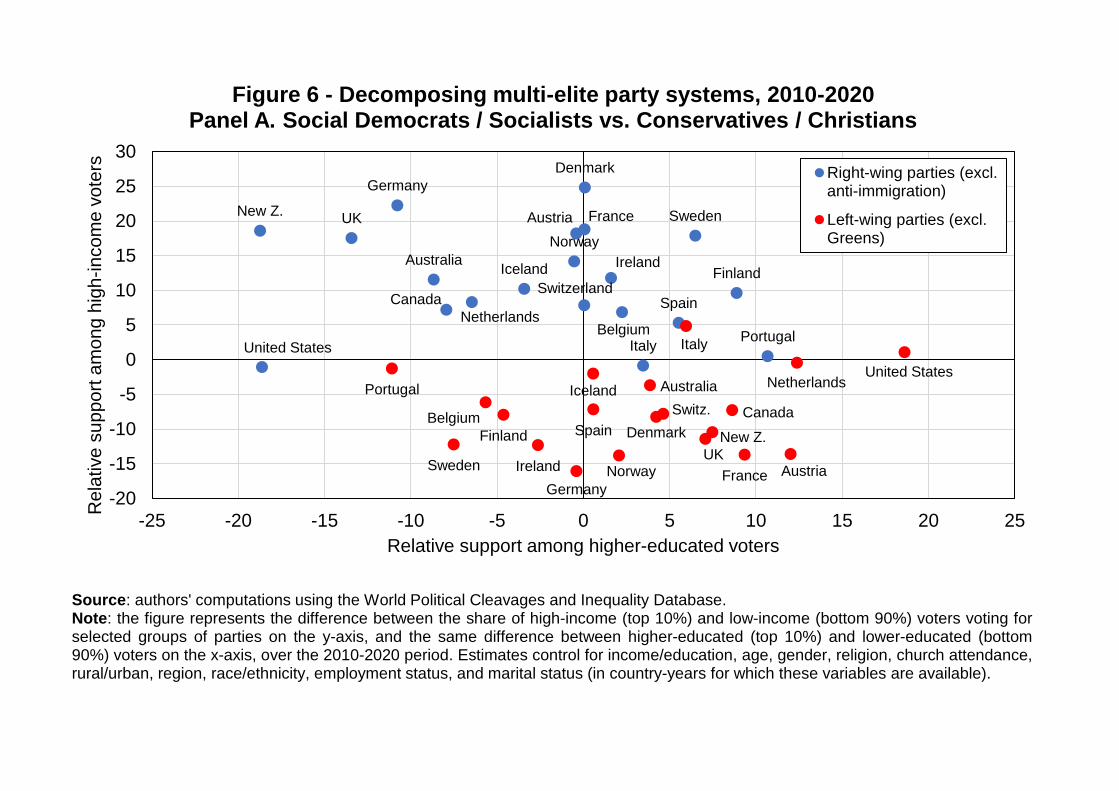
Austria
Australia
Belgium
CanadaSwitzerland
Germany
Denmark
Spain
Finland
FranceUK
IrelandIceland
Italy
Netherlands
Norway
New Z.
Portugal
Sweden
Austria
Australia
Belgium CanadaSwitz.
Germany
DenmarkSpainFinland
France
UKIreland
Iceland
Italy
Netherlands
Norway
New Z.
Portugal
Sweden
-20
-15
-10
-5
0
5
10
15
20
25
30
-25 -20 -15 -10 -5 0 5 10 15 20 25
Rela
tive s
upport
am
ong h
igh-incom
e v
ote
rs
Relative support among higher-educated voters
Figure 6 - Decomposing multi-elite party systems, 2010-2020Panel A. Social Democrats / Socialists vs. Conservatives / Christians
Right-wing parties (excl.anti-immigration)
Left-wing parties (excl.Greens)
Source: authors' computations using the World Political Cleavages and Inequality Database.Note: the figure represents the difference between the share of high-income (top 10%) and low-income (bottom 90%) voters voting forselected groups of parties on the y-axis, and the same difference between higher-educated (top 10%) and lower-educated (bottom90%) voters on the x-axis, over the 2010-2020 period. Estimates control for income/education, age, gender, religion, church attendance,rural/urban, region, race/ethnicity, employment status, and marital status (in country-years for which these variables are available).
United States
United States
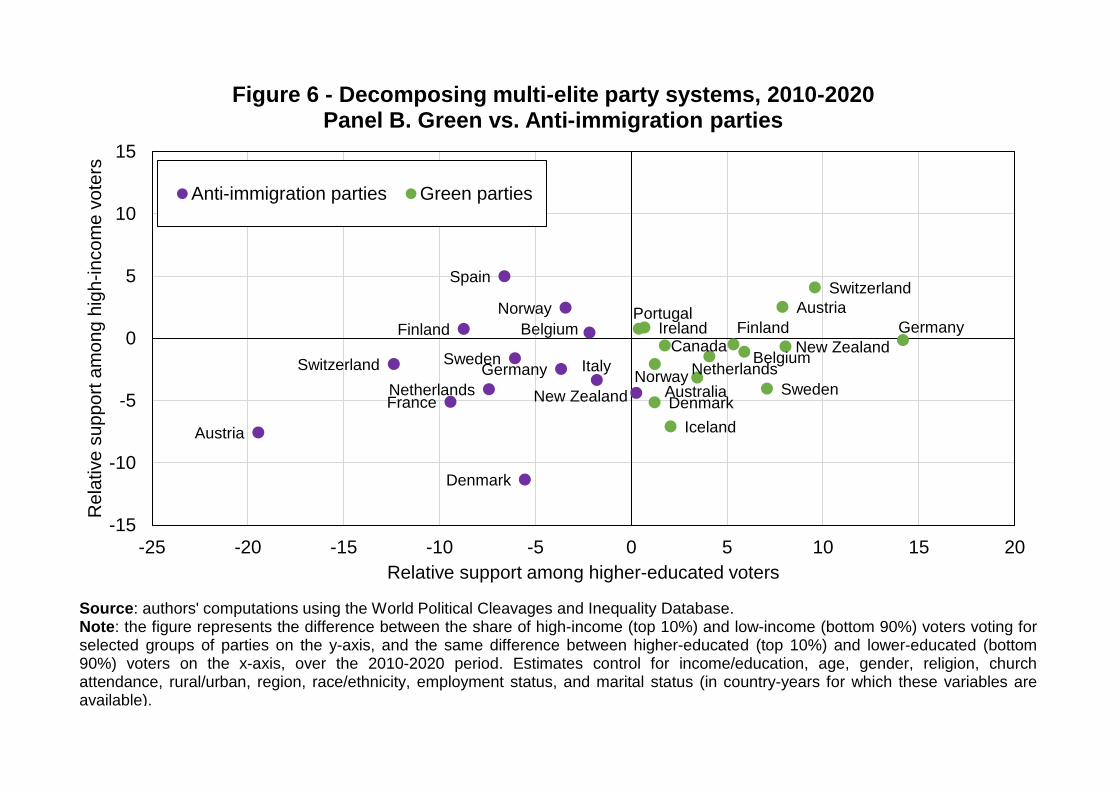
Austria
Belgium
Switzerland Germany
Denmark
Spain
Finland
France
Italy
Netherlands
Norway
New Zealand
Sweden
Austria
Australia
BelgiumCanada
Switzerland
Germany
Denmark
FinlandIreland
Iceland
NetherlandsNorway
New Zealand
Portugal
Sweden
-15
-10
-5
0
5
10
15
-25 -20 -15 -10 -5 0 5 10 15 20
Rela
tive s
upport
am
ong h
igh-incom
e v
ote
rs
Relative support among higher-educated voters
Figure 6 - Decomposing multi-elite party systems, 2010-2020Panel B. Green vs. Anti-immigration parties
Anti-immigration parties Green parties
Source: authors' computations using the World Political Cleavages and Inequality Database.Note: the figure represents the difference between the share of high-income (top 10%) and low-income (bottom 90%) voters voting forselected groups of parties on the y-axis, and the same difference between higher-educated (top 10%) and lower-educated (bottom90%) voters on the x-axis, over the 2010-2020 period. Estimates control for income/education, age, gender, religion, churchattendance, rural/urban, region, race/ethnicity, employment status, and marital status (in country-years for which these variables areavailable).

-0,6
-0,5
-0,4
-0,3
-0,2
-0,1
0
0,1
0,2
0,3
0,4
0,5
0,6
0,7
1960-69 1970-79 1980-89 1990 2000-09 2010-20
Figure 7 - Multi-elite party systems and ideological polarizationPanel A. Party ideology, income, and education
Correlation between education gradient and sociocultural position
Correlation between income gradient and economic-distributive position
Source: authors' computations combining the World Political Cleavages and Inequality Database with Manifesto Project data.Note: the upper lines plots the raw correlation between the education gradient (defined as the share of top 10% educated voters withinthe electorate of a given party) and the sociocultural index. The bottom line plots the raw correlation between the income gradient(defined as the share of top 10% income voters within the electorate of a given party) and the economic-distributive index (inverted, sothat higher values correspond to greater pro-redistribution emphases). Error bars represent 95% confidence intervals.
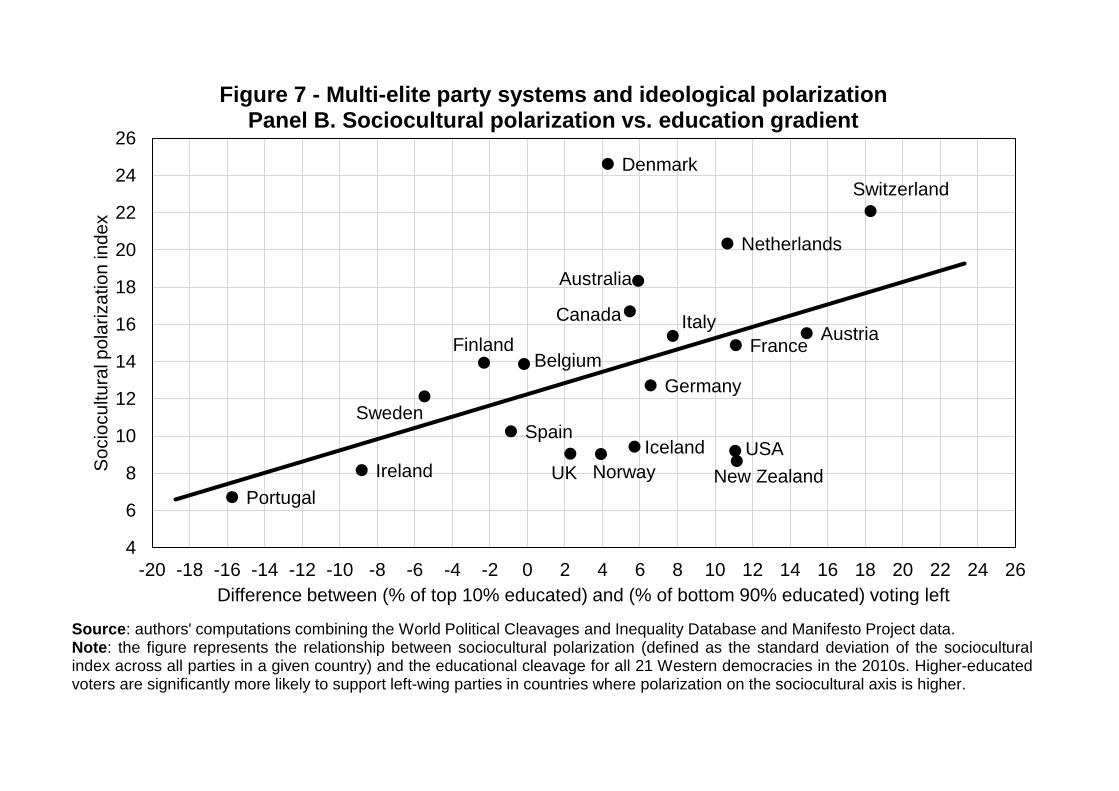
Austria
Australia
Belgium
Canada
Switzerland
Germany
Denmark
Spain
Finland France
UKIreland
Iceland
Italy
Netherlands
Norway New ZealandPortugal
Sweden
USA
4
6
8
10
12
14
16
18
20
22
24
26
-20 -18 -16 -14 -12 -10 -8 -6 -4 -2 0 2 4 6 8 10 12 14 16 18 20 22 24 26
So
cio
cu
ltu
ral p
ola
riza
tio
n in
de
x
Difference between (% of top 10% educated) and (% of bottom 90% educated) voting left
Figure 7 - Multi-elite party systems and ideological polarizationPanel B. Sociocultural polarization vs. education gradient
Source: authors' computations combining the World Political Cleavages and Inequality Database and Manifesto Project data.Note: the figure represents the relationship between sociocultural polarization (defined as the standard deviation of the socioculturalindex across all parties in a given country) and the educational cleavage for all 21 Western democracies in the 2010s. Higher-educatedvoters are significantly more likely to support left-wing parties in countries where polarization on the sociocultural axis is higher.

5%
10%
15%
20%
25%
30%
35%
20 25 30 35 40 45 50 55 60 65 70
Age
Figure 8 - Generational cleavagesPanel A. Generational cleavages and party system fragmentation
Green parties
New left (Germany, Spain, France, Portugal, Norway)
Anti-immigration (Switzerland, Denmark, Norway, New Zealand, Sweden)
Anti-immigration (Austria, Spain, Finland, France)
Source: authors' computations using the World Political Cleavages and Inequality Database.Note: the figure represents the share of votes received by selected groups of parties in Western democracies by age in the last electionavailable. Green parties and "New left" parties (Die Linke, Podemos, France Insoumise, Bloco de Esquerda, Norwegian Socialist LeftParty) make much higher scores among the youth than among older generations. By contrast, there is no clear age profile in the case offar-right or anti-immigration parties. 20 correponds to voters aged 20 or younger; 70 corresponds to voters 70 or older.
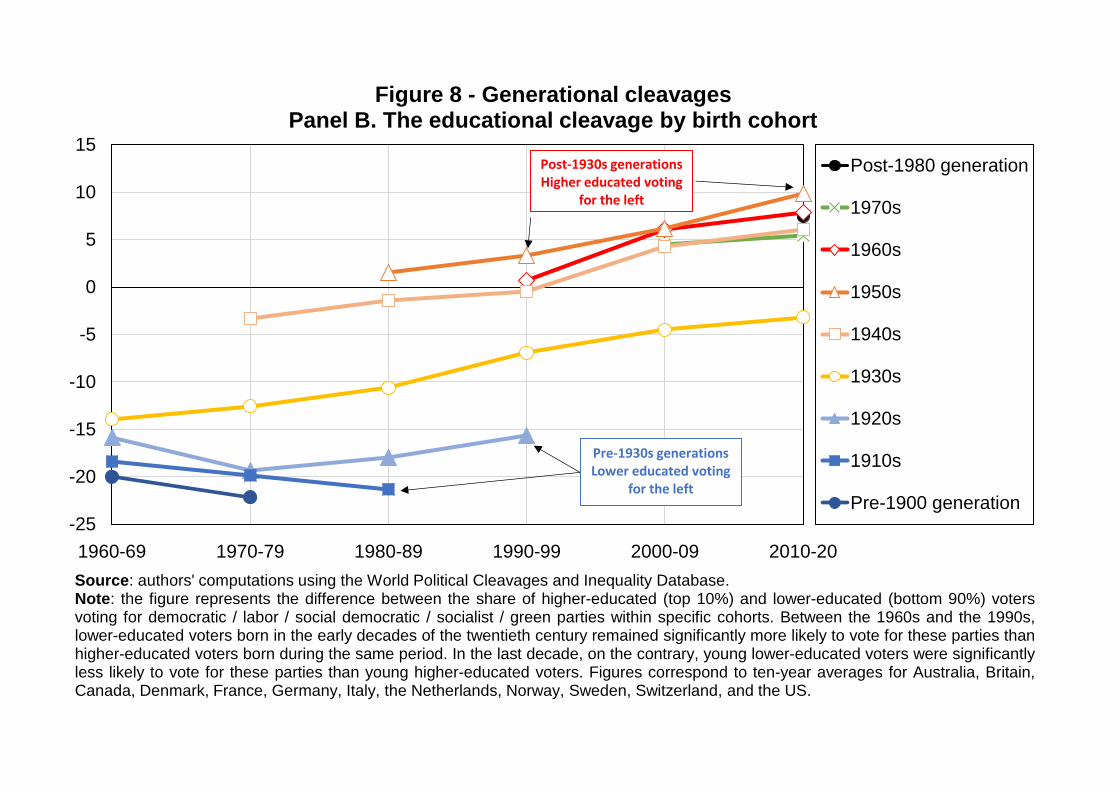
-25
-20
-15
-10
-5
0
5
10
15
1960-69 1970-79 1980-89 1990-99 2000-09 2010-20
Figure 8 - Generational cleavagesPanel B. The educational cleavage by birth cohort
Post-1980 generation
1970s
1960s
1950s
1940s
1930s
1920s
1910s
Pre-1900 generation
Source: authors' computations using the World Political Cleavages and Inequality Database.Note: the figure represents the difference between the share of higher-educated (top 10%) and lower-educated (bottom 90%) votersvoting for democratic / labor / social democratic / socialist / green parties within specific cohorts. Between the 1960s and the 1990s,lower-educated voters born in the early decades of the twentieth century remained significantly more likely to vote for these parties thanhigher-educated voters born during the same period. In the last decade, on the contrary, young lower-educated voters were significantlyless likely to vote for these parties than young higher-educated voters. Figures correspond to ten-year averages for Australia, Britain,Canada, Denmark, France, Germany, Italy, the Netherlands, Norway, Sweden, Switzerland, and the US.
Pre-1930s generationsLower educated voting
for the left
Post-1930s generationsHigher educated voting
for the left

-30
-25
-20
-15
-10
-5
0
5
10
15
1950-59 1960-69 1970-79 1980-89 1990-99 2000-09 2010-20
Figure 9 - Religious and rural-urban cleavagesPanel A. The rural-urban divide
Australia Austria Canada Denmark Finland France
Iceland Italy Luxembourg Netherlands New Zealand Norway
Portugal Spain Sweden Switzerland United States Average
Source: authors' computations using the World Political Cleavages and Inequality Database.Note: the figure displays the difference between the share of rural areas and the share of urban areas voting for democratic / labor /social democratic / socialist / green parties. In all countries, rural areas have remained significantly less likely to vote for these partiesthan cities, with no clear trend over time. Estimates control for income, education, age, gender, employment status, and marital status(in country-years for which these variables are available).
Switzerland
Italy
France

-50
-40
-30
-20
-10
0
10
20
1950-59 1960-69 1970-79 1980-89 1990-99 2000-09 2010-20
Figure 9 - Religious and rural-urban cleavagesPanel B. The religious divide
Australia Belgium Britain Canada France Germany
Italy Luxembourg Netherlands New Zealand Portugal Spain
Sweden Switzerland United States Average
Source: authors' computations using the World Political Cleavages and Inequality Database.Note: the figure displays the difference between the share of Catholics (or Catholics and Protestants in mixed countries) declaring goingto church at least once a year and the share of other voters voting for democratic / labor / social democratic / socialist / green parties. Inall countries, religious voters have remained significantly less likely to vote for these parties than other voters.
Italy
Spain
New Zealand
United States

-5
0
5
10
15
20
25
30
35
40
45
Figure 10 - The nativist cleavagePanel A. The native-immigrant cleavage
Source: authors' computations using the World Political Cleavages and Inequality Database and the European Social Survey forDenmark, Finland, Germany, Italy, Norway, Spain, Sweden, Switzerland, and the United Kingdom.Note: the figure represents the difference between the share of voters born in non-Western countries (all countries excluding Europe,Australia, New Zealand, Canada, and the United States) and the share of natives (voters born in the country considered) voting fordemocratic / labor / social democratic / socialist / green parties over the 2010-2020 period. In nearly all Western countries, immigrantsare much more likely to vote for these parties than natives. US and Iceland figures include voters born in Western countries given lackof data on exact country of origin. Excludes Fianna Fáil in Ireland.
Denmark: immigrants more likely to vote forsocial democratic / socialist / green partiesby 39 percentage points
Iceland, Finland, Portugal, Australia:immigrants not voting for differentparties than natives
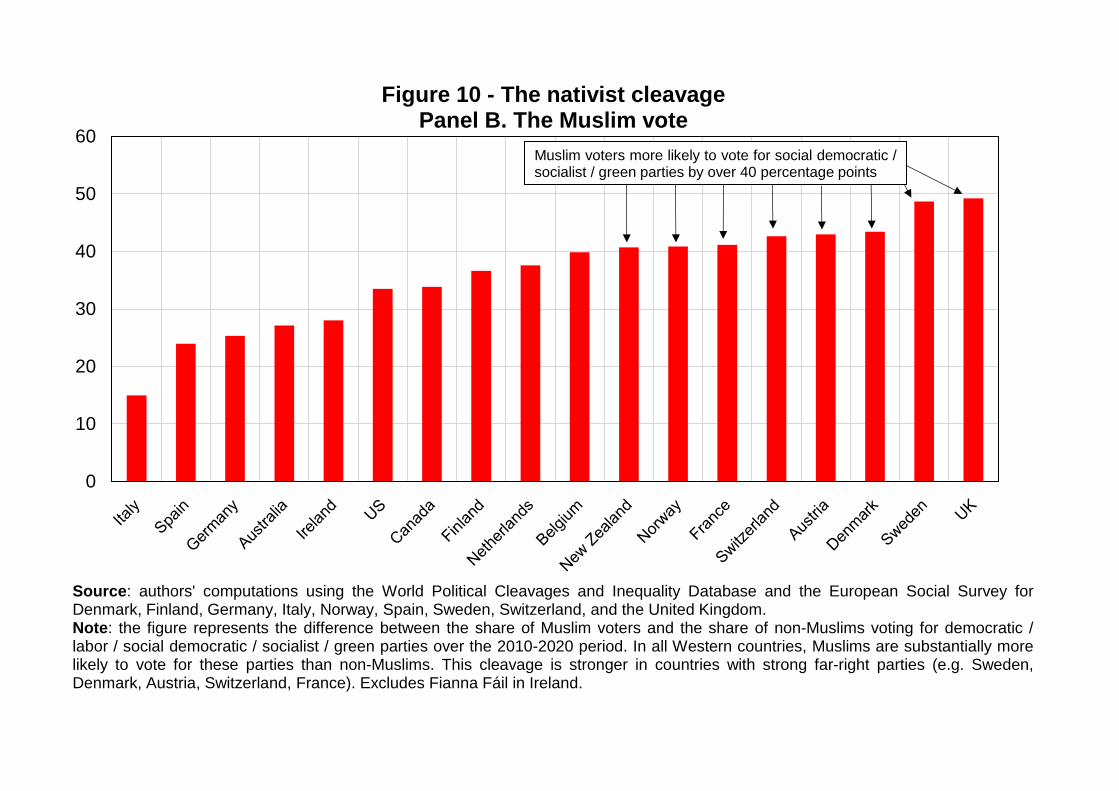
0
10
20
30
40
50
60
Figure 10 - The nativist cleavagePanel B. The Muslim vote
Source: authors' computations using the World Political Cleavages and Inequality Database and the European Social Survey forDenmark, Finland, Germany, Italy, Norway, Spain, Sweden, Switzerland, and the United Kingdom.Note: the figure represents the difference between the share of Muslim voters and the share of non-Muslims voting for democratic /labor / social democratic / socialist / green parties over the 2010-2020 period. In all Western countries, Muslims are substantially morelikely to vote for these parties than non-Muslims. This cleavage is stronger in countries with strong far-right parties (e.g. Sweden,Denmark, Austria, Switzerland, France). Excludes Fianna Fáil in Ireland.
Muslim voters more likely to vote for social democratic /socialist / green parties by over 40 percentage points
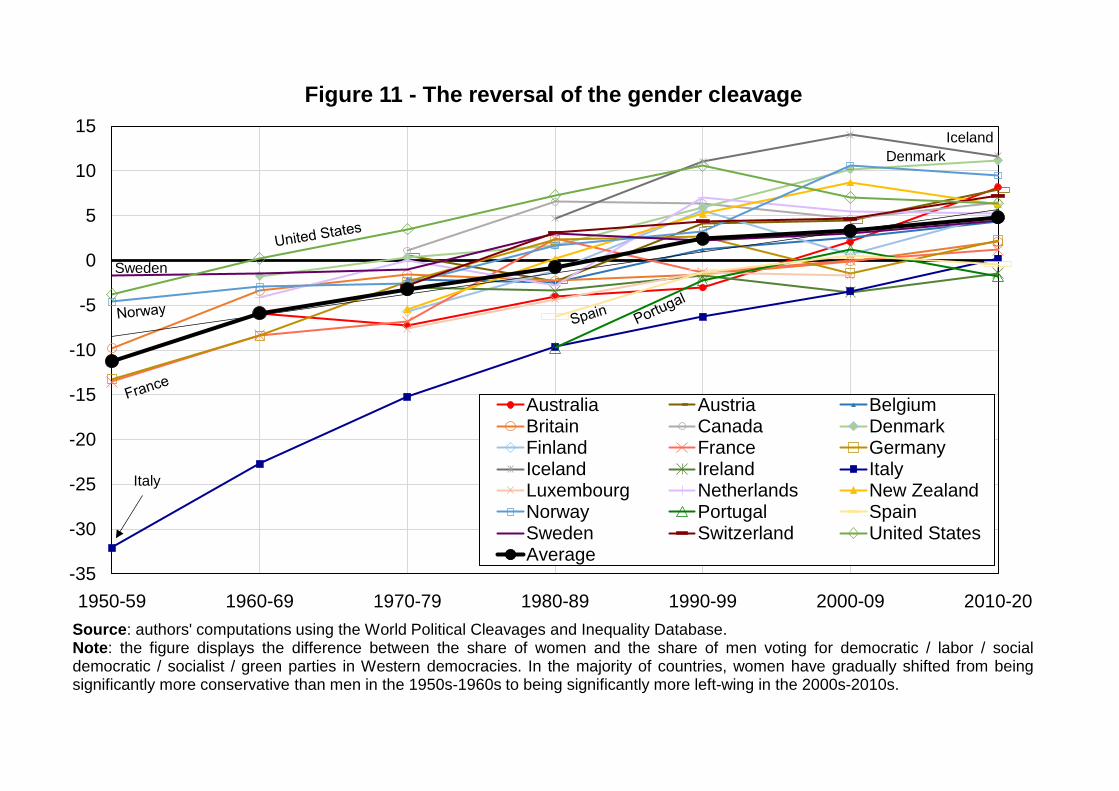
-35
-30
-25
-20
-15
-10
-5
0
5
10
15
1950-59 1960-69 1970-79 1980-89 1990-99 2000-09 2010-20
Figure 11 - The reversal of the gender cleavage
Australia Austria BelgiumBritain Canada DenmarkFinland France GermanyIceland Ireland ItalyLuxembourg Netherlands New ZealandNorway Portugal SpainSweden Switzerland United StatesAverage
Source: authors' computations using the World Political Cleavages and Inequality Database.Note: the figure displays the difference between the share of women and the share of men voting for democratic / labor / socialdemocratic / socialist / green parties in Western democracies. In the majority of countries, women have gradually shifted from beingsignificantly more conservative than men in the 1950s-1960s to being significantly more left-wing in the 2000s-2010s.
Italy
Sweden
Iceland
Denmark
1
Brahmin Left versus Merchant Right: Changing Political Cleavages in 21 Western
Democracies, 1948-2020
Amory Gethin
Clara Martínez-Toledano
Thomas Piketty
May 5, 2021
Amory Gethin, Thomas Piketty: Paris School of Economics – World Inequality Lab; Clara Martínez-Toledano:
Imperial College London – World Inequality Lab.
APPENDIX
This appendix supplements our paper “Brahmin Left versus Merchant Right: Changing
Political Cleavages in 21 Western Democracies, 1948-2020”. It contains additional
methodological details, as well as supplementary figures and tables.

2
This appendix supplements our paper “Brahmin Left versus Merchant Right: Changing Political
Cleavages in Western Democracies, 1948-2020”. Appendix A presents the methodology used
to derive quantile groups from discrete categories. Appendix B contains supplementary figures
and tables.
Appendix A. Estimation of quantile groups from discrete categories
One of the contribution of this paper is to provide data on the vote share received by specific
parties and coalitions by income and education groups, decomposing for instance the population
into its poorest or least educated half (the bottom 50%), the next 40% (the middle 40%), and
the highest decile (the top 10%). Such groups are key to track political cleavages over time and
compare them across countries. The problem is that existing surveys do not provide continuous
values for income or education: these variables are most often coded in discrete categories
(educational levels in the case of education, income brackets in the case of income).
To partially overcome this issue, we introduce a simple reweighing method, which exploits the
distribution of individuals in each bracket or category to approximate quantiles. Consider for
example the 2015 Canadian Election Study, which contains an income variable coded in
eighteen brackets (see table 1). One is interested in computing the proportion of individuals
belonging to the lowest income decile voting for the New Democratic Party �̅�{𝑑=1}, where 𝑦 is
a binary variable taking 1 is the respondent voted for the NDP and 0 otherwise, and where 𝑑
refers to the income decile to which the respondents belong. Unfortunately, this is not directly
possible with this income variable since only 5% of individuals belong to the first income
bracket (𝑏 = 1), and 15.5% of them belong to the lowest two brackets (𝑏 ∈ [1,2]). If support
for the NDP decreases linearly with income, then �̅�{𝑏=1} will strongly overestimate �̅�{𝑑=1},
while �̅�{𝑏=2} will strongly underestimate it since we are looking at individuals who are on
average too poor in the first case and too rich in the second. However, it is easy to see that since
individuals within the second bracket range from quantiles 0.05 to 0.155, this means that
0.05
0.155−0.05≈ 48% of them belong to the bottom 10%, while 52% of them belong to the rest of
the population, assuming for simplicity that individuals within brackets are uniformly
distributed.
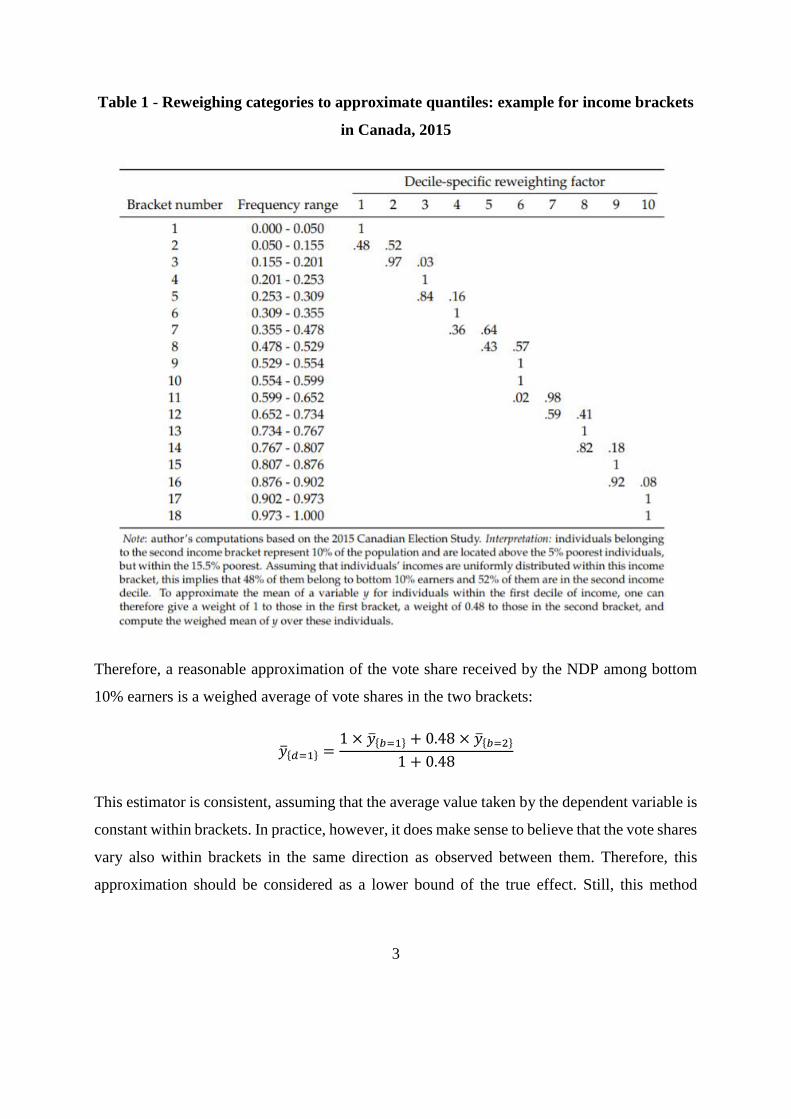
3
Table 1 - Reweighing categories to approximate quantiles: example for income brackets
in Canada, 2015
Therefore, a reasonable approximation of the vote share received by the NDP among bottom
10% earners is a weighed average of vote shares in the two brackets:
�̅�{𝑑=1} =1 × �̅�{𝑏=1} + 0.48 × �̅�{𝑏=2}
1 + 0.48
This estimator is consistent, assuming that the average value taken by the dependent variable is
constant within brackets. In practice, however, it does make sense to believe that the vote shares
vary also within brackets in the same direction as observed between them. Therefore, this
approximation should be considered as a lower bound of the true effect. Still, this method
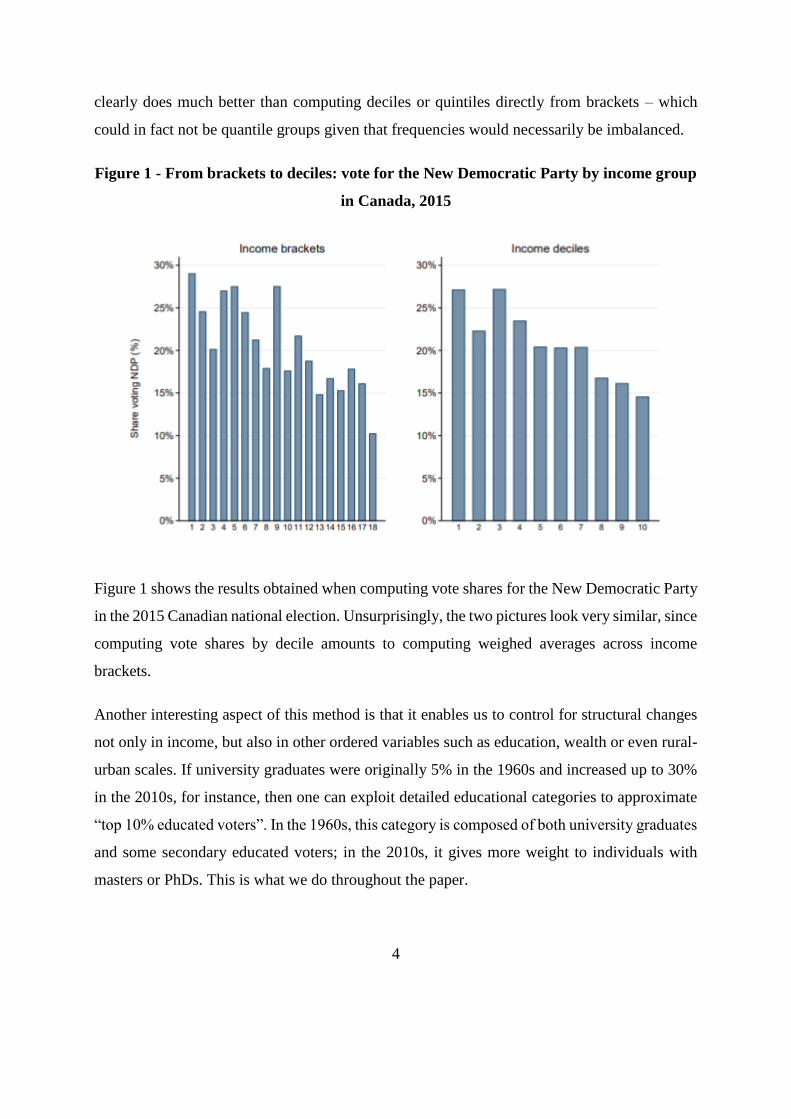
4
clearly does much better than computing deciles or quintiles directly from brackets – which
could in fact not be quantile groups given that frequencies would necessarily be imbalanced.
Figure 1 - From brackets to deciles: vote for the New Democratic Party by income group
in Canada, 2015
Figure 1 shows the results obtained when computing vote shares for the New Democratic Party
in the 2015 Canadian national election. Unsurprisingly, the two pictures look very similar, since
computing vote shares by decile amounts to computing weighed averages across income
brackets.
Another interesting aspect of this method is that it enables us to control for structural changes
not only in income, but also in other ordered variables such as education, wealth or even rural-
urban scales. If university graduates were originally 5% in the 1960s and increased up to 30%
in the 2010s, for instance, then one can exploit detailed educational categories to approximate
“top 10% educated voters”. In the 1960s, this category is composed of both university graduates
and some secondary educated voters; in the 2010s, it gives more weight to individuals with
masters or PhDs. This is what we do throughout the paper.
5
Finally, one issue is that ‘splitting’ brackets into deciles implies that a single individual may
belong to different quantile groups: in the example above, individuals in bracket 2 belong both
to the first and the second deciles. While this is not problematic when computing averages, it
makes regression models impossible to solve: without changing the dataset, one cannot
compare the vote shares of the first and second decile with control variables.
To solve this problem, we expand the entire dataset as many times as the number of quantile
groups required. In the case of deciles, for instance, the procedure consists in duplicating all
observations ten times. Then, one simply needs to attribute the corresponding weights to
duplicated individuals: individuals belonging to bracket 2 see their sample weight multiplied
by 0.48 in their first observation, 0.52 in the second time they appear in the dataset, and 0 in all
other instances. Since this process only reweighs individuals, it leaves the effect of other
explanatory variables perfectly unchanged.
Appendix B. Supplementary figures and tables
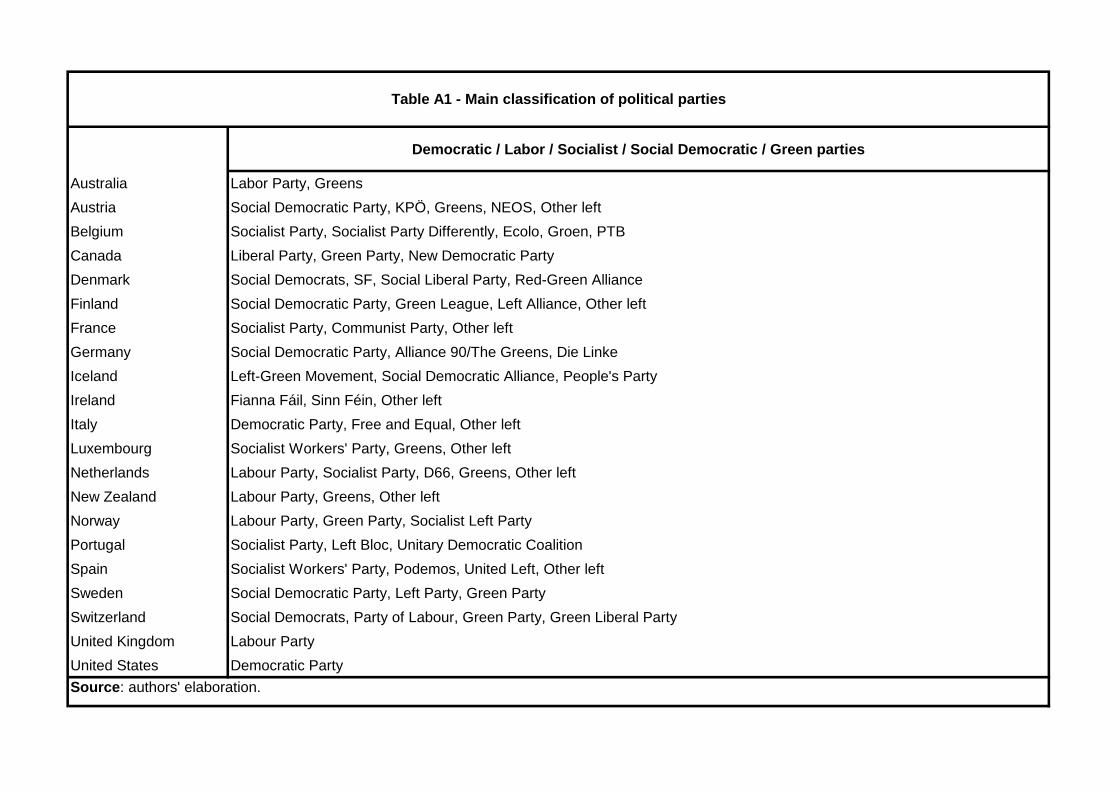
Democratic / Labor / Socialist / Social Democratic / Green parties
Australia Labor Party, Greens
Austria Social Democratic Party, KPÖ, Greens, NEOS, Other left
Belgium Socialist Party, Socialist Party Differently, Ecolo, Groen, PTB
Canada Liberal Party, Green Party, New Democratic Party
Denmark Social Democrats, SF, Social Liberal Party, Red-Green Alliance
Finland Social Democratic Party, Green League, Left Alliance, Other left
France Socialist Party, Communist Party, Other left
Germany Social Democratic Party, Alliance 90/The Greens, Die Linke
Iceland Left-Green Movement, Social Democratic Alliance, People's Party
Ireland Fianna Fáil, Sinn Féin, Other left
Italy Democratic Party, Free and Equal, Other left
Luxembourg Socialist Workers' Party, Greens, Other left
Netherlands Labour Party, Socialist Party, D66, Greens, Other left
New Zealand Labour Party, Greens, Other left
Norway Labour Party, Green Party, Socialist Left Party
Portugal Socialist Party, Left Bloc, Unitary Democratic Coalition
Spain Socialist Workers' Party, Podemos, United Left, Other left
Sweden Social Democratic Party, Left Party, Green Party
Switzerland Social Democrats, Party of Labour, Green Party, Green Liberal Party
United Kingdom Labour Party
United States Democratic Party
Source: authors' elaboration.
Table A1 - Main classification of political parties

Country Party Family
Australia Labor Party Social Democrats / Socialists / Other left
Australia Liberal Party Conservatives / Christian Democrats
Australia Australian Greens Greens
Australia National Party Conservatives / Christian Democrats
Australia Australian Democrats Conservatives / Christian Democrats
Australia Palmer United Party Anti-immigration
Australia One Nation Party Anti-immigration
Austria Social Democratic Party of Austria (SPÖ) Social Democrats / Socialists / Other left
Austria Austrian People's Party (ÖVP) Conservatives / Christian Democrats
Austria Freedom Party of Austria (FPÖ) Anti-immigration
Austria Greens Greens
Austria NEOS / Liberal Forum Liberals / Social-liberals
Belgium Christian People's Party (CVP) Conservatives / Christian Democrats
Belgium Belgian Socialist Party (PSB) Social Democrats / Socialists / Other left
Belgium Socialist Party (PS) Social Democrats / Socialists / Other left
Belgium New Flemish Alliance (N-VA) Other
Belgium Party for Freedom and Progress (PLP/PVV) Liberals / Social-liberals
Belgium Open Flemish Liberals and Democrats (VLD) Liberals / Social-liberals
Belgium Socialist Party (SP / sp.a) Social Democrats / Socialists / Other left
Belgium Reformist movement (MR) Liberals / Social-liberals
Belgium Christian Democratic and Flemish (CD&V) Conservatives / Christian Democrats
Belgium PL Liberals / Social-liberals
Belgium Christian Social Party (PSC) Conservatives / Christian Democrats
Belgium Liberal Reformist Party (PRL) Liberals / Social-liberals
Belgium Volksunie (VU) Other
Belgium Vlaams Blok Anti-immigration
Belgium Workers' Party of Belgium (PTB) Social Democrats / Socialists / Other left
Belgium Communist Party (PCB) Social Democrats / Socialists / Other left
Canada Liberal Party Social Democrats / Socialists / Other left
Table A2 - Detailed classification of political parties
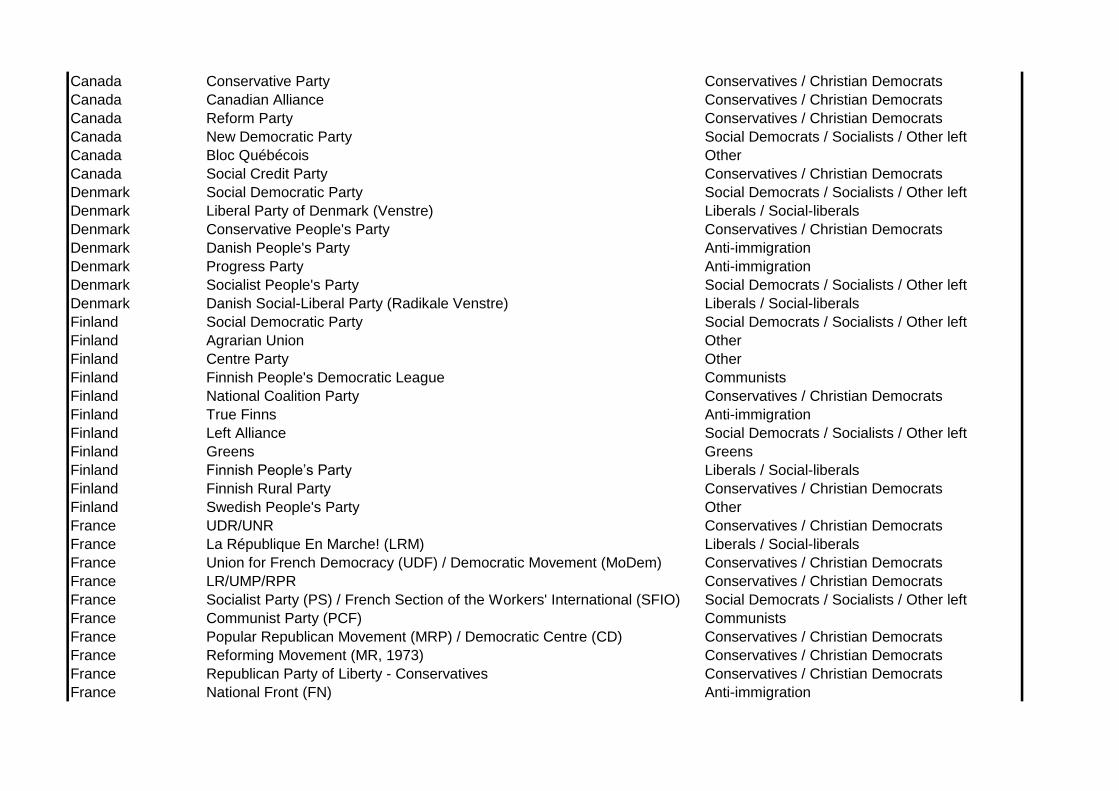
Canada Conservative Party Conservatives / Christian Democrats
Canada Canadian Alliance Conservatives / Christian Democrats
Canada Reform Party Conservatives / Christian Democrats
Canada New Democratic Party Social Democrats / Socialists / Other left
Canada Bloc Québécois Other
Canada Social Credit Party Conservatives / Christian Democrats
Denmark Social Democratic Party Social Democrats / Socialists / Other left
Denmark Liberal Party of Denmark (Venstre) Liberals / Social-liberals
Denmark Conservative People's Party Conservatives / Christian Democrats
Denmark Danish People's Party Anti-immigration
Denmark Progress Party Anti-immigration
Denmark Socialist People's Party Social Democrats / Socialists / Other left
Denmark Danish Social-Liberal Party (Radikale Venstre) Liberals / Social-liberals
Finland Social Democratic Party Social Democrats / Socialists / Other left
Finland Agrarian Union Other
Finland Centre Party Other
Finland Finnish People's Democratic League Communists
Finland National Coalition Party Conservatives / Christian Democrats
Finland True Finns Anti-immigration
Finland Left Alliance Social Democrats / Socialists / Other left
Finland Greens Greens
Finland Finnish People’s Party Liberals / Social-liberals
Finland Finnish Rural Party Conservatives / Christian Democrats
Finland Swedish People's Party Other
France UDR/UNR Conservatives / Christian Democrats
France La République En Marche! (LRM) Liberals / Social-liberals
France Union for French Democracy (UDF) / Democratic Movement (MoDem) Conservatives / Christian Democrats
France LR/UMP/RPR Conservatives / Christian Democrats
France Socialist Party (PS) / French Section of the Workers' International (SFIO) Social Democrats / Socialists / Other left
France Communist Party (PCF) Communists
France Popular Republican Movement (MRP) / Democratic Centre (CD) Conservatives / Christian Democrats
France Reforming Movement (MR, 1973) Conservatives / Christian Democrats
France Republican Party of Liberty - Conservatives Conservatives / Christian Democrats
France National Front (FN) Anti-immigration
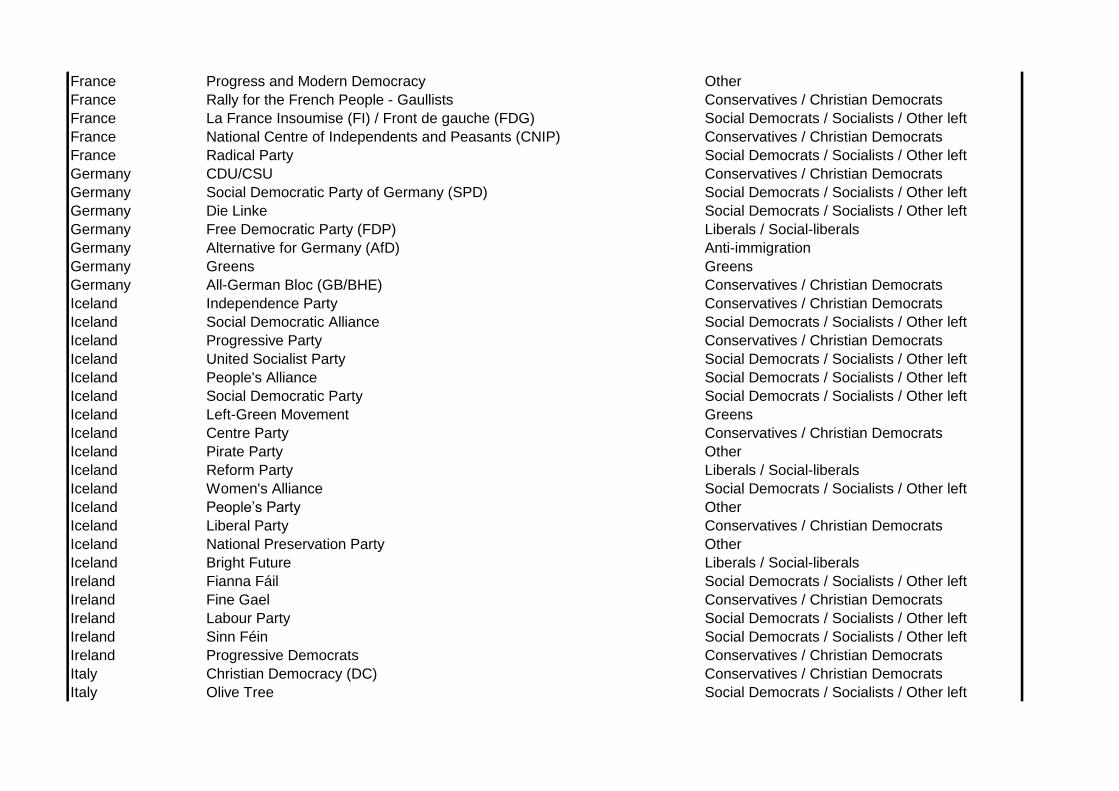
France Progress and Modern Democracy Other
France Rally for the French People - Gaullists Conservatives / Christian Democrats
France La France Insoumise (FI) / Front de gauche (FDG) Social Democrats / Socialists / Other left
France National Centre of Independents and Peasants (CNIP) Conservatives / Christian Democrats
France Radical Party Social Democrats / Socialists / Other left
Germany CDU/CSU Conservatives / Christian Democrats
Germany Social Democratic Party of Germany (SPD) Social Democrats / Socialists / Other left
Germany Die Linke Social Democrats / Socialists / Other left
Germany Free Democratic Party (FDP) Liberals / Social-liberals
Germany Alternative for Germany (AfD) Anti-immigration
Germany Greens Greens
Germany All-German Bloc (GB/BHE) Conservatives / Christian Democrats
Iceland Independence Party Conservatives / Christian Democrats
Iceland Social Democratic Alliance Social Democrats / Socialists / Other left
Iceland Progressive Party Conservatives / Christian Democrats
Iceland United Socialist Party Social Democrats / Socialists / Other left
Iceland People's Alliance Social Democrats / Socialists / Other left
Iceland Social Democratic Party Social Democrats / Socialists / Other left
Iceland Left-Green Movement Greens
Iceland Centre Party Conservatives / Christian Democrats
Iceland Pirate Party Other
Iceland Reform Party Liberals / Social-liberals
Iceland Women's Alliance Social Democrats / Socialists / Other left
Iceland People’s Party Other
Iceland Liberal Party Conservatives / Christian Democrats
Iceland National Preservation Party Other
Iceland Bright Future Liberals / Social-liberals
Ireland Fianna Fáil Social Democrats / Socialists / Other left
Ireland Fine Gael Conservatives / Christian Democrats
Ireland Labour Party Social Democrats / Socialists / Other left
Ireland Sinn Féin Social Democrats / Socialists / Other left
Ireland Progressive Democrats Conservatives / Christian Democrats
Italy Christian Democracy (DC) Conservatives / Christian Democrats
Italy Olive Tree Social Democrats / Socialists / Other left

Italy People of Freedom (PDL) Conservatives / Christian Democrats
Italy Five Star Movement (M5S) Social Democrats / Socialists / Other left
Italy Italian Communist Party (PCI) Communists
Italy Democratic Party (PD) Social Democrats / Socialists / Other left
Italy Forza Italia (FI) Conservatives / Christian Democrats
Italy Democratic Party of the Left (PDS) Social Democrats / Socialists / Other left
Italy Democrats of the Left (DS) / Margherita / Ulivo Social Democrats / Socialists / Other left
Italy Italian Socialist Party of Proletarian Unity (PSIUP) Social Democrats / Socialists / Other left
Italy National Alliance (AN) Conservatives / Christian Democrats
Italy Populars for Italy (PPI) Social Democrats / Socialists / Other left
Italy Italian Socialist Party (PSI) Social Democrats / Socialists / Other left
Italy Civic Choice Conservatives / Christian Democrats
Italy Lega Anti-immigration
Italy Socialist Party of Italian Workers Social Democrats / Socialists / Other left
Italy Communist Refoundation Party (PRC) Social Democrats / Socialists / Other left
Italy Italian Social Movement (MSI, MSI-DN) Anti-immigration
Luxembourg Christian Social People's Party Conservatives / Christian Democrats
Luxembourg Luxembourg Socialist Workers' Party Social Democrats / Socialists / Other left
Luxembourg Democratic Party Liberals / Social-liberals
Luxembourg Democratic Group Liberals / Social-liberals
Luxembourg Patriotic and Democratic Group Liberals / Social-liberals
Luxembourg Action Committee Conservatives / Christian Democrats
Luxembourg The Greens Greens
Luxembourg Communist Party of Luxembourg Communists
Luxembourg Green List Ecological Initiative Greens
Luxembourg Alternative Democratic Reform Party Anti-immigration
Netherlands Catholic People's Party (KVP) Conservatives / Christian Democrats
Netherlands Labour Party (PvdA) Social Democrats / Socialists / Other left
Netherlands Christian Democratic Appeal (CDA) Conservatives / Christian Democrats
Netherlands People's Party for Freedom and Democracy (VVD) Liberals / Social-liberals
Netherlands Pim Fortuyn List (LPF) Anti-immigration
Netherlands Party for Freedom (PVV) Anti-immigration
Netherlands Anti-Revolutionary Party (ARP) Conservatives / Christian Democrats
Netherlands Christian Historical Union (CHU) Conservatives / Christian Democrats
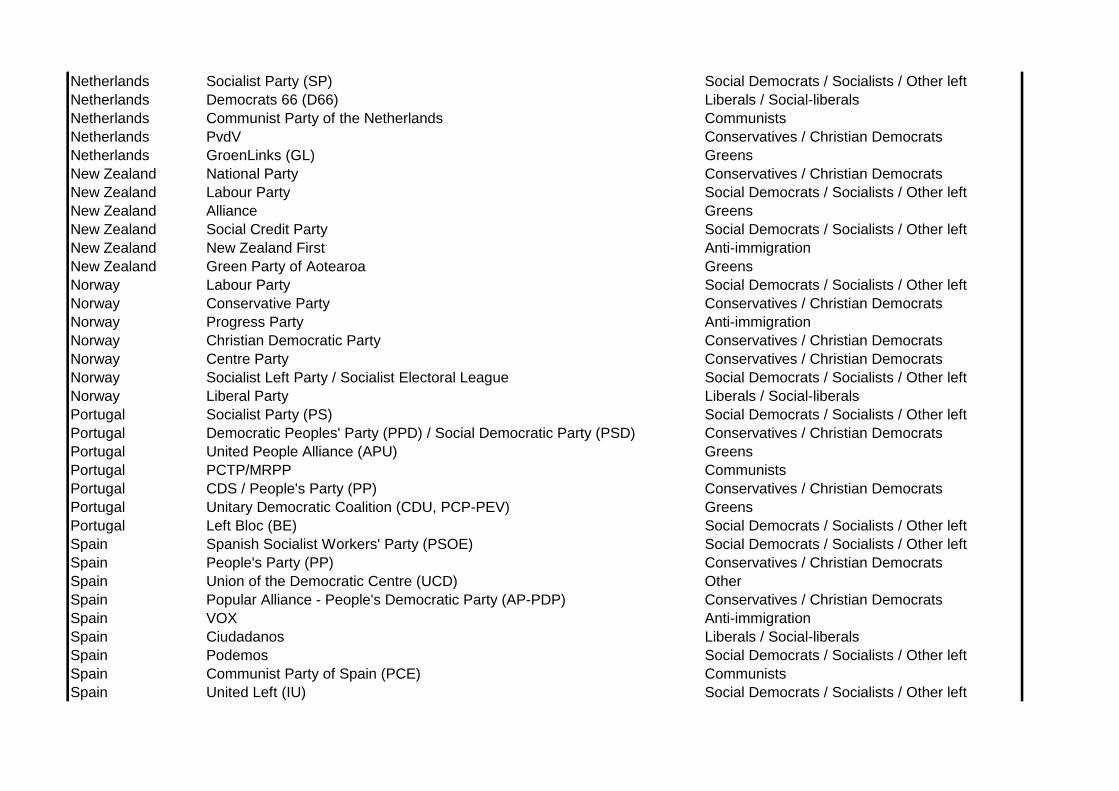
Netherlands Socialist Party (SP) Social Democrats / Socialists / Other left
Netherlands Democrats 66 (D66) Liberals / Social-liberals
Netherlands Communist Party of the Netherlands Communists
Netherlands PvdV Conservatives / Christian Democrats
Netherlands GroenLinks (GL) Greens
New Zealand National Party Conservatives / Christian Democrats
New Zealand Labour Party Social Democrats / Socialists / Other left
New Zealand Alliance Greens
New Zealand Social Credit Party Social Democrats / Socialists / Other left
New Zealand New Zealand First Anti-immigration
New Zealand Green Party of Aotearoa Greens
Norway Labour Party Social Democrats / Socialists / Other left
Norway Conservative Party Conservatives / Christian Democrats
Norway Progress Party Anti-immigration
Norway Christian Democratic Party Conservatives / Christian Democrats
Norway Centre Party Conservatives / Christian Democrats
Norway Socialist Left Party / Socialist Electoral League Social Democrats / Socialists / Other left
Norway Liberal Party Liberals / Social-liberals
Portugal Socialist Party (PS) Social Democrats / Socialists / Other left
Portugal Democratic Peoples' Party (PPD) / Social Democratic Party (PSD) Conservatives / Christian Democrats
Portugal United People Alliance (APU) Greens
Portugal PCTP/MRPP Communists
Portugal CDS / People's Party (PP) Conservatives / Christian Democrats
Portugal Unitary Democratic Coalition (CDU, PCP-PEV) Greens
Portugal Left Bloc (BE) Social Democrats / Socialists / Other left
Spain Spanish Socialist Workers' Party (PSOE) Social Democrats / Socialists / Other left
Spain People's Party (PP) Conservatives / Christian Democrats
Spain Union of the Democratic Centre (UCD) Other
Spain Popular Alliance - People's Democratic Party (AP-PDP) Conservatives / Christian Democrats
Spain VOX Anti-immigration
Spain Ciudadanos Liberals / Social-liberals
Spain Podemos Social Democrats / Socialists / Other left
Spain Communist Party of Spain (PCE) Communists
Spain United Left (IU) Social Democrats / Socialists / Other left
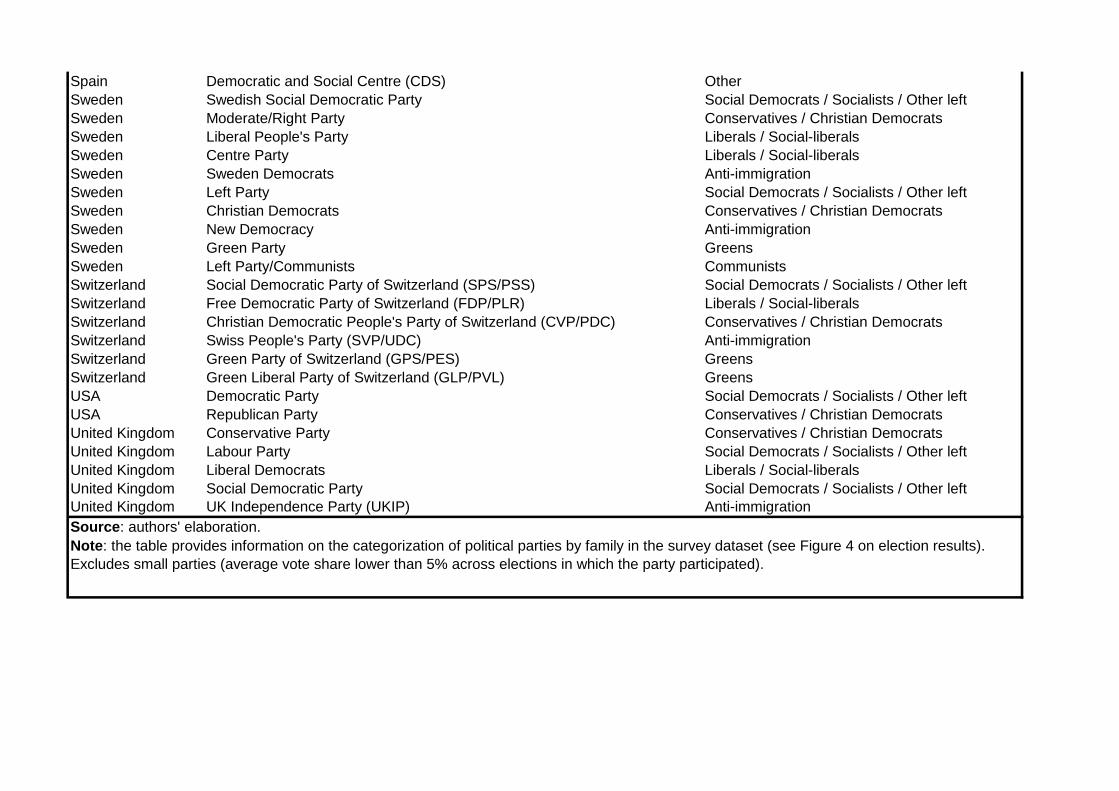
Spain Democratic and Social Centre (CDS) Other
Sweden Swedish Social Democratic Party Social Democrats / Socialists / Other left
Sweden Moderate/Right Party Conservatives / Christian Democrats
Sweden Liberal People's Party Liberals / Social-liberals
Sweden Centre Party Liberals / Social-liberals
Sweden Sweden Democrats Anti-immigration
Sweden Left Party Social Democrats / Socialists / Other left
Sweden Christian Democrats Conservatives / Christian Democrats
Sweden New Democracy Anti-immigration
Sweden Green Party Greens
Sweden Left Party/Communists Communists
Switzerland Social Democratic Party of Switzerland (SPS/PSS) Social Democrats / Socialists / Other left
Switzerland Free Democratic Party of Switzerland (FDP/PLR) Liberals / Social-liberals
Switzerland Christian Democratic People's Party of Switzerland (CVP/PDC) Conservatives / Christian Democrats
Switzerland Swiss People's Party (SVP/UDC) Anti-immigration
Switzerland Green Party of Switzerland (GPS/PES) Greens
Switzerland Green Liberal Party of Switzerland (GLP/PVL) Greens
USA Democratic Party Social Democrats / Socialists / Other left
USA Republican Party Conservatives / Christian Democrats
United Kingdom Conservative Party Conservatives / Christian Democrats
United Kingdom Labour Party Social Democrats / Socialists / Other left
United Kingdom Liberal Democrats Liberals / Social-liberals
United Kingdom Social Democratic Party Social Democrats / Socialists / Other left
United Kingdom UK Independence Party (UKIP) Anti-immigration
Source: authors' elaboration.
Note: the table provides information on the categorization of political parties by family in the survey dataset (see Figure 4 on election results).
Excludes small parties (average vote share lower than 5% across elections in which the party participated).

Country Election Source
Australia 1966 International Social Mobility and Politics File (Franklin et al. 1992)
Australia 1972 International Social Mobility and Politics File (Franklin et al. 1992)
Australia 1977 International Social Mobility and Politics File (Franklin et al. 1992)
Australia 1983 International Social Mobility and Politics File (Franklin et al. 1992)
Australia 1984 International Social Mobility and Politics File (Franklin et al. 1992)
Australia 1987 Australian Election Study
Australia 1990 Australian Election Study
Australia 1993 Australian Election Study
Australia 1996 Australian Election Study
Australia 1998 Australian Election Study
Australia 2001 Australian Election Study
Australia 2004 Australian Election Study
Australia 2007 Australian Election Study
Australia 2010 Australian Election Study
Australia 2013 Australian Election Study
Australia 2016 Australian Election Study
Australia 2019 Australian Election Study
Austria 1971 International Social Mobility and Politics File (Franklin et al. 1992)
Austria 1983 International Social Mobility and Politics File (Franklin et al. 1992)
Austria 1986 International Social Mobility and Politics File (Franklin et al. 1992)
Austria 1994 Eurobarometers
Austria 1995 Eurobarometers
Austria 1999 Eurobarometers
Austria 2002 European Social Survey
Austria 2006 European Social Survey
Austria 2013 Comparative Study of Electoral Systems (CSES)
Austria 2017 Comparative Study of Electoral Systems (CSES)
Belgium 1971 Eurobarometers
Belgium 1974 Eurobarometers
Belgium 1977 Eurobarometers
Belgium 1978 Eurobarometers
Belgium 1981 Eurobarometers
Belgium 1985 Eurobarometers
Belgium 1987 Eurobarometers
Belgium 1991 Belgium General Election Study
Belgium 1995 Belgium General Election Study
Belgium 1999 Belgium General Election Study
Belgium 2003 European Social Survey
Belgium 2007 European Social Survey
Belgium 2010 European Social Survey
Belgium 2014 European Social Survey
Canada 1963 Canadian Election Studies
Canada 1965 Canadian Election Studies
Canada 1968 Canadian Election Studies
Canada 1974 Canadian Election Studies
Table A3 - Data sources

Canada 1979 Canadian Election Studies
Canada 1980 Canadian Election Studies
Canada 1984 Canadian Election Studies
Canada 1988 Canadian Election Studies
Canada 1993 Canadian Election Studies
Canada 1997 Canadian Election Studies
Canada 2000 Canadian Election Studies
Canada 2004 Canadian Election Studies
Canada 2006 Canadian Election Studies
Canada 2008 Canadian Election Studies
Canada 2011 Canadian Election Studies
Canada 2015 Canadian Election Studies
Canada 2019 Canadian Election Studies
Denmark 1960 Danish Election Study
Denmark 1964 Danish Election Study
Denmark 1966 Danish Election Study
Denmark 1968 Danish Election Study
Denmark 1971 Danish Election Study
Denmark 1973 Danish Election Study
Denmark 1975 Danish Election Study
Denmark 1977 Danish Election Study
Denmark 1979 Danish Election Study
Denmark 1981 Danish Election Study
Denmark 1984 Danish Election Study
Denmark 1987 Danish Election Study
Denmark 1988 Danish Election Study
Denmark 1990 Danish Election Study
Denmark 1994 Danish Election Study
Denmark 1998 Danish Election Study
Denmark 2001 Danish Election Study
Denmark 2005 Danish Election Study
Denmark 2007 Danish Election Study
Denmark 2011 Danish Election Study
Denmark 2015 Danish Election Study
Finland 1972 Finnish Voter Barometers
Finland 1975 Finnish Voter Barometers
Finland 1979 Finnish Voter Barometers
Finland 1983 Finnish Voter Barometers
Finland 1987 Finnish Voter Barometers
Finland 1995 Finnish Voter Barometers
Finland 1999 Finnish Voter Barometers
Finland 2003 Finnish Voter Barometers
Finland 2007 Finnish National Election Studies
Finland 2011 Finnish National Election Studies
Finland 2015 Finnish National Election Studies
France 1956 French Election Studies
France 1958 French Election Studies
France 1962 French Election Studies
France 1965 French Election Studies
France 1967 French Election Studies

France 1973 French Election Studies
France 1974 French Election Studies
France 1978 French Election Studies
France 1986 French Election Studies
France 1988 French Election Studies
France 1993 French Election Studies
France 1995 French Election Studies
France 1997 French Election Studies
France 2002 French Election Studies
France 2007 French Election Studies
France 2012 French Election Studies
France 2017 French election studies
Germany 1949 German Federal Election Studies
Germany 1953 German Federal Election Studies
Germany 1957 German Federal Election Studies
Germany 1961 German Federal Election Studies
Germany 1965 German Federal Election Studies
Germany 1969 German Federal Election Studies
Germany 1972 German Federal Election Studies
Germany 1976 German Federal Election Studies
Germany 1980 German Federal Election Studies
Germany 1983 German Federal Election Studies
Germany 1987 German Federal Election Studies
Germany 1990 German Federal Election Studies
Germany 1994 German Federal Election Studies
Germany 1998 German Federal Election Studies
Germany 2002 German Federal Election Studies
Germany 2005 German Federal Election Studies
Germany 2009 German Federal Election Studies
Germany 2013 German Federal Election Studies
Germany 2017 German Federal Election Studies
Iceland 1978 Icelandic National Election Studies
Iceland 1983 Icelandic National Election Studies
Iceland 1987 Icelandic National Election Studies
Iceland 1991 Icelandic National Election Studies
Iceland 1995 Icelandic National Election Studies
Iceland 1999 Icelandic National Election Studies
Iceland 2003 Icelandic National Election Studies
Iceland 2007 Icelandic National Election Studies
Iceland 2009 Icelandic National Election Studies
Iceland 2013 Icelandic National Election Studies
Iceland 2016 Icelandic National Election Studies
Iceland 2017 Icelandic National Election Studies
Ireland 1973 Eurobarometers
Ireland 1977 Eurobarometers
Ireland 1981 Eurobarometers
Ireland 1982 Eurobarometers
Ireland 1987 Eurobarometers
Ireland 1989 Eurobarometers
Ireland 1992 Eurobarometers
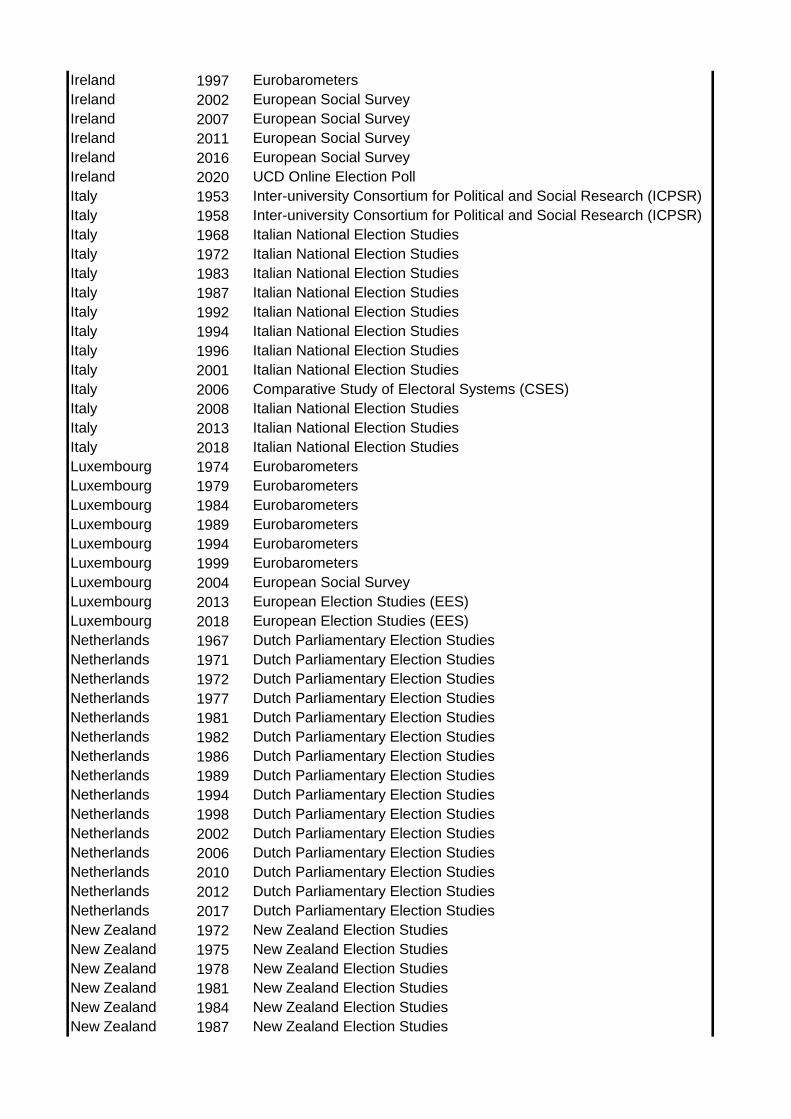
Ireland 1997 Eurobarometers
Ireland 2002 European Social Survey
Ireland 2007 European Social Survey
Ireland 2011 European Social Survey
Ireland 2016 European Social Survey
Ireland 2020 UCD Online Election Poll
Italy 1953 Inter-university Consortium for Political and Social Research (ICPSR)
Italy 1958 Inter-university Consortium for Political and Social Research (ICPSR)
Italy 1968 Italian National Election Studies
Italy 1972 Italian National Election Studies
Italy 1983 Italian National Election Studies
Italy 1987 Italian National Election Studies
Italy 1992 Italian National Election Studies
Italy 1994 Italian National Election Studies
Italy 1996 Italian National Election Studies
Italy 2001 Italian National Election Studies
Italy 2006 Comparative Study of Electoral Systems (CSES)
Italy 2008 Italian National Election Studies
Italy 2013 Italian National Election Studies
Italy 2018 Italian National Election Studies
Luxembourg 1974 Eurobarometers
Luxembourg 1979 Eurobarometers
Luxembourg 1984 Eurobarometers
Luxembourg 1989 Eurobarometers
Luxembourg 1994 Eurobarometers
Luxembourg 1999 Eurobarometers
Luxembourg 2004 European Social Survey
Luxembourg 2013 European Election Studies (EES)
Luxembourg 2018 European Election Studies (EES)
Netherlands 1967 Dutch Parliamentary Election Studies
Netherlands 1971 Dutch Parliamentary Election Studies
Netherlands 1972 Dutch Parliamentary Election Studies
Netherlands 1977 Dutch Parliamentary Election Studies
Netherlands 1981 Dutch Parliamentary Election Studies
Netherlands 1982 Dutch Parliamentary Election Studies
Netherlands 1986 Dutch Parliamentary Election Studies
Netherlands 1989 Dutch Parliamentary Election Studies
Netherlands 1994 Dutch Parliamentary Election Studies
Netherlands 1998 Dutch Parliamentary Election Studies
Netherlands 2002 Dutch Parliamentary Election Studies
Netherlands 2006 Dutch Parliamentary Election Studies
Netherlands 2010 Dutch Parliamentary Election Studies
Netherlands 2012 Dutch Parliamentary Election Studies
Netherlands 2017 Dutch Parliamentary Election Studies
New Zealand 1972 New Zealand Election Studies
New Zealand 1975 New Zealand Election Studies
New Zealand 1978 New Zealand Election Studies
New Zealand 1981 New Zealand Election Studies
New Zealand 1984 New Zealand Election Studies
New Zealand 1987 New Zealand Election Studies

New Zealand 1990 New Zealand Election Studies
New Zealand 1993 New Zealand Election Studies
New Zealand 1996 New Zealand Election Studies
New Zealand 1999 New Zealand Election Studies
New Zealand 2002 New Zealand Election Studies
New Zealand 2005 New Zealand Election Studies
New Zealand 2008 New Zealand Election Studies
New Zealand 2011 New Zealand Election Studies
New Zealand 2014 New Zealand Election Studies
New Zealand 2017 New Zealand Election Studies
Norway 1957 Norwegian National Election Studies
Norway 1965 Norwegian National Election Studies
Norway 1969 Norwegian National Election Studies
Norway 1973 Norwegian National Election Studies
Norway 1977 Norwegian National Election Studies
Norway 1981 Norwegian National Election Studies
Norway 1985 Norwegian National Election Studies
Norway 1989 Norwegian National Election Studies
Norway 1993 Norwegian National Election Studies
Norway 1997 Norwegian National Election Studies
Norway 2001 Norwegian National Election Studies
Norway 2005 Norwegian National Election Studies
Norway 2009 Norwegian National Election Studies
Norway 2013 Norwegian National Election Studies
Norway 2017 Norwegian National Election Studies
Portugal 1983 ESEO
Portugal 1985 ESEO
Portugal 1987 ESEO
Portugal 1991 ESEO
Portugal 1995 European Election Studies (EES)
Portugal 2002 Comparative Study of Electoral Systems (CSES)
Portugal 2005 Comparative Study of Electoral Systems (CSES)
Portugal 2009 Comparative Study of Electoral Systems (CSES)
Portugal 2015 Comparative Study of Electoral Systems (CSES)
Portugal 2019 Portuguese Election Study
Spain 1982 Centro de Investigaciones Sociológicas
Spain 1986 Centro de Investigaciones Sociológicas
Spain 1989 Centro de Investigaciones Sociológicas
Spain 1993 Centro de Investigaciones Sociológicas
Spain 1996 Centro de Investigaciones Sociológicas
Spain 2000 Centro de Investigaciones Sociológicas
Spain 2004 Centro de Investigaciones Sociológicas
Spain 2008 Centro de Investigaciones Sociológicas
Spain 2011 Centro de Investigaciones Sociológicas
Spain 2015 Centro de Investigaciones Sociológicas
Spain 2016 Centro de Investigaciones Sociológicas
Spain 2019 Centro de Investigaciones Sociológicas
Spain 2020 Centro de Investigaciones Sociológicas
Sweden 1956 Swedish National Election Studies
Sweden 1958 Swedish National Election Studies

Sweden 1960 Swedish National Election Studies
Sweden 1964 Swedish National Election Studies
Sweden 1968 Swedish National Election Studies
Sweden 1970 Swedish National Election Studies
Sweden 1973 Swedish National Election Studies
Sweden 1976 Swedish National Election Studies
Sweden 1979 Swedish National Election Studies
Sweden 1982 Swedish National Election Studies
Sweden 1985 Swedish National Election Studies
Sweden 1988 Swedish National Election Studies
Sweden 1991 Swedish National Election Studies
Sweden 1994 Swedish National Election Studies
Sweden 1998 Swedish National Election Studies
Sweden 2002 Swedish National Election Studies
Sweden 2006 Swedish National Election Studies
Sweden 2010 Swedish National Election Studies
Sweden 2014 Comparative Study of Electoral Systems (CSES)
Switzerland 1967 Swiss National Election Studies
Switzerland 1971 Swiss National Election Studies
Switzerland 1975 Swiss National Election Studies
Switzerland 1979 Swiss National Election Studies
Switzerland 1983 Swiss National Election Studies
Switzerland 1987 Swiss National Election Studies
Switzerland 1991 Swiss National Election Studies
Switzerland 1995 Swiss National Election Studies
Switzerland 1999 Swiss National Election Studies
Switzerland 2003 Swiss National Election Studies
Switzerland 2007 Swiss National Election Studies
Switzerland 2011 Swiss National Election Studies
Switzerland 2015 Swiss National Election Studies
Switzerland 2019 Swiss National Election Studies
UK 1955 British Election Studies
UK 1959 British Election Studies
UK 1964 British Election Studies
UK 1966 British Election Studies
UK 1970 British Election Studies
UK 1974 British Election Studies
UK 1979 British Election Studies
UK 1983 British Election Studies
UK 1987 British Election Studies
UK 1992 British Election Studies
UK 1997 British Election Studies
UK 2001 British Election Studies
UK 2005 British Election Studies
UK 2010 British Election Studies
UK 2015 British Election Studies
UK 2017 British Election Studies
US 1948 American National Election Studies
US 1952 American National Election Studies
US 1956 American National Election Studies
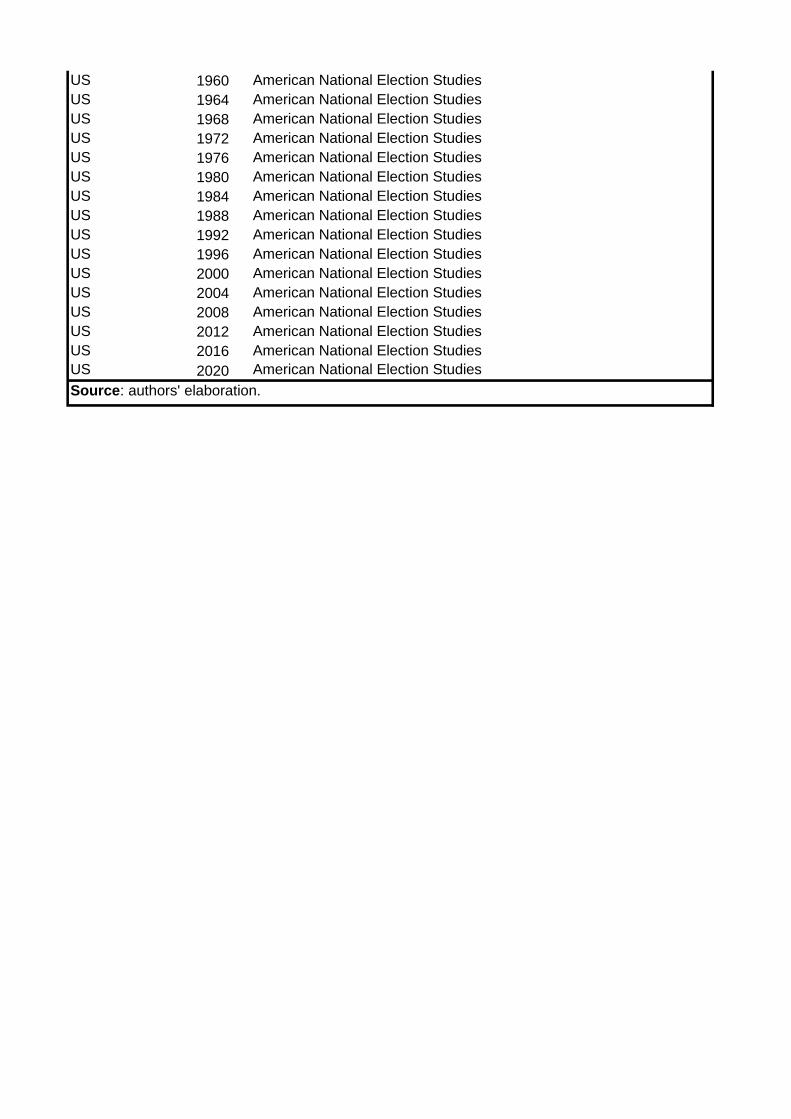
US 1960 American National Election Studies
US 1964 American National Election Studies
US 1968 American National Election Studies
US 1972 American National Election Studies
US 1976 American National Election Studies
US 1980 American National Election Studies
US 1984 American National Election Studies
US 1988 American National Election Studies
US 1992 American National Election Studies
US 1996 American National Election Studies
US 2000 American National Election Studies
US 2004 American National Election Studies
US 2008 American National Election Studies
US 2012 American National Election Studies
US 2016 American National Election Studies
US 2020 American National Election Studies
Source: authors' elaboration.
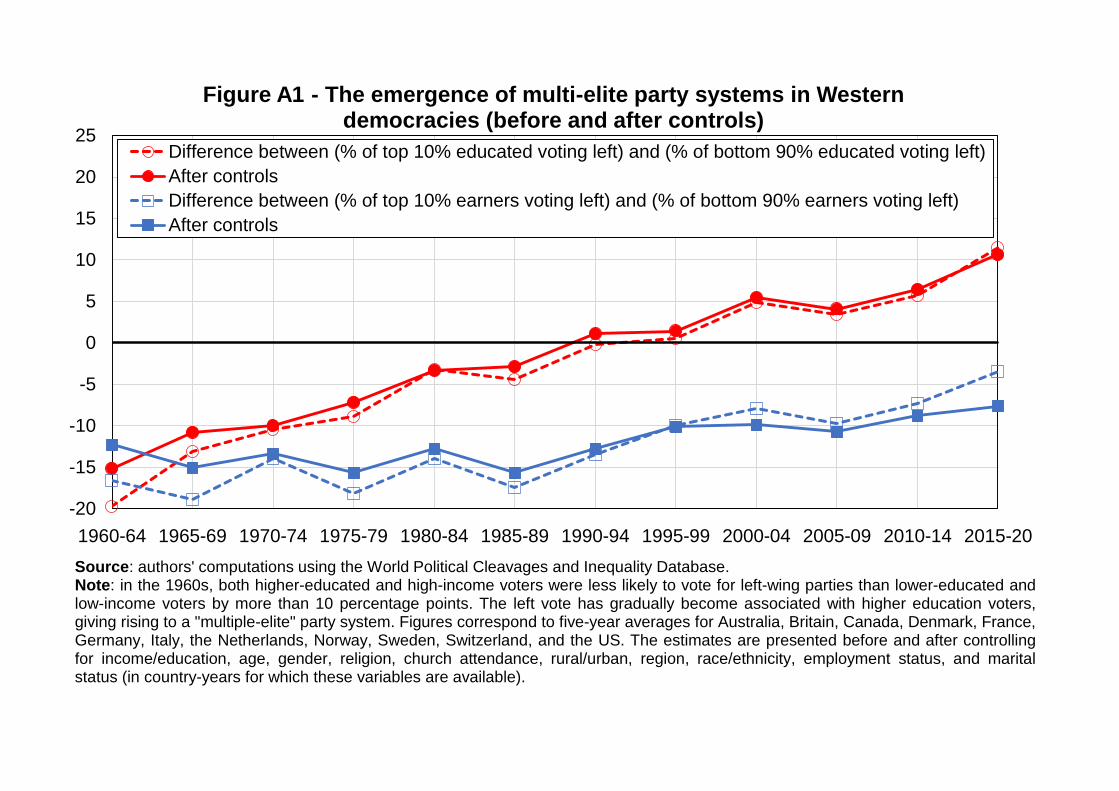
-20
-15
-10
-5
0
5
10
15
20
25
1960-64 1965-69 1970-74 1975-79 1980-84 1985-89 1990-94 1995-99 2000-04 2005-09 2010-14 2015-20
Figure A1 - The emergence of multi-elite party systems in Western democracies (before and after controls)
Difference between (% of top 10% educated voting left) and (% of bottom 90% educated voting left)
After controls
Difference between (% of top 10% earners voting left) and (% of bottom 90% earners voting left)
After controls
Source: authors' computations using the World Political Cleavages and Inequality Database.Note: in the 1960s, both higher-educated and high-income voters were less likely to vote for left-wing parties than lower-educated andlow-income voters by more than 10 percentage points. The left vote has gradually become associated with higher education voters,giving rising to a "multiple-elite" party system. Figures correspond to five-year averages for Australia, Britain, Canada, Denmark, France,Germany, Italy, the Netherlands, Norway, Sweden, Switzerland, and the US. The estimates are presented before and after controllingfor income/education, age, gender, religion, church attendance, rural/urban, region, race/ethnicity, employment status, and maritalstatus (in country-years for which these variables are available).

-12
-10
-8
-6
-4
-2
0
2
4
6
8
10
12
14
16
18
20
1960-64 1965-69 1970-74 1975-79 1980-84 1985-89 1990-94 1995-99 2000-04 2005-09 2010-14 2015-20
Figure A2 - The emergence of multi-elite party systems in Western democracies (top 50% vs. bottom 50%)
Difference between (% of top 50% educated voting left) and (% of bottom 50% educated voting left)
After controls
Difference between (% of top 50% earners voting left) and (% of bottom 50% earners voting left)
After controls
Source: authors' computations using the World Political Cleavages and Inequality Database.Note: in the 1960s, both higher-educated and high-income voters were less likely to vote for left-wing parties than lower-educated andlow-income voters. The left vote has gradually become associated with higher education voters, giving rising to a "multiple-elite" partysystem. Figures correspond to five-year averages for Australia, Britain, Canada, Denmark, France, Germany, Italy, the Netherlands,Norway, Sweden, Switzerland, and the US. The estimates are presented before and after controlling for income/education, age, gender,religion, church attendance, rural/urban, region, race/ethnicity, employment status, and marital status (in country-years for which thesevariables are available).
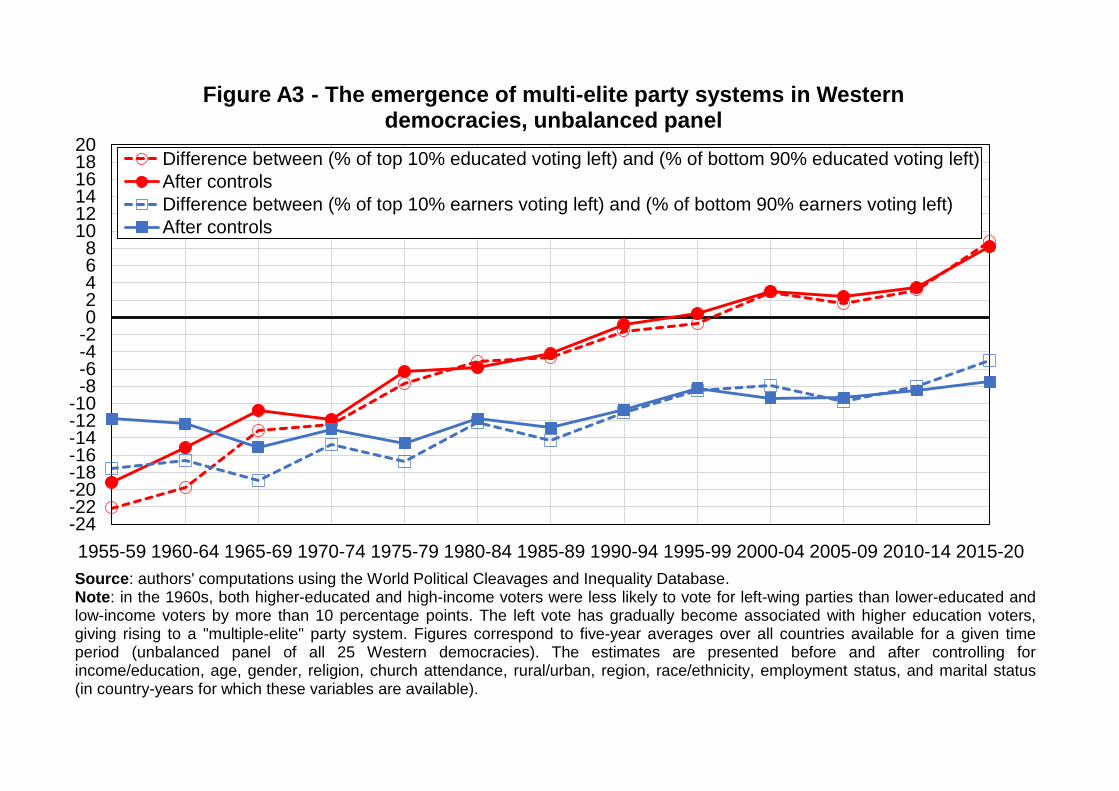
-24-22-20-18-16-14-12-10-8-6-4-202468
101214161820
1955-59 1960-64 1965-69 1970-74 1975-79 1980-84 1985-89 1990-94 1995-99 2000-04 2005-09 2010-14 2015-20
Figure A3 - The emergence of multi-elite party systems in Western democracies, unbalanced panel
Difference between (% of top 10% educated voting left) and (% of bottom 90% educated voting left)
After controls
Difference between (% of top 10% earners voting left) and (% of bottom 90% earners voting left)
After controls
Source: authors' computations using the World Political Cleavages and Inequality Database.Note: in the 1960s, both higher-educated and high-income voters were less likely to vote for left-wing parties than lower-educated andlow-income voters by more than 10 percentage points. The left vote has gradually become associated with higher education voters,giving rising to a "multiple-elite" party system. Figures correspond to five-year averages over all countries available for a given timeperiod (unbalanced panel of all 25 Western democracies). The estimates are presented before and after controlling forincome/education, age, gender, religion, church attendance, rural/urban, region, race/ethnicity, employment status, and marital status(in country-years for which these variables are available).
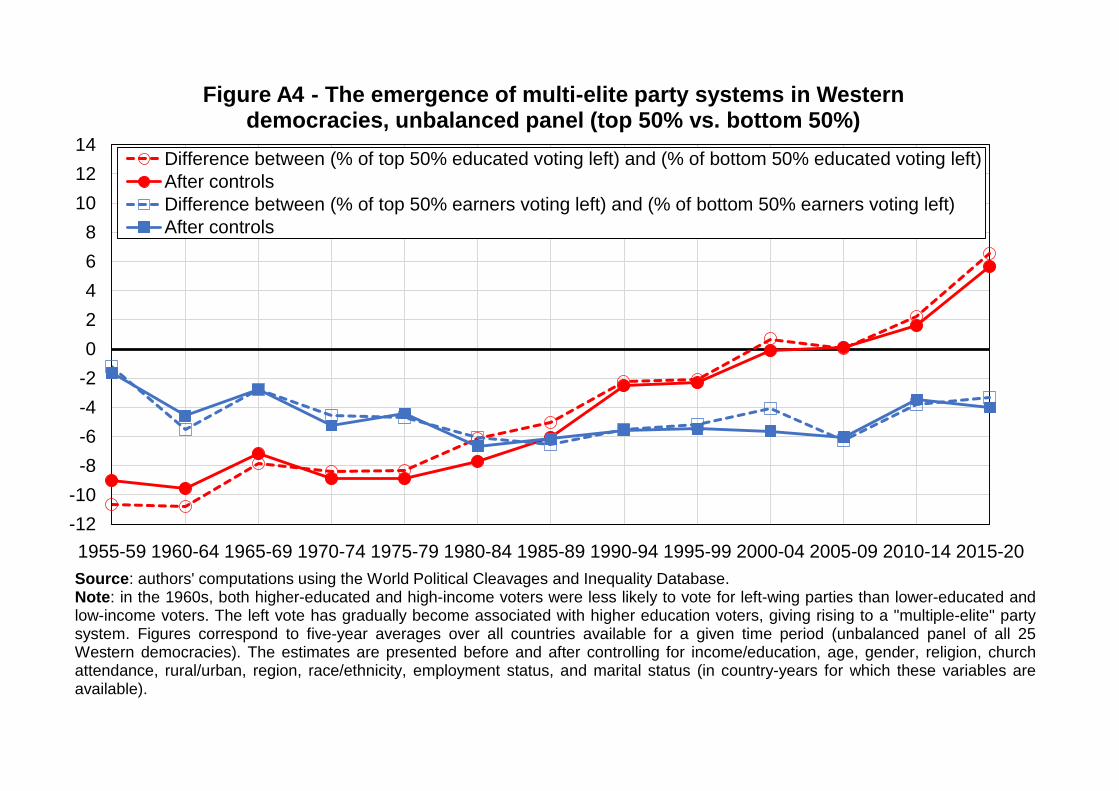
-12
-10
-8
-6
-4
-2
0
2
4
6
8
10
12
14
1955-59 1960-64 1965-69 1970-74 1975-79 1980-84 1985-89 1990-94 1995-99 2000-04 2005-09 2010-14 2015-20
Figure A4 - The emergence of multi-elite party systems in Western democracies, unbalanced panel (top 50% vs. bottom 50%)
Difference between (% of top 50% educated voting left) and (% of bottom 50% educated voting left)
After controls
Difference between (% of top 50% earners voting left) and (% of bottom 50% earners voting left)
After controls
Source: authors' computations using the World Political Cleavages and Inequality Database.Note: in the 1960s, both higher-educated and high-income voters were less likely to vote for left-wing parties than lower-educated andlow-income voters. The left vote has gradually become associated with higher education voters, giving rising to a "multiple-elite" partysystem. Figures correspond to five-year averages over all countries available for a given time period (unbalanced panel of all 25Western democracies). The estimates are presented before and after controlling for income/education, age, gender, religion, churchattendance, rural/urban, region, race/ethnicity, employment status, and marital status (in country-years for which these variables areavailable).

-40-35-30-25-20-15-10-505
101520253035404550
1950-59 1960-69 1970-79 1980-89 1990-99 2000-09 2010-20
Figure A5 - The reversal of educational divides, all Western democracies
Australia Austria Belgium Britain Canada Denmark
Finland France Germany Iceland Ireland Italy
Luxembourg Netherlands New Zealand Norway Portugal Spain
Sweden Switzerland Average United States
Source: authors' computations using the World Political Cleavages and Inequality Database.Note: the figure represents the difference between the share of higher-educated (top 10%) and lower-educated (bottom 90%) voters voting for left-wing (socialist, social-democratic, communist, and green) parties in Western countries. In nearly all countries, higher-educated voters used to be significantly more likely to vote for right-wing parties and have gradually become more likely to vote for left-wing parties.

-40-35-30-25-20-15-10-505
101520253035404550
1950-59 1960-69 1970-79 1980-89 1990-99 2000-09 2010-20
Figure A6 - The reversal of educational divides, all Western democracies, after controls
Australia Austria Belgium Britain Canada Denmark
Finland France Germany Iceland Ireland Italy
Luxembourg Netherlands New Zealand Norway Portugal Spain
Sweden Switzerland Average United States
Source: authors' computations using the World Political Cleavages and Inequality Database.Note: the figure represents the difference between the share of higher-educated (top 10%) and lower-educated (bottom 90%) votersvoting for left-wing (socialist, social-democratic, communist, and green) parties in Western countries, after controlling for income, age, gender, religion, church attendance, rural/urban, region, race/ethnicity, employment status, and marital status (in country-years for which these variables are available). In nearly all countries, higher-educated voters used to be significantly more likely to vote for right-wing parties and have gradually become more likely to vote for left-wing parties.
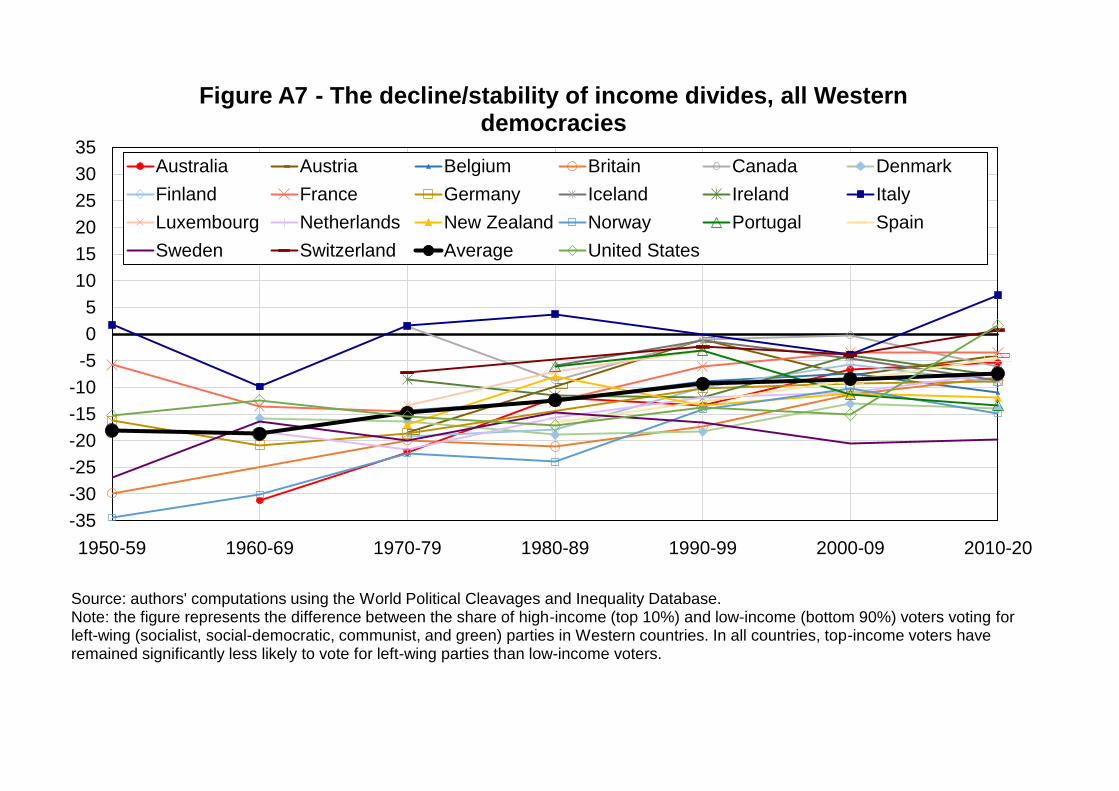
-35
-30
-25
-20
-15
-10
-5
0
5
10
15
20
25
30
35
1950-59 1960-69 1970-79 1980-89 1990-99 2000-09 2010-20
Figure A7 - The decline/stability of income divides, all Western democracies
Australia Austria Belgium Britain Canada Denmark
Finland France Germany Iceland Ireland Italy
Luxembourg Netherlands New Zealand Norway Portugal Spain
Sweden Switzerland Average United States
Source: authors' computations using the World Political Cleavages and Inequality Database.Note: the figure represents the difference between the share of high-income (top 10%) and low-income (bottom 90%) voters voting for left-wing (socialist, social-democratic, communist, and green) parties in Western countries. In all countries, top-income voters have remained significantly less likely to vote for left-wing parties than low-income voters.

-35
-30
-25
-20
-15
-10
-5
0
5
10
15
20
25
30
35
1950-59 1960-69 1970-79 1980-89 1990-99 2000-09 2010-20
Figure A8 - The decline/stability of income divides, all Western democracies, after controls
Australia Austria Belgium Britain Canada Denmark
Finland France Germany Iceland Ireland Italy
Luxembourg Netherlands New Zealand Norway Portugal Spain
Sweden Switzerland Average United States
Source: authors' computations using the World Political Cleavages and Inequality Database.Note: the figure represents the difference between the share of high-income (top 10%) and low-income (bottom 90%) voters voting for left-wing (socialist, social-democratic, communist, and green) parties in Western countries. In all countries, top-income voters have remained significantly less likely to vote for left-wing parties than low-income voters. Estimates control for education, age, gender, religion, church attendance, rural/urban, region, race/ethnicity, employment status, and marital status (in country-years for which these variables are available).
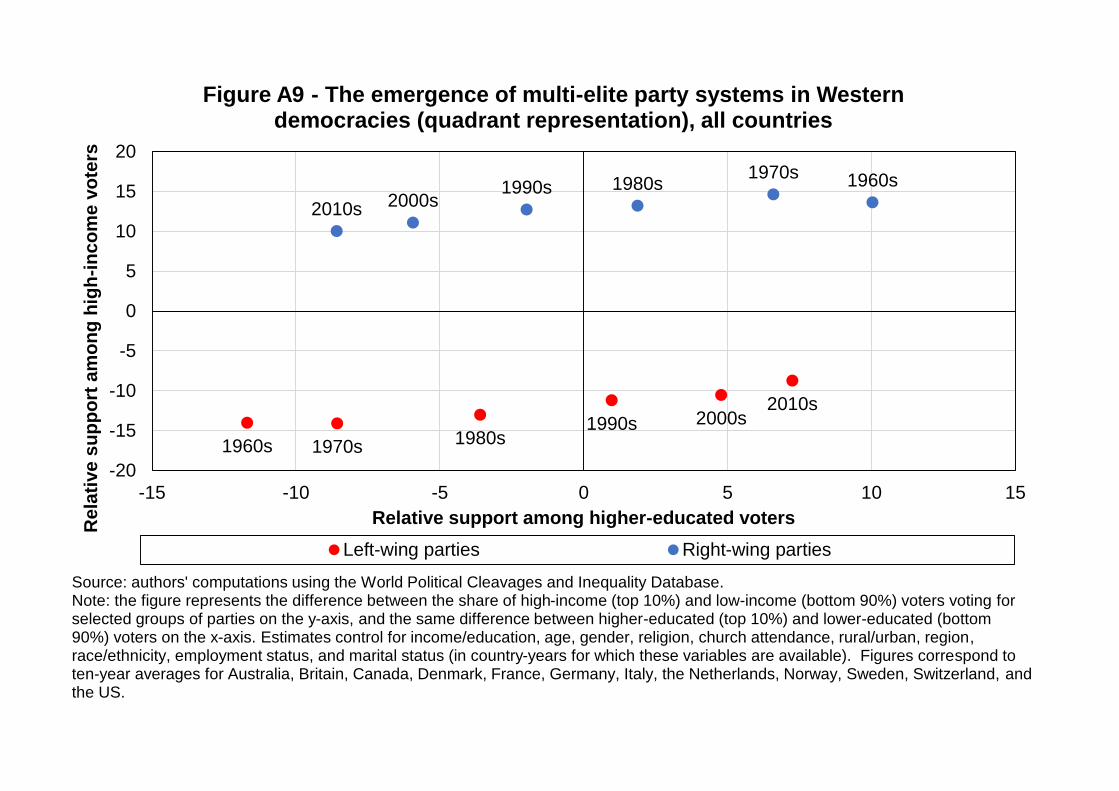
1960s 1970s 1980s1990s 2000s
2010s
1960s1970s1980s1990s
2000s2010s
-20
-15
-10
-5
0
5
10
15
20
-15 -10 -5 0 5 10 15
Re
lati
ve
su
pp
ort
am
on
g h
igh
-in
co
me
vo
ters
Relative support among higher-educated voters
Figure A9 - The emergence of multi-elite party systems in Western democracies (quadrant representation), all countries
Left-wing parties Right-wing parties
Source: authors' computations using the World Political Cleavages and Inequality Database.Note: the figure represents the difference between the share of high-income (top 10%) and low-income (bottom 90%) voters voting for selected groups of parties on the y-axis, and the same difference between higher-educated (top 10%) and lower-educated (bottom 90%) voters on the x-axis. Estimates control for income/education, age, gender, religion, church attendance, rural/urban, region, race/ethnicity, employment status, and marital status (in country-years for which these variables are available). Figures correspond to ten-year averages for Australia, Britain, Canada, Denmark, France, Germany, Italy, the Netherlands, Norway, Sweden, Switzerland, and the US.

Germany
France
UK
Italy
Norway
Sweden
US
Germany
France
UK
Italy
Norway
Sweden
US
-30
-20
-10
0
10
20
30
40
-40 -30 -20 -10 0 10 20 30 40
Re
lati
ve
su
pp
ort
am
on
g h
igh
-in
co
me
vo
ters
Relative support among higher-educated voters
Figure A10 - Income and educational divides in Western democracies, 1950s
Left-wing parties Right-wing parties

Australia
Canada
Germany
Denmark France
UK
Italy
NetherlandsNorway
SwedenUS
Australia
Canada
Germany
Denmark
France
UK
Italy
Netherlands
Norway
SwedenUS
-40
-30
-20
-10
0
10
20
30
40
-40 -30 -20 -10 0 10 20 30 40
Re
lati
ve
su
pp
ort
am
on
g h
igh
-in
co
me
vo
ters
Relative support among higher-educated voters
Figure A11 - Income and educational divides in Western democracies, 1960s
Left-wing parties Right-wing parties

Austria
Australia
BelgiumCanada
Switzerland
Germany
Denmark
Finland France
UK
Ireland
Italy
Luxembourg
Netherlands
Norway
New Z.
Sweden
US
Austria
Australia
BelgiumCanada
Switzerland Germany
DenmarkFinland
FranceUK
Ireland
Italy
Luxembourg
NetherlandsNorway
New Z.
Sweden
US
-30
-20
-10
0
10
20
30
-25 -20 -15 -10 -5 0 5 10 15 20 25
Re
lati
ve
su
pp
ort
am
on
g h
igh
-in
co
me
vo
ters
Relative support among higher-educated voters
Figure A12 - Income and educational divides in Western democracies, 1970s
Left-wing parties Right-wing parties

AustriaAustraliaBelgium
Canada
Denmark
SpainFinland
FranceUK
Ireland
IcelandItaly
Luxembourg
Netherlands
Norway
New Z.
Portugal
Sweden
US
Austria
AustraliaBelgium
Canada
Denmark
Spain
Finland
France
UK
Ireland
Iceland
Italy
Luxembourg
Netherlands
Norway
New Z.
Portugal
SwedenUS
-30
-20
-10
0
10
20
30
-20 -15 -10 -5 0 5 10 15 20
Re
lati
ve
su
pp
ort
am
on
g h
igh
-in
co
me
vo
ters
Relative support among higher-educated voters
Figure A13 - Income and educational divides in Western democracies, 1980s
Left-wing parties Right-wing parties

Austria
Australia
Belgium
Canada
Switzerland
Germany
Denmark
Finland
FranceUKIreland
Iceland
Luxembourg
NetherlandsNorway
New Z.
Portugal
Sweden
US
Austria
Australia
Belgium
Canada Switzerland
Germany
Denmark
FinlandFrance
UK
Ireland
Iceland
Luxembourg
NetherlandsNorway
New Z.
Portugal
Sweden
US
-25
-20
-15
-10
-5
0
5
10
15
20
25
-15 -10 -5 0 5 10 15
Re
lati
ve
su
pp
ort
am
on
g h
igh
-in
co
me
vo
ters
Relative support among higher-educated voters
Figure A14 - Income and educational divides in Western democracies, 1990s
Left-wing parties Right-wing parties

AustriaAustralia
BelgiumCanada
Switzerland
Germany
Denmark
Spain
FinlandFrance
UK
Ireland
Iceland
Italy
Luxembourg Netherlands
NorwayNew Z.
Portugal
Sweden
US
Austria
Australia
BelgiumCanada
SwitzerlandGermany
Denmark
SpainFinland
France
UK
Ireland
Iceland
Italy
Luxembourg
NetherlandsNorway
New Z.
Portugal
Sweden
US
-25
-20
-15
-10
-5
0
5
10
15
20
25
-15 -10 -5 0 5 10 15
Re
lati
ve
su
pp
ort
am
on
g h
igh
-in
co
me
vo
ters
Relative support among higher-educated voters
Figure A15 - Income and educational divides in Western democracies, 2000s
Left-wing parties Right-wing parties
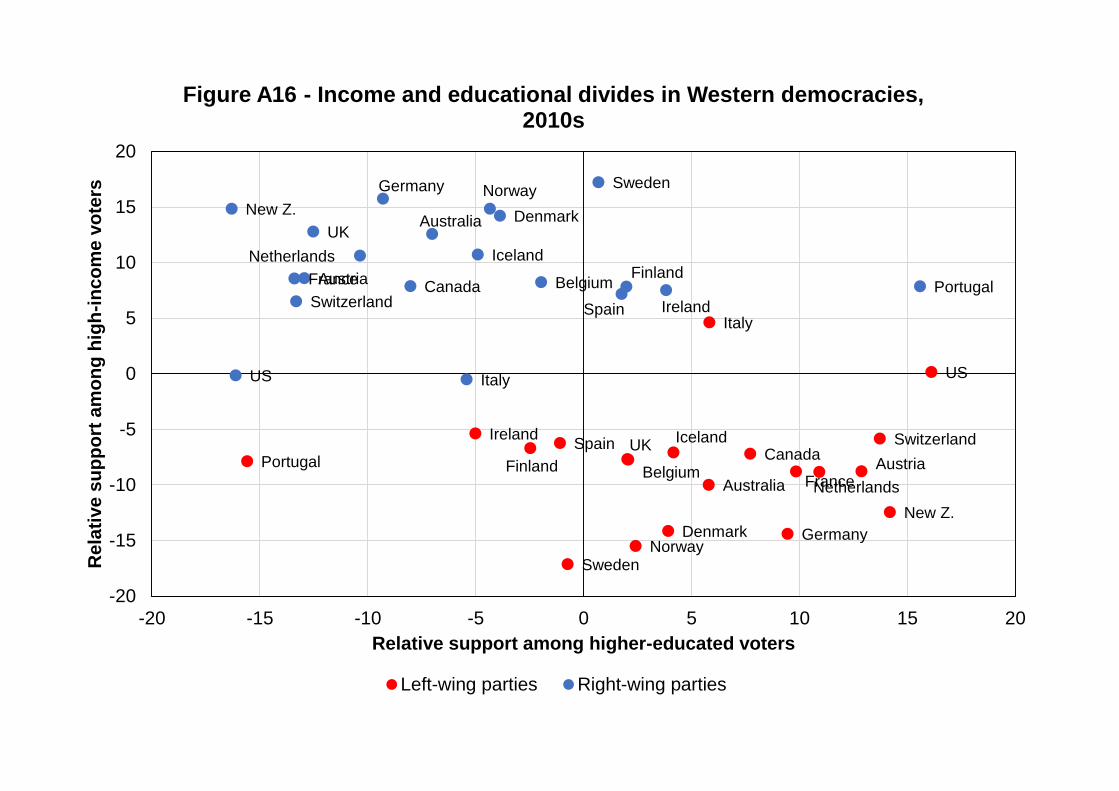
Austria
AustraliaBelgium
CanadaSwitzerland
GermanyDenmark
Spain
FinlandFrance
UKIreland Iceland
Italy
Netherlands
Norway
New Z.
Portugal
Sweden
US
Austria
Australia
BelgiumCanadaSwitzerland
Germany
Denmark
Spain
FinlandFrance
UK
Ireland
Iceland
Italy
Netherlands
NorwayNew Z.
Portugal
Sweden
US
-20
-15
-10
-5
0
5
10
15
20
-20 -15 -10 -5 0 5 10 15 20
Re
lati
ve
su
pp
ort
am
on
g h
igh
-in
co
me
vo
ters
Relative support among higher-educated voters
Figure A16 - Income and educational divides in Western democracies, 2010s
Left-wing parties Right-wing parties

0
0,1
0,2
0,3
0,4
0,5
0,6
0,7
0,8
1950-59 1960-69 1970-79 1980-89 1990-99 2000-09 2010-20
Figure A17 - Correlation between income and education
Austria Belgium Canada Denmark Finland
France Germany Iceland Ireland Italy
Luxembourg Netherlands New Zealand Norway Portugal
Spain Sweden Switzerland United Kingdom United States
Average
Source: authors' computations using the World Political Cleavages and Inequality Database.Note: the figure represents the correlation between income and education in post-electoral surveys in all Western democracies. Income is defined as the rank (quantile group) to which individuals belong, computed directly from raw income brackets. Education is defined as education deciles, computed from available educational categories (see methodology).

-24
-20
-16
-12
-8
-4
0
4
8
12
16
1955-59 1960-64 1965-69 1970-74 1975-79 1980-84 1985-89 1990-94 1995-99 2000-04 2005-09 2010-14 2015-20
Figure A18 - Oaxaca-Blinder decomposition of educational cleavage
Educational cleavage
Explained by group differences in predictors
Unexplained
Source: authors' computations using the World Political Cleavages and Inequality Database.Note: the figure represents a two-way Oaxaca-Blinder decomposition of the educational cleavage by decade, separating it into acomponent explained by group differences in predictors (that is, differences in the composition of educational groups by age, gender,income, etc.) and an unexplained component. The unexplained component is almost perfectly equal to the actual indicator, revealingthat the reversal of educational divides cannot be accounted for by changes in the composiiton of educational groups. Figurescorrespond to five-year averages for Australia, Britain, Canada, Denmark, France, Germany, Italy, the Netherlands, Norway, Sweden,Switzerland, and the US.
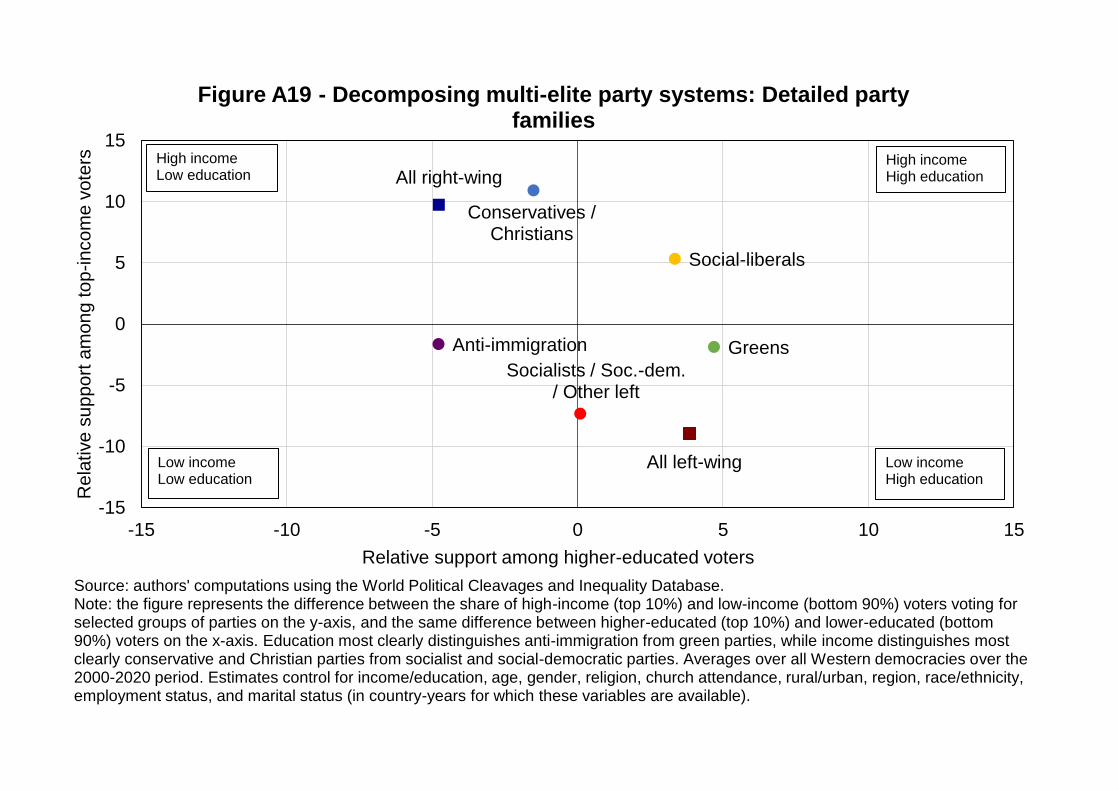
All left-wing
All right-wing
Anti-immigration
Conservatives / Christians
Greens
Social-liberals
Socialists / Soc.-dem. / Other left
-15
-10
-5
0
5
10
15
-15 -10 -5 0 5 10 15
Re
lative
su
pp
ort
am
on
g to
p-in
co
me
vo
ters
Relative support among higher-educated voters
Figure A19 - Decomposing multi-elite party systems: Detailed party families
Source: authors' computations using the World Political Cleavages and Inequality Database.Note: the figure represents the difference between the share of high-income (top 10%) and low-income (bottom 90%) voters voting for selected groups of parties on the y-axis, and the same difference between higher-educated (top 10%) and lower-educated (bottom 90%) voters on the x-axis. Education most clearly distinguishes anti-immigration from green parties, while income distinguishes most clearly conservative and Christian parties from socialist and social-democratic parties. Averages over all Western democracies over the 2000-2020 period. Estimates control for income/education, age, gender, religion, church attendance, rural/urban, region, race/ethnicity, employment status, and marital status (in country-years for which these variables are available).
High incomeLow education
Low incomeLow education
High incomeHigh education
Low incomeHigh education

0%
5%
10%
15%
20%
25%
30%
35%
40%
Figure A20 - Vote for Green parties by education group
Bottom 50% Middle 40% Top 10%
Source: authors' computations using the World Political Cleavages and Inequality Database.Note: the figure shows the share of votes received by Green parties in Western democracies in the last election available by education group.
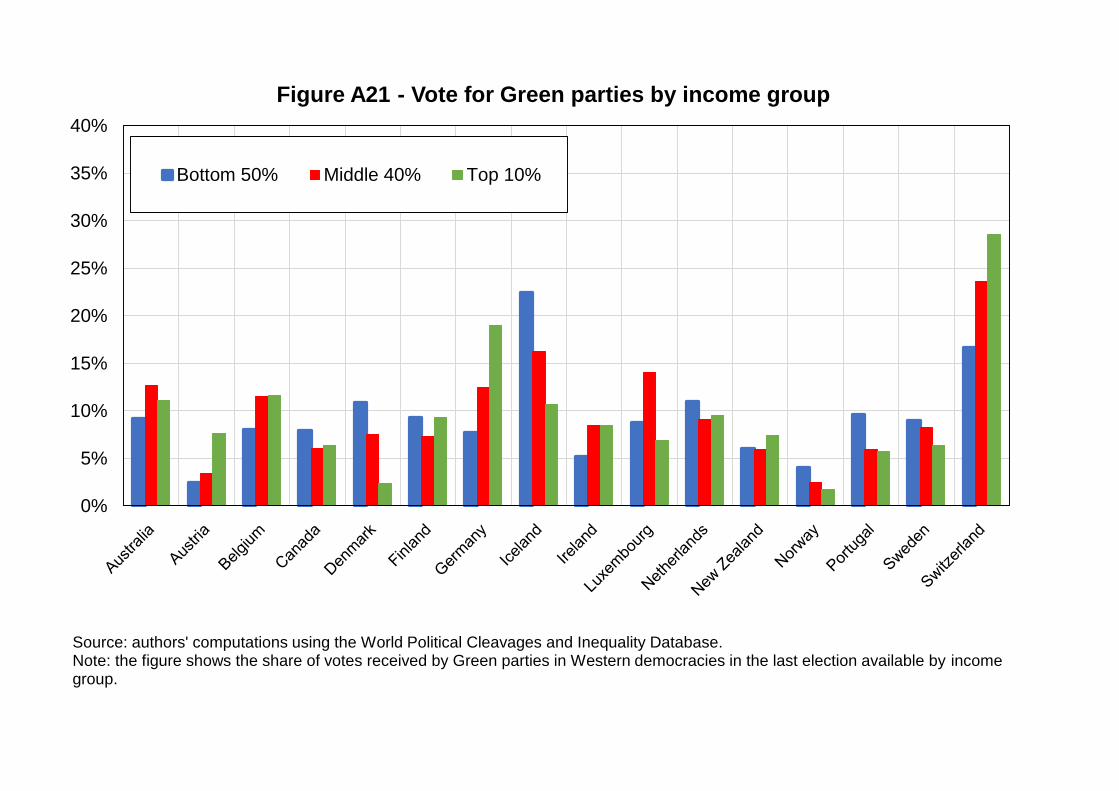
0%
5%
10%
15%
20%
25%
30%
35%
40%
Figure A21 - Vote for Green parties by income group
Bottom 50% Middle 40% Top 10%
Source: authors' computations using the World Political Cleavages and Inequality Database.Note: the figure shows the share of votes received by Green parties in Western democracies in the last election available by income group.

0%
5%
10%
15%
20%
25%
30%
35%
40%
45%
Figure A22 - Vote for anti-immigration parties by education group
Bottom 50% Middle 40% Top 10%
Source: authors' computations using the World Political Cleavages and Inequality Database.Note: the figure shows the share of votes received by anti-immigration parties in Western democracies in the last election available by education group.
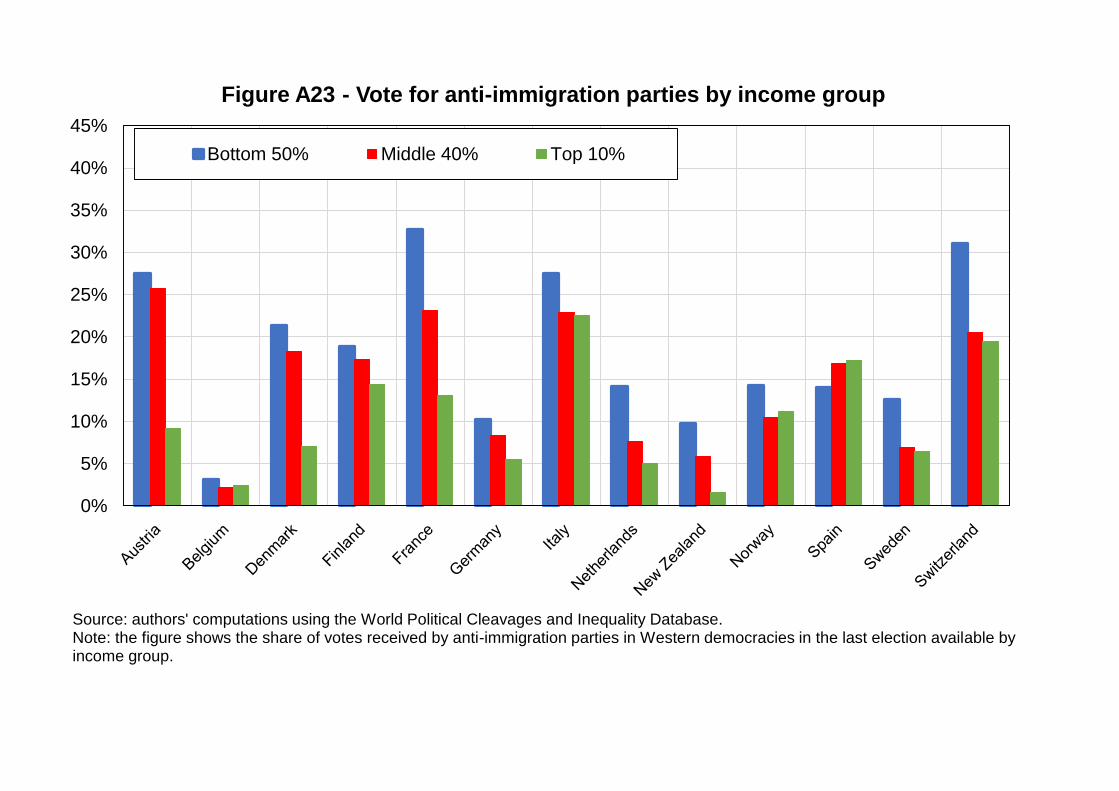
0%
5%
10%
15%
20%
25%
30%
35%
40%
45%
Figure A23 - Vote for anti-immigration parties by income group
Bottom 50% Middle 40% Top 10%
Source: authors' computations using the World Political Cleavages and Inequality Database.Note: the figure shows the share of votes received by anti-immigration parties in Western democracies in the last election available by income group.
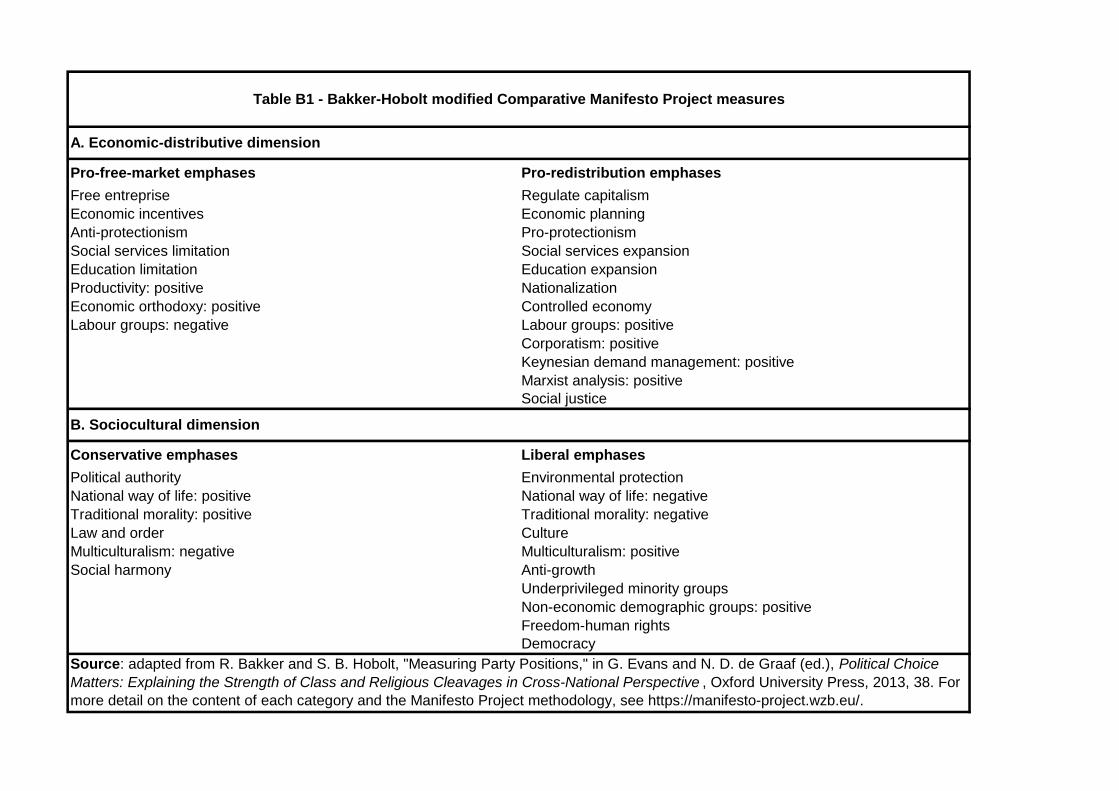
Pro-free-market emphases Pro-redistribution emphases
Free entreprise Regulate capitalism
Economic incentives Economic planning
Anti-protectionism Pro-protectionism
Social services limitation Social services expansion
Education limitation Education expansion
Productivity: positive Nationalization
Economic orthodoxy: positive Controlled economy
Labour groups: negative Labour groups: positive
Corporatism: positive
Keynesian demand management: positive
Marxist analysis: positive
Social justice
Conservative emphases Liberal emphases
Political authority Environmental protection
National way of life: positive National way of life: negative
Traditional morality: positive Traditional morality: negative
Law and order Culture
Multiculturalism: negative Multiculturalism: positive
Social harmony Anti-growth
Underprivileged minority groups
Non-economic demographic groups: positive
Freedom-human rights
Democracy
Table B1 - Bakker-Hobolt modified Comparative Manifesto Project measures
A. Economic-distributive dimension
B. Sociocultural dimension
Source: adapted from R. Bakker and S. B. Hobolt, "Measuring Party Positions," in G. Evans and N. D. de Graaf (ed.), Political Choice
Matters: Explaining the Strength of Class and Religious Cleavages in Cross-National Perspective , Oxford University Press, 2013, 38. For
more detail on the content of each category and the Manifesto Project methodology, see https://manifesto-project.wzb.eu/.
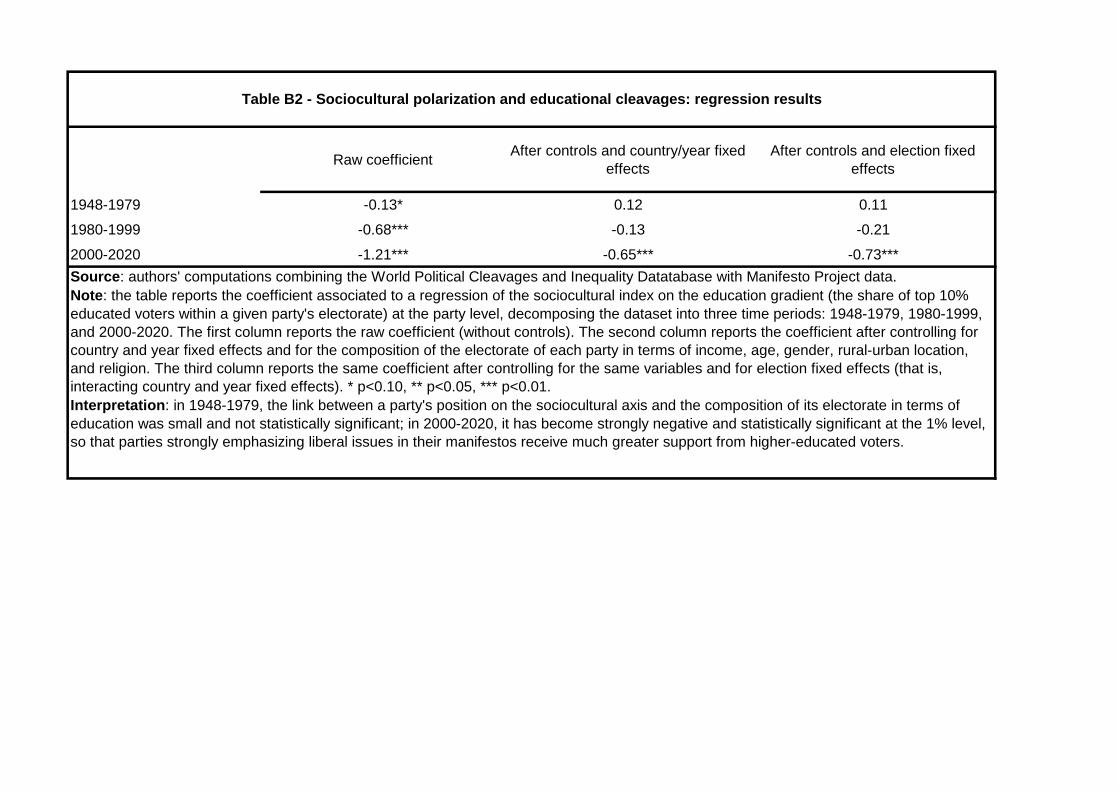
Raw coefficientAfter controls and country/year fixed
effects
After controls and election fixed
effects
1948-1979 -0.13* 0.12 0.11
1980-1999 -0.68*** -0.13 -0.21
2000-2020 -1.21*** -0.65*** -0.73***
Table B2 - Sociocultural polarization and educational cleavages: regression results
Source: authors' computations combining the World Political Cleavages and Inequality Datatabase with Manifesto Project data.
Note: the table reports the coefficient associated to a regression of the sociocultural index on the education gradient (the share of top 10%
educated voters within a given party's electorate) at the party level, decomposing the dataset into three time periods: 1948-1979, 1980-1999,
and 2000-2020. The first column reports the raw coefficient (without controls). The second column reports the coefficient after controlling for
country and year fixed effects and for the composition of the electorate of each party in terms of income, age, gender, rural-urban location,
and religion. The third column reports the same coefficient after controlling for the same variables and for election fixed effects (that is,
interacting country and year fixed effects). * p<0.10, ** p<0.05, *** p<0.01.
Interpretation: in 1948-1979, the link between a party's position on the sociocultural axis and the composition of its electorate in terms of
education was small and not statistically significant; in 2000-2020, it has become strongly negative and statistically significant at the 1% level,
so that parties strongly emphasizing liberal issues in their manifestos receive much greater support from higher-educated voters.
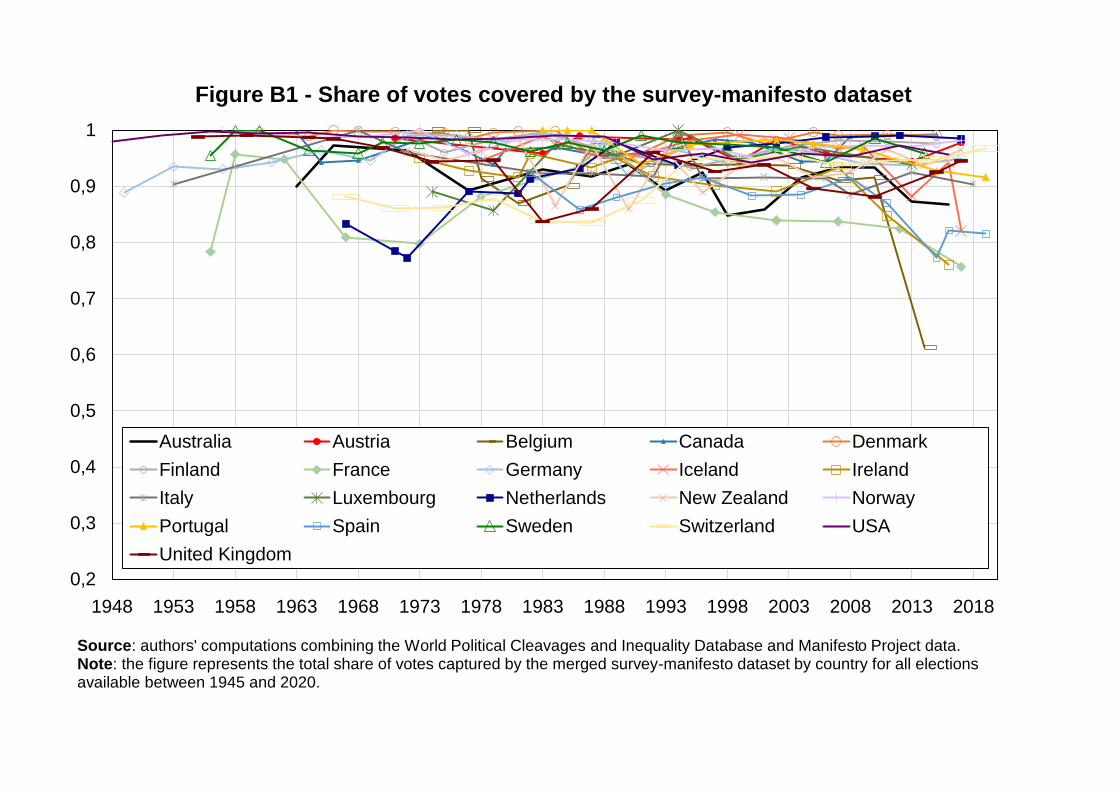
0,2
0,3
0,4
0,5
0,6
0,7
0,8
0,9
1
1948 1953 1958 1963 1968 1973 1978 1983 1988 1993 1998 2003 2008 2013 2018
Figure B1 - Share of votes covered by the survey-manifesto dataset
Australia Austria Belgium Canada Denmark
Finland France Germany Iceland Ireland
Italy Luxembourg Netherlands New Zealand Norway
Portugal Spain Sweden Switzerland USA
United Kingdom
Source: authors' computations combining the World Political Cleavages and Inequality Database and Manifesto Project data.Note: the figure represents the total share of votes captured by the merged survey-manifesto dataset by country for all elections available between 1945 and 2020.

-50
-40
-30
-20
-10
0
10
20
30
40
50
-50 -40 -30 -20 -10 0 10 20 30 40 50
Eco
no
mic
-dis
trib
utive
in
de
x
Sociocultural index
Figure B2 - Ideological polarization in Western democracies, 1950s
Conservatives Anti-immigration
Social Democrats Other
Source: authors' computations using the Comparative Manifesto Project database.Note: the figure displays the average score of all parties available in the CMP dataset in the 1950s on the economic-distributive index(y-axis) and the sociocultural index (x-axis). Parties are categorized into conservative, Christian democratic, and liberal parties; socialdemocratic, socialist, and other left-wing parties, anti-immigration parties; green parties; and other unclassifiable parties.
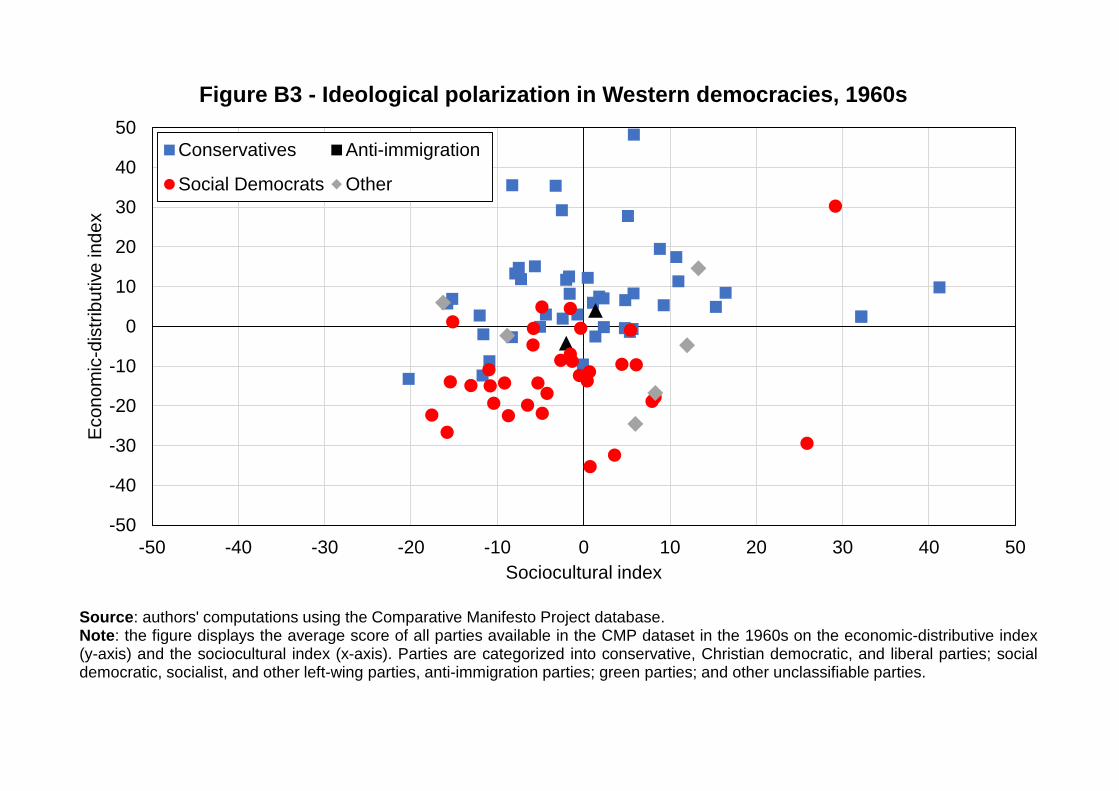
-50
-40
-30
-20
-10
0
10
20
30
40
50
-50 -40 -30 -20 -10 0 10 20 30 40 50
Eco
no
mic
-dis
trib
utive
in
de
x
Sociocultural index
Figure B3 - Ideological polarization in Western democracies, 1960s
Conservatives Anti-immigration
Social Democrats Other
Source: authors' computations using the Comparative Manifesto Project database.Note: the figure displays the average score of all parties available in the CMP dataset in the 1960s on the economic-distributive index(y-axis) and the sociocultural index (x-axis). Parties are categorized into conservative, Christian democratic, and liberal parties; socialdemocratic, socialist, and other left-wing parties, anti-immigration parties; green parties; and other unclassifiable parties.
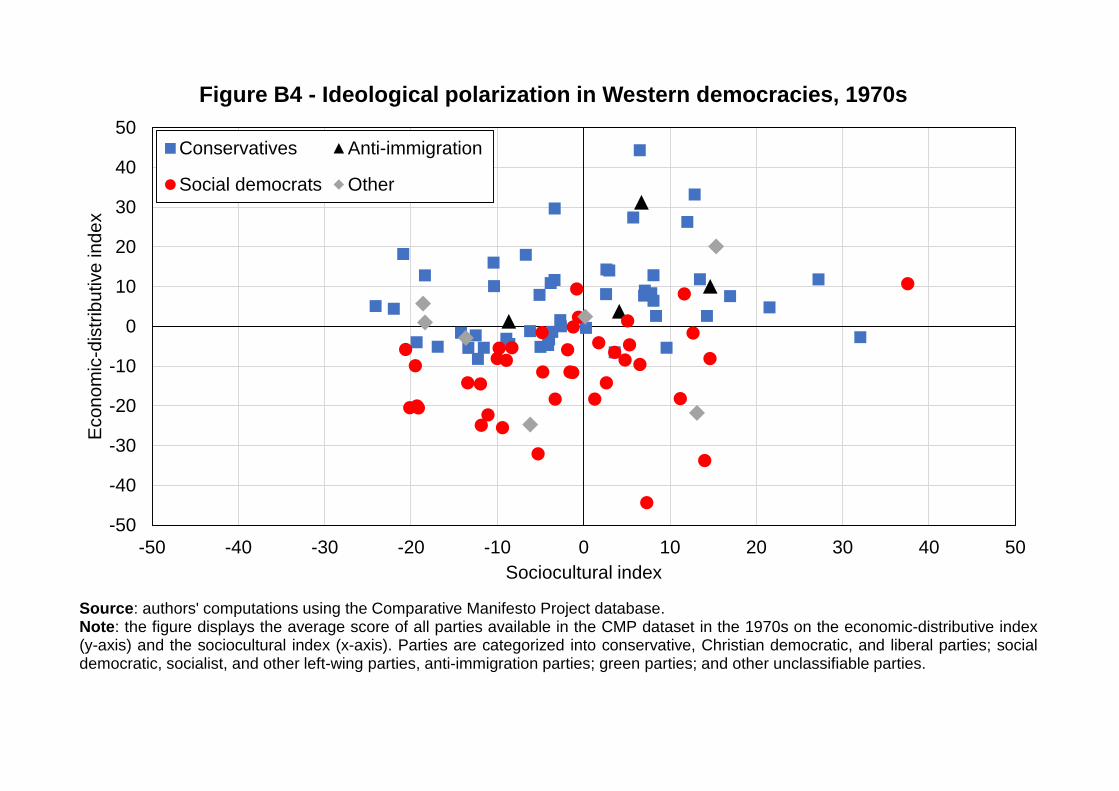
-50
-40
-30
-20
-10
0
10
20
30
40
50
-50 -40 -30 -20 -10 0 10 20 30 40 50
Eco
no
mic
-dis
trib
utive
in
de
x
Sociocultural index
Figure B4 - Ideological polarization in Western democracies, 1970s
Conservatives Anti-immigration
Social democrats Other
Source: authors' computations using the Comparative Manifesto Project database.Note: the figure displays the average score of all parties available in the CMP dataset in the 1970s on the economic-distributive index(y-axis) and the sociocultural index (x-axis). Parties are categorized into conservative, Christian democratic, and liberal parties; socialdemocratic, socialist, and other left-wing parties, anti-immigration parties; green parties; and other unclassifiable parties.

-50
-40
-30
-20
-10
0
10
20
30
40
50
-50 -40 -30 -20 -10 0 10 20 30 40 50
Eco
no
mic
-dis
trib
utive
in
de
x
Sociocultural index
Figure B5 - Ideological polarization in Western democracies, 1980s
Conservatives Anti-immigration
Social democrats Other
Source: authors' computations using the Comparative Manifesto Project database.Note: the figure displays the average score of all parties available in the CMP dataset in the 1980s on the economic-distributive index(y-axis) and the sociocultural index (x-axis). Parties are categorized into conservative, Christian democratic, and liberal parties; socialdemocratic, socialist, and other left-wing parties, anti-immigration parties; green parties; and other unclassifiable parties.

-50
-40
-30
-20
-10
0
10
20
30
40
50
-50 -40 -30 -20 -10 0 10 20 30 40 50
Eco
no
mic
-dis
trib
utive
in
de
x
Sociocultural index
Figure B6 - Ideological polarization in Western democracies, 1990s
Conservatives Anti-immigration
Social Democrats Greens
Other
Source: authors' computations using the Comparative Manifesto Project database.Note: the figure displays the average score of all parties available in the CMP dataset in the 1990s on the economic-distributive index(y-axis) and the sociocultural index (x-axis). Parties are categorized into conservative, Christian democratic, and liberal parties; socialdemocratic, socialist, and other left-wing parties, anti-immigration parties; green parties; and other unclassifiable parties.

-50
-40
-30
-20
-10
0
10
20
30
40
50
-50 -40 -30 -20 -10 0 10 20 30 40 50
Eco
no
mic
-dis
trib
utive
in
de
x
Sociocultural index
Figure B7 - Ideological polarization in Western democracies, 2000s
Conservatives Anti-immigration
Social Democrats Greens
Other
Source: authors' computations using the Comparative Manifesto Project database.Note: the figure displays the average score of all parties available in the CMP dataset in the 2000s on the economic-distributive index(y-axis) and the sociocultural index (x-axis). Parties are categorized into conservative, Christian democratic, and liberal parties; socialdemocratic, socialist, and other left-wing parties, anti-immigration parties; green parties; and other unclassifiable parties.
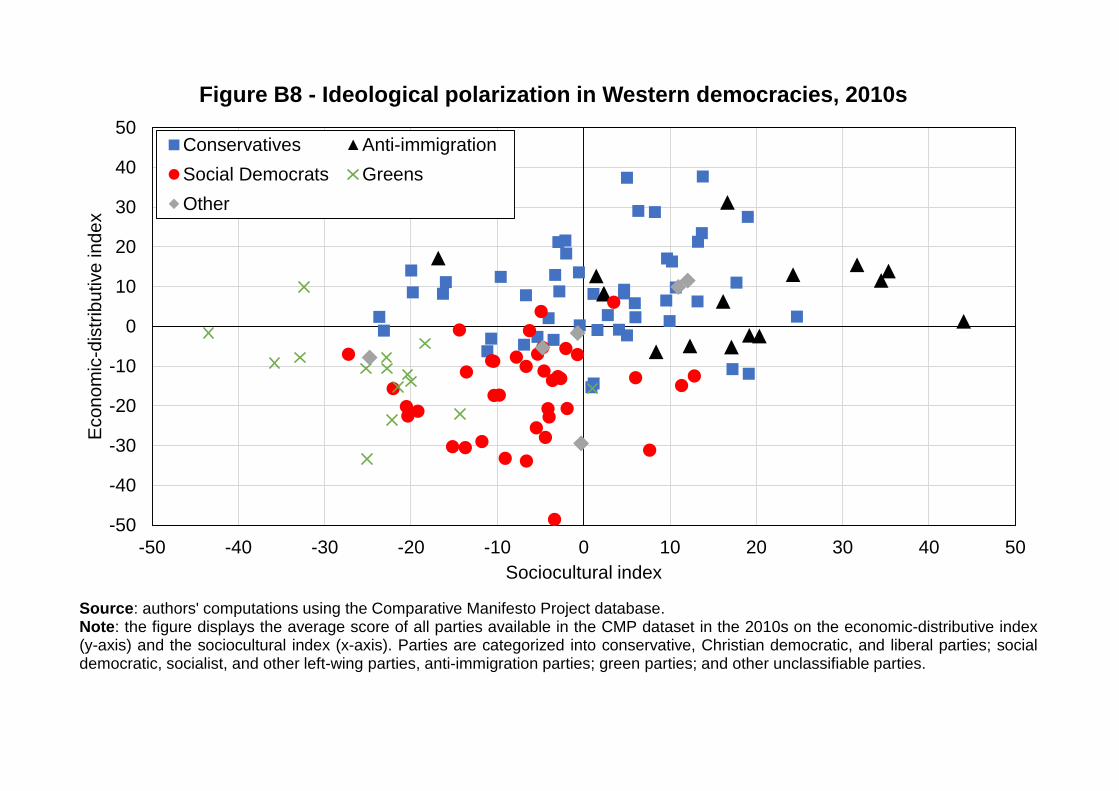
-50
-40
-30
-20
-10
0
10
20
30
40
50
-50 -40 -30 -20 -10 0 10 20 30 40 50
Eco
no
mic
-dis
trib
utive
in
de
x
Sociocultural index
Figure B8 - Ideological polarization in Western democracies, 2010s
Conservatives Anti-immigration
Social Democrats Greens
Other
Source: authors' computations using the Comparative Manifesto Project database.Note: the figure displays the average score of all parties available in the CMP dataset in the 2010s on the economic-distributive index(y-axis) and the sociocultural index (x-axis). Parties are categorized into conservative, Christian democratic, and liberal parties; socialdemocratic, socialist, and other left-wing parties, anti-immigration parties; green parties; and other unclassifiable parties.
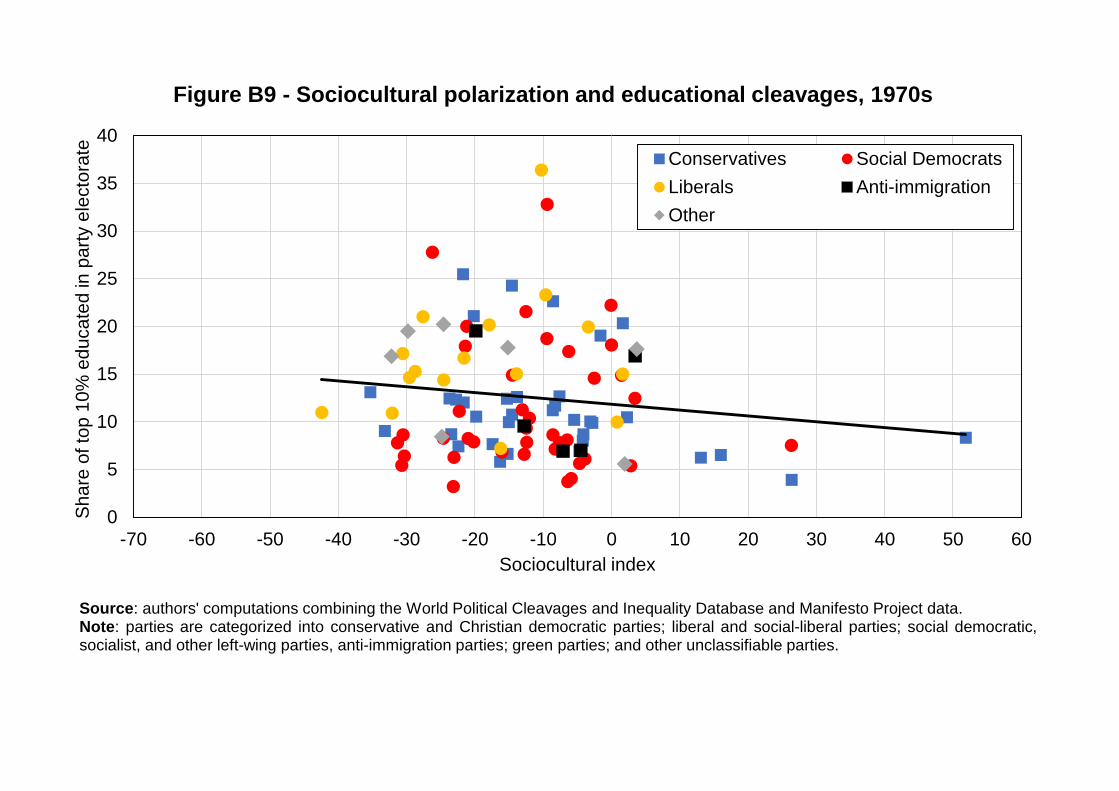
0
5
10
15
20
25
30
35
40
-70 -60 -50 -40 -30 -20 -10 0 10 20 30 40 50 60
Share
of to
p 1
0%
educate
d in p
art
y e
lecto
rate
Sociocultural index
Figure B9 - Sociocultural polarization and educational cleavages, 1970s
Conservatives Social Democrats
Liberals Anti-immigration
Other
Source: authors' computations combining the World Political Cleavages and Inequality Database and Manifesto Project data.Note: parties are categorized into conservative and Christian democratic parties; liberal and social-liberal parties; social democratic,socialist, and other left-wing parties, anti-immigration parties; green parties; and other unclassifiable parties.
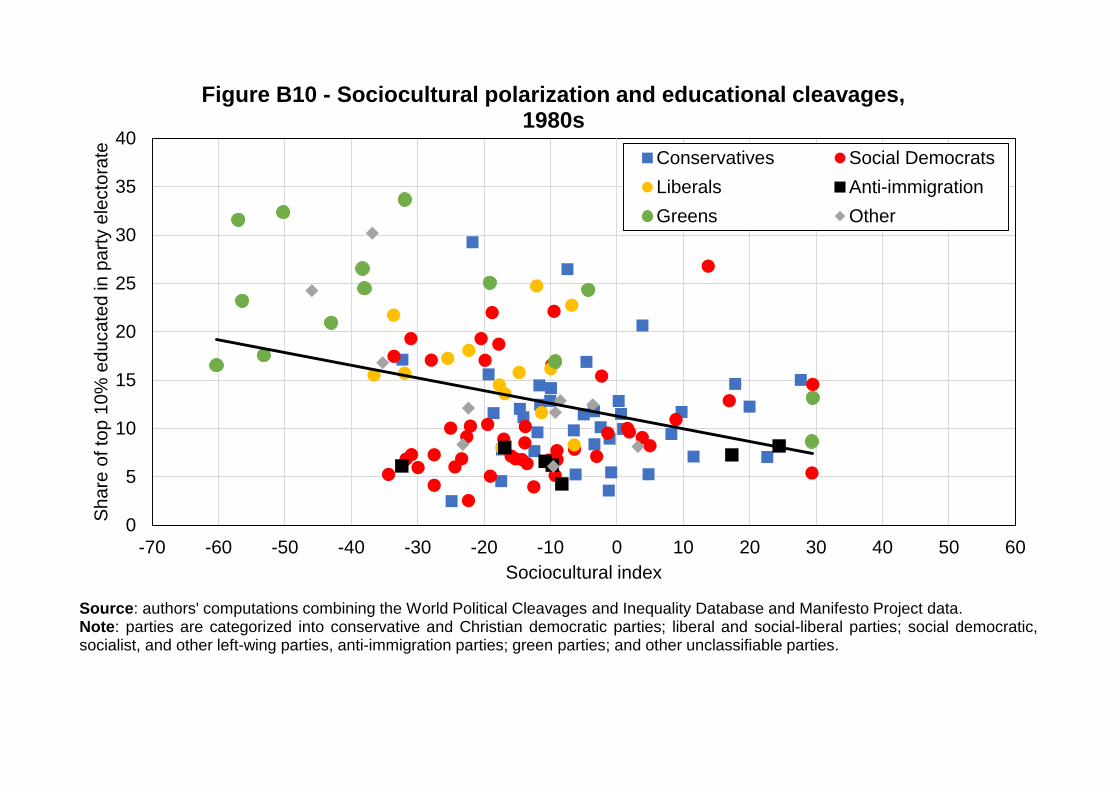
0
5
10
15
20
25
30
35
40
-70 -60 -50 -40 -30 -20 -10 0 10 20 30 40 50 60
Sh
are
of to
p 1
0%
ed
uca
ted
in
pa
rty e
lecto
rate
Sociocultural index
Figure B10 - Sociocultural polarization and educational cleavages, 1980s
Conservatives Social Democrats
Liberals Anti-immigration
Greens Other
Source: authors' computations combining the World Political Cleavages and Inequality Database and Manifesto Project data.Note: parties are categorized into conservative and Christian democratic parties; liberal and social-liberal parties; social democratic,socialist, and other left-wing parties, anti-immigration parties; green parties; and other unclassifiable parties.

0
5
10
15
20
25
30
35
40
-70 -60 -50 -40 -30 -20 -10 0 10 20 30 40 50 60
Sh
are
of to
p 1
0%
ed
uca
ted
in
pa
rty e
lecto
rate
Sociocultural index
Figure B11 - Sociocultural polarization and educational cleavages, 1990s
Conservatives Social Democrats
Liberals Anti-immigration
Greens Other
Source: authors' computations combining the World Political Cleavages and Inequality Database and Manifesto Project data.Note: parties are categorized into conservative and Christian democratic parties; liberal and social-liberal parties; social democratic,socialist, and other left-wing parties, anti-immigration parties; green parties; and other unclassifiable parties.

0
5
10
15
20
25
30
35
40
-70 -60 -50 -40 -30 -20 -10 0 10 20 30 40 50 60
Sh
are
of to
p 1
0%
ed
uca
ted
in
pa
rty e
lecto
rate
Sociocultural index
Figure B12 - Sociocultural polarization and educational cleavages, 2000s
Conservatives Social Democrats
Liberals Anti-immigration
Greens Other
Source: authors' computations combining the World Political Cleavages and Inequality Database and Manifesto Project data.Note: parties are categorized into conservative and Christian democratic parties; liberal and social-liberal parties; social democratic,socialist, and other left-wing parties, anti-immigration parties; green parties; and other unclassifiable parties.

0
5
10
15
20
25
30
35
40
-70 -60 -50 -40 -30 -20 -10 0 10 20 30 40 50 60
Sh
are
of to
p 1
0%
ed
uca
ted
in
pa
rty e
lecto
rate
Sociocultural index
Figure B13 - Sociocultural polarization and educational cleavages, 2010s
Conservatives Social Democrats
Liberals Anti-immigration
Greens Other
Source: authors' computations combining the World Political Cleavages and Inequality Database and Manifesto Project data.Note: parties are categorized into conservative and Christian democratic parties; liberal and social-liberal parties; social democratic,socialist, and other left-wing parties, anti-immigration parties; green parties; and other unclassifiable parties.

-0,5
-0,4
-0,3
-0,2
-0,1
0
0,1
0,2
0,3
0,4
0,5
0,6
0,7
0,8
1970-79 1980-89 1990 2000-09 2010-20
Figure B14 - Ideological polarization and multi-elite party systems (country-level analysis)
Correlation between education gradient and sociocultural polarization
Correlation between income gradient and economic-distributive polarization
Source: authors' computations combining the World Political Cleavages and Inequality Database and Manifesto Project data.Note: the upper lines plots the raw correlation between the education gradient (defined as the difference between the share of top 10%educated voters and the share of bottom 90% educated voters voting for left-wing parties) and sociocultural polarization (defined asthe standard deviation of the sociocultural index across all parties in a given country). Conversely, the bottom line plots the rawcorrelation between the income gradient and economic-distributive polarization (inverted, so that higher values correspond to greaterpro-redistribution emphases). Both polarization indices are normalized to the average standard deviation to highlight relativeevolutions.

-20
-15
-10
-5
0
5
10
15
20
25
30
35
40
45
1950-59 1960-69 1970-79 1980-89 1990-99 2000-09 2010-20
Figure CA1 - Vote for left-wing parties among young voters in Western democracies
Australia Austria Belgium Britain Canada Denmark
Finland France Germany Iceland Ireland Italy
Luxembourg Netherlands New Zealand Norway Portugal Spain
Sweden Switzerland United States Average
Source: authors' computations using the World Political Cleavages and Inequality Database.Note: the figure shows the difference between the share of voters younger than 25 and the share of voters aged 25 or above voting for left-wing parties in Western democracies.
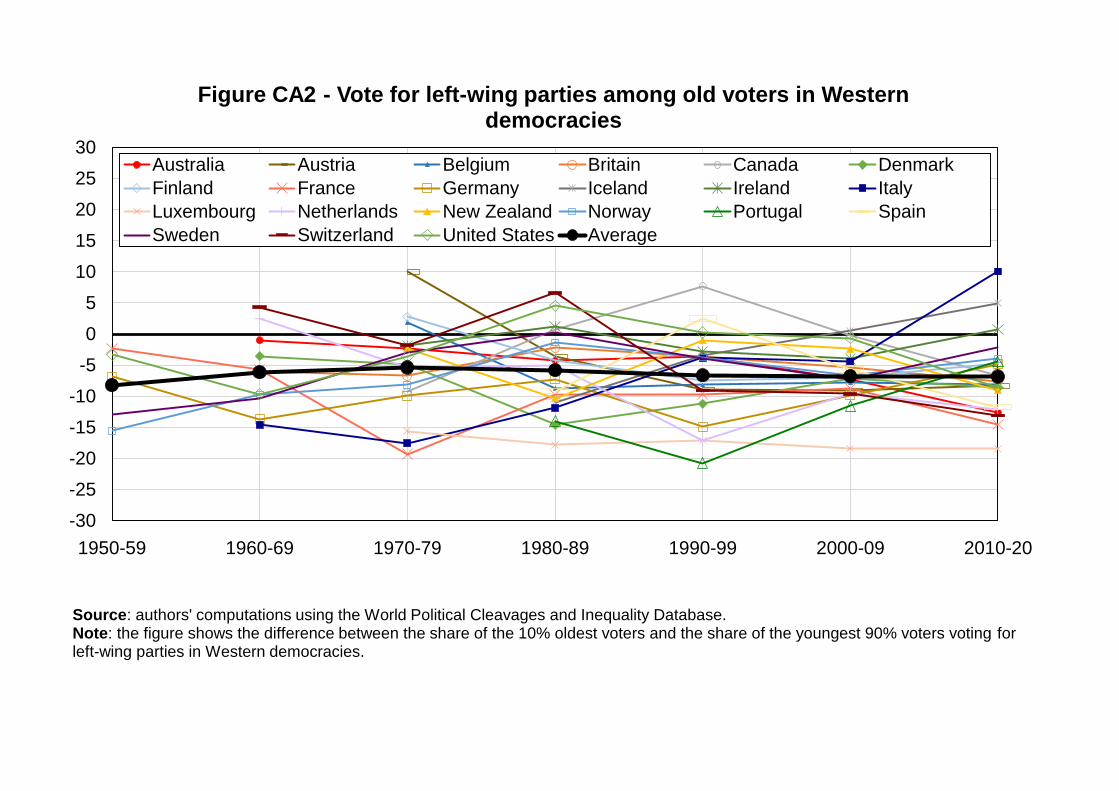
-30
-25
-20
-15
-10
-5
0
5
10
15
20
25
30
1950-59 1960-69 1970-79 1980-89 1990-99 2000-09 2010-20
Figure CA2 - Vote for left-wing parties among old voters in Western democracies
Australia Austria Belgium Britain Canada Denmark
Finland France Germany Iceland Ireland Italy
Luxembourg Netherlands New Zealand Norway Portugal Spain
Sweden Switzerland United States Average
Source: authors' computations using the World Political Cleavages and Inequality Database.Note: the figure shows the difference between the share of the 10% oldest voters and the share of the youngest 90% voters voting forleft-wing parties in Western democracies.

-20
-15
-10
-5
0
5
10
15
20
25
30
35
40
45
1950-59 1960-69 1970-79 1980-89 1990-99 2000-09 2010-20
Figure CA3 - Vote for left-wing parties among young voters in Western democracies, after controls
Australia Austria Belgium Britain Canada Denmark
Finland France Germany Iceland Ireland Italy
Luxembourg Netherlands New Zealand Norway Portugal Spain
Sweden Switzerland United States Average
Source: authors' computations using the World Political Cleavages and Inequality Database.Note: the figure shows the difference between the share of voters younger than 25 and the share of voters aged 25 or above voting for left-wing parties in Western democracies, after controlling for income, education, gender, religion, church attendance, rural/urban, region, race/ethnicity, employment status, and marital status.

-30
-25
-20
-15
-10
-5
0
5
10
15
20
25
30
1950-59 1960-69 1970-79 1980-89 1990-99 2000-09 2010-20
Figure CA4 - Vote for left-wing parties among old voters in Western democracies, after controls
Australia Austria Belgium Britain Canada Denmark
Finland France Germany Iceland Ireland Italy
Luxembourg Netherlands New Zealand Norway Portugal Spain
Sweden Switzerland United States Average
Source: authors' computations using the World Political Cleavages and Inequality Database.Note: the figure shows the difference between the share of the 10% oldest voters and the share of the youngest 90% voters voting forleft-wing parties in Western democracies, after controlling for income, education, gender, religion, church attendance, rural/urban, region, race/ethnicity, employment status, and marital status.

0%
5%
10%
15%
20%
25%
30%
35%
Figure CA5 - Vote for Green parties by age group
18-39 40-59 60+
Source: authors' computations using the World Political Cleavages and Inequality Database.Note: the figure shows the share of votes received by Green parties in Western democracies in the last election available by age group.
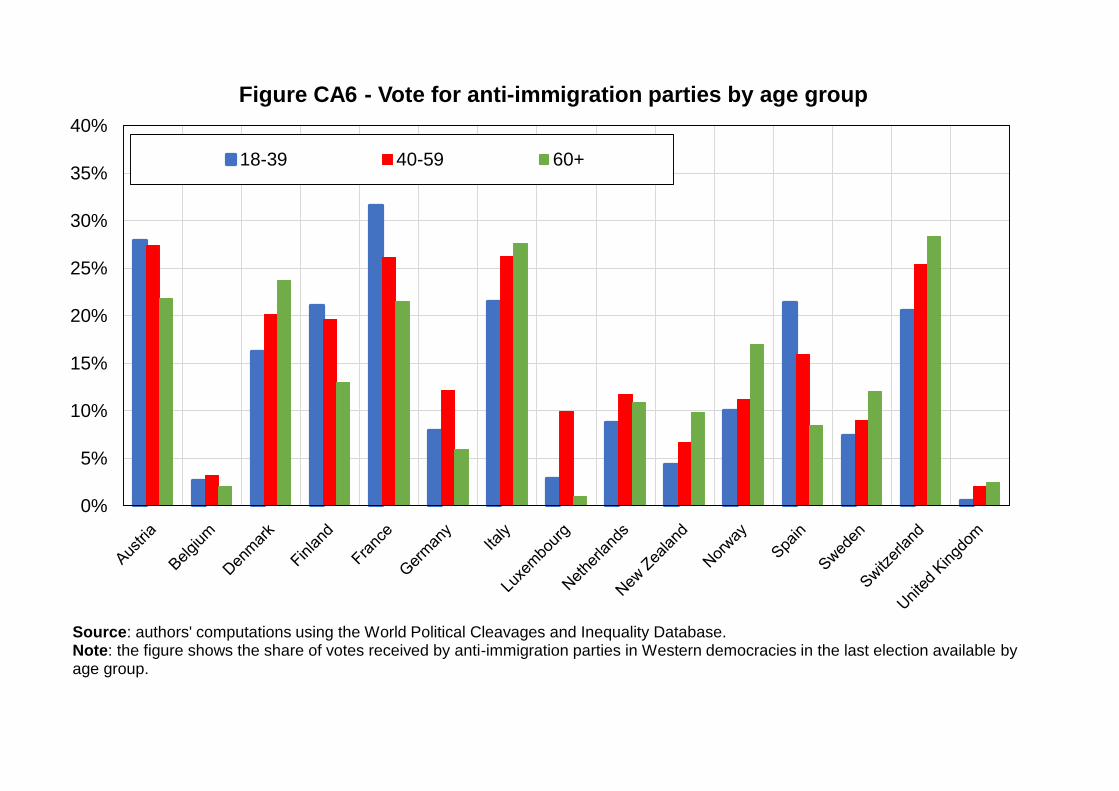
0%
5%
10%
15%
20%
25%
30%
35%
40%
Figure CA6 - Vote for anti-immigration parties by age group
18-39 40-59 60+
Source: authors' computations using the World Political Cleavages and Inequality Database.Note: the figure shows the share of votes received by anti-immigration parties in Western democracies in the last election available by age group.

0%
5%
10%
15%
20%
25%
30%
Figure CB1 - Vote for Green parties by rural-urban location in Western democracies
Urban Rural
Source: authors' computations using the World Political Cleavages and Inequality Database.Note: the figure shows the share of votes received by Green parties by rural-urban location in Western democracies.
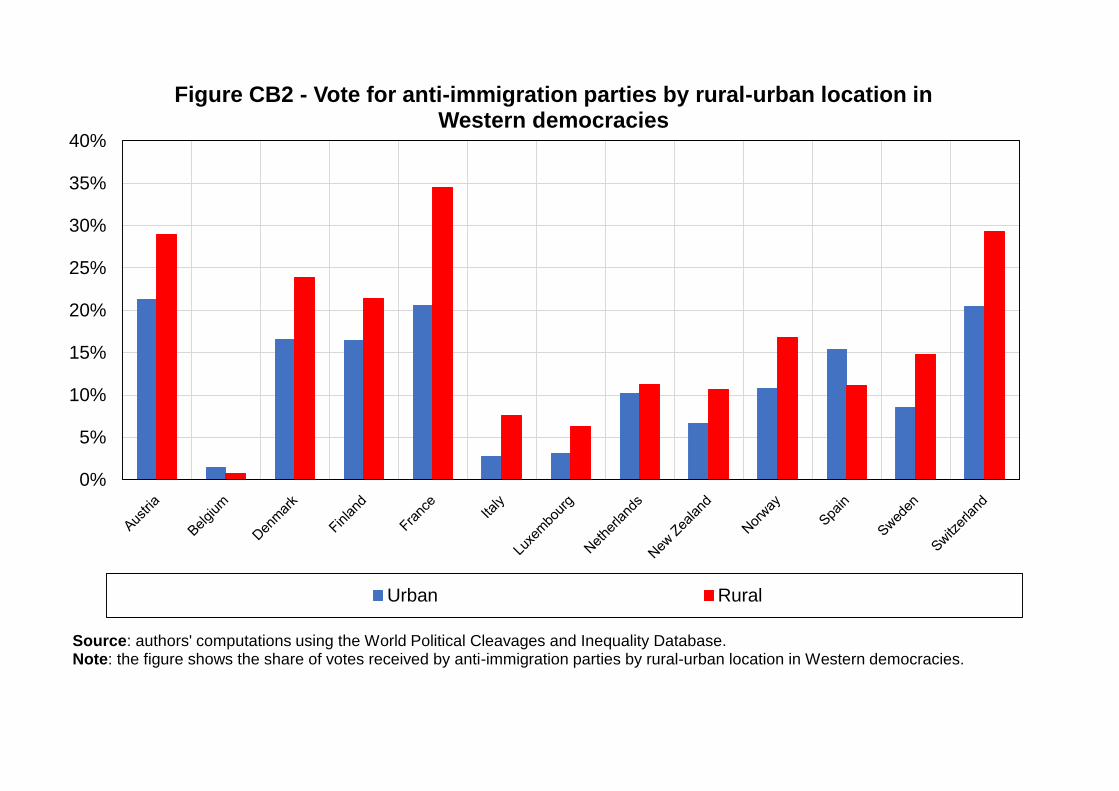
0%
5%
10%
15%
20%
25%
30%
35%
40%
Figure CB2 - Vote for anti-immigration parties by rural-urban location in Western democracies
Urban Rural
Source: authors' computations using the World Political Cleavages and Inequality Database.Note: the figure shows the share of votes received by anti-immigration parties by rural-urban location in Western democracies.
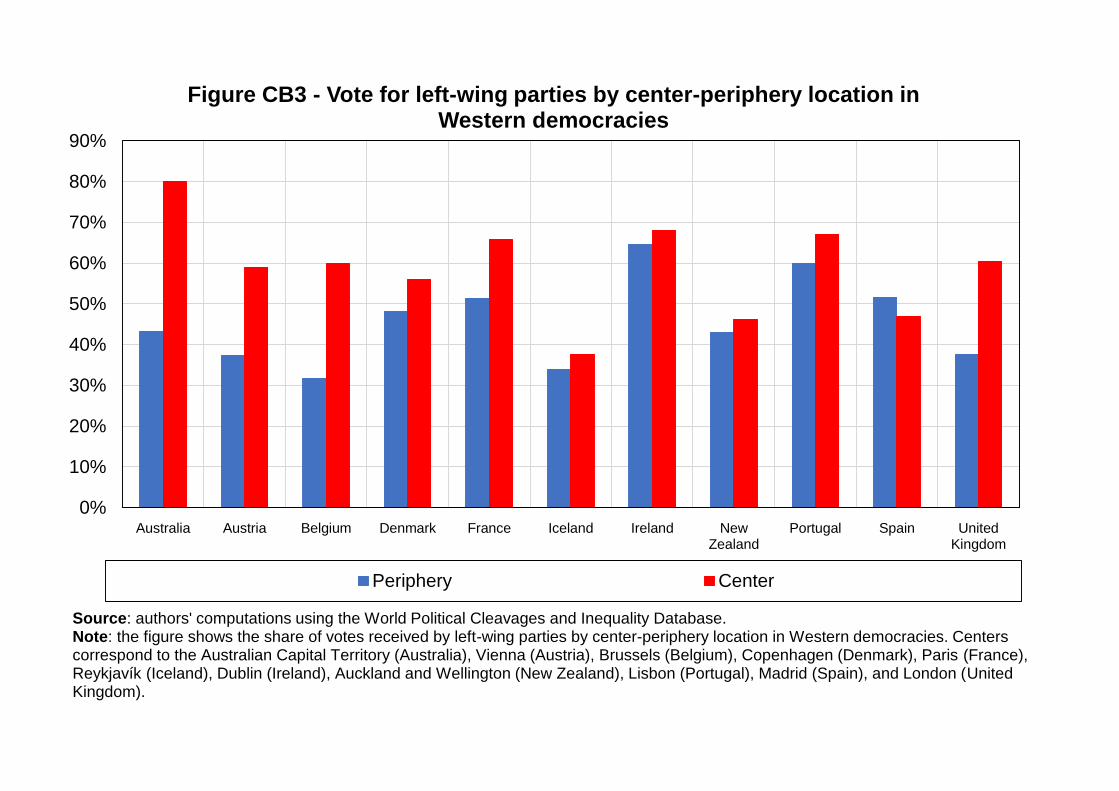
0%
10%
20%
30%
40%
50%
60%
70%
80%
90%
Australia Austria Belgium Denmark France Iceland Ireland NewZealand
Portugal Spain UnitedKingdom
Figure CB3 - Vote for left-wing parties by center-periphery location in Western democracies
Periphery Center
Source: authors' computations using the World Political Cleavages and Inequality Database.Note: the figure shows the share of votes received by left-wing parties by center-periphery location in Western democracies. Centerscorrespond to the Australian Capital Territory (Australia), Vienna (Austria), Brussels (Belgium), Copenhagen (Denmark), Paris (France), Reykjavík (Iceland), Dublin (Ireland), Auckland and Wellington (New Zealand), Lisbon (Portugal), Madrid (Spain), and London (United Kingdom).
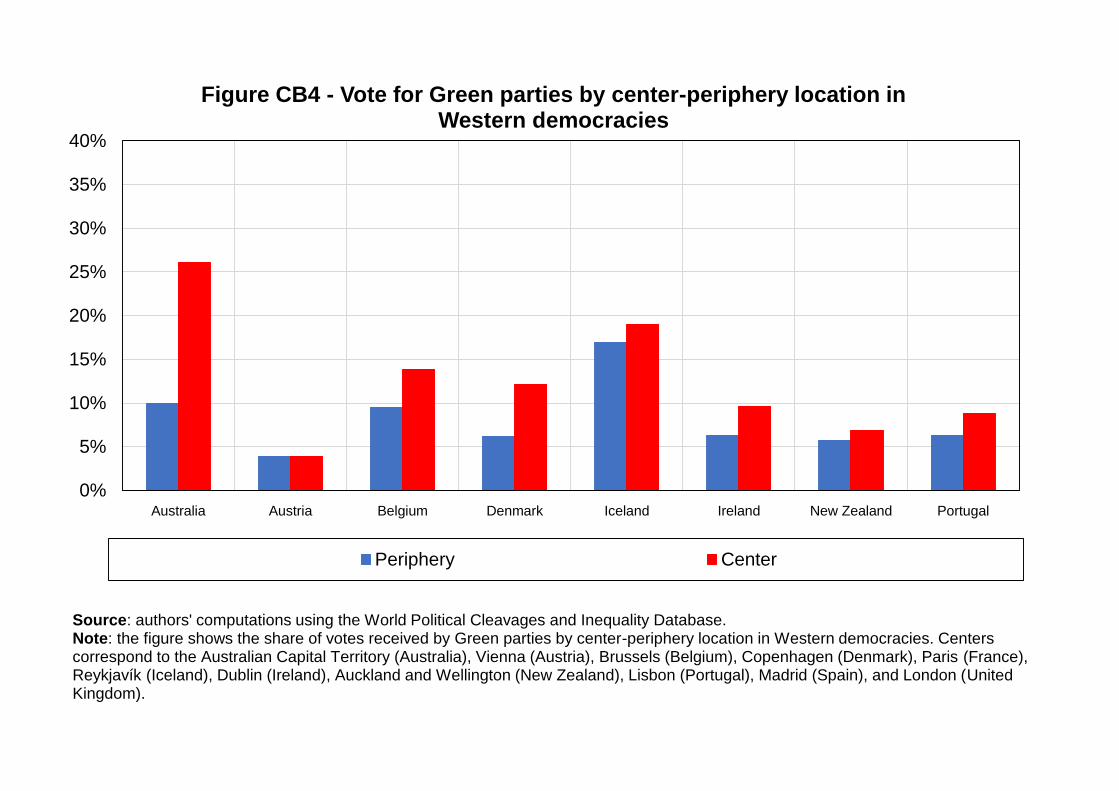
0%
5%
10%
15%
20%
25%
30%
35%
40%
Australia Austria Belgium Denmark Iceland Ireland New Zealand Portugal
Figure CB4 - Vote for Green parties by center-periphery location in Western democracies
Periphery Center
Source: authors' computations using the World Political Cleavages and Inequality Database.Note: the figure shows the share of votes received by Green parties by center-periphery location in Western democracies. Centers correspond to the Australian Capital Territory (Australia), Vienna (Austria), Brussels (Belgium), Copenhagen (Denmark), Paris (France), Reykjavík (Iceland), Dublin (Ireland), Auckland and Wellington (New Zealand), Lisbon (Portugal), Madrid (Spain), and London (United Kingdom).

0%
5%
10%
15%
20%
25%
30%
35%
40%
Austria Belgium Denmark France New Zealand Spain United Kingdom
Figure CB5 - Vote for anti-immigration parties by center-periphery location in Western democracies
Periphery Center
Source: authors' computations using the World Political Cleavages and Inequality Database.Note: the figure shows the share of votes received by anti-immigration parties by center-periphery location in Western democracies. Centers correspond to the Australian Capital Territory (Australia), Vienna (Austria), Brussels (Belgium), Copenhagen (Denmark), Paris (France), Reykjavík (Iceland), Dublin (Ireland), Auckland and Wellington (New Zealand), Lisbon (Portugal), Madrid (Spain), and London (United Kingdom).
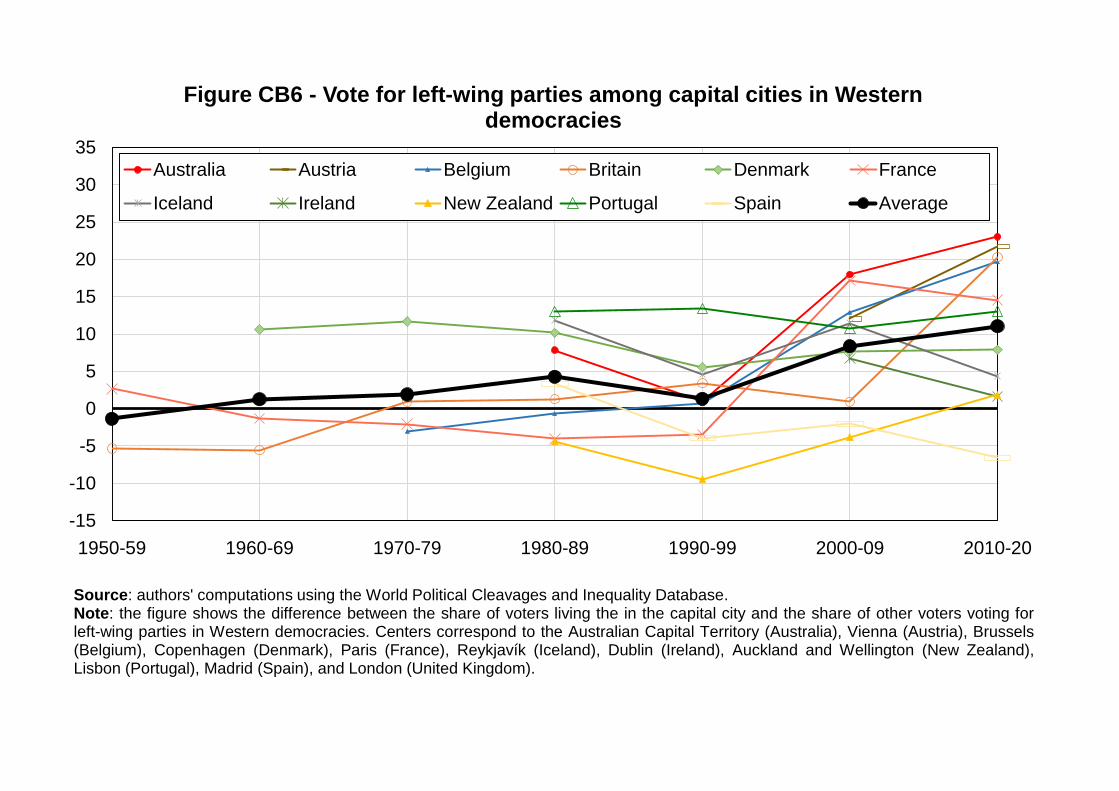
-15
-10
-5
0
5
10
15
20
25
30
35
1950-59 1960-69 1970-79 1980-89 1990-99 2000-09 2010-20
Figure CB6 - Vote for left-wing parties among capital cities in Western democracies
Australia Austria Belgium Britain Denmark France
Iceland Ireland New Zealand Portugal Spain Average
Source: authors' computations using the World Political Cleavages and Inequality Database.Note: the figure shows the difference between the share of voters living the in the capital city and the share of other voters voting forleft-wing parties in Western democracies. Centers correspond to the Australian Capital Territory (Australia), Vienna (Austria), Brussels(Belgium), Copenhagen (Denmark), Paris (France), Reykjavík (Iceland), Dublin (Ireland), Auckland and Wellington (New Zealand),Lisbon (Portugal), Madrid (Spain), and London (United Kingdom).
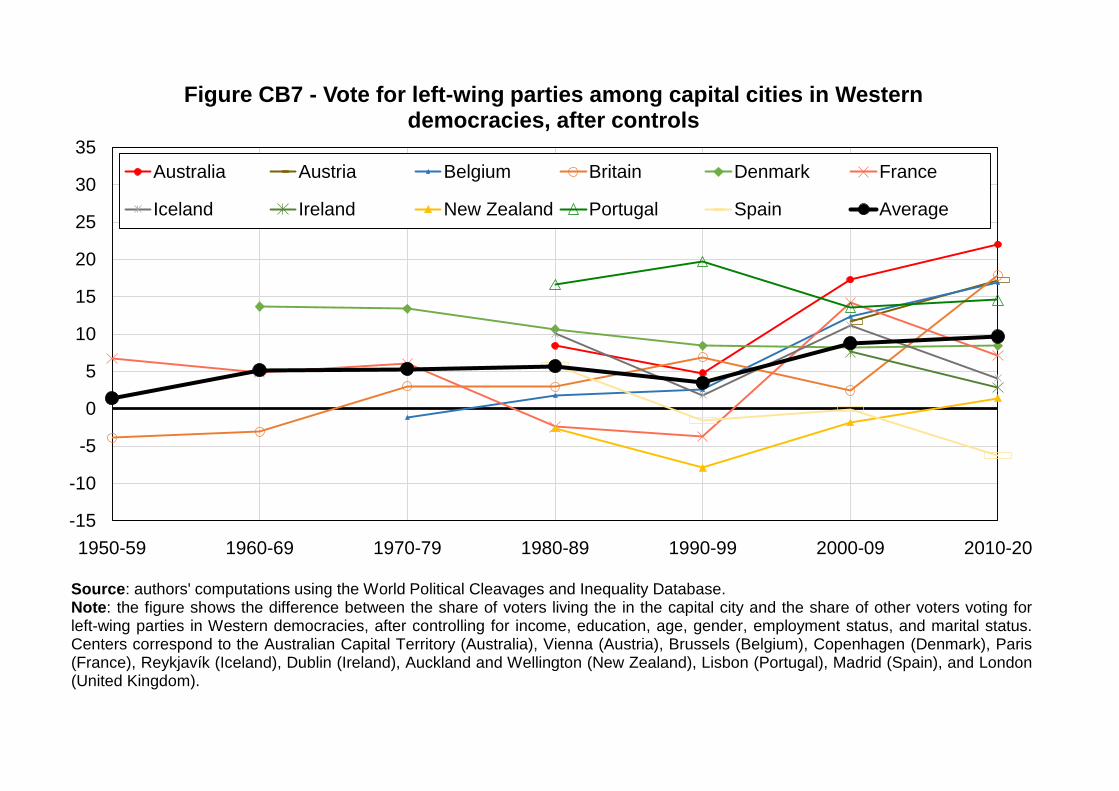
-15
-10
-5
0
5
10
15
20
25
30
35
1950-59 1960-69 1970-79 1980-89 1990-99 2000-09 2010-20
Figure CB7 - Vote for left-wing parties among capital cities in Western democracies, after controls
Australia Austria Belgium Britain Denmark France
Iceland Ireland New Zealand Portugal Spain Average
Source: authors' computations using the World Political Cleavages and Inequality Database.Note: the figure shows the difference between the share of voters living the in the capital city and the share of other voters voting forleft-wing parties in Western democracies, after controlling for income, education, age, gender, employment status, and marital status.Centers correspond to the Australian Capital Territory (Australia), Vienna (Austria), Brussels (Belgium), Copenhagen (Denmark), Paris(France), Reykjavík (Iceland), Dublin (Ireland), Auckland and Wellington (New Zealand), Lisbon (Portugal), Madrid (Spain), and London(United Kingdom).
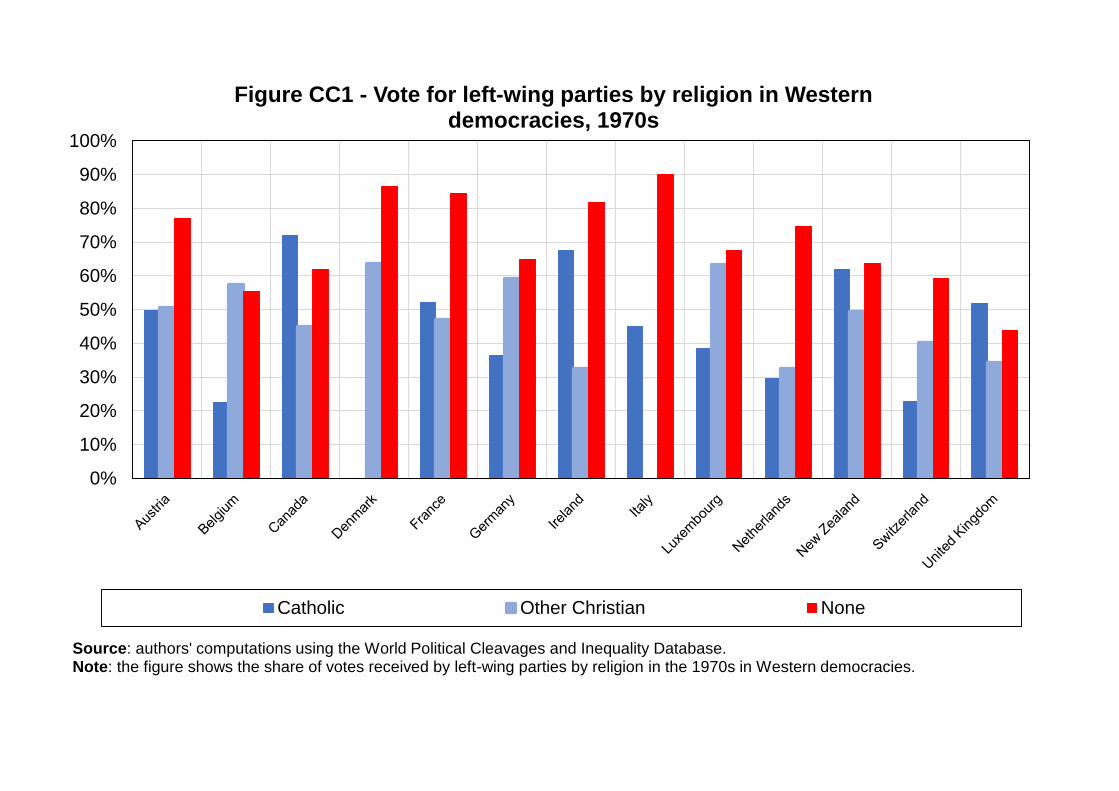
0%
10%
20%
30%
40%
50%
60%
70%
80%
90%
100%
Figure CC1 - Vote for left-wing parties by religion in Western democracies, 1970s
Catholic Other Christian None
Source: authors' computations using the World Political Cleavages and Inequality Database.Note: the figure shows the share of votes received by left-wing parties by religion in the 1970s in Western democracies.
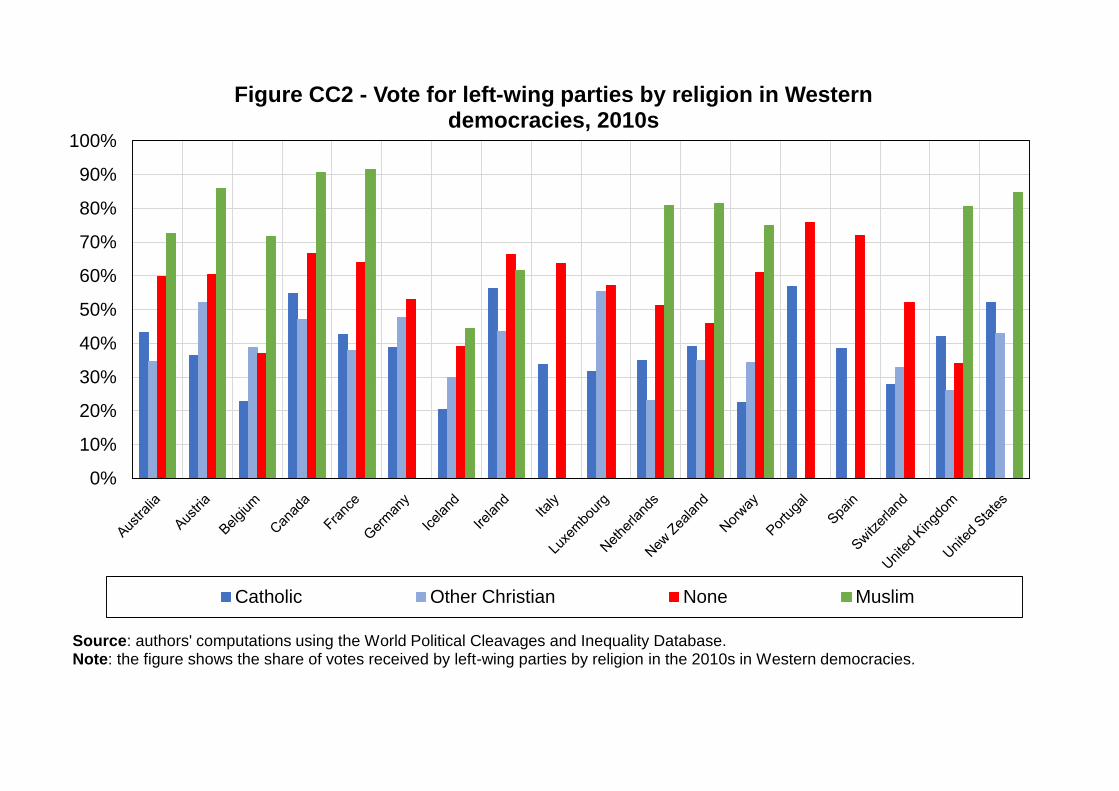
0%
10%
20%
30%
40%
50%
60%
70%
80%
90%
100%
Figure CC2 - Vote for left-wing parties by religion in Western democracies, 2010s
Catholic Other Christian None Muslim
Source: authors' computations using the World Political Cleavages and Inequality Database.Note: the figure shows the share of votes received by left-wing parties by religion in the 2010s in Western democracies.

-10
0
10
20
30
40
50
60
70
1950-59 1960-69 1970-79 1980-89 1990-99 2000-09 2010-20
Figure CC3 - Vote for left-wing parties among voters with no religion in Western democracies
Australia Belgium Britain Canada France
Germany Italy Luxembourg Netherlands New Zealand
Portugal Spain Switzerland Average
Source: authors' computations using the World Political Cleavages and Inequality Database.Note: the figure represents the difference between the share of voters belonging to no religion and the share of other voters voting for left-wing parties in Western democracies. Non-religious voters have remained significantly more left-wing than the rest of the electorate since the 1950s.
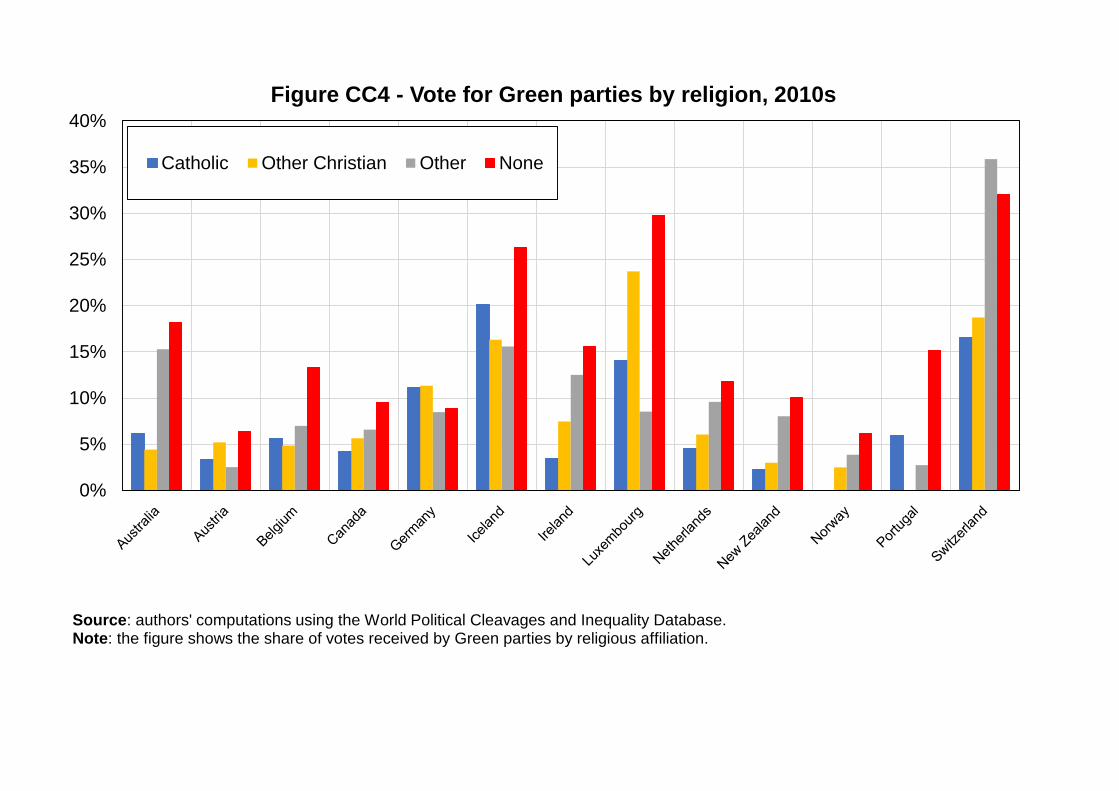
0%
5%
10%
15%
20%
25%
30%
35%
40%
Figure CC4 - Vote for Green parties by religion, 2010s
Catholic Other Christian Other None
Source: authors' computations using the World Political Cleavages and Inequality Database.Note: the figure shows the share of votes received by Green parties by religious affiliation.
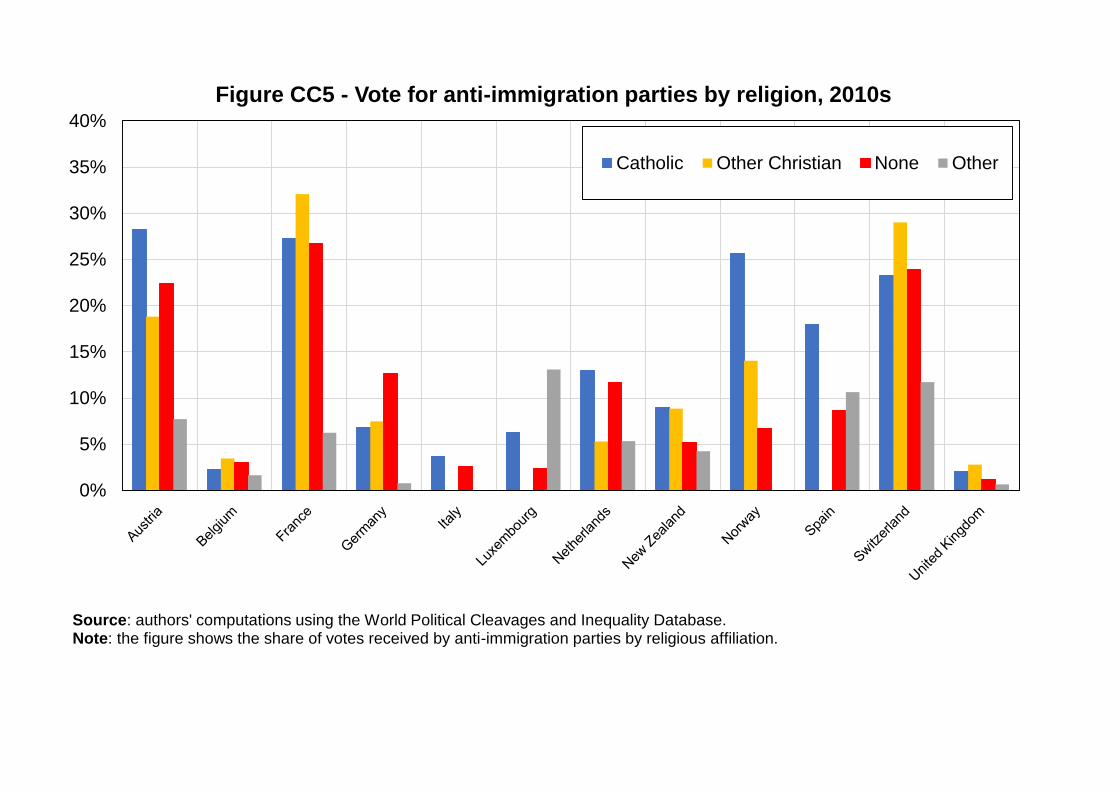
0%
5%
10%
15%
20%
25%
30%
35%
40%
Figure CC5 - Vote for anti-immigration parties by religion, 2010s
Catholic Other Christian None Other
Source: authors' computations using the World Political Cleavages and Inequality Database.Note: the figure shows the share of votes received by anti-immigration parties by religious affiliation.

0%
10%
20%
30%
40%
50%
60%
70%
80%
90%
100%
Figure CD1 - Vote for left-wing parties by country of birth in Western democracies, 2010s
Country Other Western Countries Non-Western countries
Source: authors' computations using the World Political Cleavages and Inequality Database.Note: the figure shows the share of votes received by left-wing parties by country of birth in Western democracies in the 2010s. Excludes Fianna Fáil in Ireland. Covers 2007 and 2012 elections in France (no data in 2017).

-25
-20
-15
-10
-5
0
5
10
15
1950-59 1960-69 1970-79 1980-89 1990-99 2000-09 2010-20
Figure CE1 - Vote for left-wing parties among women in Western democracies (after controlling for religion)
Australia Austria BelgiumBritain Canada DenmarkFinland France GermanyIceland Ireland ItalyLuxembourg Netherlands New ZealandNorway Portugal SpainSweden Switzerland United StatesAverage
Source: authors' computations using the World Political Cleavages and Inequality Database.Note: the figure displays the difference between the share of women and the share of men voting for left-wing (socialist, social-democratic, communist, and green) parties in Western democracies, after controlling for religion and church attendance. In the majorityof countries, women have gradually shifted from being significantly more right-wing to being significantly more left-wing than men.

-6
-4
-2
0
2
4
6
8
10
12
14
Figure CE2 - Gender cleavages and sectoral specialization in Western democracies
Difference between (% women) and (% men) voting left
After controlling for public/private sector of employment
Source: authors' computations using the World Political Cleavages and Inequality Database.Note: the figure shows the difference between the share of women and the share of men voting for left-wing parties in Western democracies in the last election available, before and after controlling for occupation (employment status + private/public sector of employment).
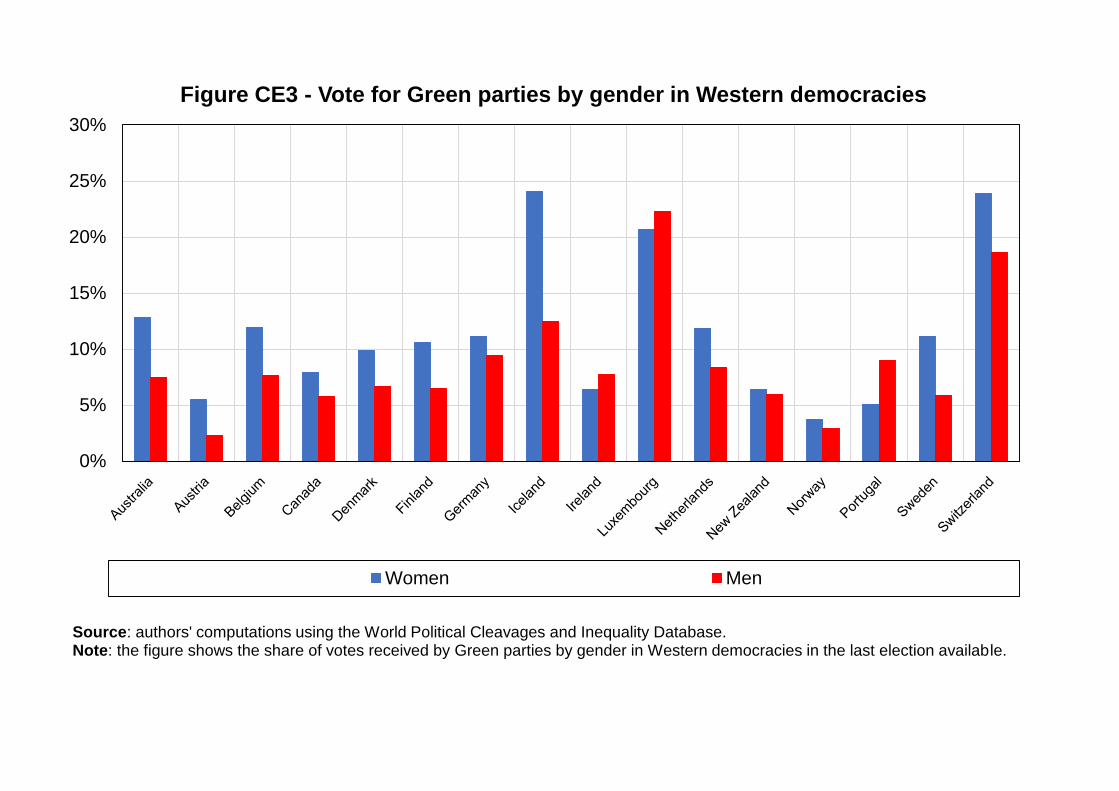
0%
5%
10%
15%
20%
25%
30%
Figure CE3 - Vote for Green parties by gender in Western democracies
Women Men
Source: authors' computations using the World Political Cleavages and Inequality Database.Note: the figure shows the share of votes received by Green parties by gender in Western democracies in the last election available.

0%
5%
10%
15%
20%
25%
30%
35%
40%
Figure CE4 - Vote for anti-immigration parties by gender in Western democracies
Women Men
Source: authors' computations using the World Political Cleavages and Inequality Database.Note: the figure shows the share of votes received by anti-immigration parties by gender in Western democracies in the last electionavailable

-10
-5
0
5
10
15
20
25
30
35
40
45
50
55
60
1950-59 1960-69 1970-79 1980-89 1990-99 2000-09 2010-20
Figure CF1 - The decline of self-perceived class cleavages in Western democracies (before controls)
Australia
Britain
Denmark
France
Luxembourg
Netherlands
New Zealand
Norway
Portugal
Spain
Sweden
United States
Average
Source: authors' computations using the World Political Cleavages and Inequality Database.Note: the figure shows the difference between the share of voters self-identifying as belonging to the "working class" or the "lower class"and the share of voters identifying with the "middle class", the "upper class" or "no class" voting for left-wing (socialist, social-democratic, communist, and green) parties.
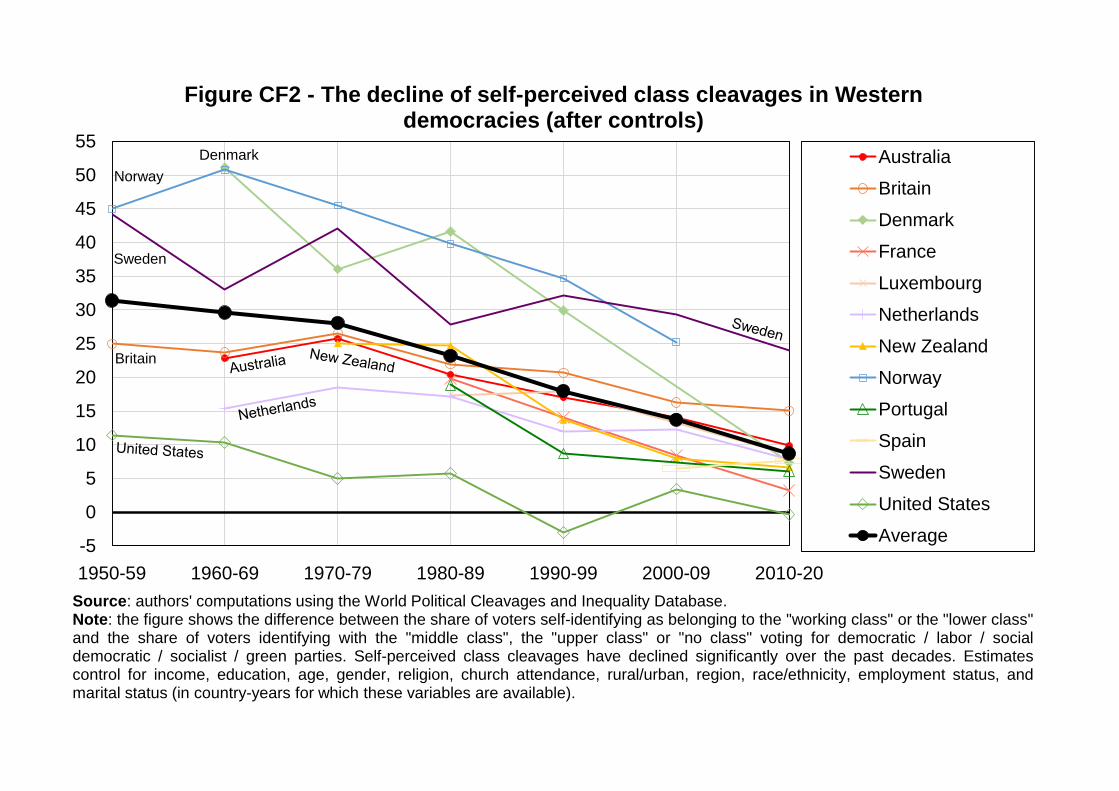
-5
0
5
10
15
20
25
30
35
40
45
50
55
1950-59 1960-69 1970-79 1980-89 1990-99 2000-09 2010-20
Figure CF2 - The decline of self-perceived class cleavages in Western democracies (after controls)
Australia
Britain
Denmark
France
Luxembourg
Netherlands
New Zealand
Norway
Portugal
Spain
Sweden
United States
Average
Source: authors' computations using the World Political Cleavages and Inequality Database.Note: the figure shows the difference between the share of voters self-identifying as belonging to the "working class" or the "lower class"and the share of voters identifying with the "middle class", the "upper class" or "no class" voting for democratic / labor / socialdemocratic / socialist / green parties. Self-perceived class cleavages have declined significantly over the past decades. Estimatescontrol for income, education, age, gender, religion, church attendance, rural/urban, region, race/ethnicity, employment status, andmarital status (in country-years for which these variables are available).
Sweden
Norway
Denmark
Britain
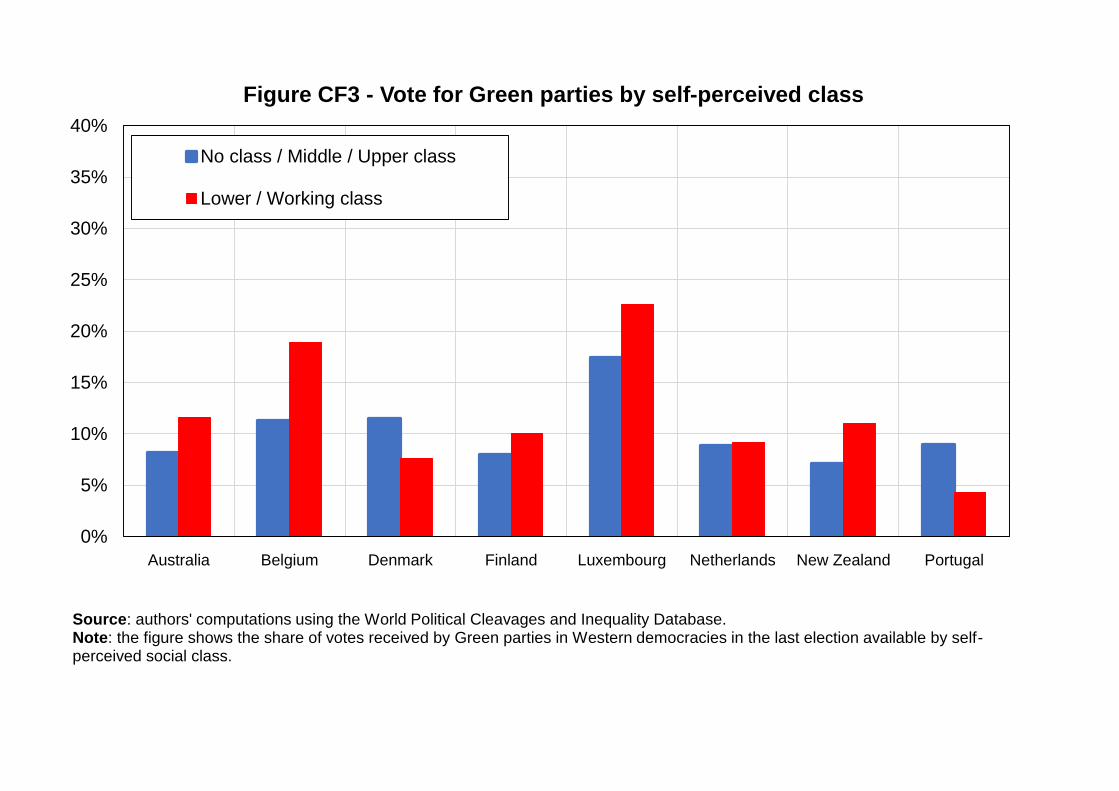
0%
5%
10%
15%
20%
25%
30%
35%
40%
Australia Belgium Denmark Finland Luxembourg Netherlands New Zealand Portugal
Figure CF3 - Vote for Green parties by self-perceived class
No class / Middle / Upper class
Lower / Working class
Source: authors' computations using the World Political Cleavages and Inequality Database.Note: the figure shows the share of votes received by Green parties in Western democracies in the last election available by self-perceived social class.
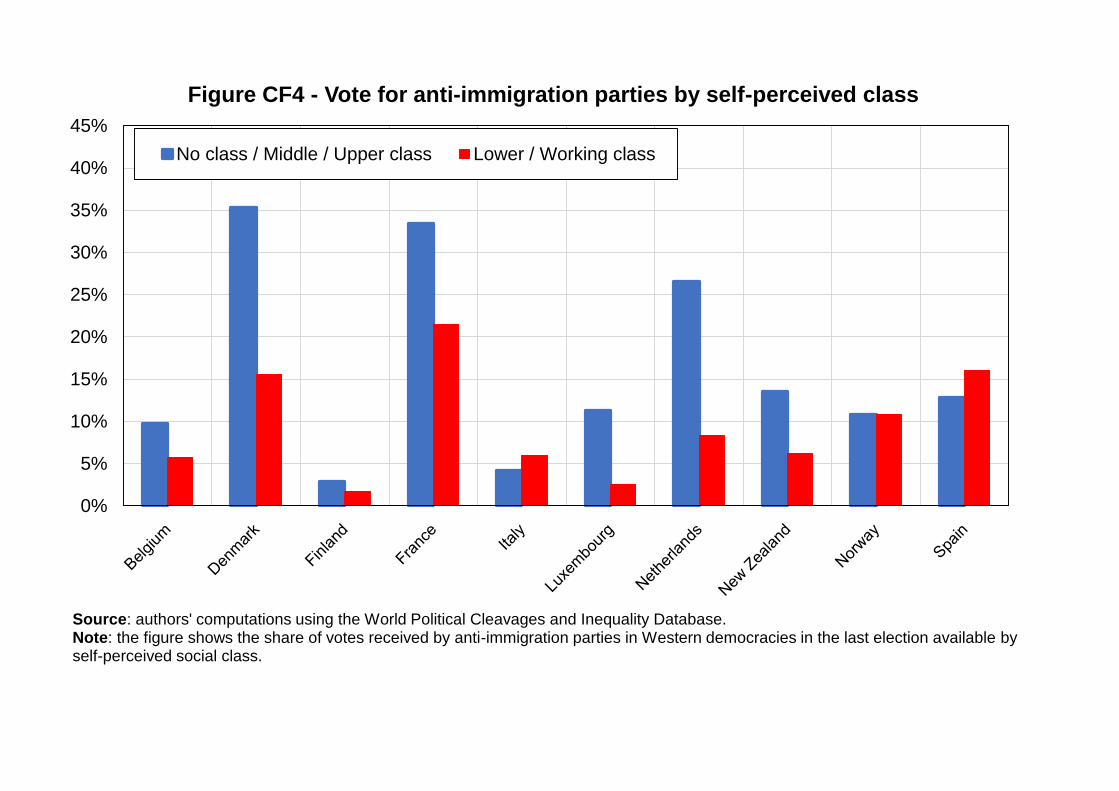
0%
5%
10%
15%
20%
25%
30%
35%
40%
45%
Figure CF4 - Vote for anti-immigration parties by self-perceived class
No class / Middle / Upper class Lower / Working class
Source: authors' computations using the World Political Cleavages and Inequality Database.Note: the figure shows the share of votes received by anti-immigration parties in Western democracies in the last election available by self-perceived social class.
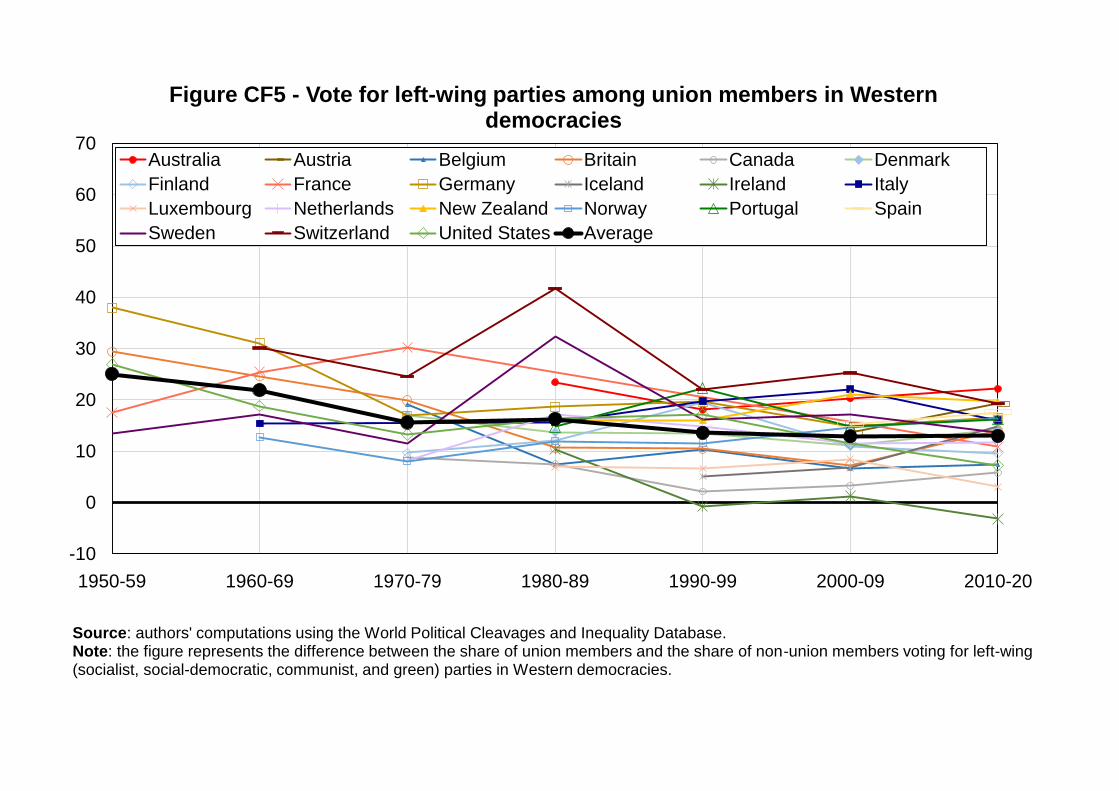
-10
0
10
20
30
40
50
60
70
1950-59 1960-69 1970-79 1980-89 1990-99 2000-09 2010-20
Figure CF5 - Vote for left-wing parties among union members in Western democracies
Australia Austria Belgium Britain Canada Denmark
Finland France Germany Iceland Ireland Italy
Luxembourg Netherlands New Zealand Norway Portugal Spain
Sweden Switzerland United States Average
Source: authors' computations using the World Political Cleavages and Inequality Database.Note: the figure represents the difference between the share of union members and the share of non-union members voting for left-wing (socialist, social-democratic, communist, and green) parties in Western democracies.

-10
0
10
20
30
40
50
60
70
1950-59 1960-69 1970-79 1980-89 1990-99 2000-09 2010-20
Figure CF6 - Vote for left-wing parties among union members in Western democracies, after controls
Australia Austria Belgium Britain Canada DenmarkFinland France Germany Iceland Ireland ItalyLuxembourg Netherlands New Zealand Norway Portugal SpainSweden Switzerland United States Average
Source: authors' computations using the World Political Cleavages and Inequality Database.Note: the figure represents the difference between the share of union members and the share of non-union members voting for left-wing (socialist, social-democratic, communist, and green) parties in Western democracies. Estimates control for education, income, age, gender, religion, church attendance, rural/urban, region, employment status, and marital status (in country-years for which these variables are available).

-30
-20
-10
0
10
20
30
40
50
60
1950-59 1960-69 1970-79 1980-89 1990-99 2000-09 2010-20
Figure CF7 - Vote for left-wing parties among public sector workers in Western democracies
Australia Austria Belgium Canada Denmark
Finland France Iceland Ireland Italy
Luxembourg Netherlands New Zealand Norway Portugal
Spain Sweden Switzerland Average
Source: authors' computations using the World Political Cleavages and Inequality Database.Note: the figure represents the difference between the share of public sector workers and the share of private sector workers voting for left-wing (socialist, social-democratic, communist, and green) parties in Western democracies.
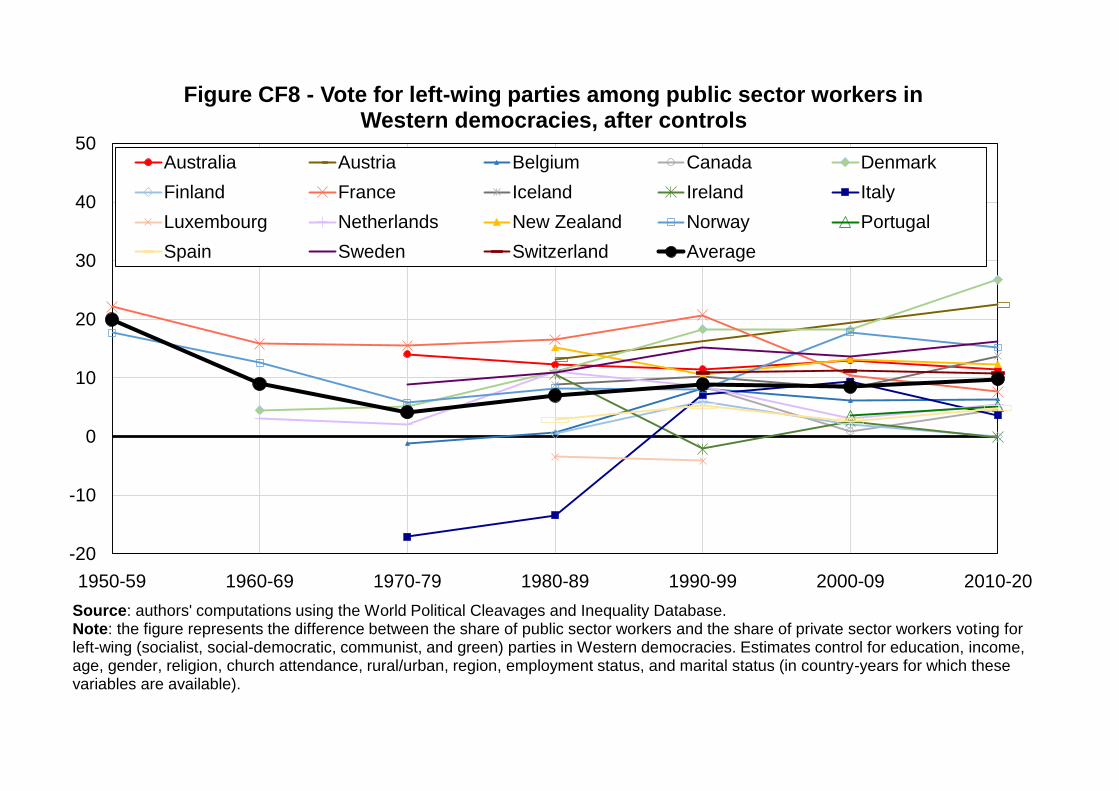
-20
-10
0
10
20
30
40
50
1950-59 1960-69 1970-79 1980-89 1990-99 2000-09 2010-20
Figure CF8 - Vote for left-wing parties among public sector workers in Western democracies, after controls
Australia Austria Belgium Canada Denmark
Finland France Iceland Ireland Italy
Luxembourg Netherlands New Zealand Norway Portugal
Spain Sweden Switzerland Average
Source: authors' computations using the World Political Cleavages and Inequality Database.Note: the figure represents the difference between the share of public sector workers and the share of private sector workers voting for left-wing (socialist, social-democratic, communist, and green) parties in Western democracies. Estimates control for education, income, age, gender, religion, church attendance, rural/urban, region, employment status, and marital status (in country-years for which these variables are available).