br fact sheet stbrst brstbr br brstbrstbrst september … · investor insights (as on 31-july-2019)...
TRANSCRIPT

BRSTRSTBRST
BRSTRSTBRST
BRSTBRSTBRSTBR
BRSTBRSTBRBRSTBR
ST
BRBRSTBRSTBRSTBRST
STBRST September 2019
FACT SHEETFACT SHEET
Dear Investors and my dear advisor friends;
Recently I wrote on micro-blogging pla�orm Twi�er:
There are phases when poli�cs and socio-poli�cal considera�ons determine economics. Government involvement in the flow and alloca�on of resources seems ever-increasing with rising taxes, resource mobiliza�on and rou�ng them to weaker sec�ons of society or the sec�ons that need a�en�on. And this is rightly so. But this imbalance of focus eventually results in risks to the economic posi�on and percep�on of the country, deficits start to go out of control, skewed intermedia�on in resource alloca�on results in economic growth suffering, macros turn towards imbalance, investments suffer, foreigner investors lose interest and economic confidence dwindles. Over and above that, specific to the recent past, we have had massive economic upheavals via demone�sa�on, RERA, GST etc. Eventually we can travel only that much with poli�cs driving economics before the economy starts to backfire and starts dicta�ng the poli�cs. We have seen examples like August 2012 where the Government of the day had to make the highly unpopular decision of hiking diesel prices overnight to prevent the deficits from bloa�ng. We have seen the Government in 2007 sacrificing poli�cal support of one party and securing support of another in order to have be�er rela�ons and strike a nuclear deal with the US. The biggest example of economics backfiring to dictate poli�cs was the reforms of 1991 where many poli�cally tough decisions were made.
On Friday September 20, 2019 the Government announced quite unexpectedly that corporate tax rates would be brought down to effec�ve rates close to 25% instead of the current highest rate of 35%. And further, in case of new manufacturing units there would be a concessional tax of 15% plus surcharge. Which this was proposed by the Government way back in 2014, consistently a weak fiscal posi�on and different set of priori�es were cited to avoid cu�ng the taxes although promised long back. The consistently dwindling corporate performance and investment demand coupled with the opportuni�es opened up by the US-China trade war has finally encouraged the Government to bite the bullet on corporate taxes.
The markets have reacted posi�vely. The ini�al reac�on is obviously just related to a kind of reset. Part of the tax cut could poten�ally translate into higher bo�om lines and hence companies which benefit do deserve higher valua�ons. But that’s just the first order effect of
Aashish P SomaiyaaMD & CEO
On Friday September 20, 2 0 1 9 t h e G o v e r n m e n t a n n o u n c e d q u i t e u n e x p e c t e d l y t h a t corporate tax rates would b e b r o u g h t d o w n t o effective rates close to 25% instead of the current highest rate of 35%. And further, in case of new manufacturing units there would be a concessional tax of 15% plus surcharge.
“
”

BRSTBRSTBRSTB
BRSTRSTBRST
BRSTBR
BRSTBRSTBRSBRSTBRS
ST
BRSTthe move. We have yet to see how the benefit of lower taxes are u�lised by companies – by giving discounts to consumers, or compensa�on employees be�er or hiring more people, announcing new investments, spending on marke�ng, distribu�on and adver�sing etc. It is the la�er set of developments which will determine what kind of second order effects we witness in the economy. Fortunately for us this comes amidst the busy fes�ve season and the last two quarters of the financial year which are busier than the first two. Good monsoons may aid too.
There are many who have expressed concerns over fiscal deficits rising and eventually impac�ng infla�on. Well yes, if you are a bond market investor then fiscal deficit and rising infla�on comes back to bite immediately. But if you are an equity investor then 5% growth with 2% infla�on is way worse than 7-8% growth with 4-5% infla�on. Yes, eventually high deficits do come back to bite even equity investors but low growth low infla�on with deficit is much worse than a deficit which engenders be�er growth and slightly higher infla�on. We are on the right track and our belief is that the markets will cheer and may show significant upside over the next 3-6 months. Just around the corner we will see September end quarter results and GDP print for the September quarter which one must not react if they are not good because it is baked in the market knowledge. Any declines will be opportuni�es to invest for be�er results in the next 1-2 years. You may consistently top up your investments over the next 2-3 months at every dip so as to not only get be�er results in the next 1-2 years but also to hasten the recovery in any investments that have shown poor value in the last 1-2 years.
Lastly, the recent upside and further impending upside should not be used as a relief to exit posi�ons as is the reac�on some�mes a�er a period of poor inves�ng experience. I recently ran a poll on this.
While overwhelming majority says they would stay on course, it’s the ac�on that will count.
Yours Sincerely,
Aashish P. Somaiyaa (MD & CEO – Molal Oswal AMC)
We have yet to see how the benefit of lower taxes are utilised by companies – by g i v i n g d i s c o u n t s t o consumers, or compensation employees better or hiring more people, announcing new investments, spending on marketing, distribution and advertising etc.
“
”
There are many who have expressed concerns over fiscal deficits rising and e v e n t u a l l y i m p a c t i n g inflation. Well yes, if you are a bond market investor then fiscal deficit and rising inflation comes back to bite immediately. But if you are an equity investor then 5% growth with 2% inflation is w a y w o r s e t h a n 7 - 8 % growth with 4-5% inflation.
“
”

BRSTBRSTBRSTB
BRSTRSTBRST
BRSTBR
BRSTBRSTBRSBRSTBRS
ST
BRSTMotilal Oswal Focused 25 Fund (MOF25) (An open ended equity scheme investing in maximum 25 stocks intending to focus on Large Cap stocks)
SIP Performance (As on 31-August-2019)
Date of inception: 13-May-13. = Incase, the start/end date of the concerned period is non business date (NBD), the NAV of the previous date is considered for computation of returns. The NAV per unit shown in the table is as on the start date of the said period. Past performance may or may not be sustained in the future. Performance is for Regular Plan Growth option. Different plans have different expense structure. = Mr. Siddharth Bothra is the Fund Manager for equity component since 23-Nov-2016 and Mr. Abhiroop Mukherjee is the Fund Manager for debt component since inception. The performance of the Schemes managed by them are on page no. 2 ,3, 4, 5, 6 and 7
* Also represents additional benchmarkFor SIP returns, monthly investment of ` 10,000/- invested on the 1st day of every month has been considered. Performance is for Regular Plan Growth Option. Past performance may or may not be sustained in the future.
Industry Allocation Top 10 Holdings
Investment Objective
The investment objective of the Scheme is to achieve long term capital appreciation by investing in up to 25 companies with long term sustainable competitive advantage and growth potential. However, there can be no assurance or guarantee that the investment objective of the Scheme would be achieved.
BenchmarkNifty 50 TRI
Continuous OfferMinimum Application Amount : ̀ 500/- and in multiples of ̀ 1 /- thereafter.
Additional Application Amount : ̀ 500/- and in multiples of ̀ 1/- thereafter.
Redemption proceeds
Normally within 3 Business days from acceptance of redemption request.Entry / Exit Load
1
The above table depicts the daily rolling returns for Regular Plan Growth Option on compounded annualized basis from inception to 1 year , 3 year & 5 year periods. It provides the maximum, minimum and average returns derived for all these time periods. Total number of time periods: 1year-1309; 3years-817; 5year-321. The above chart is provided for illustration purpose only. Motilal Oswal AMC does not provide any guarantee/ assurance any minimum or maximum returns. Past performance may or may not be sustained in future
CategoryFocused Fund intending to invest in large cap stocks
Entry Load: NilExit Load: 1% - If redeemed on or before 15 days from the date of allotment. Nil - If redeemed after 15 days from the date of allotment. A switch-out or a withdrawal shall also be subjected to the Exit Load like any Redemption. No Exit Load applies for switch between MOF25, MOF30, MOF35, MOFEH & MOFDYNAMIC. No Load for switch between Options within the Scheme. Further, it is clarified that there will be no exit load charged on a switch-out from Regular to Direct plan within the same scheme.
Performance (As on 31-August-2019)
(Data as on 31-August-2019) Industry classification as recommended by AMFI
1 Year 3 Year 5 Year
CAGR(%)
Current Valueof Investment of ` 10,000
CAGR(%)
CAGR(%)
7.30 9.60 Scheme -4.73 12,3549,527
9.30 8.11Nifty 50 TRI (Benchmark) -4.35 13,0569,565
17.223722.3359NAV (`) Per Unit(21.2790 : as on 30-Aug-2019)
BSE Sensex TRI (Additional Benchmark)
10.85 8.40 -2.13 13,621
15,816
14,766
13.4545
14,9689,787
Current Valueof Investment of ` 10,000
Current Valueof Investment of ` 10,000
Since Inception
CAGR(%)
12.73
11.66
12.31
21,279
20,043
10.0000
20,790
Current Valueof Investment of ` 10,000
Rolling Returns
% times returns are in excess of 15%
Maximum
Average
64.04
16.29
23.38
63.10
47.67
% times returns arein excess of 7%
% times negative returns
67.76
53.80
14.26
15.81
45.23
Minimum -18.02 -21.53
14.07
0.00
97.67
25.59
41.13
5.94
98.16
19.57
11.88
0.00
15.67
6.23
Scheme Nifty 50 TRI
1 Year(%)
3 Year(%)
1 Year(%)
3 Year(%)
14.98
0.00
100.00
21.21
36.14
9.56
5 Year(%)
5 Year(%)
100.00
24.00
16.50
0.00
75.70
9.73
Investor Insights (As on 31-July-2019)
Investors Behavioural Analysis (As on 31-July-2019)
Investor Age Bucket
1-30 Years 30-50 Years 50-75 Years > 75 years Not AvailableGrand Total
8,824 26,155 12,443 5,653 0 53,075
Particular
Folio where Investors have never redeemed (Folio Count)
Total No. of Folios
Average age of Investor (in years)
No. of locations from which inflow is received (Unique PinCodes)
Live SIPs
AUM from SIPs
New SIP registration in the month
49.78
1,695
36,020
13.91Crs
538
53,075
45,468
Average monthly SIP instalment ` 3,862.20
` 1,044.63 (` cr)
` 1,059.55 (` cr)
0.92
0.43
6.44% (Annualised)
13.42 (Annualised)
0.14 (Annualised)
0.77
Fund Manager
Mr. Siddharth BothraManaging this fund since 23-Nov-2016He has a rich experience of more than 17 years
Dividend History
Scheme Statistics
*Against the benchmark Nifty 50 Index. # Risk free returns based on last overnight MIBOR cut-off of 5.45% (Data as on 31-August-2019)
Mr. Abhiroop Mukherjee
Date of Allotment13-May-2013
NAV
For Equity Component
For Debt Component since Inception
Pursuant to payment of dividend, NAV per unit will fall to the extent of the dividend payout and statutory levy (if applicable). Face value ` 10/-. Past performance may or may not be sustained in future.
Regular Plan Growth Option
Regular Plan Dividend Option
Direct Plan Growth Option
Direct Plan Dividend Option
Monthly AAUM
Latest AUM (31-Aug-2019)
Beta
Portfolio Turnover Ratio
Tracking Error*
Standard Deviation
Sharpe Ratio#*
R-Squared
: ̀ 21.2790
: ̀ 15.4221
: ` 23.1969
: ` 17.0871
Dividend perUnit (`)
Cum DividendNAV
Ex DividendNAV
1.00
1.00
0.50
0.50
15.5745
14.9854
16.8789
15.9292
14.5745
13.9854
16.3789
15.4292
Record Date
Direct Plan
Regular Plan
Direct Plan
Regular Plan
01-Jan-2016
24-Mar-2017
1.80
1.80
18.1652
16.8759
16.3652
15.0759
Direct Plan
Regular Plan
20-Mar-2018
0.50
0.50
17.6230
16.0255
17.1230
15.5255
Direct Plan
Regular Plan
28-Mar-2019
Invested Amount
Market Value
Returns (CAGR) %
1 Year
Scheme Nifty 50TRI
121,175
1.82
BSE Sensex
TRI*
120000
119,044
3 Year
Scheme Nifty 50TRI
BSE Sensex
TRI*
360,000
5 Year
Scheme Nifty 50TRI
600,000
BSE Sensex
TRI*
Scheme Nifty 50TRI
BSE Sensex
TRI*
750,000
Since Inception
120,999
1.55
380,989
3.72
401,042
7.14
743,340
8.50
10,24,133
9.84
10,51,632
10.68
10,17,450
9.64
766,402
9.73
710.626
6.71
414,814
9.43-1.48
(Data as on 31-August-2019)
ScripSr. No. Weightage (%)
1 HDFC Bank Ltd.
2 HDFC Life Insurance Company Ltd.
3 Tata Consultancy Services Ltd.
4 ICICI Bank Ltd.
5 Kotak Mahindra Bank Ltd.
Avenue Supermarts Ltd.6
7
8 ABB India Ltd.
9 Maruti Suzuki India Ltd.
10 Max Financial Services Ltd.
Larsen & Toubro Ltd.
1
10.34
10.22
8.12
8.09
6.11
5.82
5.53
4.34
4.16
3.850.86%Cash & Equivalent
1.06%Cement
1.66%Services
3.44%
4.34%
5.53%
5.82%
6.54%
7.94%
11.13%
20.20%
Consumer Non Durables
Industrial Capital Goods
Construction Project
Retailing
Auto
Pharmaceuticals
Software
Finance
4.90%Transportation
2.01%Consumer Durables
24.54%Banks

BRSTBRSTBRSTB
BRSTRSTBRST
BRSTBR
BRSTBRSTBRSBRSTBRS
ST
BRSTMotilal Oswal Midcap 30 Fund (MOF30)(Mid Cap Fund - An open ended equity scheme predominantly investing in mid cap stocks)
Date of inception: 24-Feb-14. = Incase, the start/end date of the concerned period is non business date (NBD), the NAV of the previous date is considered for computation of returns. The NAV per unit shown in the table is as on the start date of the said period. Past performance may or may not be sustained in the future. Performance is for Regular Plan Growth option. Different plans have different expense structure. = Mr. Akash Singhania is the Fund Manager for equity component since 28-Jul-2017; Mr. Niket Shah is the Associate Fund Manager since March 1, 2018 and Mr. Abhiroop Mukherjee is the Fund Manager for debt component since 24-Feb-2014. = The performance of the Schemes are on page no. 1, 3, 4, 5, 6 and 7.
* Also represents additional benchmarkFor SIP returns, monthly investment of ` 10000/- invested on the 1st day of every month has been considered. Performance is for Regular Plan Growth Option. Past performance may or may not be sustained in the future.
Industry Allocation
(Data as on 31-August-2019) Industry classification as recommended by AMFI
Dividend HistoryDividend
per Unit (`)Cum Dividend
NAVEx Dividend
NAV
1.0000
1.0000
0.4800
0.4751
17.8511
17.4182
22.4293
21.5575
16.8511
16.4182
21.9493
21.0824
Record Date
Direct Plan
Regular Plan
Direct Plan
Regular Plan
19-Feb-2016
24-Mar-2017
Fund and Associate Fund Manager
Mr. Akash SinghaniaManaging this fund since 28-Jul-2017He has overall 13 years of experience
Mr. Niket ShahHe has been appointed as Associate Fund Manager since March 1, 2018
Mr. Abhiroop Mukherjee
Investment ObjectiveThe investment objective of the Scheme is to achieve long term capital appreciation by investing in a maximum of 30 quality mid-cap companies having long-term competitive advantages and potential for growth.
However, there can be no assurance or guarantee that the investment objective of the Scheme would be achieved.
BenchmarkNifty Midcap 100 TRI
Continuous Offer
Minimum Application Amount: ` 500/- and in multiples of ̀ 1/- thereafter.
Additional Application Amount: ̀ 500/- and in multiples of ̀ 1/- thereafter.Redemption proceeds
Normally within 3 Business days from acceptance of redemption request.
Entry / Exit Load
Date of Allotment 24-Feb-2014NAVRegular Plan Growth Option : ̀ 23.7830Regular Plan Dividend : ̀ 17.0264OptionDirect Plan Growth Option : ̀ 25.4763Direct Plan Dividend Option : ̀ 18.5311
Scheme Statistics
0.76Tracking Error*Standard Deviation
9.01% (Annualised)
Sharpe Ratio# -0.27 (Annualised)
Portfolio Turnover RatioBeta 0.77
` 1,375.45(` cr)Monthly AAUMLatest AUM (31-Aug-2019) ` 1,413.87 (` cr)
16.24 (Annualised)
R-Squared 0.76*Against the benchmark Nifty Midcap 100. # Risk free returns based on last overnight MIBOR cut-off of 5.45%(Data as on 31-August-2019)
For Equity Component
For Debt Component since Inception
2.00
2.00
22.6302
21.4405
20.6302
19.4405
Direct Plan
Regular Plan
20-Mar-2018
2.00
2.00
21.6801
20.1677
19.6801
18.1677
Direct Plan
Regular Plan
28-Mar-2019
SIP Performance (As on 31-August-2019)
Pursuant to payment of dividend, NAV per unit will fall to the extent of the dividend payout and statutory levy (if applicable). Face value ` 10/-. Past performance may or may not be sustained in future.
CategoryMidcap Fund
He has overall 9 years of experience
Entry Load: NilExit Load: 1% - If redeemed on or before 15 days from the date of allotment. Nil - If redeemed after 15 days from the date of allotment. A switch-out or a withdrawal shall also be subjected to the Exit Load like any Redemption. No Exit Load applies for switch between MOF25, MOF30, MOF35, MOFEH & MOFDYNAMIC. No Load for switch between Options within the Scheme. Further, it is clarified that there will be no exit load charged on a switch-out from Regular to Direct plan within the same scheme.
Performance (As on 31-August-2019)
% times returns are in excess of 15%
Maximum
Average
98.49
14.02
25.87
53.27
38.59
% times returns arein excess of 7%
% times negative returns
59.27
71.03
13.24
26.32
43.60
Minimum -18.31 -22.48
12.85
0.00
75.68
34.18
35.75
0.14
94.69
30.25
15.58
0.00
51.21
1.22
Scheme Nifty Midcap 100 Index TRI
1 Year(%)
3 Year(%)
1 Year(%)
3 Year(%)
14.83
0.00
100.00
19.24
51.59
9.73
5 Year(%)
5 Year(%)
100.00
18.56
13.18
0.00
37.30
7.46
Rolling ReturnsInvestor Insights (As on 31-July-2019)
The above table depicts the daily rolling returns for Regular Plan Growth Option on compounded annualized basis from inception to 1 year & 3 year periods. It provides the maximum, minimum and average returns derived for all these time periods. Total number of time periods: 1year-1117; 3years-621; 5years-126. The above chart is provided for illustration purpose only. Motilal Oswal AMC does not provide any guarantee/ assurance any minimum or maximum returns. Past performance may or may not be sustained in future
Investors Behavioural Analysis (As on 31-July-2019)
Investor Age Bucket
1-30 Years 30-50 Years 50-75 Years > 75 years Not AvailableGrand Total
8,070 27,327 11,220 6,460 0 53,077
Particular
Folio where Investors have never redeemed (Folio Count)
Average monthly SIP instalment
Average age of Investor (in years)
No. of locations from which inflow is received (Unique PinCodes)
Total No. of Folios
Live SIPs
AUM from SIPs
New SIP registration in the month
50.66
1,644
53,077
37,009
14.21 Crs
429
` 3,839.02
44,602
1 Year 3 Year 5 Year
CAGR(%)
Current Valueof Investment of ` 10,000
CAGR(%)
CAGR(%)
0.99 10.53 Scheme -14.30 10,2998,570
1.74 8.26 Nifty Midcap 100 TRI (Benchmark)
-20.63 10,5307,937
23.0921 27.7530 NAV (`) Per Unit(23.7830 : as on 30-Aug-2019)
Nifty 50 TRI (Additional Benchmark)
9.30 8.11-4.35 13,056
16,495
14,872
14.4186
14,7669,565
Current Valueof Investment of ` 10,000
Current Valueof Investment of ` 10,000
Since Inception
CAGR(%)
17.00
15.03
12.50
23,783
21,653
10.0000
19,158
Current Valueof Investment of ` 10,000
Top 10 Holdings
(Data as on 31-August-2019)
ScripSr. No. Weightage (%)
1 Bajaj Finance Ltd.
2 Asian Paints Ltd.
3 City Union Bank Ltd.
4 Voltas Ltd.
5 HDFC Asset Management Company Ltd.
Crompton Greaves Consumer Electricals Ltd.6
7
8 RBL Bank Ltd.
9 Page Industries Ltd.
10 Bata India Ltd.
AU Small Finance Bank Ltd.
Invested Amount
Market Value
Returns (CAGR) %
1 Year
SchemeNiftyFree
FloatMidcap100 TRI
116,796
-4.92
Nifty 50TRI*
120000
107,708
-18.43
3 Year
Scheme
360,000
5 Year
Scheme
600,000
Scheme
660,000
Since Inception
119,044
-1.48
347,073
-2.36
324,498
0.00
629,287
1.88
735,502
3.89
844,787
8.89
769,345
5.51
743,340
8.50
647,792
3.03
401,042
7.14
NiftyFree Float
Midcap100 TRI
Nifty 50TRI*
NiftyFree Float
Midcap100 TRI
Nifty 50TRI*
NiftyFree Float
Midcap100 TRI
Nifty 50TRI*
0.80%
2.06%
2.51%
4.52
4.62%
10.36%
15.02%
18.28%
19.44%
22.39%
Cement
Industrial Products
Pharmaceuticals
Textile Products
Auto Ancillaries
Consumer Non Durables
Finance
Banks
Consumer Durables
Cash & Equivalent
2
9.43
9.14
8.62
8.15
6.95
6.52
6.19
4.63
4.62
4.36

BRSTBRSTBRSTB
BRSTRSTBRST
BRSTBR
BRSTBRSTBRSBRSTBRS
ST
BRSTMotilal Oswal Multicap 35 Fund (MOF35)(Multi Cap Fund - An open ended equity scheme investing across large cap, mid cap, small cap stocks)
3
Date of inception: 28-Apr-14. = Incase, the start/end date of the concerned period is non business date (NBD), the NAV of the previous date is considered for computation of returns. The NAV per unit shown in the table is as on the start date of the said period. Past performance may or may not be sustained in the future. Performance is for Regular Plan Growth option. Different plans have different expense structure.=Mr. Akash Singhania has been appointed as the Fund Manager for equity component with effect from 17-May-2019 vide addendum dated 16-May-2019; Mr. Abhiroop Mukherjee is the Fund Manager for debt component since 28-Apr-2014 and Mr. Herin Visaria for Foreign Securities since 26-July-2019. The performance of the Schemes managed by them are on page no. 1,2,4,5,6 and 7
* Also represents additional benchmarkFor SIP returns, monthly investment of ` 10000/- invested on the 1st day of every month has been considered. Performance is for Regular Plan Growth Option. Past performance may or may not be sustained in the future.
Industry Allocation
(Data as on 31-August-2019) Industry classification as recommended by AMFI(Data as on 31-August-2019)
ScripSr. No. Weightage (%)
1 HDFC Bank Ltd.
2 HDFC Ltd.
3 Infosys Ltd.
4 Axis Bank Ltd.
5 HDFC Life Insurance Company Ltd.
Larsen & Toubro Ltd.6
7 Maruti Suzuki India Ltd.
8 Bajaj Finance Ltd.
9 Tata Consultancy Services Ltd.
10 United Spirits Ltd.
Top 10 Holdings
Investment ObjectiveThe investment objective of the Scheme is to achieve long term capital appreciation by primarily investing in a maximum of 35 equity & equity related instruments across sectors and market-capitalization levels.
However, there can be no assurance or guarantee that the investment objective of the Scheme would be achieved.
BenchmarkNifty 500 TRIContinuous OfferMinimum Application Amount: ` 500/- and in multiples of ̀ 1/- thereafter.
Additional Application Amount: ̀ 500/- and in multiples of ̀ 1/- thereafter.Redemption proceedsNormally within 3 Business days from acceptance of redemption request.
Entry / Exit Load
SIP Performance (As on 31-August-2019)
CategoryMulticap Fund
Entry Load: NilExit Load: 1% - If redeemed on or before 15 days from the date of allotment. Nil - If redeemed after 15 days from the date of allotment. A switch-out or a withdrawal shall also be subjected to the Exit Load like any Redemption. No Exit Load applies for switch between MOF25, MOF30, MOF35, MOFEH & MOFDYNAMIC. No Load for switch between Options within the Scheme. Further, it is clarified that there will be no exit load charged on a switch-out from Regular to Direct plan within the same scheme.
Performance (As on 31-August-2019)
The above table depicts the daily rolling returns for Regular Plan Growth Option on compounded annualized basis from inception to 1 year & 3 year periods. It provides the maximum, minimum and average returns derived for all these time periods. Total number of time periods: 1year-1075; 3years-579; 5year-87. The above chart is provided for illustration purpose only. Motilal Oswal AMC does not provide any guarantee/ assurance any minimum or maximum returns. Past performance may or may not be sustained in future
Investor Insights (As on 31-July-2019)
Investors Behavioural Analysis (As on 31-July-2019)
Investor Age Bucket
1-30 Years 30-50 Years 50-75 Years > 75 years Not AvailableGrand Total
1,00,589 2,79,246 1,07,519 39,233 0 5,26,587
Particular
Folio where Investors have never redeemed (Folio Count)
Average monthly SIP Instalment
Average age of Investor (in years)
No. of locations from which inflow is received (Unique PinCodes)
Total No. of Folios
Live SIPs
AUM from SIP
New SIP registration in the month
46.17
7,819
5,26,587
3,42,214
140.97Crs
4,552
` 4,119.25
4,59,544
1 Year 3 Year 5 Year
CAGR(%)
Current Valueof Investment of ` 10,000
CAGR(%)
CAGR(%)
8.04 15.16 Scheme -7.33 12,6109,267
7.56 8.40Nifty 500 TRI (Benchmark) -9.02 12,4459,098
19.9267 27.1151 NAV (`) Per Unit(25.1282 : as on 30-Aug-2019)
Nifty 50 TRI (Additional Benchmark)
9.30 8.11 -4.35 13,056
20,249
14,970
12.4093
14,7669,565
Current Valueof Investment of ` 10,000
Current Valueof Investment of ` 10,000
Since Inception
CAGR(%)
18.81
11.65
11.06
25,128
18,019
10.0000
17,517
Current Valueof Investment of ` 10,000
Fund Manager
Date of Allotment 28-Apr-2014
NAVRegular Plan Growth Option : ̀ 25.1282Regular Plan Dividend Option : ̀ 22.1383Direct Plan Growth Option : ̀ 26.4470Direct Plan Dividend Option : ̀ 23.4254
Scheme Statistics
0.27Tracking Error*
Standard Deviation6.44% (Annualised)
Sharpe Ratio# 0.18 (Annualised)
Portfolio Turnover RatioBeta 0.97
` 12,443.96 (` cr)Monthly AAUMLatest AUM (31-Aug-2019) ` 12,693.11 (` cr)
14.64 (Annualised)
R-Squared 0.81*Against the benchmark Nifty 500. # Risk free returns based on last overnight MIBOR cut-off of 5.45%
(Data as on 31-August-2019)
Mr. Abhiroop Mukherjee
For Equity Component
For Debt Component since Inception
Mr. Herin Visaria
Foreign Securities
Managing since 26-July-2019
Dividend HistoryDividend
per Unit (`)Cum Dividend
NAVEx Dividend
NAV
0.3000
0.3000
24.5332
23.7803
24.2332
23.4803
Record Date
Direct Plan
Regular Plan
30-June-2017
Pursuant to payment of dividend, NAV per unit will fall to the extent of the dividend payout and statutory levy (if applicable). Face value ` 10/-. Past performance may or may not be sustained in future.
1.75
1.75
26.4448
25.4495
24.6948
23.6995
Direct Plan
Regular Plan
20-March-2018
1.00
1.00
25.1298
23.8865
24.1298
22.8865
Direct Plan
Regular Plan
28-March-2019
Mr. Akash SinghaniaManaging this fund since 17-May-2019He has overall 13 years of experience
Invested Amount
Market Value
Returns (CAGR) %
1 Year
Scheme Nifty500 TRI
119,114
-1.37
Nifty 50TRI*
120000
116,423
-5.48
3 Year
Scheme
360,000
5 Year
Scheme
600,000
Scheme
640,000
Since Inception
119,044
-1.48
371,579
2.07
379,314
3.43
714,637
6.93
779,876
7.34
826,293
9.50
743,340
8.50
736,299
8.12
401,042
7.14
Nifty 50TRI*
Nifty 50TRI*
Nifty 50TRI*
Nifty500 TRI
Nifty500 TRI
Nifty500 TRI
807,833
8.66
10.08
7.68
7.26
6.54
6.15
5.80
4.82
4.77
4.72
4.41
% times returns are in excess of 15%
Maximum
Average
66.68
16.10
24.28
60.19
47.72
% times returns arein excess of 7%
% times negative returns
57.58
39.63
10.16
24.00
35.26
Minimum -13.84 -20.06
17.66
0.00
100.00
33.63
58.38
7.36
100.00
18.03
12.60
0.00
14.85
8.16
Scheme Nifty 500 TRI
1 Year(%)
3 Year(%)
1 Year(%)
3 Year(%)
17.56
0.00
100.00
21.08
90.80
14.43
5 Year(%)
5 Year(%)
100.00
14.28
10.66
0.00
0.00
7.85
Rolling Returns
2.55%
2.94%
3.17%
4.34%
5.80%
8.11%
9.90%
13.77%
21.17%
24.06%
Consumer Durables
Petroleum Products
Gas
Pharmaceuticals
Construction Project
Auto
Consumer Non Durables
Software
Banks
Finance
1.54%Retailing
2.62%Cash & Equivalent

BRSTBRSTBRSTB
BRSTRSTBRST
BRSTBR
BRSTBRSTBRSBRSTBRS
ST
BRSTMotilal Oswal Long Term Equity Fund (MOFLTE)(An open ended equity linked saving scheme with a statutory lock in of 3 years and tax benefit)
4
SIP Performance (As on 31-August-2019)
Date of inception: 21-Jan-15. = Incase, the start/end date of the concerned period is non business date (NBD), the NAV of the previous date is considered for computation of returns. The NAV per unit shown in the table is as on the start date of the said period. Past performance may or may not be sustained in the future. Performance is for Regular Plan Growth Option. Different plans have different expense structure. = Mr. Akash Singhania has been appointed as the Fund Manager for equity component with effect from 17-May-2019 vide addendum dated 16-May-2019; Mr. Abhiroop Mukherjee is the Fund Manager for debt component since inception. The performance of the Schemes managed by them are on page no. 1, 2, 3, 5,6 and 7 = The scheme has been in existence for less than 5 years.
* Also represents additional benchmarkFor SIP returns, monthly investment of ` 10000/- invested on the 1st day of every month has been considered. Performance is for Regular Plan Growth Option. Past performance may or may not be sustained in the future.
Industry Allocation
(Data as on 31-August-2019) Industry classification as recommended by AMFI
Fund Manager
Investment Objective
The investment objective of the Scheme is to generate long-term capital appreciation from a diversified portfolio of predominantly equity and equity related instruments. However, there can be no assurance or guarantee that the investment objective of the Scheme would be achieved.
BenchmarkNifty 500 TRI
Continuous Offer
Minimum Application Amount: ` 500/- and in multiples of ̀ 500/- thereafter.
Additional Purchase: ` 500/- and in multiples of ̀ 500/- thereafter.
Redemption proceeds
Normally within 3 Business days from acceptance of redemption request.Entry / Exit LoadNil
Date of Allotment
21-Jan-2015
NAV
Regular Plan Growth Option : ̀ 16.6287
Regular Plan Dividend Option : ̀ 14.7344
Direct Plan Growth Option : ̀ 17.6990
Direct Plan Dividend Option : ̀ 15.7646
Scheme Statistics
Dividend History
Top 10 Holdings
(Data as on 31-August-2019)
ScripSr. No. Weightage (%)
1 HDFC Bank Ltd.
2 ICICI Bank Ltd.
3 HDFC Ltd.
4 HDFC Life Insurance Company Ltd.
5 Larsen & Toubro Ltd.
Kotak Mahindra Bank Ltd.7
6 Maruti Suzuki India Ltd.
8
Hindustan Unilever Ltd.
9 Asian Paints Ltd.
10
Infosys Ltd.
8.66
7.08
5.89
5.21
4.87
4.64
4.85
4.11
4.07
4.06
Dividendper Unit (`)
Cum DividendNAV
Ex DividendNAV
0.50
0.50
15.0915
14.6324
14.5915
14.1324
Record Date
Direct Plan
Regular Plan
24-March-2017
Mr. Akash SinghaniaManaging this fund since 17-May-2019He has overall 13 years of experience
Mr. Abhiroop Mukherjee
For Equity Component
For Debt Component since Inception
The above table depicts the daily rolling returns for Regular Plan Growth Option on compounded annualized basis from inception to 1 year period. It provides the maximum, minimum and average returns derived for all these time periods. Total number of time periods: 1year-891; 3year-386; The above chart is provided for illustration purpose only. Motilal Oswal AMC does not provide any guarantee/ assurance any minimum or maximum returns. Past performance may or may not be sustained in future
0.52
Tracking Error*
Standard Deviation
6.47% (Annualised)
Sharpe Ratio# 0.27 (Annualised)
Portfolio Turnover RatioBeta 0.85
` 1355.20 (` cr)Monthly AAUM
Latest AUM (31-Aug-2019) ` 1389.39 (` cr)
13.09 (Annualised)
R-Squared 0.77*Against the benchmark Nifty 500. # Risk free returns based on last overnight MIBOR cut-off of 5.45%
(Data as on 31-August-2019)
Pursuant to payment of dividend, NAV per unit will fall to the extent of the dividend payout and statutory levy (if applicable). Face value ` 10/-. Past performance may or may not be sustained in future.
Category
ELSS
1.00
1.00
17.8423
17.0751
16.8423
16.0751
Direct Plan
Regular Plan
05-February-2018
Performance (As on 31-August-2019)
1 Year 3 Year Since Inception
12.8541 10.0000NAV (`) Per Unit(16.6287 as on 30-August-2019)
CAGR(%)
Current Value ofInvestment of
` 10,000
CAGR(%)
Current Value ofInvestment of
` 10,000
CAGR(%)
Current Value ofInvestment of
` 10,000
18.0537
8.96 11.66Scheme -7.89
7.56 6.54 Nifty 500 TRI (Benchmark) -9.02
9.30
12,936
12,445
13,056 6.61
16,629
13,392
13,435Nifty 50 TRI (Additional Benchmark) -4.35
9,211
9,098
9,565
0.10
0.10
16.7096
15.9239
16.6096
15.8239
Direct Plan
Regular Plan
20-March-2018
Rolling Returns
% times returns are in excess of 15%
Maximum
Average
50.60
13.78
30.64
59.15
45.01
% times returns arein excess of 7%
% times negative returns
58.36
42.05
10.83
23.01
38.16
Minimum -14.98 -18.66
100.00
17.46
12.50
0.00
19.43
7.02
15.80
0.00
100.00
22.24
63.73
8.47
Scheme Nifty 500 TRI
1 Year(%)
3 Year(%)
1 Year(%)
3 Year(%)
Investor Insights (As on 31-July-2019)
Investors Behavioural Analysis (As on 31-July-2019)
Investor Age Bucket
1-30 Years 30-50 Years 50-75 Years > 75 years Not AvailableGrand Total
59,774 86,688 32,007 13,539 0 1,92,008
0.30
0.30
16.4708
15.5031
16.1708
15.2031
Direct Plan
Regular Plan
28-March-2019
1 Year 3 Year Since Inception
Scheme Nifty 500 TRI
Nifty 50TRI*
Scheme Nifty 500 TRI
Nifty 50TRI*
Scheme Nifty 500 TRI
Nifty 50TRI*
120,000 360,000 550,000 Invested Amount
Returns (CAGR) %
119,406 116,423 118,977 372,230 379,314 400,975 660,473 643,131 672,009Market Value
-0.92 -5.48 -1.58 2.18 3.43 7.13 7.93 6.77 8.69
1.27%
1.68%
3.22%
4.87%
7.36%
7.59%
8.08%
14.24%
20.76%
30.89%
Pharmaceuticals
Textile Products
Construction Project
Software
Auto
Consumer Durables
Consumer Non Durables
Finance
Banks
Cash & Equivalent
Particular
Folio where Investors have never redeemed (Folio Count)
Average monthly SIP Instalment
Average age of Investor (in years)
No. of locations from which inflow is received (Unique PinCodes)
Total No. of Folios
Live SIPs
AUM from SIP
New SIP registration in the month
43.08
3,659
1,92,008
68,829
20.05Crs
1,414
` 2,913.32
1,89,349

BRSTBRSTBRSTB
BRSTRSTBRST
BRSTBR
BRSTBRSTBRSBRSTBRS
ST
BRSTMotilal Oswal Dynamic Fund (MOFDYNAMIC)(An open ended dynamic asset allocation fund)
Performance (As on 31-August-2019)
SIP Performance (As on 31-August-2019)
Date of inception: 27-Sep-2016 = Incase, the start/end date of the concerned period is non business date (NBD), the NAV of the previous date is considered for computation of returns. The NAV per unit shown in the table is as on the start date of the said period. Past performance may or may not be sustained in the future. Performance is for Regular Plan Growth Option. Different plans have different expense structure. = Mr. Akash Singhania has been appointed as the Fund Manager for equity component with effect from 17-May-2019 vide addendum dated 16-May-2019; Mr. Abhiroop Mukherjee is the Fund Manager for debt component since inception. The performance of the Schemes managed by them are on page no. 1,2,3, 4,6 and 7. = The scheme has been in existence for less than 3 years
1 Year Since Inception
* Also represents additional benchmarkFor SIP returns, monthly investment of ` 10000/- invested on the 1st day of every month has been considered. Performance is for Regular Plan Growth Option. Past performance may or may not be sustained in the future.
Scheme CRISIL Hybrid 35 + 65 - Aggressive Index TRI
Nifty 50 TRI*
Scheme CRISIL Hybrid 35 + 65 - Aggressive Index TRI
Nifty 50 TRI*
120,000 350,000 Invested Amount
1 Year Since Inception
10.0000NAV (`) Per Unit(12.2653: as on 30-August-2019)
CAGR (%) Current Value ofInvestment of ` 10,000
CAGR (%)Current Value of
Investment of ` 10,000
12.2470
7.23Scheme 0.15
8.42CRISIL Hybrid 35 + 65 - Aggressive TRI (Benchmark)
-0.35
9.86
12,265
12,668
13,167Nifty 50 TRI (Additional Benchmark) -4.35
10,015
9,965
9,565
Returns (CAGR) %
122,252 121,691 119,044 373,518 384,145 388,016Market Value
3.50 2.63 -1.48 4.39 6.32 7.01
Investment Objective
The investment objective is to generate long term capital appreciation by investing in equity and equity related instruments including equity derivatives, debt, money market instruments and units issued by REITs and InvITs.
However, there can be no assurance or guarantee that the investment objective of the Scheme would be achieved.
BenchmarkCRISIL Hybrid 35 + 65 - Aggressive TRI
Continuous OfferMinimum Application Amount : ̀ 500/- and in multiples of ̀ 1/- thereafter.
Additional Application Amount: ̀ 500/- and in multiples of ̀ 1/- thereafter.
Redemption proceedsNormally within 3 Business days from acceptance of redemption request.
Entry / Exit Load
CategoryDynamic Asset Allocation
Entry Load: NilExit Load: 1% - If redeemed on or before 15 days from the date of allotment. Nil - If redeemed after 15 days from the date of allotment. A switch-out or a withdrawal shall also be subjected to the Exit Load like any Redemption. No Exit Load applies for switch between MOF25, MOF30, MOF35, MOFEH & MOFDYNAMIC. No Load for switch between Options within the Scheme. Further, it is clarified that there will be no exit load charged on a switch-out from Regular to Direct plan within the same scheme.
Industry Allocation (Equity) Top 10 Holdings
(Data as on 31-Aug-2019) Industry classification as recommended by AMFI (Data as on 31-August-2019)
ScripSr. No. Weightage (%)
1
2
3
4
5
6
7
8
9
10
HDFC Ltd.
United Spirits Ltd.
Bajaj Finance Ltd.
HDFC Bank Ltd.
Titan Company Ltd.
ICICI Bank Ltd.
HDFC Life Insurance Company Ltd.
Larsen & Toubro Ltd.
Kotak Mahindra Bank Ltd.
Asian Paints Ltd.
9.39
8.77
8.73
7.05
4.78
4.10
3.64
2.96
2.83
2.81
Investor Insights (As on 31-July-2019)
5(Data as on 31-August-2019)
Instrument Name
Allocation Weightage%
Equity 69.23
Bonds and NCDs 8.00
Fixed Deposit 5.52
Derivatives -24.66
Money Market Instrument (CD & CBLO Treasury Bill) 17.18
Cash & Cash Equivalents 24.73
Total 100.00
Fund Manager
Date of Allotment27-Sep-2016
NAVRegular Plan Growth Option : ̀ 12.2653Regular Plan - Quarterly Dividend Option : ̀ 11.3797
Direct Plan Growth Option : `12.6582
Scheme Statistics
Portfolio Turnover Ratio 3.61
` 1,273.83 (` cr)Monthly AAUMLatest AUM (31-Aug-2019) ` 1264.31 (`cr)
Regular Plan - Annual Dividend Option : ̀ 11.5374
Direct Plan - Annual Dividend Option : ̀ 11.9852
Mr. Abhiroop Mukherjee
For Equity Component
For Debt Component since Inception
Quantitative Indicators
(Data as on 31-August-2019)
Average Maturity
YTMPortfolio Modified Duration
1.35 yrs
7.35%0.039yrs
Direct Plan - Quarterly Dividend Option : ̀ 11.5480
Dividend HistoryDividend
per Unit (`)Cum Dividend
NAVEx Dividend
NAV
0.2600 11.8446 11.5846
Record Date
23-Oct-2017
Quarterly Dividend (Direct Plan)
Quarterly Dividend (Regular Plan)
Annual Dividend (Direct Plan)
Pursuant to payment of dividend, NAV per unit will fall to the extent of the dividend payout and statutory levy (if applicable). Face value ` 10/-. Past performance may or may not be sustained in future.
0.1199 11.8554 11.735520-Mar-2018
Annual Dividend( Regular Plan)0.2600 11.6879 11.427923-Oct-20170.1500 11.6473 11.497320-Mar-2018
28-Mar-2019 0.3000 11.8144 11.5144
0.0750 11.3702 11.295231-Oct-2018
0.3000 11.5864 11.286421-Jan-2019
0.0500 11.6597 11.609710-Jul-2018
0.0750 11.1126 11.037631-Oct-2018
0.3000 11.2969 10.996921-Jan-2019
0.2681 12.1778 11.909728-Mar-2019
Mr. Akash SinghaniaManaging this fund since 17-May-2019He has overall 13 years of experience
Investors Behavioural Analysis (As on 31-July-2019)
Investor Age Bucket
1-30 Years 30-50 Years 50-75 Years > 75 years Not Available
GrandTotal
4,782 17,672 14,682 4,147 0 41,283
The above table depicts the daily rolling returns for Regular Plan Growth Option on compounded annualized basis from inception to 1 year period. It provides the maximum, minimum and average returns derived for all these time periods. Total number of time periods: 1year-474; The above chart is provided for illustration purpose only. Motilal Oswal AMC does not provide any guarantee/ assurance any minimum or maximum returns. Past performance may or may not be sustained in future
Rolling Returns
24.68
38.61% times returns arein excess of 7%
% times negative returns
Minimum -4.36
66.88
3.16
-2.04
Average 6.77 9.47
Dynamic Equity Fund
CRISIL Hybrid 35+65 -
Aggressive index
Maximum 27.49 26.76
% times returns are in excess of 15% 22.57 18.57
1 Year (%) 1 Year (%)
0.61%
1.48%
2.67%
2.96%
3.09%
4.78%
14.17%
17.71%
21.76%
Pharmaceuticals
Textile Products
Software
Construction Project
Auto
Consumer Durables
Consumer Non Durables
Banks
Finance
Particular
Folio where Investors have never redeemed (Folio Count)
Average monthly SIP Instalment
Average age of Investor (in years)
No. of locations from which inflow is received (Unique PinCodes)
Total No. of Folios
Live SIPs
AUM from SIP
New SIP registration in the month
50.05
704
41,283
8,703
4.48 Crs
33
` 5,153.07
37,475
5
0.2000 11.6058 11.405830-Jul-2019

Cement 1.38%
BRSTBRSTBRSTB
BRSTRSTBRST
BRSTBR
BRSTBRSTBRSBRSTBRS
ST
BRSTMotilal Oswal Equity Hybrid Fund (MOFEH)(An open ended hybrid scheme investing predominantly in equity and equity related instruments)
6
Investment Objective
The investment objective is to generate equity linked returns by investing in a combined portfolio of equity and equity related instruments, debt, money market instruments and units issued by Real Estate Investment Trust (REITs) and Infrastructure Investment Trust (InvITs).
BenchmarkCRISIL Hybrid 35 + 65 - Aggressive TRI
Continuous Offer
Minimum Application Amount : ̀ 500/- and in multiples of ̀ 1/- thereafter.
Additional Application Amount: ̀ 500/- and in multiples of ̀ 1/- thereafter.
Redemption proceedsNormally within 3 Business days from acceptance of redemption request.
Entry / Exit Load
Equity
Bonds & NCDs
Treasury Bills
CBLO / Reverse Repo Investments
Instrument Name
Allocation
76.84
Weightage%
3.92
Cash & Cash Equivalents
14.20
-0.49
(Data as on 31-August-2019)
CategoryAggressive Hybrid Fund
Entry Load: Nil
Exit Load: 1% - If redeemed on or before 15 days from the date of allotment. Nil - If redeemed after 15 days from the date of allotment. A switch-out or a withdrawal shall also be subjected to the Exit Load like any Redemption. No Exit Load applies for switch between MOF25, MOF30, MOF35, MOFEH & MOFDYNAMIC. No Load for switch between Options within the Scheme. Further, it is clarified that there will be no exit load charged on a switch-out from Regular to Direct plan within the same scheme.
(Data as on 31-August-2019)
HDFC Life Insurance Company Ltd.
Security
Top 10 Holdings
9.56
Weightage%
Tata Consultancy Services Ltd. 6.53
ICICI Bank Ltd. 6.49
HDFC Bank Ltd. 6.39
Avenue Supermarts Ltd. 5.16
Abbott India Ltd. 4.73
Kotak Mahindra Bank Ltd. 4.57
Larsen & Toubro Ltd. 4.02
Maruti Suzuki India Ltd. 3.03
ABB India Ltd. 2.78
Sr. No.
1
2
3
4
5
6
7
8
9
10
Industry Allocation (Equity)
(Data as on 31-August-2019) Industry classification as recommended by AMFI
8.93%
14.20%
14.22%
17.44%
Textile Products
Auto Ancillaries
Consumer Non Durables
Industrial Capital Goods
Consumer Durables
Transportation
Construction Project
Auto
Retailing
Pharmaceuticals
Software
Sovereign
Finance
Banks
7.02%
5.16%
4.51%
4.02%
3.44%
2.89%
2.78%
1.90%
1.62%
1.51%Fund and Co-Fund Manager
Date of Allotment14-Sep-2018
NAVRegular Plan Growth Option : ̀ 10.4452Direct Plan Growth Option
Scheme Statistics
Portfolio Turnover Ratio 0.56
` 254.15 (` cr)Monthly AAUMLatest AUM (31-Aug-2019) ` 256.84 (`cr)
Mr. Siddharth BothraHe is managing this fund since inception.He has close to 17 years of experience
Mr. Akash SinghaniaHe is managing this fund since inception.He has close to 13 years of experience
Mr. Abhiroop Mukherjee
For Equity Component
For Debt Component since Inception
: ` 10.5973
Quantitative Indicators
(Data as on 31-August-2019)
Average Maturity
YTM
0.53 yrs
5.60%
Portfolio MD 0.09 yrs
Total 100.00
5.53
Cash & Equivalent 5.04%

BRSTBRSTBRSTB
BRSTRSTBRST
BRSTBR
BRSTBRSTBRSBRSTBRS
ST
BRSTInvestment Objective
The investment objective of the Scheme is to generate optimal returns consistent with moderate levels of risk and liquidity by investing in debt securities and money market securities.
However, there can be no assurance or guarantee that the investment objective of the Scheme would be achieved.
BenchmarkCRISIL Ultra Short Term Debt TRI
Continuous Offer
Minimum Application Amount : ̀ 500/- and in multiples of ̀ 1/- thereafter.Additional Application Amount : ̀ 500/- and in multiples of ̀ 1/- thereafter.
Redemption proceeds
Normally within 1 Business day from acceptance of redemption request.
Entry / Exit LoadNil
Date of Allotment6-Sep-2013
NAV
Motilal Oswal Ultra Short Term Fund (MOFUSTF)(An open ended ultra-short term debt scheme investing in instruments such that the Macaulay#
duration of the portfolio is between 3 months and 6 months)
7
Performance (As on 31-August-2019)
Scheme Statistics` 117.72 (` cr)Monthly AAUM
Latest AUM (31-August-2019) ` 115.53(` cr)
Fund Manager
Mr. Abhiroop Mukherjee Managing this fund since inception
He has over 10 years of experience
Dividend HistoryDividend
per Unit (`)Cum Dividend
NAVEx Dividend
NAV
0.1399
0.1571
10.1607
10.1932
10.0208
10.0361
Record Date
29-Dec-2017
03-Apr-2018
Quarterly Dividend (Direct Plan)
0.1629 10.1885 10.025629-Jun-2018
10.1596
10.1917
10.0313
10.0465
29-Dec-2017
03-Apr-2018
Quarterly Dividend (Regular Plan)
0.1283
0.14520.1517 10.1876 10.035929-Jun-2018
10.0860 10.000429-Jun-2018
Monthly Dividend (Direct Plan)
0.08560.0527 10.0531 10.000427-Jul-2018
10.0827 10.001229-Jun-2018
Monthly Dividend (Regular Plan)
0.08150.0491 10.0503 10.001227-Jul-2018
Regular Plan Growth Option
Regular Plan - Daily Dividend Option
Regular Plan - Fortnightly Dividend Option
Regular Plan - Monthly Dividend Option
Regular Plan - Weekly Dividend Option
Regular Plan - Quarterly Dividend Option
Direct Plan Growth Option
Direct Plan Growth - Daily Dividend Option
Direct Plan Growth - Weekly Dividend Option
Direct Plan Growth - Fortnightly Dividend Option
Direct Plan Growth - Monthly Dividend Option
Direct Plan Growth - Quarterly Dividend Option
: ̀ 12.6650
: ` 9.1953
: ` 9.1986
: ` 9.2048
: ̀ 9.1958
: ̀ 9.3294
: ̀ 13.0243
: ̀ 9.1919
: ̀ 9.2022
: ̀ 9.2092
: ̀ 9.1985
: ̀ 9.3308
Quantitative Indicators
*For Motilal Oswal Ultra Short Term Fund Modified Duration is equal to its Average maturity(Data as on 31-August-2019)
Average Maturity
YTM
154.73 days/0.42 yrs
5.40%
Pursuant to payment of dividend, NAV per unit will fall to the extent of the dividend payout and statutory levy (if applicable). Face value ` 10/-. Past performance may or may not be sustained in future.
Date of inception: 6-Sep-2013. = Incase, the start/end date of the concerned period is non business date (NBD), the NAV of the previous date is considered for computation of returns. The NAV per unit shown in the table is as on the start date of the said period. Past performance may or may not be sustained in the future. Performance is for Regular Plan Growth option. Different plans have different expense structure. = Mr. Abhiroop Mukherjee is the Fund Manager since 6-Sep-2013. The performance of the Schemes managed by him are on page no. 1,2,3,4, 5 and 6
Catagory
Ultra Short Duration Fund
Sovereign
ICRA A1+
Rating
Rating Profile
% to Net Assets
67.11
4.24
364 Days T BILL - 28-Mar-20
Treasury Bill
67.111
(Data as on 31-August-2019)
(Data as on 31-August-2019)
#please refer to page no.21 of SID of MOFUSTF
0.0653 10.0657 10.000431-Aug-2018
0.0608 10.0619 10.001131-Aug-2018
(Data as on 31-August-2019)
Security
Holdings in Certificate of Deposit (CD)
Weightage (%)
ICICI Bank Ltd. 4.24
Sr. No.
2
1 Year 3 Year 5 Year
CAGR(%)
Current Valueof Investment of ` 10,000
CAGR(%)
CAGR(%)
1.04 3.25Scheme -8.05 10,3169,195
7.60 7.98CRISIL Ultra Short Term DebtTRI (Benchmark) 8.28 12,43810,828
12.277613.7669NAV (`) Per Unit (12.6650 as on30-August-2019)
CRISIL Liquifex TRI (Additional Benchmark) 7.13 7.557.31 12,277
11,734
14,651
10.8516
14,36310,731
Current Valueof Investment of ` 10,000
Current Valueof Investment of ` 10,000
Since Inception
CAGR(%)
4.03
8.35
7.92
12,665
16,159
10.0000
15,776
Current Valueof Investment of ` 10,000
CRISIL A1+ 4.20
Cash and Cash Equivalent 24.46
IndusInd Bank Ltd. 4.203

Cash & Equivalent 38.30
8
Investment Objective
The investment objective of the Scheme is to seek returns by investing in units of Motilal Oswal Nasdaq 100 ETF.
However, there can be no assurance or guarantee that the investment objective of the Scheme would be achieved.
BenchmarkNASDAQ-100 Index
Continuous Offer
Minimum Application Amount : ̀ 500/- and in multiples of ̀ 1/- thereafter.Additional Application Amount : ̀ 500/- and in multiples of ̀ 1/- thereafter.
BRSTBRSTBRSTB
BRSTRSTBRST
BRSTBR
BRSTBRSTBRSBRSTBRS
ST
BRSTMotilal Oswal Nasdaq 100 Fund of Fund (MOFN100FOF)(An open ended fund of fund scheme investing in Motilal Oswal Nasdaq 100 ETF)
Category
Domestic Fund of Fund
Company
Portfolio
% to Net Assets
(Data as on 31-August-2019)
CBLO / Reverse Repo Investments 1.49
NASDAQ ETF 98.75
: ̀ 11.7648
: ` 11.6747
Redemption proceeds
Normally within 6 Business days from acceptance of redemption request
Entry / Exit LoadNil
Date of Allotment 29-Nov-2018
NAV
Regular Plan Growth Option
Direct Plan Growth Option
Scheme Statistics
` 76.42 (` cr)Monthly AAUM
Latest AUM (31-August-2019) ` 80.55 (` cr)
Fund Manager
Mr. Swapnil Mayekar
Mr. Abhiroop MukherjeeFor Debt Component since Inception
Managing this fund since 26-July-2019. He has 10 years of rich experience. The performance of the schemes managed by him are on page 9 and 10
BRSTBRSTBRSTB
BRSTRSTBRST
BRSTBR
BRSTBRSTBRSBRSTBRS
ST
BRSTMotilal Oswal Liquid Fund (MOFLF)(An open ended liquid fund)
Company
Portfolio
% to Net Assets
CBLO / Reverse Repo Investments
Cash & Cash Equivalent
Treasury Bill
37.02
1.28
Investment Objective
The investment objective of the Scheme is to generate optimal returns with high liquidity to the investors through a portfolio of money market securities.
However, there can be no assurance or guarantee that the investment objective of the scheme would be achieved.
BenchmarkCRISIL Liquid Fund IndexContinuous OfferMinimum Application Amount: Rs 500/- and in multiples of Rs 1/- thereafter.
Additional Application Amount: Rs 500/- and in multiples of Rs 1/- thereafter.
CategoryLiquid Fund
Investors are requested to note that they will be bearing the recurring expenses of the fund of funds scheme, in addition to the expenses of underlying scheme in which the fund of funds scheme makes investments.
(Data as on 31-August-2019)
Particular
Rating Profile
% to Net Assets
(Data as on 31-August-2019)
Particular
Sector
% to Net Assets
Cash & Equivalent
Investment Funds/Mutual Funds
1.25
98.75
(Data as on 31-August-2019)
Sovereign 61.70
Dividend History
0.0543 10.0844 10.030030-Aug-2019
Pursuant to payment of dividend, NAV per unit will fall to the extent of the dividend payout and statutory levy (if applicable). Face value ` 10/-. Past performance may or may not be sustained in future.
Dividendper Unit (`)
Cum DividendNAV
Ex DividendNAV
Record Date
Cash & Cash Equivalent -0.24
Monthly Dividend (Direct Plan)
0.0528 10.0828 10.030030-Aug-2019
Dividendper Unit (`)
Cum DividendNAV
Ex DividendNAV
Record Date
Monthly Dividend (Regular Plan)
0.0399 10.0699 10.030026-Jul-2019
0.0412 10.0712 10.030026-Jul-2019
61.70
0.0420 10.0720 10.030028-Jun-2019
0.0408 10.0708 10.030028-Jun-2019
0.1449 10.1483 10.003428-Jun-2019
Dividendper Unit (`)
Cum DividendNAV
Ex DividendNAV
Record Date
Quarterly Dividend (Regular Plan)
For deployment of unclaimed redemption and dividend amounts, four separate plans are introduced under MOFLF collectively referred to as “Unclaimed Amount Plan(s). For detailed information please refer the Scheme Information Document.
The performance of schemes managed by him are on page 1,2,3,4,5,6 and 7
Redemption proceeds
Normally within 1 Business day from acceptance of redemption request
Entry / Exit LoadNil
Date of Allotment 20-Dec-2018
NAV Scheme Statistics
` 388.60 (` cr)Monthly AAUM
Latest AUM (31-August-2019) ` 402.48
Fund Manager
Mr. Abhiroop MukherjeeManaging this fund since inception. He has over 10 years of experience. The performance of schemes managed by him are on page 1,2,3,4,5,6 and 7
Quantitative Indicators
For Liquid Fund, Modified Duration is equal to its Average maturity(Data as on 31-August-2019)
Average Maturity
YTM
31.09 days/0.085 yrs
5.25%
Regular Plan Growth Option
Regular Plan - Weekly Dividend Option
Regular Plan - Monthly Dividend Option
Regular Plan - Daily Dividend Option: ̀ 10.4026
: `10.0130
: `10.0300
: `10.0055
Regular Plan - Fortnightly Dividend : `10.0136
Direct Plan Daily DividendOption Direct Plan Weekly DividendOption
Direct Plan Monthly DividendOption Direct Plan Quarterly DividendOption
Direct Plan Growth Option
Direct Plan Fortnightly DividendOption
: `10.0077: `10.0058
: `10.0300: `10.0988
: `10.4135
: `10.0140
Unclaimed Dividend Plan Below 3 years : `10.1120
Regular Plan - Quarterly Dividend Option : `10.0845
Total 100
BRSTBRSTBRSTB
BRSTRSTBRST
BRSTBR
BRSTBRSTBRSBRSTBRS
ST
BRSTInvestment Objective
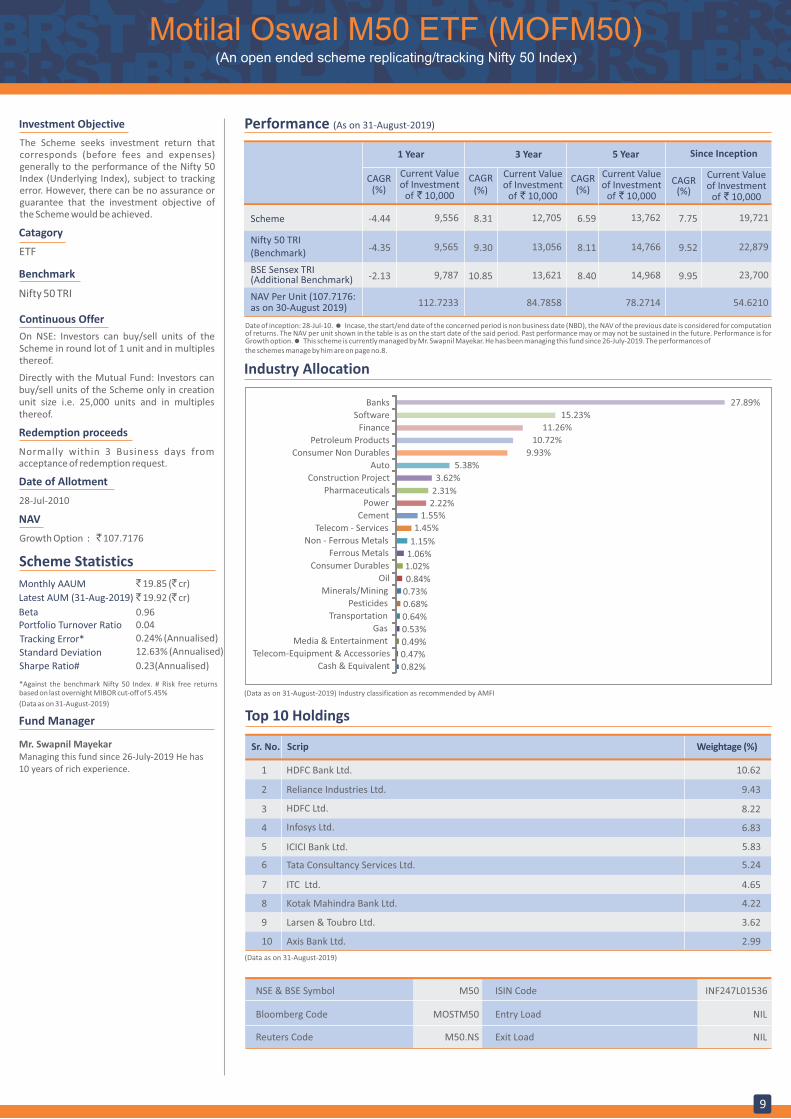
The Scheme seeks investment return that corresponds (before fees and expenses) generally to the performance of the Nifty 50 Index (Underlying Index), subject to tracking error. However, there can be no assurance or guarantee that the investment objective of the Scheme would be achieved.
Benchmark
Nifty 50 TRI
Continuous Offer
On NSE: Investors can buy/sell units of the Scheme in round lot of 1 unit and in multiples thereof.
Directly with the Mutual Fund: Investors can buy/sell units of the Scheme only in creation unit size i.e. 25,000 units and in multiples thereof.
Redemption proceeds
Normally within 3 Business days from acceptance of redemption request.
Date of Allotment
28-Jul-2010
NAV
Growth Option : ̀ 107.7176
Motilal Oswal M50 ETF (MOFM50)(An open ended scheme replicating/tracking Nifty 50 Index)
9
Performance (As on 31-August-2019)
Scheme Statistics
Fund Manager
0.04
Tracking Error*
Standard Deviation
0.24% (Annualised)
Sharpe Ratio# 0.23(Annualised)
Portfolio Turnover RatioBeta 0.96
` 19.85 (` cr)Monthly AAUM
Latest AUM (31-Aug-2019) ` 19.92 (` cr)
12.63% (Annualised)
1 Year 3 Year Since Inception
CAGR (%)
Current Valueof Investment
of ` 10,000
CAGR (%)
Current Valueof Investment
of ` 10,000
CAGR(%)
Current Valueof Investment
of ` 10,000
8.31 7.75Scheme -4.44
9.30 9.52Nifty 50 TRI (Benchmark)
-4.35
12,705
13,056
19,721
22,879
9,556
9,565
5 Year
CAGR (%)
6.59
8.11
Current Valueof Investment
of ` 10,000
13,762
14,766
Mr. Swapnil MayekarManaging this fund since 26-July-2019 He has 10 years of rich experience.
*Against the benchmark Nifty 50 Index. # Risk free returns based on last overnight MIBOR cut-off of 5.45%
(Data as on 31-August-2019)
Industry Allocation
(Data as on 31-August-2019) Industry classification as recommended by AMFI
0.82%
0.47%0.49%0.53%
0.64%
0.68%
0.73%
0.84%
1.06%
1.15%
1.45%
1.55%2.22%
2.31%
3.62%
5.38%
9.93%
10.72%
11.26%
15.23%
27.89%
Cash & Equivalent
Telecom-Equipment & Accessories
Media & Entertainment
Gas
Transportation
Pesticides
Minerals/Mining
Oil
Consumer Durables
Ferrous Metals
Non - Ferrous Metals
Telecom - Services
Cement
Power
Pharmaceuticals
Construction Project
Auto
Consumer Non Durables
Petroleum Products
Finance
Software
Banks
(Data as on 31-August-2019)
ScripSr. No. Weightage (%)
1 HDFC Bank Ltd.
2 Reliance Industries Ltd.
3 HDFC Ltd.
4 Infosys Ltd.
5 ICICI Bank Ltd.
Tata Consultancy Services Ltd.6
7 ITC Ltd.
8 Kotak Mahindra Bank Ltd.
9 Larsen & Toubro Ltd.
10 Axis Bank Ltd.
10.62
9.43
8.22
6.83
5.83
5.24
4.65
4.22
3.62
2.99
Top 10 Holdings
NSE & BSE Symbol
Bloomberg Code
Reuters Code
M50
MOSTM50
M50.NS
ISIN Code
Entry Load
Exit Load
INF247L01536
NIL
NIL
Date of inception: 28-Jul-10. = Incase, the start/end date of the concerned period is non business date (NBD), the NAV of the previous date is considered for computation of returns. The NAV per unit shown in the table is as on the start date of the said period. Past performance may or may not be sustained in the future. Performance is for Growth option.= This scheme is currently managed by Mr. Swapnil Mayekar. He has been managing this fund since 26-July-2019. The performances ofthe schemes manage by him are on page no.8.
Catagory
ETF
54.621084.7858112.7233NAV Per Unit (107.7176: as on 30-August 2019) 78.2714
10.85 9.95-2.13 13,621 23,700 9,787 8.40 14,968BSE Sensex TRI (Additional Benchmark)
1.02%

BRSTBRSTBRSTB
BRSTRSTBRST
BRSTBR
BRSTBRSTBRSBRSTBRS
ST
BRSTInvestment Objective
The Scheme seeks investment return that corresponds (before fees and expenses) to the performance of Nifty Midcap 100 Index (Underlying Index), subject to tracking error. However, there can be no assurance or guarantee that the investment objective of the Scheme would be achieved.
Motilal Oswal Midcap 100 ETF (MOFM100)(An open ended scheme replicating/tracking Nifty Midcap 100 Index)
10
Performance (As on 31-August-2019)
1 Year 3 Year Since Inception
CAGR(%)
Current Valueof Investment
of ` 10,000
CAGR (%)
Current Valueof Investment
of ` 10,000
CAGR (%)
Current Valueof Investment
of ` 10,000
0.52 8.77Scheme -20.67 10,157 20,5877,933
5 Year
CAGR (%)
7.08
Current Valueof Investment
of ` 10,000
14,081
9.30 9.82Nifty 50 (Additional Benchmark)
-4.35 13,056 22,343 9,565 8.11 14,766
7.922516.057420.5582NAV Per Unit (16.3098:as on 30-August-2019) 11.5829
1.74 9.65Nifty Midcap 100 TRI (Benchmark)
-20.63 10,530 22,055 7,937 8.26 14,872
Benchmark
Nifty Midcap 100 TRI
Continuous Offer
On NSE/BSE: Investors can buy/sell units of the Scheme in round lot of 1 unit and in multiples thereof.
Directly with the Mutual Fund: Investors can buy/sell units of the Scheme only in creation unit size i.e. 1,25,000 units and in multiples thereafter.
Redemption proceeds
Normally within 3 Business days from acceptance of redemption request.
Date of Allotment
31-Jan-2011
NAV
Growth Option : ̀ 16.3098
Scheme Statistics
Fund Manager
0.41
Tracking Error*
Standard Deviation
0.34% (Annualised)
Sharpe Ratio# -0.29 (Annualised)
Portfolio Turnover RatioBeta 0.96
` 23.03(` cr)Monthly AAUM
Latest AUM (31-Aug-2019) ` 23.08 (` cr)
16.81(Annualised)
*Against the benchmark Nifty Midcap 100 Index. # Risk free returns based on last overnight MIBOR cut-off of 5.45%
(Data as on 31-August-2019)
Mr. Swapnil Mayekar Managing this fund since 26-July-2019 He has 10 years of rich experience.
Industry Allocation
(Data as on 31-August-2019) Industry classification as recommended by AMFI
NSE & BSE Symbol
Bloomberg Code
Reuters Code
M100
MOST100
M100.NS
ISIN Code
Entry Load
Exit Load
INF247L01023
NIL
NIL
Date of inception: 31-Jan-11. = Incase, the start/end date of the concerned period is non business date (NBD), the NAV of the previous date is considered for computation of returns. The NAV per unit shown in the table is as on the start date of the said period. Past performance may or may not be sustained in the future. Performance is for Growth option. = This scheme is currently managed by Mr. Swapnil Mayekar. He has been managing this fund since 26-July-2019. The performances of the schemes manage by him are on page no.7.
Catagory
ETF
(Data as on 31-August-2019)
The Federal Bank Ltd.
Security
Top 10 Holdings
2.73
Weightage%
Voltas Ltd. 2.46
Info Edge (India) Ltd. 2.34
Apollo Hospitals Enterprise Ltd. 2.30
RBL Bank Ltd. 2.25
REC Ltd. 2.22
LIC Housing Finance Ltd. 2.13
Indraprastha Gas Ltd. 1.95
AU Small Finance Bank Ltd. 1.93
Tata Global Beverages Ltd. 1.92
Sr. No.
1
2
3
4
5
6
7
8
9
10
0.62%0.62%
0.69%
0.97%1.13%
1.25%1.25%
1.27%1.62%
1.67%1.70%1.70%1.79%1.98%
2.30%2.58%3.44%3.66%3.81%
4.85%6.86%
7.42%7.58%
7.76%11.24%
17.83%
Ferrous Metals
Media & EntertainmentOil
Petroleum ProductsPesticides
Construction ProjectTextile Products
CementHotels Resorts And Other Recreational Activities
Chemicals
AutoConstruction
Healthcare ServicesRetailing
Industrial ProductsGas
PowerAuto Ancillaries
PharmaceuticalsSoftware
Consumer Non DurablesConsumer Durables
BanksFinance
0.35%Telecom-Equipment & Accessories
Fertilisers
Non - Ferrous Metals
0.33%Services
0.77%
0.95%Cash & Equivalent
Industrial Capital Goods

BRSTBRSTBRSTB
BRSTRSTBRST
BRSTBR
BRSTBRSTBRSBRSTBRS
ST
BRSTInvestment Objective
The Scheme seeks investment return that corresponds (before fees and expenses) generally to the performance of the NASDAQ-100 Index, subject to tracking error. However, there can be no assurance or guarantee that the investment objective of the Scheme would be achieved.
Motilal Oswal Nasdaq 100 ETF (MOFN100)(An open ended scheme replicating/tracking NASDAQ-100 Index)
11
Performance (As on 31-August-2019)
1 Year 3 Year Since Inception
CAGR (%)
Current Valueof Investment
of ` 10,000
CAGR (%)
Current Valueof Investment
of ` 10,000
CAGR(%)
Current Valueof Investment
of ` 10,000
19.21 21.66Scheme 2.10 16,940 52,232 10,210
5 Year
CAGR (%)
17.02
Current Valueof Investment
of ` 10,000
21,943
9.30 9.46Nifty 50 TRI (Additional Benchmark)
-4.35 13,056 21,429 9,565 8.11 14,766
103.2365318.3119528.1279NAV Per Unit (539.2274: as on 30-August-2019) 245.7443
21.28 23.50NASDAQ 100 (INR) TRI (Benchmark)
3.35 17,840 59,269 10,335 18.92 23,782
Benchmark
NASDAQ - 100 TRI
Continuous Offer
On NSE / BSE: Investors can buy/sell units of the Scheme in round lot of 1 unit and in multiples thereof.
Directly with the Mutual Fund: Investors can buy/sell units of the Scheme only in creation unit size i.e. 25,000 units and in multiples thereafter.
Redemption Proceeds
Normally within 3 Business days from acceptance of redemption request.
Date of Allotment
29-Mar-2011
NAV
Growth Option : ̀ 539.2274
Scheme Statistics
Fund Manager
0.03
Tracking Error*
Standard Deviation
0.20% (Annualised)
Sharpe Ratio# 0.88 (Annualised)
Portfolio Turnover RatioBeta 0.97
` 199.55 (` cr)Monthly AAUM
Latest AUM (30-Aug-2019) ` 205.70 (` cr)
15.61 (Annualised)
*Against the benchmark NASDAQ-100 Index. # Risk free returns based on last overnight MIBOR cut-off of 5.45%
(Data as on 31-August-2019).
Mr. Herin VisariaManaging this fund since 26-July-2019He has 10 years of rich experience.
Industry Allocation
(Data as on 31-August-2019) Industry Classification is as per Global Industry Classification Standard (GICS)
(Data as on 31-August-2019)
ScripSr. No. Weightage (%)
1 Microsoft Corp
2 Apple Inc.
3 Amazon Com Inc
4 Facebook Inc
5 Alphabet Inc
Alphabet Inc A6
7 Intel Corp
8 Comcast Corp-Class A
9 Cisco Sys inc com
10 Pepsico Inc
11.46
10.42
9.49
4.88
4.52
3.97
2.56
2.41
2.41
2.31
Top 10 Holdings
NSE & BSE Symbol
Bloomberg Code
Reuters Code
N100
MOSTNDX
N100.NS or N100.BO
ISIN Code
Entry Load
Exit Load
INF247L01031
NIL
NIL
Date of inception: 29-Mar-11. = Incase, the start/end date of the concerned period is non business date (NBD), the NAV of the previous date is considered for computation of returns. The NAV per unit shown in the table is as on the start date of the said period. Past performance may or may not be sustained in the future.Performance is for Growth option. = This scheme is currently managed by Mr. Herin Visaria. He has been managing this fund since 26-July-2019. The performances of the schemes manage by him are on page no. 5.
Catagory
ETF
0.40%
0.44%
0.48%
0.48%
0.96%
1.20%
1.57%
2.13%
2.06%
4.03%
4.33%
6.03%
10.74%
14.09%
14.32%
35.85%
Utilities
Consumer Durables & Apparel
Capital Goods
Automobiles & Components
Telecommunication Services
Commercial & Professional Services
Transportation
Health Care Equipment& Services
Consumer Services
Food & Staples Retailing
Food Beverage & Tobacco
Media
Pharmaceuticals Biotechnology
Semiconductors & Semiconductor
Technology Hardware & Equipment
Retailing
Software & Services
0.09%Cash & Equivalent
0.80%

BRSTBRSTBRSTB
BRSTRSTBRST
BRSTBR
BRSTBRSTBRSBRSTBRS
ST
BRST
12
Assets Under Management
AUM REPORT FOR THE QUARTER ENDED (30/06/2019)Asset class wise disclosure of AUM & AAUM
` in Lakhs
Income
Category AUM as on the last day of the Quarter
Average AUM as on last day of the Quarter
Equity (other than ELSS)
Balanced
Liquid
Gilt
Equity - ELSS
GOLD ETF
Other ETF
Fund of Fund investing overseas
Total
12,942.58
1,767,048.50
0.00
41,392.91
0.00
141,056.54
0.00
22,698.44
0.00
1,985,138.96
14,980.66
1,755,102.21
0.00
37,055.96
0.00
135,957.18
0.00
20,914.57
0.00
1,964,010.58
AUM REPORT FOR THE QUARTER ENDED (30/06/2019) Disclosure of percentage of AUM by geography
Top 5 Cities
Geographical Spread % of Total AUM as on
the last day of the Quarter
Next 10 Cities
Next 20 Cities
Next 75 Cities
Others
Total
70.75
15.97
6.03
4.68
2.24
100
Total Expense Ratio*: Motilal Oswal Focused 25 Fund: Direct Plan- 1.17%, Regular Plan- 2.23%; Motilal Oswal Midcap 30 Fund: Direct Plan- 1.10%, Regular Plan- 2.26%; Motilal Oswal Multicap 35 Fund: Direct Plan- 0.96%, Regular Plan- 1.75%; Motilal Oswal Long Term Equity Fund: Direct Plan- 0.77%, Regular Plan- 2.11%; Motilal Oswal Dynamic Fund: Direct Plan- 1.18%, Regular Plan- 2.16%; Motilal Oswal Equity Hybrid Fund: Direct Plan- 1.18%, Regular Plan- 2.46% Motilal Oswal Ultra Short Term Fund: Direct Plan- 0.08%, Regular Plan- 0.08%; Motilal Oswal Liquid Fund: Direct Plan- 0.21%, Regular Plan- 0.36%; Motilal Oswal Nasdaq 100 Fund of Fund: Direct Plan- 0.10%, Regular Plan- 0.50%; Motilal Oswal M50 ETF 0.15%; Motilal Oswal Midcap 100 ETF 0.20%; Motilal Oswal NASDAQ-100 ETF 0.54%
Disclaimer: The information contained herein should not be altered in any way, transmitted to, copied or distributed, in part or in whole, to any other person or to the media orreproduced in any form, without prior written consent of Motilal Oswal Asset Management Company Limited (MOAMC). Any information herein contained does not constitute andshall be deemed not to constitute an advice, an offer to sell/purchase or as an invitation or solicitation to do so for any securities. MOAMC shall not be liable for any direct or indirectloss arising from the use of any information contained in this document from time to time. Readers shall be fully responsible/liable for any decision taken on the basis of thisdocument. The information/data herein alone is not sufficient and shouldn’t be used for the development or implementation of an investment strategy.
Mutual Fund Investments are subject to market risks, read all scheme related documents carefully.
(Data as on 31-August-2019)*

BRSTBRSTBRSTB
BRSTRSTBRST
BRSTBR
BRSTBRSTBRSBRSTBRS
ST
BRST
13
RR
00
00
4_4
01
12
_01
0
Risk Disclosure and Disclaimer
Statutory Details: Constitution: Motilal Oswal Mutual Fund has been set up as a trust under the Indian Trust Act, 1882. Trustee: Motilal Oswal Trustee Company Ltd. Investment Manager: Motilal Oswal Asset Management Company Ltd. Sponsor: *Motilal Oswal Financial Services Ltd. Risk Factors: (1) All Mutual Funds and securities investments are subject to market risks and there can be no assurance that the Scheme's objectives will be achieved (2) As the price / value / interest rates of the securities in which the Scheme invests fluctuates, the Net Asset Value (NAV) of units issued under the Scheme may go up or down depending upon the factors and forces affecting the securities market (3) Past performance of the Sponsor/AMC/Mutual Fund and its affiliates does not indicate the future performance of the Scheme and may not provide a basis of comparison with other investments (4) The name of the Schemes does not in any manner indicate the quality of the Schemes, its future prospects and returns. Investors are therefore urged to study the terms of offer carefully and consult their Investment Advisor before they invest in the Scheme (5) The Sponsor is not responsible or liable for any loss or shortfall resulting from the operation of the Mutual Fund beyond the initial contribution made by it of an amount of Rs. 1 Lac towards setting up of the Mutual Fund (6) The present Schemes are not guaranteed or assured return Schemes. Mutual Fund investments are subject to market risks, read all scheme related documents carefully.
NSE Indices Limited Disclaimer: MOFM50 and MOFM100: MOFM50 and MOFM100 offered by Motilal Oswal Asset Management Company Limited (MOAMC) or its affiliates is not sponsored, endorsed, sold or promoted by NSE Indices Limited and its affiliates. NSE Indices Limited and its affiliates do not make any representation or warranty, express or implied (including warranties of merchantability or fitness for particular purpose or use) to the owners of MOFM50 and MOFM100 or any member of the public regarding the advisability of investing in securities generally or in the MOFM50 and (MOFM100) linked to Nifty 50 Index and Nifty Midcap 100 Index respectively or particularly in the ability of Nifty 50 Index and Nifty Midcap 100 Index to track general stock market performance in India. Please read the full Disclaimers in relation to the Nifty 50 Index and Nifty Midcap 100 Index in the Scheme Information Document. NASDAQ-100 Disclaimer: MOFN100: NASDAQ®, OMX®, NASDAQ OMX®, NASDAQ-100®, and NASDAQ-100 Index®, are registered trademarks of The NASDAQ OMX Group, Inc. (which with its affiliates is referred to as the “Corporations”) and are licensed for use by MOAMC. MOFN100 (the Product) has not been passed on by the Corporations as to their legality or suitability. The Product are not issued, endorsed, sold, or promoted by the Corporations. THE CORPORATIONS MAKE NO WARRANTIES AND BEAR NO LIABILITY WITH RESPECT TO THE PRODUCT. NSE Disclaimer: It is to be distinctly understood that the permission given by NSE should not in any way be deemed or construed that the Scheme Information Document has been cleared or approved by NSE nor does it certify the correctness or completeness of any of the contents of the Scheme Information Document. BSE Disclaimer: It is to be distinctly understood that the permission given by BSE Ltd. should not in any way be deemed or construed that the SID has been cleared or approved by BSE Ltd. nor does it certify the correctness or completeness of any of the contents of the SID. The investors are advised to refer to the SID for the full text of the Disclaimer Clause of the BSE Ltd.
*Pursuant to the scheme of amalgamation Motilal Oswal Securities Limited (MOSL) has been merged with Motilal Oswal Financial Services Limited (MOFSL) whereby all the assets and liabilities of MOSL including its business and investments have been transferred to MOFSL w.e.f. August 21, 2018.
*Investors should consult their financial advisors if in doubt about whether the product is suitable for them.
Product Suitability
Name of the Scheme This product is suitable for investors who are seeking*
Motilal Oswal Focused 25 Fund (MOF25)
• Return by investing in upto 25 companies with long term sustainable competitive advantage and growth potential
• Investment in Equity and equity related instruments subject to overall limit of 25 companies
Motilal OswalMidcap 30 Fund (MOF30)
• Long-term capital growth• Investment in equity and equity related instruments in a maximum of 30
quality mid-cap companies having long-term competitive advantages and potential for growth
Motilal OswalMulticap 35 Fund (MOF35)
• Long-term capital growth• Investment in a maximum of 35 equity and equity related instruments
across sectors and market capitalization levels
Motilal OswalLong Term Equity Fund(MOFLTE)
• Long-term capital growth• Investment predominantly in equity and equity related instruments;
Motilal Oswal M50 ETF (MOFM50)
• Return that corresponds generally to the performance of the Nifty 50 Index (Underlying Index), subject to tracking error
• Investment in equity securities of Nifty 50 Index
Motilal Oswal Midcap 100 ETF (MOFM100)
• Return that corresponds generally to the performance of the Nifty Midcap 100 Index, subject to tracking error
• Investment in equity securities of Nifty Midcap 100 Index
Low
Modera
tely
Low
High
ModeratelyHigh
Moderate
HighLow
Investors understand that their principal will be at Moderately High risk
Riskometer
Motilal Oswal Ultra Short Term Fund (MOFUSTF)
• Optimal returns consistent with moderate levels of risk • Investment in debt securities and money market securities with
Macaulay duration of the portfolio between 3 months and 6 months.
Low
Modera
tely
Low
High
ModeratelyHigh
Moderate
HighLow
Investors understand that their principal will be at Moderately Low risk
Riskometer
Motilal Oswal Nasdaq 100 ETF (MOFN100)
• Return that corresponds generally to the performance of the Nasdaq-100 Index, subject to tracking error
• Investment in equity securities of NASDAQ-100 Index
Low
Modera
tely
Low
High
ModeratelyHigh
Moderate
HighLow
Investors understand that their principal will be at High risk
Riskometer
Motilal Oswal Dynamic Fund (MOFDYNAMIC)
• Long-term capital appreciation• Investment in equity, derivatives and debt instruments
Motilal Oswal Equity Hybrid Fund (MOFEH)
• Long-term capital appreciation by generating equity linked returns• Investment predominantly in equity and equity related instruments;
Motilal Oswal Nasdaq 100 Fund of Fund (MOFN100FOF)
• Long term capital appreciation• Return that corresponds generally to the performance of the Scheme,
Motilal Oswal Nasdaq 100 ETF (MOFN100) through investment in units of MOFN100
Low
Modera
tely
Low
High
ModeratelyHigh
Moderate
HighLow
Investors understand that their principal will be at Low risk
Riskometer
Motilal Oswal Liquid Fund (MOFLF)
• Regular income over short term • Investment in money market securities

BRSTBRSTBRST
BRSTBRST
BRSTBRST
Sit Tight Approach
BUY RIGHT : SIT TIGHTBuying quality companies and riding their growth cycle
At Motilal Oswal Asset Management Company (MOAMC), our investment philosophy and investing style is centered on 'Buy Right: Sit Tight‘ principle. ‘Buy Right' means buying quality companies at a reasonable price and 'Sit Tight' means staying invested in them for a longer time to realise the full growth potential of the stocks.
‘Q’uality denotes quality of the business and management
‘G’rowth denotes growth in earnings and sustained RoE
‘L’ongevity denotes longevity of the competitive advantage or economic moat of the business
‘P’rice denotes our approach of buying a good business for a fair price rather than buying a fair business for a good price
QGLPBuy and Hold: We are strictly buy and hold investors and believe that picking the right business needs skill and holding onto these businesses to enable our investors to benefit from the entire growth cycle needs even more skill.
Focus: Our portfolios are high conviction portfolios with 25 to 30 stocks being our ideal number. We believe in adequate diversification but over-diversification results in diluting returns for our investors and adding market risk
It is a known fact that good quality companies are in business for decades but views about these companies change every year, every quarter, every month and sometimes every day! While many of you get the first part of identifying good quality stocks, most don’t stay invested for a long enough time. The temptation to book profits at 25% or 50% or even 100% returns in a 1 to 3 year period is so natural that you miss out on the chance of generating substantial wealth that typically happens over the long term; say a 10 year period.
Call: 81086 22222 or 022-4054 8002 Website:www.motilaloswalmf.com