bowers & harris pond - pennichuck...bowers pond was tested for these traces of fallout...
TRANSCRIPT

Bowers & Harris Pond
SEDIMENT ANALYSIS STUDY
August 2013 Prepared for:
Pennichuck Water Works, Inc. 25 Manchester Street
Merrimack, NH 03054
Comprehensive Environmental, Inc. 21 Depot Street Merrimack, NH
225 Cedar Hill Street Marlborough, MA 01752

TABLE OF CONTENTS 1.0 Introduction ........................................................................................................................1
2.0 Data Collection and Field Work .......................................................................................1 2.1 Sediment Core Collection ......................................................................................1 2.2 Sediment Core Analysis .........................................................................................2
3.0 Sediment Load Calculations & Analysis ........................................................................4 3.1 Sediment Observations ..........................................................................................4 3.2 Expected Sediment Load Analysis .......................................................................5 3.3 Sediment Accumulation Using Gamma Spectroscopy .......................................6 3.4 Summary of Findings ............................................................................................7
4.0 Recommendations ..............................................................................................................9
List of Tables
Table 1.0 – Total Watershed Loading Estimates ................................................. End of Section 4.0 List of Figures
Figure 1.0 – Sediment Measurements .................................................................. End of Section 4.0 Figure 2.0 – Bowers Pond Soil Boring Profile .................................................... End of Section 4.0 Figure 3.0 – Harris Pond Soil Boring Profile ...................................................... End of Section 4.0 List of Appendices
Appendix A: Pennichuck Brook Subwatershed Ortho-photo Pennichuck Brook Model Subwatershed Map Appendix B: Pond Sediment Cores Sediment Core Photos Soil Gradation Testing Sediment Core Boring Log Appendix C: Seasonal Sand Usage Total Suspended Solids Loadings
Appendix D: Radiochemical Analysis of a New Hampshire Pond Core (TB-9)
Sediment Core Profile View (AutoCAD)

1
Bowers and Harris Pond Sediment Analysis Study Pennichuck Water Works, Inc.
1.0 Introduction
Bowers Pond and Harris Pond are drinking water reservoirs located in series in southern New Hampshire, straddling the border between the towns of Merrimack and Nashua. These two drinking water reservoirs provide the primary storage volume of a riverine reservoir pond system in series, consisting of Holts Pond, Bowers Pond, and Harris Pond. The drinking water reservoirs were created in the late 1800s as a result of damming portions of Pennichuck Brook and are currently operated by Pennichuck Water Works, Inc. in Merrimack, New Hampshire. The upper Pennichuck Brook watershed is mainly rural in nature, becoming more developed closer to the ponds, with a highly developed corridor consisting of commercial, industrial, and high density residential development running through portions of Amherst, Merrimack and Nashua. A major state highway, the Everett Turnpike, also runs through the lower watershed and intersects Bowers Pond. An ortho-photo of the Pennichuck Brook sub-watershed, revealing the setting of the ponds within the surrounding watershed is presented in Appendix A and is titled “Pennichuck Brook Subwatershed Ortho-photo.” A sediment impact study was completed in November 2012 by Comprehensive Environmental Inc. (CEI) to evaluate sediment accumulation between 2000 and 2010. The results of the investigation showed that sediments measured in 2000 had moved around in the pond system and new sediment accumulations were also evident, including formation of a sediment ‘island’. Recommendations were made to evaluate whether the sediment is accumulating faster than expected, the source of the sediment accumulation and responses needed to reduce and/or prevent sediment accumulation from continuing. This sediment investigation study was initiated to perform the recommended evaluations. This project included the following scope:
1. Estimate expected sediment loadings over time based on land uses, standard sanding factors, algal die-off and stream channel deposition
2. Identification of locations for collection of sediment cores 3. Collect sediment core samples 4. Install sediment sampling gages 5. Report Findings & Accumulation Estimates
The Pennichuck Brook watershed was separated into 21 sub-watershed areas to complete modeling for the Watershed Restoration Plan and to differentiate between areas of interest throughout this sediment study. A subwatershed map titled “Pennichuck Brook Model Subwatershed Map” is provided in Appendix A which details this watershed breakdown. 2.0 Data Collection and Field Work 2.1 Sediment Core Collection CEI subcontracted the company Soil Exploration to perform soil sediment borings from a floating barge at 13 pre-determined locations along Harris and Bowers Pond. Using the 2010 Sediment Depth map prepared by CEI, these locations were chosen near incoming tributaries,

2
Bowers and Harris Pond Sediment Analysis Study Pennichuck Water Works, Inc.
and in existing sediment deltas within multiple sections of both ponds. These locations were selected to represent incoming sediments and those that have accumulated over the long-term based on where sediment deltas have settled. Sediment core samples were retrieved at each of the thirteen locations, at 4-foot depth intervals to a maximum depth of 12 feet. These intervals began at the soil/water interface and terminated when substantial amounts of clay, mud, or solid sand was encountered. Reaching refusal, or when the slide hammer could no longer advance the sample tube into the underlying soils, was assumed to represent the original hardened sediment river bottom prior to the construction of the dams. This assumption is based on the fact that smaller sediments and organic material were located above these sediment layers. The boring process began by using a slide hammer to drive a sampling tube down to a depth of four feet to collect the first core sample. The clear, hollow, plastic sampling tubes have an approximate diameter of 1.5 inches and collected material as they were driven into the underlying soils. Once the sample tube was extracted, a metal casing with an approximate diameter of 3 inches was driven down to the same depth and a device was lowered to wash the inside diameter of the casing out. This was done to widen the borehole for easy entry for the next interval and to ensure that the first four feet of extracted material would not be disturbed by a potential collapse of the surrounding material. This process was repeated for every subsequent soil sample until “native” material or refusal was reached. Refusal was encountered only when hard sediment or other obstruction prevented the slide hammer from advancing the boring deeper into the soil beneath. Once a boring was completed, the metal casings were extracted and an orange marking pole was placed in the borehole to permanently mark its location. The marking poles extend a few inches above the water’s surface so that the exact sampling locations can be easily located in the future in order to annually monitor sediment movement and accumulations. The coordinates for each borehole were also recorded using a handheld GPS unit. A map identifying the borehole locations across Bowers and Harris ponds, titled “Sediment Measurements” is located in Figure 1.0 of this report. Figures 2.0 and 3.0 provide boring profiles and material compositions for the soil encountered during the boring exploration for Bowers and Harris Ponds, respectively. A large scale map detailing these boring profiles is provided at the end of this report. 2.2 Sediment Core Analysis The Core sample compositions were visually inspected and analyzed to determine the probable sources of the soil deposits. The amount of recovery for each 4-foot sampling section varied based on the type of sediment encountered. Soft organic and sandy material, for example, was heavily compressed during the boring process and the resulting core sample often measured far less than four feet in length. This compression was later accounted for during the analysis of the samples. During most of the borings, the sampled material had been compressed to approximately 50% of the total length of the core. A table titled “Pond Sediment Cores,” is located in Appendix B and contains the complete record of the sediment core samples taken from Harris and Bowers Pond including elevations, depths, and locations. Photos depicting each segment of the sediment cores are provided in Appendix A and titled “Sediment Core Photos”.

3
Bowers and Harris Pond Sediment Analysis Study Pennichuck Water Works, Inc.
To expand upon the visual analysis of pond core samples, CEI contacted Dr. Clark Alexander, Professor at Skidaway Institute of Oceanography and Director of Applied Coastal Research Laboratory at Georgia Southern University in Savannah, GA for his expertise in sediment tracing. Dr. Alexander performed a Gamma Spectroscopy analysis on a select pond sediment core, which examines the aging characteristics of the collected material through radionuclide testing. Fallout radionuclides are present in most soils and can be natural and/or anthropogenic, depending on location. They are useful for tracing physical processes, such as soil mixing, erosion, and sedimentation as well as geochemical processes occurring at the earth’s surface on timescales of years to decades 1. Detection of fallout radionuclides is based on their half-life and rate of decay. Gamma spectroscopy is a proven and reliable analytical method to detect and quantify unknown radionuclides in sample media 2. The radionuclides tested for in the select soil samples included Caesium-137, Lead-210, and Beryllium-7. The presence of any of these three radionuclides in soil samples will likely present a “timeline” of when soil was deposited in a particular location over an extended period of time. This analysis is important in determining the rate of sediment buildup in the Pennichuck drinking water reservoirs. Caesium-137 (Cs-137) is the radionuclide that has been most widely used as a sediment tracer. It is a man-made radionuclide, with a half-life of 30.2 years. Cs-137 was produced mainly from atmospheric testing of thermonuclear weapons, which ranged from the mid-1950s to the 1960s. Global fallout of Cs-137 began in 1954, peaked in the early 1960s, and reached near zero levels in the mid-1980s. Nuclear power station accidents, such as the Chernobyl disaster in 1986 have also contributed to Cs-137 fallout. Today, if Cs-137 is detected in a soil sample, it can be used to trace when sediment was deposited based on its concentration and rate of decay. Lead-210 (Pb-210) and Beryllium-7 (Be-7) are both fallout radionuclides of natural origin. Unlike Cs-137, these two radionuclides can be treated as essentially constant over time. Lead-210 has a half-life of 22.2 years and is derived from the decay of gaseous Rn-222. Lead-210 is commonly termed “unsupported” or “excess” Pb-210 when incorporated into soils and sediments, to distinguish it from the Pb-210 produced in situ by the decay of Ra-226. Pb-210 is measureable in soil for roughly 100 years (5 times its half-life). Be-7 has an extremely short half-life of 53 days and is produced by the bombardment of the Earth’s atmosphere by cosmic rays and is subsequently deposited as fallout 3. As with Cs-137 and Pb-210, Be-7 can be used to trace sediment based on its concentration and rate of decay. Prior to laboratory analysis, the entire sediment core was sliced along it’s cross-section into ten, 3-inch long sub-samples at areas of interest along the core to be sent in for analysis. Sub-samples were selected based on changes in material composition and where the highest concentrations of radionuclides might be located. Many factors were taken into consideration in
1 Center for Applied Isotope Studies at the University of Georgia. Center for Applied Isotope Studies, n.d. Web. 1 June 2013. <http://cais.uga.edu/ programs_applications/nuclear_monitoring/gamma_spectroscopy.php>. 2 Dartmouth College Department of Earth Sciences. Dartmouth College, 6 Sept. 2011. Web. 2 June 2013. <http://www.dartmouth.edu/~earthsci/labs/cosmolab.html>. 3 Walling, Des E. "Using Environmental Radionuclides to Trace Sediment Mobilisation and Delivery in River Basins as an Aid to Catchment
Management." Proceedings of the Ninth International Symposium on River Sedimentation. Exeter, UK: Department of Geography, University of Exeter, 2004. 121-35. Print.

4
Bowers and Harris Pond Sediment Analysis Study Pennichuck Water Works, Inc.
determining which core sample should be sent in for analysis. The boring at location (TB-9) in Bowers Pond was tested for these traces of fallout radionuclides due to both its unique composition and location near the Everett Turnpike, which was constructed in 1955. The boring at location TB-9 was a particularly interesting candidate for the radionuclide testing because it was anticipated that large quantities of sand found in the boring sample were a direct result of the construction of the Turnpike. Small, dark bands of material were also visible throughout this particular core, making it unique to most other cores. Lastly, this core sample presented clear transitions between different materials throughout its length. There were other cores located throughout the ponds that had similar composition to this location, so TB-9 was selected as the representative sample. 3.0 Sediment Load Calculations & Analysis Desktop calculations were performed to estimate expected sediment loads from the surrounding watershed and their potential sources, including roadway sanding, surrounding land uses, channel deposition, and algal die-off. The Pennichuck Brook watershed is currently comprised of five towns, which are as follows: Amherst, Hollis, Merrimack, Nashua, and Milford. Each town was asked to provide their best estimates regarding yearly sand usage, as well as the amount of lane miles that the town is responsible for maintaining. It is important to note that the amount of sand used varies annually based on storm frequency and severity. Seasonal state and private road sanding volumes have also been estimated and used to calculate a total volume of sand used in the Pennichuck Brook watershed. Sediment loadings from surrounding land uses and stream bank erosion were also estimated. The surrounding watershed land uses contribute sediment to the water supply reservoirs as stormwater runoff erodes surfaces. During storm events of ranging severities, erosion of stream banks (channel deposition) can also cause sediment to accumulate in the reservoir ponds.
3.1 Sediment Observations The thirteen sediment borings showed a layer of black, organic material was prevalent near the surface of almost every core. This organic material represents decaying plant matter that accumulates each year as lily pads, grass, cyanobacteria, forest debris, and other organic materials die and settle to the bottom of the ponds. This soft, dark material accounted for approximately 1-3 inches of the cores and a relatively small portion of the overall recovered material from the borings taken in Bowers and Harris ponds. Underneath the organic material, however, most of the cores revealed a transition to sand or silty sand. Some of the borings contained sand continuously throughout the sample, whereas others were underlain by larger sediments and finally clay or mud. Dark organic bands were also visible in some of the collected samples, including the boring sample that was tested for radionuclides (TB-9). CEI sent ten soil samples from soil core TB-9, three inches in length, to S.W. Cole Engineering, Inc. for a laboratory gradation analysis. The results of this analysis confirmed that the samples consisted of mostly sand and fines (particles passing the #200 sieve). A table titled “Soil

5
Bowers and Harris Pond Sediment Analysis Study Pennichuck Water Works, Inc.
Gradation Testing” is located in Appendix A and identifies each sample sent in for analysis, followed by the results of the gradation analysis. A series of boring logs titled “Sediment Core Boring Logs” are provided in Appendix A and detail the material composition of each core taken in the ponds. This information was used to generate profile views of the thirteen borings including their compositions and depths using AutoCAD. Profile drawings of the pond cores are detailed in Figures 2.0 and 3.0 and depict a scaled representation of the borings horizontally, as well as vertically across Bowers and Harris ponds respectively. 3.2 Expected Sediment Load Analysis Sediment loads from roadway sanding operations were estimated using sanding rates obtained from town highway/winter operations departments, and using extrapolated sanding application rates for state and private roads. For example, it was assumed that state-owned roads receive less sand than town-owned roads, but are subject to a heavier salt loading. Privately owned roads were assumed to receive more sand than other roads, but are much less numerous than state and town-owned roads. GIS was used to differentiate between and quantify town, state, and private roads. The sand volumes used were divided between the number of lanes and lane miles in each sub-watershed area to determine the volume of sand that would theoretically reach the reservoir ponds. This information was used to determine an estimated volume of sand accumulating each year within each sub-watershed from the combined sanding of town, state, and private roads. A spreadsheet containing a summary of the calculated yearly sand loadings from town, state, and private roads within these 21 sub-watersheds is titled “Seasonal Sand Usage” and is located in Appendix B of this report. A breakdown of the yearly sand usage for town, state, and private roads within each of the 21 sub-watershed areas is included in the spreadsheet.
Land use coefficients and the acreage of land for each land use category were used to determine estimated Total Suspended Solids (TSS) contributions for each sub-watershed area. TSS quantities were relatively small when compared to the calculated sand use volumes per sub-watershed area, but still represent a major contribution to the pond sediment accumulation. TSS results, titled “Total Suspended Solids Loadings” can be found in Appendix B of this report.
Estimates of stream bank erosion loadings were calculated using a “Lateral Erosion Rate” formula (LER=aQ0.6) which accounts for many factors, such as flow, % developed land, curve number, k-factor, animal density, an empirical constant, and average slope of the contributing subwatershed to a specific stream segment. A model, “Equations for estimating bankfull-channel geometry and discharge for streams in the northeastern United States” (Gardner C. Bent, USGS) was used to determine bankfull stream width, depth, cross-sectional area, and discharge for a given subwatershed, which was necessary to determine a volume of erosion for various tributaries in the Pennichuck Brook watershed. Lateral erosion rates were calculated for sub-watershed areas that contained major tributaries in the Pennichuck Brook watershed, namely Witches Brook and Pennichuck Brook. These sub-watersheds were divided up between three monitoring locations (12-PEN, 01-WCH, and 09T-PEN) along Pennichuck Brook, Witches Brook, and through Holts Pond. Using this equation, a total estimated value of stream bank erosion was calculated for each sub-watershed area containing tributaries that flow through the three monitoring locations. Common obstacles that would normally be identified during field

6
Bowers and Harris Pond Sediment Analysis Study Pennichuck Water Works, Inc.
observations such as rocks, culvert pipes, and tree roots were not factors that could be accounted for using this particular formula. Using the USGS bankfull stream bank erosion analysis resulted in an overestimation in the volume of sediment that was being contributed to the ponds. The calculated volume produced approximately 99,400 yd3/yr of stream bank eroded sediment. This loading did not correlate when compared to the calculated combined loading of sand usage and TSS, which is approximately 3,400 yd3/yr. Therefore, a relatively small amount of sediment erodes from stream banks and actually reaches the reservoir ponds on a yearly basis. General observations showed that common obstacles such as culvert pipes, tree roots, and rocks prevent eroded stream bank material from reaching the reservoirs all at once during common storm events. A detailed stream morphology assessment of the contributing streams would be necessary to determine a representative amount of stream bank erosion and resulting annual sediment accumulation to the reservoir ponds. This assessment could provide information regarding the amount of time that it takes for a certain volume of eroded sediment to reach the ponds from various locations along the stream. A summary of roadway sand, stream bank, and land use contributions to the watershed is presented in Table 1.0 in this report and is titled “Total Watershed Loading Estimates.”
3.3 Sediment Accumulation Using Gamma Spectroscopy The Gamma Spectroscopy analysis performed on sediment core TP-9 was used to identify a range of possible accumulation rates based on the length of the core sub-sample and presence of radionuclides. Based on the amount of sediment recovery in this core sample compared to the depth of the boring, a compaction rate of 50% was used for every core sample obtained. Beryllium-7 (Be-7) was not detected in any of the 10 sub-samples. Be-7 has a very short half-life (approximately 53 days) and its absence indicates that there has been little, if any, sediment accumulation to this area of Bowers Pond in the last six months. Caesium-137 (Cs-137) was present above detection limits only in the first core interval, representing the top 6 inches (15.24 centimeters) of sediment in the pond at this location. Since 1954 was the first year Cs-137 was introduced into the atmosphere and 2012 was the year the sample was taken, a conservative accumulation rate of 0.26 cm/yr was calculated (15.24 cm over 58 years). Lead-210 (Pb-210) results indicated that Pb-210 was present above detection limits only in some of the top core intervals, representing roughly 12-33 inches (a maximum of 85 cm) of sediment in the pond at this location. Since Pb-210 decays over a period of approximately 112 years, its decay profile should be captured in the material that was present during the time period of the construction of the dams and reservoir ponds. Using the obtained radiochemical data results for Pb-210, a more conservative accumulation rate of 0.85 cm/yr was calculated (approximately 85 cm over 100 years). Copies of Dr. Alexander’s results and conclusive report can be found in Appendix D of this report.

7
Bowers and Harris Pond Sediment Analysis Study Pennichuck Water Works, Inc.
3.4 Summary of Findings The two sediment accumulation rates produced by the radiochemical analysis may represent the upper and lower limits of a possible range of accumulation rates. Sediment may have accumulated at a faster rate several years ago or been the result of a specific contribution, such as construction of the Everett Turnpike crossing, and then slowed down when construction slowed down. Based on the limited number of samples analyzed, the decay profiles of Cs-137 and Pb-210 could not provide an exact accumulation rate for the particular section (TP-9) in Bowers Pond. However, subsequent comparison of the radiochemical results with the estimated sediment loadings from the watershed does yield useful information. The surface area of each pond was delineated from the 2010 Bathymetry Map and then multiplied by each sediment accumulation rate to obtain a range of yearly sedimentation volumes. According to the radiochemical data and 2010 Bathymetry Map, sediment accumulation rates range from about 1,750 yd3/yr (0.26 cm/yr) to 5,730 yd3/yr (0.85 cm/yr). The estimated watershed sediment loadings determined through land use calculation were about 3,420 yd3/yr. This falls within the range predicted by the Gamma Spectroscopy results, indicating these accumulation estimates are consistent for this pond. Despite this correlation, there are still potential sources of sediment that could contribute to the higher accumulation rate (e.g. stream bank erosion and sediment migration). The sediment core analyzed for radiochemical contents represents the sediment accumulation rate for only one specific area in Bowers Pond at TP-9. Accumulation rates vary from pond to pond due to varying land uses and restrictions (e.g., culverts, dams, wetlands) in each contributing drainage area. Holts Pond is the first receiving water body in the Pennichuck Brook water supply system and has the largest direct contributing area without significant upstream attenuation through pond settling, essentially serving as a detention basin to the downstream ponds. This would suggest that Holts Pond contains the most amount of sediment, followed by Bowers Pond, and finally Harris Pond. To summarize the radiochemical analysis results, Cs-137 was introduced to the atmosphere, mainly during the 1950’s, as a result of thermonuclear weapons testing in the western United States. The resulting radionuclide’s widespread deposit has made it possible to aid in determining the aging characteristics of the underlying soils since the time of its introduction and rate of decay is known. The detection of Cs-137 at a depth of 6 inches results in a lower accumulation rate of 0.26 cm/yr (1,750 yd3/yr) for the ponds over a 50-60 year period. This was determined by detecting and partially capturing the Cs-137 radionuclide’s decay profile during the radiochemical analysis. The resulting accumulation of 1,750 yd3/yr was determined by spreading the 0.26 cm/yr accumulation over the surface area of the bottom of the ponds. Pb-210 is a fallout radionuclide of natural origin and can be treated as essentially constant over time. Like Cs-137, Pb-210’s decay profile can be captured in soils, but can be detected for up to approximately 100 years. The detection of Pb-210 found at a maximum depth of 33 inches results in a higher accumulation rate of 0.85 cm/yr (5,730 yd3/yr) for the ponds over a 100-120 year period. The resulting accumulation of 5,730 yd3/yr was determined by spreading the 0.85 cm/yr accumulation over the surface area of the bottom of the ponds.

8
Bowers and Harris Pond Sediment Analysis Study Pennichuck Water Works, Inc.
The constant accumulation of Pb-210 also helps aid in determining soil aging characteristics since it is detectable in soils for a longer period of time than Cs-137. Since the decay profiles of each radionuclide had not been fully captured during the radiochemical analysis, two different accumulation rates had been calculated, which has been treated as the upper and lower bounds of possible accumulation rates. By comparing the lower (1,750 yd3/yr from Cs-137) and upper (5,730 yd3/yr from Pb-210) annual accumulation rates from the radiochemical analysis to the empirical calculations for land use and roadway maintenance activities; the predicted estimated annual loading rate can be confirmed. The approximate rate of 3,420 yd3/yr falls between the radiochemical accumulation rates and could be used as accurate prediction rate for estimating reservoir storage loss over time. The approximate storage capacity of Bowers and Harris Ponds are 891,146 yd3 and 1,683,277 yd3, respectively. The surface areas of Bowers and Harris Ponds were delineated from the 2010 Bathymetry Map and used to calculate an accumulated sediment volume. Using the lower accumulation rate of 0.26 cm/yr produced by the Cs-137 analysis and extrapolating over 120 years (approximate time period of construction of the dams), an estimated 108,912 yd3 of sediment has accumulated in Bowers Pond. Over this time period, approximately 12% of the original drinking water storage capacity has been filled by sediment. When using the larger accumulation rate of 0.85 cm/yr produced by the Pb-210 analysis over 120 years, an estimated 355,877 yd3 of sediment has accumulated in Bowers Pond. This would account for almost 40% of the original drinking water storage capacity. Using the lower accumulation rate of 0.26 cm/yr produced by the Cs-137 analysis and extrapolating over 120 years for Harris Pond, an approximate sediment volume of 94,396 yd3 has accumulated. This would account for approximately 5.6% of the original storage capacity of the reservoir. Using the larger accumulation rate of 0.85 cm/yr produced by the Pb-210 analysis over 120 years, an estimated 308,447 yd3 of sediment has accumulated in Harris Pond. This volume of sediment would account for approximately 18% of the original storage capacity of Harris Pond. The above calculations assume that the pond volumes and delineated surface area of both ponds using the 2010 Bathymetry Map are representative of the original reservoir pond conditions and that sediment accumulations are distributed evenly across the entire surface area of each pond. This data would suggest that there is a concern regarding the sediment accumulation rates to each pond. Since the construction of the dams, Bowers Pond has lost 12% to 40% of its original drinking water capacity and Harris Pond has lost 5.6% to 18% of its original drinking water capacity. Based on results from the previous sediment study completed in November of 2012, the sediment in Bowers and Harris Ponds has accumulated and migrated to different areas and has not spread evenly over time. It should be noted that the calculated sediment accumulations and storage capacity losses are assuming the accumulation of sediment has been evenly spread over the entire surface area of the pond bottoms, resulting in an average sediment depth through-out the ponds. This assumption could also provide a more conservative estimate of storage loss.

9
Bowers and Harris Pond Sediment Analysis Study Pennichuck Water Works, Inc.
Visual observations were made during the recent soil exploration of sediment deltas and sediment “islands” forming in portions of Bowers Pond that appeared deeper than what was noted in the latest 2010 sediment mapping. Other core locations revealed less accumulation than previously noted in both 2000 and 2010, further confirming movement of sediment from some areas and the addition of sediment in others. Visual inspection of soil cores taken at these locations revealed material compositions that would support these results, however, without radiochemical analysis this cannot be confirmed. It is possible that large portions of the ponds do have deeper sediment depths resulting from higher accumulation rates compared to those analyzed at core location TB-9 and the conservative estimates for loss of storage could be accurate representing an average depth of sediment over the entire reservoir system. As a result of these calculations, it is clear that further analyses need to be conducted to further refine the results. The range of sediment accumulation rates produced by the radiochemical analysis support the calculated accumulation rates produced by roadway maintenance sand usage and general land use TSS loadings over the entire watershed. This is true using data from one pond core sample from a single location. To obtain accurate sediment accumulation rates in each pond, more of the completed borings would need to be analyzed for radionuclides or more shallow cores taken at different locations throughout the reservoir ponds. This will provide useful information specific to each area and will be comparable to the data that has already been obtained. Comparing the compositions of the collected cores is helpful in determining probable accumulation rates relative core TB-9, but further radiochemical analyses would also be needed to accurately present those rates throughout each pond. This would help confirm whether the accumulation results are accurate throughout the ponds, as well as provide additional “time stamps” on the sediment accumulation to determine if pond filling is occurring faster or slower than anticipated. Further analysis may also provide a more detailed sediment accumulation time period and rate rather than assuming the ponds have gradually filled over a 100-120 year period at a consistent rate. It is more likely the sediment accumulation has sped up in more recent years with increased watershed development. Additional time stamp data from radiochemical analysis could confirm this assumption. Likewise, further analysis of stream bank erosion will need to be conducted to determine how much more sediment is contributing to the reservoir ponds from eroding tributaries. Although these estimates were not included in this report, it would be useful to know how much sediment erodes from the stream banks and what portion of that volume reaches the ponds on an annual basis. This resulting amount could provide clarification that the accumulation rate and loss of storage is closer to the upper end that was predicted from the radiochemical analysis, rather than be near the average of the two. The stream bank erosion and resulting sediment loading could make up the difference between the land use loading predictions and the storage loss due to the higher accumulation rate of 0.85 cm/yr. 4.0 Recommendations
To develop a more accurate representation of the actual sediment accumulation rate it is recommended that borings of up to 3 feet in length be taken, preferably by hand, in “ponded” locations in each reservoir. It is now known that the detectable radionuclide concentrations

10
Bowers and Harris Pond Sediment Analysis Study Pennichuck Water Works, Inc.
reside within approximately 1 to 2 feet of the existing surface material and taking sediment samples by hand would provide a more representative sample of in situ conditions. By collecting samples in this manner, it is likely that a more accurate decay profile will be captured, giving much more insight as to what the actual accumulation rates may be. Obtaining sediment accumulation rates in area(s) of each reservoir will not only reveal contributing sediment quantities from directly contributing watershed areas, but will also help determine how much sediment is passing over each dam. The cores that were sampled as part of this study could also be submitted for radiochemical analysis; however the half-lives of some of the radionuclides that could provide a more current detailed time stamp may not be detectable in the older samples. This will also provide a starting point for known accumulation sediment locations and depths to be further monitored through the sediment accumulation monitoring at each of the permanent boring location. It is also recommended that secchi disk and echo-sounding procedures be conducted at each of the permanent boring locations once a year and once every 5 years, respectively, to closely monitor sediment accumulations. These recommended procedures were provided in the November 2012 sediment study completed by CEI. Water clarity can easily be recorded by using a secchi disk and the Acoustic Echo-sounding Method is a reliable technique frequently used to determine water depth. The Acoustic Echo-sounding Method should be used to measure sediment depth at each of the permanent boring locations to record sediment movement and accumulations. This is done by first determining a fixed reference point, such as a spillway elevation. The current water level and its difference to the fixed reference point should be measured and recorded. Permanent staff gauges should be installed at each spillway to record the water level prior to performing echo sounding procedures. At each permanent measurement point location, a secchi disk reading and depth to sediment (or pond bottom) should be obtained from the sonar unit and recorded in the logs that were provided in the November 2012 sediment study. Once this has been completed, the data should be inputted for processing by GIS to develop an elevation model. This will provide an annual comparison to determine the difference in sediment depths over time. By consistently measuring water clarity and depth, sediment migrating into the ponds and resulting accumulation rates can be continually monitored. To further expand on the sediment accumulation mapping, GPS units with sonar capabilities can be used to measure pond depths and tied into the permanent boring locations as bench marks to cross reference and check newly acquired data points. Point by point depths using the sonar and GPS unit attached to an electrically powered boat could be obtained and used to take spatially accurate GPS points with invert elevations of the pond bottoms to create accurate bathymetric maps of the migrating sediment. Sampling could be done in a grid fine enough to yield a map of resolution similar to the baseline information, but could be updated on an annual basis to track sediment accumulation in some areas and sediment migration throughout the reservoir system. This process would be far less time consuming and cost effective compared to the transect

11
Bowers and Harris Pond Sediment Analysis Study Pennichuck Water Works, Inc.
methods previously used. Measurements could also be more accurately cross referenced using newly acquired baseline information. This data could not only be used to track accumulation over time, but also identify locations where sediment accumulation is the greatest, providing a prioritized map of locations that could be permitted and developed as permanent dredging locations for routine maintenance as sediment settles in the area.

Area State Town Private Totals State Town Private Totals
(acres) (yd3/yr) (yd3/yr) (yd3/yr) (yd3/yr) (yd3/yr) (tons/yr) (tons/yr) (tons/yr) (tons/yr) (tons/yr)3 662 39.2 31.4 14.7 85.3 5464.4 52.9 42.4 19.8 115.1 7377.04 233 9.2 4.9 6.0 20.1 3351.2 12.4 6.6 8.1 27.1 4524.15 19 0.9 0.5 0.0 1.4 70.1 1.2 0.6 0.0 1.8 94.66 1406 30.8 76.3 72.6 179.7 29527.1 41.6 103.0 98.0 242.6 39861.67 461 10.0 15.0 15.8 40.8 885.7 13.5 20.2 21.3 55.1 1195.78 1088 2.0 36.5 73.0 111.5 5115.3 2.7 49.3 98.6 150.5 6905.69 960 20.2 177.6 17.7 215.5 20323.2 27.3 239.7 23.9 290.9 27436.310 491 0.0 82.9 0.7 83.6 2992.4 0.0 111.9 0.9 112.9 4039.811 665 0.0 173.7 1.7 175.4 1414.6 0.0 234.4 2.3 236.7 1909.712 939 0.0 114.3 7.4 121.7 1342.8 0.0 154.3 10.0 164.3 1812.813 1768 0.0 304.9 3.0 307.9 4086.0 0.0 411.6 4.1 415.7 5516.114 1338 17.0 219.0 4.8 240.8 1037.9 23.0 295.7 6.5 325.1 1401.215 26 0.0 4.0 1.3 5.3 251.8 0.0 5.4 1.8 7.2 339.916 34 0.0 0.0 0.0 0.0 2034.6 0.0 0.0 0.0 0.0 2746.717 1373 22.4 384.4 5.4 412.2 4854.9 30.2 519.0 7.2 556.4 6554.218 951 23.1 185.9 11.4 220.4 7604.3 31.2 251.0 15.4 297.6 10265.819 337 0.0 82.0 1.3 83.3 1017.6 0.0 110.6 1.8 112.4 1373.720 686 12.9 51.3 12.5 76.7 2501.6 17.4 69.3 16.9 103.5 3377.121 105 0.5 14.6 0.0 15.1 2233.8 0.7 19.8 0.0 20.4 3015.722 1326 12.8 170.0 3.2 186.0 2324.8 17.3 229.5 4.3 251.1 3138.523 1686 7.2 318.5 6.9 332.6 3968.8 9.7 430.0 9.3 449.1 5357.924 741 0.7 60.4 3.2 64.2 437.2 0.9 81.5 4.3 86.7 590.3
Totals 2,979.45 cy / yr Totals 4,022.26 ton / yrTotal Roadway & Land Use Loadings cy / yr Total Roadway & Land Use Loadings ton / yr
Total of All Loadings cy / yr Total of All Loadings ton / yr
62.827087.3 58.2
5946.6 51.1
4878.9 30.0
0.42745.0 1.7
Table 1: Total Watershed Loading Estimates
487.1 16.4
3237.1 36.42986.6 8.72865.4 22.0
68.6 0.129292.7 54.8810.1
1662.0 11.01635.1 13.4
6692.243.1
2898.8 10.0
5071.8 28.6
9919.2 49.11250.8 10.5
Totals
2397.9 27.02212.3 6.42122.5 16.3
4404.9 37.97347.6 36.3926.5 7.8
786.0 11.1246.1 0.32033.3 1.3
1231.1 8.2
1061.1 14.9332.3
Sub‐Watershed(yd3/yr) (yd3/yr)
34.8
Land Use Loading
(tons/yr) (tons/yr)5359.5 19.73315.9 15.3
7235.3 26.64476.4
Streambank Loading Land Use LoadingRoadway Loading
Streambank Loading
20.692.7 0.1
39545.1 73.9
Total Loading
99,418.52 442.23 3,421.68
102,840.21
134,215.01 597.01 4,619.27
138,834.28
Roadway Loading
360.8 12.2
3913.4 13.5
1093.7 47.0
3614.0 22.2
1211.2 10.03756.9 21.2
4957.2 46.520064.6

!(
!( !(
!(
!(
!(
!(
!( !(
!(!(
!(
!(
HoltsPond
HarrisPond
Supply Pond
Pennichuck Brook
FE EVERETT TPK
TINKER ROAD
MANCHESTER STREET
TINKER ROAD
THORNTON ROAD
STUART DRIVE
AMHERST STREET
THORNTON ROAD
DANIEL WEBSTER HW
Y
BowersPond
BowersPond
HarrisPond
Bowers PondDam
Harris PondDamTB-2
TB-1
TB-3TB-4
TB-5
TB-6
TB-7
TB-8
TB-9
TB-11
TB-10
TB-12
TB-13
40 500 1,000 1,500 2,000
Feet
Pennichuck Water Supply
SedimentMeasurements
!( Sediment Core Location
Legend
Figure 1:

TOP OF BARGE DECK BOREHOLE LOCATION (TYP.) WATER LEVEL
0'
Bit f13
1~5" L--~1~~u~~~~==============~::::::::::::::::~====~~======c:::::::~~:::c:::::::~~==j=======~~~,--~ 1n.s·
1~5" ~--------4------~------·------~-------------~------+·------~--------+----:--------~----;---------+----~
1~5" ~--------4------~------·------~-------------~------+·------~--------+----:--------~----;---------+----~
1~5" ~--------4------~------·------~-------------~------+·------:--------+----:--------~----'---------+----~
1nS" ~--------4------~------·------~-------------~------+·------~--------+----:--------~----;---------+----~
1nS" ~--------4------~------·------~-------------~------+·------~--------+----:--------~----;---------+----~ 171.U
171.5" 1---------
170.5" 1---------
1111.5" ~-------
11111.5" ~-------
117.83' 117.5" 1---------
11111.5" 1---------
115.5" ~-------
1114.5" ~-------
111U 1113.5" 1---------
112.5" 1---------
111.5" ~-------
1110.5" ~-------
11511.83'
1~5" ~---------------~------·-------~------------~-------·------~-------------:--------------:--------------~
1-5" ~---------------~------·-------~------------~-------·------~-------------:--------------:--------------~
147.5" ~---------------:-------·-------:--------------:-------·-------:-------------:--------------:·--------------~
1-5" ~---------------~------·-------~------------~-------·------:-------------:--------------'--------------~
1~5" ~---------------~------·-------~------------~-------·------~-------------:--------------:--------------~
1~5" L-------------------------------------------------------------------------·--------------·--------------~ HORIZONTAL SCALE - 1"
0 1000
SCALE
= 1000'
2000
FEET
VERTICAL SCALE - 1" = 4'
BOWERS POND ELEVA TION=177.5'
FIGURE 2.0 BOWERS POND
SOIL BORING PROFILES

OF BARGE DECK BOREHOLE LOCATION (TYP.) WATER LEVEL
11000" 10000" 1111100" 12000" 1JOOO"
Bltfll Bltf2 Bltf1
1----+----:----+--·:--+----·:------·:--+----·-t----+--:-------l 118.0"
1----+---·:----+--·:--+----·:------·:--+----·-t----+--:-------liii!.O"
t----+---·:----+--·:--+----·:------·:--+----·-t----+--:-------1114.0"
l-----+---'----+--·~--+----·------·---+----·-t-----+-·-------1113.0"
l----+----:----+--·:--+----·:------·:--+----·-t----+--:-------112.0"
l----+---·:----+--·:--+----·:------·:--+----·-t----+--:-------111.0"
t----+---·:----+--·:--+----·:------·:--+----·-t----+--:-------110.0"
l-----+---'----+--·~--+----·------·---+----·-t-----+-·-------171.0"
l----+----:----+--·:--+----·:------·:--+----·-t----+-·:-------17&0"
l----+---·:----+--·:--+----·:------·:--+----·-t----+-·:-------177.0"
t----+---·:----+--·:--+----·:------·:--+----·-t----+--:-------178.0"
l-----+---'----+--·~--+----·------·---+----·-t-----+-·-------175.0"
74.33"
70.33"
f-·-------1 87.0"
----------1118.0"
---------1111!.0"
---------1114.0"
---------1 UO"
---------112.0"
---------181.0"
---------1110.0"
l----------------~------·------·---f ... ---·~------·-------1511.0"
1-------:------·:------·:------·----l-""'""'l---·:------·:-------liiii.O"
---·:------·:-------157.0"
---·:------·:-------158.0"
HORIZONTAL SCALE - 1" = 1000'
2000 VERTICAL SCALE - 1" = 4'
HARRIS POND ELEVA TION=90.5'
FIGURE 3.0 HARRIS POND 0 1000
SCALE FEET SOIL BORING PROFILES

Appendix A

N W.E ~ ~~
Legend
c:J Subw atershed Boundaries
[=] Town Boundaries
0 3,500 7,000
Feet
Pennichuck Brook Subwatershed Orthop hoto
Pennichuck Brook Watershed Southern New Hampshire
Source: GR.ANIT. NRPC GIS
PENN ICH U CK L:.;J ' II LJ H
Comprehensive Environmental Incorporated

I I
• I
• • • I
I I
I
II
I
N W. E s
Milford
. \ \ \ \ ,_.,-· \ \ \ \ \ \ \ \ i. \ \ \ \ . \ \ \ \ \
·-·, .<! ·., .;•• i ,_ ..
\ \
SUB· 22 t .,. .. .. , .. ,-·""~·
~· ..... ..-··""'·· ,:
Hollis
Amherst Merrimack
SUB- 12.•.,.."\ .,.,.. .. --·· \
?.. \.~.,
. ~\ \
i i . i i i i ! !
\ i I I
i
\ \ ..
\ SUB·6
Nashua
Legend D Subwatershed Boundaries
c===J Lakes, Ponds
/"._/ Streams, Brooks ·------.... ! i Town Boundaries ·-··--·-~
0 3,500 ----I j i \ '\\
~.\.
··"-
7,000
Feet
\ .. . ' t, •• .. ' ~ ··,.--··-··-··-··-··-··-··-,. ·\,.
.,.· . ,,·· '·
\ ~~· \ '···"" . \ ! i i j ; I i \ \ , .. ,
' ··, ··, ··, ..
'·
Pennichuck Brook Model Subwatershed Map
Pennichuck Brook Watershed Southern New Hampshire
Source: GRANIT. NRPC GIS
'
PENNI CHUCK
~ Comprehensive Environmental Incorporated

Appendix B

Soil Borings completed by: Brian and Rich (Soil Exploration, Leominster, MA)
Location Point # Sample # Date Time
H2O Depth to Top of
DeckDeck
HeightH2O
Depth
Local Datum Water
Elevation
Boring Depth Interval
(top of deck)Elevation
(top of deck)
Sample Recovery
(in)2 1 Harris TB2 T 2 - 1 10/3/2012 1:30 PM 20' 1" 16" 18' 9" 87.0 20'-24' 20 24 88.33 68.33 - 64.33 15.002 2 Harris TB2 B 2 - 2 2:30 PM 87.0 24'-28' 24 28 88.33 64.33 - 60.33 26.251 1 Harris TB1 T 1 - 1 10/4/2012 8:30 AM 20' 10" 16" 19' 6" 87.0 21'-25' 21 25 88.33 67.33 - 63.33 15.001 2 Harris TB1 B 1 - 2 9:15 AM 87.0 25'-29' 25 29 88.33 63.33 - 59.33 27.753 1 Harris TB3 T 3 - 1 10/4/2012 2:00 PM 22' 0" 16" 20' 8" 87.0 22'-26' 22 26 88.33 66.33 - 62.33 8.253 2 Harris TB3 M 3 - 2 2:30 PM 87.0 26'-30' 26 30 88.33 62.33 - 58.33 12.003 3 Harris TB3 B 3 - 3 3:00 PM 87.0 30'-34' 30 34 88.33 58.33 - 54.33 8.254 1 Harris TB4 T 4 - 1 10/5/2012 8:00 AM 18' 0" 16" 16' 8" 87.0 18'-22' 18 22 88.33 70.33 - 66.33 7.754 2 Harris TB4 B 4 - 2 8:30 AM 87.0 22'-26' 22 26 88.33 66.33 - 62.33 17.255 1 Harris TB5 T 5 - 1 10/5/2012 10:30 AM 17' 0" 16" 15' 8" 87.0 17'-21' 17 21 88.33 71.33 - 67.33 16.255 2 Harris TB5 B 5 - 2 11:00 AM 87.0 21'-25' 21 25 88.33 67.33 - 63.33 27.256 1 Harris TB6 T 6 - 1 10/5/2012 12:30 PM 14' 0" 16" 12' 8" 87.0 14'-18' 14 18 88.33 74.33 - 70.33 16.256 2 Harris TB6 B 6 - 2 1:30 PM 87.0 18'-22' 18 22 88.33 70.33 - 66.33 6.257 1 Bowers TB7 T 7 - 1 10/9/2012 10:00 AM 14' 0" 16" 12' 8" 177.5 14'-18' 14 18 178.83 164.83 - 160.83 7.007 2 - 10:30 AM 177.5 18'-18' 6" 18 18.5 178.83 160.83 - 160.33 No Sample8 1 Bowers TB8 T 8 - 1 10/9/2012 11:45 AM 20' 0" 16" 18' 8" 177.5 20'-24' 20 24 178.83 158.83 - 154.83 21.258 2 Bowers TB8 B 8 - 2 12:35 PM 177.5 24'-28' 24 28 178.83 154.83 - 150.83 24.509 1 Bowers TB9 T 9 - 1 10/9/2012 2:00 PM 15' 0" 16" 13' 8" 177.5 15'-19' 15 19 178.83 163.83 - 159.83 24.759 2 Bowers TB9 M 9 - 2 2:20 PM 177.5 19'-23' 19 23 178.83 159.83 - 155.83 26.009 3 Bowers TB9 B 9 - 3 2:40 PM 177.5 23'-27' 23 27 178.83 155.83 - 151.83 25.50
10 1 Bowers TB10 T 10 - 1 10/9/2012 3:15 PM 15' 0" 16" 13' 8" 177.5 15'-19' 15 19 178.83 163.83 - 159.83 15.5010 2 Bowers TB10 B 10 - 2 3:45 PM 177.5 19'-23' 19 23 178.83 159.83 - 155.83 14.0011 1 Bowers TB11 T 11 - 1 10/10/2012 8:15 AM 14' 0" 16" 12' 8" 177.5 14'-18' 14 18 178.83 164.83 - 160.83 24.7511 2 Bowers TB11 M 11 - 2 8:30 AM 177.5 18'-22' 18 22 178.83 160.83 - 156.83 13.0011 3 Bowers TB11 B 11 - 3 9:00 AM 177.5 22'-26' 22 26 178.83 156.83 - 152.83 14.7512 1 Bowers TB12 T 12 - 1 10/10/2012 9:50 AM 10' 0" 16" 8' 8" 177.5 10'-14' 10 14 178.83 168.83 - 164.83 17.7512 2 Bowers TB12 B 12 - 2 10:30 AM 177.5 14'-18' 14 18 178.83 164.83 - 160.83 29.5013 1 Bowers TB13 T 13 - 1 10/10/2012 11:05 AM 7' 0" 16" 5' 8" 177.5 7'-11' 7 11 178.83 171.83 - 167.83 18.5013 2 Bowers TB13 M 13 - 2 11:30 AM 177.5 11'-15' 11 15 178.83 167.83 - 163.83 18.2513 3 Bowers TB13 B 13 - 3 12:00 PM 177.5 15'-19' 15 19 178.83 163.83 - 159.83 25.75
Pond Sediment Cores (Soil Exploration)
Harris Pond (elev.=87')
Bowers Pond (elev.=177.5')
Calculated Sample ElevationsPhoto ID Lab ID

Soil Borings completed by: Brian and Rich (Soil Exploration, Leominster, MA)
Description
USGS Assumed
Water elevation
Boring Depth
Interval (top of deck)
Elevation (top of deck)
sand/minimal organic material Harris TB2 T 2 - 1 168.0 20'-24' 20 24 169.33 149.33 - 145.33solid sand Harris TB2 B 2 - 2 168.0 24'-28' 24 28 169.33 145.33 - 141.33sand/minimal organic material-not many leaves; all pine Harris TB1 T 1 - 1 168.0 21'-25' 21 25 169.33 148.33 - 144.33very solid sand/minimum organic material Harris TB1 B 1 - 2 168.0 25'-29' 25 29 169.33 144.33 - 140.33soft/some organics to hard sediment Harris TB3 T 3 - 1 168.0 22'-26' 22 26 169.33 147.33 - 143.33slight organic material (soft) to sediment (hard) Harris TB3 M 3 - 2 168.0 26'-30' 26 30 169.33 143.33 - 139.33very solid sediment to silt Harris TB3 B 3 - 3 168.0 30'-34' 30 34 169.33 139.33 - 135.33Little silt; sandy; soft(organic sand) Harris TB4 T 4 - 1 168.0 18'-22' 18 22 169.33 151.33 - 147.33some sediment to sand; minimal organic material Harris TB4 B 4 - 2 168.0 22'-26' 22 26 169.33 147.33 - 143.33organic material to sand Harris TB5 T 5 - 1 168.0 17'-21' 17 21 169.33 152.33 - 148.33good sand/some organic bands Harris TB5 B 5 - 2 168.0 21'-25' 21 25 169.33 148.33 - 144.33organic/dark brown sand Harris TB6 T 6 - 1 168.0 14'-18' 14 18 169.33 155.33 - 151.33sandy gravel (hard); river bottom cobble Harris TB6 B 6 - 2 168.0 18'-22' 18 22 169.33 151.33 - 147.33light silt to solid sand Bowers TB7 T 7 - 1 177.5 14'-18' 14 18 178.83 164.83 - 160.83Refusal at 18' 6"-river bottom - 177.5 18'-18' 6" 18 18.5 178.83 160.83 - 160.33soft silt into soft sand Bowers TB8 T 8 - 1 177.5 20'-24' 20 24 178.83 158.83 - 154.83soft dark silt to grey silt Bowers TB8 B 8 - 2 177.5 24'-28' 24 28 178.83 154.83 - 150.83soft/dark silt to sand (soft) Bowers TB9 T 9 - 1 177.5 15'-19' 15 19 178.83 163.83 - 159.83sand into soft silt/some organic bands Bowers TB9 M 9 - 2 177.5 19'-23' 19 23 178.83 159.83 - 155.83soft silt to gravel (hard) at 26' Bowers TB9 B 9 - 3 177.5 23'-27' 23 27 178.83 155.83 - 151.83soft organic material to sand (soft) Bowers TB10 T 10 - 1 177.5 15'-19' 15 19 178.83 163.83 - 159.83gravel to silty sand Bowers TB10 B 10 - 2 177.5 19'-23' 19 23 178.83 159.83 - 155.83soft organic material to sand (soft) Bowers TB11 T 11 - 1 177.5 14'-18' 14 18 178.83 164.83 - 160.83silty sand to sand (soft) Bowers TB11 M 11 - 2 177.5 18'-22' 18 22 178.83 160.83 - 156.83sand (soft) Bowers TB11 B 11 - 3 177.5 22'-26' 22 26 178.83 156.83 - 152.83soft/dark organic material to sand (soft) Bowers TB12 T 12 - 1 177.5 10'-14' 10 14 178.83 168.83 - 164.83sand (soft) Bowers TB12 B 12 - 2 177.5 14'-18' 14 18 178.83 164.83 - 160.83soft/dark silt to sand (soft) Bowers TB13 T 13 - 1 177.5 7'-11' 7 11 178.83 171.83 - 167.83soft sand with organic bands Bowers TB13 M 13 - 2 177.5 11'-15' 11 15 178.83 167.83 - 163.83sand (soft) Bowers TB13 B 13 - 3 177.5 15'-19' 15 19 178.83 163.83 - 159.83
Calculated Sample ElevationsPhoto ID Lab ID
Pond Sediment Cores (Soil Exploration)

Sediment Core Photos:
Harris Pond Core Samples
TP 1-1 TP 1-2
TP 2-1 TP 2-2

Harris Pond Core Samples:
TP 3-1 TP 3-2
TP 3-3

Harris Pond Core Samples:
TP 4-1 TP 4-2
TP 5-1 TP 5-2

Harris Pond Core Samples:
Bowers Pond Core Samples:
TP 6-1 TP 6-2
TP 7-1

Bowers Pond Core Samples:
TP 8-1 TP 8-2
TP 9-2 TP 9-1

Bowers Pond Core Samples:
TP 9-3
TP 10-2
TP 10-1

Bowers Pond Core Samples:
TP 11-1
TP 11-3
TP 11-2

Bowers Pond Core Samples:
TP 12-1 TP 12-2
TP 13-1 TP 13-2
TP 13-3

Sample ID Location LengthSample 1 S1 1-2 2.25"Sample 2 S2 2-3 2.75"Sample 3 S3 3-4 3.00"Sample 4 S4 4-5 4.50"Sample 5 S5 5-6 2.75"Sample 6 S6 6-7 3.25"Sample 7 S7 7-8 2.50"Sample 8 S8 8-9 2.50"Sample 9 S9 9-10 3.00"
Sample 10 S10 10-end 3.50"
** Location: Samples sent for gradation were taken between the samples sent in forGamma Spectroscopy Analysis
Soil Gradation Testing

Project Name Merrimack NH- Pennichuck Source Testing
Project Number 13-0019
Client Comprehensive Environmental, Inc,
Comprehensive Environmental, Inc, William Devore 21 Depot Street Merrimack, NH 03054
Results Being Reported
GRAIN SIZE (WET SIEVE}- ASTM C117, C136/AASHTO T11, T27
Copy To
Notes:
LETTER OF TRANSMITTAL
Project Manager Scott Harmon
Date 1/9/2013
Phone 603-424-8444
S. W. C~~~~~~RING, INC.
BY: (f/1 1/L____-
150 Zachary Road, Suite 6, Manchester, NH 03109-5614 • Tel (603) 716-2111 • Fax (603) 716-2112 • www.swcole.com

Project Name MERRIMACK NH - PENNICHUCK SOURCE TESTING
Client COMPREHENSIVE ENVIRONMENTAL, INC,
Material Source S-1
STANDARD DESIGNATION !mm/uml
SIEVE SIZE
4.75 mm No.4 2.00 mm No. 10 850um No. 20 425um No. 40 250um No. 60 150 urn No.100 75um No. 200
SANDY SILT
3" 2" 1" 1/2" 1/4" #1 0 #20 #40 #1 00 #200
100%
90%
80%
z 70% (i)
~ 60%
1-z 50% :::> 0 ::2 <X: 40%
30%
20%
10%
0% 100.0000 10.0000 1.0000 0.1000
SIEVE SIZE- nm
Comments:
Report of Gradation ASTM C-117 & C-136
Project Number 13-0019
Lab ID 108M
Date Received 1/8/2013
Date Completed 1/9/2013
Tested By CHRISTOPHER WILDES
AMOUNT PASSING f%1
100 0% Gravel 100 100 97 37.4% Sand 92 82
62.6 62.6% Fines
0.0100 0.0010
Sheet

Project Name MERRIMACK NH - PENNICHUCK SOURCE TESTING
Client COMPREHENSIVE ENVIRONMENTAL, INC,
Material Source 5·2
3" 2" 1"
100%
90%
80%
z 70% ii5 en
60% ct ...... z 50% ::> 0
~ 40%
30%
20%
10%
0%
100.0000
Comments:
1/2"
STANDARD DESIGNATION !mm/uml
1/4"
4.75 rnm 2.00 rnm 850 urn 425urn 250 urn 150 urn 75urn
#10 #20
SIEVE SIZE
No.4 No. 10 No.20 No. 40 No. 60
No. 100 No. 200
SANDY SILT
#40 #100 #200
10.0000 1.0000 0.1000
SIEVESIZE- rrrn
Report of Gradation A STM C-117 & C-136
Project Number 13-001 9
Lab ID 109M
Date Received 1/8/2013
Date Completed 1/9/201 3
Tested By CHRISTOPHER WILDES
AMOUNT PASSING (% )
100 0% Gravel 100 99 98 45.9% Sand 93 78
54.1 54.1% Fines
0.0100 0.0010
Sheet

Project Name MERRIMACK NH - PENNICHUCK SOURCE TESTING
Client COMPREHENSIVE ENVIRONMENTAL, INC,
Material Source S-3
STANDARD DESIGNATION (mm/uml
4.75 rnrn 2 .00 rnrn 850 urn 425 urn 250 urn 150 urn 75 urn
SIEVE SIZE
No.4 No.10 No. 20 No. 40 No. 60 No.100 No. 200
Report of Gradation ASTM C-117 & C.136
Project Number 13-0019
Lab ID 110M
Date Received 1/8/2013
Date Completed 1/9/2013
Tested By CHRISTOPHER WILDES
AMOUNT PASSING (%)
100 0% Gravel ·99 98 92 94.5% Sand 56 20 5.5 5.5% Fines
MEDIUM TO FINE SAND .
3" 2" 1" 1/2" 1/4"
90%
80%
z 70% Ci3 ~ 60% I-~ 50% 0 ~ 40%
30%
20%
10%
0% 100.0000
Comments:
10.0000
#10 #20 #40 #100 #200
1.0000 0.1000 0.0100 0.0010
SIEVESIZE-rrm
Sheet

Project Name MERRIMACK NH ~ PENNI CHUCK SOURCE TESTING
Client COMPREHENSIVE ENVIRONMENTAL, INC,
Material Source 5·4
STANDARD SIEVE SIZE DESIGNATION (mm/uml
4.75 mrn No.4 2.00 rnrn No.10 850urn No.20 425 urn No.40 250 urn No. 60 150 urn No. 100 75urn No.200
Report of Gradation ASTM C-117 & C-136
Project Number 13-0019
Lab ID 111M
Date Received 1/8/2013
Date Completed 1/9/2013
Tested By CHRISTOPHER WILDES
AMOUNT PASSING !%}
100 0% Gravel 100 100 95 98.1% Sand 45 8
1.9 1.9% Fines
FINE MEDIUM SAND
3" 2" 1" 1/2" 1/4" #10 #20 #40 #100 #200
100%
90%
80%
z 70% (i.i (/)
ct 60%
1-z 50% :::> 0 ::!! 40% <
30%
20%
10%
0% 100.0000 10.0000 1.0000 0.1000 0.0100 0.0010
SIEVESIZE~I11ll
Comments: Sheet
Project Name MERRIMACK NH- PENNICHUCK SOURCE TESTING
Client COMPREHENSIVE ENVIRONMENTAL, INC,
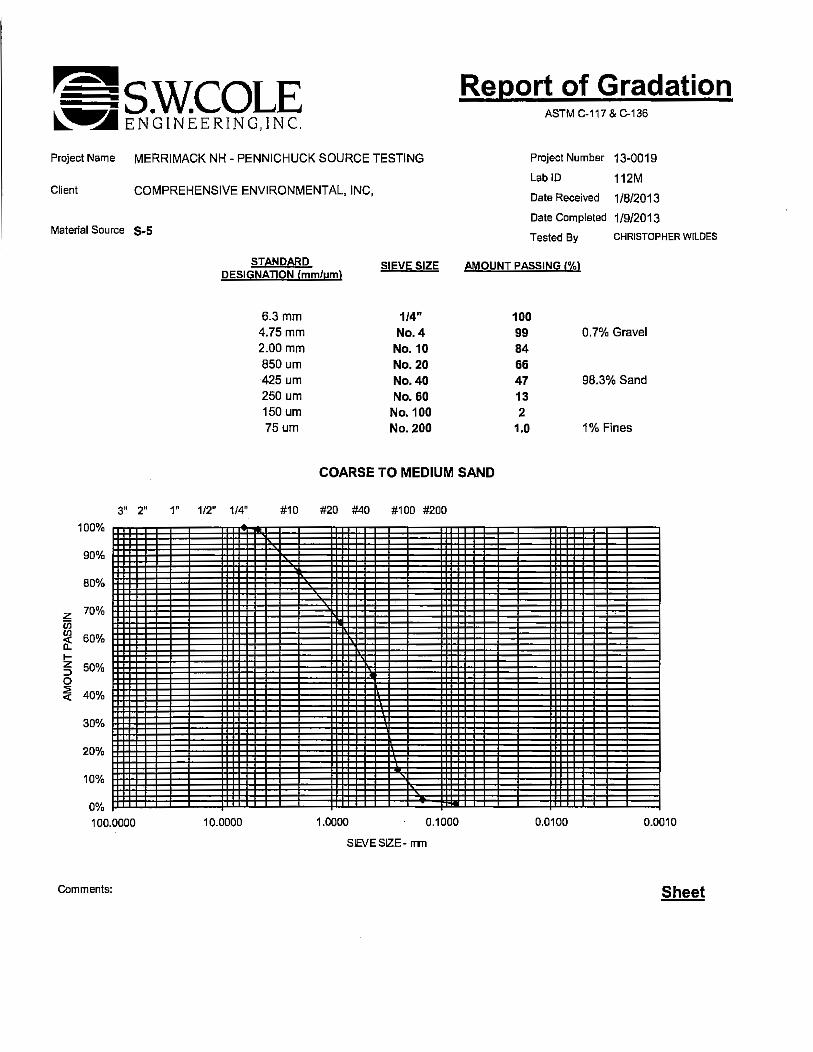
Material Source S-5
STANDARD DESIGNATION (mm/uml
6.3rnm 4.75 rnrn 2.00 rnrn 850urn 425urn 250 urn 150 urn 75um
SIEVE SIZE
1/4" No.4 No. 10 No.20 No.40 No. 60
No.100 No. 200
Report of Gradation ASTM C-117 & C-136
Project Number 13-0019
Lab ID 112M
Date Received 1/8/2013
Date Completed 1/9/2013
Tested By CHRISTOPHER WILDES
AMOUNT PASSING (%)
100 99 0.7% Gravel 84 66 47 98.3% Sand 13 2
1.0 1% Fines
COARSE TO MEDIUM SAND
3" 2" 1" 1/2" 1/4" #10 #20 #40 #100 #200
100%
90%
80%
z 70% if.j (/)
60% a: 1-z 50% ::l 0 ~
40% <(
30%
20%
10%
0%
100.0000 10.0000 1.0000 0.1000 0.0100 0.0010
SIEVESIZE - mm
Comments: Sheet

Project Name MERRIMACK NH - PENNICHUCK SOURCE TESTING
Client COMPREHENSIVE ENVIRONMENTAL, INC,
Material Source S-6
STANDARD SIEVE SIZE DESIGNATION (mm/um)
25.0 mm 1" 19.0 mm 3/4" 12.5 mm 1/2" 9.5mm 3/8" 6.3mm 1/4"
4.75 mm No. 4 2.00 mm No.10 850 um No. 20 425 um No. 40 250um No.60 150 um No.100 75um No. 200
Report of Gradation ASTM C-117 & C-136
Project Number 13-0019
Lab ID 113M
Date Received 1/8/2013
Date Completed 1/9/2013
Tested By CHRISTOPHER WILDES
AMOUNT pASSING (%)
100 100 99 98 92 86 13.5% Gravel 70 52 24 85.1% Sand 8 3
1.3 1.3% Fines
SAND WITH LITILE FINE GRAVEL
3" 2" 1" 1/2" 1/4" #10 #20 #40 #100 #200
100%
90%
80%
.c. 70% (j) en
60% ~ t-z 50% :::::l 0 ::E <( 40%
30%
20%
10%
0% 100.0000 10.0000 1.0000 0.1000 0.0100 0.0010
SIEVESIZE-mm
Comments: Sheet

t:-iSW.COLE ~A ENGINEERING, INC.
Project Name MERRIMACK NH- PENNICHUCK SOURCE TESTING
Client COMPREHENSIVE ENVIRONMENTAL, INC,
Material Source &-7
STANDMD SIEVE SIZE DESIGNATION lmm/um)
4.75 mm No.4 2.00mm No.10 850um No.20 425 um No.40 250 um No. 60 150 um No.100 75um No. 200
Report of Gradation ASTM C-117 & C-136
Project Number 13-0019
Lab ID 114M
Date Received 1/8/20 13
Date Completed 1/9/2013
Tested By CHRISTOPHER WILDES
AMOUNT PASSING (%)
100 0% Gravel 97 57 30 90.6% Sand 17 13 9.4 9.4% Fines
FINE TO MEDIUM SAND WITH LITILE SILT
3" 2" 1" 1/2" 1/4" #10 #20 #40 #100 #200
100%
90%
80%
z 70%
~ 60%
f-z 50% ::I 0 ~ 40%
30%
20%
10%
0%
100.0000 10.0000 1.0000 0.1000 0.0100 0.0010
SIEVESIZE-mm
Comments: Sheet

Project Name MERRIMACK NH - PENNICHUCK SOURCE TESTING
Client COMPREHENSIVE ENVIRONMENTAL, INC,
Material Source S-8
STANDARD SIEVE SIZE DESIGNATION (mm/uml
19.0 mm 3/4" 12.5mm 1/2" 9.5mm 3/8" 6.3mm 1/4"
4.75 mm No.4 2.00 mm No. 10 850um No.20 425um No. 40 250um No.60 150 um No.100 75 um No. 200
Report of Gradation ASTM C-117 & C-136
Project Number 13-0019
Lab ID 115M
Date Received 1/8/20 13
Date Completed 1/9/2013
Tested By CHRISTOPHER WILDES
AMOUNT PASSING (%)
100 97 97 93 91 9% Gravel 87 85 85 11% Sand 84 84
80.0 80% Fines
SILT AND CLAY WITH SAND AND FINE GRAVEL
3" 2" 1" 1/2" 1/4" #10 #20 #40 #100 #200
100%
90%
80%
~ 70%
~ cf 60%
1-z 50% ::::l 0 :E < 40%
30%
20%
10%
0%
100.0000 10.0000 1.0000 0.1000 0.0100 0.0010
SIEVESIZE-nm
Comments: Sheet

SW.COLE ENGINEERING, INC.
Project Name MERRIMACK NH- PENNICHUCK SOURCE TESTING
Client COMPREHENSIVE ENVIRONMENTAL, INC,
Material Source S-9
STANDARD DESIGNATION lmm/uml
SIEVE SIZE
4.75mm No. 4 2.00 mm No.10 850um No. 20 425um No. 40 250 um No. 60 150 um No.100 75um No. 200
SILT AND CLAY
3" 2" 1" 1/2" 1/4" #1 0 #20 #40 #1 00 #200
100%
90%
80%
z 70%
~ 60%
1-z 50% ::J 0 ~ 40%
30%
20%
10%
0% 100.0000 10.0000 1.0000 0.1000
SIEVESIZE-mm
Comments:
Report of Gradation ASTM C-117 & C-136
Project Number 13-0019
Lab ID 116M
Date Received 1/812013
Date Completed 1/9/2013
Tested By CHRISTOPHER WILDES
AMOUNT PASSING (%)
100 0% Gravel 100 99 99 4.2% Sand 98 98
95.8 95.8% Fines
0.0100 0.0010
Sheet

Project Name MERRIMACK NH -PENNI CHUCK SOURCE TESTING
Client COMPREHENSIVE ENVIRONMENTAL, INC,
Material Source S-1 0
STANDARD SIEVE SIZE DESIGNATION (mm/um)
4.75rnrn No. 4 2.00 rnrn No.10 850urn No.20 425urn No.40 250 urn No. 60 150 urn No.100 75 urn No. 200
Report of Gradation ASTM C-117 & C-136
Project Number 13-0019
lab ID 117M
Date Received 1/8/2013
Date Completed 1/9/2013
Tested By CHRISTOPHER WILDES
AMOUNT PASSING (%)
100 0% Gravel
100 100 98 16% Sand
94 91
84.0 84% Fines
SILT AND CLAY WITH FINE SAND
3" 2" 1" 1/2" 1/4" #1 0 #20 #40 #1 00 #200
100%
90%
80%
z 70% u; (/)
~ 60%
1-z 50% ::> 0
~ 40%
30%
20%
10%
0%
100.0000 10.0000 1.0000 0.1000 0.0100 0.0010
SIEVESIZE-mm
Comments: Sheet

Sediment Core Boring Log Comprehensive Environmental Incorprated
21 Depot StreetMerrimack, NH 03054
PROJECT:
Pennichuck Water Works-Pond Sediment Borings
BORING/TP: TB-1LOCATION: Harris Pond
SCALE:
WL Remarks
DATE: 10/4/2012 1 inc = 0.5"
ELEV Depth Symbol Description of Materials BPF
0 GS Ground Surface0
5
10
15
20
sand/minimal organic materialsand/minimal organic material(all pine; no leaves)
25
very solid sand/minimal organic material
sample recovery: ≈1.25'
sample recovery: ≈2.31'
30
35
40

Sediment Core Boring Log Comprehensive Environmental Incorprated
21 Depot StreetMerrimack, NH 03054
PROJECT:
Pennichuck Water Works-Pond Sediment Borings
BORING/TP: TB-2LOCATION: Harris Pond
SCALE:
WL Remarks
DATE: 10/4/2012 1 inc = 0.5"
ELEV Depth Symbol Description of Materials BPF
0 GS Water Surface0
5
10
15
20
sample recovery: ≈1.25'sand/minimal organic material
25
sample recovery: ≈2.19'solid sand
30
35
40

Sediment Core Boring Log Comprehensive Environmental Incorprated
21 Depot StreetMerrimack, NH 03054
PROJECT:
Pennichuck Water Works-Pond Sediment Borings
BORING/TP: TB-3LOCATION: Harris Pond
SCALE:
WL Remarks
DATE: 10/4/2012 1 inc = 0.5"
ELEV Depth Symbol Description of Materials BPF
0 GS Ground Surface0
5
10
15
20
25
sample recovery: ≈0.69'
sample recovery: ≈1.00'
soft/some organics to hard sediment
slight organic material (soft) to sediment (hard)
30
sample recovery: ≈0.69'very solid sediment to silt
35
40

Sediment Core Boring Log Comprehensive Environmental Incorprated
21 Depot StreetMerrimack, NH 03054
PROJECT:
Pennichuck Water Works-Pond Sediment Borings
BORING/TP: TB-4LOCATION: Harris Pond
SCALE:
WL Remarks
DATE: 10/5/2012 1 inc = 0.5"
ELEV Depth Symbol Description of Materials BPF
0 GS Ground Surface0
5
10
15
sample recovery: ≈0.65'20 Little silt, sandy, soft organic sand
25
sample recovery: ≈1.44'sediment to sand/minimal organic
material
30
35
40

Sediment Core Boring Log Comprehensive Environmental Incorprated
21 Depot StreetMerrimack, NH 03054
PROJECT:
Pennichuck Water Works-Pond Sediment Borings
BORING/TP: TB-5LOCATION: Harris Pond
SCALE:
WL Remarks
DATE: 10/5/2012 1 inc = 0.5"
ELEV Depth Symbol Description of Materials BPF
0 GS Ground Surface0
5
10
15
20
sample recovery: ≈1.35'organic material to sand
25
sample recovery: ≈2.27'good sand/some organic bands
30
35
40

Sediment Core Boring Log Comprehensive Environmental Incorprated
21 Depot StreetMerrimack, NH 03054
PROJECT:
Pennichuck Water Works-Pond Sediment Borings
BORING/TP: TB-6LOCATION: Harris Pond
SCALE:
WL Remarks
DATE: 10/5/2012 1 inc = 0.5"
ELEV Depth Symbol Description of Materials BPF
0 GS Ground Surface0
5
10
l 1 35'i /d k b d15
sample recovery: ≈1.35'
sample recovery: ≈0.52'20
organic/dark brown sand
sandy gravel (hard); river bottom cobble
25
30
35
40
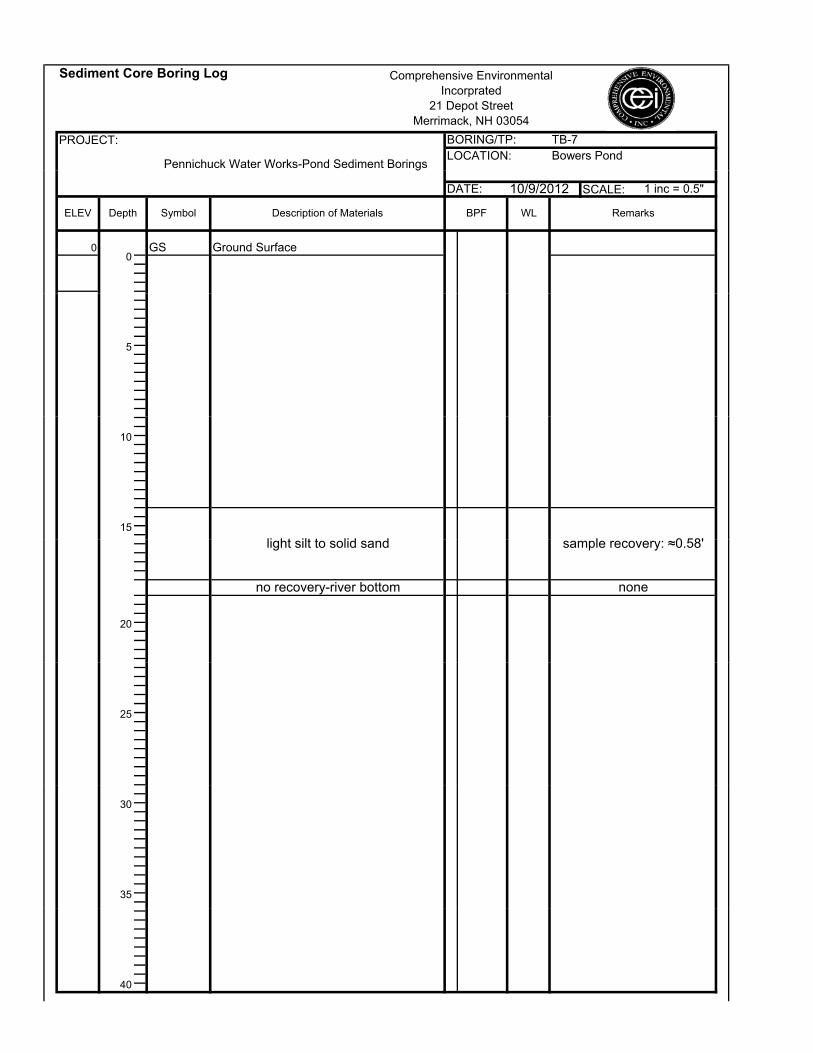
Sediment Core Boring Log Comprehensive Environmental Incorprated
21 Depot StreetMerrimack, NH 03054
PROJECT:
Pennichuck Water Works-Pond Sediment Borings
BORING/TP: TB-7LOCATION: Bowers Pond
SCALE:
WL Remarks
DATE: 10/9/2012 1 inc = 0.5"
ELEV Depth Symbol Description of Materials BPF
0 GS Ground Surface0
5
10
15
l 0 58'li ht ilt t lid d
20
sample recovery: ≈0.58'
none
light silt to solid sand
no recovery-river bottom
25
30
35
40

Sediment Core Boring Log Comprehensive Environmental Incorprated
21 Depot StreetMerrimack, NH 03054
PROJECT:
Pennichuck Water Works-Pond Sediment Borings
BORING/TP: TB-8LOCATION: Bowers Pond
SCALE:
WL Remarks
DATE: 10/9/2012 1 inc = 0.5"
ELEV Depth Symbol Description of Materials BPF
0 GS Ground Surface0
5
10
15
20
sample recovery: ≈1.77'soft silt into soft sand
25
sample recovery: ≈2.04'soft dark silt to grey silt
30
35
40

Sediment Core Boring Log Comprehensive Environmental Incorprated
21 Depot StreetMerrimack, NH 03054
PROJECT:
Pennichuck Water Works-Pond Sediment Borings
BORING/TP: TB-9LOCATION: Bowers Pond
SCALE:
WL Remarks
DATE: 10/9/2012 1 inc = 0.5"
ELEV Depth Symbol Description of Materials BPF
0 GS Ground Surface0
5
10
15
20
sample recovery: ≈2.06'
sample recovery: ≈2.17'
soft/dark silt to soft sand
sand into soft silt/some organic bands
25 sample recovery: ≈2.13'soft silt to hard gravel at 26'
30
35
40

Sediment Core Boring Log Comprehensive Environmental Incorprated
21 Depot StreetMerrimack, NH 03054
PROJECT:
Pennichuck Water Works-Pond Sediment Borings
BORING/TP: TB-10LOCATION: Bowers Pond
SCALE:
WL Remarks
DATE: 10/9/2012 1 inc = 0.5"
ELEV Depth Symbol Description of Materials BPF
0 GS Ground Surface0
5
10
15
20
sample recovery: ≈1.29'
sample recovery: ≈1.17'
soft dark organic material to soft sand
gravel to silty sand
25
30
35
40
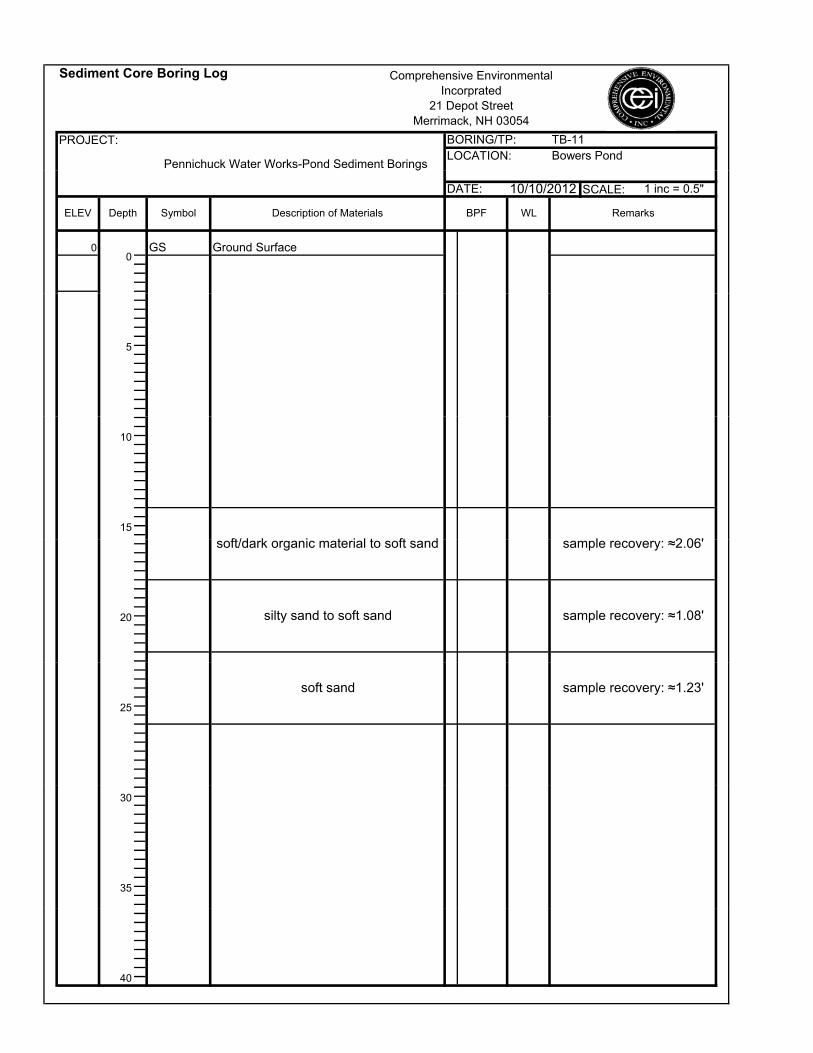
Sediment Core Boring Log Comprehensive Environmental Incorprated
21 Depot StreetMerrimack, NH 03054
PROJECT:
Pennichuck Water Works-Pond Sediment Borings
BORING/TP: TB-11LOCATION: Bowers Pond
SCALE:
WL Remarks
DATE: 10/10/2012 1 inc = 0.5"
ELEV Depth Symbol Description of Materials BPF
0 GS Ground Surface0
5
10
l 2 06'ft/d k i t i l t ft d15
sample recovery: ≈2.06'
sample recovery: ≈1.08'20
soft/dark organic material to soft sand
silty sand to soft sand
25
sample recovery: ≈1.23'soft sand
30
35
40

Sediment Core Boring Log Comprehensive Environmental Incorprated
21 Depot StreetMerrimack, NH 03054
PROJECT:
Pennichuck Water Works-Pond Sediment Borings
BORING/TP: TB-12LOCATION: Bowers Pond
SCALE:
WL Remarks
DATE: 10/10/2012 1 inc = 0.5"
ELEV Depth Symbol Description of Materials BPF
0 GS Ground Surface0
5
10
sample recovery: ≈1.48'
15
l 2 46'
soft/dark organic material to soft sand
ft d
20
sample recovery: ≈2.46'soft sand
25
30
35
40

Sediment Core Boring Log Comprehensive Environmental Incorprated
21 Depot StreetMerrimack, NH 03054
PROJECT:
Pennichuck Water Works-Pond Sediment Borings
BORING/TP: TB-13LOCATION: Bowers Pond
SCALE:
WL Remarks
DATE: 10/10/2012 1 inc = 0.5"
ELEV Depth Symbol Description of Materials BPF
0 GS Ground Surface0
5
sample recovery: ≈1 54'soft dark silt to soft sand
10
sample recovery: ≈1.54
15
sample recovery: ≈1.52'
soft dark silt to soft sand
soft sand with organic bands
20
sample recovery: ≈2.15'soft sand
25
30
35
40

Appendix C

Town Weight (tons) Volume (yd3)Total Town
Road/Lane MilesAmherst: 4,050 3,000 130 Miles
Hollis: 5,400 4,000 82 Miles Assumptions:Merrimack: 5,000 3,700 160 Miles 1 cubic foot of sand weighs 100 lbs; 1 cubic yard of sand weighs 2700 lbs
Nashua: 1,450 1,075 700 Lane Miles Sanding in all areas of the watershed is done at a consistent rate and evenly distributed across all lanes of roadMilford: 1,950 1,445 81 Miles Road and lane miles, as well as average volume of sand used per season obtained from each town is accurate
State and Private road sand loadings were estimated
State Town Private State Town Private State Town Private State Town Private Total Total Total(mi) (mi) (mi) (yd3/yr) (yd3/yr) (yd3/yr) (lbs/yr) (lbs/yr) (lbs/yr) (tons/yr) (tons/yr) (tons/yr) (yd3/yr) (lbs/yr) (tons/yr)
3 7.83 12.64 2.94 78.3 31.4 14.7 211,410 84,894 39,690 105.7 42.4 19.8 124.4 335,994 168.04 1.84 0.42 1.2 18.4 4.9 6.0 49,680 13,125 16,200 24.8 6.6 8.1 29.3 79,005 39.55 0.18 0.3 0 1.8 0.5 0.0 4,860 1,243 0 2.4 0.6 0.0 2.3 6,103 3.16 6.16 10.33 14.52 61.6 76.3 72.6 166,320 205,981 196,020 83.2 103.0 98.0 210.5 568,321 284.27 2 9.77 3.16 20.0 15.0 15.8 54,000 40,476 42,660 27.0 20.2 21.3 50.8 137,136 68.68 0.4 17.12 14.6 4.0 36.5 73.0 10,800 98,575 197,100 5.4 49.3 98.6 113.5 306,475 153.29 4.04 18.63 3.54 40.4 177.6 17.7 109,080 479,451 47,790 54.5 239.7 23.9 235.7 636,321 318.2
10 0 4.28 0.14 0.0 82.9 0.7 0 223,846 1,890 0.0 111.9 0.9 83.6 225,736 112.911 0 7.12 0.34 0.0 173.7 1.7 0 468,878 4,590 0.0 234.4 2.3 175.4 473,468 236.712 0 5.21 1.48 0.0 114.3 7.4 0 308,540 19,980 0.0 154.3 10.0 121.7 328,520 164.313 0 13.12 0.6 0.0 304.9 3.0 0 823,271 8,100 0.0 411.6 4.1 307.9 831,371 415.714 3.4 8.98 0.96 34.0 219.0 4.8 91,800 591,366 12,960 45.9 295.7 6.5 257.8 696,126 348.115 0 0.26 0.26 0.0 4.0 1.3 0 10,893 3,510 0.0 5.4 1.8 5.3 14,403 7.217 4.48 33.25 1.07 44.8 384.4 5.4 120,960 1,037,922 14,445 60.5 519.0 7.2 434.6 1,173,327 586.718 4.62 10.9 2.28 46.2 185.9 11.4 124,740 501,972 30,780 62.4 251.0 15.4 243.5 657,492 328.719 0 3.36 0.26 0.0 82.0 1.3 0 221,268 3,510 0.0 110.6 1.8 83.3 224,778 112.420 2.58 4.22 2.5 25.8 51.3 12.5 69,660 138,511 33,750 34.8 69.3 16.9 89.6 241,921 121.021 0.1 0.6 0 1.0 14.6 0.0 2,700 39,512 0 1.4 19.8 0.0 15.6 42,212 21.122 2.56 9.523 0.64 25.6 170.0 3.2 69,120 459,045 8,640 34.6 229.5 4.3 198.8 536,805 268.423 1.44 13.06 1.38 14.4 318.5 6.9 38,880 860,049 18,630 19.4 430.0 9.3 339.8 917,559 458.824 0.14 6.25 0.63 1.4 60.4 3.2 3,780 163,065 8,505 1.9 81.5 4.3 64.9 175,350 87.7
Totals 41.77 189.343 52.5 417.7 2508.1 262.5 1,127,790 6,771,882 708,750 563.9 3385.9 354.4 3188.3 8,608,422 4304.2
WatershedLane Length Total (mi) Loading / Year Loading / Year Loading / Year Loading / Year
Sand Usage Loading Summary
Seasonal Sand Usage
Sand Weight & Volume Used per Season per Town (varies per year)

Sand Loading Calculations
State Town Private State Town Private State Town Private State Town Private State Town Private
Watershed Town NameNumber of
Lanes (mi) (mi) (mi) (mi) (mi) (mi) (yd3/yr) (yd3/yr) (yd3/yr) (lbs/yr) (lbs/yr) (lbs/yr) (tons/yr) (tons/yr) (tons/yr) Watershed State Town Private TotalsAmherst 0 0 0 0 0 0 0 0.0 0.0 0.0 0.0 0.0 0.0 0.0 0.0 0.0 yd3/yr yd3/yr yd3/yr yd3/yrHollis 0 0 0 0 0 0 0 0.0 0.0 0.0 0.0 0.0 0.0 0.0 0.0 0.0 78.3 31.4 14.7 124.4Merrimack 2 0 0.6 1.41 0 1.2 2.82 0.0 13.9 14.1 0.0 37500.0 38070.0 0.0 18.8 19.0 (tons/yr) (tons/yr) (tons/yr) (tons/yr)Nashua 1 0.76 0 0 0.76 0 0 7.6 0.0 0.0 20520.0 0.0 0.0 10.3 0.0 0.0 105.7 42.4 19.8 168.0Nashua 2 2.1 5.72 0.06 4.2 11.44 0.12 42.0 17.6 0.6 113400.0 47394.3 1620.0 56.7 23.7 0.8Nashua 3 0.89 0 0 2.67 0 0 26.7 0.0 0.0 72090.0 0.0 0.0 36.0 0.0 0.0Nashua 5 0.04 0 0 0.2 0 0 2.0 0.0 0.0 5400.0 0.0 0.0 2.7 0.0 0.0Milford 0 0 0 0 0 0 0 0.0 0.0 0.0 0.0 0.0 0.0 0.0 0.0 0.0
7.83 12.64 2.94 78.3 31.4 14.7 211410.0 84894.3 39690.0 105.7 42.4 19.8Amherst 0 0 0 0 0 0 0 0.0 0.0 0.0 0.0 0.0 0.0 0.0 0.0 0.0 yd3/yr yd3/yr yd3/yr yd3/yrHollis 0 0 0 0 0 0 0 0.0 0.0 0.0 0.0 0.0 0.0 0.0 0.0 0.0 18.4 4.9 6.0 29.3Merrimack 1 0 0 0.52 0 0 0.52 0.0 0.0 2.6 0.0 0.0 7020.0 0.0 0.0 3.5 (tons/yr) (tons/yr) (tons/yr) (tons/yr)Merrimack 2 0.41 0.21 0.34 0.82 0.42 0.68 8.2 4.9 3.4 22140.0 13125.0 9180.0 11.1 6.6 4.6 24.8 6.6 8.1 39.5Nashua 2 0.51 0 0 1.02 0 0 10.2 0.0 0.0 27540.0 0.0 0.0 13.8 0.0 0.0Milford 0 0 0 0 0 0 0 0.0 0.0 0.0 0.0 0.0 0.0 0.0 0.0 0.0
1.84 0.42 1.2 18.4 4.9 6.0 49680.0 13125.0 16200.0 24.8 6.6 8.1Amherst 0 0 0 0 0 0 0 0.0 0.0 0.0 0.0 0.0 0.0 0.0 0.0 0.0 yd3/yr yd3/yr yd3/yr yd3/yrHollis 0 0 0 0 0 0 0 0.0 0.0 0.0 0.0 0.0 0.0 0.0 0.0 0.0 1.8 0.5 0.0 2.3Merrimack 0 0 0 0 0 0 0 0.0 0.0 0.0 0.0 0.0 0.0 0.0 0.0 0.0 (tons/yr) (tons/yr) (tons/yr) (tons/yr)Nashua 1 0.14 0 0 0.14 0 0 1.4 0.0 0.0 3780.0 0.0 0.0 1.9 0.0 0.0 2.4 0.6 0.0 3.1Nashua 2 0.02 0.15 0 0.04 0.3 0 0.4 0.5 0.0 1080.0 1242.9 0.0 0.5 0.6 0.0Milford 0 0 0 0 0 0 0 0.0 0.0 0.0 0.0 0.0 0.0 0.0 0.0 0.0
0.18 0.3 0 1.8 0.5 0.0 4860.0 1242.9 0.0 2.4 0.6 0.0Amherst 0 0 0 0 0 0 0 0.0 0.0 0.0 0.0 0.0 0.0 0.0 0.0 0.0 yd3/yr yd3/yr yd3/yr yd3/yrHollis 0 0 0 0 0 0 0 0.0 0.0 0.0 0.0 0.0 0.0 0.0 0.0 0.0 61.6 76.3 72.6 210.5Merrimack 1 0.53 0.16 0.53 0 0.16 5.3 0.0 0.8 14310.0 0.0 2160.0 7.2 0.0 1.1 (tons/yr) (tons/yr) (tons/yr) (tons/yr)Merrimack 2 1.06 2.53 2.52 2.12 5.06 5.04 21.2 58.6 25.2 57240.0 158125.0 68040.0 28.6 79.1 34.0 83.2 103.0 98.0 284.2Merrimack 4 0.43 0.24 0.93 1.72 0.96 3.72 17.2 11.1 18.6 46440.0 30000.0 50220.0 23.2 15.0 25.1Merrimack 5 0.31 1.55 0 0 15.5 0.0 0.0 41850.0 0.0 0.0 20.9 0.0 0.0Nashua 1 0.01 0 0.01 0 0.0 0.0 0.0 0.0 41.4 0.0 0.0 0.0 0.0Nashua 2 0.12 2.15 2.8 0.24 4.3 5.6 2.4 6.6 28.0 6480.0 17814.3 75600.0 3.2 8.9 37.8Milford 0 0 0 0 0 0 0 0.0 0.0 0.0 0.0 0.0 0.0 0.0 0.0 0.0
6.16 10.33 14.52 61.6 76.3 72.6 166320.0 205980.7 196020.0 83.2 103.0 98.0Amherst 0 0 0 0 0 0 0 0.0 0.0 0.0 0.0 0.0 0.0 0.0 0.0 0.0 yd3/yr yd3/yr yd3/yr yd3/yrHollis 0 0 0 0 0 0 0 0.0 0.0 0.0 0.0 0.0 0.0 0.0 0.0 0.0 20.0 15.0 15.8 50.8Merrimack 0 0 0 0 0 0 0 0.0 0.0 0.0 0.0 0.0 0.0 0.0 0.0 0.0 (tons/yr) (tons/yr) (tons/yr) (tons/yr)Nashua 1 0.52 0.12 0 0.52 0.12 0 5.2 0.2 0.0 14040.0 497.1 0.0 7.0 0.2 0.0 27.0 20.2 21.3 68.6Nashua 2 0.56 3.55 1.58 1.12 7.1 3.16 11.2 10.9 15.8 30240.0 29414.3 42660.0 15.1 14.7 21.3Nashua 3 0 0.08 0 0 0.24 0 0.0 0.4 0.0 0.0 994.3 0.0 0.0 0.5 0.0Nashua 4 0.09 0 0 0.36 0 0 3.6 0.0 0.0 9720.0 0.0 0.0 4.9 0.0 0.0Nashua 5 0 0.33 0 0 1.65 0 0.0 2.5 0.0 0.0 6835.7 0.0 0.0 3.4 0.0Nashua 6 0 0.11 0 0 0.66 0 0.0 1.0 0.0 0.0 2734.3 0.0 0.0 1.4 0.0Milford 0 0 0 0 0 0 0 0.0 0.0 0.0 0.0 0.0 0.0 0.0 0.0 0.0
2 9.77 3.16 20.0 15.0 15.8 54000.0 40475.7 42660.0 27.0 20.2 21.3Amherst 0 0 0 0 0 0 0 0.0 0.0 0.0 0.0 0.0 0.0 0.0 0.0 0.0 yd3/yr yd3/yr yd3/yr yd3/yrHollis 0 0 0 0 0 0 0 0.0 0.0 0.0 0.0 0.0 0.0 0.0 0.0 0.0 4.0 36.5 73.0 113.5Merrimack 2 0.2 0.51 0 0.4 1.02 0 4.0 11.8 0.0 10800.0 31875.0 0.0 5.4 15.9 0.0 (tons/yr) (tons/yr) (tons/yr) (tons/yr)Nashua 1 0 0.69 0.48 0 0.69 0.48 0.0 1.1 2.4 0.0 2858.6 6480.0 0.0 1.4 3.2 5.4 49.3 98.6 153.2Nashua 2 0 4.55 7.06 0 9.1 14.12 0.0 14.0 70.6 0.0 37700.0 190620.0 0.0 18.9 95.3Nashua 4 0 0.79 0 0 3.16 0 0.0 4.8 0.0 0.0 13091.4 0.0 0.0 6.5 0.0Nashua 5 0 0.63 0 0 3.15 0 0.0 4.8 0.0 0.0 13050.0 0.0 0.0 6.5 0.0Milford 0 0 0 0 0 0 0 0.0 0.0 0.0 0.0 0.0 0.0 0.0 0.0 0.0
0.4 17.12 14.6 4.0 36.5 73.0 10800.0 98575.0 197100.0 5.4 49.3 98.6Totals
Totals
7 7
Totals
8 8
Totals
5 5
Totals
6 6
Totals
4 4
Loading / Year Loading / YearOwner Owner Owner Owner Owner
Watershed Summary
Road Length per Lane (mi) Lane Length Total (mi) Loading / Year Loading / Year
3 3

Amherst 0 0 0 0 0 0 0 0.0 0.0 0.0 0.0 0.0 0.0 0.0 0.0 0.0 yd3/yr yd3/yr yd3/yr yd3/yrHollis 0 0 0 0 0 0 0 0.0 0.0 0.0 0.0 0.0 0.0 0.0 0.0 0.0 40.4 177.6 17.7 235.7Merrimack 1 0 0 0.08 0 0 0.08 0.0 0.0 0.4 0.0 0.0 1080.0 0.0 0.0 0.5 (tons/yr) (tons/yr) (tons/yr) (tons/yr)Merrimack 2 1.07 7.42 1.32 2.14 14.84 2.64 21.4 171.8 13.2 57780.0 463750.0 35640.0 28.9 231.9 17.8 54.5 239.7 23.9 318.2Merrimack 5 0.24 0 0 1.2 0 0 12.0 0.0 0.0 32400.0 0.0 0.0 16.2 0.0 0.0Merrimack 7 0.1 0 0 0.7 0 0 7.0 0.0 0.0 18900.0 0.0 0.0 9.5 0.0 0.0Nashua 2 0 0.78 0.41 0 1.56 0.82 0.0 2.4 4.1 0.0 6462.9 11070.0 0.0 3.2 5.5Nashua 4 0 0.17 0 0 0.68 0 0.0 1.0 0.0 0.0 2817.1 0.0 0.0 1.4 0.0Nashua 5 0 0.31 0 0 1.55 0 0.0 2.4 0.0 0.0 6421.4 0.0 0.0 3.2 0.0Milford 0 0 0 0 0 0 0 0.0 0.0 0.0 0.0 0.0 0.0 0.0 0.0 0.0
4.04 18.63 3.54 40.4 177.6 17.7 109080.0 479451.4 47790.0 54.5 239.7 23.9Amherst 0 0 0 0 0 0 0 0.0 0.0 0.0 0.0 0.0 0.0 0.0 0.0 0.0 yd3/yr yd3/yr yd3/yr yd3/yrHollis 2 0 1.67 0.07 0 3.34 0.14 0.0 81.5 0.7 0.0 219951.2 1890.0 0.0 110.0 0.9 0.0 82.9 0.7 83.6Merrimack 0 0 0 0 0 0 0 0.0 0.0 0.0 0.0 0.0 0.0 0.0 0.0 0.0 (tons/yr) (tons/yr) (tons/yr) (tons/yr)Nashua 2 0 0.47 0 0 0.94 0 0.0 1.4 0.0 0.0 3894.3 0.0 0.0 1.9 0.0 0.0 111.9 0.9 112.9Milford 0 0 0 0 0 0 0 0.0 0.0 0.0 0.0 0.0 0.0 0.0 0.0 0.0
0 4.28 0.14 0.0 82.9 0.7 0.0 223845.5 1890.0 0.0 111.9 0.9Amherst 0 0 0 0 0 0 0 0.0 0.0 0.0 0.0 0.0 0.0 0.0 0.0 0.0 yd3/yr yd3/yr yd3/yr yd3/yrHollis 1 0 0 0.2 0 0 0.2 0.0 0.0 1.0 0.0 0.0 2700.0 0.0 0.0 1.4 0.0 173.7 1.7 175.4Hollis 2 0 3.56 0.07 0 7.12 0.14 0.0 173.7 0.7 0.0 468878.0 1890.0 0.0 234.4 0.9 (tons/yr) (tons/yr) (tons/yr) (tons/yr)Merrimack 0 0 0 0 0 0 0 0.0 0.0 0.0 0.0 0.0 0.0 0.0 0.0 0.0 0.0 234.4 2.3 236.7Nashua 0 0 0 0 0 0 0 0.0 0.0 0.0 0.0 0.0 0.0 0.0 0.0 0.0Milford 0 0 0 0 0 0 0 0.0 0.0 0.0 0.0 0.0 0.0 0.0 0.0 0.0
0 7.12 0.34 0.0 173.7 1.7 0.0 468878.0 4590.0 0.0 234.4 2.3Amherst 0 0 0 0 0 0 0 0.0 0.0 0.0 0.0 0.0 0.0 0.0 0.0 0.0 yd3/yr yd3/yr yd3/yr yd3/yrHollis 1 0 0.43 0.58 0 0.43 0.58 0.0 10.5 2.9 0.0 28317.1 7830.0 0.0 14.2 3.9 0.0 114.3 7.4 121.7Hollis 2 0 2.11 0.45 0 4.22 0.9 0.0 102.9 4.5 0.0 277902.4 12150.0 0.0 139.0 6.1 (tons/yr) (tons/yr) (tons/yr) (tons/yr)Merrimack 0 0 0 0 0 0 0 0.0 0.0 0.0 0.0 0.0 0.0 0.0 0.0 0.0 0.0 154.3 10.0 164.3Nashua 2 0 0.28 0 0 0.56 0 0.0 0.9 0.0 0.0 2320.0 0.0 0.0 1.2 0.0Milford 0 0 0 0 0 0 0 0.0 0.0 0.0 0.0 0.0 0.0 0.0 0.0 0.0
0 5.21 1.48 0.0 114.3 7.4 0.0 308539.5 19980.0 0.0 154.3 10.0Amherst 0 0 0 0 0 0 0 0.0 0.0 0.0 0.0 0.0 0.0 0.0 0.0 0.0 yd3/yr yd3/yr yd3/yr yd3/yrHollis 2 0 6.23 0.3 0 12.46 0.6 0.0 303.9 3.0 0.0 820536.6 8100.0 0.0 410.3 4.1 0.0 304.9 3.0 307.9Merrimack 0 0 0 0 0 0 0 0.0 0.0 0.0 0.0 0.0 0.0 0.0 0.0 0.0 (tons/yr) (tons/yr) (tons/yr) (tons/yr)Nashua 2 0 0.33 0 0 0.66 0 0.0 1.0 0.0 0.0 2734.3 0.0 0.0 1.4 0.0 0.0 411.6 4.1 415.7Milford 0 0 0 0 0 0 0 0.0 0.0 0.0 0.0 0.0 0.0 0.0 0.0 0.0
0 13.12 0.6 0.0 304.9 3.0 0.0 823270.9 8100.0 0.0 411.6 4.1Amherst 0 0 0 0 0 0 0 0.0 0.0 0.0 0.0 0.0 0.0 0.0 0.0 0.0 yd3/yr yd3/yr yd3/yr yd3/yrHollis 2 1.7 4.49 0.48 3.4 8.98 0.96 34.0 219.0 4.8 91800.0 591365.9 12960.0 45.9 295.7 6.5 34.0 219.0 4.8 257.8Merrimack 0 0 0 0 0 0 0 0.0 0.0 0.0 0.0 0.0 0.0 0.0 0.0 0.0 (tons/yr) (tons/yr) (tons/yr) (tons/yr)Nashua 0 0 0 0 0 0 0 0.0 0.0 0.0 0.0 0.0 0.0 0.0 0.0 0.0 45.9 295.7 6.5 348.1Milford 0 0 0 0 0 0 0 0.0 0.0 0.0 0.0 0.0 0.0 0.0 0.0 0.0
3.4 8.98 0.96 34.0 219.0 4.8 91800.0 591365.9 12960.0 45.9 295.7 6.5Amherst 0 0 0 0 0 0 0 0.0 0.0 0.0 0.0 0.0 0.0 0.0 0.0 0.0 yd3/yr yd3/yr yd3/yr yd3/yrHollis 2 0 0.04 0.13 0 0.08 0.26 0.0 2.0 1.3 0.0 5268.3 3510.0 0.0 2.6 1.8 0.0 4.0 1.3 5.3Merrimack 2 0 0.09 0 0 0.18 0 0.0 2.1 0.0 0.0 5625.0 0.0 0.0 2.8 0.0 (tons/yr) (tons/yr) (tons/yr) (tons/yr)Nashua 0 0 0 0 0 0 0 0.0 0.0 0.0 0.0 0.0 0.0 0.0 0.0 0.0 0.0 5.4 1.8 7.2Milford 0 0 0 0 0 0 0 0.0 0.0 0.0 0.0 0.0 0.0 0.0 0.0 0.0
0 0.26 0.26 0.0 4.0 1.3 0.0 10893.3 3510.0 0.0 5.4 1.8
Totals
15 15
Totals
Totals
13 13
Totals
14 14
Totals
11 11
Totals
12 12
9 9
Totals
10 10

Amherst 2 0 5.93 0.51 0 11.86 1.02 0.0 136.8 5.1 0.0 369484.6 13770.0 0.0 184.7 6.9 yd3/yr yd3/yr yd3/yr yd3/yrAmherst 4 0.5 0 0 2 0 0 20.0 0.0 0.0 54000.0 0.0 0.0 27.0 0.0 0.0 44.8 384.4 5.4 434.6Hollis 4 0.09 0 0 0.36 0 0 3.6 0.0 0.0 9720.0 0.0 0.0 4.9 0.0 0.0 (tons/yr) (tons/yr) (tons/yr) (tons/yr)Merrimack 1 0.14 0.43 0.01 0.14 0.43 0.01 1.4 5.0 0.1 3780.0 13437.5 135.0 1.9 6.7 0.1 60.5 519.0 7.2 586.7Merrimack 2 0 10.48 0.02 0 20.96 0.04 0.0 242.6 0.2 0.0 655000.0 540.0 0.0 327.5 0.3Merrimack 4 0.32 0 0 1.28 0 0 12.8 0.0 0.0 34560.0 0.0 0.0 17.3 0.0 0.0Merrimack 5 0.14 0 0 0.7 0 0 7.0 0.0 0.0 18900.0 0.0 0.0 9.5 0.0 0.0Nashua 0 0 0 0 0 0 0 0.0 0.0 0.0 0.0 0.0 0.0 0.0 0.0 0.0Milford 0 0 0 0 0 0 0 0.0 0.0 0.0 0.0 0.0 0.0 0.0 0.0 0.0
4.48 33.25 1.07 44.8 384.4 5.4 120960.0 1037922.1 14445.0 60.5 519.0 7.2Amherst 2 0.05 3.11 1.14 0.1 6.22 2.28 1.0 71.8 11.4 2700.0 193776.9 30780.0 1.4 96.9 15.4 yd3/yr yd3/yr yd3/yr yd3/yrAmherst 4 1.13 0 0 4.52 0 0 45.2 0.0 0.0 122040.0 0.0 0.0 61.0 0.0 0.0 46.2 185.9 11.4 243.5Hollis 2 0 2.34 0 0 4.68 0 0.0 114.1 0.0 0.0 308195.1 0.0 0.0 154.1 0.0 (tons/yr) (tons/yr) (tons/yr) (tons/yr)Merrimack 0 0 0 0 0 0 0 0.0 0.0 0.0 0.0 0.0 0.0 0.0 0.0 0.0 62.4 251.0 15.4 328.7Nashua 0 0 0 0 0 0 0 0.0 0.0 0.0 0.0 0.0 0.0 0.0 0.0 0.0Milford 0 0 0 0 0 0 0 0.0 0.0 0.0 0.0 0.0 0.0 0.0 0.0 0.0
4.62 10.9 2.28 46.2 185.9 11.4 124740.0 501972.0 30780.0 62.4 251.0 15.4Amherst 0 0 0 0 0 0 0 0.0 0.0 0.0 0.0 0.0 0.0 0.0 0.0 0.0 yd3/yr yd3/yr yd3/yr yd3/yrHollis 1 0 0 0.26 0 0 0.26 0.0 0.0 1.3 0.0 0.0 3510.0 0.0 0.0 1.8 0.0 82.0 1.3 83.3Hollis 2 0 1.68 0 0 3.36 0 0.0 82.0 0.0 0.0 221268.3 0.0 0.0 110.6 0.0 (tons/yr) (tons/yr) (tons/yr) (tons/yr)Merrimack 0 0 0 0 0 0 0 0.0 0.0 0.0 0.0 0.0 0.0 0.0 0.0 0.0 0.0 110.6 1.8 112.4Nashua 0 0 0 0 0 0 0 0.0 0.0 0.0 0.0 0.0 0.0 0.0 0.0 0.0Milford 0 0 0 0 0 0 0 0.0 0.0 0.0 0.0 0.0 0.0 0.0 0.0 0.0
0 3.36 0.26 0.0 82.0 1.3 0.0 221268.3 3510.0 0.0 110.6 1.8Amherst 1 0 0.1 0 0 0.1 0.0 0.0 0.5 0.0 0.0 1350.0 0.0 0.0 0.7 yd3/yr yd3/yr yd3/yr yd3/yrAmherst 2 1.12 1.25 1.17 2.24 2.5 2.34 22.4 28.8 11.7 60480.0 77884.6 31590.0 30.2 38.9 15.8 25.8 51.3 12.5 89.6Hollis 2 0.17 0.23 0 0.34 0.46 0 3.4 11.2 0.0 9180.0 30292.7 0.0 4.6 15.1 0.0 (tons/yr) (tons/yr) (tons/yr) (tons/yr)Merrimack 0 0 0 0 0 0 0 0.0 0.0 0.0 0.0 0.0 0.0 0.0 0.0 0.0 34.8 69.3 16.9 121.0Nashua 0 0 0 0 0 0 0 0.0 0.0 0.0 0.0 0.0 0.0 0.0 0.0 0.0Milford 1 0 0.06 0 0 0.06 0 0.0 0.5 0.0 0.0 1444.4 0.0 0.0 0.7 0.0Milford 2 0 0.6 0.03 0 1.2 0.06 0.0 10.7 0.3 0.0 28888.9 810.0 0.0 14.4 0.4
2.58 4.22 2.5 25.8 51.3 12.5 69660.0 138510.6 33750.0 34.8 69.3 16.9Amherst 0 0 0 0 0 0 0 0.0 0.0 0.0 0.0 0.0 0.0 0.0 0.0 0.0 yd3/yr yd3/yr yd3/yr yd3/yrHollis 2 0.05 0.3 0 0.1 0.6 0 1.0 14.6 0.0 2700.0 39512.2 0.0 1.4 19.8 0.0 1.0 14.6 0.0 15.6Merrimack 0 0 0 0 0 0 0 0.0 0.0 0.0 0.0 0.0 0.0 0.0 0.0 0.0 (tons/yr) (tons/yr) (tons/yr) (tons/yr)Nashua 0 0 0 0 0 0 0 0.0 0.0 0.0 0.0 0.0 0.0 0.0 0.0 0.0 1.4 19.8 0.0 21.1Milford 0 0 0 0 0 0 0 0.0 0.0 0.0 0.0 0.0 0.0 0.0 0.0 0.0
0.1 0.6 0 1.0 14.6 0.0 2700.0 39512.2 0.0 1.4 19.8 0.0Amherst 0 0 0 0 0 0 0 0.0 0.0 0.0 0.0 0.0 0.0 0.0 0.0 0.0 yd3/yr yd3/yr yd3/yr yd3/yrHollis 2 1.28 2.75 0.1 2.56 5.5 0.2 25.6 134.1 1.0 69120.0 362195.1 2700.0 34.6 181.1 1.4 25.6 170.0 3.2 198.8Merrimack 0 0 0 0 0 0 0 0.0 0.0 0.0 0.0 0.0 0.0 0.0 0.0 0.0 (tons/yr) (tons/yr) (tons/yr) (tons/yr)Nashua 0 0 0 0 0 0 0 0.0 0.0 0.0 0.0 0.0 0.0 0.0 0.0 0.0 34.6 229.5 4.3 268.4Milford 1 0 0.003 0 0 0.003 0 0.0 0.0 0.0 0.0 72.2 0.0 0.0 0.0 0.0Milford 2 0 2.01 0.22 0 4.02 0.44 0.0 35.8 2.2 0.0 96777.8 5940.0 0.0 48.4 3.0
2.56 9.523 0.64 25.6 170.0 3.2 69120.0 459045.1 8640.0 34.6 229.5 4.3Amherst 0 0 0 0 0 0 0 0.0 0.0 0.0 0.0 0.0 0.0 0.0 0.0 0.0 yd3/yr yd3/yr yd3/yr yd3/yrHollis 2 0.72 6.53 0.69 1.44 13.06 1.38 14.4 318.5 6.9 38880.0 860048.8 18630.0 19.4 430.0 9.3 14.4 318.5 6.9 339.8Merrimack 0 0 0 0 0 0 0 0.0 0.0 0.0 0.0 0.0 0.0 0.0 0.0 0.0 (tons/yr) (tons/yr) (tons/yr) (tons/yr)Nashua 0 0 0 0 0 0 0 0.0 0.0 0.0 0.0 0.0 0.0 0.0 0.0 0.0 19.4 430.0 9.3 458.8Milford 0 0 0 0 0 0 0 0.0 0.0 0.0 0.0 0.0 0.0 0.0 0.0 0.0
1.44 13.06 1.38 14.4 318.5 6.9 38880.0 860048.8 18630.0 19.4 430.0 9.3Amherst 1 0.13 0 0 0.13 0.0 0.0 0.7 0.0 0.0 1755.0 0.0 0.0 0.9 yd3/yr yd3/yr yd3/yr yd3/yrAmherst 2 0.07 0.89 0.25 0.14 1.78 0.5 1.4 20.5 2.5 3780.0 55453.8 6750.0 1.9 27.7 3.4 1.4 60.4 3.2 64.9Hollis 0 0 0 0 0 0 0 0.0 0.0 0.0 0.0 0.0 0.0 0.0 0.0 0.0 (tons/yr) (tons/yr) (tons/yr) (tons/yr)Merrimack 0 0 0 0 0 0 0 0.0 0.0 0.0 0.0 0.0 0.0 0.0 0.0 0.0 1.9 81.5 4.3 87.7Nashua 0 0 0 0 0 0 0 0.0 0.0 0.0 0.0 0.0 0.0 0.0 0.0 0.0Milford 1 0.11 0 0.11 0 0.0 1.0 0.0 0.0 2648.1 0.0 0.0 1.3 0.0Milford 2 2.18 0 4.36 0 0.0 38.9 0.0 0.0 104963.0 0.0 0.0 52.5 0.0
0.14 6.25 0.63 1.4 60.4 3.2 3780.0 163065.0 8505.0 1.9 81.5 4.3
Totals
24 24
Totals
Totals
22 22
Totals
23 23
Totals
20 20
Totals
21 21
Totals
18 18
Totals
19 19
17 17

Sub-Watershed Area (acres) Commercial Forest HighDenRes LowDenRes Industrial Open Space Road Water Commercial Forest HighDenRes LowDenRes Industrial Open Space Road Water3 662 1.89 19.97 26.29 19.23 5.90 15.20 11.52 12.51 132.20 174.04 127.30 39.06 0.00 100.62 76.264 233 41.03 16.01 7.75 11.56 7.85 15.81 95.60 37.30 18.06 0.00 26.93 0.00 18.29 36.845 19 66.25 10.52 23.23 0.00 12.59 0.00 2.00 0.00 0.00 4.41 0.006 1406 3.94 28.87 6.40 20.28 29.15 7.45 3.93 55.40 405.91 89.98 285.14 409.85 0.00 104.75 55.267 461 41.15 12.13 19.54 4.87 12.41 1.27 8.63 189.70 55.92 90.08 22.45 57.21 5.85 39.78 0.008 1088 13.51 27.76 14.51 13.35 15.35 6.51 5.14 3.88 146.99 302.03 157.87 145.25 167.01 70.83 55.92 42.219 960 23.33 18.66 0.57 41.64 4.98 0.12 8.42 2.29 223.97 179.14 5.47 399.74 47.81 1.15 80.83 21.98
10 491 2.53 58.23 21.58 13.24 1.02 2.90 0.51 12.42 285.91 0.00 105.96 65.01 5.01 14.24 2.5011 665 44.16 44.09 3.60 8.15 0.00 293.66 0.00 293.20 0.00 0.00 23.94 54.2012 939 2.61 65.01 25.67 3.27 2.29 1.15 24.51 610.44 0.00 241.04 0.00 30.71 21.50 10.8013 1768 0.00 38.5 42.74 16.46 2.24 0.06 0.00 680.68 0.00 755.64 0.00 291.01 39.60 1.0614 1338 0.25 51.15 27.87 12.88 2.91 4.95 3.35 684.39 0.00 372.90 0.00 172.33 38.94 66.2315 26 55.48 38.52 4.32 1.67 0.00 14.42 0.00 10.02 0.00 1.12 0.43 0.0016 34 0.01 74.90 20.52 0.24 0.58 3.74 0.00 0.00 0.00 25.47 6.98 0.08 0.20 1.2717 1373 6.83 13.94 0.08 69.51 0.17 8.98 0.49 93.78 191.40 1.10 954.37 0.00 2.33 123.30 6.7318 951 9.67 28.55 2.90 33.10 18.23 1.21 5.97 0.36 91.96 271.51 27.58 314.78 173.37 11.51 56.77 3.4219 337 5.78 33.5 56.91 0.21 3.59 19.48 112.90 0.00 191.79 0.71 0.00 12.10 0.0020 686 1.70 16.56 3.33 47.58 26.45 0.62 3.76 11.66 113.60 22.84 326.40 181.45 4.25 25.79 0.0021 105 36.94 25.18 25.72 10.02 2.14 38.79 26.44 0.00 27.01 10.52 0.00 2.25 0.0022 1326 56.06 2.86 36.98 0.61 3.49 0.00 743.36 37.92 490.35 0.00 8.09 46.28 0.0023 1686 0.31 42.96 45.81 8.41 2.51 5.23 724.31 0.00 772.36 0.00 141.79 42.32 0.0024 741 38.17 1.18 56.59 0.83 3.22 0.00 282.84 8.74 419.33 0.00 6.15 23.86 0.00
Calibrated Coeff.Lbs/acre/year
334.71.4
176.01.7
176.073.8N/A
224.1762.1
1.4
Residential-Low DensityResidential-Med. Density**
IndustrialRoadway/Parking Lot
Open Non-Urban Land
CommercialForested
MultifamilyOpen Urban Land
Residential-High Density
Total Suspended Solids (TSS) LoadingsLand Use (%): Land Use (Acres)

Commercial Forest HighDenRes LowDenRes Industrial Open Space Road Water (lb/yr) (ft3 /yr) (yd3/yr) (ton/yr) (lb/yr) (ft3/yr) (yd3/yr) (ton/yr)4187.70 185.08 30631.00 9394.93 8752.90 0.00 76685.55 0.00 129837.17 1298.37 48.09 64.92 53151.62 531.52 19.69 26.58
31997.29 52.22 3178.12 0.00 6036.09 0.00 13939.19 0.00 55202.91 552.03 20.45 27.60 41263.72 412.64 15.28 20.630.00 17.62 0.00 147.51 0.00 0.00 3363.68 0.00 3528.81 35.29 1.31 1.76 165.13 1.65 0.06 0.08
18541.18 568.28 15837.18 21043.10 91847.16 0.00 79827.69 0.00 227664.58 2276.65 84.32 113.83 147836.89 1478.37 54.75 73.9263493.09 78.29 15853.97 1656.86 12820.78 9.95 30319.62 0.00 124232.57 1242.33 46.01 62.12 93912.95 939.13 34.78 46.9649197.15 422.84 27784.91 10719.30 37426.49 120.41 42619.07 0.00 168290.18 1682.90 62.33 84.15 125671.10 1256.71 46.54 62.8474962.09 250.79 963.07 29501.11 10713.77 1.96 61602.07 0.00 177994.86 1779.95 65.92 89.00 116392.79 1163.93 43.11 58.20
4157.74 400.27 0.00 7819.69 14568.38 8.51 10851.54 0.00 37806.14 378.06 14.00 18.90 26954.60 269.55 9.98 13.480.00 411.13 0.00 21638.05 0.00 0.00 18244.67 0.00 40293.85 402.94 14.92 20.15 22049.18 220.49 8.17 11.02
8202.79 854.62 0.00 17788.85 0.00 52.20 16387.51 0.00 43285.98 432.86 16.03 21.64 26898.46 268.98 9.96 13.450.00 952.95 0.00 55766.47 0.00 494.72 30181.60 0.00 87395.74 873.96 32.37 43.70 57214.14 572.14 21.19 28.61
1119.57 958.14 0.00 27520.06 0.00 292.97 29672.97 0.00 59563.72 595.64 22.06 29.78 29890.75 298.91 11.07 14.950.00 20.19 0.00 739.12 0.00 1.91 330.90 0.00 1092.13 10.92 0.40 0.55 761.23 7.61 0.28 0.380.00 0.00 0.00 1879.39 1563.50 0.14 150.29 0.00 3593.32 35.93 1.33 1.80 3443.04 34.43 1.28 1.72
31386.79 267.95 193.32 70432.68 0.00 3.97 93963.42 0.00 196248.13 1962.48 72.68 98.12 102284.71 1022.85 37.88 51.1430779.58 380.11 4853.90 23230.84 38851.61 19.56 43268.00 0.00 141383.61 1413.84 52.36 70.69 98115.61 981.16 36.34 49.06
6519.49 158.05 0.00 14153.86 158.60 0.00 9220.11 0.00 30210.11 302.10 11.19 15.11 20989.99 209.90 7.77 10.493903.27 159.04 4020.51 24088.23 40662.27 7.23 19657.30 0.00 92497.86 924.98 34.26 46.25 72840.56 728.41 26.98 36.42
12982.01 37.01 0.00 1993.04 2357.76 0.00 1712.44 0.00 19082.26 190.82 7.07 9.54 17369.82 173.70 6.43 8.680.00 1040.70 6674.55 36188.18 0.00 13.75 35268.01 0.00 79185.19 791.85 29.33 39.59 43917.19 439.17 16.27 21.96
1749.34 1014.03 0.00 56999.92 0.00 241.05 32251.01 0.00 92255.34 922.55 34.17 46.13 60004.34 600.04 22.22 30.000.00 395.98 1538.91 30946.69 0.00 10.46 18183.86 0.00 51075.89 510.76 18.92 25.54 32892.03 328.92 12.18 16.45
Total Suspended Solids (TSS) LoadingsTSS Land Use Loads (lbs/yr) Total Subwatershed TSS Loads Total Subwatershed TSS Loads - No Roads

0.26 0.00853 1 0.26 0.00853 24,496 907 0.1%0.51 0.01673 1 0.51 0.01673 48,050 1,780 0.2%0.85 0.02789 1 0.85 0.02789 80,083 2,966 0.3%0.26 0.00853 1 0.26 0.00853 21,231 786 0.0%0.51 0.01673 1 0.51 0.01673 41,646 1,542 0.1%0.85 0.02789 1 0.85 0.02789 69,410 2,571 0.2%0.26 0.00853 1 0.26 0.00853 1,620 60 0.1%0.51 0.01673 1 0.51 0.01673 3,178 118 0.2%0.85 0.02789 1 0.85 0.02789 5,297 196 0.3%0.26 0.00853 50 13.00 0.42651 1,224,804 45,363 5%0.51 0.01673 50 25.50 0.83661 2,402,500 88,981 10%0.85 0.02789 50 42.50 1.39436 4,004,167 148,302 17%0.26 0.00853 50 13.00 0.42651 1,061,564 39,317 2%0.51 0.01673 50 25.50 0.83661 2,082,299 77,122 5%0.85 0.02789 50 42.50 1.39436 3,470,499 128,537 8%0.26 0.00853 50 13.00 0.42651 81,010 3,000 4%0.51 0.01673 50 25.50 0.83661 158,905 5,885 8%0.85 0.02789 50 42.50 1.39436 264,841 9,809 13%0.26 0.00853 100 26.00 0.85302 2,449,608 90,726 10%0.51 0.01673 100 51.00 1.67323 4,805,000 177,963 20%0.85 0.02789 100 85.00 2.78871 8,008,333 296,605 33%0.26 0.00853 100 26.00 0.85302 2,123,129 78,634 5%0.51 0.01673 100 51.00 1.67323 4,164,598 154,244 9%0.85 0.02789 100 85.00 2.78871 6,940,997 257,074 15%0.26 0.00853 100 26.00 0.85302 162,021 6,001 8%0.51 0.01673 100 51.00 1.67323 317,810 11,771 16%0.85 0.02789 100 85.00 2.78871 529,683 19,618 26%0.26 0.00853 120 31.20 1.02362 2,939,529 108,871 12%0.51 0.01673 120 61.20 2.00787 5,766,000 213,556 24%0.85 0.02789 120 102.00 3.34646 9,610,000 355,926 40%0.26 0.00853 120 31.20 1.02362 2,547,754 94,361 6%0.51 0.01673 120 61.20 2.00787 4,997,518 185,093 11%0.85 0.02789 120 102.00 3.34646 8,329,197 308,489 18%
Sediment Accumulation Volume Estimates vs Pond Storage
Starting Pond Volume (ft3)
Harris Pond
Bowers Pond
Harris Pond
Bowers Pond 24,060,954
2,871,694
2,488,960
45,448,469
24,060,954
45,448,469
24,060,954
Harris Pond
Holts Pond
Loss of Reservoir Volume (%)
Holts Pond 189,938 2,029,528
45,448,469
2,029,528
Sediment Volume (yd3)
Sediment Volume (ft3)
Pond Surface Area (ft2)
2,871,694
2,488,960
Accumulation Rate (ft/yr)
Total Accumulation (ft)Accumulation Rate
(cm/yr)
Total Accumulation (cm)
Bowers Pond 2,871,694
2,488,960
Time (Years)Pond
189,938
Holts Pond 189,938 2,029,528
Bowers Pond
Harris Pond
2,871,694
2,488,960
24,060,954
45,448,469

Directly Contributing Watershed Loadings
Accumulation Rate (cm/yr) Time (Years)
Sediment Volume (yd3)
Combined Watershed Loadings (yd3)
LocationDirectly Contributing
WatershedsRoadway Loading
(yd3/yr)Land Use Loading
(yd3/yr)
Combined Roadway and Land Use
Loadings (yd3/yr)
0.26 1 1,754 3,422 Holts Pond 8 through 24 2652 318 2,970 60 to 1960.85 1 5,733 Bowers Pond 4,6 200 70 270 907 to 2,9660.26 50 87,681 171,083 Harris Pond 3,4,5,7 148 70 218 786 to 2,5710.85 50 286,6480.26 100 175,361 342,165 * These directly 0.85 100 573,297
Watersheds PondsWatershed Loadings
(cy / yr)Watershed Loadings
(cf / yr)Surface Area
(sf)Accumulation
(ft/yr)Accumulation
(cm/yr)4 and 6 Harris Direct 270 7,290 2,871,694 0.002538571 0.07743,4,5 and 7 Bowers Direct 218 5,886 2,488,960 0.002364843 0.0721All All (Harris Total) 3,422 92,385 5,550,592 0.016644089 0.50738 through 24 Holts Total 2,970 80,190 189,938 0.422190399 12.86843,4,5,7 and 8 ‐ 24 Bowers Total 3,188 86,076 2,871,694 0.029973946 0.9136
Combined Loadings for Holts, Bowers, & Harris Ponds
Empirical Sediment Accumulation on Annual Basis
Sediment Volume Range as Determined by Radiochemical Testing (yd3/yr)

Appendix D

Radiochemical Analysis of a New Hampshire Pond Core
Data Report to:
Bill Devore, EIT Project Engineer 225 Cedar Hill Street Marlborough, MA 01752 Report by: Dr. Clark Alexander Skidaway Institute of Oceanography 10 Ocean Science Circle Savannah, GA 31411 Methods Ten sections of a sediment core were provided to me, along with sample depths and time of collection. These samples were dried to determine porosity gravimetrically, and then were ground in a porcelain mortar and pestle to a powder. Samples of known mass were subsequently sealed in polypropylene jars and left for 20 days to allow ingrowth and secular equilibrium of intermediate daughter products of Ra-226 and Rn-222 (Pb-214 and Bi-214) to occur. The uppermost two samples were counted immediately to determine the activity of Be-7, a naturally occurring radionuclide with a 50-d half-life, and then counted again for Pb-210 and Cs-137 after the 20 days had passed. Samples were counted for up to three days each on an ORTEC planar germanium detector, using gamma spectroscopic MCA software, to gather enough counts in each peak. Be-7 and Cs-137 were determined by quantification of their gamma emission peaks at 477 and 661 KeV, respectively. Total Pb-210 was determined by quantification of its 46.5-KeV emission peak, whereas Ra-226 (which equals supported Pb-210) activity was determined by averaging the activities of its three daughter isotopes Pb-214 (at 295 and 352 KeV) and Bi-214 (at 609 KeV). Excess Pb-210, the value needed to determine an accumulation rate, was determined by subtracting supported Pb-210 activities (Ra-226) from the total Pb-210 value in each interval. Results were plotted in Sigmaplot 12.0. Detection limits for Cs-137 are 0.05 dpm/g and for excess Pb-210 are 0.3 dpm/g (shown on plots as vertical line). These detection limits are typical for the gamma spectroscopic technique. Results Sediment in the core was very heterogeneous, which complicates the interpretation of Pb-210, Cs-137 and Be-7 radiochemical profiles. Fine-grained materials are preferred for radiochemical studies because clay particles have a high surface area to mass ratio, therefore can carry a strong adsorbed radiochemical signal. The upper two core intervals were suitable, being an organic rich, fine-grained mud, whereas other core intervals were sandy materials of various sizes, except for the last two, which again have some component of mud. Some of these core intervals represent sediment that has accumulated in the pond since construction, and some of the intervals of the core may represent the native sediments below the depth to which the pond was dug.
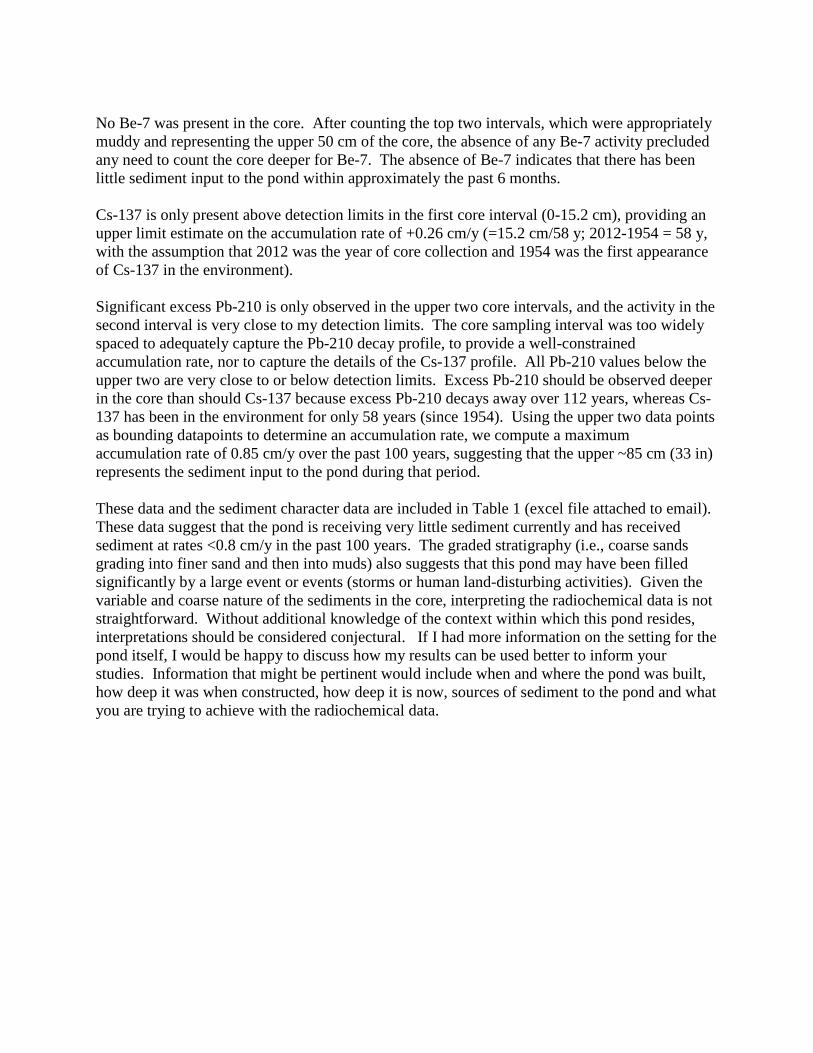
No Be-7 was present in the core. After counting the top two intervals, which were appropriately muddy and representing the upper 50 cm of the core, the absence of any Be-7 activity precluded any need to count the core deeper for Be-7. The absence of Be-7 indicates that there has been little sediment input to the pond within approximately the past 6 months. Cs-137 is only present above detection limits in the first core interval (0-15.2 cm), providing an upper limit estimate on the accumulation rate of +0.26 cm/y (=15.2 cm/58 y; 2012-1954 = 58 y, with the assumption that 2012 was the year of core collection and 1954 was the first appearance of Cs-137 in the environment). Significant excess Pb-210 is only observed in the upper two core intervals, and the activity in the second interval is very close to my detection limits. The core sampling interval was too widely spaced to adequately capture the Pb-210 decay profile, to provide a well-constrained accumulation rate, nor to capture the details of the Cs-137 profile. All Pb-210 values below the upper two are very close to or below detection limits. Excess Pb-210 should be observed deeper in the core than should Cs-137 because excess Pb-210 decays away over 112 years, whereas Cs-137 has been in the environment for only 58 years (since 1954). Using the upper two data points as bounding datapoints to determine an accumulation rate, we compute a maximum accumulation rate of 0.85 cm/y over the past 100 years, suggesting that the upper ~85 cm (33 in) represents the sediment input to the pond during that period. These data and the sediment character data are included in Table 1 (excel file attached to email). These data suggest that the pond is receiving very little sediment currently and has received sediment at rates <0.8 cm/y in the past 100 years. The graded stratigraphy (i.e., coarse sands grading into finer sand and then into muds) also suggests that this pond may have been filled significantly by a large event or events (storms or human land-disturbing activities). Given the variable and coarse nature of the sediments in the core, interpreting the radiochemical data is not straightforward. Without additional knowledge of the context within which this pond resides, interpretations should be considered conjectural. If I had more information on the setting for the pond itself, I would be happy to discuss how my results can be used better to inform your studies. Information that might be pertinent would include when and where the pond was built, how deep it was when constructed, how deep it is now, sources of sediment to the pond and what you are trying to achieve with the radiochemical data.

226 Ra, 210 Pb Activ ity (dpm/g)
1 o-1 10° 101 0 ~--~--~~~~~----~--~~~~~----~--~~
I 0 I
100
-E (.) -..c -a. 0,) • 0 200
01 . ...
300
. ... . ...
....
• •
New Hampshire Samples Ace. Rate= 0.85 cm/y
A total 210Pb
• suppo rted 210Pb
• excess 210Pb vs . depth
•

137 Cs Activ ity (dpm/g)
0.0 0.1 0.2 0.3 0.4 0.5 0 +-~+-~~~~~~~~~~~~~~~~~
100
-E (,) .._
.t=. -c.. 0,)
0 200
300 New Hampshire Samples

New Hampshire Pond CoreDr. Clark Alexander, Skidaway Institute of OceanographyResults reported Feb. 24, 2013
Section Interval(cm)
Midpoint (cm)
Porosity(%)
Pb-210tot
(dpm/g)Pb-210tot
errorRa-226(dpm/g)
Ra-226error
Pb-210xs
(dpm/g)1 0.0-15.2 7.6 88.25 3.67 0.17 2.30 0.18 1.382 30.5-45.7 38.1 71.80 2.75 0.11 2.30 0.12 0.453 61.0-76.2 68.6 60.57 1.61 0.07 1.19 0.07 0.414 94.0-109.2 101.6 54.42 0.91 0.05 0.88 0.06 0.035 147.3-162.6 154.9 34.90 0.70 0.04 0.61 0.04 0.096 180.3-195.6 188.0 38.01 1.09 0.07 1.00 0.07 0.087 213.4-228.6 221.0 40.75 0.88 0.05 0.67 0.04 0.228 243.8-259.1 251.5 34.61 2.57 0.10 2.27 0.10 0.309 271.8-287.0 279.4 32.26 3.05 0.15 2.66 0.15 0.39
10 337.8-353.1 345.4 34.77 3.03 0.11 2.66 0.11 0.37
NOTESNA: not analyzed

New Hampshire Pond CoreDr. Clark Alexander, Skidaway Institute of OceanographyResults reported Feb. 24, 2013
Pb-210xs
errorCs-137(dpm/g)
Cs-137error (dpm/g)
Be-7(dpm/g)
Be-7error (dpm/g)
Visual Sediment Description
0.24 0.10 0.020 -0.17 -0.06 mud & organic material0.16 -0.01 -0.004 -0.11 -0.04 mud & organic material0.11 -0.01 -0.003 NA NA medium sand0.08 0.00 0.004 NA NA medium sand0.06 -0.01 -0.003 NA NA very coarse sand0.10 0.03 0.007 NA NA very coarse sand0.07 -0.01 -0.003 NA NA very coarse sand & organic material0.14 -0.01 -0.003 NA NA fine sand0.21 -0.01 -0.003 NA NA fine sand & mud0.15 0.01 0.005 NA NA fine sand & mud

TOP OF BARGE DECK BOREHOLE LOCATION (TYP.) WATER LEVEL
a· 1000' 1500' 2000' 2500' 3000' 3500' 4000' 4500' 5000' 6000' 6500'
BH #13 BH #12 BH #11/EIH #10 BH #9 BH #7
179.5' ~-------------------+--·------------------:T---------------------------·------------------·----------------------------7-----------------·--~
178.83' 178.5' ~------------+---------·----------------~--------------------------~·------------------·--~-----------------+-----+------------~-------~
177.5'
176.5' ~------------+---------·----------------~--------------------------~·------------------·--~-----------------+------------------~----·--~
175.5' ~------------+---------·----------------~--------------------------~·------------------·--~-----------------+------------------~-------~
174.5' ~------------+---------·----------------~--------------------------~·------------------·--~-----------------+------------------~-------~
173.5' ~------------+---------·----------------~--------------------------~·------------------·--~-----------------+------------------~-------~
172.5' ~------------+---------·----------------~--------------------------~·------------------·--~-----------------+------------------~-------~
171.83'
171.5"
170.5' r-----------
169.5' f------------
168.83' 168.5' f------------
167.83' 167.5' f------------
166.5' f-------
165.5' f-------
164.83' 104.83' 164.8:5' 164.5' f-------
163.83' 163.83' 163.5' f-------
162.5' f-------
161.5'
160.83' 100.83' 160.8:1' 160.5' f-------
159.83' 159.83' 159.5' ~----------------------·------------------·------------------------1
158.83' 158.5' ~----------------------·------------------·-----------------------
157.5' ~----------------------·------------------·-----------------------
1!)6.83'
156.5' ~----------------------·------------------·-----------------------
155.83'
155.5" ~----------------------·------------------·-----------------------
154.83'
154.5' ~----------------------·------------------·-----------------------
153.5' ~----------------------·------------------·-----------------------
1!)2.83'
152.5' ~----------------------·----------------------------------------------·------------------·~--~-------------~
151.83'
151.5'
150.83'
150.5' ~----------------------·----------------------------------------------·------------------·----------------------------------------------·--~
BOWERS POND ELEVATION=177.5'
, .. = 2'
VERTICAL SCALE
0 2 4 6 ----- -SCALE FEET
70 oo'
,---- TOP OF BARGE DECK
7500' 8000' 8500' 9000' 9500' 10000'
BH #6 BH #5 BH #4
'
74.33'
71.3~,'
70.33' 70.33'
I 67.3,1'
66.33' 66.33'
63.3,1'
62.33'
HORIZONTAL SCALE
0 500 1000 1500
1" = 500' ----- -SCALE FEET
,--- BOREHOLE LOCATION
I 0500' 11000' "~uu
BH #3
r
66.33'
~ ..H.
62.33'
.H.
58.33'
54.33'
HARRIS POND ELEVATION=90.5'
12000' 12500'
BH #2
"'
68.33'
67.33'
64.33'
63.33'
..
60.33'
59.33'
( ) TYP.
,~(w 13000'
ATER LEVEL
BH #1 I ,....,
88.33' / I
89.0'
88.0'
87.0'
I
I 86.0'
85.0'
I 84.0'
I 83.0'
I
I
I
I
I
I
I
I
82.0'
81.0'
80.0'
79.0'
78.0'
77.0'
76.0'
75.0'
74.0'
LEGEND
ORGANIC MATERIAL
SANDY MATERIAL
D SILTY/MUDDY MATERIAL
~ SEDIMENT/GRAVEL
I 73.0'
I 72.0'
71.0'
I 70.0'
I 69.0'
68.0'
I 67.0'
66.0'
65.0'
I 64.0'
63.0'
I 62.0'
61.0'
60.0'
I 59.0'
I
I
I
I
58.0'
57.0'
56.0'
55.0'
54.0'