boston society of civil engi,neers section american
TRANSCRIPT

ISSN: 0361·087X
----JOURNAL OF THE----
Boston Society of Civil Engi,neers Section
American Society of Civil Engi,neers
•
VOLUME 71 • NUMBERS 1 & 2 • 1985

BOSTON SOCIETY OF CIVIL ENGINEERS SECTION, ASCE
BOARD OF GOVERNMENT, 1985-1986
PRESIDENT
Judith Nitsch (Term expires 1986)
SECRETARY Gerald C. Potamis
Rodney P. Plourde
VICE-PRESIDENTS
DIRECTORS
Steven L. Berstein (Term expires 1987)
TREASURER Lee Marc G. Wolman
Robert B. Barton· Lewis Edgers Ronald E. Sharpin Richard M. Simon (Terms expire 1986) (Terms expire 1987)
ASSISTANT TREASURER Peter J. Majeski
PAST PRESIDENTS Stanley C. Rossier Richard J. Scranton John P. Sullivan
VICE-PRESIDENT, WESTERN MASSACHUSETTS BRANCH Paul H. Kwiatkowski
National Director, District 2, Robert A. Perrault, Jr.
TECHNICAL GROUP CHAIRMEN
COMPUTER Spiro Pollalis
CONSTRUCTION Robert .Ashburn
ENGINEERING MANAGEMENT George D. Gustafson
ENVIRONMENTAL Stephen Geribo
GEOTECHNICAL Bruce Beverly
HYDRAULICS Joseph 0. Elmer
STRUCTURAL Nicholas Mariani
TRANSPORTATION James D'Angelo
WATERWAYS, PORT, COASTAL & OCEAN Athanasios A. Vulgaropulos
JOURNAL EDITOR - Gian S. Lombardo NEWSLETTER EDITOR - Gerald C. Potamis EXECUTIVE DIRECTOR - Dorri Giles
(For Committee Chairmen See Inside Back Cover)

JOURNAL OF THE BOSTON SOCIETY OF CIVIL ENGINEERS SECTION
Contents ========= AMERICAN SOCIETY OF CIVIL ENGINEERS =========
Computerized Monitoring for Leakage Detection in Water Supply Systems
Leslie J. Blythe • • • • • • • • • • • • • • • • • • • • • • • • • • • • • • • • • • • • • • • • • • 3
Slurry Pipelin~s -An Overview Robert R. Faddick • • • • • • • • • • • • • • • • • • • • • • • • • • • • • • • • • • • • • • 35
Composite Beams with Web Openings David Darwin • • • • • • • • • • • • • • • • • • • • • • • • • • • • • • • • • • • • • • • • • 67
Profitability and Productivity of Structural Engineering Computer Systems
Gary R. Koser • • • • • • • • • • • • • • • • • • • • • • • • • • • • • • • • • • • • • • • • • 85
East Boston Wastewater Pumping System Abu M.Z. Alam, Noel D. Baratta, Katina Belezos and William R. Kelley • • • • • • • • • • • • • • • • • • • • • • • • • • 109
Residential Wastewater-Ground Water Interactions in the Vicinity of Mares Pond, Falmouth, Cape Cod
Ralph F. Vaccaro, Nathaniel Corwin and James R. Mitchell • • • • • • • • • • • • • • • • • • • • • • • • • • • • • • • • • • • 123
A Study of Marketing of Consulting Engineering Services to Industrial Firms
Robert J. Carey and James A. Brunner • • • • • • • • • • • • • • • • • • • • • • • • • 147
A NotefromBSCES ...................................... 179
Guide to Authors
I Copyright 1985 by the Boston Society of Civil Engineers Section American Society of Civil Engineers
Published by the Society 236 Huntington Ave., Boston, Massachusetts 02115-4701
(617) 536-2576
Single copies of new issues are $5.00 each.
I
Special Issue Vol. 67, No. 4 is $7.95 in North America and $8.95 outside, postpaid. Single copies prior to Vol. 67, No. 4 are $2.50 each.
Members' subscriptions are part of their dues. This Volume represents combined issues No. I & 2.
VOLUME 71 • NUMBERS 1 & 2 • 1985
180


COMPUTERIZED MONITORING FOR LEAKAGE DETECTION IN WASTE SUPPLY SYSTEMS
INTRODUCTION
3
Leslie J. Blythe1
Water supply systems are vital arteries in the operation of any city, yet
here the age old adage "out-of-sight, out-of-mind" is particul.arly apropos.
The nonhazardous nature of water combined with l.ow retail. water prices
contributed to an attitude where l.arge system l.osses were traditional.l.y
tol.erated. Today, however, problems of deteriorating infrastructure and
costl.y capacity expansion have brought system losses under closer scrutiny. A
program which continually monitors system performance in real time would aid
in establishing a data base for pipeline repair/replacement decisions as well
as conserving water when supply is limited or when the most readily available
sources have already been utilized, These problems are not unique to
utilities with ol.d systems or in isolated geographical areas. On-line
computerized monitoring is thus considered for potential improvements in
network operation and maintenance.
To impl.ement computerized monitoring, the program must be both
technically and economically viable. First, conventional methods of leakage
detection are reviewed to recognize their underlying limitations and identify
the possible advantages of the proposed scheme. A brief system description
follows including the suitability of existing computer and instrumentation
technology. Design hurdl.es and possible difficulties are also addressed. For
economic justification, the benefits of computerized leakage detection must
outweigh the associated costs. To determine so, the methodology for a
benefit-cost analysis is outlined. Lastly, sensitivity of the ultimate
cost justification to several important input variables is taken up. In
conclusion suggestions for future work are offered, The objective through
these steps is to integrate the relevant engineering and economic concepts and
1Freeman Fellow, Parson's Lab for Water Resources, Department of Civil Engineering, Massachusetts Institute of Technology, Cambridge, MA.

4 BOSTON SOCIETY OF CIVIL ENGINEERS SECTION, ASCE
evaluate computerized monitoring for leakage detection in municipal water
supply systems. For a more in-depth treatment of the subject including causes
of pipe failures see Blythe (4).
METHODS OF LEAKAGE DETECTION
Methods of leakage detection have ranged from laissez-faire to active
audits and surveys done on an annual basis. Currently practiced detection
methods will be discussed in order of increasing sophistication.
The so-called "laissez-faire attitude" may perpetuate when the system
performs "well". Despite apparent losses, supply meets demand and there may
be little incentive to locate failures. In such a case, no organized
detection program exists. The utility responds to customer complaints and by
doing so establishes a passive pattern to its detection approach. Standard
practice which responds to emergency items only can escalate the costs of
later rehabilitation (22) and result in large water losses.
A second approach relies on chance discovery. In municipal locations
water mains are normally located in proximity of other utility lines such as
electric cable, underground telephone, gas, fire, or sewer. Service workers
in these areas may detect leaking or broken mains in conjunction with their
work and report any failures. The same applies for highway related
excavations. Additionally, visual surface inspection will prove to be
unreliable since the number of leaks which surface constitute a small
percentage of the total number occurring.
Organized leakage detection programs can be aggregated into four major
approaches. The first employs acoustic equipment; the second conducts a water
audit; the third utilizes correlators, and the fourth applies tracer gases.
The first two are traditional methods, the third incorporates the more recent
state-of-the-art equipment, and the fourth is undertaken in special cases when
other methods cannot be used.
Acoustic devices work on. the principle of sound transmittal. Leaks emit
a characteristic noise allowing identification by an experienced operator.
The general survey is a two part process where distinction is made between
bracketing and pinpointing, pinpointing equipment being of greater precision.

COMPUTERIZED MONITORING FOR LEAKAGE PROTECTION
A district is typically covered by crews of one to three who listen at
consecutive checkpoints in attempt to "bracket" or locate a leak. Several
disadvantages should be noted. Accurate system mapping does not always exist
which complicates the bracketing process (18). Detecting characteristic leak
noises is a skill sometimes requiring 10 to 15 years experience before full
development. Therefore, the use of experienced personnel will ultimately
determine the program's effectiveness.
Even when trained personnel are available, limitations exist. Problems
of sound propagation may occur depending on pipe material (e.g., cast iron,
concrete, PVC) and soil type (i.e., better transmittal in sands than clays).
Large leaks with slow velocities may have a less intense sound and go
unnoticed, while small leaks under high pressure might emit an intense noise
and are detected even though much less water is being lost. Conventional
equipment does not reconcile this pressure-velocity difference. Other
practical difficulties arise because changes in the piping system and depth of
cover will change the characteristic leak noise. In cases of multiple leaks,
one may overwhelm the others and a single leak is perceived.
Another serious problem occurs from background interferences. Traffic,
subways, pumps, construction, and other ambient urban noises may render leak
detection virtually impossible. In an attempt to alleviate these complica
tions, night surveys have been conducted. Overtime charges have increased
the real costs of these maintenance programs, and by and large, they have not
occurred in depressed or high crime regions.
The second major approach taken in traditional leak detection programs is
the water audit. In the audit check point scanning is replaced by flow
metering, and failures are later pinpointed using sounding equipment. An area
is divided into smaller districts and pitometers and/or master meter recorders
are used to determine if a zone's minimum night ratio is above a prespecified
expected level. One immediate shortcoming is that the cutoff ratio is
selected from empirical observations and is not rigorously tested. The issue
of zone decomposition is also an important factor which influences the
accuracy of district metering but has received little attention. Addition
ally, a water audit will not provide accurate enough flow measurements
5

6 BOSTON SOCIETY OF CIVIL ENGINEERS SECTION, ASCE
to determine if inaccurate metering is a major contributor to the problem.
Leak noise correlators represent more state-of-the-art equipment and have
much higher accuracy in pinpointing leaks than tr-a.di tional sounding devices.
The primary advantage of such systems is that they more effectively screen out
background interference noises and are accurate within one to three feet (10),
(31). Improved accuracy is valuable not only in locating leaks which were
previously undetectable, but also in real cost savings through fewer 11dry
hole" excavations. For example, dry hole excavations in New York City
accounted for 10% of street openings (16).
While leak noise correlations are more advanced than traditional
equipment, several disadvantages should be noted. The equipment is expensive
and time consuming which has limited its present use to applications where
conventional equipment has failed or where conventional apparatus cannot be
used. For example, at a rate of 3,7 miles/day, a complete survey is expected
to take five years in Denver (39). Trained personnel are necessary and the
equipment is bulky requiring van-mounting with an associated follow up crew.
For a more detailed treatment of the principles of operation and equipment,
further readings by Field (14) and Arnac (2) are suggested.
The last method of leak detection discussed regards tracer gases. In
general, use of these has been restricted to special cases and to times when
acoustic methods can not be undertaken. Tracer gases are very expensive
primarily due to highly sensitive detection equipment ·or dewatering
procedures. Because tracer gas techniques are not practical ·as part of a
regular maintenance program, no further attention is devoted here.
GENERAL SYSTEM DESCRIPTION
At this point we need a better idea of what computerized monitoring for
leak detection entails and how the system would operate. The first major
departure from conventional methods is that computerized monitoring utilizes
on-line detection rather than periodic surveys. By installing pressure arid
flow gauges at specified locations, a continual record of system operation is
provided. Data becomes available on a 24-hour basis and departures from
11 normal 11 operating levels can be alarmed or printed out. The contrast becomes

COMPUTERIZED MONITORING FOR LEAKAGE PROTECTION
evident; the best of the traditional techniques undertook routine surveys on
an annual basis while the frequency of other audits ranged from one to five
7
years. As has been well documented (30), (35) the possibility for large leaks
going unnoticed over long periods (years) has resulted in huge water losses.
A second.major distinction of computerized moni~oring is that all
measurements can be signaled i.e. telemetered back to a central location. It
does not require that work crews be sent out or scheduled during evening,
early morning, or weekend hours. It also allows updated knowledge on the
entire system rather than updated knowledge on a small segment {~5 miles)
surveyed during any particular day.
To implement a computerized failure identification program, the issues of
instrument placement and system operation must be addressed. The location of
monitoring sites and determination of normal operating pressure and flow
ranges are the two design elements considered here.
Specifying appropriate monitoring sites will depend on the system 0
configuration, network characteristics, and equipment limitations. Regarding
the first, measurements will be required at all branch points, Otherwise, it
would be impossible to preserve the continuity relationship between stations
and determine where losses occur. Individual network features will also
influence the location of monitoring sites. If it is known that particular
zones experience large losses (i.e., geographic "hot spots"), then it will be
more worthwhile to place monitoring devices in these troubled areas given a
limited budget. Without prior information on areas with above average failure
rates, a survey can be undertaken and monitors installed in pipes of greater
importance, where priority ,is established by diameter. The remaining aspect
of gauge placement regards placement density, Namely, how closely should
monitoring stations be spaced, The separating distance will largely be
determined by the equipment accuracy. Instrumentation will function reliably
within a specified distance interval, and spacing will be limited by this
equipment design range.
The second and more difficult design area of computerized monitoring
regards the actual detection parameters. Here we must answer the question of
what are the appropriate alarm levels to indicate system failures while

8 BOSTON SOCIETY OF CIVIL ENGINEERS SECTION, ASCE
allowing for normal variations in pressure and flow, To answer this, failures
are segregated into the two component parts - breaks and leaks. The
distinction is made because the two events differ in nature; breaks are abrupt
while leakage is a gradual deterioration process. Identification of the two
cases will differ, thus requiring both pressure and flow devices.
Commencing with breakage, we need to alarm conditions 01•+.side of the
normal operating range. Both pressure and flow in the network will fluctuate
due to a roughly diurnal water demand schedule (8), (40). Furthermore, demand
can be classified seasonally where summer outdoor uses often attribute to peak
periods. Estimates of the mean and standard deviation demand schedules can be
used to determine normal operating ranges.
The basic idea of the failure detection mechanism is to examine whether
each additional pressure or flow measurement lies outside a specified region
around the estimate of the corresponding mean value (m). This region can be
defined as a multiple of the associated standard deviation (s). If so, a
possible failure event is identified. Subsequent observations will confirm
failure and initiate an alarm. Otherwise, the system is considered to be
operating normally, and the measurement is used to update the mean and
standard deviation estimates. For a discussion and derivation of these
statistics see Blythe (4).
Turning now to the more gradual event of leakage, deterioration will
occur more slowly over time than by a pronounced impact. Consequently,
pressure changes may be too small to detect by short interval comparisons. As
an alternative, simultaneous flow measurements at consecutive monitoring
stations can be used to conduct a water balance where a difference in inflow
minus outflow can be attributed to leakage. Based on pipe class, a threshold
level above which leakage is unacceptable can be defined.
Just as pressure levels fluctuate with the diurnal demand, flow and
leakage rate will also follow the same characteristic pattern. To avoid
repair/replacement decisions based on extreme data, focusing on average
leakage should smooth out these fluctuations. Since, the effects will be more
noticeable for longer periods, measurements should be averaged to record
system decay over time (weekly, monthly, yearly).

COMPUTERIZED MONITORING FOR LEAKAGE PROTECTION
As a final note on operation, computer downtime is sometimes mentioned in
the literature as a significant handicap, However, the applications reporting
problems have much more of a chemical control orientation and are usually in
the treatment sector. Downtime in computerized monitoring results in a loss
of information not quality degradation. The system performs no more poorly
than before program implementation. Problems of downtime are further reduced
by the decentralized nature and possibility to telemeter information to a
central storage bank. In short, this criticism is not perceived to be a real
problem for on-line monitoring.
EQUIPMENT AND AUXILARY SYSTEMS
The equipment requirements and related features of a computerized
monitoring scheme are computer hardware, software, instrumentation (pressure
indicators, flow recorders) and telemetry devices. The general movement in
the computer industry in the recent past has been away from mainframes and
towards the use of microcomputers, where the latter have already been
successfully employed to alarm exceedance limits (15). Rapid technological
hardware advances in this area have had several important consequences, a
major one being a reduction in overall system costs. In response, a market
for software has arisen leading to a variety of available packages at low
costs, The implications of this progress on computerized monitoring in water
supply networks favor a decentralized computer scheme which readily lends
itself to a complex information network with transfers between many sites.
Smaller capacity computer obsolescence is largely unanticipated for two
main reasons. First, they will still be usable in their originally planned
function and second, software compatibility developments, as have already
occured, are expected to continue as larger memory capacity is achieved.
Additional peripheral equipment has also been developed to extend the memory
capacity of smaller models.
The software transformation is equally noteworthy. Previously, programs
were designed for a particular system or for the specific needs of one
application causing large developmental costs and difficult debugging
procedures. Now more general, documented software packages are readily
9

10 BOSTON SOCIETY OF CIVIL ENGINEERS SECTION, ASCE
available at low costs. The trend is away from in-house reliance on a systems
programmer and towards operational ease by water resource engineers and
operators, In fact, Marks and Noonan (20) suggest that at least 75% of
present computing needs can be done without special programming,
Desirable sensor characteristics are reliability, accuracy, little drift,
and infrequent maintenance. Well documented· experience with pressure and flow
instrumentation has occurred in the wastewater industry where the major
problems have been due to "dirty" applications and instrument fouling,
However, problems of this nature should not exist on the supply side, As a
final note on instrumentation, Edwards (13) extends a basic warning regarding
detection of erroneous data. Gradual drift and loss of calibration may go
undetected for long periods if data is directly supplied to the CPU unless
some validity check is incorporated in the process. Dual sensors are
expensive and both may drift and still mutually agree, The suggestion is made
to automatically incorporate calibration checks on-line,
Having obtained•pressure and flow readings, data transmitted is the next
concern. Operationally, a telemetering system connects data sources to a
common location over communication channels. These channels could be
telephone lines, radio links, microwave signals, or power lines, although
phone lines have been most common, Given the number of monitoring stations
and remote locations, water supply systems will involve complex telemetry.
The system described thus far has focused on computerized monitoring,
However, data acquisition only represents one aspect in the range of computer
capabilities, A system might begin with monitoring applications, expand to
analysis, and eventually include on-line control, Alternately, utilities who
presently computerize some aspects of operation may augment their present
functions to incorporate leakage detection. The notion of progressive or
phased computerization is summarized by Figure 1 which also illustrates how a
decision maker can use the results,
In the initial phase (P-1) the automatically collected information can
directly update the inventory of mains in the network on failure record and
operating conditions, This updated inventory can then be used for phase two
(P-2) analysis (e.g., failure rate vs, diameter, age, pipe material, etc.) as

COMPUTERIZED MONITORING FOR LEAKAGE PROTECTION 11
(I) w z ... ~ t,
iii (I) ::iii o_ w Ut-0 (I)
w
± ' I" -,
z Qa: u,w ua ~~
3:1'1.:I ~31NI - -3NIH :::l'1ftol
,,,,✓
t, !z ~---~ :::) g; w o~~ w w ..J
i5 a: fu (/) a:
NVIN - -
5 :;: 0 N ... Q)
& E 8 .... 0 -C: (II
E Q. 0 Q)
> (I)
0
-0 Q) U)
0 ..c: a..
Q) ... ::, 01
LI...

12 BOSTON SOCIETY OF CIVIL ENGINEERS SECTION, ASCE
well as input to the decision maker in modifying design criteria for pipeline
replacements or in estimating and testing predictive models. These models can
then be used to project future maintenance costs. Additionally, results from
the analysis can be used in scheduling repair vs. replacement decisions.
Maintenance can be prioritized according to actual losses on an immediate and
as needed basis when system failures are identified. In phase three (P-3) the
computer and instrumentation can automatically perform control functions.
(e.g., valve or pump shut-off; pump motor speed adjustments). The same
conductors carrying telemetering signals in one direcion can carry control
information in the other, ·although the number of monitored and controlled
points need not be the same. Some applications in the water industry are now
examined to illustrate these points.
COMPUTER AND INSTRUMENTATION APPLICATIONS IN THE WATER INDUSTRY
computers, pressure sensors, flow meters and telemetry have all been used
in wastewater treatment, water quality monitoring, and distribution. Some
uses in the past were motivated by high energy costs. N9w as municipalities
face the prospect of capacity expansion and unaccounted-for-water figures on
the order of 30%, the economic climate may be ripe for computerized leak
detection. Several domestic and foreign programs are examined to cite
examples of the above and to identify future industry trends.
A recent example of a flow monitoring program applied to a wastewater
collection system can be seen by the St. Louis Metropolitan Sewer District
(SLMSD). As part of the public works maintenance program, SLMSD implemented a
low cost, long-term flow monitoring system (28) in response to sewer
maintenance problems - 370 collapses occurred in 1981 alone. Flow sensors
were selected to measure flow, and data were telemetered to a microcomputer
(monitor) over phone lines. The system has been used in design, planning,
infiltration/inflow studies, rehabilitation, and maintenance scheduling.
Computerization has also been useful in water quality monitoring. The
New York State Department of Environmental Conservation has applied a computer
system to data collection, command transmittal, and alarming limits (7). The
system operates under the management by exception principle where

COMPUTERIZED MONITORING FOR LEAKAGE PROTECTION 13
deviations from prespecified norms are displayed for later correction,
The business extensions of computerized systems have saved time,
increased efficiency, and performed tedious calculations., Billing and
accounting procedures have been greatly facilitated where reports p~eviously
requiring days or weeks of preparation can be completed in minutes. An
important use has been in conjunction with preventative maintenance. The Army
Corps of Engineers undertook a study of the network in Buffalo, New York where
a primary objective was to develop a computerized inventory file (11). Once
the inventory is computerized, the network can be analyzed for failure rates
and likely causes. The study also suggested which parameters to encode for
each pipe (19).
Domestically the following three case studies are considered in greater
detail: Philadelphia, Atlanta, and Denver. In addition, selected applications
in England, Japan, and Germany are also examined. Each of these has
implemented forms of computer control in their distribution system.
Development has proceeded in stages, for the most part, in much the same way
as the phased process described in the general system description. Although
specific classification may not follow the phase-one, -two, and -three
breakdown shown in Figure 1, developmental sophistication increases in much
the same way.
The Philadelphia system is undertaking automation and computerization of
its water and wastewater treatment plants. A central facility, called the
Load Control Center (LCC), monitors and controls pump stations throughout the
distribution system, Pressure, flow, water elevation, and chlorine residual
data are telemetered to the LCC by microwave frequency multiplexing via remote
satellite stations (17). Control commands are similarly sent by microwave
radio signals to operate booster pumps, service pumps, and distribution system
valves (9). The following are among the functions performed by the LCC: data
logging, inventory of mains, computerized network mapping, trend analysis,
leakage data analysis, an updating of predictive and a repair/replace model,
s·tray current locating, and frost monitoring (41). The overall program is a
phased development (5 stages) and proceeds from monitoring through complete
automation. Control has focused on chemical feed (water quality) and pumpage

14 BOSTON SOCIETY OF CIVIL ENGINEERS SECTION, ASCE
(energy savings) (27). Conservative estimates of chemical, power, and labor
savings break even with the costs of automation at three to five years (1),
(27). The management information system (MIS) approach to distribution
planning is recommended as well as an infiltration/inflow (I/I) survey (29),
Atlanta's water distribution system is remotely monitored and controlled,
the primary objective being energy conservation and reduced power costs, The
first computer system was installed in 1975 to monitor average and hourly flow
rates and pressures (36), After two years of successful operation, the
decision was made to fully computerize the distribution system which can be
incremented as the network expands, In 1979 a dual computer system was
installed to (i) monitor the system for pressure and flow rate and (ii) to
control remote pumping. Data have been helpful in detecting main breaks,
although this was mentioned as secondary. The central computer generates
reports automatically and alarms high and low exceeded limits, No major
maintenance or programming problems were reported,
The last domestic application addressed pertains to automation in the
Denver system. Denver has undergone a phased development since the
1950 1 s when pump stations were automated. The first efforts focused on power
conservation as in some cases above. Later phases were aimed at computer
operation of the distribution system and automation of the treatment plant
facility (7). The centralized system is broken down into two parts, data
acquisition and process control. Dual computers divide the two functions and
provide redundancy in the event of a power failure (25), Remote multiplexing
has lead to faster response times. Economic justification was based primarily
on power savings, process efficiency, and valid data collection.
In the late 1950 1 s a 15 year program was designed in Sugarbrook, England
to minimize costs for the East Worcestershire Waterworks Company (EWWC) supply
network. Today the system is fully automated where minicomputers are used in
monitoring and remote control (21). Telemetering successfully utilized radio
links (where only one 12 minute interruption occurred in 10 years). The aim
of the control scheme was to minimize pump costs, and 5% order of magnitude
savings were noted. Operators supervise and check for abnormalities such as
main bursts. However, before automation progresses to this area, it was felt

COMPUTERIZED MONITORING FOR LEAKAGE PROTECTION 15
that further study was required.
The Wessex Water Authority (England) extends the aim of minimizing pump
costs to include locating and reducing water loss by pressure and flow control
(21), Although the pump control scheme is not as sophisticated as that of the
EWWC, prediction is also applied to pressure and flow control with "striking
results in savings on distribution losses",
Other on-line computer systems have been implemented in England, One
fairly sophisticated system in Hamburg utilizes multi-processors (12),
Routine tests performed include data scanning and limit checks of all
monitored inputs, Exceeded limits are alarmed and logged. The system can
recognize pipe ruptures, initiate corrective action through pump and valve
control, and compute fault frequency statistics.
Ongoing British research in automation is being conducted by the Water
Research Centre for the utility industry. A five year'program was established
by the National Water Council, a large part of which addresses leakage and
detection in distribution systems. Particular focus is being given to
accurate measurement of pressure and flow distributions and to automatic
analysis of leak data. Full-scale facilities in water distribution,
treatment, and sewage treatment to test instrument control and automation
specifications are planned. The potential for on-line leakage detection has
also been recognized in Japan where the need to incorporate preventive
maintenance control into a computer hierarchy has been emphasized (26).
Work in Germany has applied leak detection and localization to both
compressible and incompressible fluids. Small leaks in gasoline pipelines
have been isolated using pressure drop and flow rate measurements, and the
technique can also be applied to water mains (33). Utilizing cross
correlation, this technique has been implemented on a microcomputer and tested
on a gas line under actual operating conditions (34). Setting up an
artificial leak to obtain system specific data is suggested. This application
represents the closest parallel to computerized monitoring for leak detection
and a strong evidence of operational feasibility.
To conclude this section on applications, what we can extract from
experience in the water industry is that the technology exists, that it has

16 BOSTON SOCIETY OF CIVIL ENGINEERS SECTION, ASCE
been successfully implemented in varying degrees of sophistication, and that
expected future trends will proceed along the lines of expanded automation.
In the next section the benefits and costs of computerized monitoring are
identified to determine if financial incentive is provided.
BENEFIT-COST ANALYSIS
In evaluating the program's economic viability, two perspectives can be
taken depending on the utility's ownership, namely municipal (government) or
investor (private) with the breakdown in the U.S. being roughly 70-30
respectively (32). In the government owned case, maximizing social welfare is
the appropriate criterion while under an investor owned scenario net gains to
shareholders determine worthwhile investments. The real difference between
these perspectives is not so much a generic identification of benefits and
costs but rather a question of where the boundaries are drawn. In either case
maximizing net present value will measure the economic gain.
The net present value criteria measures economic viability through
monetary benefits exceeding the costs. Future dollars are discounted to
account for current investment opportunities. The discount rate can also
account for risk in that a safe dollar is worth more than a risky one.
Additionally, risk can be incorporated by taking a range of benefits and costs
with an associated probability density function to arrive at an expected
value.
Benefit-cost analysis forces one to define and quantify the benefits and
costs associated with the project. Transfers should not be included while any
externalities should. Benefits and costs are classified as direct or
indirect, direct being a primary result of the project while indirect
measuring secondary impacts. Benefits and costs are assessed using market
data where available. Where market inefficiencies occur or when no market
exists I shadow prices can be employed to reflect 11 true costs". This can be
particularly important in valuing water which has traditionally been
underpriced. In the absence of a market, impacts such as water quality, human
health, or inconvenience may be exceedingly difficult to quantify. These
indirect effects, however, may be important, and an analysis which avoids

COMPUTERIZED MONITORING FOR LEAKAGE PROTECTION 17
mentioning them at least qualitatively will under or over state the actual net
benefits. Using creative measurement techniques, some of the problems can be
avoided.
Traditionally, a variety and a combination of investment criteria have
been used in deciding if a project should be undertaken and how to prioritize
or establish rank among competing alternatives. These criteria include
payback, average book return, internal rate of return, the benefit-cost ratio,
and net present value (NPV). Limitations of the first four are well
documented (6), and we conclude in support of NPV.
To measure NPV, the benefits (Btl and costs (Ctl in each period tare
projected. Since we are interested in improvements generated by the project,
aggregate benefits must be greater than total costs. To compare this net
effect today, future forecasts are weighted by an appropriate discount rate
(r), Net present value is thus given by
where
NPV
t -
t ~
NPV
B - C 0 0
Bl - Cl + ---- + l+r
0 initial period,
n project life (typically
> 0 + Project adds value
years).
to the utility or
NPV • 0 .. Project does not change the existing
NPV < 0 + Project contributes no net gains.
n B - C L t t t•o ~•
increases welfare.
status quo ..
It is not the intention here to create NPV as the panacea of investment
decision making. Cash flow estimates may be difficult to reliably forecast,
and there is the never ending debate on selecting an appropriate discount
rate. However, NPV is based on a sound theoretical framework and does not
suffer from the shortcomings of other criteria, In the final evaluation
sensitivity analysis is suggested to see how responsive the results are to
changes in uncertain inputs.
A specific evaluation can only be done for a particular municipality.
The results and ultimate decision are subject to system dependent inputs where
the economic justification ia determined by the level of leakage, water
pricing, water treatment and pumpage (energy) costs. The results from one

18 BOSTON SOCIETY OF CIVIL ENGINEERS SECTION, ASCE
city (utility) can not be applied to another unless the basic inputs are
analogous, Additionally, depending on whether a public or private perspective
is appropriate, values for discount rate, benefits, and costs will differ.
Consequently, an overall methodology to carry out a detailed analysis is
undertaken here,
To present this overall methodology, a general slate of benefits and
costs generated from computerized monitoring is defined, and steps for their
measurement are itemized, Benefits are taken up first, for certainly if these
are found to be insignificant, there is no need to conduct detailed cost
estimates, The discussion of costs follows with the same progression from
direct to indirect,
Direct Benefits
The direct benefits of computerized monitoring are considered as the
potential cost savings over existing practice. When compared to conventional
methods, these primary benefits result from prompt failure identification,
Leaks and breaks which could previously go undetected for years and lose vast
quantities of water (on the order of 106 gallons per day; (30), (35)). This
brings us to the first direct benefit considered - the value of water saved.
The value of water saved is based on two dominant variables: (i) the
quantity of water lost and (ii) the price of water, Estimating the quantity
of water lost is addressed first, and water pricing is discussed in the
sensitivity analysis section, The quantity of water lost depends on the
number of system failures, the leakage rate, and the time until detection and
repair. Two levels of maintenance programs are considered, active and
passive, to show how the amount of water lost can be estimated for each.
We begin with the simpler case of an active leak detection program where
good maintenance records have been kept, Given this data, the number of
system failures can be estimated, If a sufficiently long historical record
exists, it can be used for parameter estimation of a model predicting the
expected number of failures in future years, The records should also contain
the approximate leakage rates which can then be used to come up with an
average leakage rate (gpm) for the system, Knowing the approximate number of

COMPUTERIZED MONITORING FOR LEAKAGE PROTECTION 19
failures and average leakage rate, the last required estimate is duration.
In general, the time to detection will depend on the failure intensity
and the method of detection. For major breaks or serious outages customer
complaints will be reported even without·a monitoring program; the event is
assumed to be so severe as to be noticed within hours. However, the smaller
magnitude leaks may go undetected for long periods and it is primarily these
where monitoring will make a real difference. Once identified, the repair
time is taken to be the same with or without on-line monitoring and therefore
it is not pertinent in the comparative analysis.
With respect to maintenance programs, detection time is a direct function
of survey frequency. For example, if a sounding program is undertaken every
two years, then an upper bound on the maximum time before detection is
provided (ignoring deficiencies of surveys and sounding devices). A more
realistic approach might use the average time between surveys and is suggested
here. In the next section, we examine the economic feasibility vs. the
quantity of water lost which will be a very useful measure in light of the
duration argument above.
Greater difficulties are encountered in passive maintenance programs due
to the lack of data and routine surveillance. A rough way to quantify the
amount of water lost is through the unaccounted-for-water (UFW) estimates. By
examining the fraction of total UFW attributable to leaks and breaks and
having defined the degree of "allowable" leakage (i.e. that level below which
it is uneconomical to detect and repair), an estimate of economically
recoverable water loss can be obtained by the difference. The main problem
with this method is that total UJ<'W estimates may be very inaccurate and the
fraction assigned to failures even more so.
As an alternative to deriving a water loss estimate from UFW, some
engineering studies have derived results based on different assumptions. In
the Boyle study (5), the number of leaks and average leakage rate were based
on agency interviews and a demonstration project. A two-year duration was
assumed in calculating benefits. Using utilities with detection programs as a
reference, the rationale given was that small leaks could go longer without a
detection program while large leaks would be detected sooner. In

20 BOSTON SOCIETY OF CIVIL ENGINEERS SECTION, ASCE
the absence of better data, this duration assumption does not appear to be
unreasonable. In Boston's MDC Demand Management Report (37) only losses from
main breaks were directly estimated, The number of breaks used was obtained
from city records, While these numbers may be justified for main breaks,
lower level leakage is not included in this category, No attempt was made to
estimate each of the quantity components (number, rate, duration), Instead a
variation on the UFW approach was taken (called a flow profile in that
context). An aggregate estimate for savings from 10 communities was derived
rather than individual assessments, despite the wide variety in maintenance
programs,
Given a lack of data, what can be said about intercity comparisons and
extracting information from one city for use in another? If statistical
information is based on pipes of the same characteristics (e.g., material,
diameter, age, or age span} and if operating environments are similar, then
data on the number of breaks per length should be useful in the network
lacking data, Likewise, average leakage rates should be transferable, On the
other hand, the time until detection should reflect the particular maintenance
program. This approach offers advantages over the UFW estimates since the
potential for errors in the latter is large, It also provides more reliable
and justifiable estimates than by straight assumptions.
Lacking reliable data, information from actively maintained systems can
be transferred to systems of passive maintenance, Instead of reducing water
loss estimates to a single number, one can obtain (by regression analysis of
break frequency on significant variables) the most likely range of variation
for a given class of pipe and evaluate the effects on a probabilistic basis,
Uncertainty in the estimate is therefore 'directly encoded.
Once the quantity of water saved has been established, two other direct
benefits can be computed as a result of these savings, These are reduced
energy and chemical costs which will vary for different utilities, Typical
cost estimates are sometimes quoted but should be verified for a particular
system, The estimates, however, are straightforward to obtain,
In addition to the above, the last direct benefit discussed is delayed
capacity expansion. Construction of new facilities can be deferred because

COMPUTERIZED MONITORING FOR LEAKAGE PROTECTION 21
the water savings are like an effective decrease in total demand.
Alternatively, this can be viewed as an effective increase in capacity
allowing the postponement of capital expenditures. Given investment
opportunities, the value of deferred system expansion can be approximated for
a community of projected growth rate and future demand. Potentially
preventing lost water, saves on power, chemical, and capacity expansion
costs. We now turn to the indirect benefits which indeeq are numerous.
INDIRECT BENEFITS
One area for benefit realization is reduced infiltration/inflow (I/I).
Leaks from the water supply network find their way into the storm and sewer
system thereby increasing the required waste handling and treatment capacity.
On a nationwide basis it has been estimated that one-half of all wastewater
treated is attributed to I/I (28), a fraction of which is due to leakage.
While the previous focus has been on the supply side utility, the treatment
industry will also benefit from the program. Sometimes these two utilities
fall under the same jurisdiction in which case reduced I/I would be a direct
benefit. The cost savings will depend on the amount of reduced I/I and the
associated treatment costs.
A second area for utility cost savings can result from fewer lawsuits.
Liability for property damage has varied with the case, but the established
precedent has been ·to prove a utility's negligence. With a monitoring program
in place, not only should there by less ensuing damage but the utility will
also have stronger grounds to win its cases. The costs of litigation are high
and difficult to predict. To estimate cost savings, previous legal fees
(attorneys, courts, and awarded claims) should be examined. Depending on the
degree of on-line implementation, an average of previous expenses could be
reduced by roughly the same propo.rtion as program development. This procedure
assumes that damages are virtually eliminated which is not unreasonable if
data are frequently reported and repairs are prompt.
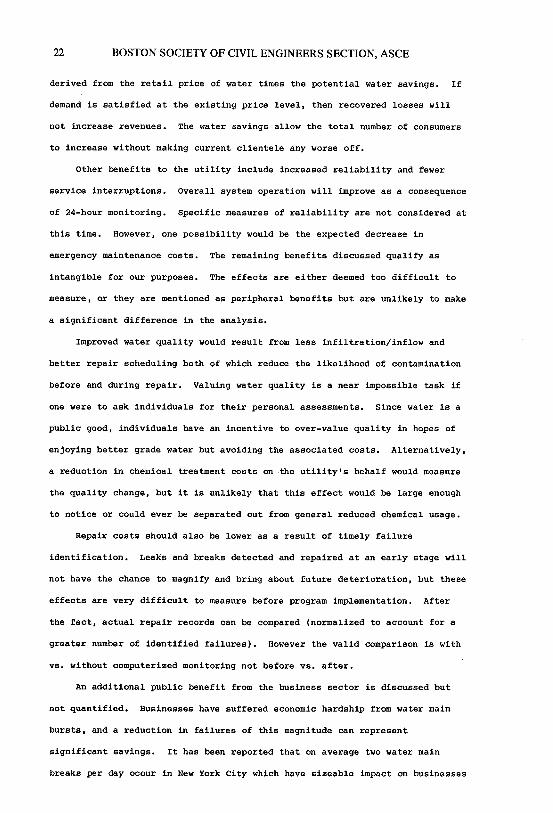
Another benefit to the utility includes increased revenues. Increased
revenues represent income from water which would otherwise be lost, provided
that demand exceeds supply (as in the western U.S.). An estimate can be
22 BOSTON SOCIETY OF CIVIL ENGINEERS SECTION, ASCE
derived from the retai1 price of water times the potentia1 water savings. If
demand is satisfied at the existing price 1eve1, then recovered 1osses wi11
not increase revenues. The water savings allow the total number of consumers
to increase without making current c1iente1e any worse off.
Other benefits to the uti1ity include increased re1iabi1ity and fewer
service interruptions. overa11 system operation wi11 improve as a consequence
of 24-hour monitoring. Specific measures of re1iabi1ity are not considered at
this time. However, one possibi1ity wou1d be the expected decrease in
emergency maintenance costs. The remaining benefits discussed qualify as
intangible for our purposes. The effects are either deemed too difficu1t to
measure, or they are mentioned as peripheral benefits but are unlikely to make
a significant difference in the analysis.
Improved water quality would result from 1ess infiltration/inflow and
better repair scheduling both of which reduce the 1ike1ihood of contamination
before and during repair. Valuing water quality is a near impossible task if
one were to ask individuals for their personal assessments. Since water is a
pub1ic good, individuals have an incentive to over-value quality in hopes of
enjoying better grade water but avoiding the associated costs. Alternative1y,
a reduction in chemical treatment costs on the utility's behalf would measure
the quality change, but it is unlikely that this effect would be large enough
to notice or could ever be separated out from general reduced chemica1 usage.
Repair costs should also be 1ower as a result of timely failure
identification. Leaks and breaks detected and repaired at an early stage wi11
not have the chance to magnify and bring about future deterioration, but these
effects are very difficult to measure before program implementation. After
the fact, actual repair records can be compared (normalized to account for a
greater number of identified failures). However the valid comparison is with
vs. without computerized monitoring not before vs. after.
An additional public benefit from the business sector is discussed but
not quantified. Businesses have suffered economic hardship from water main
bursts, and a reduction in failures of this magnitude can represent
significant savings. It has been reported that on average two water main
breaks per day occur in New York City which have sizeable impact on businesses

COMPUTERIZED MONITORING FOR LEAKAGE PROTECTION 23
(23). In many instances commercial/retail shutdown is temporarily required.
The devastating effect of a main break during a seasonal peak period in New
York City's garment district exemplifies this point (26). Numerous other
instances could be sited, but the locations and durations all lead to
different displacement and damage costs. Having convinced ourselves that the
potential benefits are indeed significant, we now consider the corresponding
costs.
DIRECT COSTS
The direct costs of computerized monitoring are fairly straight-forward
to identify generically and are attributed to equipment purchases,
installation, operation and maintenance, and staff training. All of these
primarily focus on detection. Leakage control requires that identified
failures are corrected, and the corresponding repair cost should also be
considered. In general, the direct costs like the direct benefits will be
system specific depending on the project design, system size, and degree of
implementation.
computer hardware costs will primarily be a function of the number of
decentralized and central read out units where estimates can be obtained from
equipment manufacturers. An examination of existing software packages will
determine suitability of different equipment brands. Many of the computerized
applications include cost summaries, but these either differ too widely or are
too outdated to be useful.
Pressure sensors and flow recorders are the next major items on the cost
schedule where cost depends on the number for optimal placement throughout the
system. Once it has been regionally decided where to implement monitoring,
costs can be solicited from manufacturers. Since excavation for placement
will be a large component, the comparison should be made on installed basis.
The third major area of cost appraisal involves telemetering. Once the
number and location of monitoring sites are known, the telemetering equipment
options can be examined, Many of the most economical applications cited in
the literature have multiplexed over rented phone lines. In the absence of
nearby lines, other communication channels must be examined and priced out.

24 BOSTON SOCIETY OF CIVIL ENGINEERS SECTION, ASCE
Additional costs include related equipment such as multiplexers and
transmitters. Again costs and options can be obtained from manufacturers.
In conjunction with installed equipment costs, opera ting and maintenance
(O+M) cost estimates should be estimated. These estimates can then be
compared to manufacturer's actual service records for similar applications
where available. While an analogous system is unlikely to exist,
installation listings should reveal parallel components in other systems where
service histories and repair records can improve cost estimates. Any
additional wages of operators should also be included.
Failure correction is the last direct ·cost considered as part of the
network maintenance program. Having identified leak/break locations, they
must be fixed either by repair or replacement for the overall plan to be
effective. There is no reason to believe that the repair or replacement costs
for computerized monitoring should differ from other leak detection methods.
Departures occur in the method of detection not the corrective action taken.
Walski (38) has approximated these cost functions for water supply systems,
INDIRECT COSTS
The indirect costs identified are not numerous but capture important
consequences such as possible displacement or disruption to the public and
difficulties the utility might experience in implementation. The first two
may be quite significant and the last items are included for completeness.
Perhaps the most important externality to the public reg~rds the method
of financing. If the government (state or federal) provides any grants or low
interest loans, this is a subsidy which occurs at the taxpayers• expense. The
utility receives a direct benefit, but taxpayers pay the bill. Because this
situation represents a transfer, it is not quantified. However, the
distributional effect should be overlooked.
A second major indirect cost regards public inconvenience during
instrument installation. Monitoring devices are placed on-line in the
distribution network which will require considerable disruption in heavy
traffic areas. Customer service will be interrupted and it may take years to
complete a full project implementation. No attempt is made to quantify
COMPUTERIZED MONITORING FOR LEAKAGE PROTECTION
inconvenience or disruption here. However, these effects will be sizeable.
(For a discussion of travel time inconvenience valuation see Mishan ( 24). )·
25
The next displacement considered is drawn from the investment side of the
evaluation. Economic arguments have been made that a proposed project should
consider the opportunity cost of public funds, and theoretically this is
true. However, an opportunity cost rationale can be incorporated through the
discount rate, where the opportunity cost is measured by the amount of
displaced consumption and investment. Consequently, the opportunity cost is
not tabulated as a cost in its own right but can be implicitly considered in
discounting.
As impedences to carrying out a computerized program, a.shortage of
technical personnel and operator resistence are sometimes mentioned. With
respect to the former, concern is justified in the short run, but training
should eliminate some of the new demand for skilled labor. Regarding operator
resistance, reorientation of present staff would hopefuly eliminate any
employee fears and attempted barriers.
This completes the discussion•of costs and benefits. Sensitivity of the
analysis to uncertain or variable inputs is considered in the next section.
SENSITIVITY OF THE DECISION TO INPUT VARIABLES
Having identified the inputs for the benefit-cost analysis, we now
examin, how these values will determine project feasibility. Namely, how
changes in the inputs can alter the decision to go ahead with project
implementation, If significant price changes occur, the net gains at some
future time may be sizeable even if the project is not justified by current
standards. First, changes in the value of water are considered by examining
the amount of water lost and the price of water. Then, changes in computer
equipment, energy, and chemical costs are discussed. Lastly, different levels
of discount rate and project design life are incorporated by looking at the
parameters over actual values for selected U.S. cities.
For municipalities with low levels of leakage, present implementation is
not likely to be justified, at least on a city-wide basis. If particular
geographic 11hot spots" exist, then the program may be feasible for small scale

26 BOSTON SOCIETY OF CIVIL ENGINEERS SECTION, ASCE
development, on the other hand, areas experiencing large water losses are
likely to incur sufficient savings to offset the costs of capital investment.
Insufficient current cost savings do not rule out future via.bility. Small
leaks may undermine bedding, precipitate freezing, .or bring about greater
system failures if uncorrected. In short, condition of the physical system is
not static, and the decision may change in time or over geographic boundaries.
One of the problems facing both public and private utilities is
ineffective water pricing. The price of water in the majority of cases
is set artificially low and does not reflect the true cost of providing
service. By and large, water has not been viewed as an economic good,
and the conventional approach has been to treat it as a requirement rather
than a quantity demanded. Costs should be assessed on an incremental basis to
insure price reflects the cost of the last unit consumed, otherwise known as
marginal cost pricing. When water is underpriced, there will be little
economic incentive to prevent system losses, and this in turn will influence
the maintenance program.
Additionally, computer costs enter the analysis as determinants of the
direct benefits and costs, As technology expands and more software is
developed, costs in the computer industry will decrease, Indeed, this trend
has been observed in the past, and if prices drop, a program currently
unjustified by the NPV criterion may be worth implementing at a future date.
Changes in energy pumpage and chemical treatment cost levels should also
be considered. Increases in these, which are likely to occur given
inflationary pressure, will bring about greater cost savings as more water is
conserved.
Choices of project life and discount rate determine how benefits and
costs are accrued. Project life specifies the period over which benefits and
costs are forecasted, and discount rate establishes how heavily those benefits
and costs are weighted. For long term projects differences in project life
are expected to be small since the distant effects are most heavily discounted
and thus contribute relatively little to the overall net effect. In the next
.section a range of typical values for several of the above inputs is used to
show how the decision to implement computerized monitoring might change.
COMPUTERIZED MONITORING FOR LEAKAGE PROTECTION 27
EXAMPLE OF SENSITIVITY ON THE VARIABLES USING SELECTED U.S. CITIES
We would like to define the threshold above which the best decision is to
implement the project. The threshold marks the point of indifference where
computerized monitoring just covers its costs but generates no additional
savings (i.e., NPV = 0). Once project costs are known, they can be compared
to the present value of benefits at particular levels of the variables to
assess feasibility.
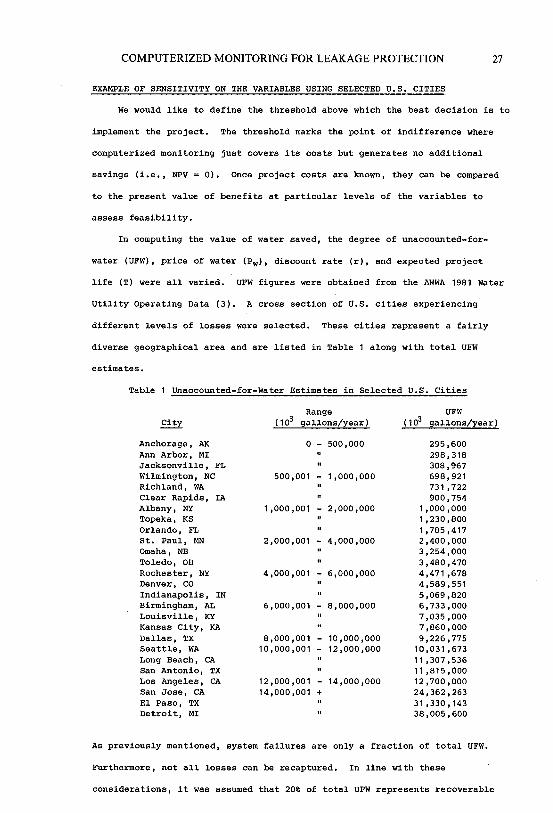
In computing the value of water saved, the degree of unaccounted-for-
water (UFW), price of water !Pwl, discount rate (r), and expected project
life (T) were all varied. UFW figures were obtained from the AWWA 1981 Water
Utility Operating Data (3). A cross section of U.S. cities experiencing
different levels of losses were selected. These cities represent a fairly
diverse geographical area and are listed in Table 1 along with total UFW
estimates.
Table 1 Unaccounted-for-Water Estimates in Selected u.s. Cities
Anchorage, AK Ann Arbor, MI Jacksonville, FL Wilmington, NC Richland, WA Clear Rapids, IA Albany, NY Topeka, KS Orlando, FL St. Paul, MN Omaha, NB Toledo, OH Rochester, NY Denver, CO Indianapolis, IN Birmingham, AL Louisville, KY Kansas City, KA Dallas, TX Seattle, WA Long Beach, CA San Antonio, TX Los Angeles, CA San Jose, CA El Paso, TX Detroit, MI
Range (103 gallons/year)
0 - 500,000
500,001 - 1,000,000
1,000,001 - 2,000,000
2,000,001 - 4,000,000
4,000,001 - 6,000,000
6,000,001 - 8,000,000
8,000,001 - 10,000,000 10,000,001 - 12,000,000
12,000,001 - 14,000,000 14,000,001 +
UFW ( 103 gall.ans/year)
295,600 298,318 308,967 698,921 731,722 900,754
1,000,000 1,230,800 1,785,417 2,400,000 3,254,000 3,480,470 4,471,678 4,589,551 5,069,820 6,733,000 7,035,000 7,860,000 9,226,775
10,031,673 11,307,536 11,815,000 12,700,000 24,362,263 31,330,143 38,005,600
As previously mentioned, system failures are only a fraction of total UFW.
Furthermore, not all losses can be recaptured. In line with these
considerations, it was assumed that 20% of total UFW represents recoverable

28 BOSTON SOCIETY OF CIVIL ENGINEERS SECTION, ASCE
losses. This assumption was only made for illustrative purposes; recoverable
losses must be assessed for a particular system.
The retail price of water was likewise obtained by referencing the 1981
Water Utility Operating Data (3) and different literature citations. A range
of $0.50/1000 gal to $2.00/1000 gal (in $0.50 increments) includes the average
rate of most cities. Since retail values alone can be misleading, marginal
costs of 5.00, 10.00, and 15.00 $/1000 gal were assumed to include the costs
of capacity expansion for illustrative purposes of the calculations.
Similarly, these must be verified in an application. Since present value was
found to be a linear ·function of the price of water (Figure 2), a marginal
cost comparison can be done by extrapolation.
A discount rate of 5 - 17.5% was selected to include reasonable estimates
of both public and private sector evaluations. The lower range of 5 - 10% was
chosen for public evaluations while the upper range of 10 - 17.5% should be
reasonable for the investor owned case. Present value was estimated at every
2. 5% interval.
Lastly, given uncertainty on how long equipment will satisfactorily
operate, sensitivity is carried out for the expected project life. A range of
15 to 50 years was selected in 5 year increments.
Results of the various present value calculations are summarized by
Figure 2. To assess the sensitivity, one variable was changed while holding
the others constant at a representative value. These values, considered to be
the nominal case in the present value calculation, are as follows: 3 billion
gallons UAW, 10% discount rate, $1/1000 gallons retail water price, and 25
year expected project life. Other nominal values would result in a parallel
shift of the curves.
Looking at Figure 2, it can be seen that the decision strongly depends on
discount rate and water price but is not very sensitive to project life. UFW
estimates will also influence the outcome, but the magnitude of these is so
large that errors of this scale are unlikely. To illustrate these
sensitivities, we examine how much each variable must change to produce an
equivalent impact on present value.
A 5% error in discount rate (say from 5-10%) would result in a $3 million

COMPUTERIZED MONITORING FOR LEAKAGE PROTECTION 29
II
"' 10
ID 0
9
>C 8
~ 7 a, > C 6 (/) .. 5 a, - 4 C
~ 3 -0 2 > Q. I
0
0
0
UFW or Pw
T
Input Var ioble
05 2 3 4 5
5 12.5
UFW (1()9 go I)
l----1---4--,1---1--11--1-&---1--lf--l-&---l-4-,1-+-- r (%) 6
15 20 1----1---4--1-o--1--o-1--o---1-o-1--1-<..+-1--o-- T ( yea rs l
25 30 40
0 0.5 1.5
_ _.___,. __ ......___.'--_......___. __ _.___.'--_ __...pw (S /100090 I)
2
UFW = Unai:coun t - for - Water Pw = Price of Water T • Expected Project Life r = Discount Rate
Figure 2 Sensitivity of the Present Value of Water Saved to Input Variables

30 BOSTON SOCIETY OF CIVIL ENGINEERS SECTION, ASCE
underestimate of benefits in the present value calculations. The decision is
thus highly sensitive tor at the low range encountered in public evalua
tions, Within the private realm discount rate is not quite so sensitive. The
same 5% error (only this time in the 10-15% interval) results in a $1.5
million underestimate which is still significant but not as critical.
A $3 million present value misestimate can also occur from $0.50/1000 gal
underpricing in retail water values, Given existing practice of artificially
low water rates, this represents a serious problem if the evaluation is based
on current price structure, As mentioned, an efficient evaluation would use a
price equal to marginal cost strategy, Capacity expansion is thereby
incorporated. (This is consistent with the concept of shadow pricing.}
UFW follows the same linear pattern as water price; however, the
horizontal axis differs in magnitude. The reference $3 million FV error would
result from 1,5 billion gallon UFW inaccuracy. While the decision to
implement is sensitive, it is unlikely that an error of this magnitude would
occur. From Table 1, 1,5 billion gallons is larger than some of the total UFW
estimates. For cities at the upper end of the loss scale, a 1,5x10⁹ loss
might be possible, (For example, this is approximately 4% of the amount
reported for Detroit,) Care should be taken in reviewing total system losses
before this sensitivity is applied or dismissed.
Finally, expected project life is varied over a 15 to 50 year design
period, The entire range roughly accounts for a $1.3 million PV difference.
The change in benefits between 5 year intervals is not large or very
significant provided equipment need not be replaced, These results make
intuitive sense from the PV equation. Distant future events are more heavily
discounted and therefore benefits (or costs) at this horizon make little
contribution.
CONCLUSIONS AND SUGGESTIONS FOR FUTURE WORK
Given sizeable water losses in urban distribution systems, attention for
corrective action focused on leaks and breaks since they are large
contributors to the problem of unaccounted-for-water. Because UFW estimates
can be very unreliable, future attention should also be directed towards meter

COMPUTERIZED MONITORING FOR LEAKAGE PROTECTION
maintenance programs and towards more extensive metering especially in the
public use category.
31
Conventional leakage detection techniques have some underlying
limitations such as background noise level interference, reliance on operator
skill, and infrequent survey frequency. With these limitations in mind,
computerized monitoring was proposed. On-line detection offers the advantage
of prompt failure identification and large corresponding water savings.
Drawing on instrumentation experience and computer applications in other areas
of the water industry, parallels to demonstrate technical feasibility can be
drawn.
Before detailed costs can be worked out, additional study is needed to
make specific instrumentation and equipment choices. Basic pressure and flow
sensors are well established, but detailed comparisons of individual types and
models will be required for an application of the magnitude involved.
Likewise, careful examination of telemetry options should be undertaken.
Structuring the computer system will be a major effort needing future
research. On-line monitoring is essentially an information network. How the
network will be put together, the level of interaction between decentralized
computers and a central data bank, and the number of pipes each computer can
handle are all crucial but still undetermined design issues.
Once the technical evaluation has been completed, the benefits and costs
can be quantified to determine economic feasibility. Using the net present
value criterion, benefits greater than costs justify program implementation.
These benefits and costs were defined along with procedures for estimating the
tangible effects.
The largest expected benefit is the value of water saved, a quantity
determined to be highly sensitive to discount rate (especially in the lower
range of public evaluations), and to the price of water, Sensitivity to UFW
can be considered as moderate and depends on the magnitude of losses. The
expected project life beyond a 25 year design period has little effect on the
decision to implement. The largest expected costs are associated with
computer equipment and instrumentation. The final results and ultimate
decision are system specific, Results for the same system may even change

32 BOSTON SOCIETY OF CIVIL ENGINEERS SECTION, ASCE
over time as greater losses evolve or if price structure changes.
To arrive at a definitive conclusion, the evaluation must be undertaken
for a particular city. Computerized monitoring represents a potentially
viable technique for failure identification and addresses the issues of
technical and economic feasibility on a preliminary basis. What is now called
for are more in-depth analyses on the specific design issues and cost
assessments. As more information develops, we can look to developing
standards for leakage measurement and better estimating techniques for
"allowable" leakage. Here one step is taken in the direction of an effect! ve
maintenance program and towards improved distribution control.
ACKNOWLEDGEMENTS
I would like to extend my sincere thanks to the John R. Freeman Fund
Committee for their support and financial assistance and to Professor David
H. Marks at Massachusetts Institute of Technology for supervising the related
thesis work.
REFERENCES
1. Andrews, J.F. et. al., "Computer Application in Water and Wastewater Management: A Panel Discussion, J. Am •. Wtr. Wks. Assoc., 69(5), 1977, 246-255.
2. Arnac, P., "A New Method of Leak Detection in Distribution Systems Under Pressure", Aqua, No. 3, 1982, 410-417.
3. AWWA, 1981 Water Utility Operating Data, Denver, 1981, 268 p.
4. Blythe, L.J., Leak Detection Technology: A Benefit-Cost Appraisal of Computerized Monitoring in Water Supply Systems, Master's Thesis, Massachusetts Institute of Technology, 1984, 157 p.
5. Boyle Engineering Corp., Municipal Leak Detection Program Loss Reduction - Research and Analysis, California Dept. of Wtr. Resources Office of Water Conservation, August, 1982, 110 p.
6. Brealey, R. ands. Myers, Principles of Corporate Finance, McGraw-Hill Book Co., New York, 1981, 794 p.
7. Bugliarello, G. and F.J. Gunther, Computer Systems and Water Resources, Elsevier Scientific Publishing Co., New York, 1974, 202 p.
8. caves, J.L. and T.C. Earl, "Computer Applications: A Tool for Water Distribution Engineering", J. Am: Wtr. Wks. Assoc., 71(5), 1978, 230-235.
9. City of Philadelphia, PA Water Revenue Bonds, Eighth Series, Nov. 15, 1982.

COMPUTERIZED MONITORING FOR LEAKAGE PROTECTION 33
10. Cole, E.S., "Methods of Leak Detection: An Overview, J. Am. Wtr. Wks. ~. 71(2), 1979, 73-75.
11. Deb, A.K., zementsch, C., and J. McElhaney, "Need for Rehabilitation of Nation• s Aged Water Systems: A case Study", Proceedings of AWWA ~ Annual Conference, 143-162.
12. Dowler, E,, "Computers in the Water Industry", Water and Waste Treatment, 23(7), 1980, 26, 28, 31.
13. Edwards, s., "Experience in Instrumentation Rehabilitation and the Need for Reliability", in S.H. Jenkins, ed., Progress in Water Technol.ogy, Vol. 9, Nos. 5/6, Pergamon Press, New York, 1977, 7-8.
14. Field, D.B., "Location of Underground Leaks Using the Leak Noise Correlator", Aqua, No. 7, 1980, p. 21-22.
15. Gilman, H,D., "Computer Operation - Save Energy in Water Treatment", Proceedings of AWWA 1980 Annual Conference, 275-279.
16. Greeley, D.S., "Leak Location Enters Computer Age", ~rican City and County, 97(5), 1982, 14, 17-18.
17, Guarino, C.F. et. al., "Philadelphia's Water System Automation Plan" J. of the Environmental Divison ASCE Proceedings, No. EE5, 102(10), 1976, 953-968.
18. Heim, P.M., "Conducting a Leak Detection Search", J, of Am. Wtr, Wks. ~. 71(2), 1979, 66-69.
19. Lane, P.H. and N.L. Buehring, "Establishing Priorities for Replacement of Distribution Facilities", .J. Am. Wtr. Wks. Assoc., 70(7), 1978, 355-357.
20. Marks, D.H. and D. Noonan, "General. Strategies for Microcomputer Use", Eng. Found. Conf. on Microcomputers in Wtr. Resour., Niagara Falls, Ontario, Nov. 2, 1983, 4 p.
21. Marlow, K.C. and F. Fallside, "Minicomputer, Microprocessor, and Telecontrol Applications to a water Suppl.y Network", Institution of Water Engineers and Scientists Journal, 34(6) 1 1980, 517-45.
22, Matera, J., "Federal Help for Aging Distribution Systems: A Viable Option°. J .. of Am. Wtr. Wks. Assoc.t 72(6), 1980, 13.
23, McArdle, F.X., "Water Supply in New York City in the 1980s", ~ Wtr. Wks. Assoc., 74(3), 1982, 137-139.
24. Mishan, E.J., Cost-Benefit AnaJ.ysis, Praeger Publishers, New York, 1976, 454 p.
25. Nelson, J,K. and B,B. Mishra, "Digital on-J.ine Closed-loop Control for Wastewater Treatment Operation", J. Wtr. Poll. Contr. Fed., 52(2), 1980, 406-415.
26. New York Times, 11, 12, 25 August, 1983 {numerous articles) McFadden, R,D., "Transformer Fire Blacks out 12 Blocks in Garment
District; Shuts Streets and Big Stores", 8/11/83. McFadden, R.D., "Con Edison Begins Effort to Restore Power in
Midtown", 8/12/83. Shenon, P., "Water Main Break on East Side Stops Subway for Hours",
8/25/83. Gargan, E,A., "Sloshing to the Rescue: 1 It Looked Like a River'",
8/25/83.

34 BOSTON SOCIETY OF CIVIL ENGINEERS SECTION, ASCE
27. O'Day, D.K., Fox, C.M. and G.M. Huguet, "Aging Water Distribution systems: A Computerized Case Study", Public Works, 111 ( 8), 1980, 61-64, 111.
28. Petroff, R.G. and J. Koeper, "Flow Monitoring as a Maintenance Tool", Deeds and Data, Wtr. Poll. Contr. Fed., June 1983, 7-9.
29. Philadelphia Water Department and Water Revenue Bureau, Fiscal Year 1980 Unaccounted-For-Water Report, Philadelphia, June 1981, 121 p.
30. Pilzer, J.E., "Leak Detection Case Histories", J. Am. Wtr. Wks. Assoc., 7 3 ( 11 ) , 1981 , 565, 56 7.
31. Research News, No. 36, AWWA Research Foundation, Denver, Sept. 1982, 15 p.
32. Schilling, K.E., "Urban Water Systems: Problems and Alternative Approaches to Solutions", J. of New England Wtr. Wks. Assoc., 95(3), 1981, 178-186.
33. Siebert, H., "Methods for the Detection and Localization of Small Leaks in Pipelines", Wasserwirtschaft, 70(9), 1980, 309-312. (In German, English Abstract).
34. Siebert, V.H. and T. Klaiber, "Microcomputer for Monitoring a Gasoline Pipeline for Leaks and Locating Leaks", 3R International, 19(6), 1980, 341-347. (In German, English Summary).
35. Sowby, S.E., "Leak Detection Programs Recover Revenues", J. Am. Wtr. Wks. Assoc., 73(11), 1981, 562-564.
36, Stallworth, T.E., Bavan, T.M., and J,C. New, "Versatile Computer Controls Atlanta Water Distribution", Water and Wastes Engineering, 17(5), 1980, 16-19,
37. Wallace, Floyd Aeeocs. Inc,, Task 3: Demand Management Report, Metropolitan District Commission, Boston, June 1983, (Bechtel Civil and Minerals Inc., Chapter Two, "Unaccounted-for-Water and Leakage Recovery Within Planning Area Communities", 151 p.).
38. Walski, T.M., "Economic Analysis of Rehabilitation of Water Mains", J. of Am. Soc. of Civil Engs., WR3, Oct. 1982, 296-308.
39. Water Quality Research News, No. 15, AWWA Research Foundation, Denver, Dec, 1980, 15 p.
40, WE&M Engineering News, "Computer Assisted Analysis to Improve Water System Operation", Water Engineering and Management, Oct. 1982, 8-9.
41. Weiss, R., Memorandum to Philadelphia Water Department, 7/19/82.

SLURRY PIPELINES - AN OVERVIEW1 35
Robert R. Faddick2
INTRODUCTION
Slurry pipelining involves the transportation of particulate
solids in a liquid carrier through a pipe under pressure, The
liquid most commonly used is water,although liquors, brines and
hydrocarbons (fuel oil, methanol, crude oillhave been used. The
solids are usually products of the mineral industry,although
agricultural and food products are a1so pipelined in slurry form.
The mineral solids may be raw ores, beneficiated ores, or wastes
such as tailings. Some examples are coal in oil, salt in brine,
iron concentrates in water, and fly ash in water.
Generally, most slurries are inert, that is, non-reactive.
Occasionally, reactive slurries are encountered where some or
all of the solids can be partially dissolved in the liquid carrier,
e.g., trona in water, or salt in water. The saturation level of
such slurries is temperature-dependent. For purposes of
throughput determination, the ratio of undissolved solids to
dissolved solids is of concern when the brine carrier is
separated from the solids and is recirculated. Otherwise, the
total delivered solids, both undissolved and dissolved, con
tribute to the pay load.
There are mineral slurries which are inherently inert until
made reactive by chemical treatment. For example, power plant
scrubber sludge (calcium sulfate or sulfite) can be treated with
a hardening agent which increases the slurry viscosity with time
until it eventually sets up like concrete. Obviously, the
slurry residence time of transportation in a pipe is minimal
compared to t:he time for stabilization in a waste area.
1 Presented at Joint Meeting, Hydraulics Group and Waterways, Port,
Coastal and Ocean Group, Boston Society of Civil Engineers Section ASCE and Boston Chapter ASME, at MIT, Cambridge, MA, Jan. 26, 1983.
2 Robert R. Paddick, M,ASCE, is Professor of Civil Engineering, Basic
Engineering Department, Colorado School of Mines, Golden, co.

36 BOSTON SOCIETY OF CIVIL ENGINEERS SECTION, ASCE
While the emphasis here is on mineral slurries, many un
usual slurries have been pipelined. These include many kinds
of waste products - sewerage sludges, bagasse (waste sugar
products), and household garbage. Other interesting mixtures
that have been pumped are peas in water for food processing
(without being damaged by pumps), one-meter long pulpwood logs,
live fish pumped past hydro~electric turbines, and grass seeds
mixed with wood-fiber mulch for hydraulic revegetation of
mountains. Appendix A lists numerous slurries which have been
pumped.
Long distance pipelines have several advantages:
1) They have low operating costs which are relatively immune
to cost escalation. However, their capital costs can
be high. The major cost of a long distance pipeline is
the steel pipe.
2) Pipelines have high reliability. Some water pipelines
are over 100 years old and are still operating. Many
of the long distance slurry pipelines are available well
over 95% of the time. Some use factors are nearly 100%.
3) By their nature of being pressurized containers, pipe
lines require little manpower and are conducive to auto
mation. The economics of long-distance pipelines are
enhanced by high volumes of steady throughput which are
also conducive to automation.
4) Overland pipelines are normally buried in trenches below
the frost level. Consequently, they are out of sigh~
allowing for an aesthetic right of way which can be re
stored quickly to its original appearance. Of all the
transportation modes, buried pipelines are probably the

SLURRY PIPELINES 37
least harmful to the environment.
5) The health and safety aspects of slurry pipelines,
particularly buried pipelines, are noteworthy because
the slurry is totally contained. This type of trans
portation mode is relatively quiet; few slurries emit
toxic fumes, and the slurries do not come into contact
with the general public where accidents can occur.
Furthermore, many pipelines have an enviable record of
longevity.
6) For the most part, slurry pipelines use water as the
carrier liquid. It is generally the most abundant and
inexpensive liquid although there can be exceptions
depending on the source of solids being transported,
their market destination, and the end use or process.
THE PAST
The earliest known slurry pipeline transported a gold
bearing gravel-water slurry in a California placer mining
operation in the late 1850's. In 1889, a patent claim was
filed by W.C. Andrews for a slurry system although no record
exists of its application, In 1904, coal pipelines were mentioned
in a patent application by W.T. Donnelly of Brooklyn, N. Y.
The earliest working coal slurry pipeline was operated in
England in 1914 by G.G. Bell. It transported 50 tph of 50% coal
by weight at 1.2m/s in a 200-mm diameter pipe a distance of 600 m
from barges in the Thames River to a power house. In the U.S.,
an anthracite sludge line was built in the late 1920's near Mt.
Carmel, Pennsylvania, The pipeline was 1,6 km long and carried
solids at 40 to 65% by weight.

38 BOSTON SOCIETY OF CIVIL ENGINEERS SECTION, ASCE
Today's list of slurry pipelines is extensive, whether
one considers long distance pipelines only, or whether one
includes every slurry pipeline over one kilometer in length.
Appendix A gives an idea of the range of commodities, solids
throughput and pipeline diameters and length. The list is by
no means complete but does show a preponderance of mineral
commodities. Although this section will emphasize mineral
solids, it does recognize the application of slurry pipeline
technology to the transportation of food products, agricultural
products, encapsulated solids, and three-phase (solids-liquid
gas) mixtures.
The mineral slurries, the transported product,may be a
raw ore, a beneficiated ore, or a waste, called tailings. The
tailings may be discharged into a settling pond, returned to a
mine as backfill for ground support, or developed into a use
ful product such as landfill by the addition of a stabilizer.
Several companies have found certain stabilizers which produce
a landfill with fairly high load bearing capacities. For ex
ample, the Synearth process developed by the Dravo Corporation
(Ref. 1) in the United States adds a cement-like stabilizer to
a power plant wet scrubber sludge containing fly ash and sulfur
dioxide compounds.
THE PRESENT
It is obvious from Appendix A that slurry pipeline technology
is well established. This means that the technology is sufficently
well understood so that a systems approach to slurry pipelining
can be applied. Adequate information can be obtained for each
element of the system. For example, most slurry pipeline systems
involve preparation of the slurry at the commodity source, pipe
line transportation from source to market, and, possibly, solids

SLURRY PIPELINES 39
separation {dewatering) at the user point, Dewatering is not
always necessary; some examples being the calcining of a lime
stone-water slurry, or direct combustion of a coal-oil slurry or
a highly-concentrated coal-water slurry.
Preparation of a slurry usually involves crushing and
grinding of the solids, perhaps some cleaning and sorting, all
followed by a mixing of the solids with water, crushing and
grinding are expensive. Therefore, reduction in particle size
should be minimized wherever possible. Figure 1 shows a typical
relationship between the cost of slurry preparation and the degree
of reduction of particle size for coal. The particle size is
represented by a weighted mean particle size (Ref. 2) for con
venience.
There are two possible constraints in minimizing solids
reduction: market requirements, and a solid size amenable to
pipeline transportation. The first constraint tends to be
nebulous at times. Rigid market specifications for particle
size are not always dictated by product end use (e.g., com
bustion of coal) but by past experience and preference in
materials handling. Lump solids are preferred because they
are less dusty and handle more easily than powders, even though
the end use may require a powder.
On the other hand, the pipeline transportation constraint is
more explicit. It is a well known fact that fine solids are
easier to pipeline in slurry form than coarse solids, Energy re
quirements to pump a slurry are high for coarse solids but de
crease rapidly to some minimum value as solids size is reduced,
Furthermore, pipe wear by erosion can be severe with large

40 BOSTON SOCIETY OF CIVIL ENGINEERS SECTION, ASCE
particles. If the solids are made too small however,
(approaching near-micron sizes) the energy requirements for
pipeline transport climb rapidly because a thick paste-like
slurry develops. Fig. 2 shows such a cost-particle size
relationship for the pipeline transportation of coal (Ref. 2).
Slurries of fine particles are said to be homogeneous or slow
settling whereas $1Urries of coarse, heavy particles are said
to be heterogeneous or rapid settling. Most mineral slurries
are composite in size distribution which is why their evaluation
for pumpability is often complex.
At the terminal, the system contains dewatering equipment
such as screens, centrifuges, filters, and dryers. Homogeneous
slurries are much more difficult and costly to dewater than
heterogeneous slurries. Figure 3 shows a typical cost-particle
siz.e relationship for the dewatering of coal (Ref. 2).
Regardless of the commodity, if such cost curves can be
prepared, as shown above, for preparation, pipeline transportation,
and separation, a slurry pipeline system can be optimized with
respect to particle size, to give the lowest total cost. See
Figure 4.
As with any technology, t.here are certain problem areas
that require special attention. There are three major ones with
slurries: flow and pressure requirements, particle size de
gradation, and wear of pumps and pipes. Depending on the commodity
to be transported and the topography to be traversed by the pipe
line, the ranking of the problem areas may be interchanged. For
example, a gravity line is not concerned with pump wear but with
pipe wear, Hoisting coarse solids upward in a pipe must overcome
the static lift but pipewall friction itself is small (Ref. 3).

\0 t-
°' ,-f
a, i:: i:: 0 .µ
'-ti) .µ i:: a, u
U)
::,
.µ ti)
0 tJ
\0 r--
°' ,-f
E ~ I a, i:: i::
B 'ti) .µ i:: a, u
.µ ti)
8
0.150
0.139
0.128
0.117
0.106
0.095
1.94
1. 72
1.50
1.28
1.06
SLURRY PIPELINES 41
2 72 tonnes/hr
0 4 8 12 16 Weighted Mean Particle Size, mm
Fig. 1 - Cost Curve for Coal Slurry Preparation
0 0.5
2 72 tonnes/hr 322 km
1.0 1.5
Weighted Mean Particle Size, mm 2.0 2.5
Fig. 2 - Cost Curve for Coal Slurry Pipeline Transportation.

42
0.271
(I) C C 0.236 0 ;J
' V) w C Q) 0.201 u
~ :::,
. 0.165 ;J V)
0 u
0.130
0.095
2.09
1.95 e
.lo: I (I) C C 0 1. 82 ;J
'-,n ;J
i:: (I)
1.68 u
ui :::,
..; 1.54 V)
0 u
1.40
1.27
BOSTON SOCIETY OF CIVIL ENGINEERS SECTION, ASCE
0
272 tonnes/hr
2.65 5.15 7.65 10.15
Weighted Mean Particle Size, mm Fig. 3 - Cost Curve for Coal Slurry Separation.
0 0.5 1.0 l.5
272 tonnes/hr 322 km
2.0 Weighted Mean Particle Size, mm
12 .65
2.5
Fig. 4 - Total Cost of Coal Slurry Pipeline System

SLURRY PIPELINES 43
Generally, it can be said that energy requirements, particle
degradation, and pipe wear are proportional to'slurry velocity
raised to some power, (2 to 3). Therefore, it is desirable
to keep the velocity to a minimum such that deposition of
solids doesn't cause cessation of flow. While there is an
optimum operating paint from the viewpoint of fluid mechanics
it must be compromised with the economic optimum discussed pre
viously.
The environmental impact of slurry pipelines is probably
least of all the transportation modes. It will not be discussed
herein except for highlighting one point, that of water con
tamination. There can be no slurry pipeline without water. If
water availability is marginal, extensive water treatment may be
necessary and recircuiation of the water carrier may have to be
considered (Refs. 4, 5). Co.al slurries produce black water
consisting of minute particles smaller than 50 microns. Removal
is difficult and expensive. Woodchip slurries have the potential
of imparting high chemical oxygen demand, biochemical oxygen
demand, total organic carbon, turbidity levels and color to the
water. In addition, pH can be lowered to about 5 (Ref. 6). In
comparing the economics of various transportation modes, there
fore, slurry water treatment may have to be included.
THE FUTURE
In looking to the future, the growth of slurry pipelines
is excellent. In 1960, there were fewer than a dozen commercial
slurry test facilities in the world. In 1980, a recent count
showed over twelve test facilities in the U.S., over three
dozen in Japan, as well as numerous .facilities in Eurqpe and
the Soviet Union. A number of recent studies are described
briefly where slurry pipeline technology shows promise of
advances.

44 BOSTON SOCIETY OF CIVIL ENGINEERS SECTION, ASCE
The U., S. Department of Energy has recently completed the
construction of a Hydraulic Transport Research Facility, the
largest in the world. It is a once-through or non-recirculating
system capable of handling an initial load of 300 tonnes of
coal. Three separate pipelines of 150-, 300-, and 430-mm
diameter extend horizontally, declined at 45 degrees, and ver
tically for a total length of 230 meters, A filtration and
clarification system permits dewatering of the coal slurry.
The facility was constructed to generate design data and equipment
for underground coal mining. Operation of the facility, located
in Bruceton, Pennsylvania commenced in late 1980 (Ref, 7).
1. The Electric Power Research Institute and the U.S. Department
of Energy (DOE) have funded a study to develop a high capacity/
pressure/temperature (315 L/s), (20, 7 MPa), 290 C) centrifugal
pump to discharge coal-oil slurries into liquefaction reactors
(Ref. 8). The pump is concurrently being tested at the
Colorado School of Mines Research Institute for Rockwell
International under DOE sponsorship. Six modules of double
staged impellers constitute a pump set producing all the
rated pressure and half the flowrate. Two sets in parallel
achieve the total rated flowrate. The module being tested
is designed to produce half the total flowrate and one-sixth
the total discharge pressure at the rated temperature.
2. The U.S. Department of Energy has funded two studies to
develop a high capacity, medium pressure, low profile coal
feeder pump to inject coal into a pipeline in an underground
coal mining application (Ref. 9). In 1968, there were 14
hydraulic mines and four hydraulic complexes in operation in
the Soviet Union with a total planned capacity of 14 million
tonnes of coal per year (Ref. 10). The three largest hydraulic
mines include surface pipelines of lO km each. In North

SLURRY PIPELINES 45
America, private enterprise has been slow to adapt slurry
pipelines both to hydraulic mining and underground coal
mining transport. At present, there is only one hydraulic
mine in Canada and one underground coal mine slurry transport
system in the U.S. The Hydraulic Transport Research Facility
operated for the Department of Energy is expected to
accelerate interest in underground coal mining transportation
by pipeline.
1. The future will probably see an increased use of lined pipes,
those containing ceramic (both chips and tiles epoxied in
fiber-glass) , polyurethane, and rubber, to resist erosive
wear and corrosive wear in short distance pipelines. Long
distance steel pipelines may perhaps be inner coated with
plastics to reduce oxygen corrosion and improve hydraulic
efficiency provided the joining of steel pipe by welding
does not deform the plastic.
2. Work continues on the use of internal spiral ribs in steel
pipe to improve the reliability of low flows of slurries.
The turbulence created by the ribs re-suspends the solids
and offsets the increased headloss normally associated
with ribs (Ref. 11).
3. Another scheme is to install a segmented pipe. A horizontal
plate is welded to the inner perimeter in the lower part of
the pipe. The plate provides a wide, flat base for the
solids to flow over and at the same time functions as a wear
plate. It has been shown (Ref. 12) that such a segmented
pipe reduces the minimum required flow velocity and the
power requirements for the s.ame solids ttrnoughput co:inpared
to a pipe without a plate.

46 BOSTON SOCIETY OF CIVIL ENGINEERS SECTION, ASCE
The last two special pipes described above are installed
as low-cost short sections of pipe where flow stability
is hampered by bedload formation.
Instrumentation
1. Numerous manufacturers have improved the design of an
ultrasonic velocity meter which is cemented to the outer
wall of the pipe and connected to a digital recorder for
a quick and inexpensive velocity measurement (Ref. 13).
2. A three-component sensor is under development by Science
Applications, Inc., for the U.S. Department of Energy to
measure coal-refuse-water concentration in a hydraulic
pipeline. The sensor measures slurry conductivity,
transmitted single-energy gamma rays, and transmitted
neutrons (Ref, 14).
Slurry Technology and the Oceans
1. The U.S. Marconaflow system (Ref. 15) and the Japanese
MIKS Flow system (Ref. 16) have been demonstrated
successfully for slurrying iron ore aboard ship and off
ship. Coal and woodchips are receiving attention as the
next potential candidates for application of slurry pipe
lining technology to maritime shipping. Research is pro
gressing on four fronts: a test facility is currently
under construction in New Zealand to test the pumping
aboard ship and dewatering of coarse coal slurries; Marcona
flo in the U.S. has been testing the slurrying of coal off
board ship by their Dynajet system; and the Dutch are also
studying port facilities for the off-loading of coal from
ships. The Japanese have modified a ship for coal slurries
and are studying dewatering characteristics.
SLURRY PIPELINES 47
2, Retrieval of manganese modules from 5 km below the ocean's
surface and their hoisting to the mother ship via slurry
pipeline will probably be the zenith of slurry pipelining,
Several commercial ventures have been struggling with the
technology for many years and to date slurry pipelines
appear to be the leading contender for the transportation
mode (Ref, 17).
Slurry Technology and Energy
1. Coal-oil slurries are seen as a possible means of reducing
U.S. dependence on foreign oil by as much as 50 percent,
Replacement of half the oil used to fuel furnaces, with
coal, would achieve thts goal, The u.s. Dept. of Energy
has funded several programs to retrofit oil furnaces for
coal-oil slurries. These include industrial and electric
utility furnaces as well as kilns (Ref. 18).
2. In the process of making clean fuel (solvent-refined coal)
from coal, slurries of coal and coal solvent are fed to
high pressure and temperature reactors, The properties of
the slurries are not well understood and represent an
interesting challenge to slurry pipeline technology (Ref. 19).
3. The application of slurry pipeline technology to the trans
portation of raw and spent oil shales is gaining attention.
Both types of shales are amenab.le to pipeline transportation
but the shortage of water in the shale-rich areas may preclude
slurry transport (Ref. 20).
4. The transportation of coal in a hydrocarbon liquid carrier
over long distances to be fired by direct combustion in a
power plant is being considered. This is discussed in more
detail in the following section.

48 BOSTON SOCIETY OF CIVIL ENGINEERS SECTION, ASCE
Energy Slurries
If direct combustion looks desirable and feasible in the
immediate future, the logical extension of this thinking for
the long term is to consider a total energy coal delivered in a
hydrocarbon liquid carrier. The carrier would be crude oil,
synthetic crude oil (Syncrude, Synthoil) or a member of the
alcohol family such as methanol.
Crude oil is unlikely to be available where coal is mined.
It would have to be pipelined to the coal source and mixed there
for slu.rry transport to market. Possible customers would be
utility plants which are presently burning oil and which must
convert to coal as oil supplies dwindle or become excessively
expensive. Retrofitting, or the modification of nozzles in oil
burne~s to coal-oil slurry burners may be justifiable economically
rather than total conversion to coal. Alaskan crude oil and
Montana coal or Dakota lignite might be potential candidates
for future consideration by u.s. mid-Western or Southern markets.
Because of tne widely aiffer~nt calorific content and market
price of coal and oil, some proprietary research is directed at
investigating the separation of coal and oil at the terminus of
a pipeline but previous research (Ref, 21) suggests this may be
expensive. Therefore, direct combustion of the total slurry
may be the best approach.
The concept of creating a liquid hydrocarbon carrier from
coal at the mine site is appealing provided more water is not used
in the process than that required by coal-water slurry pipeline.
Coal liquefaction has the same chemical basis as coal gasification.
Only the ratio of carbon to hydrogen in the end product is
different. Coal is reacted with hydrogen and oxygen by the
application of heat and pressure in the presence of catalysts or
chemical solvents to produce a volatile gas or synthetic crude
oil. Both end products can be used either directly for combustion

SLURRY PIPELINES
or as a refinery feedstock. Coal can be liquefied by four
basic methods:
a) direct catalytic hydrogenation
b) solvent extraction
c) pyrolysis
d) liquid hydrocarbon synthesis
Liquefaction consumes from 0,11 to 0.72 liters of water
49
per million Joules. By contrast a coal-fired power plant
consumes 3.1 liters/million Joules and a slurry pipeline requires
a little over 0.36 liters/million Jourles (Ref. 22). The
economics of liquefaction are poorly understood pending furtheT
research. Consequently, the economics of producing a liquid
hydrocarbon such as synthetic oil or methanol are vague. How
ever, some preliminary work has been done which appears en
couraging (Refs. 23, 24, 25).
Where pipeline transportation of energy slurries is involved
the transport energy ratio may be defined as the ratio of energy
required for transport to the total usable energy delivered. In
terms of energy slurries, this can be simplified as the ratio
of energy requirement to overcome pipewall frictional resistance,
to the calorific content of the slurry transported. Thus, a
common assumption inferred is that pump-motor efficiencies, and
pipeline minor losses are similar for most energy slurries and
are therefore, ignored. Another assumption is that the market
use in each case will be combustion of fossil-derived fuel in
thermal-electric generation stations. While the water that is
separated from a coal-water slurry is used for cooling purposes,
it has little energy value for combustion. The transport energy
ratio per kilometer is:

50 BOSTON SOCIETY OF CIVIL ENGINEERS SECTION, ASCE
specific power x throughput of solids calorific content delivery rate
kw-hr/tonne-km x tonnes/hr / Joules/hr - kw-hr/Joule-km
where tonnes refer to the weight of dry combustible solids de
livered. The specific power is the power required to overcome
pipewall resistance in delivering one tonne of dry solids per
hour a distance of one kilometer. The smaller the transport
energy ratio, the more efficient is the energy slurry for
pipeline transportation.
While a minimum ratio is desirable, it is obvious that this
is achieved by increasing the concentration of the solids or
liquid phase with the higher calorific content. Because the
alternate fuels (oil and alcohol) are more valuable than coal, it
is apparent that the choice of energy slurry for transport must
be optimized in conjunction with its preparation, The avail~
ability or processing of the higher priced carrier liquid will be
critical. If the oil or alcohol is derived directly from coal,
it is probable that processing economics of the refining quality
of the carrier will dictate a high coal-low liquid carrier
mixture. On the other hand, a low coal-high liquid mix may be
preferable where oil-burning power plants are retrofitted for
c.oal-oil slurries.
For combustion purposes, no dewatering costs will be in
curred, so effectively this cost can be transferred to the front
of the pipeline for grinding the coal to a finer size. Since
pulverization of coal to about 85 percent minus 75 microns is
necessary for power plant combustion, this grinding cost is
not attributable to pipeline transportation. The finely ground
coal may allow higher stable slurry concentrations to be pro
duced thus minimizing the amount of carrier liquid. Also, the
affinity that coal has for hydrocarbon liquids enable.s easier

SLURRY PIPELINES
slurry mixing, avoiding the often-encountered hydrophobic
tendencies of coal in water.
51
The disadvantage is that if the coal is ground too finely,
the slurry becomes paste-like with a high viscosity and a high
energy requirement for pipelining. However, the elimination
of dewatering costs means that additional costs can be allocated
for increased pipeline transportation costs. Furthermore, some
proprietary work on chemical additives for coal-oil slurries
looks promising for developing slurry viscosity thinners.
Preliminary work suggests a strong potential for energy
slurries to become an alternate power plant fuel of the future.
If burned directly, this fuel, besides being higher in calorific
value, would probably ameliorate the materials handling problems
associated with rail-delivered coal or coal-water slurry coal.
It is strongly recommended that coal-liquid hydrocarbon
slurries be researched at the preparation stage, pipeline
transportation stage, and combustion stage to evaluate their
economics.
Because energy slurries are combustible, unlike coal
water slurries, their transportation by pipeline would probably
present the same environmental and pollution consequences as
oil pipelines,
Novel Coal Slurries
Several different types of slurries have been proposed
recently:
1. Enlightened slurries consist of froth flotation reagents
(alcohol and oil) along with air to cause bubbles of air
crusted with fine particles to attach themselves to
coarser coal particles thereby effecting a reduced den,sity.

52 BOSTON SOCIETY OF CIVIL ENGINEERS SECTION, ASCE
This allows easier suspension of the coarse coal resulting
in higher solids concentrations being pumped with less
energy. These have been tested by the writer at the
Colorado School of Mines Research Institute and results
will be published soon.
2. Coal-liquid carbon dioxide slurries are under study by
W.R. Grace and A.D. Little, Inc. These slurries are
said to offer reduced pumping requirements and easy
separation of the coal by depressurizing the slurry to
allow the co2 to vaporize.
3. Aquatrain is a system proposed by W.R. Grace and Co. to
take western coal encapsulated in plastic bags and pro
pelled by western saline water through pipelines to the
west coast. There the coal would be easily recaptured
while the saline water would be dumped into the ocean.
It is evident that slurry pipelines are an active technology
and will continue to attract strong interest.

SLURRY PIPELINES 53
REFERENCES
1. Pratt, L.C., Treatment and Transport Aspects of the Scrubber
Sludge Disposal System at Bruce Mansfield Power Station,
Pennsylvania Electric Association, Structures and Hydraulics
Comm., Pittsburgh, PA, Nov. 7, 1975.
2. Faddick, R.R. and G.S. DaBai, "Optimization of Particle
Size Distribution for Coal Slurry Transportation, 11 Slurry
Transportation Association, Las Vegas, NV, March 2-4, 1977.
3. Pouska, G.A. and J.M. Link, "Investigation of Headlosses in
Coarse Oil Shale Slurries, 11 Paper H2, Hydrotransport 5 ;: BHRA,
Hannover, GFR, May 8-11, 1978.
4. Peavy, H. S. , et al. , "Chemical Interaction of Water and
Coal Constituents in Slurry Pipelines," Proc. of 3rd Int'l
Technical Conf. on Slurry Transportation, Slurry Transport
Assoc., Las Vegas, NV., March 29-31, 1978.
5. Moore, J.W., "Quality Characteristics of Slurry Wastewater
Resulting from the Slurry Pipelining of Eastern Ccial, 11
Slurry Transport Association 5tih Annual Meeting, Lake Tahoe,
NV., March 26-28, 1980.
6. Asano, T., W.A. Hunt, and R.L. Sanks, "Leaching of Pollutants
from Wood Chips Transported in Simulated Hydraulic Pipe
lines, Report of Contract 12-11-204-12 submitted to USDA,
Forest Service, Montana State Univ., Bozeman MT, 1972.
7. Miscoe, A.J., and R.R. Faddick, "U.S. Department of Energy
Hydraulic Transport Research Facility for Coarse Coal 11
Proc. 5th Int'l Tech. Conf. on Slurry Trnasportation;
Slurry Transport Association, Lake Tahoe, NV, March 26-28,
1980.
54 BOSTON SOCIETY OF CIVIL ENGINEERS SECTION, ASCE
8. Wong, G.S., "Coal Slurry Feed Pump for Coal Liquefaction,"
Rockwell International, EPRI AF-853, September, 1978.
9. Faddick, R.R. and J. w. Martin, Editors, "Materials
Handling for Tunnel Construction," Proc. of Workshop,
U.S. Dept. of Transportation, Keystone, Colorado, U.S.,
August 3-5, 1977.
10. Traynis, v.v., "Parameters and Flow Regimes for Hydraulic
Transport of Coal by Pipelines," Izdatelstovo Nauka 1970,
Translation, edited by W.C. Cooley and R.R. Faddick,
Terraspace, Inc., Rockville, MD. April, 1977.
11. Kuzuhara, s., and T. Shakouchi, "Hydraulic Transport of
Solids in Special Pipes," Paper H3, Hydrotransport 5,
BHRA, Hannover, GFR, May 8-11, 1978.
12. Sauermann, H.B., "Hydraulic Transportation in a Segmented
Pipe," Paper A4, Hydrotransport 5, BHRA, Hannover, GFR,
May 8-11, 1978.
13. Faddick, R.R., G. Pouska, J. Connery, L. DiNapoli, and
G. Punis, "Ultrasonic Velocity Meter," Paper B4, Hydro
transport 6, BHRA, Canterbury, UK September 26-28, 1979.
14. Verbinski, V.V., C.G. Cassapakis, D.L. deLesdernier, and
V. J. Orphan, "Development of Sensors for Measurement
of Coal/Refuse/Water Concentrations .in a Haulage Pipe
line," Phase II Report, Contract ET-76-C-01-9021, Dept.
of Energy, Pittsburgh Mining Operations, by Science
Applications, Inc., La Jolla, CA. June, 1978.

SLURRY PIPELINES 55
15. Faddick, R.R. and J.M. Link, and A.K. Anderson,
"Application of Slurry Pipelining Technology to the
Maritime Industry," Paper E3, Hydrotransport 4, BHRA,
Banff, Alberta, May 18-21, 1976.
16. Nari ta, K., et al. "The New System for the Treatment of
Turbid Water which Occurs when Iron Ore Slurry is Loaded
on an Ore Carrier," Paper C3, Hydrotransport 3, BHRA,
Golden, Colorado, May 15-17, 1974.
17. Sea Technology, "Soundings," Vol. 9, December, 1978.
18. Freedman,. S.I., C.B. Foster, and E.M. Jamgochian,
"Technical Aspects of Coal-oil Mixture Combustion,"
Conf.-780206, UC-90, Presented at Society of Mining
Engineers of AIME, U.S. Dept. of Energy, Denver,
Colorado, Feb, 26 - March 2, 1978.
19, Status of Wilsonville Solvent Refined Coal Pilot Plant,
Research Project 1234, Interim Report, Southern Services,
Inc., Birmingham, Alabama, May, 1975.
20. Paddick, R.R., "Headlosses for Fine Oil Shale Slurries,"
Paper C4, Hydrotransport 5, BHRA, Hannover, GFR, May 8-11,
1978.
21. Smith, L.G., D.B. Haas, A.D. Richardson, and W.H.W.
Husband, "Preparation and Separation of Coal-Oil Slurries
for Long Distance Pipeline Transportation," GHRA, Hydro•·
transport 4, Banff, Alberta, May, 1976.

56 BOSTON SOCIETY OF CIVIL ENGINEERS SECTION, ASCE
22. Faddick, R.R. and J.J. Gusek, "The Environmental and
Pollution Aspects of Coal Slurry Pipelines," Proc. 2nd
International Technical Conference on Slurry Transpor
tation, Slurry Transport Association, Las Vegas, NV,
March 2-4, 1977.
23. "Markets. A New Market for Lignite, Methanol Production,"
Coal Age, November, 1977.
24. Hearings before the Committee on Interior and Insular
Affairs, House of Representatives. 94th Congress,.lst
Session on HR-1963, 2220, 2552, and 2968 Serial No.
94-8, 1975.
25. Banks, W.F. and J.F. Horton, "Efficiency Improvements in
Pipeline Transportation Systems," Report SSS-R-77-3025
submitted to ERDA, Oakland, CA, by Systems, Science and
Software, La Jolla, CA, September, 1977.

SUMMARY OF MAJOR PIPELIIIE INS'l'ALLA TIOIIS - lfORIZONTAL
SPECIFIC OD X WALL CAPACITY NO. □PER. Sl.llRRY GRAV. OF PSD THICKNESS CONC 11EL L TONNES PER OPERATION PUMP OF PUMPS-
CODE LOCATION/OWNER sm.ro·s %+-MM MM ·, WT. M/S KM (SEE NOTE) DATES TYPE STA STANDBY REF
ASH~T SUNBURY PA,USA / PA.POWER & LIGHT 2.25 - - - 254.0 10.0 4,39 2,408 39.00 H 1956 CSE - - 5 1 ASH-T SAFE HARBOR PA,USA/PA.POWER 2.4 - - - 152.4 l 7.0 1,62 1.372 20.62 Ii 1953 CSE - - 6 l ASH-T KAZINCBARCIKA,HUNGARY/BORSOD POWER -- - - - 200 .o --- --- 8.000 70 H 1967 _..,.,_ - -ASH-T BUNA WERKE, GDR / IAI --- - - - 400.0 --- --- 12.000 320 H 1979 ---- - -ASH-T•N□VAKY, CZECH. I ELEKTRAREN, NOVAK¥ -- - - ·- 250.0 --- --- 1.200 300 H 1980 ---- - -
AU-T KDLAR,KARNAIAKA,IND/KOLAR AU FIELDS --- - - -- --- --- --- --- ---- ---- - - - 6
BAU-T KORBA,MADH'lA PRADESH,l!ID/BHARAT AL CO --- - - - --- --- --- --- --- ---- ---- - - - 6
BO-T BORON, CA, USA/US BORAX & CHEM CORP 2.6 - - - 127.0 16-26 l.46- 1,326 --- 1957 CSE - 0 2'-2 1 3.66
;:; .,, "' z 0
CE 3.15 - - - 203.2 --- 11.68 0.152 --- 1948 ? - 1-1 - H X
:,,
co-c B~ACK MESA,AZ,USA/SDUTHERN PACIFIC 1.41 99-1.19 457.2 48.0 l, 768 439 599 H 1970 DAPO 4 3 9-4 15 305
CADIZ,OH,USA I CONS. COAL 1.4 - - - 273-0 so.o 1.52 173-8 1.1SE6 Y DAPD 2 3 13 16 SAFE HARBOUR,PA,USA / PA, POWER 1,85 - - - 323.B --- --- 0,49 l.4E6 y C - - 6 17
ca-c CHESNICK,PA,USA/ HANNA COAL CO 1.5 - - - 152,4 52.5 2.44 o. 792 --- C - 0 - l co-c POLAND --- - - - 254,0 --- --- 202.8 --- ---- ---- - - - -co-c CARLI!iG, FRANCE --- - - - 381.0 2.59 8.851 1.SE6 Y 19.52 ---- - - - 17 co-c NOROVDLYNSKAYA MINES, USSR --- - - - 304.8 1,463 61,16 199.6 H 1957 --- - - - -co-c LONDDN,ENG / HAMMERSMITH. BOROUGH --- - - - 203.0 1.200 0,540 50 H 1914 C - 1 l 14 "' co-c WESTF.IELD COLLIERY, UK --- - - - 75.0 --- --- 1.100 .2E6 Y ---- ---- - - - 17
t"' ,:: c □-c WALTON COLLIERY, UK / N,E, --- - - - 127.0 34,0 2.59 2.010 600 D 1963 CE - 1 3 13 ~ co-c !!ARKHAM COLLIERY, UK --- - - - 150,0 --- --- 0.100 .2E6 Y 1951 ---- - - - l7 -<
;!
e co-o SAFE HARBOR,USA/PA P~WER & LIGHT 1.85 - - - 298,5 13.3 4.63 .488 y 1953 CSE - 0 3-3 1 z
ti'.! ca-o ROBINSON RUN MINE WVA,USA/CONS. COAL --- - - - 254,0 38.0 4.27 .925 y --- C - - 2 - "' co-o L□VERIDGE,WVA,USA /CONS.COAL CO --- - ,_ - 504. a --- --- --- --- 1980 C - - - -co-□ SUNAGAWA MINE,JAPAN/MITSUI COAL CO. 1.56 - - - 300.0 3.1 4,100 2,200 339 D 1965 C - - - 12 co-□ NOWOKUZNEZK --- 100-100 345.0(5)--- 3 .50 10.0 3E6 Y ---- --- ... - - - ll co-o LOTl!RlNGEN, PRANC& ,--- 100-1 386,0 --- 2. 50 s. 70 , 5E6 Y ---- ---- - - - 11 co-o RUHRGEBIET, GFR --- 100-1 136.0 --- 2,20 7.50 .3g6 Y ---- ---- - - - 11 ~ co-o PERHOMAJSK, tlSSR --- 100-100 200.0 --- 3.30 3.00 --- ---- ---- - - - ll

SUMMARY OF MAJOR PIPELINE INSTALLATIONS - HORIZONTAL u,
"' SPECIFIC OD X WALL CAPACITY NO. □PER.
SLURRY GRAV. OF PSD THICKNESS CONC VEL L TONNES PER OPERATION PUMP OF PUMPS-CODE LOCATION/OWNER SOLIDS %+-MM MM WT, M/5 KM (SEE NOTE) DATES Ti'PE STA STANDBY REF
l:!i co-□ W□ HYNIEN, USSR -- 100-6 300.0 --- 1.00 61.0 .3E6 Y ---- ---- - - - ll
~ "'
CO-T FAIRMOUNT,WVA,USA / CONS •. COAL CO --- - - - 101.6 40.0 2.13 , 823 --- 1953 CSE - 0 3-0 l 8 CO-T NORTHER~, WV A, USA 1.4 - - - 101. 6 4.0 3,26 • 549 2,344 H 1957 CSE - 0 3-1 1
~ co-T DEHUE,WVA,USA I YOUNGSTOWN MINES CO 1.43 - - - 102.1 10.0 1,23 .5:\3 7,312 H 1957 CSE - D 4-,) 1 CO-T CHESNICK, PA, USA / HARMAR COAL CO 1.so- - - - 152.4 50-55 2. 438 .792 ll0,6 H 1957 CSE - 0 3-1 l 0 1.55 'I! co-T CANADA --- - - - 330. 2 45,0 1.829 7,242 9090.9 D ---- ---- - - - 3
~ CO-T LIMBURG,NL --- 100-1 200.0 --- 2.10 22.0 ,2E6 Y ---- ---- - - - 11 CO-T SHRGEBL ET, C:FR --- 100-1 150.0 --- --- 1.10 ,2F.6 ¥
_.,. __ ---- - - - 11 t" CO-T SAARGEBL ET, GFR --- 100-1 150.0 --- --- 3. 8(1 ,2E5 ¥ ---- ---- - - - 11 t'1 C□-T SAARGEBLET, GFR --- 100-1 150,0 --- --- 3,80 ,3E6 Y ---- ---- - - - 11 z
0 z t'1 t'1 :,:,
co-c KBI TURKEY --- - - - 127 .o --- --- 61,16 0,91E6 Y ---- "' ---- - - - "' cu-c BOUGAINVILtE -- - - - 152,4 --- --- 27,3 0.91E6 Y 1972 VPL 3 - 2 - g cu-c ARBITER PLANT,USA --- - - - 101. 6 --- --- --- O. 18E6 Y 1974 -·-- - - - -cu-c WIRA / !RIAN JAYA FREEPORT INDO INC --- - - - 88.9 65.0 1.22 111.0 653 D 1972 VPL 3 - 1-1 5 0 cu-c PINTO VALLE¥,AZ,USA/CITIES SERVICE CO --- - - - 101. 6 28, 0 --- 17,7 0.36E6 Y 1974 PL 3 - 2 - ,,: cu-c ELSO-I.IANH,CHIU / ANACONDA -- - - - 152. 4 --- --- 22,53 727.3 D 1959 ---- - - - - ?;; cu-c HAYDEN,AZ,USA / KENNECOTT COPPER CO 4.2 - - - 152.4 26.0 l,28 0,853 --- 1958 CSE RU 0 2-2 l
(') t'1
cu-s GHUSIU,BIHAR,INO/HINDUSTAN COPPER --- - - - --- --- --- --- --- --- .,. ___ - - - 6
CU-T JAPAN --- - - - 304.8 --- --- 70. 81 o.~E6 Y 1968 DAPI 2 - 3 CU-T WHITE PINE,MI,USA/WHITE PI!IE COPPER 2.7 - - - 587 ,38 17,5 3,22 1.897 H183.5 D 1953 CSE - 0 4-0 l CU-T BUTTE,MT,USA / AJIACONDA 2.1 - - - 508.0 30,0 2.844 5.632 i54!!◄ , 5 0
.., ___ CSE - - 7 3
cu-T W. VIRGINIA, USA l.4 - - - 101.6 --- --- --- --- 1957 C - - 4 CU-T W, VIRGINIA, USA 1,4 - - - 102.1 --- --- --- --- 1957 C - - 4 CU-T CANADA/ U,S, BORAX 2.6 - - - 121.0 --- --- --- --- 1957 C - - 4 CU-T MONTANA, USA / ANACONDA --- - - - 508,0 --- --- --- 18181,8 D 1964 C - - 3 CU-T GHATSILA,BIHAR,IND/HINOUSTAN CU LTD 2,80 100-.295 219x 35-40 1. 70- 1.0 96-129 H 1974 C P.U - - 6
50-,0H 7 ,14 2,2 5 CU-T KHETRI,RAJASTHAN, IND/HINUST. CU LTD 2.ao 100-. 20 355.6x 50,0 l,63 1. 60 9200 D ---- C - - - 6
60-.074 1,,92 1,40 5000 n CU-T MALANJK!!AND, MAOHY APRADESH, IND/HIN, CU 2,86 100-.589 273x 25.25 2,5(2) 2,5 252 H 1982 CSE RU 5 2-1 6
52-,07 ◄ 7.09 CU-T HIGHLAND VALLEY,CA,USA/LORNEX MINING 2.60 - - - 915.0 36,0 2.00 8.00 19000 D 1975 G CU-T TUSCON, AZ, USA / ANU!EX 2,70 - - - 500,0 30.0 2,00 --- 10 1979 G CU-T IDAHO, USA / ASARCO 2. 70 - - - 203.0 27.0 2.80 --- --- 1978 G

SUMMARY OF MAJOR PIPELINE INSTALLATIONS - HORIZONTAL
SPECIFIC OD X WALL CAPACITY NO. □PER. SLURRY GRAV. OF PSD THICKNESS CONC VEL L TONNES PER OPERATION PUMP OF PUMPS-
CODE LOCATION/OWNER SOLIDS %+-MM MM WT. M/S KM (SEE NOTE) DATES TYPE STA STANDBY REF
FE-C WAHPI(LAND) / MARCON A 4.9 - - - 203.2 45. 0 4.88 l.829 323 H 1971 CSE RU - 10 3 FE-C WAIPPICOFFSll □RE) / MARCONA 4.9 - - - 304. 8 45.0 5. 79 2. 896 1000 H 1971 CSE - - 6 3 FE-C CHONG IN, N. KOREA --- - - - --- --- --- 98.17 4.lE6 Y 1975 ---- - - - 4 FE-C SAVAGE RivER,TASMANIA 5.0 - - - 228.6 55.0 --- 85.30 2.3E6 Y 1967 PL 3 - 4 4 FE-C PENA,COLORADA-MEXICO 5.0 - - - 203.2 --- --- 45.06 l.6E6 Y 1974 C - - 2 4 FE-C SIERRA GRANDE,AGTA 5.0 - - - 203. 2 --- --- 27.36 l.9E6 Y 1974 PL 3 - 3 4 FE-C LAS TRUCHAS,MEXICO 5.0 - - - 203.2 --- --- 402.3 1.4E6 Y 1975 PL 3 - 3 4 FE-C SAMARCO, BRAZIL 5.0 - - - 508.0 --- --- 400. 10.9E6 Y 1977 PL 3 2 14 4 FE-C CANADA / ANACONDA --- - - - --- --- --- 225.3 2.lE6 Y ---- ---- - - - -FE-C LABRADOR-PT. MARMITE,CAN --- - - - 203.2 --- --- 482. 8 lo. 9E6 Y 1974 ---- - - - 3 FE-C KUDREMUKH,KARNATKi<,IND/KUDR. FE LTD 4. 90 100-.104 457/ 60-70 1.80- 66.0 7.5E6 Y 1979 CSE RU 5 1-1 6
406 2.00
FE-T HUNNER PLAIIT, USA / M.A. HANNA 3.2 - - - 406.4 16.0 2. 92 5.364 --- 1955 C - 1 8-0 1 FE-T STAR LAKE,NY,USA / LAUGHLIN STEEL 2.7 - - - 298.5 20.0 3.66 1.524 --- 1957 C - 0 14 1 FE-T CALUMET,HN,USA / LAUGHLIN STEEL 2.0 - - - 406.4 14.8 2.56 2.621 --- 1958 C - 0 1 1 FE-T CANIST<O,MN,USA / CLEVELAND-CLIFFS 2.8 - - - 457.2 17. 5 2.68 0.783 318.5 H 1958 C - 0 2 1 FE-T GRAND RAPIDS,MN,USA / LAUGHLIN STEEL 3. 0 - - - 609. 6 9 .5 2.65 1. 633 317.5 H 1959 C - 0 2 1 FE-T HIBBING,M."i,USA / M.A. HANNA 3.2 - - - 488. 95 11.0 2.20 3.962 179.l H 1959 C RU 0 2 1 FE-T MINNESOTA,USA / M.A. HANNA 3.4 - - - 406. 4 16.5 2. 93 5.359 211.8 H 1955 C RU - -FE-T KEEWATIN,MN,USA / HANNA MINING CO 3.0 - - - 292-1 45.0 4.572 3.219 5636.4 D ---- C - 0 5 FE-T SELLWOOD,ONURIO, CAN/ LOWPHOS ORE,LTD 2.8 - - - 355.6 4.0 3. 20 0.488 393 .6 H 1957 C - 0 6 1 FE-T MORGANTO WN,P A, USA/BETHLEHAM CORNWALL 3.0 - - - 254.0 35.0 2.10 2. 663 169.0 H 1958 C - 0 4 1 FE-T CALUMET,MN,USA / LAUGHLIN STEEL 3.0 - - - 609. 6 6.0 2.40 1.737 78.97 H 1961 CPA - 0 2 1 FE-T KUDREMUKH,KARNATK~,IND/KUDR. FE LTD 3.04 100-.147 457x 40.0 4. 20 2.50(2) 940- H 1979 CSE RU 5 2-1 6
64-.043 9. 52 1230 FE-T BAILADILLA,MAKHYA PRADESH,IND / --- - - - --- --- --- --- --- ---- ---- - - - 6
NATIONAL MINERAL DEVELOP CORP.
"' GIL-□ UTAH-COL □RADO,USA/ AMER. GILSONIH CO 1.04 - - - 152.4 46.0 1.19 115.9 997. 9 D 57-75 PL - 1 2-1 1 t"" c::: :,0 :,0 -<
G-T LORRAINE MINE-FREDDIE,RSA / 2. 7 - - - 228.6 50.0 1.33 9.449 150.4 H 1963 CSE - 0 4-4 1 ; t'1
L□ RRAINo GOLD MINES r:: G-T - - ~SA - - 2. 7 - - - 228.6 45.0 1. 49 9.144 136.9 H 1957 CSE - C 4-4 1 z G-T LEAD, SD, USA/ HOMESTAKE 3.1 - - - 203.0 47.0 1.85 4.67 1.3 1978 CSE - - 16 9 t'1 G-T LEADvILLE,CO,USA / ASARCO 3.0 - - - 300.0 30 .o 2.00 3.00 --- 1975 "'
GS-T caEIGHTON,PA,USA/PITSBG.PLATE GLASS 2 .5 - - - 101.6 31.0 1.95 1. 707 23. 45 H 1949 CSE - 2 6-6 1 V,
"'

SUMMARY OF MAJOR PIPELINE INSTALLATIONS - HORIZONTAL g SPECIFIC DD X WALL CAPACITY NO. OPER.
SLURRY GRAV, OF PSD THICKNESS CONC VEL L TONNES PER OP!RATlOM PUMP Of PUMPS-COD! L □CATI □II/OWNER SOLIDS %+-MM MM WT, M/S KM (SEe NOTE) D.lt'!S TYPE STA STANDBY REF
HH-C AUSTR.I.LlA/TITANlU>i & ZIRC □NlUM LTD. 1.3 - - - 152,4 --- --- 5.633 21.8 H ---- ---- - - - - I! RM-C Fl.OP. IDA, USA / E. I, DUPONT 3.4 - - - lOl,6 --- --- --- 40, 9 H 1955 C - - 2 - ~ HM-C LAWTEY FL,USA / b.I, DUPONT 3.4 - - - 101.6 40,0 2. 47 4.828 41.30 H 1955 C - 8 16-0 l i "' 0 i'.l
KC- □ GEORGIA, USA / P!!ILLIPP CORP. 2.6 - - - 203. 2 2s.o 1.22 l 7. 70 41.12 H 1951 C - 1 2-0 1 ~ 1<C-O GEORGU.,USA I PHILLIPP CORP. 2.6 - - - 203.2 33.0 1.22 25.75 86.31 H 1959 C - 0 2-1 1 -< KC-□ GEORGIA, USA / PHILLIPP CORP. 2.6 - - - 304,8 25,0 1.22 8.047 137 .o H 1940 C - 0 2-0 l 0
"l n < ?
LI-0 CHAVERAS --- - - - 111. a --- --- 27.3 l,4E6 Y 1971 DAPI 2 - 2 - ~ LI-□ RUGllY,ENGUND --- - - - 254.0 --- --- 91,7 l,5E6 Y 1964 DAPI 2 - 3 - Sl Ll-0 TRINIDAD --- - - - 203.2 --- --- 9.6 0,5E6 Y 1959 DAPI 2 - 2 - z LI-□ COLUMBIA --- - - -- 177. 8 --- --- --- 0.36E6 Y 1944 ---- - - - - tn
tn :,0
"' ri, t!l
MA SZENTEGAT,HUNG/SZENTEGATI STATE FARMS --- - - - 150.0 --- --- 8,000 --- 1973 ---- - - - B MA RABAFUZES,HUNG/SZUMBATHELY STATEFARMS --- - - - 200.0 --- --- 4,000 --- 1974 ---- .. - - - -~ MA VAROSFOLD,HUNG/VAROSFOLDI SUTE HRMS --- - - - 150.00 --- --- 3,000 --- 1975 ---- - - - -MA PlROSKA, HUNG/SZOLNOKI STATE FARMS --- - - - 150.00 --- --- 4,500 --- 1976 ---- - - - - >
"' n tn
NI-C CANADA --- - - - 203.2 28.0 1,829 12,07 1818.'2 D ---- ---- - - - 2
NI-T WEST MINNESOTA,USA / WESTERN MINING --- - - - 101.6 --- --- 6.920 .091E6 Y 1970 ---- - -
ORE HUNGARY / ERCBANYA VALLJ\LAT --- - - - 250.00 ---- --- 7.000 --- 1979 ---- - -
PHM-0 BARTOW,FL,USA/ARMOUR AGRIC. CHEM, CO 2. 75 - - - 406.4 25.0 3.658 3,200 544.31 H 1955 C - 3 4-0 PHM-□ FLORIDA, USA / SMITH-DOUGLAS CO INC 2. 7 - - - 406.4 25,0 3.658 3.200 --- 1960 C - - 4 PHM.,-0 NORALYN MINE,FL,USA/INT. MIN&CHEM CO 2.6 - - - 457.2 35,0 5.029 7.62 --- 1974 C - - 7 PHM-0 NORA!.YN. MWE,FL,USA/INT. MIN&CHEM CO 2.6 - - - 508.0 35.0 5.029 7.62 6.2604E6 Y 1974 C - - 1 2 PHM-0 NICHOLS FL1 USA / MOBIL CHEMICAL CO. 2.7 - - - 457.2 35.0 3.6S8 2.743 1056. l H· 1971 C - 4 l-1 2 PHM-□ LEE CREEK,NC,USA / TEXASGULF 2, 7 - - - 457.2 35.0 3.322 4.420 4.754E6 Y 1966 C - 5 2:-3 2 PHM-0 WHITE SPRINGS FL,USA/OCCIDEN'l'AL CO. --- - - - 508.0 37.0 5.090 5,273 1674.7 H 1965 C - 4 4-0 2 PaM-□ BONNY LAKE MINE,USA / w.R.GRACE 2,6 - - - 457.2 32.s 4,572 8,230 5,622E6 Y 1946 C - 10 10-0 2 PllM-0 FORT l!EADE,F!.,USA / USS AGRICHE~. CO. 2,65 - - - 508.0 30.0 4.724 3,658 lJ73, 8 H 1968 GIW - 4 •-o 2

SUMMARY OF MAJOR PIPELINE INSTALLATIONS - !l □RIZONTAL
SPECIFIC OD X WALL CAPACI'l'Y liO. □PER. SLURRY GRAV, OF PSD THICKNESS CONC VEL L TONNES PER OPERATION PUMP OF PUMPS-
CODE LOCATION/OWNER SOLIDS %+-MM MM IIT• M/S KM {SEE NOTE) DATES TYPE STA STANDBY REF
PHM~O TAPIRA-UBERA~A,BRAZIL / VALEP 3.2 - - - 244,5 61.0 l.658 119.0 2,0E6 Y 1978 REPL 3 - 2-1 2 PHM-0 TENOROC MINE FL,USA/SMITH-DOUGLAS CO 2. 7 - - - 406,4 35.0 3,962 3.962 792.l II 1960 CSE - 4 4-0 l PHM-0 CDLUMBH,TN,USA / MONSANTO CHEM, CO, --- - - - 254,0 25,0 3.719 0,137 12,07E6 Y ---- C - 2 2-2 -PHM-0 SLIVER,CITY,FL,USA/SWIFt AGRI CHEM CO 2,5 - - - 508.0 30.0 4,511 2,164 --- ---- C - - 3 2 PHM-a WATSON MINE,FL,USA/SWIFT AGRI CHEM CO 2.5 - - - 406,4 30.0 4.267 8 .• 717 734,7 H ---- C - - 7-7 2 PHM-0 MANATE:& CO,,FL,USA/BEJ<ER PHOSPHATE CO 2,65 - - - 635,0 34,0 5,500 3.962 l5.42E6 'f ---- C - - s-o 2
PHP-0 CONDA,ID,USA / JR, SIMPLOT CO, 2.95 - - - 50,0 5,014 2.295 191.9 H ---- CRU - 0 2 PHP-0 CONDA,ID,USA / JR, SIMPLOT CO, 2,95 - - - 50.0 5,014 2,295 --- ---- CRU - 0 2 PHP-0 SYDNEY MXNE FL,USA/AMER, CYANAMID CO 2.65 - - - 35,0 3.63 6,096 787. 2 H 1949 CSE - 1 1 PHP-0 ACHAN&NORALYN MINE Ft,USA / 2. 7 - - - 40.0 3.66 6,437 --- ---- C - 9 l
INT, HIN & CHEM CO.
PHO-C HATON,RAJASTHAN,UID/HINDUSTAN ZN LTD 2,95 100-,30 73,c 58-68 1.25- 15 H 1982 V PL 3 1 1-1 6 90-,053 7,14 1,9
Pi!O-T MATON,INDH I HINDUSTAN ZN LTD. 2.e - - - 127,0 40.0 0,488 1. 500 8,913 H 1976 VSP - l 1-1 2 PHO-T FLORIOA,USA I CHEMICAL CO, 2.6 - - - 406.4 --- --- --- --- 1959 C - - 5 PH□-T FLORIDA,USA I CHEMICAL CO, 2,6 - - - 355.6 --- --- --- --- 1952 C - - 7 PRO-T I PA, POWER & LIGHT 2. 1 - - - 254.0 --- --- --- --- 1953 C - - 2 PHO-T SULLIVAN MO,USA/ MERAMEC MINING ca. 4.2 - - - 101,6 15.0 --- 0.274 --- 1964 CRU - - 1-0 PHO-! !UC!iOLS,FL,USA / VI-CAROL CiiEM, CORP, 2.65 - - - 355.6 35.0 2.896 7,724 610,8 H 52-55 C - 0 7-0 1 P!IO•T lllCHOLS,FL,USA / VI-CAROL CHEM. CORP. 2,65 - - - 406.4 25.0 4,237 6,287 596,9 II 58-59 C - 0 5-0 1 PHO-T CAPE PROV.,RSA / CHEMEOS LTD, 2,6 - - - 152.4 30.0 1.890 3,060 46. 79 H 1965 C - 5 9-9 2 PHO-T WHITE SPRINGS,FL,USA/OCCIDENTAL CO, 2.72 - - - 508,0 25,0 5,243 2.967 1070,4 H 1965 C - 3 3-0 2 PHO-T KINGSFORD MN-FL,USUINT. MIN&CHEM. CO 2,65 - - - 457,2 32,0 4.511 4,267 6,532E6 Y 1975 C - 4 4-1 2 "' ~
:,<I
:!; PY-C GMCL, RS A 3,0 - - - 127.0 --- --- --- 181,8 D ---- C - - 4 - l
~ z SI-T BLACKBIRD,ID,USA / CALERA MINI!lG CO 2. 7 - - - 152, 4 45,0 1,387 2,262 52.28 H 46-60 CSE - 9 18-0
!;l l
SI-T BRALORN£,BC,CAN / BRlLORNE PIONEER MI 2. 7 - - - 76.2 28.0 1.646 1,341 9. 749 H 1960 CSE - 0 3•0 l SI-T KELLOGG, ID, USA. / BUNKER HILL CO, 2. 75 - - - 127 .o 40.0 f.661 2. 865 40.41 H 1961 CSE - 0 4-0 1 SI-T TA?ABANYA,HUNG / COAL MINE TATABANYA --- - - 200,ii --- --- 8,500 240 H 1969 ---- - - - -SI-T - • - I QUEBEC CARTIER MIN. CO -- - - - 298.5 40.0 4,267 2.092 1814 H ---- C - - 4 :a::

SUMMARY Of MAJOR PIPELINE INSTALLATIONS - HORIZONTAL ~
SPECIFIC OD X WALL CAPACITY NO. OPER. SLURP¥ ~RAV. OF PSD THICKNESS CONC VEL L TONNES PER OPERATION PU"P OF PUMPS-
CODE LOCATION/OwNER SOLIDS %+-MM MM WT, M/S KM (SEE NOTE) OATES ?YPE STA STANDBY REF
SR-T JAPAN / DUWA & NIPPON MINING 1. 57 - - - 318.B 18. 8 1. 311 70.6 1212.1 0 1968 DARE - - 3 - to SR-T SUNBRIGHT,VA,US. / FOOTE MUIERAL CO. 1.s - - - 101.6 30.0 1,156 0.366 11. 908 H 1952 CSE - 0 3-1 l 0
"' b z "' 0
ss-T THOMPSON,MAUTOBA,CAN / INT. NICKEi. 3.5 - - - 127. 0 15.0 3.658 0.305 --- 1959 CSE - 0 2-2 1 Q ss-T CLIMAX, CO, USA / AMAX 2.10 - - - 1067.0 30. 0 2.10 6.00 19E6 1982 ---- - - - 7 l'l:! ...;. S5-t KITSAULT ec, CAil / AMAX 2. 70 - - - 500.o 20 .o 2.00 --- 2. 5E6 1980 ---- - - - 8 -< ss-t MICHIGAN, USA / HA!lNA MINING 3.00 - - - 560.0 30.0 4.00 --- --- ---- ---- - - - :;; SS-T HE~DERSON ~INE, CO, USA / AMAX 2. 70 - - - 760.0 30.0 2.00 1.20 15E6 1974 ---- - - - -
~ UP-C RSA / ANG-TRS-CO!!-INV CO. 3.0 - - - 127.0 51,0 l,J72 5.224 42.47 H 1957 C RU 0 4-4 l !l!
0 UP-C DAGGAFONTEIN,RSA / OAGGAFONTEIN MINES 3.0 - - - 101.6 --- 1.859 2. 853 --- 1957 C RU 0 1-1 l z UP-C DAGGAPO~TEI!I, RSA / DAGGAFONTEIN MINES 3,0 - - - 121.0 --- 1.3~6 2.853 --- 1957 C RU - 1-1 l l'l:!
l'l:!
"" "' "' UR-TO EAST CHAMP 0, Of<,RSA I 2. 7 - - - 152.4 so.o 0. 750 10.21 870. 9 D 1957 CSE - 0 2-2 1 i UR-TO UBROSCO,RSA / GEN MIN & FINA CORP 2.7 - - - 152.4 so.o 0.972 19.00 1110,4 D 1957 PL - 0 1-1 1 UR-TO FREDDIE-N-S,RSA / FREDDIE$ CONSOL. Ml 2.7 - - - 304.7 so.o 1.152 8.138 5334.3 D 1957 CSE - 0 2-, 1 UR-TO FREDDIE S-liELCO!l,RSA/1:REDLJIES CON. MI 2. 7 406.4 50.0 1.207 11.12 7228,5 D 1957 CSE - 0 3-3 1 > UR-TO PRES. STEYN-WELCOM,RSA / 2,7 - - - 228.6 so.o 1.120 6.401 125.7 H 1957 CSE - 0 3-3 1 "' (')
PRES STEYN GOLD MIN CO. l'l:! UR-TO PRES.BRAND-RES.STEY~, RSA / 2. 7 - - - 254.o so.o 1.364 3,673 185.5 H 1957 CSE - 0 2-2
PRES STEYN GOL MIN CO UR-TO PRES,BRAND-SAUPLHS,GMCI., RSA / 2. 7 - - - 228,6 50.0 1.364 10,46 5.HE6 Y 1963 CSE - - 5 OR-TO DOORFOijTEIN, RSA/ 2. 7 - - - 215.9 50.0 0.872 10.67 77.8 H 1957 CSE - - 2-2
~EW CONSUL. GO FIELD LTD UR-TO ELLATON-STILFONTELN, RSA/ 2. 7 - - - 228,6 so.o 1.021 15.26 107.v H 1957 PL - - 6 l
GEN MIN & !'INA CORP UR-TO RSA /CO. SuR VAAL REEFS 1.28 - - - --- --- --- --- 2. 73E6 Y ---- DARE - - 4 UR-TO PRES,STEYN-WF.LCOM, RSA / 2. 70 - - - 228.6 so.o 1.12s 2,743 125.7 H 1957 CSE - 0 2-2
PRES. STEY1l G□L MIil CO
URN-T JADIJGUDA,BIHAR,LND/UR CORP OF INDIA --- - - - --- --- --- --- --- ---- ---- - -
ZN-T ZAWAR,RAJAS!HAN/lUNDUSTAN ZINC LTD. 2,85 100-.42 273x 28-40 2.00 2.30 3500 D ---- CSE RU 3 2-l 6 45-.074 7.14
ZN-T ZAWAR,RAJASTHAN/HUDUSTAN ZINC LTD. 2.as 100-.42 219x 28-40 2.00 2.30(2) 2000 D 1977 CSE RU 3 1-1 4s-.n4 7.14
ZN-T RAJPURA DARIBA,RAJASTHAN/HIN. ZN LTD 2. BS 100-.600 --- --- --- --- --- ---- ---- - -42-.074

SUMMARY OF MAJOR PIPELINE lNSTALLATIONS - VERTICAL
SLURRY CODE LOCATION/OWNER
SPEC ff IC GRAV, OF
SOLIDS
CO-C GREISENAU, DORTMilND, GFR
co-a co-a co- □ co- □ co-a co-a co-a co-□ co- □ co-a co~ □ co~a co- □ co- □ co-□ co-o co- □
EGERCSEHI, HUNGARY / COAL fUNE BORSOD GNEISENAU, W,GERMANY / BERGBAU AG HANSA, W, GERMANY/ BERGBAU AG DEBIENSKO MINE, POLAND SIERZA MINE, POLA~D ANDALUZJA MINE, POLAND SUTOGAN MINE, USS~ SELIOOVUG□ t. MINE, USSR ST, ETIENNE, FRANCE MITSUI-SUNAGAWA MINE, JAPAN YOSHIMA MINE, JAPAN LU-CHA-TO MINE, CHINA ROBINSON RUN .MINE, USA KARt. FUNK MINE, W, GER, GNEISENAU, W. GER. HAN SA, W. GER, LOVERIDGE MINE, USA
cu-□ BANCROFT MINE, RHODESIA
G-T BAAt. REEFS Kt.ERKSDORF MINE, RSA
ZN- □ SHUt.t.SBURG,WI, USA/ CAfUMET & HELCA CONS, COPPER
OD X WALL PSD THICKNESS CONC
%+-MM MM WT,
200, 0
150,0 150 .o 25c, .o 250 .o
200,0 190 .o 165,0 400,0 250.0 140,0 200.0 240.0 300,0
200.0
150,0
250.0
VEL M/S
L KM
0,700
,212 .670 .850 .309 .110 • 300 • 400 ,130 ,178 , 515 ,253 , 473 ,035 • 762 , 700 • 840 ,274
,400
2.200
,111
CAPACITY TONNES PER OPERATION PUMP (SEE NOTE) DATES TYPE
1E6 Y 1971 ---- -
60 H 1956 ---- -150 H 1971 ---- -250 H 1977 ---- -100 H 1957 ---- ---- 1958 120 H 1958
41 H 1959 ---- -21 H 1959 ---- -50 H 1960 ---- -
100 H 1965 ---- -110 H 1970
41 H 1974 ---- -270 H 1974 ---- -
73 H 1974 127 H 1974 ---- -209 Ii 1976 ---- -
1979 ---- -
143 1961
50 1970
220 1952
rm. □ PER. OF PUMPS-STA STANDBY REF
- - 17
----
---------
4
"' r; ; ::g
e z [;l
ei

NJMENCLHURE
SLURRY CODE: C=CONCENTRUES, T=TAILS/REFUSE,O=□RE
ASH-T AU-T BAU-T BO-T CE co-c co-o cu-c Cll-T FE-C FE-T GIL-0 GS-TO G-T HM-C KC- □ LI MA MIL-T NI-C NI-T ORE PHM- □ PHP- □ PHO-C PHO-T py-c SI-T SR-T SS-T UP-C UR-TO URN-T ZN- □ Z.N-T
nv ASH;T GOLD TAlLS SJ\UXITE TAILS BORAX;T CEMENT COAL;C C □ AL;U COPPEit;C COPPER;T IRON;C IRON ORE;T GILSONUE;O GLASS TAILINGS; I,O GOLD;T HEAVY MINERAL CuNCENTRATES;C KAOLIN CLH; □ LIMESl'ON!': MANURE !>!ILL TAILINGS;T NICKEL;C NICKEL;T STERILE ORE PHOSPHATE MATRIX;O PHOSPHATE PEBSLES;O PHOSPHATE CONCENTRATES PHOSPHATE TULINGS;T PYRITE CONCENTRATES; C
TAlLINGS;T ORE FLOTATION;T SLAG;T . PYRITE CONCENTRATES;C
URANIUM SLIME;T, 0 URANIUM TAILS ZINC ORE ZINC TAILS
LOCATION: STATES
THE STATES ARE COOED USlNG THE US POSTAL SERVICE SYSTEM CODES
E6 = ONE MILLION
S = SECONDS M = MINUTES H = HOUR D = y =
PUMP TYPE:
C CENTRIFUGAL DA DOUBLE ACTING G GRAVITY H = HORIZONTAL ME = METAL PA = PARALLES PO POSitIVE OISnACEMENT PI= PISTON PL = PLUNGER RE = RECIPROCAL RU= RUBBER SA= SINGLE ACTING SE = SERIES V VERTICAL 2 DUPLEX 3 TRIPLEX 4 QU.l\llR.I.PL8X 5 QUINTUPLEX
LOCATION:
ARG AUS BRAZIL : CAN CHILE COL ELSAL ENG GDR GFR HUNG IND !ND□ JAPAN MEX NKOR NL POL RSA TAS TRIN USA USSR WIRA
COUNTRY
ARGENTINA AUSTR4LIA BRAZIL CANADA CHILE COLUMBIA EL SALVADOR ENGLAND EAST GERMANY WEST GERMANY HUNGARY INDIA INDONESIA JAPAN MEXICO NORTd KOREA NETHERLANDS POLAND REPUBLIC OF SOUTH AFRICA TASMANIA TRINIDAD UNITED STATES USSR WEST IRIAN
j:
"" § §1
8 ~ !il ~ t"'
I i "'
i i:,; &l

REFERENCES
1 THE TRANSPORTATION OF SOLIDS IN STEEL PIPELINES, COLORADO SCHOOL OF MINES RESEARCH FOUNDATION lNC.,GOLDEN COLORADO 1963
2 FADDICK R, R.,STAMAN O. D.,PIPELINE TRANSPORTATION OF PHOSPHATE SLURRIES-A SURVEY, COLORADO SCHOOL OF MINES MINERAL INDUSTRIES BULLETIN,GOLDEN COLORADO, VOLUME 20 NO. 6, NOVEMBER 1977
3 SLURRY TRANSPORTATsON AND SHLPLOADING SYTEMS AT WAPIPPI lRO~SAtlDS,LIMITED BY MURPHY E. J.
4 PROCEEDINGS OF THE FIRST 1"TERNATIONAL TECHIIICAL CONFERENCE ON SOLID LIQUID TRANSPORT, SLURRY TRANSPORT ASSOCIATID~, COLUMBUS, OHIO, EBRUARY 3-4, 1976
5 MCNAMARA, E.J.,"JPERATIONAL PROBLEMS WITH A 69-MILE COPPER CONCENTRATE SLURRY PIPLINE",PAPER F3, HYDROTRANSPORT 4, BHRA PROCEEDINGS, HNFF, ALBERTA, MAY 1976
6 PERSONAL COMMUNICATION, ENGIN'lERS OF rnDH LTD,, FEBRUARY 1982
7 ONE-METER DIAMETER PLASTIC TAILINGS PIPELINE, M.HENDERSON, R,FADDICK, T.RANDOLF
8 KITSAULT TAILINGS LINE, UNPUBLISHED, M.HENDERSON
"HOMESTAKE'S GRIZZLY GULCH TULINGS DISPOSAL PROJECT" LAWRENCE F, JEFFRIES & ANDREW TEZAP
10 DESIGN CONSTRUCTION & OPERATION OF A LONG LARGE DIAMETER POLYETHYLENE TAILINGS PIPELLNE, DELL SCOTT.
11 "ECONOMIC ASPECTS FOR THE APPLICATION OF SOLIDS-WATER TRANSPORTATION FOR MINERAL COAL," AUFBEREITUNGS - TECHNIK, N0.11, PP, 574-579, 1976 K□ gLING, R., LEININGER,. D. TRANS, FROM GERMAN BY TERRASPACE, INC,, SEPT,, 1980
12 MIURA, H., AND MASE, S,, 1979, "OPERATION AND MAINTENANCE OF SLURRY TRANSPORTATION SYSTEM AT HYDRAULIC COAL MINE," IN PROCEEDINGS OF THE 4th INTERNATIONAL TECHNICAL CONFERENCE ON SLURRY TRANSPORTATION: LAS VEGAS, NEVADA, MARCH 28-30, PP, 43-50
13 BAIN, A,G., 1963, "GETTING WORKING DATA ON COAL PIPELINES," IN ENGINEERING: LONDON, ENGLAND, VOL, 196,pp.322-323
14 ZIMMER, G ,F., 1916, THE MECHANIC AL HANDLING AND STORAGE OF MATERIAL: NEW YORK, N. Y,, 0. VAN NOSTRAND CO.:, 744P.
15 MOIITFORT, J,G,, 1980, "OPERATING EXPERIENCE OF THE BLACK MESA PIPELINE," IN PROCEEDINGS OF THE 3rd INTERNATIONAL COAL UTILIZATION EXHIBITION AND CONFERENCE--V□LUME II, TRANSPORTATION: HOUSTON, TEXAS, ,,OVEMBER 18-20,PP309-335
16 HALVORSE~, W,J,, "EXPERIENCE OF lHE OHIO COAL PIPELINE," IN COAL TODAY AND TOMORROW, JUNE 1964
17 BAKER, P.J,, 1976, "A REVH:W OF SLURRY PIPELINING AND ITS FUTURE POTENTIAL PARTICULARLY FOR COAL TRANSPORT OUTSIDE NORTH AMERICA," lN PROCEEDINGS OF THE INTERNATIONAL TECHNICAL CONFERENCE SOLID-LIQUID SLURRY TRANSPORTATION: COLUMBUS, OHIO, PP. 8-1 TO 8-17
"' s ~
?;]
I "'
8:


COMPOSITE BEAMS WITH WEB OPENINGS 67
David Darwin1
ABSTRACT
The research and current analysis tools fo.r composite beams with web
openings are reviewed. The behavior and failure modes at openings are described
and the major remaining questions are listed. Research has demonstrated that
the concrete slab contributes to the shear strength as well as flexural strength
at openings. Taking advantage of this contribution to shear strength should
significantly lower the cost and simplify the construction of web openings in
composite beams.
INTRODUCTION
Composite floor systems allow considerable savings in multistory buildings
because of the lighter, and sometimes shallower, floor that may be used when
compared with noncomposite systems. Economies in high-rise steel frame build
ings have been achieved by introducing web openings in the floor beams to permit
the passage of utility ducts and pipes, thereby reducing the story height.
However, openings weaken the sections and usually require costly reinforcing.
Prior to 1977, considerable research had been conducted on composite beams
and on beams with web openings, but no comprehensive investigation of composite
beams with web openings had been undertaken, Beginning with work at the
University of Kansas, a number of experimental and analytical studies have .been
aimed at determining the behavior of composite beams at web openings and
translating that behavior into a usable design approach, A number of those
studies are still under way.
1 Professor of Civil Engineering, University of Kansas, Lawrence, Kansas 66045
Note: This paper originally appeared in the Proceedings of the AISC National Engineering Conference, held in Tampa, Florida, March 28-30, 1984. It was also presented to the Structural Group, BSCES/ASCE, on February 6, 1985.

68 BOSTON SOCIETY OF CIVIL ENGINEERS SECTION, ASCE
It is the purpose of this paper to summarize the current state of knowledge
in the field of behavior, analysis and design of composite beams with web
openings. The paper describes the behavior at web openings, summarizes past and
current research, offers an overview of the current analysis methods and lists
what appear to be the major remaining questions.
BEAM BEHAVIOR
This section gives a brief overview of the forces that act on a composite
beam in the vicinity of a web opening and describes the response of the beam to
these forces.
Forces Acting at Opening. - The forces that act at an opening are
illustrated in Fig. l, For the usual case of positive bending, the steel
section below the opening, or bottom tee, is subjected to a tensile force Pb,
shear Vb, and secondary bending moments Mbl and Mbh' The section above the
opening, or top tee, is subjected to a compressive force Pt• shear Vt, and
secondary bending moments Mtl and Mth" Based on equilibrium
Pb= Pt= P•••••••••••••••••••••••••••••••••••••••••••••••• ••• (I)
V =Vb+ Vt•••• .. ••••••• ................................ , ..... (2)
2Vba = Mbl + Mbh••••• ............................................................. (3)
2Vta = Mtl + Mth' ... ,,,, ... , , , , .... , , , • , , , , , , .... , , , ••.,,, , •• ,(4)
M = Pz + ~h + Mbh - Va ....................................... (5)
in which V = the total shear acting at the opening; M = the primary
moment acting at the opening center line; 2a = the length of the
opening; and z = the distance between the plastic centroids in the
tees.
Deformation and Failure Modes. - The deformation and failure modes for
beams with solid slabs are illustrated in Fig. 2, The behavior at an opening
depends on the ratio of moment to shear, M/V.
For a high M/V ratio the opening deforms primarily in a flexure (Fig. 2a),
with the steel in tension and the concrete in compression. Shear and secondary
bending do not play a major role.
As the M/V ratio decreases, the shear and secondary bending moments
increase, causing an ever increasing differential, or Vierendeel, deformation to

COMPOSITE BEAMS 69
J
( V ~o_: d., ·•°'. ' ·t,· 0
<> • d • ·•
M-Va
\ Low Moment
End
I I--- 2a ---1
Fig. 1. Forces Acting at Web Opening (Ref. 4)
(al
~ \ l (cl
' .. V \ 0 ~ 0 .i,.
I M+Va
1 J High Moment
End
(bl
□ (dl
J Fig. 2. Failure Modes at Web Openings in Beams with Solid Slabs (a) Pure Bending,
v~o; (b) High M/V; (c) Lower M/V, Concrete Crushes; (d) Low M/V, Diagonal Tension Failure in Concrete
occur through the opening (Fig. 2b,c,d). The sections above and below the
opening usually exhibit a well defined change in curvature, as shown in Fig.
2c,d. In these cases, the concrete cracks above the low moment end of the
opening due to the secondary bending moment. Depending on the M/V ratio, the
concrete at the high moment end of the opening will either crush or undergo a
diagonal tension failure due to the prying action across the opening.

70 BOSTON SOCIETY 01' (:IVIL llNGINBERS SECTION, ASCE
Undec pun bendi ng ( \I = 0) • the top .ind bottom tees will be i n a uniform
eta.Ce of stt:ess aloog the full lenp,th of the opening , Por \I -/, O, the tff8 gill
by ct b cracitJ.,,g o"er che btgh !OOfl>ellt e :-id of tbe OJ>e1tlog- (ng. 3) t as weU 4!1
i:u oaverae craC:.:.Log over ti~ 10<.-• 1toaeJ\c eod. l'ailu.re 18 governed \>y <:oncret~
hHur e ,u "ulld t ile s tu:la, which «:ay ,;a ry froro a pullo1.1t t ype of failure a t t he
betwe~n the l ow 0>0ttent efl<i a nd the poiot of ,;ero ,0011,e.nt.
rt~. 3. Pat11.1re. ~t Reb Opening LI\ 3uu v i t:h Rib!ted Sln~ (,:c:c i:.•ot test n t Ul\iver:d ty oe K.:lnl':.:lts;}
B'len for very hlgl\ H/1J ratios , h rge amounts of s lip oc<".ur botwm; fl the:
cooerec~ Jeek. aoJ the steel section over the opening , with both so\t.d .-.n.d d bHd

Mlcrostraln 2700
==--=----L 1-700
-2625
COMPOSITE BEAMS
Mlcrostraln
-375 \]
-ll80~
9670
71
Low High 11700
~ -495 Late Yield
-2740
' 1550
Fig. 4. Strain Distributions at Web Opening in Beam with Ribbed Slab (recent test at University of Kansas)
The tests that have been run to date (2,3,5,7,11,12) uniformly show that
the concrete slab makes an important contribution to the shear strength at the
opening. This contrasts with standard practice in composite beam design (1),
where the concrete deck is used to resist the bending moment but shear is
assigned solely to the web of the steel section.
With this information as a background, the next section describes the
research that has helped develop the current state of knowledge.
RESEARCH
Composite Beams with Solid Slabs. - The first tests of composite beams with
web openings were made by Granade (7). He tested two beams with rectangular web
openings, and attempted to predict the experimental stresses using the
Vierendeel method. In his analysis, he assumed the points of contraflexure in
the tees to be at the opening center line.
elastic analysis were not accurate.
The stresses obtained from this
Todd and Cooper (15) developed an ultimate strength model for composite
beams with web openings, using the assumption that the shear force is carried
only by the web of the steel section. They used their model to generate
interaction diagrams to represent beam failure at different combinations of
moment and shear. In a comparison with the experimental results of Granade, the

72 BOSTON SOCIETY .OF CIVIL ENGINEERS SECTION, ASCE
model greatly underestimated the shear strength at the openings (Fig. 5). Their
work, however, played a useful role and clearly pointed the way for later
models,
.3
.2
.2
Beam 2
.3 V .4 Vp
.5
Fig. 5. Comparison of Todd-Cooper Model with Granada's Beams (Ref. 15)
Swartz and Eliufoo (14) developed a method for determining the neutral axis
at web openings in composite beams using the Vierendeel method while considering
the cracked concrete section, Their method compared reasonably well with finite
element solutions,
Clawson and Darwin (2-4) undertook an experimental investigation to study
composite beams with rectangular web openings and developed a strength model to
predict the behavior of the beams,
They tested six composite beams with solid slabs (Fig. 6) and observed that
the compressive strains in the concrete remained low, well after the steel had
begun to yield, They found that the load at first yield did not give a good
representation of the strength of the section, with the load at first yield
varying from 17 to 46 percent of the failure load, As a general rule, the
failure of the beams was ductile, that is they obtained large deformations. and
sizeable concrete cracking prior to failure,

COMPOSITE BEAMS 73
Fig. 6. Beams Tested by Clawson and Darwin, not to scale (Ref. 3)
The peak loads were governed by failure of the concrete slabs. Prior to
failure, large slips occurred between the concrete and the steel. It was not
clear to Clawson and Darwin as to what impact this slip had on strength, The
nature of the slip is illustrated by the strain distributions in Fig, 7, which
show that even for beams designed for full composite action, a sizeable strain
discontinuity exists between the concrete and the steel at both ends of the
opening,
•140 •310 ~1 6 Cl, I • '\' 4 . ·t 1401 ~ --~ . . •
Low High ·270 Low High 1600 , 850 ·i \ 1100~
40 Elastic First yield 50
Mlcrostraln Mlcrostrai n
471 ii # 0 • Q . ~t, 1 ~ . . . . 0 .
>20000
1600 Low High -2100 9100 Low High_\
~00~ 1
\ 12000~ I Late yield l O ·l Collapse 1000
Wl&c45 No. 4 WV· 3ft
Fig. 7. Strain Distributions at Web Opening in Beam with Solid Slab (Ref. 3)

74 BOSTON SOCIETY OF CIVIL ENGINEERS SECTION, ASCE
Perhaps the key observation of their tests was that the concrete
contributes to both the shear and flexural capacities of the beam at the web
opening, and that therefore, the contribution of the concrete to the shear
strength must be considered to accurately predict the strength at the section.
Their test results also demonstrated that the moment capacity at web
openings is relatively unaffected by shear until the shear reaches the maximum
shear capacity (Fig. 8).
1.4 ,------------------------,
l. 2
1.0
0.4 --w1sx45 and Wl8x46 ----.Wl4x34
0.2
0,1 0,2 0.3 0.4 0.5 0.6 o. 7 0.8 1.0 VNmax
Fig. 8. Moment-Shear Interaction for Test Specimens with Solid.Slab (Ref. 3)
Clawson and Darwin also observed that the M/V ratio at the opening had a
prominent effect on the failure mode (Fig. 2). For openings under high bending
stress and low shear, failure tended to be governed by crushing of the concrete,
while beams under moderate or high shear exhibited a Vierendeel action, with a
great deal of differential deformation through the opening. They also found the
point of inflection was not at the center of the opening, but had displaced
towards the low moment end.
Their strength model (4), provided satisfactory predictions of strength and
failure mode (Fig. 9). The model was based on full composite action and
assigned a portion of the shear to the concrete slab. The concrete slab was
assumed to be fully cracked above the low moment end of the opening. Although

COMPOSITE BEAMS 75
this assumption did not match the test observations, it did not appear to be
detrimental to the model,
Fig, 9.
1.2
"E ill j 0,6
'al ,!:!
! 0.4
0.2
0.2
M,,,,.ln vtflO)(c,;q
Beam Inch-kips In kips 2 4630 71.3 3 3660 72.2 4 4770 79,2 5 4930 75.8
• Observed Failure • Predicted Failure
0.4 0.6 0,8 1.0 Normalized Shear V{y...._
Comparison of Predicted with Observed Failure - Clawson and Darwin (Ref. 4)
Clawson and Darwin also developed a simplified version of their model for
use in design (2), which provided reasonably good agreement with the interaction
diagrams developed using the full strength model (Fig. 10).
4000 ,----......-----,-----,,.....----,----..-----,
VI 3000 C.
:52 I C
~-E 2000 0 E i:'..' "' E
J: 1000
-
0
---- ,.....,-Clrcular Interaction ----.............::
~Beam No. 4
"\ ~
10 20 30 40 50 60 Shear force, kips
Fig. 10. Comparison of Simplified (Gircular) and Full Strength Model MomentShear Interaction Diagrams (Ref. 2)
In 1982, the experimental work of Clawson and Darwin was largely duplicated
by Cho (5) who arrived at virtually the same conclusions.

76 BOSTON SOCIETY OF CIVIL ENGINEERS SECTION, ASCE
In 1983, Momeni (8) modified the model developed by Clawson and Darwin to
include web reinforcement in the analysis. His model allowed the cracked
portion of the slab at the high moment end of the opening to carry shear. The
model produced unconservative results for beams with low M/V ratios, high shears
and a shallow steel section.
Composite Beams with Ribbed Slabs. - In contrast to the earlier tests that
used solid slabs, Redwood and Wong ( 11, 16) tested composite beams with slabs
constructed with formed steel decking, keeping with current practice in
composite building construction. They tested six sections with web openings
(Fig. 11) and developed a simplified, conservative strength model. p
I 1000 I '
W 2601122 Beam 0
W36ox51 8eam 1
[~:::~:=:t"''t'$r' .. a"':::~:~ 3:4 P/4
Fig. 11. Beams Tested by Redwood and Wong, not to scale (Ref. 11)
From their study, Redwood and Wong found, as did Clawson and Darwin, that
the moment-shear ratio played an important role in the mode of failure. At high
M/V ratios, the mode of failure was primarily flexural, although Vierendeel
action was evident. As the M/V ratio at the opening decreased, the amount of
shear deformation through the opening increased and became dominant for openings
located in high shear regions.
Failure at the openings was also governed by failure of the slab. However,
the mode of failure was distinct from that in solid slabs, in that rib separa
tion occurred in all tests (Fig. 12). They obtained compressive failures in the

COMPOSITE BEAMS 77
slab for high and medium M/V ratios and separation of the slab and beam near the
high moment end of the openings for high shear (low M/V) cases.
Hole 1 D Support
I
23 28 34
lo 0 0 .!Lo---,, 28 .,/ .. - -u 0
Hole 1 34 23 28
)
Fig. 12, Crack Patterns in Ribbed Slab (Ref. 11)
They concluded from observing their test specimens that a strength model
based on the formation of four hinges, one at each corner of the opening, was
satisfactory, but that analytical models must account for the shear in the
slab. They also pointed out that the rib separation would be difficult to
include in an analytical model. They used an assumption, similar to that used
by Clawson and Darwin (2 ,4), that the concrete carries no stress at the low
moment end of the opening. Based on their comparison with test data, however,
they felt that it was important to model the compressive stresses in the slab
that occur at the low moment end of the opening. They also felt that the
effects of differing amounts of composite action (shear connection between the
slab and the beam) should be studied. Their model, along with the simplified
version of Clawson and Darwin's model and a model based on non-composite
behavior, is compared against four of their tests in Fig. 13.
In terms of serviceability, Redwood and Wong expressed concern about the
possibility of cracking at working loads over the low moment end of openings
subjected to low M/V ratios.
More recently, Redwood and Poumbouras (12) performed three additional tests
to study the influence of studs over the opening on beam strength and the effect
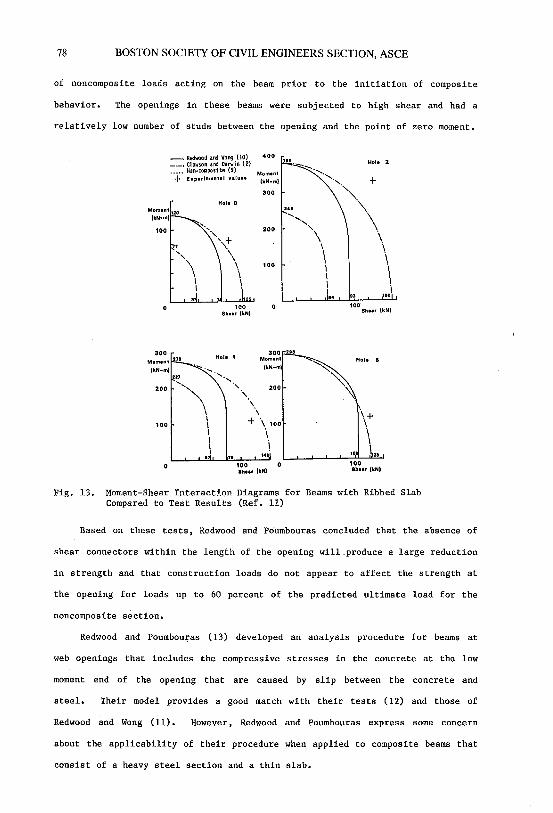
78 BOSTON SOCIETY OF CIVIL ENGINEERS SECTION, ASCE
of noncomposite loads acting on the beam prior to the initiation of composite
behavior. The openings in these beams were subjected to high shear and had a
relatively low number of studs between the opening and the point of zero moment.
- Redl«lod and Wong (10) 400 -·-• Clawson and Darwin (2) ..... llon-cornposi te (9) Moment
+ ExpHlmenUI value• (kN-m)
300
Hol1 0 Moment
120 (kN-m)
'· ' 200 100 '· '·<I·
' .... \
' \
' \ 100
\ i \ I I I
,). 0 100 0
Sh"r lkN)
300 Hola 1
300 Mom,nt m Momant
(kN-m) -., (kN-m)
m ' ' 200 ', .... 200
'" ' I \ I \ I + \ 100 I 100 I I I \ I I
I " 14
0 100 0 lhur lkN)
,.. •:,,,..·:---.. . ....._
·,.,.
241
........... ,, \ \ I I I I I I I ..
"
Hole 2
+ '·"·
\ \
\ \ I
\ ,.. 100·
Sh,., (kN)
Hole 5
\+ \ \
100 Shur (kN)
Fig. 13. Moment-Shear Interaction Diagrams for Beams with Ribbed Slab Compared to Test Results (Ref. 11)
Based on these tests, Redwood and Pciumbouras concluded that the absence of
shear connectors within the length of the opening will.produce a large reduction
in strength and that construction loads do not appear to affect the strength at
the opening for loads up to 60 percent of the predicted ultimate load for the
noncomposite section.
Redwood and Poumbouras (13) developed an analysis procedure for beams at
web openings that includes the compressive stresses in the concrete at the low
moment end of the opening that are caused by slip between the concrete and
steel. Their model provides a good match with their tests (12) and those of
Redwood and Wong ( 11) • However, Redwood and Poumbouras express some concern
about the applicability of their procedure when applied to composite beams that
consist of a heavy steel section and a thin slab.

COMPOSITE BEAMS 79
Donoghue (6) recently presented a design procedure that neglects the
contribution of the concrete slab to the shear strength at the opening and,
instead, strengthens the opening by adding reinforcement (Fig. 14).
324 !\it. distributed food
~ I 100010
I ::m: 35'(1os1m) • I
~ 4000.
Mu
~8.5klps
20. 40. 60.
Fig. 14. Example Problem and Interaction Diagram for Reinforced Web Opening (Ref. 6)
Ongoing Research. - Work on composite beams with web openings is continuing
at the University of Kansas, To date, a total of eleven openings in composite
beams with formed metal decking have been tested, These tests indicate that the
nature of failure is ductile, but that in all cases, including high M/V ratios,
a rib separation takes place as observed by Redwood and Wong ( 11). Based on
observations after failure, rib separation appears to be caused by concrete
failure around the studs. The Vierendeel deformation through the opening pries
the studs at the opening, but appears to reduce their contribution only
slightly.
A series of tests specifically designed to study the influence of studs on
strength seems to indicate that studs between the opening and the point of zero
moment, as well as studs over the opening, make an important contribution to the
capacity of sections subjected to high shear. When the studs between the
opening and the point of zero moment are "heavy", the relative contribution of
the studs over the opening appears to be small, while for beams with a lower
number of studs between the opening and the point of zero moment, the studs over
the opening appear to play an important role.
INTERACTION DIAGRAMS
Models to represent the strength of composite beams at web openings
( 2 ,4 ,6, 9, 11, 13, 15) do so through the construction of moment-shear interaction

80 BOSTON SOCIETY OF CIVIL ENGINEERS SECTION, ASCE
diagrams (Fig. 5,9,10,13,14). There are a number of similarities between
models, although the details involved in constructing the diagrams differ, As a
minimum, the analysis usually starts with the determination of the pure moment
capacity (i.e., V = 0) and the pure shear capacity (i.e., M = 0) at the
opening. Once these values have been obtained, the simplier models (2, 11, 13)
then utilize curves, such as an ellipses, to construct the balance of the
interaction diagram.
The more complete strength models generate the full diagram, point by
point, based on an analytical representation ( 4, 9, 15). For these models, the
interaction diagrams are developed by calculating the primary moment, M, that
can be carried as the shear, V, is increased from zero to the maximum value.
For each value of shear at the opening, a portion is assigned to the top and
bottom tees. The axial force and secondary bending moments in the bottom tee
are then obtained. An axial force of equal magnitude, but opposite sign
(Eq, (1)) is assigned to the top tee. The shear in the top tee is distributed
between the concrete and steel at the high and low moment ends, based on the
assumptions inherent in the model. The shear distributions between the top and
bottom tees, and between the concrete and steel within the top tee may be varied
to maximize the primary bending moment, M,
For the models designed to predict the strength of unreinforced openings
(2,4,9,11,13,15), there is virtually no disagreement on the strength of the
sections under pure bending. The various models differ in how they handle the
high shear cases and how they represent the interaction diagram between pure
bending and pure shear.
Clawson and Darwin (2,4) assume full composite behavior for beams with
solid slabs and generate the interaction diagram by first determining the
distribution of shear between the top and bottom tees for the case of zero axial
force within the tees (Pb • Pt = 0). This ratio is then held constant as the
value of total shear, V, is increased from zero to the maximum value. The
corresponding bending moment, M, is maximized for each value of V, since the
procedure is an equilibrium method which produces a lower bound solution.
For their simplified model, Clawson and Darwin (2) generate only the pure
bending and pure shear strengths and then connect the two with an ellipse (Fig.

COMPOSITE BEAMS 81
10). This model has recently been adapted to include partial composite action
and is proving to be a useful research tool.
Redwood et al. (11,13) calculate the maximum bending and shear strengths.
Using a procedure developed by Redwood (10), Redwood and Wong (11) calculate the
maximum moment that can be sustained at the maximum shear. Redwood and
Poumbouras ( 13) obtain the moment corresponding to the maximum shear, using
Eq. (5). In each case this generates a vertical line on the right side of the
interaction curve (Fig. 13). The curve is closed with an ellipse.
THE MAJOR QUESTIONS
A number of major questions ·must still be answered before the development
of a comprehensive model for the strength of composite beams at web openings can
be completed. First among these questions is the contribution of the studs at
the opening and between the opening and the point of zero moment. Current work
at the University of Kansas seems to indicate that there are some conditions in
which studs over the opening can increase strength, and others where they have
only a small effect.
Redwood and Poumbouras (13) have expressed some concern about beams that
combine a large steel member with a relatively small slab, a case which may
occur for main flexural members in buildings. They are also concerned with the
applicability of their model to openings with large downward eccentricities.
The subject of serviceability criteria is important. Exactly what the
criteria should be, deflection and/or cracking, is being addressed at the
University of Kansas.
Another important area of research is the development of low cost
reinforcing procedures that can be used when the strength at the opening is not
satisfactory. Work here should offer attractive alternatives to the addition of
stiffeners around the opening.
SUMMARY'
This paper has given a brief review of the research and the current analy
sis tools for composite beams with web openings. A great deal of progress has
been made during recent years in both understanding the behavior of the beams
and representing their strength. Research has demonstrated that the concrete

82 BOSTON SOCIETY OF CIVIL ENGINEERS SECTION, ASCE
slab contributes not only to the flexural strength, but also to the shear capa
city of composite beams at web openings. Taking advantage of this contribution
to shear strength should significantly lower the cost and simplify the construc
tion of web openings in composite beams.
ACKNOWLEDGEMENTS
Research at the University of Kansas on composite beams with web openings
has been supported by the National Science Foundation under NSF Grant ENG 76-
19045 through a subcontract from Kansas State University and by University of
Kansas General Research Allocation f/3128-X0-0038, The work is currently being
funded by the American Institute of Steel Construction under Research Project
21,82, Studs and stud welding equipment are being furnished by the Nelson Stud
Welding Division of TRW and steel decking is being supplied by United Steel
Deck, Inc. The contributions of Rex C. Donahey, graduate student who is
actively engaged in this research at the University of Kansas, are gratefully
acknowledged,
REFERENCES
1, American Institute of Steel Construction, Inc,, Manual of Steel Construction, Eighth Ed,, Chicago, Illinois, 1980, pp. 5-36 -5-41.
2, Clawson, William C,, and Darwin, David, "Composite Beams with Web Openings," Structural Engineering and Engineering Materials SM Report No. 4, University of Kansas Center for Research, Inc,, Lawrence, Kansas, Oct, 1980, 209 PP•
3, Clawson, William C. and Darwin, David, "Tests of Composite lleams with Web Openings," Journal of the Structural Division, ASCE, Vol, 108, No. ST!, Jan. 1982, pp. 145-162.
4, Clawson, William C. and Darwin, David, "Strength of Composite lleams at Web Openings," Journal of the Structural Division, ASCE, Vol. 108, No. ST3, Mar. 1982, PP• 623-641,
S. Cho Soon Ho, "On Investigation on the Strength of Composite Beams with Web Openings," thesis present'ed to Hanyong University, Seoul, Korea, Dec. 1982, in partial fulfillment of the requirements for the degree of M,S,Arch,Eng,, 270 PP•
6. Donoghue, C, Michael, "Composite lleams with Web Openings: Design," Journal of the Structural Division, ASCE, Vol. 108, No, ST12, Dec. 1982, pp. 2652-2667.
7. Granade, C,J., "An Investigation of Composite Beams Having Large Rectangular Openings in Their Webs," thesis presented to the University of Alabama, at University, Ala., in 1968, in partial fulfillment of the requirements for the degree of Master of Science.

COMPOSITE BEAMS 83
8. Moemni, Ali M., "Strength of Composite Beams with Eccentric, Reinforced, Rectangular Web Openings," dissertation presented to Kansas State University, at Manhattan, Kansas, in 1983, in partial fulfillment of the requirements for the degree of Doctor of Philosophy, 151 pp.
9. Poumbouras, George, "Modification of a Theory Predicting the Shear Strength of Composite Beams with Large Web Openings," Project Report No. U83-20, Department of Civil Engineering and Applied Mechanics, McGill University, Montreal, Quebec, Canada, April 1983.
10. Redwood, Richard G., "Plastic Behaviour and Design of Beams with Web Openings,". Proceedings, First Canadian Structural Engineering Conference, Toronto, 1968, Canadian Institute of Steel Construction, Willowdale, Ontario, Canada, PP• 128-138.
11. Redwood, Richard G. and Wong, Patrick P.K., "Web Holes in Composite Beams with Steel Deck, Proceedings, 8th Canadian Structural Engineering Conference, Canadian Steel Construction Council, Willowdale, Ontario, Canada; Feb. 1982, 41 pp.
12. Redwood, Richard G. and Poumbouras, George, "Tests of Composite Beams with Web Holes, Canadian Journal of Civil Engineering, Vol. 10, No. 4, Dec. 1983, pp. 713-721.
13. Redwood, Richard G. and Poumbouras, George, "Analysis of Composite Beams with Web Openings," Journal of Structural Engineerigg_, ASCE, Vol. llO, No. 9, Sept. 1984, pp. 1949-1958.
14. Swartz, Stuart E. and Eliufoo, Krigo, s., "Composite Beams with Web Openings," Journal of the Structural Division, ASCE, Vol. 106, No. ST5, Tech. Note, May 1980, pp. 1203-1208.
15. Todd, David M. and Cooper, Peter B., "Strength of Composite Beams with Web Openings," Journal of the Structural Division, ASCE, Vol. 106, No. ST2, Feb. 1980, pp. 431-444.
16. Wong, Patrick P.K. and Redwood, Richard G., "Pilot Test of a Hollow Composite Beam Containing a Web Opening," Structural Engineeri!,g_R,_~p9.!:!_ No. 80-6, McGill University, Montreal, Quebec, Canada, Dec. 1980, 40 pp.


PROFITABILITY AND PRODUCTIVITY OF STRUCTURAL ENGINEERING COMPUTER SYSTEMS
85
Gary R. Koser
INTRODUCTION
Computers bring out the best and worst in people because there is a large
range of thought and feeling about them, what they can do, what they can't do,
how they do it, and what they do it with. My background is primarily in
consulting, and in that capacity I have spent 10 years working with people either
getting actual drawings out the door or helping them install the computer systems
that can. My purpose is to provide you with a brief overview of where we are;
i.e., state of the art information on hardware and software. There are over 400
companies making computer systems today: - all different price ranges, speeds,
quality, etc. It is just a phenomonal and an exciting field to be in. What was
true yesterday may not be true tomorrow and it is up to you to research and find
out about it.
I am going to talk about profitability and productivity in terms of using
computer systems. Let me start with a little background. Where did we start? I
started with the slide rule, log tables, and different mathematical formulas,
etc. In that same time frame the first computers were being put together at the
University of Pennsylvania. The new dawn came in 1972 when HP came out with its
electronic slide rule, the HP-35, My parents were interested in furthering my
education so they spent $400 for this calculator. A few years later the price
was $150 and now you can get it for $10, It is simply amazing how rapidly the
market changes. This was the start of one type of revolution - the calculators
and the basic chips that go into this kind of machine. In 1972 our company
started with the WANG 2200 computer system from Dr. Wang (who is right up the
road a little bit from where we are). This was one of the first BASIC,language
mini-computers. We wrote engineering software for the Wang 2200 because there
wasn't anything available in 1972 when it first came out. Suprisingly enough,
A transcription of a lecture President, ECOM Associates, Inc., Structural Group Committee, Boston Society of Civil Engineers, Boston,
presented by: Gary R. Koser, P,E,, Vice Milwaukee, Wisconsin. Sponsored by the
Society of Civil Engineers Section, American Massachusetts, November 30, 1983.

86 BOSTON SOCIETY OF CIVIL ENGINEERS SECTION, ASCE
that machine still works in our office after ten years. However,
it seems that nobody wants to use it anymore because we have other
machines that are faster, better, and solve hiaaer nroblems.
COMPUTER PARAMETERS
Basically, what we look for and the things that you should be looking at
with regard to computer systems relate to the following:
1) Number crunching -- computers obviously have the ability to do complex calculations. That is what they are really built for and this is where most of the use and progress in terms of structural engineering software has been. We find that many programs today are doing things that by hand we wouldn't even dream of doing.
2) Storing data -- Most systems are strong in retrieving the data from disks, diskettes, tapes, etc.
3) Driving peripherals plotters, graphics, system.
Various kinds of disk CRT's, and other pieces can be
drives, printers, attached to the
4) Controlling intruments or R & D types of things.
These are related to failure investigations
The computer system today can do so much more than we can.
But there are things a computer can't do. These considerations revolve
around the application of ingenuity in solving a problem. Just how do I want it
to solve the problem, where do I want it to lead, and what does the result mean.
In many cases there are hundreds of different paths to solve any particular
problem. This is where human reasoning comes in, It is human imagination and
creativity that will make this computer system into a tool that you can use. A
tool that will become part of your office just as the slide rule was ten years
ago and what the computer aided drafting machine might be ten years from now.
COMPUTER APPLICATIONS
As a consulting engineer the major emphasis revolves around having the
computer do structural analysis and design calculations for us, we have a 25 man
firm which includes 15 professional engineers. We have six terminals available
either on the Wl\NG system or the personal computer systems in the office. At any
time, one of us can walk up to a machine and run an analysis or go through a
design process. The machine does the numbers and the engineer provides the
concept and the ideas that he wants to test as the solution.
In addition to engineering applications we are doing word processing.

STRUCTURAL ENGINEERING COMPUTER SYSTEMS 87
Everyone should be aware of what computers can offer in terms of word processing,
spec writing, proposals, etc. Our word processing software ended all repetitive
typing and proof reading in our office. Accounting is another big area for
computer usage in a consulting firm. Probably the most time consuming aspect of
an engineering office in relationship to office management functions is the
posting of time cards and expense information into a job record so that the
client can be billed. Obviously, billing is necessary for us to be paid.
Another application for a computer system is for data processing (in terms
of marketing and data base management). Questions such as for what clients have
we done what jobs and where we have done a certain type of building can be easily
answered. For example, a surveying office that we work with bas all of their
surveys and places where they have done surveys on the computer system so if they
are proposing to work for somebody, they can look at what benchmarks they have
and what reference points are already set. They can come back with a much more
precise answer regarding what it would take to do that particular job.
The last item to mention is the automated drafting function. Many firms, the
larger firms in particular, are starting to get into this primarily due to
governmental pressure. A rather large firm in Houston had to buy a certain
computer aided drafting system because they are going to do work for the Air
Force in San Antonio. There was no choice. They had to buy this particular
system and that was it because the government mandated it. Fortunately, the
project was big enough that they could put the $200,000 price tag into the
project cost. Not many of us can do that. We are starting to see the
computerized, automated drafting function move into the smaller firms but the
transition will be fairly slow. Then, as hardware prices once again take another
cycle downward, software will be available that will justify this economic
investment for a f-irm of five to ten people.
COMPUTER HARDWARE TERMS
More specifically, regarding hardware I know I might be using terms that may
be new to a few people. Obviously, the key thing I am going to be discussing
hardware-wise revolves around the Central Processing Unit. There are, as I said,
400 firms making "CPU's" right now, ranging from the popular ones such as the

88 BOSTON SOCIETY OF CIVIL ENGINEERS SECTION, ASCE
Apple and IBM to such up and comers as Pixel, Plexus, Apollo, and many others.
Mass storage corresponds to the magnetic storage medium of the system, be it
a flexible disk, a hard disk, or tape drive. There are systems available which
allow you to put millions of characters of information on 5-1/4" surfaces. Also
coming are 3-1/2" diameter surfaces which make the system small enough to fit on
a desktop and still be extremely powerful.
The CRT, the display message center, is the heart of any computer system.
This is where you are going to know what's going on and where you are going to
tell the machine what you want done. Probably the key thing happening here is
the influence of graphics on the CRT. Graphics will make the system easier to
understand. Even the answers are more informative by using graphics.
Memory is in the central processing unit and the place where programs are
executed. Recently memory has dropped
bought our WANG system, an 8K memory board
in price dramatically, When we first
was about $2,500, Now I can buy 128K
memory boards ·for $500, There has also been a dramatic shift in the memory
available on the machines. Most of the personal computers that you see coming out
today start at 128K or 256K; in fact, some of the HP systems start at 512K.
This is phenomenal compared to ten years ago when 4K was a big deal.
There are great differences in keyboards as well, Obviously, for an
engineering function you want a numeric keypad so you can key in joint, load, and
member numbers quickly and easily. Some of the systems such as Apple II do not
have a numeric keyboard. You have to use the upper row of keys on the typewriter
for the numbers. There are great differences in the keyboard with regard to how
they feel and operate.
Printers range over the price spectrum from $250 up to thousands of dollars
depending on quality, speed, and accessories that you might want for your
computer system,
COMPUTER TRENDS
At this time I would like to discuss some trends with computers. One trend
is that computer hardware costs are going down, and a decline of 20% a year is
not unbelievable. Manufacturers are not changing their prices but rather they
are putting in things that last year were options or extras to the systems. I
think that pricing has bottomed out for business professional systems. There

STRUCTURAL ENGINEERING COMPUTER SYSTEMS 89
is tremendous competition on the home/hobby level at this time. In the home
machines, four of the five major manufacturers lost money last year, sG----they
won't survive very long or they will be raising their prices.
The other side of the graph is labor and this corresponds to the software.
The cost of producing and maintaining software is very labor intensive. I know
that our programming people want to get paid more every year. Therefore, the
software costs will continue to increase in specialized areas such as structural
engineering. If you are looking at word processing, there is a wide open market
and the prices are coming down. Database management information systems also
have a wide open range of applications and, therefore, the prices are coming
down. On the specialized side, whether you are a doctor or a lawyer or an
engineer, the software costs aren't going to come down. Prices will increase in
proportion to labor costs involved.
Another thing that is happening is the computer need explosion. As Forbes,
Business Week, and others have predicted, by 1985 there will be fivefold increase
in computer units sold, taking the market from roughly a billion dollars to five
billion per year over the next three years. The phenomonal growth in this market
bas one very confusing aspect, namely, you don't know who to believe anymore with
regard to what is going on.
The start of the personal computer revolution (and I am going to orient
myself to the personal business level machine and the software available for it)
began with Apple. The interesting part of this is that the people who started
Apple initially worked for Hewlett-Packard so we could all be talking about
Hewlett-Packard machines if the people at HP had said "that sounds like a good
idea." Apple really started the revolution in 1977. The IBM people legitimized
it by bringing out their PC. The marketing expertise of IBM, bas made this
market what it is today, more so than anything Apple or any of the other
competitors have done, IBM is selling almost 800,000 units in 1983, But even at
those production levels, they are talking about a four to six week delay in
getting machines to people. The demand has been outstanding and it has created a
whole series of compatible types of machines (clones) Compact, Franklin,
Eagle, Corona, etc. Even older companies such as Digital, Wang, Altos, HP, and

90 BOSTON SOCIETY OF CIVIL ENGINEERS SECTION, ASCE
others are emulating what IBM does. So, IBM has legitimized the personal computer
and has brought software as well as a lot of good things to the marketplace.
Everybody is waiting to see what they do next, In my opinion, the PCJr. is
really not a business/professional type machine we would want in our office,
however, it is an interesting machine.
One of the other major manufacturers, particularly in engineering, is
Hewlett-Packard. The HP-86 system has been around for two or three years. It
has matured to having a fair amount of software available for it, It is a good
unit as are the other ones. You can't really knock the hardware. There is a lot
of sameness, if you will, about the systems. They are using the same hard disks
or they are using the same chips from Motorola, Intel or whoever, The difference
comes from how the operating systems work, The speed with which a machine runs is
not necessarily in the chips or the disks or the printers that are used on it.
There are many variables involved.
Business Week has predicted the following sales figures for 1984: IBM at 2
million units, DEC with 300,000 units, HP with 300,000 units, Wang at 100,000
units - the figures are phenomenal. One of the reasons for this awakening demand
is that there are advantages to owning a system, the major one being
convenience. When I worked for the State of Wisconsin, and I believe this is
applicable to most large groups and organizations, we felt it was easier for us
to get our own system, do our own thing internally and fix our turnaround to
something we controlled rather than working through a third party. In addition,
the fact that a company may not need to hire or replace a person also affects the
value. Another reason to purchase a system is the expensive cost of time
sharing. Even beyond that, the IRS has certain tax advantages that make it more
equitable to invest in hardware and software.
invest in a system.
So, there are many reasons to
COMPUTER CONSIDERATIONS
mind:
When deciding to purchase a system these are some considerations to keep in
1) Expandability - Expandability is a key concept because typically when people buy a system, and as they mature with it they want to have more disk capacity and more memory. Various aspects come in to play so it's a good idea to ask yourself -- "what is the future of this system" or "how expandable do I want this system to be". Initially, you will pay more for a system that allows you to expand.

STRUCTURAL ENGINEERING COMPUTER SYSTEMS 91
2) Modularity - This refers to the ability to interface a variety of peripheral (modules) with your system. For example if you buy an HP-150 with the thermal printer built into it and you decide you really need a faster printer, you can't replace your printer with something faster. There is only one speed to the printer so you have to buy a separate unit. You should have bought a separate unit to begin with so that you could sell it later and get the higher speed one with a minimal investment. This same idea applies to disks. If the disks are built in (such as an Apple III or a Lisa) and you decide that you need more disk capacity, you are stuck. When you do get the 1.0 megabyte disk, the floppies will be unused. Some modularity should be considered. Again, an all-in-one-unit, a portable unit such as the Kaypro or Compacq is not bad -- depending on what you want to do.
3) Compatibility - This is an important consideration particularly when you are talking about software. Compatibility of software means that the dBase II I bought for my Digital Rainbow will work when I buy a Digital Mic,ro-vax. However, the price of software for general applications is not that critical so if you spend $500 on Lotus for your HP-150 and then you need the version for your IBM PC, you are out $500 which i.s not as great an amount. If you are paying $8,000 or $10,000 for a Finite Element Analysis program compatibility is an important question and should be considered. Related to hardware compatibility becomes "Can that printer plug into this other system that I may buy in the future?"
SOFTWARE CONSIDERATIONS
The critical item here is software. This is what I am going to spend most
of my time discussing. In terms of software the main concept revolves around a
proven package. You don't want to be a guinea pig in any software that you are
using. The ability to use a program to run your problem and to verify that the
system does what you want is the key factor. Most firms supply demo disks to
prospective buyers because they understand the "touch and feel" aspect is
important to prove that the system will do what you want it to do. Also, you
will learn how fast it solves the problem. In terms of providing a proper
solution, the software should ask the questions in a logical sequence. So you
Should be aware of these considerations when purchasing software.
Testing the program will give you a feel for what installation and support
procedures are. Does the vendor have an 800 number? Are there support personnel
available? And other related questions are very important considerations.
Another item to consider are enhancements. Are there changes being made
that will make the software more powerful or that will keep it up with the latest
techniques. For instance, if the AISC code changes are the programs modified to
reflect those changes? This is a very important question to ask the software
people that you are going to be dealing with.

92 BOSTON SOCIETY OF CIVIL ENGINEERS SECTION, ASCE
Is the software transportable? For instance, as you enhance or upgrade your
machine will the software still work or do you need to buy another version of
it? Also, what are the policies across hardware manufacturers, i.e., if I buy a
program for an IBM PC, is there a similar program for those of us in the office
who have an HP-86 at their disposal. Do I have to retrain people to use the
different machines or is there a consistency in that software so that when you
sit down at any machine you will be familiar with the questions and your respones
to the system. Obviously, transportability is an interest;i.ng concept.
Another key consideration is ease of operation. If I have to spend ten
minutes getting the program up and running to solve a simple steel beam, then the
system is useless. Some programs are written to be all encompassing and
therefore require a waste of time answering questions which do not apply to the
solution. On the other hand, there may be need for an all encompassing program.
So ease of operation is important and something that should be considered as you
look at systems.
SUPPLIER CONSIDERATIONS
With regard to both hardware and the software, a key consideration is the
strength of the distributor. In other words, will the company that you are going
to work with be here five years from now? I think you can pick which ones are
going to be around for sure in terms of hardware but what about in terms of
softwace? If you are dealing with a one man operation the odds of him being here
five years from now to support your software are pretty slim. If you are dealing
with a 15 man organization that has been around for ten years, then you have a
shot at it at least. Still, there are no guarantees in this busipess.
Typically, the firms that have been around longer will charge more for their
software. This is how they survive and maintain their profitability. If support
is not a concern and if you want to take a little more risk and pay a little less
money, that is another route to take. You pay your money and take your chances
all the way across the line.
Both your choices of a hardware and software company should have a proven
record of success. What technical expertise is behind their systems? What are
they doing to make sure that they are going to be there when you need service in

STRUCTURAL ENGINEERING COMPUTER SYSTEMS 93
a year or three, or when you need a new system? If they have been around for a
while, they should have a user base that you can talk to. You should ask the
company to provide you with a reference list of users, which is something you
should check out, However, I find it hard to believe that it is economic for
anyone to spend 200 hours researching a $3,000 computer system and software when
that time is worth $4,000, You are better off to take a flyer in some cases and
see what happens rather than spend the $4,000 in administrative overhead,
Also, consider where the maintenance is coming from for the hardware, Is
there a four hour response for on-site service or do I have to mail it back to
the manufacturer? The level' of expertise and support that you can expect from
the manufacturer or vendor is dependent upon the particular piece of hardware or
software.
INTEGRATED SYSTEM CONSIDERATIONS
Of course, as we mentioned previously data processing and word processing
can be integrated, We use the word "can" as this is not necessarily the best
solution. There are occasions where it makes sense to put all the accounting,
the word processing, and the engineering on one system and get a larger system
with multiple terminals. On other occasions; for reasons of security, backups,
or use (depending on the applications, etc,), it would be better to split the
system onto discrete machines. Today's market indicates that these are going to
cost you about the same either way, Typical systems are going to cost $3,000 to
$4,000 or up to $8,000 per terminal whether it is a discrete system, such as an
IBM or an HP, or whether it is a multiple terminal system like the WANG 2200 or
DEC PDP/11, Again, there is a wide range of choices.
In terms of accounting, a computerized system can coordinate the confusion
on the accountant's desk and turn it into an organized display, Everybody is
happy because the project reports are on time rather than three or four weeks
late, and your firm is getting its billing out on time. Beautiful things happen
when you automate the accounting functions in an engineering firm.
Word processing can also be a big part of computer system justification. The
system takes the repetitive manual typing of proposals, specs and other things
and puts it on the CRT for review and editing purposes. Then print it off on a
daisy wheel printer so that you have the typed copy coming back quickly and

94 BOSTON SOCIETY OF CIVIL ENGINEERS SECTION, ASCE
correctly. One of the other developments I saw while in Las Vegas for a computer
dealer show was multiple speed printers. These printers will go 400 characters
per second in draft mode so that you can get a rough copy very quickly. They also
will slow down to 40 or 50 characters per second and do a near letter quality in
typewriter style. This way you have the best of both worlds in one printer.
Getting back to what we started with -- the profitability and productivity
of a computer system. In terms of structural engineering, even projects of
minimal complexity justify a computer system. A project is typically not going
to be just one run, as much as we would like it to be. Therefore, having it on
the machine make.s that second, third or fourth run much quicker and easier to
deal with. Even with a small structure it makes sense to use the machine.
The design of structural elements, beams, columns, prestressed beams, post
tensioned slabs, and whatever, makes sense on a small computer system. The
machine gives the ability to do ten different elements in the same time that it
would have taken to do one by hand or on a calculator. You get a professional
looking printout that I can show to other people. One of the key things I
learned about the business of engineering was that I would always guess wrong
about the right answer. You spend all this time computing and doing the numbers
that you were taught in college. The project engineer says "Naw, that should be
a Wl2x50." There was always an information gap there that I never understood
until I finally started to use the computer system and do a range of answers. I
felt a lot better by coming in with more positive reasoning than just my hunch.
One of the other uses that we tend to overlook is the ability to create load
tables. with the computer system. We can create our own tables that relate to
specific products with specific designs that we are using everyday. That is a
good application for the computer because you are dealing with repetitious
calculations and taking them away from time wasting, error prone hand calcs.
SYSTEM COST CONSIDERATIONS
Obviously, the question of money comes into all of this. What is the
investment in this system? Depending on your perspective, it could be a little,
it could be a lot, it could be major or minor, it could spread out over a

STRUCTURAL ENGINEERING COMPUTER SYSTEMS 95
few years, or it could be all done in one payment. Different things come into
play when you talk about the investment.
When thinking in terms of money the first item to discuss is hardware
costs. Whether you are going to purchase or lease the system is an important
question. In most leases you will get the tax advantages from the IRS passed
through. There are other definite advantages to leasing. We find about 50% of
our sales are going to leasing companies, using leasing money from local banks or
national concerns such as u.s. Leasing. People are writing 60 month leases for
computer systems at a rate of 2 to 3% per monthi therefore, take the $10,000
system that you really need for the office and break it down to a $200 to $300
cost per month over a five year time frame. This figure is more manageable. To
purchase or lease have come into consideration as probably the number one aspect
of the hardware.
When you do spend that $10,000 as one payment, it is capital you are
removing from the firm since you are buying an asset for the firm. There is a
cost associated with that capital. As engineers we do not think of the economic
costs, the opportunity cost, if that $10,000 was put into a money market fund at
11% it would represent $1,100 that is lost. The machine has to be able to
overcome that cost of capital involved in its purchase.
In some cases as you buy bigger equipment, you have to modify the site, put
in air conditioning, put in special electrical circuits for special grounding,
and maybe go into humidifying the room to cut down on the static electricity.
There is a wide range of site preparations that may be done and may be necessary.
Also, one should consider the cost of consultants, management personnel, and
staff, etc. As I said, if I spent 50 hours researching this computer system
(just obtaining literature and reading requires many hours) and my six partners
and I spend another 10 hours apiece at board meetings deciding what we want to
do, we've just taken the cost of the system from $4,000 on up to $10,000 or
$12,000 by the time we ac·tually make the decision. Many of us overlook the cost
of research and management involved in just making the decision to purchase the
hardware.
From the software standpoint, the cost of application software is the major
factor. If that is the route you are going, the cost of modification should be a

96 BOSTON SOCIETY OF CIVIL ENGINEERS SECTION, ASCE
consideration. Will the provider of that software modify it? Will he make it
fit to your particular needs and recommendations? or, are you going to have to
modify your mode of operation to work with that system?
An alternative is in-house written software. In-house software development
brings with it many other responsibilities that we probably do not think of
immediately. For example, the maintenance of a piece of software and the
documentation of the software are all things that will come if it is purchased
from outside the office. If it is written internally and then the programmer
leaves the firm or is too busy to provide support then we have invested in a
piece of software that will not bring the expected return. Software must be
maintained and explained to the users if they are going to be using it on a daily
basis.
The cost of training is also an important consideration. What does it take
to get up to speed with that piece of software? This relates to the ease of use
of the machine with that software.
Furthermore, consider the cost of data collection, particularly related to
accounting functions. Somebody has to put all the job cost information, time
card information, open jobs, open invoices, etc., onto the system before it
becomes usable in any way, shape or form. We should consider what that cost is.
Some firms will do' that for free as they include it in the software price, and
other firms are going to charge separately for that service, These are all things
you have to consider as you're purchasing the computer system.
OTHER COST CONSIDERATIONS
Other items for review include documentation for the system. How do I get
the software to operate in my office? If I'm buying softwarei are we getting
manuals and will I have to do other things to document how to use the system in
my office? Also consider the cost of software management. There obviously is a
management function involved in any system. Knowing when to say it's a software
problem, knowing when to say i~s a hardware problem, and knowing who to call
requires expertise. Just managing system usage promotes some costs whether it be
a $3,000 Apple system or a $100,000 VAX.
Your system will have some one-time startup costs you should consider. What
is the operating system going to cost and what will it take to get it up and

STRUCTURAL ENGINEERING COMPUTER SYSTEMS 97
running? What other communications equipment do I need (such as telephone lines
or moderns)? If we are putting terminals around the office, do I get cables
included, or buy them?
Management becomes involved during the initial start-up and during the
training sessions, Also, what does it cost to disrupt the organization and put
this system in? One of the biggest things, particularly with drafting systems,
is that as soon as one comes in every client that comes in the door gets a walk
through to look at the graphics system. Furthermore, every employee has to go
over and see what's being drawn, particularly if it is a fast plotter. This is
true in our office and it's true in every office, As soon as the plotter comes
alive, the productivity of the drafting room drops to zero as they all come over
and observe what the plotter is doing,
There are also ongoing costs. What is the maintenance cost of the hardware
system? What is the maintenance cost of the software? This varies with what
support level you are looking for. Another cost is utilities, which also comes
into play and should be considered, Some systems when they are turned on will
take 4,000 or 5,000 watts, while other systems such as an HP85 only require 25
watts, There is a big difference in what the utility costs are when we have the
big system turned on all the time. The cost of supplies should be considered,
Paper, discs, plotter pens, and all kinds of things are not a part of our
standard office supplies. Perhaps we need special filing cabinets to keep the
materials in. It is possible that a special area to keep accounting records
secure such as fireproof rooms or fireproof safes, etc., come into play, Coming
back to the planning and management of that system, there should be one person
who will keep up to date on the latest operating system and will keep us up to
date on what software additions are available and whether or not the firm should
have them. Which hardware upgrades are available and whether or not the firm
should have them must be evaluated, There are many different things that revolve
around each aspect of an ongoing system.
So, you can see from these major categories that there are many things to
think about in the selection of a computer system. Yet, not any of them are
overwhelming when approached systematically, It is something that we must do to
stay efficient and profitable,

98 BOSTON SOCIETY OF CIVIL ENGINEERS SECTION, ASCE
PROFITABILITY ASPEcrS
. Profitability, as it is defined by economists, is the net income for the
firm divided by the total assets. When you invest in a computer system you are
increasing the assets of the firm so the denominator is going up. To maintain
the same level of profitability, the net income also has to go up. The net
income is revenue less expenses, Therefore, the firm has to increase income or
reduce expenses to be as profitable after the computer system is installed as it
was before the computer.
To increase revenues one must do more marketing by going after larger
projects, winning more bids, etc. The other option is to decrease costs,
Typically in the engineering firm the major cost that we are dealing with is
labor. Therefore, for the equation to work out, the computer system either has
to improve revenue by getting jobs or allowing more jobs per minute, or I have to
eliminate personnel to maintain the same profitability and to stay competitive.
As an engineer, I really hate the latter alternative. It is important for us to
realize that when a computer system comes in, we have to go out and promote. We
have to do some very serious marketing to make this investment pay off in any
environment, whether it is a small computer system or a major investment.
Some of the problems that a system may present include basically four
items. These represent the traps the typical firm will fall into when using
computers, By falling into these traps, you will have eliminated the gain in
profitability and, in turn, the revenue you were planning on.
Trap number one is the iteration trap. This is reflected in the fact that
the computer system allows the user to run 20 or 30 frames through it when you
might have been done in one or two cycles. You have probably not gained a whole
lot by doing those additional 28 runs if you came in with good judgements to
begin with, One of our rules in the office is if you don't know the answer,
don't use the computer. Otherwise, you are just going to waste a lot of time
getting down to the solution, A better way is to make that first guess
reasonable and get it within 20 to 30 percent, Then you need only two cycles to
be at a good solution rather than wasting 20 or 30 cycles through the system, So
always watch out for the iteration trap.
Trap number two concerns being overwhelmed by data. Far instance, in

STRUCTURAL ENGINEERING COMPUTER SYSTEMS 99
designing a crane building, you will have dead, live, and wind load combinations.
You are also dealing with horizontal loads from the crane, the impact loads,
wheel loads on the girders, and all kinds of combinations. If you try to analyze
all the combinations at one time, you're going to be very confused by the
output. The procedure we find to be effective is to go on a unit load basis with
all the different loads and look at what effects the structure the most. Then we
combine those cases into the combination so as not to lose the feel for what's
happening to the structure. In this way, we prevent the tendancy to become
overwhelmed by data in the analysis.
Trap number three is the overanalysis trap which is probably the most common
trap to fall into. A computer system will do 13 significant digit calculations
and will carry them out with more precision than is practical. It seems
ridiculous to worry about one half of one percent overstress when we know the
loads or materials properties are not that precise. So, it is easy to
overanalyze with a computer system, which will decrease profit, increase
expenses, and waste time.
Trap number four is the "shouldn't have used the computer" trap. Again,
this is fairly common as we forget about using all previous analysis and design
aids such as tables, charts, etc. We have a steel beam design program that we
wrote but it only makes sense to use that program when you are working with a
strange loading or a strange bracing on that particular beam. If there is a
uniform load on the beam, then we shouldn't use the machine because the A.I.S.c.
Manual will give the answer directly. There are numerous occasions when the
C.R.S.I. or A.I.s.c. Manuals or other design aids make more sense to use rather
than wasting time and effort on the computer. This is one of the concepts you
learn as you become experienced with a system. Working with a system will
educate the user with regard to the various traps that should be avoided.
Computers can generate tremendous amounts of information and they can do
many good things for us. It's a matter of "how do you spell relief?" Is it
through the computer system and all the output data or is it using your
engineering judgment? Our belief is that engineering judgment is the better way
of going and we use the computer system as the tool to get us there. The result
is that the microcomputer and the mini-computer can increase profits and
productivity.

100 BOSTON SOCIETY OF CIVIL ENGINEERS SECTION, ASCE
DIFFERENCES OF COMPUTER SYSTEMS
Two of the concepts we've been discussing are the mini and microcomputer
systems. Actually, there are very few differences between computer systems
anymore because they are all using the same technology and many of the same
chips. The biggest difference revolves around the marketing and packaging of the
system. Is it a desk top, a floor unit, a rack mount, etc.? Economics greatly
affects the cost of the machine and how easy it is to repair. Today, we are
beginning to see "throw it away when I'm done" systems. For instance, the
keyboard on an HP-150 costs about $11 to make; therefore, they are not going to
spend any time repairing it. They are going to throw them in the garbage and
send you a new one. On other systems you may be working with more complicated
communications between the keyboard and the terminal so they may try to repair
it.
Marketing differences reflect varying levels of support. If you buy a PC at
a store, you should expect that you are going to have to take it back to the
store to get it fixed. You're going to have to put it in the car and haul it
around, taking your time and money to get it to them for repairs. If you buy a
different type of system, such as a Digital Rainbow, you can get an on-site
service contract which dictates that they will come to your office within four
hours to fix it. What is the value of having that response time and your
investment protected? This is something for you to evaluate. Support is a key
difference between the types of machines that are in use.
The manner in which a computer is marketed varies from manufacturer to
manufacturer. Personal/business computers are generally sold going through
retail channels. In a store environment don't expect the salesperson to know a
great deal about your needs. Generally, one cannot be very technical in a retail
store because they cannot afford the time and effort to answer a lot of
sophisticated questions. However, if you're dealing with the manufacturer's
salesperson (the guy in the 3-piece suit), you can expect him to either know the
answers or to be able to get the answers in a reasonably short time. You are
paying for that service because his machine is going to be higher priced than the
one that is in the store.
COMPUTER SPEED RELATIONSHIPS
Another concept I want to discuss is speed. There is tremendous capability

STRUCTURAL ENGINEERING COMPUTER SYSTEMS IOI
with almost every computer system but to make use of this power requires speed,
The operating system in combination with the architecture of the machine will
make a big difference in how that machine operates. For instance, a typical 8
bit machine (such as Apple IIe or Apple II+) will take almost an hour to solve a
40 joint two-dimensional frame. If you put that same problem on a Wang personal
computer, the time will drop to eight minutes. That's 52 minutes saved. The
fact that you have to wait that extra hour will make a difference in the value of
the machine for the office. The Wang 2200 system will do the same problem in
four minutes.
While speed can vary dramatically, the price variation generally is fairly
small, You'll probably spend $2,800 to $3,200 including dual disk drives and
printer for an Apple IIe system, The Wang personal computer is around $4,400 and
the Wang 2200 sells for about $10,000,
used to be in system costs.
There's not as much variation as there
Regressing a moment to our frame analysis example where the program ran for
an hour on the Apple, eight minutes on the Wang PC, and four minutes on the Wang
2200; the IBM PC takes 26 minutes to solve that same problem. The HP-9816, which
is a Motorola chip based 16 bit machine, takes ten minutes to solve it, The Radio
Shack Model II will take about 30 minutes. Differences in price, performance,
and support can be important.
The "right" machine for you is dependent upon the types of solutions you
want, If you want discrete two-dimensional analysis, an 8 bit machine will
probably do the job at a rate of 40 to 50 joints an hour. If you want to run
three-dimensional problems, an 8 bit machine will solve only 15 joints an hour;
therefore, this system may not be "right" for you, Even a 16 bit machine may not
be appropriate considering these will solve only 30 to 40 joints of a space frame
per hour, That's why there is a place for mini-computers and main-frame systems
in the world. There will always be a place for bigger, faster computers for
major number-crunching projects,
The main frames started out in 1946 and have continued to grow in power,
size, and speed while becoming less expensive.
100,000,.000 instructions per second through
The talk about processing
those machines, is simply
unbelievable, Also, it is said that they can run 10 sets of those. hundred

102 BOSTON SOCIETY OF CIVIL ENGINEERS SECTION, ASCE
million items simultaneously to get a billion items processed in a second.
The mini-computers are going the same route as the main frames. We started
out with the the WANG 2200, a small mini. Now, we have the Supermini {WANG VS,
Digital VAX and PDP-11, and the Data General Nova). There is a whole new
generation coming.
On a smaller scale the hobbyist machines, such as Heathkit, are now growing
into micros. The new buzz word now is supermicro where you are· hearing names
like Pixel, Plexus, Altos, Apollo, etc. I'm not sure what a micro is, and
therefore I'm not sure what a supermicro is but it must mean something to these
firms. Apparently, the difference revolves around speed, support, expansion, and
marketing.
The 32 bit machines are starting to become an economic reality for the
engineering firm. The HP 9000, the IBM 9000, the Wang VS, and various other
brands are the start of this generation. These are all going to be in the
$25,000 to $30,000 bracket but you can expect the prices are going to drop over
the next two years. Here again is an increase in speed.
joints an hour as one does on a Wang personal computer,
Instead of solving 80
I can now solve 300
joints in an hour on my desktop. This means structural software will provide you
with the results you are looking for, at a rate of 150 to 200 joints an hour for
three-dimensional analysis.
Finite Element analysis is another step up and we will have to wait to get
that much power on the desktop economically. There are some microcomputer
programs that do Finite Element analysis and if you only need to do 100 nodes
this is probably acceptable.
COMPUTER INFORMATION RESOURCES
One of the best software books that is available right now is put together
by the American Consulting Engineers Council and is called Major Software Sources
for Consulting Engineers. It lists approximately 400 different sources for
software. It also lists what machines are compatible with a particular
program. There is an abstract of each company and the software. The book is an
excellent reference guide. So, I recommend it to you.

STRUCTURAL ENGINEERING COMPUTER SYSTEMS 103
How current is this book? Since it is computer generated, I would say that
it is fairly current as they have already issued three or four volumes. I
believe it is issued quarterly.
There are numerous other sources and directories available. If you walk
into a computer store you will find an Apple directory that lists all the
software available for Apple. There is an IBM directory and a book called the
Source (another book that comes out periodically) • If it's current, it's good.
There was a time when we had three or four years to rest up from a major
change in our software. Now, we may have six months breathing room before going
to the next step, the next machine, the next generation
transition.
CONCLUSION
it is a fast paced
In summary, I would like to reiterate several concepts that we have covered.
First, I want to make sure that you understand that support is the key to a
successful installation. The support of the software, the support of the
hardware, whether i.t' s in-house, whether it's software you purchase. In other
words, the who, what, why, when, and how of maintenance is a very key factor
regarding your system.
The next aspect that we should think about in a computer installation and
use are the legal implications. Who is responsible for the results? As an
engineer using software, you may believe the software house is responsible but
that's not true. Since you are stamping the drawings and doing the engineering
calcs, it is your responsibility. At this time, the courts have not had any
cases presented to them to test this.
Which brings me to the next point, which is that anybody who says their
software has no bugs is a fool. Every piece of software has bugs in it. You may
not be able to find them or they may be very small, very isolated bugs. our
programs on the Wang have been in existence for almost 10 years and we currently
have 800 installations. Three weeks ago a user found a way to end up with
answers that were absolutely ridiculous for his problem. It was a particular set
of input that led to this bug. It wasn't something that he did wrong as an
operator, although I believe that 99 percent of the "bugs" are operator errors

104 BOSTON SOCIETY OF CIVIL ENGINEERS SECTION, ASCE
which stem from not reading the manual or not working with the software
properly. In terms of ethical and legal considerations, there is a paper out
that was published a few years ago by ASCE entitled "Ethical Considerations in
Computer Practices." It is being updated by the Computer Practices Committee, as
is the computer pricing guide.
In conclusion, what is the best system for an engineer? The choice is based
on your applications: what you want to do, how much money you have to spend, how
valuable that system can be in your office, what kind of growth you are looking
for, and what kind of support and maintenance you want on that system. The
decision may include such minor things as color. Do you want to have the status
of a name brand or are you willing to take a chance on somebody who has a good
product but may not have the reputation yet? Is the salesman going to make a
difference to you? In general, the hardware may be much the same, and in a lot
of cases the software is going to look very similar. So. it's a matter of who are
you going to be more comfortable with and that will be the right system for your
office.

STRUCTURAL ENGINEERING COMPUTER SYSTEMS 105
Thank you for your attention. We will go to questions and comments at this time.
Q: IS THERE ANY SOFTWARE FOR BRIDGE DESIGN AND ANALYSIS? ECOM does have a program for bridge analysis on the Wang 2200 that we're testing in three sites, Illinois, Louisiana and Indiana. All indications are that it is a useful program. Over the next year you will see a lot of programs coming out for bridge design, bridge analysis, bridge economics, and other related topics because of the need to replace bridges, the gas tax, etc. Right now the best program I know of for bridge analysis and design is the US Steel program, SIMON. It is going to take a while to market software with any quality or stature and hopefully, we have one that,is not too far away.
Q: WHY IS THERE SUCH A WIDE VARIANCE IN SOLUTION SPEED? The application run on all the systems was the same: ECOM'S General Frame Analysis Program. We put in the same structure, same number of joints (35 joints), same number of members, the same loads and combinations, etc., and just let the machine solve away. The difference in speed is a function of the operating system. The Wang P.C. is using the same chip that IBM uses and basically the same MS/DOS operating system that IBM uses. Whatever Wang did to make their machine run three times faster than the IBM P.C., it was successful. If I knew their secrets, I'd be in the hardware business. For some reason, Wang came up with a winner. Unfortunately, Wang is probably one of the worst marketing organizations in the world for computer systems. They have great hardware and their growth has been primarily oriented around that fact. If they did an effective job of telling the world about their systems Wang would be growing at an even faster rate than they are today.
Most manufacturers have chosen to be relatively compatible with IBM so that they are not bucking the trend. Digital learned the hard way. They tried to go with CP/M as its main operating system on the Rainbow and PRO Basic on the 300 series system. The PRO 350 have been stones; nobody is selling them. On the Rainbow, DEC found that with CP/M the system was selling ok. As soon as they announced the MS/DOS operating system on it (compatible to IBM), sales accelerated.
Q: COULD YOU PLEASE TELL ME THE DIFFERENCE BETWEEN A MIRCO AND A MINI COMPUTER? I use those words interchangeably because I don't think there is a difference between them anymore. There used to be a difference in t.erms of the size of the CPU and the chips used but now not even that is true. Another old ·dividing line related to the number of terminals present on the system. If it had multiple terminals it was a mini; if it had only one terminal that was a micro. However, even that is gone today so the definition is wide open. One difference may be the price and how you are buying it. If you're buying it in a store, it's probably a micro; if you're buying it from the manufacturer, its probably a mini.
Q: HOW DO I FIND THE BEST SYSTEM? There are two computer rules that come to mind: Rule No. 1 is to find the software first and buy whatever hardware it runs on; and Rule No. 2 is to see Rule No. 1. Find the software that you want, whether it is Finite Element analysis, space frame structural analysis, concrete beam design, post-tensioned slabs or whatever first. It doesn't matter what hardware system the software runs on, the hardware is not going to be that much different in price over what system you might think would be .the best. For instance, Victor is in the press about their financial troubles. The Victor is an excellent machine. If you are willing to take the risk that one year from now there might not be service on it, it is probably a great investment. But does it have the right software to do what you want to do? What do you want it to do, what do you need it to do, and what different aspects of support do you require for that system must be considered and evaluated. Find the software first and you'll find some hardware that will be acceptable.

106 BOSTON SOCIETY OF CIVIL ENGINEERS SECTION, ASCE
Q: WILL COMPUTERS REPLACE ENGINEERS AND LOWER THE DEMAND FOR ENGINEERS? There is no doubt that our economy is changing to an information oriented economy; a data processing economy if you will, and away from the manufacturing base of the past. I think that structural engineers are not going to fall in demand. There will always be a demand for good engineering people and with the aid of a computer system that engineer can do a great deal more. I worry about the draftsman as that's where the decline will occur. As machines are linked the next step in the evolution will be that the machine can take my solution and make the drawings. For example, metal building manufacturers have super systems that make building drawings come out on their automated drafting systems easily and efficiently. I would be more worried about the future if I was a draftsman than an engineer. The engineer is going to be needed, no doubt about it.
Q: WILL WE THROW OUT MIRCOCOMPUTERS IN THE MANNER THAT WE THREW OUT THE SLIDERULES A FEW YEARS AGO? As long as a tool is useful one will keep using it. The computer will continue to do its job for many years. It is you who decides when you want the latest tool or a faster tool. Yes, I believe that you will want to change machines every three or four years due to improvements in hardware, software, and price. The answer is yoJre.going to throw it away. If you can get five years out of it, that is a great deal. In terms of a justification or payback cycle, we tell our clients to use two years for a personal computer. Then, the third is free, and the fourth year is gravy. If you get five out of it that is great. For the bigger systems when you spend over $15,000, you want to get five years out of it to justify it. The computer decision is not a once-in-a-lifetime choice; it is similiar to buying a car only not as expensive any more.
Q: WILL THE SOFTWARE REVOLUTION AND ARTIFICAL INTELLIGENCE BEGIN TO SUPERCEDE THE HARDWARE REVOLUTION? Five to ten years from now you will see analysis software feeding into design software which feeds into drafting software. I don't think that many. firms will be able to afford it in five years but maybe it will be affordable in ten years as the cost comes down. The hardware is here right now to communicate and make drawings. It is a matter of somebody sitting down and funding the software development. ECOM cannot afford to do that development because of our size. A small engineering firm needs to look at a very quick payback and resonable investments to stay in business. It is important that the software people you are dealing with are also living in that environment and understand your needs so that day to day improvements are made with an eye to the future. You should not be forced beyond your capabilities or funds.
Q: AREN'T THERE ALREADY COMPANIES THAT HAVE ALL THE FUNCTIONS INTEGRATED AS WAS SHOWN IN AN E.N.R. ARTICLE? I remember the article you are referring to in "Engineering News Record." That article was somewhat misleading. s.o.M. has an outstanding program that will put a building into the cityscape and let you look at it from all different views and different angles. However, they are still doing design by hand in some cases. They have not integrated all the pieces together -- yet. Again, it is a matter of funding. The pizzaz of showing the owner his building in the cityscape is promotion and marketing. They are one of the firms that can afford to invest the time and effort to do work with it.
Q: ARE WE GOING TO USE THE COMPUTER TO DO RUN AFTER RUN JUST BECAUSE WE HAVE TIME AVAILABLE? IS IT A GOOD TIME TO BE IN THE PAPER BUSINESS? There is no doubt that the paper or the phone business will be a good investment when related to computers. It does take a while for the average firm to really use their system efficiently on an everyday basis. The one thing that scares me 'about the computer revolution and all the paper it produces is the loss of feel for the structure and what you are doing. You put your numbers into a black box and the solution comes out the other end with 24"x 36"drawings numbered Sl through ss. You are not sure that the machine is doing what you want the way you want it done. That is a little scary and I am not sure how we as professional engineers are going to confirm the design. One way is to stop and look at the intermediate stages of a solution. We cannot let the black box do it all and see the end

STRUCTURAL ENGINEERING COMPUTER SYSTEMS 107
result without evaluation. This is a major concern for our future.
Some people are going exceed their limits of expertise or extend beyond their capabilities. There is a user of ours in Texas who recently bought our Space Frame Analysis Program. There is no way on earth he should be using it. He does not have the expertise to understand the required input much less the answers. This goes back to my earlier discussion regarding knowing the answers before you start working with the system. Getting a feel for the structure and knowing what the results should be must be a requirement for any engineering process.
Q: ARE THE EDUCATORS DOING A GOOD JOB IN PREPARING GRADUATES TO DEAL WITH EXPERTISE, FEELING FOR THE ANSWER, AND THE COMPUTER? They are doing a better job than ten years ago, but it is still not great. Ten years ago when I came out of school I was unprepared. Having taken the advanced steel, the advanced concrete and the advanced structural analysis courses in school, I still had no feel for what was happening in that structure until I sat down and worked with an engineer who had the experience and the background to help me understand it. Educational institutions have not kept up with the pace of knowledge the profession requires nor the practical application of that knowledge. In the last couple of years more universities are buying software and putting in computer systems for the students .to use. The schools are starting to realize that once the students get out the door they are going to be using systems of some sort. Some colleges such as Penn State and Arizona State are setting up Software Centers to show the student (and the faculty, hopefully) what is available & in use today. After you've done two or three concrete beams by hand you should understand the calcs and time required. Going to the computer system and doing 15 or 20 beams gives you much better feel for what the shear requirements are, what size beam makes sense, and how much steel you need. Education is not doing the job it should; however, they are doing a better job than they were ten years ago.
Q: CAN ONE OR SHOULD ONE REQUIRE ACCESS TO THE PROGRAMMING CODE BEFORE BUYING SOFTWARE? When you buy a piece of software, you should always run sample problems and compare the results to some other standard solution procedure such as on a time-sharing system. This should be done whether or not you have access to the source code. On some machines ECOM will provide the source code so the user can go in and look at the program. On other machines we will not because it is too easy to pirate. When a user obtains the source code from us, he can look at the program and nine times out of ten he can't figure it out. There are so many overlays of coding or interwoven variables in the program to make it fit in a 24k or 32k memory, that it is often difficult for us as the o~iginator to understand what is happening. Sometimes when we fix a bug, we find out that the variable is used in other places and we now have more bugs.
The best source of information in terms of verifying whether ,a program does it right or not is looking at the manual. The manual associated with the program should reference the code provisions and solution methods being used and what assumptions are being made in that software. If the manual is poorly written, hard to follow, xeroxed on a liquid copy machine, and sticks together, I wouldn't advise getting involved with that program. If it is printed up or is a nice photocopy and has a decent flow to it, then that represents a company who has put time into the manual. This program should be considered. You get what you pay for in this market. Don't take anything for granted; test it by doing old problems and see what the results are. If the answers are not better than what you did by hand, you do not need that software.
Q: HOW COMPATIBLE ARE THE VARIOUS OPERATING SYSTEMS? CAN I TAKE A PROGRAM FROM ONE MACHINE TO ANOTHER? There are advantages and disadvantages to every operating system. For instance, the Wang 2200 is very fast, but it also requires that its own BASIC-2 language be used. There is nothing else in the world that is compatible with it. On the other hand, the Apple is very generic and just about anything written for an Apple will transfer either directly with a diskette or through telephone communication lines to any other CP/M machine. The best way to proceed is to assume that there is no compatibility in terms of the software.

108 BOSTON SOCIETY OF CIVIL ENGINEERS SECTION, ASCE
Each machine should be examined on its own available software. Do not buy future promises of compatibility. Our. software is available on 14 different machines and we have 14 different versions of software that make use of the advantages of each system. For example, graphics on the IBM are different than on the HP which are different than the graphics on the Wang, Apple, Radio Shack, etc. There is no commonality across those machines (despite what the hardware salesman told us). We made a corporate decision to go to the CP/M and MS/DOS Basic languages as a base to get to something that is more generic. Recently, we had the first direct compatibility ever when we took an IBM P.C. diskette and put it in the Wang P.C. and ran the program. That is the only time we have ever been able to do something like that.
Everybody has different screen formatting, everybody has different diskette capacity, everybody has a few different operating commands, etc. so that we need to maintain 14 different versions and 14 machines for testing. The typical salesman doesn't know -that as he believes all CP/M's or MS/DOS's are the same. Do not buy a system and get caught·without software. It goes back again to our discussion on finding the right software. If you find the right software and it runs on a particular machine then you know it works. Do not expect it to transfer; it may, but don't expect it to happen.
Q: IS THERE ANY SOFTWARE FOR THE DESIGN OF CONNECTIONS? It is much easier to put a note on a plan that says "connection design by fabricator". I save lots of time and have minimum risk. ECOM does have a program that designs a steel girder bolted connection. We use other utility type programs for welded connection design. Whether a software program will be developed or not is generally dependent upon a commonality of procedure and results. It is easy to do a steel beam because everybody uses the same code and the same procedures. On the other hand you can give a connection design problem to 45 different people and you get 45 different solutions. Most of the time connections are a very individual design and there is not any commonality or routine other than code guidelines from which to create a marketable program. So, I do not see any connection design software being developed in the near future. I like having the fabricator design connections because he knows what makes the most sense based on his operation and costs.
Thank you very much.

EAST BOSTON WASTEWATER PUMPING SYSTEM 109
Abu M.Z. Alam1, Noel D. Baratta2
Katrina Belezos3 and William R. Kelley4
INTRODUCTION
The East Boston Pumping System is part of the Boston Metropolitan District
Commission's (MDC) North Metropolitan sewerage system. Its service area includes
the communities of East Boston, Chelsea, Revere and Winthrop. Major facilities of
the East Boston Pumping System include: the Chelsea Creek Headworks, the Chelsea
Screen House, the Chelsea Creek Siphons, the East Boston Steam Pumping Station,
the East Boston Electric Pumping Station, the Winthrop Terminal Facilities, the
North Metropolitan Trunk Sewer, the East Boston Branch and Low Level Sewers, the
Chelsea Branch Sewer and the Revere Extension Sewer. These service area
communities and facilities are identified in Figure 1.
For nearly 100 years the Boston Metropolitan District Commission (MDC) and
its predecessor agencies have provided sewerage services to the City of Boston and
surrounding communities. The MDC's wastewater pumping system for East Boston is
one of the oldest systems built by the MDC. In 1889, the Massachusetts State
Legislature created the Metropolitan Sanitary District (MSD) to provide sewerage
services to Boston and its surrounding communities. By 1895, the North
Metropolitan Sewerage System, consisting of intercepting sewers, pumping
facilities and outfalls, was built to serve the northern communities of Boston
including East Boston, Chelsea and Winthrop. The East Boston Steam Pumping
Station, the North Metropolitan Trunk Sewer, the Chelsea Branch Sewer, and the Old
Deer Island Pumping Station were built during this period. In 1904, sewerage
services were extended to Revere through the construction of the Revere Extension
Sewer. The Chelsea Screen House and the East Boston Electric Pumping Station were
built about 1938 as temporary facilities to supplement the East Boston Steam
Pumping Station primarily during wet weather. The planned construction of (a) the
1. Associate, Metcalf & Eddy, Inc., Boston, MA. 2. Director and Chief Engineer, Sewerage Division,
Metropolitan District Commisssion, Boston, MA. 3. Project Engineer and Public Participation Coordinator,
Sewerage Division, Metropolitan District Commission, Boston, MA.
4. Engineer, Metcalf & Eddy, Inc., Boston, MA.
/

110 BOSTON SOCIETY OF CIVIL ENGINEERS SECTION, ASCE
(Al EAST BOSTON STEAM PUMPING STATION
(Bl EAST BOSTON ELECTRIC PUMPING STATION
(Cl CHELSEA SCREEN HOUSE
(DI CHELSEA CREEK HEADWORKS
EAST BOSTON LOW LEVEL SEWER
\. 'EWER;/:if{
t I
I? ~>~r , ,£ttIT~;i;;~U,[, ¾rrtl!i/t);,, "'', ;.:~_J
"·~' -·' ,~a{'.~;~-~~~;~~.:s~ -~: .~~--FIG. I SERVICE AREA COMMUNITIES AND
FACILITIES OF THE EAST BOSTON PUMPING SYSTEM
WINTHROP TERMINAL
":"7 ' /, . \ '.

WASTEWATER PUMPING SYSTEM 111
Chelsea Creek Headworks, (b) the North Metropolitan Relief Tunnel, and (c) the
Deer Island Main Pumping Station was intended to replace these temporary
facilities. The East Boston Electric Pumping Station was designed to pump
primarily wet weather flows while the steam station continued to pump primarily
the dry weather flows from the North Metropolitan Sewerage System. The new
Winthrop Terminal Facilities were built in 1970 to pump and pretreat flows from
the North Metropolitan Trunk Sewer prior to discharge to the Deer Island
Wastewater Treatment Plant.
To provide improved sewerage services to its member communities, the
Massachusetts Legislature, the MDC and its predecessor agencies conducted numerous
studies and investigations (1, 2, 3, 4, 5, 6, 7, 8). The most recent and
comprehensive study (7) of existing sewerage facilities and future sewerage
service needs was conducted by the MDC in 1976. This study, known as the Eastern
Massachusetts Metropolitan Area (EMMA) Wastewater Engineering and Management Study
(7), identified and prioritized wastewater collection, transport, pumping and
treatment needs of one hundred and nine (109) communities in and around Boston
including the communities of East Boston, Chelsea, Revere and Winthrop. The EMMA
study recommended that detailed investigation and facilities planning be carried
out for the East Boston Pumping Stations to provide improved dry and wet weather
pumping which directly affects sewerage service to these four communities. In
accordance with the EMMA recommendations, the MDC initiated a facilities planning
study in 1981 (8) on the existing Wastewater pumping system for East Boston. The
results of these investigations are briefly presented here.
SERVICE AREA CHARACTERISTICS
The service area of the East Boston Pumping System includes approximately
10,400 acres (4209 hectares) with a 1980 total population of about 119,300. East
Boston is a high density residential area surr0unded by and interspersed with
transportation, heavy industrial and commercial uses as well as the Logan
International Airport. The City of Chelsea is a large multi-family residential
community with some scattered light industry. Revere is a residential community
north of Boston with primarily single-family housing units, with the exception of
some multi-family housing units located in the downtown area. One of the most
densely populated towns in Massachusetts, the Town of Winthrop is primarily
112 BOSTON SOCIETY OF CIVIL ENGINEERS SECTION, ASCE
residential in character with business, institutional and recreational areas
scattered throughout the town.
CRITICAL PUMPING SYSTEM PROBLEMS
The existing East Boston Pumping System is very old with inadequate and
inoperative facilities and equipment at the pumping stations and appurtenant
structures, The components of this system that are currently having functional
problems include:
1. Chelsea Screen House
2. East Boston Electric Pumping Station
3. East Boston Steam Pumping Station
4. Winthrop Terminal Facilities
5. North Metropolitan Trunk Sewer
6. East Boston Branch Sewer
7. Chelsea Branch Sewer
8. Revere Extension Sewer
Figures 2 and 3 schematically illustrate the functions of these facilities.
The Chelsea Screen House, which was built in 1938 to protect the pumps at
the East Boston Electric Pumping Station, contains two inoperable mechanically
cleaned bar screens, The rake, wiper and rake guides in both screens are badly
corroded with many bars missing. All motors, starters and controls are badly
corroded and cannot be operated. Poor design and lack of proper operation and
maintenance are the main reasons for the deteriorated condition of the Chelsea
Screen House and its equipment.
The East Boston Electric Pumping station, also built in 1938 as a temporary
facility, contains two large sewage pumps for pumping mostly wet weather flows
from the North Metropolitan System. The larger pump has a capacity of 75 mgd
(3.29 m3/s) and the smaller one has a capacity of 50 mgd (2.19 m3/s). These pumps
are installed at the bottom of a 21-foot (6.40 m) diameter 60-foot (18.29 m)
deep shaft. Electric motors, motor control center and two vacuum pumps are
installed in an above ground structure. Most of the equipment in this
facility is in reasonably good condition. However, access to the below ground
shaft is very difficult (through vertical ladders) and the work environment is
very hazardous for operators and maintenance staff as this pumping station

NORTH METROPOLITAN
R~F~
FROM MOC NORTH SYSTEM
N
------ _ _ TROPOLITAN /
,soMMOC TRU~ NORTH svsTCM
~~e~RE 'I
= = £ £ ~ :¾
~ ~ ~ ~ ~ m X <
w ~ ~ i5
FROM CHELSEA
t t FROM EAST BOSTON
•
_.
FROM EAST BOSTON/
NORTH METROPOLITAN/ TRUNK SEWER 7 /
TO WINTHROP TERMINAL FACILITIES
- N~•o"o'1r
~•~N~ TO DEER ISLAND MAIN PUMPING STATION
FIG. 2 FLOW SCHEMATIC OF THE EXISTING EAST BOSTON PUMPING SYSTEM
~ v.,
~ ~ ~ :;.:I "C c::: ~ "C z 0 v., ><:
~ ~
w

r,<.O~ ll~\~.,...A..) SHAFT C ;;,..-::p.G~ ~p.\~ ~\, o u~~
'v. ~ 9s, ~
~>, 1>o
1> ?,. ...
-V,i.
~ G-1,
'f-~
~
• TO DEER ISLAND WASTEWATER TREATMENT PLANT -
;,.
'\, "'l''ll>
FIG. 3 FLOW SCHEMATIC OF THE EXISTING WINTHROP TERMINAL FACILITIES
~
1:1:)
0 Cll
~ Cll 0 (')
~ -<: 0 "Ij
(')
< F
~ z tI1 tI1 :;:z:, Cll Cll tI1
B 0 .z > Cll
g

WASTEWATER PUMPING SYSTEM 115
does not meet current safety standards of OSHA. The equipment in this station
is also not sized for dry weather operation because the station was designed
to pump wet weather flows only.
The East Boston Steam Pumping Station was put into service in 1895 and
contains equipment which is old and antiquated. Two of its four pumps are
inoperable. It contains two old triple-expansion steam engines, one of which
is operable. This operable engine has been requested by the Smithsonian
Institute of Washington D.C. for museum display. This station has been kept
in operation way beyond its useful operational life. Since this pumping
station building is eligible for listing in National Historic Register, no
major modifications to this structure can be made without concurrence from the
Massachusetss Historic Commission and the Advisory Council for Historic
Preservation.
The Winthrop Terminal Facilities, put into service in 1970, contain both
pumping equipments and pretreatment facilities. The pumping station has six
(4 electric motor driven and 2 diesel engine driven) pumps with a total
capacity of about 120 mgd (5.26 m3/s) while the pretreatment facilities have a
capacity of about 60 mgd (2.63 m3/s). As a result, flows in excess of 60 mgd
(2.63 m3/s) are by-passed and discharged without treatment. The screening
equipment, grit collectors and the diesel engine driven pumps at this facility
are in very poor condition. Poor design and lack of adequate operation and
maintenance resulted in the deteriorated condition of these equipments. The
heating and ventilation system in this facility is inadequate and the
hazardous and non-hazardous areas are not adequately isolated.
The North Metropolitan Trunk Sewer is a 9 feet (2.74 m) diameter
(circular and horseshoe) brick interceptor built in 1895 with a capacity of
about 125 mgd (5.48 m3/s). Although it used to convey wastewater flows from
all or part of 26 communities north of Boston, it currently transports pumpeq
flows from the East Boston Steam and Electric Pumping Stations as well as
flows from local connections in East Boston, Winthrop and Deer Island.
Television inspection of this interceptor showed that it is generally in
excellent condition. However, in sections of this interceptor bricks have
fallen off and debris have accumulated.

116 BOSTON SOCIETY OF CIVIL ENGINEERS SECTION, ASCE
The East Boston Branch Sewer, built in 1895, transports flows from a
combined sewer service area in East Boston to the East Boston Steam Pumping
Station. During wet weather flows in excess of the capacity of this
interceptor overflow through regulators into the harbor. Due to lack of dry
weather flow pumping capacity at the East Boston Steam Pumping Station there
is normally flow backup and surcharging in this interceptor. This has
resulted in deposition of sediments and sewage solids in the sewer and reduced
its carrying capacity.
The Chelsea Branch Sewer serves a primarily combined sewer service area
and transports dry and wet weather flows from parts of Chelsea, Everett and
Revere to the Chelsea Creek Headworks. At times flow carried by this
interceptor is diverted to the East Boston Electric and East Boston Steam
Pumping Stations. This interceptor frequently surcharges, particularly during
wet weather, causing basement and street floodings with wastewater.
Malfunctioning tide gates, excessive sea water inflow, and inadequate
operation of the East Boston Pumping system are primarily responsible for this
flooding.
The Revere Extension Sewer serves a separate sewer area and conveys.
wastewater flows from parts of Chelsea and Revere to the Chelsea Creek
Headworks. At times, Revere Extension Sewer flows are diverted to the East
Boston Electric and East Boston Steam Pumping Stations. There is excessive
infiltration/inflow (I/I) in the service area tributary to the Revere
Extension Sewer. During wet weather this excessive I/I and operation of the
Chelsea Creek Headworks and the East Boston Pumping System cause surcharging
of the Revere Extension Sewer. This results in flooding of basements and low
lying areas by wastewater.
PROBLEM SOLVING REQUIREMENTS
During analysis of the existing East Boston Pumping System, it became
clear that a number of critical problems would have to be addressed in order
to provide reliable sewerage service to the four communities. These included:
1. Existing outmoded, inefficient and hazardous facilities would have
to be replaced with new facilities;

WASTEWATER PUMPING SYSTEM 117
2. Inoperable and/or inefficient equipments would have to be replaced
with properly sized efficient new equipments;
3. Modifications of eKisting facilities would be required to provide
treatment to all flows as well as for isolating hazardous areas;
4. Pumping of flows from combined sewer systems would have to be
isolated from essentially separate area flows to prevent
surcharging of interceptors; and
5. EKcessive infiltration/inflow in separate sewer areas would have to
be reduced to eliminate flooding of basements and low lying areas.
To fulfill the above requirements a number of alternatives were develped
and evaluated. This resulted in a recommended plan for the future East Boston
Pumping System.
FUTURE EAST BOSTON PUMPING SYSTEM
Following detailed analysis and evaluation of various options to upgrade
the East Boston Pumping System the Boston Metropolitan District Commission
adopted a plan to provide reliable and improved sewerage service to these four
communities. This plan would provide reliable pumping during both dry and wet
weather and would eliminate sewage backup and flooding in East Boston,
Chelsea, Revere and Winthrop caused by present operations of the MDC.
The plan adopted by the MDC for upgrading the East Boston Pumping
Stations and appurtenant facilities has the following components:
1. A new Screen House in Chelsea,
2. A new Circular Pumping Station in East Boston,
3. Diversion of overflows from the Chelsea Creek Headworks to the new
Screen House in Chelsea,
4. Diversion of the Chelsea Branch Sewer and the Revere Extension
Sewer flows to the new Screen House in Chelsea,
5. Conduit connections from the new Screen House in Chelsea to the two
low level eKisting siphons (there are three siphon pipes one lying
on top of the other two encased in a horse-shoe shaped steel and
concrete tunnel) under Chelsea Creek,
6. Inspection and cleaning of the two low level siphons under Chelsea
Creek,

118 BOSTON SOCIETY OF CIVIL ENGINEERS SECTION, ASCE
7. Connection of the two 60-inch low level siphon extensions in East
Boston to two separate wet wells in the new Pumping Station in,East
Boston,
8. Diversion of flows from the East Boston Branch Sewer and the East
Boston Low Level Sewer to the dry weather flow (east) wet well in
the new Pumping Station,
9. Connection of the discharge conduit from the new Pumping Station to
the North Metropolitan Trunk Sewer,
10. Modification and upgrading of the existing Winthrop Terminal
Facilities and its equipment,
11. Cleaning of debris and rehabilitating the North Metropolitan Trunk
Sewer,
12. Abandonment of the existing Screen House in Chelsea, and the East
Boston Steam and East Boston Electric Pumping Stations in East
Boston, and
13. Conversion of the East Boston Steam Pumping Station into work shop
and maintenance facilities for the MDC.
Figures 4 and 5 illustrate the proposed modifications and two schematics
of the proposed East Boston Pumping System. The estimated capital cost of all
facilities and appurtenant structures of the proposed pumping system is about
$22.1 million based on ENR index of 4180. Future operation and maintenance
costs for the proposed system is estimated to be about $810,000 per year. The
MDC has initiated the final design and preparation of plans and specifications
for the new East Boston Pumping System. It is expected that all design work
will be completed by the end of July 1985 and all construction work completed
by the middle of 1988. This new pumping system is expected to be fully
operational by the end of 1988.
CONCLUSIONS
The existing East Boston Pumping System is a very complex, old, outdated
and inefficient system. It does not currently provide adequate and reliable
sewerage service to its four tributary communities. The service area
communities also have excessive sea water inflow and/or infiltration/inflow in

~~1e~'RE l/ _r'ROf>i CHELSEA
CONSTRUCT NEW SCREENING FACILl7
OIVERTCHELSEA ANO REVERE FLOWS TO NEW FACILITY
. ABANDON, :.i ~ CONVERT TO MOC ' ' MAlNTENANCE7ARAGE
,:1=:::::.!:'.~~~~-=-"":::_-.:::_-::_-~ Ji;~~d;HEEN ~~~~~UCTFACILITY Im:11~:~1.NG :~i-i;rtsT ,,. r;:::::, ""-li.--..,.__ , --i \ ~l ,, >t,., , / -RU'JK<';t:.ER , , {}l_,.-,..._:_-r--------~:.- ___: :.~~ "f / I , ·~ORTHM>1%POL•-A~. /
J,;()?,"'";.l t.>~rn9?0L1Tf>.N _c_,,::_~-J: :-J.7.x::u:-----------✓-=:::r-, '-, \,._ ~~ ~ ABANDON ,.,/ f.t..""" / \ ..,., ----l / -.:is,i_:F.§!'~.!'----- ..... ----- -( \_;r--J.-,
1~J--__ '---~ ~~ANOoN'P" ~-.._ ~ ~ / ~dv.; ,,,, ,.,/ ~~-~/ _,.,.,...-----;;-;;~~:;:-;;;P -
>><Q';JMY '--- ,..,..,._ --( /"> --._... __ '- :-0, x CU)SA.ND ./ l} ()x- -' ;t;/.-:f>¼'<- TE!WNA 'AC-JUT!~'", •,OBFHSYST~•; ,_ c,r-_ _,..______ _:.;;.--:;t _ _,._:;;;-..._ SANDTR~'\P'0::-"-\:.x-•-• CArC1sER , ><:"~ < ~~'b~ ,::,Y.-❖
-~.':::~-- ---<,,_4: ~~~~i -.. -..._ >'_:-'s...._,,"-/--t...--.,..,,f;,,._._/_,,/ G // \Jf~•-~✓-.J::>x;.-5-:~-..~\, ,-------:::::: ....,-' -,,.,. ___ \... '-<.'.:::- ,/-✓ 4a r' /,,~ / .;,;. /d'-' CONSTRUCTNEW
CHF...£!':.Z..CRE!cK / - ,,,-" -~,"-. "'-...--. /- '-'1Nt.:.r,, / ( h1' ? '-"': _,,.,.,,,...... FORCEMAIN r!EADJ."ORK..<"c __ / .,--"OPCUTAN_,../ '- ~ :;_,,,,.; S,;,Jf-O;fA/J:!.) / M /' \~ /. V
NOfln-1..,,:::,,... --- , -,:,. 'V ~ ,Z..1/': '\ _,,.._ t~ -~Ni<""~f•;.Jlfl ><" ~ -- -7J~~w .. -- ,,..?;~
/_// ,;,~,<K< ~~~~ /,, X<,✓ ,,"L.~-,0,-- -~ 7~ ~ .... ~~Ef,.,.~...;;;>-<.:.._,... -..o
CHE-SEACt•!:EK/ /' ~\ Bl-- .., -.!!~'1:,- "'---CONSTRUCTNEWSCREENING S,'HONS /' ......._,~ .J-- :::! -..._'!!_.o__':2l.tr--41y ANDPUMPINGSTATION
'"~--:,...~, !£j DIVERT EXISTING ..._ -.!!._C.f:!.!_:__~u•,,,:",
i~i~flfi-'u~,;;;;~ '1 n INTERCEPTORS :~;-;:}~:::~o ABANDONJ ' f
FROM EAST 80S"rCN
FIG. 4 PROPOSED MODIFICATIONS AND FLOW SCHEMATIC OF EAST BOSTON PUMPING SYSTEM
::E ► IZl
~ ► ..., t'Il :;,:i "C c ~ "C z 0 IZl -< IZl
;l ~
::0

REPLACE IMPELLER EQUIPMENT (TYPICAL ALLS PUMPS)
ISOLATE WET WELL AND SCREENING ROOM
:<;O" <oJi,~ SHAFT C %,.t0-
"'"'1'-"'<;,'-~""''
EXISTING GRIT CHAMBERS AND SUPERSTRUCTURE\
-- EXISTING DISCHARGE
CONDUIT
__.-PROPOSED DISCHARGE CONDUIT
1,0 '5>,,_
-s-,, "'<"
...------PROPOSED GRIT ,IY CHAMBERS AND
SUPERSTRUCTURE
~ 0.¢
°<'.,,;,.. "1-i,
~(,,; 'v,c
'"'"' ""«--ss
,\_
~
'~PROPOSED GRIT COLLECTION BUILDING WITH LOADING RAMP AND TRUCKWAY
~ PROPOSED DISTRIBUTION CHANNEL WITH PARSHALL FLUME
\'
Z SCREEN AREA L-- REPLACE 2 EXISTING DIESEL ENGINE
DRIVES WITH NEW ELECTRIC MOTOR DRIVES
REMOVE COARSE BAR SCREENS AND REPLACE WITH CLIMBER-TYPE SCREENS (TYPICAL ALL 3 CHANNELS)
FIG. 5 PROPOSED MODIFICATIONS AND FLOW SCHEMATIC OF WINTHROP TERMINAL FACILITIES
~
c:i 0 Cl)
~ Cl)
0 0
~ 0 'T1
0 < t= g.i 0 z t'I1 t'I1 ::,;, Cl)
Cl)
B 0 .z > Cl)
Q

WASTEWATER PUMPING SYSTEM 121
the community sewer systems. This combination results in surcharging of the
interceptors, sewage backup and flooding of basements and low lying areas. To
remedy this situation the Metropolitan District Commission has adopted a plan
to upgrade the existing East Boston Pumping System. This plan incorporates a
new screen house, a new circular pumping station, upgrading of the .Winthrop
Pumping and Pretreatment racilities, and cleaning and rehabitation of
interceptors and siphons. It also includes abandonment of two existing
pumping stations and an existing screen house. This upgrading plan will
provide reliable and efficient sewerage service to the four communities and
will eliminate wastewater backup and flooding caused by current MDC
operations. Elimination of excessive infiltration/inflow in community sewers
will also be needed to completely eliminate sewage backup and flooding. Each
community is expected to carry out reductions in excessive I/I in its sewer
system.
RErERENCES
1. Massachusetts Legislature's Special Commission Report on "A General System of Drainage for the Valleys of Mystic, Blackstone, and Charles Rivers, Massachusetts", 1886.
2. Massachusetts Legislature's Special Commission Report on "Discharge of Sewage into Boston Harbor", December 3, 1930.
3. Massachusetts Legislature's Special Commission Report.on "Investigating Systems of Sewerage and Sewage Disposal in the North and South Metropolitan Sewerage Districts and the City of Boston", June 15, 1939
4. Metropolitan Sewerage District, "Main Drainage Works of Boston and its Metropolitan Sewerage District", 1899
5. Metropolitan District Commission, "Memorandum to the Metropolitan District Commission Relative to Pumping Head and Rates of rlow at the East Boston Pumping Station", prepared by Metcalf & Eddy Engineers, April 10, 1940
6. Metropolitan District Commission, "Engineering Report on a Proposed Plan of Sewerage and Sewage Disposal for the Boston Metropolitan Area", prepared by Charles A. Maquire and Associates, Engineers, rebruary 1951
7. Metropolitan District Commission, "Wastewater Engineering and Management Plan for Boston Harbor - Eastern Massachusetss Metropolitan Area" (EMMA STUDY), prepared by Metcalf & Eddy, Inc., March 1976
8. Metropolitan District Commission, "East Boston Pumping Stations facilities Planning Report", prepared by Metcalf & Eddy, Inc., April 1983

122 BOSTON SOCIETY OF CIVIL ENGINEERS SECTION, ASCE
KEY WORDS
Bar Screens, Controls, Diesel Engines, Flooding, Headworks,
Infiltration/Inflow; interceptors, motors, outfalls, Pumping
Stations, Pretreatment Facilities, Rakes, Screen House, Sewers,
Sewerage Facilities, siphons, starters, steam engines, Surcharging,
Treatment Plant, Wastewater and wipers.
ABSTRACT
Boston Metropolitan District Commission's (MDC's) East Boston Pumping
System is a very old system. Historical background of the development of this
complex pumping system together with the existing condition of its facilities
are briefly discussed. Existing system is found to be outdated and
inefficient. Some of the existing screenings, pumping and pretreatment
facilities and their equipments are currently inoperable. Detailed
investigations and testing demonstrated that three of the existing facilities
need to be abandoned, two new facilities need to be built and major
modifications to seven other facilities are needed in order to provide
reliable sewerage service to service area communities. Boston MDC's plans to
modernize and upgrade this complex system are briefly outlineq. Some of the
specific details of the upgrading plan are identified and discussed.
SUMMARY
Historical background of Boston Metropolitan District Commissions very
old East Boston Pumping System is presented. The findings of current
conditions of various components of this system are discussed. It is
determined that some of the existing facilities should be abandoned. Some
facilities should be modified and two completely new facilities should be
built to provide reliable service in the future. Details of Boston MDC's
modernization plan for this complex wastewater pumping and delivery system are
briefly discussed.

RESIDENTIAL WASTEWATER-GROUND WATER
INTERACTIONS IN THE VICINITY OF
MARES POND, FALMOUTH, CAPE COD
123
Ralph F. Vaccaro, Nathaniel Corwin
and James R. Mitchell
Abstract
Time-related measurements of selected conservative and nonconservative
aquatic 'parameters from the vicinity of Mares Pond, Falmouth are used to quantify
the extent of domestic wastewater infiltration to the local ground water. A
fractional comparison between the relative importance of physical as opposed to
biological processes which together account for the observed degree of wastewater
attenuation is presented. Indications are that the total amount of leachate
infiltration detected at the sampled well point varied between 8 and 12 percent
and that physical processes such as dilution and nonbiological chemical
attenuations accounted for about 90 percent of the qualitative difference between
the well water and septic leachate compositions. Regarding the remaining 10
percent of the overall attenuation, biological processes are assigned about 95
and 60 percent respectively of the observed organic carbon and combined nitrogen
mineralization. Because organic carbon regeneration proceeded more rapidly and
completely than that of combined nitrogen, nitrogen contamination appears to pose
the more insidious threat to ground water destined for domestic usage in the
Mares Pond area.
Introduction
BACKGROUND
Maritime Cape Cod, a hook-shaped peninsula of easternmost Massachusetts
extends about 60 miles into the Atlantic and includes 15 townships distributed
over an area of 440 mi 2• According to the U. S. Geological Survey, the' remote
source of all fresh water for the entire Cape is atmospheric precipitation (ca
2.4 x 10 6 gals/mi 2 /day) and its recharge (ca 1.1 x 10 6 gals/mi 2 /day) to
This study was funded by the Woods Hole Oceanographic Institution on behalf of
the Town of Falmouth, Massachusetts.
Contribution No. 5665 from the Woods Hole Oceanographic Institution.

124 BOSTON SOCIETY OF CIVIL ENGINEERS SECTION, ASCE
ground water (Palmer, 1977). The interior aquifer currently supplies about 100
large municipal-type wells plus several thousand private wells located within
serviced and unserviced water and wastewater districts.
Historically Cape Cod ground water has provided a reliable and safe domestic
water source both for the native population (currently Cq 150,000) and the
annual ten-fold increase in temporary residents encountered during summer.
However, unprecedented demand for quality domestic water and provision for its
ultimate disposal have aroused serious concerns regarding future ground water
abundance and quality. Clearly, the incidence of complaints citing ground water
adversities such as changes in subsurface elevation, salt water intrusion,
eutrophication of surface waters and the intermittent presence ·of suspiciously
high concentrations of carbonaceous and nitrogenous organic derivatives is
increasing. To counteract this trend and to clarify the local ground water
outlook, the federal government has conferred "Single Source Aquifer" status over
the entire Cape as recorded in the Federal Register, 1982.
To predict and minimize adverse ground water impacts from unbridled
residential and commercial construction is an important responsibility of the
envi_ronmental and public health oriented regulatory agencies. On Cape Cod, much
of the impetus for new construction stems from a combination of multi-unit
residential subdivisions and from the seasonal demands of transient visitors.
Procedural decisions regarding go or no-go construction at specific locations,
however, often proceed with only quasi-relevant soil and ground water information
of questionable merit. Common deficiencies include incomplete site-specific data
on soil composition along with inadequate information on percolation characteris
tics, and other relevant hydraulic peculiarities of the aquifer.
A second complication affecting freshwater distribution and availability on
Cape Cod is the constant discharge to the sea of relatively large volumes of low
salinity ground water as opposed to river water which occurs along the entire
coastal margin. Maintenance of highly stable offshore salinity gradients
requires that a fixed but illusive volume of ground water be permanently
transported to the ocean within each tidal cycle. Finally, it is not unusual to
encounter delicately buoyant freshwater lenses overlying denser layers of deeper
seawater within the interior of the peninsula. Disruption of this sensitive

WASTEWATER-GROUNDWATER INTERACTIONS 125
layering can result in saltwater intrusion into shallow wells, Many believe that
these environmental peculiarities have led to an unwarranted reliance on ever
increasing lot sizes as the principle ground water protection strategy,
Excessively high concentrations of nitrate in the drinking water of infants
can, under certain conditions, lead to a reduction in the blood's oxygen carrying
capacity, This potentially fatal disease, called methemoglobinemia, originates
in the lower intestinal tract when nitrite produced from the reduction of nitrate
becomes abnormally associated with the victim's circulatory hemoglobin, Although
extremely rare on Cape Cod, the epidemiological evidence associated with this
disease remains a very important quality criteria which is applied to all potable
waters, A typical residential wastewater leachate on Cape Cod contains a
nitrate-nitrogen potential of 35-90 mgs/liter while a similar estimate for
dissolved organic carbon ranges between 150-250 mgs/liter (U. S. Environmental
Protection Agency, 1980). However, under current conditions nitrate-nitrogen
concentrations in excess of 10 mgs liter and dissolved organic carbon
concentration above 5 mgs/liter are rarely encountered in any Cape Cod drinking
water (Vaccaro et al., unpublished), This situation, while currently satisfying,
does not preclude the need for continued and improved ground water vigilance
especially in view of the accelerating population level,
In planning this study two procedural options, consistent with our
investigational resources, were considered, First among these was to conduct a
highly intensive short-term survey which would encompass multiple sampling
locations but minimize chances of detecting long-term causal interrelations. A
second and more challenging possibility was to undertake a more rigidly
controlled empirical experiment wherein a single ground water source would be
monitored for carefully selected parameters over an extended period of time, An
inherent advantage of the latter approach was the promise of minimizing
background noise due to the periodic influence of additional environmental
phenomena. Added consideration was given to our prior possession of abundant
data on local ground water compositions which was still awaiting a more
sophisticated level of interpretation, In toto the above considerations led to
our adoption of single well point monitoring over an extended period of time as
the format for this study,

126 BOSTON SOCIETY OF CIVIL ENGINEERS SECTION, ASCE
Specifically in this report we address some relevant quality changes observed
over an extended period of time for a single ground water source associated with
a particular residential well located within an established community near Mares
Pond, Falmouth, on Cape Cod. Comparisons of three natural water parameters:
nitrate-nitrogen, conductivity and dissolved organic carbon in septic effluent,
recharge dilutent water, and in the well water. itself are used as a basis to
quantify the extent of wastewater transport and infiltration within a hopefully
stable geological regime. The ultimate ground water assessment of the field
situation addresses, in order, the fractional amounts of recycling and
attenuation for combined domestic wastewater, sewage effluent, dissolved organic
carbon and combined nitrogen along with the relative contributions of physical as
opposed to biological processes which in combination account for the observed
ground water composition at the selected sampling location.
THE WESTERN CAPE COD AQUIFER
The western extremity of the Cape Cod peninsula lies within an area
designated as the Mashpee Pitted Plain which encompasses the townships of
Falmouth, Bourne, Sandwich and Mashpee. An irregular bedrock basement of varying
depth is overlain by unconsolidated sediments of Pleistocene and Holocene age
(Oldale, 1976, 1982). Because the original deposition of overburden proceeded in
a north-south direction, the sedimentary material at the northern apex, near the
Cape Cod Canal, is somewhat coarser than that at the Falmouth coastal extremity,
12 miles to the south. In order of abundance, the composition of overlying soil
structure consists of gravel, sand, pebbles, cobbles and boulders.
The surface of the Mashpee Plain is intermittently inundated by depressions
or kettle holes, such as Mares Pond in Falmouth which is a prominent
topographical feature of our study area. Such ponds were formed when isolated
blocks of ice, left behind by the retreating glacier, were temporarily buried
under outwash deposits. Once water-filled, these depressions or ponds became
dynamically associated with ground water which initiates their flushing.
In general, the broad hydrogeology of our study area has been described as a
single, homogeneous anisotropic aquifer having a maximum hydraulic conductivity
in the north-south direction roughly parallel to the original direction of
deposition of the out wash sands and gravel (Palmer, 1977).

WASTEWATER-GROUND WATER INTERACTIONS 127
The regional behavior of ground water on Cape Cod, as projected from a series
of three-dimensional finite-difference ground-water-flow models has recently been
reviewed by the U.S. Geological Survey (Guswa and LeBlanc, 1981). Attendant mass
balance calculations for five modeled areas indicate a total steady-state
recharge rate of 412 ft 3 /sec. and a total discharge rate to streams, marshes
and oceans of 387 ft 3 /sec. However, the large geographical scales employed in
this model study are but marginally suited for generalized hydrologic projections
to smaller, more restricted situations such as the Mares Pond area.
SITE CHARACTERISTICS
The single on-site well selected for this study is located just west of Mares
Pond, on Site 34, Locustfield Pond, Falmouth as shown in Fig. 1 (adapted from
Report to the Town of Falmouth by K.V. Associates, 1983). Ground water flow at
the above location is peripheral to and generally downstream from a cluster of
more than thirty neighboring homes, all on half-acre lots and all serviced by
private wells. Each home employs on-lot wastewater disposal via cesspools and/or
septic tanks with or without leaching facilities. The minimum distance between
any one septic source and the nearest well is 100 ft. in accordance with
regulations of the Commonwealth of Massachusetts. Since the approval and
completion of this subdivision, the minimum lot size for this area has been
increased from 20,000 to 40,000 square feet,
A convenient, nearby topographical transect describing local soil
characteristics west of Mares Pond is shown in Fig, 2 (Camp, Dresser and McKee,
1982). The transect originates about 3500 ft northwest of Site 34 and extends
about 2400 feet in a northerly direction, parallel to the western side of
Locustfield Road. The indicated depth of the water table is about 50 feet below
the ·ground surface which corresponds to an elevation of 20 feet above sea level.
Soil characteristics within the upper 110 feet indicate a highly uniform
distribution of fine to coarse sand, gravel and some occasional silt along with a
minor variation in small cobbles at depths above the water table. Records
compiled by the U.S. Geological Survey indicate that the annual oscillatory range
of ground water elevations for this part of Cape Cod is 3-4 feet,
The projected hydraulic gradient for the ground water immediately west of
Mares Pond is in a southwesterly direction (Palmer, 1977). Ground water
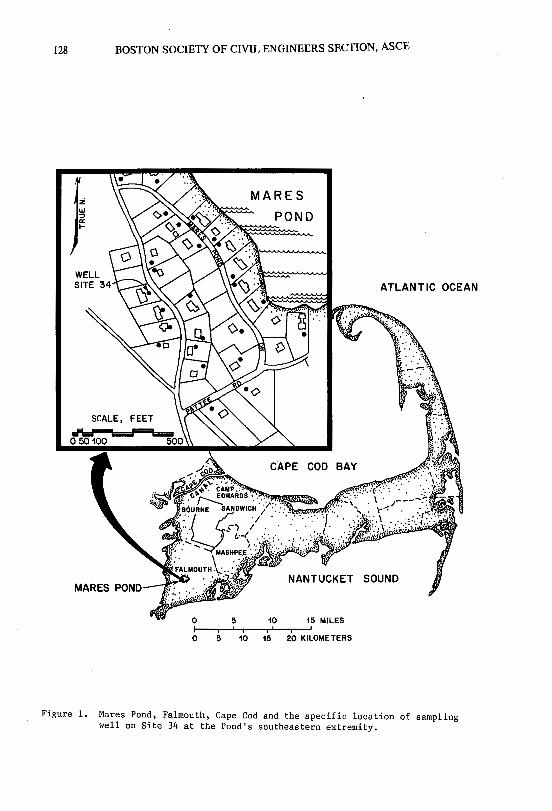
128 BOSTON SOCIETY OF CIVIL ENGINEERS SECTION, ASCE
POND
ATLANTIC OCEAN
0 5 10 15 MILES
0 5 10 15 20 KILOMETERS
Figure 1. Mares Pond, Falmouth, Cape Cod and the specific location of sampling well on Site 34 at the Pond's southeastern extremity.

~ V)
<: ~ ~
~ ~ ~ i:::: § l.aJ Cj
100
80
60
40
20
0
-20
-40 0
WASTEWATER-GROUNDWATER INTERACTIONS
Brown fine to coarse sand, some silt and gravel, trace of cobbles
1000 2000
HORIZONTAL DISTANCE (feet)
Figure 2. Upper surface geology typical of the Mares Pond area at a geological cross-section less than a mile north of Site 34. Original data by Camp Dressler and McKee in accordance with Report of K.V. Associates, 1983.
129

130 BOSTON SOCIETY OF CIVIL ENGINEERS SECTION, ASCE
contours recorded for Mares Pond in the earlier cited Report of K.V. Associates,
1983, tend to confirm the above observation despite some seasonal departures
attributed to changing surface elevations in near-by Mares Pond. Apparently
gravity-leveling at the surface of the pond promotes flushing via ground water
recharge at the northern end and ground water release at the southern pond
extremity. This interpretation is consistent with the e,xposure of well water at
Site 34 to impaction by septic plumes originating from a number of more easterly
and upstream on-site sources.
Within the past two years the Town of Falmouth has acquired considerable
information on the status of ground water quality in the Mares Pond residential
area. Selective information provided by the Barnstable County Health Department,
1982, and cited by K.V. Associates, 1983, scrutinized the ground water from
about 100 private wells in this locality. About 40% of these water samples
originated within a half mile of Mares Pond and included all of the residences
shown in our Fig. 1. This County information and its subsequent review by K.V.
Associates stress the importance of short-circuiting from neighboring septic
systems as the most likely explanation for the moderate to high levels of
inorganic ammonia- and nitrate-nitrogen encountered periodically in Mares Pond
ground water. Together, these studies aroused our interest in compiling
complementary information centering on long-term monitoring of a single well
having a high probability of experiencing intermittent wastewater incursions.
Ultimately the private well located at Site 34, whose earliest determined
characteristics also appear in Table 1, was selected as the most appropriate
water source for our analysis due to a prior history of persistently small but
measurable impaction.

WASTEWATER-GROUNDWATER INTERACTIONS
Table 1
Ground Water Quality Characteristics 1 for· the Area West of Mares Pond
Falmouth, Mass
131
No Wells
Above Background Concentrations, Percent
General Area Ammonia-nitrogen Nitrate-nitrogen Conductivity Iron
Test Well, Site No. 34 Ammonia-nitrogen mg/L Nitrate-nitrogen mg/L Conductivity µmhos/cm Iron mg/L
44 23 18 14 34
Concentration 0.14 2.56
92. 0.05
1Data of Barnstable County, Department of Public Health Adopted from Report of K.V. Associates, Inc. to the Town of Falmouth, 1983.
An additional and highly useful revelation regarding the above Mares Pond
data was the demonstration by K.V. Associates of a positive linear correlation
between total inorganic-nitrogen (combined concentrations of ammonia- and
nitrate-nitrogen) and conductance within septic plumes. The derived relation is
consistent with the equation;
Conductivity= 13.2 (Inorg. N) + 57, ( 1)
where conductivity is expressed in µmhos/cm and nitrate-nitrogen in mgs/liter.
Since conductivity is a readily measurable property of both ground water and
septic effluent, its concentration in well water as compared with that of the
contributing water types can be exploited to estimate the fractional amounts of
wastewater and recharge water present in a given well water sample.
BIOLOGICAL CONSIDERATIONS
Biological transformations affecting the ultimate distributions of
nitrogenous and carbonaceous derivatives are important public health and
environmental concerns of wastewater management. In concentrated domestic waste,
the above chemical elements typically occur in unoxidized form such as ammonia
and organic acids both of which are amenable to further biological modification.
The nature of· the ensuing biological changes have important implications
regarding health hazards, environmental aesthetics, recycling and renovative
efficiency.

132 BOSTON SOCIETY OF CIVIL ENGINEERS SECTION, ASCE
Many microbes although denied free oxygen can utilize oxygen atoms combined
with other elements such as nitrogen, sulfur, and iron for their respiration.
Thus, when water containing nitrate infiltrates an oxygen deficient environment
rich in organic matter, denitrifying microbes can utilize the oxygen content of
~itrate with the ultimate release of gaseous nitrogen, Indications are that
denitrification proximal to a watewater source can account for 30-80% of the
nitrogen removal in waste water renovation (Kardos et al., 1965; Merrell et al.,
1967). As shown below, during denitrification nitrite-nitrogen appears here as a
transient intermediate between nitrate and gaseous nitrogen, The simplified
reactions are as follows:
NO,+ 0.33 CH,OH -----> N02 + 0.33 CO2+ 0.67 H20 and
N02 + 0.5 CH,OH -----> 0.5Nz + 0.5 HzO +OH-+ ,5C02,
(2)
(3)
On the other hand, in the presence of free oxygen, reduced carbonaceous and
nitrogenous compounds are further mineralized and terminally oxided to carbon
dioxide and nitrate as follows:
CH4 + 202 ----->CO2+ 2H20 and
NH••+ OH-+ 202--->H+ +NO,-+ 2Hz0
(4)
(5)
Taken on a weight basis, the above equations indicate that the oxidation of each
unit of methane-carbon and ammonia-nitrogen requires about 5 units of oxygen to
complete an oxidation. In nature, that nitrate which escapes denitrification is
either utilized for plant growth or alternatively accumulates in a receiving
water. Thus nitrate-nitrogen, the end product of the nitrification process,
ultimately assumes a conservative behavior not unlike that of a water's
conductive characteristics.
Normally even ideally functioning septic systems release some nitrate via a
connecting leaching field or the surrounding subsoil from whence it percolates
downward to the water table. The ultimate amount of nitrate enrichment to the
down-gradient ground water represents the net effect from a variety of biological
and physical processes. The presently enforced standard for nitrate-nitrogen in
potable water is 10 mg/liter as jointly recommended by the Commonwealth of
Massachusetts and the U.S. Environmental Protection Agency.

WASTEWATER-GROUNDWATER INTERACTIONS 133
ASSESSMENT OF WASTE WATER ATTENUATION
Physical phenomena such as dilution, adsorption and other inert chemical
transformations can also play an important role in the recycling of domestic
wastewaters. Of primary concern here is the estimated ratio of composition, i.e.
wastewater: recharge water, which characterizes a given water sample,
Conductivity which measures a substance's ability to carry an electric
current, can be usefully exploited for this purpose as follows:
Coss FsE CsE + CR
Co as FRw = 1 - CsE + CR
where FsE and FRw respectively correspond to the fractional presence of
septic effluent and recharge water; Goes, a sample's observed conductivity
CsE the original, reference, conductivity of concentrated septic
effluent and c., the conductivity of unadulterated recharge water.
(6)
(7)
For an idealized situation describing a strictly conservative parameter whose
presence in a given sample reflects mixing only, the degree of non biological
attenuation has been estimated from:
where PPA is the predicted concentration for a given parameter following its
physical attenuation and PsE and PRw the concentrations of the same
parameters respectively associated with septic effluent and recharge water.
Finally, a measure of the degree of biological attenuation beyond that
contributed by purely physical interventions can be approximated by:
PeA = (PPA) - (Poes),
(8)
(9)
where PeA is the esti~ated additional effect of non-conservative behavior for
a given parameter and Poes the observed level of the same parameter as
measured in a particular sample.
Successful applications of the above relations presupposes an ability to
assign realistic va_lues for conductivity, dissolved organic carbon and total
combined nitrogen to both septic effluent and recharge along with dilutent water,
Weighted values descriptive of the above parameters are shown in Table 2, and
reflect a variety of pertinent data sources including the U.S. Environmental
Protection Agency, the Barnstable County Health Department and our own laboratory

134 BOSTON SOCIETY OF CIVIL ENGINEERS SECTION, ASCE
measurements. For added insight some of our own corresponding measurements for
Cape Cod rain water also appear in Table 2.
WATER SAMPLING AND ANALYTICAL CHEMISTRY
With few exceptions our ground water sampling at Site 34 was biweekly
throughout the 330 days of this study, Sampling protocol included prolonged ~
flushing of the 60 foot well head, and the use of separate pyrex glass containers
for nitrate and dissolved organic carbon samples. Nitrate samples were
immediately refrigerated and stored frozen pending laboratory analyses by cadmium
reduction and nitrite-nitrogen colorimetry (Wood et al. 1967). Dissolved organic
carbon water samples were collected .in precombusted (1 hour. at 550°C) pyrex test
tubes, preserved with phosphoric acid, later sparged with CO2-free air and
subjected to persulfate oxidation of triplicate subsamples to isolate the carbon
dioxide of organic origin via a non-dispersive infrared technique (Menzel and
Vaccaro, 1964),
Table 2
Assigned Values for Dissolved Organic Carbon, Total Combined Nitrogen and
Conductivity in Septic Effluent, Recharge Water and Atmospheric Precipitation,
Septic Recharge Cape Effluent Water Rain
Cod
Dissolved Organic Carbon, mg/L Range 150-250 1
, 2 0.50-0.90 0.20-0,50 2
Mean 200 4 0,70• 0,35
Total Combined Nitrogen, mg/L Range 35-90 1 , 2, 3 0.10-0.20 2 .11-.24 2
Mean 63 4 0,15• .18
Conductivity, µmhos/cm Range 519-1245 3 56-58 3
Mean 889 4 5 73 , 4
1Data of U.S. Environmental Protection Agency Design Manual 625/1-80-012 2Data of Woods Hole Oceanographic Institution. 3Data from Barnstable County projected as per K.V. Associates, Inc, Report, 1983
4 Value used to calculate ground water attenuation in this report.

WASTEWATER-GROUND WATER INTERACTIONS 135
Results
The total precipitation measured during the entire 330 days of this study
amounted to 41.1 inches which closely approximates the historical average for
Cape Cod. Biweekly changes in the combined amount of rainfall along with a few
measurements of the attendant changes in ground water elevation are shown in Fig.
3. The latter measurements relate to a Town operated well, pumping at a constant
rate, at a location about 2 1/2 miles east of our ground water test site, The
maximum encountered variation in ground water elevation was the 34 inch drop
noted between the March-April depth and that recorded for late September,
Time-related changes in conductivity along with estimates of the ground water
leachate percentages are respectively shown in Fig, 4. In accordance with the
previously discussed equations (1), (6) and (7) both of the above parameters show
proportionality to the corresponding changes in nitrate-nitrogen shown in Fig,
5, Significantly, the data on leachate percentages indicate that "tainted"
water, most likely of septic origin, accounts for more than 8% of each ground
water sample analyzed; the over-all range of impaction being 7,9-12.3%. The
above distribution pattern is consistent with the intermittent arrival of
measurable but unpredictable amounts of septic effluent at the point of
sampling; The unlikelihood of gaining such information regarding a particular
ground water source from a less coordinated and less definitive areal sampling
effort is readily apparent from these data.
Nitrate-concentrations measured over a 335 day period for the ground water at
Site 34 are also shown in Fig. 5, The overall range of concentrations was
1.1-4.4 mg/L with higher nitrate observations corresponding to late spring and
drier summer months. Despite inherent irregularities there is a suggestion of
sequential nitrate pulses having periods of 60 days duration, Comparable results
for dissolved organic carbon, also shown in Fig, 5, varied from 0.4-4,6 mg/Land
displayed more pronounced short-term oscillations than did nitrate. Like
nitrate, however, higher organic carbon levels tended to appear during the warmer
and drier summer months. The incidence of short-term changes for each of the
above parameters suggests the intermittent arrival of significant pulses of
nitrogen and carbon enrichment as opposed to an extended exposure to ground water
of a consistent chemical composition.

136 BOSTON SOCIETY OF CIVIL ENGINEERS SECTION, ASCE
::0 IT1 ~ r ~ ~ < IT1
""' Ci) ~ ::0 0 ~ C z ""O '-0 ::0
~ n, ()
~ ""O n,
~ ::0 ;..;
n, 0 r
IT1 z ~ :::, ;...i 0
0 ::r (I)
z .!!?.
I ~ .
PRECIPITATION (inches)
)> '"'O
- ::0
~l\)(>I~
o o o o
.......................... , ··························· ··························· ............................ ··················· ··················· ...................
····························· ····························· ············••················
···················· ···················· ............. ············· .............
CHANGES IN GROUNDWATER
El EVATION (inches) + + + + ~ I\) (>I ~ 0 0 0 O
Figure 3. Biweek variations in precipitation, Long Pond, Falmouth and some corresponding changes in ground water elevation observed in a municipal well near Fresh Pond. Dept. Publ, Works, Town of Falmouth.

~
~ ....._
~ ~ '-
WASTEWATER-GROUND WATER INTERACTIONS 137
f=sE• SEPTIC EFFLUENT (%)
CONOUC Tl VI TY (umhos/cm)
z 0 <
~- 0 rn
_(')
~- ~ )> z
"Tl .... rn 0- CD 0
s: )> :0
)> -0
- :0
s: I\)
~ o-0 ~
C -z
~
C r
)> C
- G')
(>J o-0
~ o-0
U> rn -0
0 (')
--1
0 I\)
.... 0 0
<D 0)
~ m en
<.O I\)
<D 0
0) .... 0) 0
0
I\) ~ 0 0
<D 0)
<D m
m en 0 0
........ 0 I\) 0 0
<D <D <D 0) ~ I\) 0 0)
RECHARGE WATER (%)
Figure 4. Seasonal variations in ground water conductivity and the fractional residuals of wastewater calculated for Site 34 ground water.

138 BOSTON SOCIETY OF CIVIL ENGINEERS SECTION, ASCE
~
~ ' ~ ~ '-
DISSOLVED ORGANIC
z 0
I\) < o- 0
JTI _()
0) c... o- J> z "Tl
..I, JTI 0- CD 0
~ - J>
:0
c... C -z
- c... C r
J> C
- G> (>I 0- (/) 0 JTI
-0
0 ()
- -i
CARBON (mqll) NITRATE-NITROGEN (mqll) ..I, I\) (>I
0 0 0 0 ~ (JI
0 0 ..I, I\) (>I ~ (JI
o b b o b o
..I,
0 0
I\)
0 0
(>I 0 0
Figure 5, Seasonal variations in nitrate-nitrogen and dissolved organic carbon measured for ground water samples from Site 34.

WASTEWATER-GROUNDWATER INTERACTIONS 139
Figure 6 relates only to dissolved organic carbon (DOC) and differentiates
between the in situ concentrations assigned to dilution and other physical
attenuation processes as opposed to that amount of carbon removal assigned to non
conservative, biological, activity. (See Equations (8) and (9) above). The
single linear relation shown in this figure describes the calculated
concentrations of dissolved organic carbon based solely on the dilution of septic
effluent with low background recharge water. Also shown are the concentrations
of organic carbon actually measured for each ground water sample. The difference
between any corresponding pair of the above concentrations provides a useful
measure of the amount of organic carbon removed by biological activity in excess
of the anticipated physical interventions. Our observations suggest that
biological transformations account for the removal of essentially all of the
remaining and detectable dissolved organic carbon above that anticipated on the
basis of dilution~ se.
A similar analytical approach has served to estimate the extent of
biologically induced combined nitrogen regeneration. As shown in Fig. 7 the
biologically assigned decomposition of organic carbon consistently exceeded that
of the nonconservative removal of combined nitrogen. :•lost of the above values
for combined nitrogen were significantly below 80 percent as opposed to
biological removals consistently in excess of 90 percent for organic carbon.
DISCUSSION
About 25% of the U.S. population lives in rural or semi-rural areas where
on-lot septic tanks exclusively account for the disposal for house.hold organic
wastes. Nationally, such facilities generate about 0.23 million tons of
nitrogenous wastes per year (USEPA, Technology Transfer Report, 1975) along with
an equivalent 1.50 million tons of organic carbon. Given favorable circum
stances, almost all the dissolved organic material associated with septic
leachate undergoes terminal oxidation to water, carbon dioxide and nitrate. A
prominent public health criterion of ground water quality is that amount of
terminal nitrate which percolates downward to ground water and then intercepts
shallow wells being used for domestic drinking water.
A growing environmental concern on Cape Cod is the fear that unrestrained

140 BOSTON SOCIETY OF CIVIL ENGINEERS SECTION, ASCE
~,.., DISSOLVED ORGANIC CARBON (ppm) ;;?-ii
:i:;;~ ..... ..... I\) I\) OJ ~~ u, 0 u, 0 u, 0 tli~
'-i
~~. (D...>,
WO
(D I\)
ex>b
(D~ -.,jO <b
(')
0 (D~ < cnb ~
'O '1,,
(D !-'1 0 % 010 Cl) (/) <,L rr, :::0
w0 < rr, ~o 0
0 0
(DN ()
(>10
) (D (X) ~ Nb
Jo •• (D (D ..... 0
(D ..... ~0 ...... .. 00 t ri 0 • • (X) ..... • ••• (D .....
o@ s:: ui
(X) ..... SQ
(X) I\) z G')
0 0 0 0 • ()
Figure 6, Equivalent concentrations of dissolved organic carbon corresponding to 0-12,5% septic effluent (straight line), the actual concentrations observed (dotted circles) and the amount of attenuation, by difference, beyond that attributable to waste water dilution (open circles),

WASTEWATER-GROUND WATER INTERACTIONS 141
ATTENUATION(%) ~
~ N <.,J ~ (JI 0) -..J CX) (.C) 0 0 0 0 0 0 0 0 0 0 0
z 0 < 0 rn (")
~-~ z .,,
~ rn 0-CD 0
s:: ::j )> 0
~ :::0 Cf)
Cf)
)> 0 -0 ~
~ :::0 z rn - 0
~ s:: -I (/j ~
:::0 0
'--- 0 :::0 N G") G") o- rn )> 0 C- z z
C z )> (")
-I (")
C- -I )> -c rn :::0 r z CD C 0 )> .Z
)> -I C 0 )> G") z -I
(>I -I
o- Cf) rn
o rn z -0 C
~ 0 0
-~ z
Figure 7. Fractions of dissolved organic carbon and combined nitrogen removed by biological activity in terms of the concentrations anticipated from waste water dilution.

142 BOSTON SOCIETY OF CIVIL ENGINEERS SECTION, ASCE
residential and commercial expansion will ultimately lead t·J unacceptable ground
water deterioration and/or surface water eutrophication. Typically, the current
strategy and timing of rigorous regulatory decisions affecting residential
construction are often strategically tied to ground water quality projections to
avoid the expensive alternative of supplying planned homesites with safer water
from a more remote source, However, an equ·itable concern for economic parity
among prospective home owners, developers and the local citizenry in general
requires that the information which underlies such decisions be o:1; the highest
possible relevancy. This study is a plea for extended, empirical field
monitoring and points out the possibility of improved ground water assessments
for projected residential communities.
Long-term variations in the behavior of conservative vs. non conservative
ground water parameters· can be used to iucercompare the extent of physical as
opposed to biological attenuation of residential septic leachates. Information
summarized in Table 3 indicates that physical processes (i.e., dilution,
solubility, adsorption, volatility, etc.) decisively account for about 90% of the
total ground water attenuation observed at Site 34. As for the additional
attenuation, beyond that assigned to physical processes, biological activity
accounts for over 90% of the non dilutional decomposition of ·organic carbon.
Conversely, the degree of comparable combined nitrogen removal, presumably due to
the combined effects of nitrogen assimilation and microbial nitrate reduction by
plants and bacteria, respectively is considerably lower, ranging from 46-78%.
In combination our study indicates that the particular ground water source
herein evaluated remains reasonably under-stressed with regard to non-exotic
waste water carbon infiltration but promises to become highly sensitive to
additional nitrate encroachment.
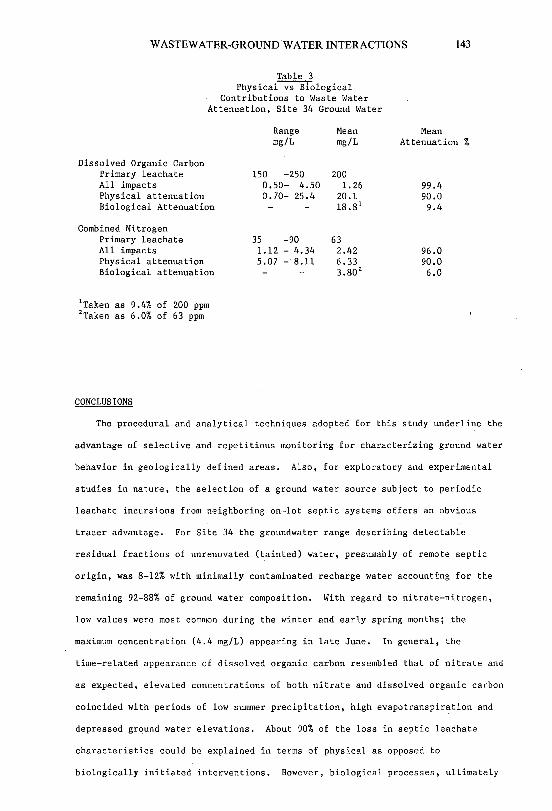
WASTEWATER-GROUNDWATER INTERACTIONS 143
Table 3 Physical~ological
Contributions to Waste Water Attenuation, Site 34 Ground Water
Dissolved Organic Carbon Primary leachate All impacts Physical attenuation Biological Attenuation
Combined Nitrogen Primary leachate All impacts Physical attenuation Biological attenuation
1Taken as 9.4% of 200 ppm 2 Taken as 6.0% of 63 ppm
CONCLUSIONS
Range mg/L
150 -250 0.50- 4.50 o. 70- 25.4
35 -90 1.12 - 4.34 5.07 - 8.11
Mean mg/L
200 1.26
20.1 18.8 1
63 2.42 6.33 3.80 2
Mean Attenuation %
99.4 90.0 9.4
96.0 90.0 6.0
The procedural and analytical techniques adopted for this study underline the
advantage of selective and repetitious monitoring for characterizing ground water
behavior in geologically defined areas. Also, for exploratory and experimental
studies in nature, the selection of a ground water source subject to periodic
leachate incursions from neighboring on-lot septic systems offers an obvious
tracer advantage. For Site 34 the groundwater range describing detectable
residual fractions of unrenovated (tainted) water, presumably of remote septic
origin, was 8-12% with minimally contaminated recharge water accounting for the
remaining 92-88% of ground water composition. With regard to nitrate-nitrogen,
low values were most common during the winter and early spring months; the
maximum concentration (4.4 mg/1) appearing in late June. In general, the
time-related appearance of dissolved organic carbon resembled that of nitrate and
as expected, elevated concentrations of both nitrate and dissolved organic carbon
coincided with periods of low summer precipitation, high evapotranspiration and
depressed gr~und water elevations. About 90% of the loss in septic leachate
characteristics could be explained in terms of physical as opposed to
biologically initiated interventions. However, biological processes, ultimately
144 BOSTON SOCIETY OF CIVIL ENGINEERS SECTION, ASCE
accounted for the removal of up to 98% of the nonconservative dissolved organic
carbon anticipated on the basis of dilution per se. Conversely,
biological transformations affecting the persistence of combined nitrogen were
notably less efficient than for organic carbon and accounted for only 45-80% of
the apparent non biological nitrogen depletion,
These behavioral differences regarding the persistence of organic carbon as
opposed to nitrogen suggest that the Mares Pond ground water system is currently
more vulnerable to additional nitrate than organic carbon interventions. This
conclusion is consistent with the Falmouth Town Meeting decision of 1984 to
service the entire Mares Pond community with a remote source of town water due to
the impending tr·reat of high nitrate concentrations.
Literature Cited
Camp, Dresser and McKee. 1982. Town of Falmouth, Massachusetts, Phase 2 Groundwater Report. Camp, Dresser and McKee, Inc., Environmental Engineers, Boston, Massachusetts.
Federal Register, 1982. Cape Cod aquifer determination, 47 (134).
Guswa, J. H. and D. R. LeBlanc. 1981. Digital models of ground-water flow in the Cape Cod aquifer system, Massachusetts. U.S. Geological Survey Water Resources Investigation 80-67.
Kardos, L. T., W, E, Sopper and E. A. Myers. 1965. Sewage effluent renovated through application to farm and forest land. Science and the Farmer, 12: 4.
K.V. Associates. 1983. Ground water quality assessment program for private well contamination near Mares Pond. Report to Town of Falmouth,
Menzel, D. W, and R. F. Vaccaro. 1964. The measurement of dissolved organic and particulate carbon in seawater. Limnol, 0ceanog. 9: 138.
Merrell, J.C. 1967. Water pollution control research series. Final Report WP-20-7, The Santee Recreation Project, Santee, California. Federal Water Pollution Control Administration.
0ldale, R. N. 1976. Notes on the generalized map of Cape Cod. U.S. Geological Survey.
0ldale, R. N. 1982. Pleistocene stratigraphy of Nantucket, Martha's Vineyard the Elizabeth Islands and Cape Cod, Massachusetts. U.S. Geological Survey, Reston, VA.

WASTEWATER-GROUND WATER INTERACTIONS
Palmer, C. D. 1977. Hydrological implications of various wastewater management proposals for the Falmouth area of Cape Cod, Massa-
145
chusetts. Appendix, Report No. 77-32, Woods Hole Oceanographic Institution, Woods Hole, MA 02543,
U.S. Environmental Protection Agency. 1975. Process design manual for nitrogen control. Office of Technology Transfer, Wash., D.C.
U.S. Environmental Protection Agency. 1983. Design manual, municipal wastewater stabilization ponds. EPA-625/1-83-015.
Winneberger, J. H. T. Nitrogen, Public Health and the Environment. Ann Arbor Science Publishers, Ann Arbor, Mich.
Wood, E. D,, F. A. J. Armstrong and F. A, Richards. 1967. Determination of nitrate in seawater by cadmium-copper-reduction to nitrite. Inc. Eng. Chem. (Anal. Ed.) 18: 96.


A STUDY OF MARKETING OF CONSULTING
ENGINEERING SERVICES TO INDUSTRIAL FIRMS
147
Robert J. Carey and James A. Brunner1
INTRODUCTION
This paper addresses the methods used and the factors
considered by industrial firms to select consulting engineering
firms. It is intended to provide a basis for formulation of
guidelines leading to effective marketing of consulting
engineering services to industrial firms.
The authors designed a marketing research study to identify
and evaluate the following aspects of consulting engineering
services marketing: the dimensions of the industrial market,
including the types of services needed and the frequency of need;
perceptions of attributes and reputation which distinguish and
differentiate consulting firms; marketing tools which can be
effectively utilized to increase the client base; and the
processes used by industrial firms to select a consultant.
The instrument for the research is a questionnaire which was
sent to industrial firms in the heavy industrial Great Lakes
region. It was targeted toward industrial categories which are,
or will be, subject to Federal Pretreatment Standards.
Robert J. Carey is General Manager of R.J. Carey Engineering
Consultants, New Bedford, Massachusetts. James A. Brunner is
Professor of Marketing, University of Toledo (Toledo, Ohio). This
paper is based on a Master's Thesis by Mr. Carey while a graduate
student at the University of Toledo.

148 BOSTON SOCIETY OF CIVIL ENGINEERS SECTION, ASCE
BACKGROUND OF THEORY AND RESEARCH
The marketing of services in general, and consulting
engineering services in particular, is a field of study in its
infancy stage of development. Consulting firms that are embarking
on marketing efforts have little guidance on how to plan and
control the marketing program. With very few exceptions, service
marketing is not taught at the university level of academia and r
is not the subject of published research. Two or three books
regarding
available,
architectural/engineering services marketing are
and authored by marketing consultants. Also, a
handfull of articles and papers have been published in various
industrial trade journals which present the advice and opinions
of persons with experience in this area.
While the value of this available literature is not being
questioned, it is believed that the field of study can be, and
needs to be, improved through empirical research. Only in this
way can a viable basis be established upon which marketing
guidelines can be formulated. Therefore, many of the questions
which are addressed in this study are based on factors which the
authors of the available literature have considered to be
important.
The reason for
service marketing is
this lack of development of the field of
uncertain. With regard to engineering
services marketing, it can be postulated that the following two
factors have contributed to the pr·esent situation.
First, the market for consulting engineering services has
been growing rapidly for the past twenty years as a result of
increased government regulations and funding of civil
engineering/public works projects. Therefore, ample opportunities
have existed for new consulting firms to enter the market and be

MARKETING CONSULTING ENGINEERING SERVICES 149
successful; the pie has been growing. The need to aggressively
compete against other firms in order to grow and survive was not
crucial to the success of a firm.
Second, professional engineering ethics have included the
generally accepted principle that an engineering firm should be
able to generate a sufficient amount of demand for its services
on the basis of goodwill and performance.
Therefore, marketing has been considered to be at best,
unnecessary and unproductive,
unethical.
and at worst, deceptive and
Recent environmental (in the broad sense> changes have
occured, however, which are causing consulting engineering firms
to reconsider marketing and the importance of it. The first such
change is a significant decline in funding programs for municipal
civil engineering/public works projects. Therefore, municipali
ties are reducing, postponing, or eliminating many projects due
to lack of funds. As a result, consulting engineering firms are
competing for market shares of a smaller pie. Some firms are
being shaken out of the market; others are becoming more austere.
Survival is a key strategic concern today - marketing might
represent the difference between success and failure.
The second key change is that industrial firms are facing
increasing pressure to improve their pollution control
procedures. The Clean Water Act, The Clean Air Act, The Toxic
Substances Control Act, RCRA, and the Federal Categorical
Pretreatment Standards are placing requirements on industrial
firms to assume responsibility for their emmissions, effluents,
and solid waste. Therefore, the need for engineering services is
increasing.
Finally, most, if not all, professional fields are changing
their ethics standards to allow the use of promotional activity.
This includes the consulting engineering profession.
Numerous seminars have been held recently regarding

150 BOSTON SOCIETY OF CIVIL ENGINEERS SECTION, ASCE
marketing. The engineering magazines and journals are including
more.and more articles and papers on marketing. Consulting firms
are expanding their staff capabilty for marketing matters.
Clearly, marketing of consulting engineering services is no
longer taboo.
As a management science, crucial to the development of
marketing is empirical research. This paper presents the results
of one research study. Much more work needs to be done to
increase the understanding of marketing and the benefits it can
provide to consulting firms.
PROCEDURES USED IN THE STUDY
A close- ended five page questionnaire was sent to 400
industrial firms. The questionnaire included five sections, with
the first section being a screening section to identify the
firms. The firms are identified on the basis of size, industrial
category, and need for consulting engineering services. Responses
to later sections of the questionnaire may correlate with
responses to this section.
Section 1 of the actual questionnaire asks the respondents
to identify the attributes and reputation factors of a consulting
firm that are considered to be important. Section 2 concerns the
consulting firm's promotional program. Section 3 concerns the
types of services which are needed by industrial firms. Finally,
Section 4 concerns the methods used to select consulting firms.
The responses to the questionnaire were analyzed with the
assistance of a statistical software package developed by McGraw
Hill called SPSS (Statistical Package for the Social Sciences).
The frequencies, mean, and median of all responses were analyzed.
Also, where appropriate, cross classification analysis, including
Chi-square analysis of independence and Pearson Correlation
Coefficient determination of linear relationship, was used to
analyze and evaluate the responses.

MARKETING CONSULTING ENGINEERING SERVICES 151
POPULATION AND SAMPLE
The population for this research was industrial firms within
a 100 mile radius of Toledo, Ohio, in the middle of the heavy
industrial Midwest. The firms employed at least 50 persons, and
were in categories with SIC <Standard Industrial Classifications>
Codes which would make them subject-to the Federal Categorical
Pretreatment Standards.
Cluster Sampling was used to select most of the firms for
inclusion in the study. The clusters consisted of industrial
firms in selected counties. Within the clusters, all industrial
firms in the population were included. In addition, same firms
were included in the sample based on their notification to the
U.S. EPA, through the RCRA Manifest program, that they are
involved in either the generation, treatment, or disposal of
hazardous materials.
ANALYSIS OF RESULTS
Nature of ResQondents
Seventy questionnaires, representing roughly a 17¾ response
rate, were completed and returned for analysis. This is not
unusually low for this type of survey, particularly since a
follow up letter or other means to increase the response rate was
not practical due to time and cast constraints.
The size of the firms ranged from 9 employees to 7000
employees, with a mean of 610 and a median of 150. The median is
more useful in this case because a few very large firms created a
sharply skewed distribution of the number of employees which
distorts the results. In fact, 23¾ employed between 150 and 200
persons. Of those firms which intend to use consulting
engineering services in the future, the median was 200 employees.
Therefore, for purposes of this study, "small" firms employ 200
or less, and "large" firms employ more than 200 persons.

152 BOSTON SOCIETY OF CIVIL ENGINEERS SECTION, ASCE
The largest single categorical group of respondents was
Fabricated Metals (24Y.). The next largest group was Rubber and
Plastics (10Y.l, followed closely by Paper (9Y.) and Miscellaneous
Manufacturing (9Y.l. The other groups were relatively evenly
represented. Table 1 summarizes the groups of respondents.
I!!t!l!!! 1
Industrial Groups and Frequencies
§!:.Q!a!Et 811 Resg_ondents E!a!t!a!!:.!!! !.!a!!!r.a
1. Fabricated Metals 24 7. 32 7.
2. Rubber and Plastics 10 7
3. Paper 9 4
4. Miscellaneous Mfg. 9 7
5. Food and Kindred Products 7 4
6. Stone, Clay, Concrete, Glass 7 11
7. Chemi·cal 6 7
8. Primary Metals 6 4
9. Transportation Equipment 4 7
10. Lumber 3 0
11. Industrial Equipment 3 0
12. Electrical/Electronics 3 0
13. Petroleum 1 4
14. Instruments 1 0
15. Other 7 14
100 7. 100 7.
Roughly 417. of the respondents have used consulting
engineering services in the past. Coincidentally, 41Y. also will
need to use a consulting firm in the future, but not the same
firms which have used these services in the past. Eighty-nine
(897.l percent of the firms which used consulting services in the
past intend to use them in the future as well. A surprisingly
large number of firms, 577., have not, and will not require
consulting services. This is surprising because the questionnaire

MARKETING CONSULTING ENGINEERING SERVICES 153
was targeted at firms which are potentially in need of
engineering services. A possible reason for the high percentage
of "non-needers" is that it was relatively easy for them to
indicate this by simply completing the first page of the
questionnaire. Therefore, the "non-needers" may have responded in
greater relative numbers than those in need of consulting
services. In any case, 30 firms have indicated that they have or
will be in need of consulting engineering services, and have
provided valuable information concerning the marketing of these
services.
11 Non-needers 11
The primary reason for an industrial firm not to need
consulting engineering services is that they are able to receive
similar services from other sources, such as corporate
headquarters or equipment vendors. Thirty-six (367.l cited this
reason, followed by 267. and 217. who cited no wastes and no
improvements planned, respectively.
A strong correlation was found between the size of the
industrial firm and the responses to this question. A review of
Table 2 shows that 817. of the large firms need engineering
services but are obtaining them from staff engineers or other
sources.
need for
On the other hand, 577. of the small non-needers have no
engineering services at all <no wastes and no
improvements planned).

154 BOSTON SOCIETY OF CIVIL ENGINEERS SECTION, ASCE
Reasons Cited for Not Needing Consulting Engineering Services
8§2laQ!1 {;;!_:!;.§!! !Qt.el be!:9§ §me!.!.
1. Corporate/Vendor Assist. 36 7. 62 7. 30 7.
2. No Wastes 26 0 32
3. No Improvements Planned 21 0 25
4. Staff Engineers B 19 6
5. Unfamiliar With Consulting 3 9 2
6. Waiting For Regulations 1 9 0
7. Other 5 0 6
Totals <rounded-off) 100 7. 99 7. 101 7.
Attributes e!l!! Regutation
Consulting firms are evaluated on the basis of tangible
attributes, which are verifiable through either documentation or
observation, and reputation, which, on the other hand, is intan
gible and subjective in nature.
According to the respondents, the most important attribute
of a consulting firm is the completenesss and quality of a
proposal. The proposal demonstrates that the firm understands the
requirements of the project in question, and has invested a
significant amount of resources and interest in obtaining the
work. Closely following in importance are the relevant experience
of the consultant, and a working relationship with the
consultant. This indicates that industrial firms tend to have a
strong loyalty to a consultant, particularly if they are satis
fied with the quality of the services being provided.
The overwhelming least important attribute was the
promotional efforts o( the consultant. This is not surprising in
light of the importance accorded quality and loyalty. Also, it
may be that the industrial firms are not familiar with

MARKETING CONSULTING ENGINEERING SERVICES 155
promotional efforts of consulting firms. Obviously, the proposal
was not considered to be a promotional effort. This will be
commented on later.
Other attributes which were considered to be very important
were cost of services, recommendations/referrals, scheduling, and
geographic location.
Generally, the size of the firm did not significantly affect
the responses. A possible exception would be cost of services,
which was considered to be more important to the smaller firms
than the larger firms.
Table 3 summarizes the rank and relative importance of the
attributes of a consulting firm. It would seem, based on a review
of these responses, that entry into the industrial market for a
consulting firm does not necessarily favor the large established,
full service firms. In fact, a small firm which specializes in a
particular area might be in a very competitive position.
A reputation for providing "State of the Art Know-how" and
maintaining confidentiality rank as the most important factors.
The large firms considered confidentiality as most important. The
small firms cited state of the art know how as most important.
Adherence to schedules and budget and respect for client's input
were also considered to be very important. Large firms considered
cost adherence to be more important than meeting scheduling,
probably reflecting the impacts of bureacracy on
budgeting flexibility.
reduced
Two of the least important reputation factors are low cost
and standardized designs. This finding, combined with earlier
discussed findings regarding the importance of quality and
experience, clearly shows that the industrial firm is looking for
a consultant that is technically proficient in the service area
in question. Also, because past use of the consultant and
confidentiality are so important, it is very likely that an
industrial firm will stay with a consultant that they are

156 BOSTON SOCIETY OF CIVIL ENGINEERS SECTION, ASCE
satisfied with, and are not likely to change consultants without
good reason to do so.
Table 4 summarizes the relative importance of the factors
influencing a consulting firm's reputation~
1.
2.
3.
4.
5.
6.
7.
8.
9.
10.
11.
12.
!s9l51 ~
Attributes of a Consulting Engineering Firm
Attribute
Completeness/Qual. of Proposal
Relevant Experience
Past Use of Consultant
Cost of Services
Recommendations/Referrals
Scheduling/Begin Immediately
Geographic Location
Range of Services
Staff Tenure
Years in Ooeration
Size, Facilities, Resources
Promotional Efforts
Bsn!i
1
2
3
4
5
6
7
8
9
10
11
12
ImE!.ortance
Extreme/Very
Very
Moderate
Slight

MARKETING CONSULTING ENGINEERING SERVICES 157
I.2!2l!s1 1
Reputation Factors of a Consulting Firm
Reautation Ea£:t.9t: Bank lmE!ortance
1. State of Art Know-How 1 Extreme/Very
2. Confidentiality 2
3. Adherence to Schedule 3 Very
4. Adherence to Budget 4
s. Respect for Client Input 5
6. Y. of Repeat Business 6 Moderate
7. Standardized Designs 7
8. Low Cost 8
9. Contract Flexibility 9
An analysis of whether the relative importance of the attri
butes and reputation will change in the future indicated that any
changes would be minor and insignificant.
Promotional !991§
The quality of documents such as reports and contract plans
and specifications are considered to be the most important
promotional tool. This is surprising because there was some
apprehension, in designing the questionnaire, to listing quality
of documents as a promotional tool. However, documents are a
tangible result of a firm's services, and are often used
internally by clients to promote a project. The selection of this
as the most important promotional tool lends further support to
the finding that industrial firms are primarily interested in
firms that exhibit high quality services.
Indirect, or passive, promotional tools such as high quality
documents, goodwill, and trade memberships, are considered to be
more important than direct promotional tools such as telephone
calls, visits, and brochures/promotional literature. Therefore,
the consulting firm which effectively uses these indirect

158 BOSTON SOCIETY OF CIVIL ENGINEERS SECTION, ASCE
promotional tools may be positioning itself very competitively
without pursuing an advertising or direct promotional program.
The only significant differences in the responses on the
basis of size was goodwill. The larger firms considered goodwill
to be the most important promotional tool; slightly more
important than the quality of documents.
Clearly, by the time that documents are used by an
industrial firm to review a consulting firm, the industrial firm
is already familiar with the consulting firm, and the project is
being defined. Goodwill and trade memberships/participation are
the best ways to promote the consulting firm to prospects with
projects which have not been defined or identified. Consulting
firms tend to compete for projects against firms which have
relatively similar levels of goodwill and trade memberships.
Therefore, a distinct advantage is not necessarily present to a
particular firm; a prospective client may still seek a
competitor's services. Since direct promotional tools are the
only way to actively plan and control a program to identify
prospective clients, they may still be important to the
consulting firm; while not being important to the prospective
client.
Of the direct promotional tools, letters and litera
ture/brochures appear to be the most effective. Perhaps this is
because the prospective client can review the material at their
convenience, as opposed to visits and telephone calls.
Advertising is the least effective means of promotion.
Industrial firms are contacted by one or two consulting
firms per year by visits and/or telephone calls, and three to
five firms by letters and literature. Therefore, very little
direct contact is engaged by consulting firms. While the cause
and effect is uncertain, it may be that the low contact is why
the industrial firms do not consider direct promotional tools to
be important.

MARKETING CONSULTING ENGINEERING SERVICES 159
Table 5 summarizes the relative importance of promotional
tools.
1.
2.
3.
4.
5.
6.
7.
8.
Is!t!l!at §
Promotional Tools Used By Consulting Firms
Igg!.
Quality of Documents
Goodwill
Trade Membership
Letters, Literature
Personal Visits
Telephone Calls
Trade Advertising
Yellow-Pages
Bi!nls.
1
2
3
4
5
6
7
8
ImE!,ortance
Very
Moderately
Slightly
§t!!tY~ gf Marketing ReE!,resentative
The respondents indicated that it is relatively important
that the consulting firm's marketing representative be a
Registered Professional Engineer and also manage the project.
They want the marketing representative to demonstrate an
awareness of the technical nature of the client's problem. Also,
if the marketing representative also manages the project, the
client is assured of attention to the client's project, and a
working relationship with the leader of the project team. What
the client does not want is, to quote a cliche, a "dog and pony
show 11•
Larger firms considered it to be more important than the
smaller firms did for the marketing representative to be a P.E ••
The smaller firms tend to have a less formal
technical/engineering staff, and therefore, do not require that
the marketing representative be prepared to discuss technical
matters concerning the project in question.
Cross cl assi f i cation analysis indicated that the industrial

160 BOSTON SOCIETY OF CIVIL ENGINEERS SECTION, ASCE
firms which consider years in operation of a consulting firm to
be important, also considered it important that the marketing
representative be a P.E. Also, firms that consider low cost and
standardized designs to be important, also felt that the
marketing representative should manage the project. A strong
correlation was found between the importance of the marketing
representative to be a P.E. and the size, promotional efforts,
and range of services. Finally, there appears to be a strong
correlation betwwen the reputational factors of low cost, repeat
clients, standardized designs, and opportunity for client input
with the P.E. status.
Table 6 summarizes the importance of the status of the
marketing representative.
Importance of Status of Marketing Representative
ImE!ortance f.,_!;;.,_
Extremely 147.
Very 28
Moderately 38
Slightly 3
Not Important 17
1007.
.!::!s!!H!9gc '
7'r.
31
41
10
10
997.
The respondents indicated that the most commonly used method
of selecting a consulting firm is to use the same firm they used
the last time they needed consulting services. However, this was
not a majority method, because only 31ll. of the resondents
indicated that they used this method. Twenty one percent of the
firms indicated that they checked their files for literature on
firms who have previously expressed an interest in assisting them
MARKETING CONSULTING ENGINEERING SERVICES 161
on engineering matters. Referrals from business associates is
another commonly used method to select consultants, used by 19Y.
of the respondents. Interviewing of prospective consulting firms
is used by 19Y. of the firms.
Responses to this question lend further support to the
finding that a past relationship with an industrial firm, and
goodwill, are two of the key success factors for a consulting
firm to obtain work with an industrial firm. However, there tends
to be a discrepancy between an industrial firm tending to check
their files for information on consultants, and their indication
that direct promotional efforts are not important. Perhaps this
implies that if an industrial firm has prior knowledge of a
consulting firm through promotional literature, it will consider
the firm for selection. However, if the industrial firm has the
opportunity to consider more than one consulting firm, the
promotional material may not be a key success factor in the final
selection process. In other words, the promotional material may
serve to get the consulting engineering firm" in the door".
Requests for Proposals <RFP) are not commonly used. This
indicates that industrial firms are not likely to advertise the
fact that they need engineering assistance, particularly if the
services in question are of a sensitive nature. It is not
surprising when it is recaHed that confidentiality is considered
to be so important.
Yellow pages advertising is rarely used by industrial firms
to select consulting firms. This supports the finding that
advertising is not an effective method of promoting a consulting
firm to the industrial market.
Large industrial firms are significantly more likely to
select a consultant that has been used in the past than are the
small firms. Perhaps the reason is that they are more likely to
need the engineering services on a more frequent basis, and
develop a satisfactory working relationship with the consultant.

162 BOSTON SOCIETY OF CIVIL ENGINEERS SECTION, ASCE
Also, it is less risky, more confidential, and convenient to do
so.
Table 7 summarizes the usage of the various methods to
select consultants. The percentages do not sum to 1007. because
more than one method may be used.
I!1!t!.!.!el Z
Methods Used To Select Consulting Firms
~glbgg ~
1. Select Firm Used The Last Time 317.
2. Check Files For Literature 21
3. Business Associates Referrals 19
4. Interviews 17
5. Professional Org'zation Referrals 10
6. Visit Consultant's Offices 7
7. Requests for Proposals (RFP) 4
8. Yellow Pages
9, Other 1
The respondents were asked to indicate which types of
services they need, and the frequency of need, Environmental
services were the most commonly cited services. Because the
survey primarily comprised firms that may have environmental
concerns, this was expected. Water/wastewater treatment, environ
mental monitoring, and toxic waste management are all used by
over 607. of the firms. Also, the demand for these services is
expected to increase significantly in the near future.
The large firms had a greater tendency than the small firms
to need environmental monitoring services. The small firms had a
greater tendency than the large firms to use toxic waste
management services.
Air pollution control is also needed by a large percentage

MARKETING CONSULTING ENGINEERING SERVICES 163
of the firms. While the respondents indicated that the need will
no increase in the future, recent regulatory changes may tend to
increase the need.
Structural engineering, water supply, drainage, and solid
waste management services are needed by less than half of the
respondents. However, they expect that the need will increase
slightly in the future.
Site engineering, transportation/roadways, and landscaping
are all aspects of site development. These have not been needed
very much in the recent past, and are expected to be needed less
in the future. This response is not surprising considering that
the survey was conducted a few years ago, in 1982, when the
economy was in recession, particularly in the Midwest, and indus
trial capacity was very underutilized. It may be that if the same
question was asked today, the responses would be significantly
different.
A secret to success in any business is to provide a service
or product in need. However, needs change with time and events.
Therefore, long range success depends on a firm's ability to
sense need levels and changes in these levels so that it can
position itself to respond accordingly. Demand analysis is one of
the primary purposes of market research and should be conducted
on a frequent basis. In fact, the responses to this section of
the survey may already be outdated, and should not be assumed to
be reliable for purposes of future services planning.
Table 8 summarizes the past demand or need for services, and
anticipated changes in the demand level, The past demand is
based on frequency of need during the last five years (prior to
the survey>.

164 BOSTON SOCIETY OF CIVIL ENGINEERS SECTION, ASCE
Lat!.!.~ §
Demand for Consulting Services
Past Demand E!!!.!!r::~ !lg!!!s
MARKETING CONSULTING ENGINEERING SERVICES 165
recognize this and be prepared to design their marketing program
to relect it. Various aspects of the marketing program must be
directed towards the appropriate decision makers.
According to the survey results, the plant manager, plant
engineer, and general manager are generally responsible for
consulting engineering matters. The plant engineer tends to be
involved throughout the decision making process. The plant
manager is primarily involved in the preliminary stage of need
determination, and the final selection process. The general
manager is involved in the later stages of final selection and
post selection liaison.
The involvement of the industrial firm's technical
personnel in the preliminary stages of selection indicate that
the industrial firm is probably prepared to discuss technical
details regarding the project with the consulting firm's
marketing representative who makes the initial contact with the
industrial firm. Therefore, the representative must be prepared
to address these technical matters. In the later stages which
involve the general manager as decision maker, it may also be
advantageous for the marketing representative to also be a good
communicator, particularly if a formal presentation is involved.
CONCLUSION
Industrial firms typically select consulting engineering
firms that can demonstrate technical proficiency. Confidentiality
is also very important. The industrial firms tend to be very
loyal to the consulting firm, particularly if the past
relationship is favorable or satisfactory.
The consulting firm that has little or no experience with
industrial clients faces some barriers that must be overcome.
However, opportunities do arise from time to time. If an
industrial firm becomes dissatisfied with the services they are
receiving, then they may decide to change consulting firms. Also,

166 BOSTON SOCIETY OF CIVIL ENGINEERS SECTION, ASCE
if their needs change, or they are seeking engineering services
for the first time, then the barriers are minimal if the
consulting firm can demonstrate competence. Further, the size of
the consulting firm, and the range of services it provides are
very minimal factors in the selection process. Therefore, the
opportunity does exist for a small consulting firm to compete
effectively against larger firms on the basis of quality.
The consulting firm that seeks to take advantage of these
opportunities must position themselves such that they are
considered for selection. The best ways to do this are:
1. Provide the needed services
2. Generate Goodwill
3. Actively participate in professional organizations
4. Distribute promotional literature
The goodwill is typicatly generated by favorable recommendations
and referrals. Professional memberships are effective because
they allow the consulting firm to be aware of current trends in
the profession, demonstrate an involvement in advancing the
quality of engineering services, and are an effective means of
socializing with the prospective clients. The promotional
literature, while not necessarily important to the industrial
firm, do allow the consulting firm to demonstrate an interest in
assisting the industrial firm, describe the available services,
and are available to the industrial firm to review when they are
in need of services and looking for qualified consultants which
provide the services.
The consulting firm must exhibit technical competence in a
direct manner. The quality and completeness of a proposal, and
documents such as technical reports and contract plans and
specifications, are tangible indicators of a consulting firm'.s
ability. Another method of exhibiting competence is to provide a
Registered Professional Engineer as a marketing representative
for discussions with the industrial firm.

MARKETING CONSULTING ENGINEERING SERVICES 167
Finally, the industrial firms that responded indicated that
the following services are demanded frequently, and the demand is
likely to increase significantly in the future: environmental
monitoring, water and wastewater treatment, toxic/hazardous waste
management, and structural engineering.
H~drocarbon Processing.
Carefully". B.G. Johnson
Production Engineering.
(March 1977), 28-33.
Pollution Engineering.
References
"Choose Environmental Consultants
56 (October 19771, 101-103.
"Which Consultant". Edwin C. Braun. 24
"Selecting an Environmental Consultant".
James A. Edwards. 10 (June 1978), 30-32.
"How to Select an A/E". Royal B. Newman. 123 (December
1979), 67.
"Marketing Intangible Products and
Product Intangibles". 59 (May/June 1981>, 94-102.
Industrial Marketing Management. "Industrial Survey Sampling". 10
(July 1981>, 183-189.

PROFESSIONAL SERVICES
+:e::c tibbetts engineer-Ing COl"P, I.I CONSULTING ENGINURS CIVll SANll4RV STRUCTURAL
210 DEANE STREET, NEW BEDFORD, MASS. 02746
TEL. (617) 996-5633
8~ ENGINEERING COMP ANY, Inc.
Cit1U En1ineer• 411 Lezinston Sll"eet
AUBURNDALE, MASS. 02166
LOUIS BERGER & ASSOC IA TES, INC. Engineers Economists • Planners
20 William Street, Wellesley, Massachusetts 02181 Telephone (617) 235-5874
~Black & veatcn ~ Engineers-Architects
260 Bear Hill Road
Waltham, Massachusetts 02154
617-890-4340
CLINTON BOGERT ASSOCIATES
CIVIL• SANITARY • ENVIRONMENTAL CONSUL TING ENGINEERS
2125 Center Avenue• Fort Lee. NJ 07024 (201) 944-1676
aAllen&.. Demur11an a Ara DemurJlan
Vice President
Consulting Engineers, Land Surveyors l31 Clarendon Street Boston, Mass. 02116 617/262-5430
BOSTON • HYANNIS • HALIFAX • BEDFORD • MANSFIELD • LEXINGTON CRANSTON, R. I.• DERRY, N. H. •WORCESTER• NORWELL
BOSTON SURVEY I ~sec CONSULTANTS~
263 SUMMER STREET BOSTON, MASS. 02210
{617) 426-8866
Specification and Document Writing
Word Processing
C D & E COMPANY Construction Documents and Engineering Company
DAN FRITZSCHE P.E.
P.O. BOX 472 MEDFIELD, MA. 02052
(617) 359-6703 C.S.I.IC.C.S.
<P GEOTECHNICAL ENGINEERS INC.
CONSULTING ENGINEERS•
• fOUNOATION$ • DAM$ • EARTHQUAKE STUOIES• , Ell.CAVATION$ • EARTH• RUAININO STIIUCTURU'
• HAZARDOUS WASTE MANAGEMENT • GEOHYOROlOGY•
• ROCIC MECHANICS• flElO INSTRUMENTATION·
WINCHESTER, MA CONCORD. NH ENG~EWOOO, CO (617}729·162S [603)lU-7979 !JOJ)779•SS6S
CAMP DRESSER & McKEE INC. Offices Throughout the U.S.
One Center Plaza Boston. Massachusetts 02108
environmental engineers. scientists. CDM planners, & management consultants
ANDREW CHRISTO ENGINEERS CONSULTING ENGINEERS
75 CHARLES STREET SOUTH BOSTON, MA 02116
(2nd Floor)
TELEPHONE 617-451-3232
Norwood Engi11eertng
Consulting Engineers and Surveyors
Norwood Engineering Co .• Inc. 1410 Route One
Norwood, Mass. 02062 (617) 762-0143
Please mention the Journal when writing to Advertisers

PROFESSIONAL SERVICES
Telephone 617-482-3400
Coffin & Richardson Inc. Consulting Engineers
87 Kilby Street, Boston, Massachusetts 02109
CONGDON, GURNEY & TOWLE, INC
59 TEMPLE PLACE
BOSTON, MASS. 021\1
CRANDALL DRY DOCK ENGINEERS, Inc.
o..,, Deeb - Plen - Waterfnat Btnchur•
U•••rw•t•r Bsaalaatloa
21 Pottery Lane Dedham, Mass.
IUCJIARD J. DONOVAN, INC, ENGltiEERS: Design & Construction Management
540 MAIN ST., WINCHESTER, MASS. 01890
0
~ ©l\JllRllRl&s[I{] &s@@@©n~'il'f?o®, □[!{]©.
ENGINEERS AND PLANNERS
182 MAIN STREET, P.O. BOX 567
NORTHAMPTON, MASSACHUSETTS 01061
TELEPHONE (413) 584-7701
H. K. DODGE ASSOCIATES, INC. Landscape Architects Engineers
24 Union Ave. Framingham, Ma. 01701
Framingham (617) 872-9413 Boston Arca (617) 23)-6644
EDWARDS AND KELCEY
(ms.,ARDS AND KELCEY
....: ORGANIZATION
Trans1Jortation Engineers, Planners and Consultants
~~~,~~1;e.8~1il8'01
617-542,4576
Offices in Principal Cities
EUSTIS ENGINEERING COMPANY, INC. Soll and Foundation Consultants
Soil Borings Laboratory Tests Foundation Analyses and Reports
3011 28th St. P.O. Box 8708 Metalrle, Louisiana 70011
(504) 834-0157
FAY, SPDFFDRD & THORNDIKE, INC.
Engineers TRANBPCRTATICN BVBTEMB WATER BUPPLY•BEWERAGI!!
CRAINAGE•BRICGEB•AIRPCRTB PCRT ANC INCUBTRIAL FACILITIES ENVIRCNMENTAL IMPACT BTUCIEB
191 Spring St., P.O. Box 802, Lexington, MA 02173 (617) 863-8300
PRC Harris, Inc.
Herbert G. Benson, P.E. Vice President
A Planning Research Company Long Wharf, Boston, Massachusetts 02110 Telephone (617) 723-1700
G®M Ganteaume & M1..-Mullcn, Inc., Engineers • An.•hitects f)9 (~hautlL'Y Street, H,>slon, Massachusetts 02111
617-423-7450
IS TRANSIT COMPREHENSIVE SYSTEM PLANNING SERVICES FROM
AND DESIGN OFFICES NATIONWIDE
HOWARD NEEDLES 7AMMEN& BERGENDOFF/THOMASK. DYER SUITE 4200 . PRUDENTIAL CENTER BOSTON, MA. 02199 (617) 267-6710
Please mention the Journal when writing to Advertisers

PROFESSIONAL SERVICES
Since 1952
CARR-DEE CORP. Comp1,1, So/I lnvHl/g11/on $1/"l'ICI
37 Linden Street Medford, MA 02155 (617) 391-4500
Albert J. DeSimone Principal
TAMS TIPPETTS-ABBETT-McCARTHY-STRATTON ENOINEERS, ARCHITECTS AND PLANNERS (617) 482-4835
BRUCE CAMPBELL, P. E. NEW ENGLAND REGIONAL MANAGER
36 CHAUNCY STREET, BOSTON I MASSACHUSETTS 02111
Greiner Engineering
JAMES D. FITZGERALD
Vice President
GREINER ENGINEERING SCIENCES, INC. 108 Llncoln Slreet Boston, Massachuseus 02111 617 542-0752
A Member of the SP Group ol Professional Servlca Companlas
liannatt Flaming ENGINEERS AND PLANNERS
347 CONGRESS STREET• BOSTON. MA 02210·1222 (617) 357•8533
J<..~}\ HALEY & ALDRICH, INC.
Consulting Geotechnical Engineers, Geologists and Hydrogeologists
238 Main Street. Cambridge, MA 02142 Tel. 617 /492-6460
Portland, ME Glastonbury, CT Affiliate: H & A of New York Rochester, NY
■ Havens and Emerson Consulting Environmental Engineers
120 Boylston St.. Boston, MA 02116 (617/ 424-1050 Cleveland• Saddle Brook, NJ• Atlanta• St. Louis• Gary
Civil and Environmental Engineers• 1617} 890-3980
HALEY AND WARD, INC.
25 Fox Road • Waltham, Massachusetts• 02154
Testing • Inspection • Consultation
Engineering Services
The Haller Tt•stin~ 1,ahoratori.-s of Massat'hnsPUs. Im•. ·
11 A WALKUP DRIVE • WESTBOROUGH, MASS. 01581 TEL. AREA CODE (617) 235-9032
HARDESTY & HANOVER Consulting Engineers
Bridges Highways
Special Structures
1501 Broadway New York, N.Y. 10036
HNTB HDWAAD NEEDLE■ TAMMEN & BEAGENDDFF
ARCHITECTS ENGINEERS PLANNERS
Offices in principal cities nationwide
Suite 4200, Prudential Center Baston, Massachusetts 021 99
61 7 267-671 0
Offices Throughout New England
Rhode Island 401/861-2900
Massachusetts 617/893-2110
SURVEYS SINCE 1877 BY LAND BY SEA BYAIR
Connecticut 203/ 563-2341
New Hampshire 603/889-1262
G
NEW ENGLAND SURVEY SERVICE SURVEY ENGINEERS OF BOSTON
GUNTHER ENGINEERING, INC.
(617) 423-3313 • 263 SUMMER ST., BOSTON, MA 02210
Please mention the Journal when writing to Advertisers

PROFESSIONAL SERVICES
S EA CONSULTANTS INC. Engineers Planners Architects
54 Cana/St. Boston MA 02114 (617) 742-1133
~ ~ Engineering, Project and ~Al~ Conslr_U()tlon Management
1893 Serving Power, Industry and Environment
CHAS. T. MAIN, INC. A Subsidiary of the Parsons Corporation
Prudential Center, Boston, MA 02199 617-262·3200
SIii SHANNON & WILSON, INC,
Geotechnical Consultants Engineering And Applied Geosciences
P.O. Box C-30313 • Seattle, WA 98103 (206)632-8020
Seattle • Spokane • Portland • Fairbanks Anchorage • St. Louis
H.W. MOORE ASSOCIATES, INC. Consulting Engineers
Civil - Structural - Sanitary
Urban Planning and Transportation
112 SHAWMUT AVENUE BOSTON, MASS. 02 I 18
Tel. 357-8145
Maurice A. Reidy Engineers
101 Tremont Street
Boston, Massachusetts 02 l 08
AN STV PROFESSIONAL FIRM
Seelye Stevenson Value & Knecht Engineers and Planners
125 Pearl Street Boston, MA 02110 Phone: (6171 482-7293
ADVANCED TECHNOLOGY I COMMERCIAL AND INDUSTRIAL RAIL AND MASS TRANSIT I HIGHWAYS AND BRIDGES ENVIRONMENTAL ENGINEERING I COMMUNICATIONS t AIRPORTS EDUCATIONAL, RESEARCH ANO HEALTH CARE FACILITIES
Solid waste Resource Recovery Air Pollution Control. Roads/Bridges
Water Pollution Control Industrial Waste
Water Supply & Distribution Drainage/Flood Control
Vel1%ssoc1ATES
ii;•:x:,~ i~:.1~:g~~1.e~,/~O~t~:~1;nr,t~:ts Carle Place, Long Island, New YOlk/Y0<k. Pennsylvania
HERMAN G. PROTZE MATERIALS TECHNOLOGIST
36 Jaconnet Street Newton Highlands, Mass.
TESTING INSPECTION RESEARCH DEVEWPMENT CONSULTATION
W&H WHITMAN & HOWARD, INC.
ENGINEERS AND ARCHITECTS 45 WILLIAM STREET, WELLESLEY, MASS. 02181
ENVIRONMENTAL ENGINEERING, PLANNING & DESIGN
Serving communities throughout New England for over 100 years.
vtii. 7 7 North Washington Street
Boston, Massachusetts 02114 (617) 227-6666
Engineers Architects Planners Consultants
Vanasse/Hangen Consulting Engineers & Planners 60 Birmingham Parkway, Boston, MA 02135 617/783-7000
PHONE, (6 tn 767-)400 TELEX, 94-0745
TECHNICAL PARK DRIVE HOLBROOK, MASS. 02343 U.S.A.
JOHN T. YUNITS
Consulting Engineer
Yunlts Engineering Cu., Inc. Sycamore Equipment Co., Inc. Boston Engineering & Sales Corp.
Boston E. & S. Company, Ltd.
• Holbrook, M,u.s. • Holbrook, Mns. • Holbrook, Mau. • Toronto, Canada
Please mention the Journal when writing to Advertisers

PROFESSIONAL SERVICES
M:'= Metcalf & Eddy
• Engineers • Planners • Construction
Managers • Contract
Operators
Headquarters: Wakefield, MA 01880 617-246-5200
Anderson-Nichols Architects/Engineers/Environmental Consultants/Planners
Comprehensive Facilities Planning and Design Services for Massachusetts Industry and Government 150 Causeway Street, Boston, MA 02114 617/742-3400
SCI TOTAL ENGINEERING
Slpplcan Consultants International, Inc. 1033 Massachusetts Avenue Cambridge, Massachusetts 02238 617/868-1200
LEA GROUP
ENGINEERS/ARCHITECTS/PlANNERS
75 Kneeland Street, Boston, MA 02111 Telephone (617) 426-6300
Aa,' GERAGHTY ,4r&MILLER, INC.
Ground-Water Consultants
The North Shore Atrium 6800 Jericho Tpke., Syosset, NY 11791
(516) 921-6060
EERS
AIKEN, SC ANNAPOLIS
BATON ROUGE DENVER
HACKENSACK, NJ HOUSTON
MILWAUKEE NEWTOWN,PA OAK RIDGE, TN PALM BEACH
GARDENS TAMPA
WASHINGTON, PA
Please mention the Journal when writing to Advertisers

ADVERTISEMENTS
We're Handy I
tl IHRlflY OIUG(Nl
PRINTER OFFSET/ COPY I NG
(~TILCONI
CRUSHED STONE
UPTOWN 320 Stuart St., Boston 02116
426-1160
DOWNTOWN 15 Lancaster St., Boston 02114
227-8131
TILCON MASSACHUSETTS INC.
BITUMINOUS CONCRETE
Serving Southeastern Massachusetts and Cape Cod
430 HOWARD ST. BROCKTON, MA 02401
'Engineers
Surveyors
Scientists
Architects
Landscape Architects
Planners
The BSC Group
~
PARSONS BRINCKERHOFF ACenturvot Engineering Excellence
Parsons Brinckerhoff Quade& Douglas, Inc.
450 Summer Street Boston MA 02210
617 350 4090
617 588 3660 617 696 8555
Boston Barnstable Bedford Halifax
Norwell Worcester
120 Boylston Street Boston, MA 02116 (617) 426-7330
42 Offices Worldwide
Engineers Planners Architects Construction Managers
Please mention the Journal when writing to Advertisers

ADVERTISEMENTS
REINFORCING STEEL
WELDED WIRE MESH
BARKER STEEL CO., INC. NORTHERN STEEL CO.
PIONEER VALLEY STEEL
80 GIBSON STREET
BOX 227, MEDFORD, MA 02155
391-8600
PLANTS
SO. DEERFIELD, MA
WATERTOWN MEDFORD
Since 1889 .....
Stone & Webster Engineering Corporation
Boston, Massachusetts
with full service Operations Centers in Cherry Hill, NJ., New York City,
Denver, and Houston.
Please mention the Journal when writing to Advertisers

ADVERTISEMENTS
CARTER
l=)I LE CRIVING
Inc.
• H-PILES
• TIMBER PILES
•CASTIN PLACE
72 BACON STREET, NATICK, MASSACHUSETTS 01760
TEL. NATICK 653-7423 • WELLESLEY 235-8488
\ FRANKi l IMll,i·@M,ii·liiNffiW
PRESSURE INJECTED FOOTINGS
CAST-IN-PLACE PILES · CAISSONS
~TRUCTURAL WALLS ANO CUT-Off'"<;; BY SlUARY TRENCH PROCESS
FRANKi FOUNDATION COMPANY 916 STATLER OFFICE 8UtLDING • BOSTON, MASSACHUSETTS 02116, PHONE 16171 426-4369
P. Gioioso & Sons, Inc. GENERAL CONSTRUCTION
HYDEPARK
58 SPRAGUE STREET
MASSACHUSETTS 02136
Please mention the Journal when writing to Advertisers

ADVERTISEMENTS
NEW ENGLAND
FOUNDATION CONTRACTORS 37 LOWELL JUNCTION RD. ANDOVER, MASS. 01810 617 944-2224
CAISSONS • DRILLED • BELL BOTTOM • DRIVEN •
GUILD DRILLING CO., INC. 100 Water Street
East Providence, RI 02914 Tel (401) 434-0750
COMPLETE SOIL INVESTIGATION SERVICE
New England Concrete Pipe Corp. NEWTON UPPER FALLS, MASSACIIUSETIS
(617) 969-0220 MANUFACTUllll:RS OP
Plain and Reinforced Concrete Sewer and Culvert Pip•
Pre-cast, Pre-stressed Concrete Structural Units PLANTS
Newton, Dedham, Westfield, Plainville, Massachusetts
Please mention the Journal when writing to Advertisers

ADVERTISEMENTS
SURVEYORS BUILDERS & ENGINEERS
THE SOUijCE:
Kern Nikon Topcon Lietz Gurley Berger
David White Path Lufkin Kroy Stacor
Rolatape Planhold Koh-i-noor Dietzgen
Complete modern repair facility with more than 40 years experience in repair and calibration of most widely used instruments.
Rentals of current model surveying instruments with purchase option.
EDM and Theodolite Sales and Rentals. Our own guarantee as well as the manufacturer's, covers every instrument we sell.
711 Concord Avenue Cambrldge, MA 02138 (617) 864-4640 Outside MA 1-800-225-1945
Please mention the Journal when writing to Advertisers


A NOTE FROM BSCES 179
The Boston Society of Civil Engineers Section/ASCE has
recently reevaluated its 70-year-old journal and is committing new
resources to the production of a new and different journal designed
to attract a broad, national readership,
The new journal, Ciyil Engineering Practice; Journal of the
Boston society of Ciyil Engineers section ASCE, will attempt to
capture the spirit and substance of contemporary Civil Engineering
in a careful selection of articles comprehensive in scope, yet
clear to the non-specialist, Key emphasis will be placed on
techniques now being applied successfully in the analysis,
justification, design, construction, operation and maintenance of
Civil Engineering works, It will cover the various technical and
professional divisions of Civil Engineering with discrimination,
understandability and balance,
The new journal will appear twice yearly, in Winter/Spring and
Summer/Fall issues, Volume 71, Nos, 1 & 2 (a combined issue), 1985,
of The Journal of the Boston society of civil Engineers represents
the last issue of that publication, The first issue of c.i.Y.il
Engineering Practice will be the Winter/Spring 1986 issue, Please
contact the Editor, BSCE Journal, 236 Huntington Ave,, Boston, MA
02115-4701, for subscription and advertising rates for C.iY.il
Engineering Practice, BSCE members will receive the new journal as
part of their membership fees,
Ciyil Engineering Practice welcomes article submissions, For
guidelines see the following page,
GUIDE TO AUTHORS 180
Submission of Papers for Publication
Articles on subjects related to civil engineering, either
technical or professional, are welcomed and will be considered for
publication. Unless you have already prepared the article, please
submit an outline of what you propose to do/cover for our review
and comments, Each article must be the original work of the
author(s). If published or offered for publication elsewhere, this
should be mentioned in a cover letter, Earlier oral presentation,
or membership in BSCES or ASCE, are not prerequisites for
publication, After review, authors will be notified either that the
article has been accepted, accepted with changes suggested by
reviewers, or not considered suitable for publication, Please send
three copies of an outline or article to the Editor, BSCE Journal,
236 Huntington Ave., Boston, MA 02115-4701,
All manuscripts should be typed, double-spaced on 8,5" x 11"
paper with l" margins, Recommended manuscript length is 24 - 40
typed, double-spaced pages (approximately 6,000 - 10,000 words).
All artwork (photos, figures, charts, graphs, tables, etc,)
should accompany the final manuscript, Photos should be black and
white glossy prints. If you need the artwork returned to you,
please note so on the reverse side of each piece,
Please keep the style of writing for article similar to the
style of writing in Scientific American. Please remember that our
readership is across sll the divisions of Civil Engineering. If
there are particular terms, acronyms, procedures, etc, that might
not be familiar to other practicing Civil Engineers in other
divisions, please define them clearly and concisely,
Please. refrain from mentioning a particular company's services
or products if a generic product name or service or procedure can
be substituted,

BOSTON SOCIETY OF
CIVIL ENGINEERS SECTION ASCE
Committee Chairmen, 1985-1986
Committee
ACTION PROGRAM PROFESSIONAL PRACTICE
ADVERTISING ANNUAL MEETING AUDITING AWARDS BERTRAM BERGER MEMORIAL COMMITTEE BORING DATA BUDGET THOMAS R. CAMP FUND CLAMBAKE CONSTITUTION & BYLAWS CONTINUING EDUCATION 1986 ASCE CONVENTION EMPLOYMENT CONDITIONS JOHN R. FREEMAN FUND HAZARDOUS WASTE HISTORY & HERITAGE AD HOC COMMITTEE ON INFRASTRUCTURE INVESTMENT JOURNAL EDITORIAL BOARD KEY MAN LECTURE SERIES MEMBERSHIP MINORITY AFFAIRS NO MINA TING COMMITTEE OPERATIONS MANUAL PROGRAMS PUBLICATIONS PUBLIC RELATIONS STATE BUILDING CODE ADVISORY
a. GEOTECHNICAL b. LOADS c. SEISMIC
STUDENT AFFAIRS YOUNGER MEMBERS
Division
ADMINISTRATIVE
Division Chairmen
PROFESSIONAL & SOCIETY AFFAIRS TECHNICAL GENERAL TASKS
Chairman
Dominic E. D'Eramo
Steven L. Ber:nstein Ronald E. Sharpin Ronald E. Sharpin Bruce Campbell Robert Palerino Judith Nitsch Stephen Geribo Kim Jaworski Edward B. Kinner Ronald E. Sharpin Charles A. Parthum Robert A. Benson Lee M.G. Wolman Westley E. Stimpson H. Hobart Holly John P. Sullivan Judith Nitsch Richard J. Scranton William 0. Martin Steven L. Bernstein A. Stanley Lucks Jack D. Bryant Stanley C. Rossier Judith Nitsch Steven L. Bernstein Judith Nitsch Robert J. Dunn, Jr.
Edmund G. Johnson Frank Heger Rene W. Luft Carol Rego Karen Kirk Adams
Chairmen
Lewis Edgers Richard M. Simon Ronald E. Sharpin Robert B. Barton

1985 I I