borrego, cutler, prince, henderson and froyd journal of engineering education fidelity of
TRANSCRIPT

Borrego, Cutler, Prince, Henderson and Froyd Journal of Engineering Education
Fidelity of Implementation
of Research-Based Instructional Strategies (RBIS)
in Engineering Science Courses
Maura Borrego and Stephanie Cutler, Virginia Tech
Michael Prince, Bucknell University
Charles Henderson, Western Michigan University
Jeffrey E. Froyd, Texas A&M University
Accepted for publication in Journal of Engineering Education
Structured Abstract
Background – Increasing attention is being paid to improvement in undergraduate STEM
education through increased adoption of Research-Based Instructional Strategies (RBIS), but
high-quality measures of faculty instructional practice do not exist to monitor progress.
Purpose (Hypothesis) – The measure of how well an implemented intervention follows the
original is called Fidelity of Implementation. This theory was used to address the research
questions: What is the fidelity of implementation of selected RBIS in engineering science
courses? That is, how closely does engineering science classroom practice reflect the intentions
of the original developers? Do the critical components that characterize a RBIS discriminate
between engineering science faculty members who claimed use of the RBIS and those who did
not?
Design/Method – A survey of 387 U.S. faculty members teaching engineering science courses
(e.g., statics, circuits, thermodynamics) included questions about class time spent on 16 critical
components and use of 11 corresponding RBIS. Fidelity was quantified as the percentage of
RBIS users who also spent time on corresponding critical components. Discrimination between
users and nonusers was tested using Chi Square.
Results – Overall fidelity of the 11 RBIS ranged from 11-80% of users spending time on all
required components. Fidelity was highest for RBIS with one required component: case-based
teaching, just-in-time teaching, and inquiry learning. Thirteen of 16 critical components
discriminated between users and nonusers for all RBIS to which they were mapped.
Conclusions – Results were consistent with initial mapping of critical components to RBIS.
Fidelity of implementation is a potentially useful framework for future work in STEM
undergraduate education.

Borrego, Cutler, Prince, Henderson and Froyd Journal of Engineering Education
Introduction
Increasingly, reports from high-profile organizations in the United States are calling for
widespread improvements to engineering and STEM undergraduate education (e.g., American
Society for Engineering Education (ASEE), 2009; Association of American Universities (AAU),
2011; Committee on Science Engineering and Public Policy, 2006, 2010; National Science
Board, 2010). The most recent of these (ASEE, 2012; National Research Council, 2012;
President’s Council of Advisors on Science and Technology, 2012) draw attention to the
complex processes of encouraging a majority of faculty members to use Research-Based
Instructional Strategies (RBIS) in their engineering, math and science courses. The focus is
shifting from research and development of RBIS such as active learning (Prince, 2004),
cooperative learning (Prince, 2004) and problem-based learning (Prince & Felder, 2006) to
include emphasis on faculty and institutional change processes. The recent “DBER” report,
Discipline-Based Educational Research: Understanding and Improving Learning in
Undergraduate Science and Engineering (National Research Council, 2012), specifically calls
for more research in this area.
In order to measure progress toward goals of widespread use of RBIS, a number of challenges
must be addressed. Among these is developing complete and consistent descriptions of each
RBIS, so that reports and measures of usage and efficacy are both accurate and precise. An
apparent lack of this type of consistency would explain in part why there is often disagreement
concerning the efficacy of specific RBIS, including those with long histories of development and
assessment.
Research publications often target other researchers, rather than practitioners, so detailed
descriptions of methodology focus on providing enough information to replicate the study
itself—not the intervention. Rarely is sufficient detail provided to faithfully implement the
instructional strategy. When publications focus on practitioners, they tend to emphasize raising
awareness and communicating effectiveness (Borrego, Froyd, & Hall, 2010), sometimes at the
expense of omitting important details about how to implement the instructional strategies. This
level of detail is important, given the complexity and diversity of engineering students and
learning environments. Specific instructional strategies are likely to work in certain settings
under certain conditions—not all of them. In order to understand and communicate these
conditions, it is important to have complete and accurate descriptions and measures of how and
when an instructional strategy is being implemented.
In the K-12 educational system, careful documentation of implementation has become necessary
in local, state, and national implementation of programs, creating a strong need for accurate
description of each program site (Century, Rudnick, & Freeman, 2010). The measure of how
well the implemented intervention follows the original is called Fidelity of Implementation
(O'Donnell, 2008). The purpose of this survey research is to explore how Fidelity of
Implementation theory from K-12 education applies to engineering undergraduate education.
Specifically, we address the following research questions:
Borrego, Cutler, Prince, Henderson and Froyd Journal of Engineering Education
1. What is the fidelity of implementation of selected RBIS in engineering science courses?
That is, how closely does engineering science classroom practice reflect the intentions of
the original developers?
2. Do the critical components that characterize a RBIS discriminate between engineering
science faculty members who claimed use of the RBIS and those who did not?
The results of this work will inform change efforts in engineering education and undergraduate
education in other STEM disciplines. This study mirrors similar investigations in physics
(Henderson & Dancy, 2009) and geosciences (Macdonald, Manduca, Mogk, & Tewksbury,
2005), and many of the RBIS we are studying were developed in other STEM fields. We chose
to focus this study on engineering science courses for several reasons. Engineering sciences (e.g.,
statics, circuits, and thermodynamics) are the “core” of engineering. They distinguish
engineering from other disciplines. They are also the gateway courses that must be passed by all
students to continue in engineering. In many ways, they are the equivalent of introductory
science courses in which these RBIS were originally developed. Along with junior-level courses
specific to the major, they appear to be the most resistant to pedagogical change. This is
evidenced, for example, by the bookending of active learning design experiences now typical in
the freshman and senior years (Froyd, 2005).
Literature Review
Our literature review comprises two parts. First we review the literature on Fidelity of
Implementation (FOI). Then, we describe the specific Research-Based Instructional Strategies
(RBIS) we studied, including selection criteria and evidence of efficacy.
Fidelity of Implementation
According to Rogers, early dissemination studies were based on the implicit assumption that all
adoption was “an exact copying or imitation of how the innovation had been used previously in a
different setting” (2003, p. 174). More recently, it has become clear that studies must also
consider the extent to which the innovation changes during the diffusion process, and researchers
have begun considering fidelity of implementation.
A high level of fidelity has obvious benefits for being able to measure and trace diffusion of an
innovation, e.g. a specific teaching strategy. However, adopters (particularly engineering faculty
members) want or need to modify the innovation in order for it to work in their local
environment. Some level of adaptation is desirable because it promotes adoption and may also
improve upon the innovation (Rogers, 2003). Work in fidelity of implementation is beginning to
consider these issues holistically, but debate continues about the extent to which an innovation
should be allowed to change (Blakey, 1987; Century et al., 2010; Emshoff et al., 1987; Hall &
Loucks, 1978; Mowbray, Holter, Teague, & Bybee, 2003; O'Donnell, 2008).
Fidelity of implementation is broadly defined as the measure of how well an implemented
intervention follows the original (O'Donnell, 2008). While there is limited research in
engineering education specifically investigating fidelity of implementation, fields such as mental

Borrego, Cutler, Prince, Henderson and Froyd Journal of Engineering Education
health, program evaluation, education, and human services have been conducting such
investigations for several decades (Mowbray et al., 2003).
There are typically two types of fidelity studies: efficacy studies and effectiveness studies.
Aspects of both are relevant to our study of undergraduate engineering education. An efficacy
study investigates whether the intervention can achieve the set objectives under ideal
circumstances. An “Efficacy study’s examination of fidelity focuses on whether a program is
implemented at all… and to what degree… and it uses the answers to these questions to improve
the program” (O'Donnell, 2008, p. 41). Efficacy studies typically focus on the development stage
and help developers to critically analyze the needed components for the innovation to succeed or
fail. Many engineering education researchers, particularly those developing curricular materials
or instructional strategies, conduct efficacy-type studies. When they expand their work to include
other student populations at other institutions, for example, they are trying to better understand
the exact conditions under which their interventions improve student learning or motivation.
An effectiveness study, in contrast, investigates the effects of an innovation when implemented
by regular users in actual practice. “Effectiveness studies seem more interested in interpreting
evidence of the program for generalizability…and observing the implementation of the program
in the field” (O'Donnell, 2008, p. 42). The focus shifts from the level of fidelity needed for the
intervention to be successful (efficacy studies) to the changes that users make in practice and the
impact of these changes on the ability of the intervention to achieve its goals (effectiveness
studies). The current study is an effectiveness study because it is investigating how RBIS are
being used in by engineering science faculty members. However, fidelity is a relatively new
concept in undergraduate STEM education, and previous efficacy studies on RBIS did not
contain a fidelity element. Therefore, this paper includes more discussion of a number of
elements typically considered in efficacy studies, such as identification of critical components.
For further discussion and examples of efficacy and effectiveness studies as well as a general
review of fidelity of implementation research, see O’Donnell (2008).
A key element of fidelity is the components that characterize the intervention. Century and
colleagues called these the critical components, defined as the “essential features that must be
measured to determine whether a program is present or not” (2010). Similar to engineering
specifications used in the design process, critical components help indicate whether the
intervention does what was intended. Critical components are similar to the components in the
Concerns Based Adoption Model’s (CBAM’s) innovation configurations. Mowbray and
colleagues refer to them as fidelity criteria (2003), Carroll calls them essential components
(2007) and Bickman and coworkers label them fidelity measures (2009). Despite the variations in
terminology, each of these perspectives focuses on identifying the components that are necessary
for fidelity. In this study, we will refer to them as critical components. Efficacy studies develop
the critical components, while effectiveness studies investigate whether the critical components
are present or if they have been changed. In order to conduct an effectiveness study, we must
first determine the critical components of the RBIS of interest.
The actual steps to identifying critical components are laid out in CBAM’s innovation
configuration literature (Hall & Loucks, 1978). Developing an innovation configuration begins
with a literature review of the innovation, followed by an iterative process including user

Borrego, Cutler, Prince, Henderson and Froyd Journal of Engineering Education
interviews and observations. Next, the component checklist is constructed, which includes all of
the components and variations of each component. The final step is locating dominant patterns
by categorizing individual users (from earlier interviews) by the variations they use. As a result,
the list may be revised. The level of fidelity in a particular setting can then be quantified by
dividing the number of components implemented by the total number of components. For
examples of fidelity research that has used CBAM, see Anderson (1997), Emshoff et al. (1987),
and Mills & Ragan (2000).
The process of establishing an innovation configuration is a significant undertaking usually
performed by the developer of the innovation, rarely if ever for more than one intervention at a
time. For the purposes of this study, in which we are comparing 11 RBIS, we have abbreviated
the process to include an extensive literature search and consensus among a panel of engineering
and physics education experts. However, we note that systematically identifying critical
components through innovation configurations or other means is an important direction for
future work, particularly among the developers of new research-based instructional strategies.
Mowbray and coworkers (2003) reviewed the literature on fidelity of implementation to identify
common steps used to establish, measure, and validate the fidelity criteria of an innovation; these
steps are outlined in Table 1. The first step is to establish critical components. The three most
common ways of establishing critical components are: using an established program model
(which already lists critical components), using the expert opinion of those who have published
on the innovation, and using qualitative research methods such as interviews with users. These
are abbreviated steps that reflect CBAM’s innovation configuration. For this study, we relied on
the literature, augmented by the expertise of our research team (which includes authors of the
most highly cited articles related to RBIS in engineering).
Once critical components have been identified, the next steps are to actually measure fidelity and
establish validity (Mowbray et al., 2003). The actual measurement of fidelity can be
accomplished through (a) researcher or expert ratings of observations or other implementation
documentation, (b) user surveys or (c) user interviews. In this study, we surveyed engineering
science faculty members about their classroom activities and RBIS use. Then, validity and
reliability of the criteria can be established utilizing one or more of the following methods:
ensuring inter-rater reliability, confirming consistency of the internal structure between expected
and actual results, ensuring convergent validity by using multiple sources, using known groups
to compare across programs, and comparing the observed fidelity measures to the expected
outcomes of the user (e.g., student learning gains). When establishing the critical components in
this study, we ensured inter-rater reliability by discussing and refining the set of critical
components until all five team members agreed. Additionally, we surveyed faculty from multiple
universities and engineering disciplines (aerospace, chemical, civil, computer, electrical, and
mechanical engineering) to compare fidelity across settings. Throughout the results section and
in the discussion that follows, we compare the actual results to the expected results and consider
implications for fidelity criteria.

Borrego, Cutler, Prince, Henderson and Froyd Journal of Engineering Education
Table 1: Mowbray, et al.’s (2003) steps to evaluate fidelity of implementation. Italics
indicate methods used in this study.
Steps Methods to accomplish each step
1. Establish Critical
Components
Established program's model (listing components)
Literature/Expert Opinion
Qualitative research methods (e.g., user interviews)
2. Measure Fidelity Researcher/expert ratings from observations or documentation
User surveys
User interviews
3. Validate Fidelity Criteria Inter-rater reliability
Comparison of actual to expected results
Comparison across known groups/programs
Comparison of fidelity to efficacy measures
Convergent validity of multiple sources
Research Based Instructional Strategies
We used the following criteria for selection of RBIS to be included in this study: (1) documented
use in engineering settings at more than one institution and (2) demonstrated positive influence
on student learning in engineering or STEM.
We acknowledge that the evidence base for some of the most widely recommended
undergraduate STEM instructional strategies does not meet the highest standards identified by
hierarchies of evidence used in medicine and K-12 education (e.g., U.S. Department of
Education, 2007). For example, the What Works Clearinghouse (2011) of the U.S. Department
of Education’s Institute for Education Sciences excludes from its reviews any study that doesn’t
include a comparison or control group demonstrated to be equivalent to the treatment group.
Given the autonomy of undergraduate faculty members to develop, select and adapt their own
instructional strategies, this level of standardization may not be realistic.
The DBER report, focusing on undergraduate STEM education, concludes that “research-based
instructional strategies are more effective than traditional lecture in improving conceptual
knowledge and attitudes about learning” (National Research Council, 2012, p. 3). “Overall the
committee has characterized the strength of the evidence on making lecture more interactive as
strong”—the highest level in their hierarchy of evidence—“because of the high degree to which
the findings converge” (p. 122). Specific strategies discussed in this section of the report overlap
significantly with those in the current study: Just-In-Time Teaching, Concept Tests, Think-Pair-
Share, Collaborative Learning, Cooperative Learning, and use of “clickers” (with the caveat that
these strategies are used appropriately)(National Research Council, 2012).
Additionally, we note that a number of high-profile undergraduate STEM education efforts are
underway (e.g., Association of American Universities (AAU), 2011; Bay View Alliance, N.D.;
Business-Higher Education Forum, N.D.) and will not wait for more rigorous evidence to
accumulate. Studies and methods to understand and measure use of instructional strategies must
develop in parallel. This study addresses the latter by introducing the concept of fidelity of

Borrego, Cutler, Prince, Henderson and Froyd Journal of Engineering Education
implementation to STEM undergraduate education so that implementation can be understood to
evolve as the evidence base is strengthened.
Table 2 summarizes the RBIS explored in the current study, and the following text briefly
describes each RBIS and reviews evidence of their efficacy. Note that although there is
significant overlap in the way that these terms can be used, the more detailed descriptions in the
text below seek to clearly categorize a particular instructional activity as a single RBIS.
Table 2: Research Based Instructional Strategies (RBIS) and descriptions supplied to
participants as they completed the survey.
RBIS Brief Description
Just-In-Time
Teaching
Asking students to individually complete homework assignments a few
hours before class, reading through their answers before class and
adjusting the lessons accordingly.
Case-Based
Teaching
Asking students to analyze case studies of historical or hypothetical
situations that involve solving problems and/or making decisions.
Service Learning Intentionally integrating community service experiences into academic
courses to enhance the learning of the core content and to give students
broader learning opportunities about themselves and society at large.
Think-aloud-
Paired Problem
Solving
Forming pairs in which one student works through a problem while the
other questions the problem solver in an attempt to get them to clarify
their thinking.
Inquiry Learning Introducing a lesson by presenting students with questions, problems or a
set of observations and using this to drive the desired learning.
Peer Instruction A specific way of using concept tests in which the instructor poses the
conceptual question in class and then shares the distribution of responses
with the class (possibly using a classroom response system or “clickers”).
Students form pairs, discuss their answers, and then vote again.
Concept Tests Asking multiple-choice conceptual questions with distracters (incorrect
responses) that reflect common student misconceptions.
Think-Pair-Share Posing a problem or question, having students work on it individually for
a short time and then forming pairs and reconciling their solutions. After
that, calling on students to share their responses.
Problem-Based
Learning
Acting primarily as a facilitator and placing students in self-directed
teams to solve open-ended problems that require significant learning of
new course material.
Collaborative
Learning
Asking students to work together in small groups toward a common goal.
Cooperative
Learning
A structured form of group work where students pursue common goals
while being assessed individually.
Just-in-time teaching. Just-in-time teaching (JiTT) combines web-based technology with active
learning methods in the classroom (Modesitt, Maxim, & Akingbehin, 1999; Novak, Patterson,
Gavrin, & Christian, 1999; Rozycki, 1999). Students individually complete Web-based assignments
a few hours before class, then the instructor reads through their answers before class and adjusts
the lessons accordingly (“just in time”). Novak et al. (1999) assessed JiTT for its impact on

Borrego, Cutler, Prince, Henderson and Froyd Journal of Engineering Education
cognitive outcomes, student attrition and student attitudes in physics. Student learning was
assessed using the Force Concept Inventory, which showed normalized students gains between
35% and 40%. This gain is similar to that found for other interactive-engagement teaching
methods (Hake, 1998) and is significantly better than the average normalized gains found in
traditionally taught physics courses. The authors also report that JiTT reduced student attrition by
40% compared to previous offerings taught traditionally. Cashman and Eschenbach also found
that JiTT increased student engagement and confidence when implemented in their Introduction
to Environmental Engineering course (2003).
Case-based teaching. Case-based teaching requires students to analyze case studies of historical
or hypothetical situations that involve solving problems and/or making decisions (Prince &
Felder, 2007). Studies have found that relative to conventional strategies, case-based teaching
significantly improves retention (Fasko, 2003), reasoning and problem-solving skills (Fasko,
2003; Levin, 1997), higher-order skills on Bloom’s taxonomy (Gabel, 1999), the ability to make
objective judgments (Dinan, 2002), the ability to identify relevant issues and recognize multiple
perspectives and awareness of ethical issues (Lundeberg, Levin, & Harrington, 1999). A meta-
analysis by Lundeberg & Yadav (2006a, 2006b) concluded that cases have a positive impact on
faculty and student attitudes, class attendance, and faculty perceptions of learning outcomes.
Newson and Delatte provided example cases and advocated for their use in civil engineering
courses to help students meet ABET criterion 3 learning objectives (2011).
Service learning. Service learning is “the intentional integration of service experiences into
academic courses to enhance the learning of the core content and to give students broader
learning opportunities about themselves and society at large” (Oakes, 2009, p. 1). Duffy et al.
(2009) report positive influences of service learning on (a) recruitment in engineering, especially
among Hispanic students, (b) student self-reports of their motivation, (c) subject matter
comprehension, and (d) student self-reports of their abilities in teamwork and communication.
Jiusto and DiBiasio (2006) report positive effects on lifelong learning in the Global Studies
Program at Worcester Polytechnic Institute. Dukhan, Schumack, and Daniels successfully used
service learning in their heat transfer course to increase students’ social awareness and ability to
identify the human connections in a project (2009).
Think-aloud-paired problem solving. Think-aloud-paired problem solving (TAPPS) is an
active learning technique that can be utilized in the classroom (Lochhead & Whimbey, 1987).
For TAPPS, the instructor forms teams in which one student works through a problem while the
other questions the problem solver in an attempt to get students to clarify their thinking (Felder
& Brent, 2009).
Inquiry learning. Inquiry learning is an instructional strategy in which students are presented
with questions to be answered, problems to be solved, or a set of observations to be explained
(Kolb, 1984). In this study we will use the term inquiry learning to refer to instruction that uses
questions and problems to provide contexts for learning and does not fall into another more
restrictive RBIS. Shymansky et al. (1990) analyzed results from 81 experimental studies
involving thousands of students and found that inquiry learning produced significant positive
gains for academic achievement, student perceptions, process skills and analytic abilities. In a
meta-analysis of 79 individual studies between 1965 and 1995 involving students from 7th grade
Borrego, Cutler, Prince, Henderson and Froyd Journal of Engineering Education
through college, Smith (1996) found that inquiry learning improved academic achievement,
critical thinking skills and laboratory skills. In a meta-study of laboratory instruction conducted
over roughly the same time period, Rubin (1996) found that inquiry-based instruction was
superior to traditional instruction for cognitive learning outcomes, which included conceptual
and subject learning, reasoning ability, and creativity, as well as for non-cognitive outcomes,
including manipulative skills and attitudes. Coller used inquiry learning in his statics course and
found that the electrical engineering students taking the course greatly benefited (as evidence by
higher exam grades) from hands-on inquiry learning when compared to another section which
did not use inquiry learning (2008).
Peer instruction. In peer instruction (Mazur, 1997) the instructor asks students to respond to
conceptual questions (often multiple choice). It is a specific case of concept tests (below) which
specifies how students discuss and respond to conceptual questions. While peer instruction can
be accomplished without the aid of classroom technology, it is most typically employed using
classroom responses systems or “clickers” (Mazur, 2009). Crouch and Mazur (2001) examined
10 years of data with physics students at Harvard comparing peer instruction to traditional
lectures. They report that students taught using peer instruction had twice the normalized gains
on the Force Concept Inventory of students in a control group. Students’ quantitative problem
solving skills were also measured using the Mechanics Baseline Test and showed that peer-
instruction resulted in problem-solving skills that were at least equal to and generally better than
those for traditionally taught courses. Additional support for the benefits of peer-instruction for
both promoting conceptual understanding and problem-solving skills in calculus is provided by
Pilzer (2001). Koretsky and Brooks used peer instruction in a thermodynamics course for
chemical engineers and found that the quick feedback provided to the faculty greatly aided them
in helping students address misconceptions. Also, on simple questions, they found an increase in
student knowledge and understanding after completing the peer instruction exercise (2011).
Concept tests. Concept tests are an example of active learning where the instructor uses
multiple-choice question about a course-related concept, often with distracters (incorrect
responses) that reflect common student misconceptions (Felder & Brent, 2009). Santi used
concept tests in a geological engineering course to address two common misconceptions (2007).
Think-pair-share. Think-pair-share is a quick active learning strategy where the instructor poses
a problem, has students work on it individually for a short time and then has them form pairs and
reconcile their solutions before calling on them to share their responses. (Felder & Brent, 2009)
Byerley used multiple active learning techniques in a thermodynamics course including think-
pair-share and found an increase in students engagement and project performance (2001).
Problem based learning. Problem-based learning (PBL) begins by posing an open-ended,
authentic problem that provides the context and motivation for learning and requires students to
gather information for its solution. Most PBL implementations involve students working in self-
directed teams to identify learning needs and develop viable solutions to the problems, with
instructors acting as facilitators rather than primary sources of information (Prince & Felder,
2007). A meta-analysis of the effectiveness of problem-based learning (Dochy, M., Van den
Bossche, & Gijbels, 2003) suggests that students may acquire more knowledge in the short term
when taught conventionally but are likely to retain knowledge longer when taught with problem-

Borrego, Cutler, Prince, Henderson and Froyd Journal of Engineering Education
based learning. The results for skill development consistently favored PBL instruction. Prince
(2004) examined several meta-analyses and concluded that PBL improves students’ skill
development, retention of knowledge, and ability to apply learned material. Prince and Felder
(2006) cite studies reporting a robust positive effect of PBL on development of a variety of
problem-solving skills, conceptual understanding, ability to apply metacognitive and reasoning
strategies, teamwork skills, and attendance. Reeves and Laffey used PBL in an Introduction to
Engineering course an found an increase in the students’ problem solving skills (1999).
Collaborative learning and cooperative learning. There is little consensus in the literature and
in faculty discussions regarding the difference between collaborative and cooperative learning
(Barkley, Cross, & Major, 2005; Prince, 2004). For the purposes of this study, we distinguished
between the two by whether the same grade is earned by all students in the group (collaborative
learning) or if at least a portion of the grade is individual (cooperative learning). This is
consistent with much of the literature in engineering education, which tends to define
cooperative learning as a structured form of group work that includes, at minimum, some
element of individual accountability. Effectively, this makes cooperative learning a special case
of the more general collaborative learning. We note that this distinction is not universally
reflected in the literature. For example, Barkley et al. (2005) focus on the role of the instructor
and the existence of a known solution in making their distinction.
Collaborative learning, in this study, refers to any instructional method in which students work
together in small groups toward a common goal (McNamee, Roberts, & Williams, N.D.). As such,
it is a catch-all category of team or group based strategies that do not fall into other better
defined categories (and studies traditionally cited in support of cooperative learning apply to
collaborative learning as well). Analyses of the educational impact of working together vs.
working individually are consistently positive. In a review of 90 years of research, Johnson,
Johnson and Smith found that working together improved learning outcomes relative to
individual work across the board (1998a). Similar results were found in an updated study by the
same authors (Johnson, Johnson, & Smith, 1998b) that examined 168 studies between 1924 and
1997. Springer et al. (1999; 1997) found similar results from 37 studies of STEM students
working in small groups. Shooter and McNeal used collaborative learning in their
interdisciplinary mechatronics course to help students meet ABET criterion 3 learning objectives
(2002).
Cooperative learning, in this study, is defined as a structured form of group work where students
pursue common goals while being assessed individually (Millis & Cottell, 1998; Prince, 2004).
Cooperative learning has extensive empirical support for promoting a range of important
learning outcomes (Johnson et al., 1998a, 1998b; Prince, 2004). Hsiung divided a planar dynamics
course into two sections, one using cooperative learning and the other using individualistic
learning. Over time, there was an increased performance with the cooperative learning group on
both homework and tests (2012).
Borrego, Cutler, Prince, Henderson and Froyd Journal of Engineering Education
Methods
Overview
National faculty surveys were administered at two points in time. In spring 2011, we surveyed
chemical engineering faculty members who had recently taught sophomore level introductory
thermodynamics, fluid mechanics, or heat transfer and electrical and computer engineering
faculty members who had recently taught sophomore circuits, electronics, and introductory
digital logic/digital design. Based on these results, the survey instrument was revised slightly. In
spring 2012, we surveyed faculty members who had recently taught statics (regardless of their
disciplinary affiliation).
Development of Critical Components
Following Hall and Loucks (1978) and Mowbray (2003), we developed critical components by
consulting the literature describing each RBIS. The author team, which includes experts on the
engineering and physics RBIS literature, achieved consensus on a list of “required” and
“indicative” elements, or critical components, for each RBIS. Required elements are activities
that would be absolutely necessary to claim that the RBIS is being used. For example, having
students discuss problems in pairs is required for think-pair-share. Indicative activities are
generally associated with RBIS use, but are not required by the literature. For example, reporting
out on the conclusions of a student group discussion is frequently indicative of cooperative
learning, but is not required to claim that cooperative learning is being used. The final list
comprised 16 items, many of which correspond to multiple RBIS. (This mapping is presented in
the results tables below; Table 15 is a complete list.)
Instrument
The survey instruments were adapted by the authors from a previous survey of introductory
physics instructors (Henderson & Dancy, 2009; Henderson, Dancy, & Niewiadomska-Bugaj,
2012). The engineering instrument was divided into three sections. The first section asked
faculty to estimate the amount of class time spent on different activities generally associated with
RBIS use—the required and indicative critical components. The second asked faculty about their
level of use and knowledge of the 11 specific RBIS; the descriptions in Table 2 were included.
The third section included demographic information such as gender, rank, and frequency of
attendance at teaching workshops. To measure the reliability of the survey, Cronbach’s alpha
was calculated for the 2011 survey as 0.855, an acceptable level of reliability (Pedhazur &
Schmelkin, 1991). Based on the results of the 2011 data collection, three RBIS (case-based
teaching, think-aloud-paired problem solving, and service learning) were removed from the
survey due to low reliability and/or low levels of use. Three critical components which did not
correspond to any remaining RBIS were also removed. The 2012 instrument was calculated to
have a Cronbach’s alpha of 0.9208, an acceptable level of reliability (Pedhazur & Schmelkin,
1991).

Borrego, Cutler, Prince, Henderson and Froyd Journal of Engineering Education
Data Collection
Instructors of the courses of interest were identified by directly contacting each department.
We compiled lists of all the ABET accredited programs in chemical, electrical and computer
engineering the U.S. To identify statics instructors, we compiled a list of all accredited U.S.
mechanical engineering programs (n = 285) as well as 7 civil engineering and 4
aeronautical/aerospace engineering programs at institutions that do not offer mechanical
engineering. Virginia Tech Center for Survey Research (CSR) staff contacted each department
via telephone with email follow-up to identify the instructors of the courses of interest. (The
protocol for statics included identifying which department was responsible for the course and
following up as appropriate.)
Each instructor was invited to complete the survey via a personalized e-mail signed by either
Margot Vigeant of the American Institute of Chemical Engineers (AIChE) survey committee,
Susan Lord, then-president of Institute for Electrical and Electronics Engineers (IEEE) Education
Society, or Paul Steif and Anna Dollár, established statics professors and researchers. Gift cards
were also offered as raffle incentives to those who completed the survey. The surveys of
chemical, electrical and computer engineering faculty were administered in fall 2011, and the
survey of statics faculty was administered in fall 2012. To understand potential survey bias and
increase the response rates, CSR contacted initial non-respondents (chemical, electrical and
computer engineering) in spring 2012 and requested they complete the survey. The early and late
responses were compared, and no statistically significant differences were found between
demographic information, RBIS use, or time spent on activities in class. The responses were
combined into one data set. Similarly, comparisons between the responses of faculty from
different engineering disciplines yielded few statistically significant differences (Prince,
Borrego, Henderson, Cutler, & Froyd, in press). For this reason, and because three individual
data sets would be too small to allow for comparisons of users and nonusers (warranting heavier
reliance on Fisher’s exact test), the data sets were combined into one.
Responses were screened to ensure respondents had taught one of the courses of interest and
completed a majority of the survey items. Any participant who did not meet these characteristics
was removed from the analysis, leaving 99 chemical engineers, 122 electrical and computer
engineers, and 166 statics faculty with usable responses.
The ECE and ChE surveys were sent to 1425 faculty members with 221 responses for an overall
response rate (including late respondents) of 16%. The statics survey was sent to 764 faculty
members with 166 responses and a response rate of 22%. The total n (electrical, computer,
chemical and statics) is 387, and the overall response rate is 18%.
Of the 387 usable responses, 19% of respondents were female and 73% male (8.2% did not
respond); 9.8% were lecturers (i.e., not tenure track), 24% assistant professors, 67% associate
professors, 26% full professors, and 5.9% listed their position as other (7.7% did not respond).
The respondents came from a variety of engineering departments or programs: 32% electrical
and/or computer engineering, 26% chemical engineering, 14% mechanical engineering, 15%
civil, 2.1% aerospace/aeronautical, 1.0% engineering mechanics, and 2.8% indicated “other”
(7.7% did not respond).

Borrego, Cutler, Prince, Henderson and Froyd Journal of Engineering Education
Data Analysis
Statistical analysis was conducted using IBM SPSS Statistics 21.0 software, released August
2012. We operationalized fidelity as the percentage of RBIS users who also spent class time on
the required critical components. However, we identified between 1 and 4 required critical
components for each RBIS. In the results section, we report the percentage of RBIS users who
spent time on 4, 3, 2, 1 and 0 required components (as relevant).
Both types of survey items were multiple choice. The options for RBIS included just one option
for current use; all other responses were considered to indicate nonusers. The prompt for critical
components was, “Please indicate what percentage of time on average your students spent/spend
on each of the activities below during class time.” The options were 0%, 1-25%, 26-50%, 51-
75%, and 76-100%. While we can argue that problem-based learning and inquiry learning
require a substantial proportion of class time, the literature provides little guidance as to the
appropriate percentages we might employ in this study. Additionally, the overwhelming majority
of nonzero responses were 1-25%. Thus all of the nonzero responses were combined to
differentiate respondents who spent time on the activity from respondents who did not.
Since all respondents answered questions about which classroom activities they spent time on,
we can also use this data set to compare users to nonusers and determine whether various critical
components are useful for discriminating between RBIS users and nonusers. We used Chi Square
or Fisher’s Exact tests to examine the relationships between RBIS use and the classroom
activities identified as critical components. (Unless indicated, all results are Chi Square.) The Chi
Square test tests the null hypothesis: for example, there is no relationship between Collaborative
Learning and having “students work on a problem in pairs or groups.” If the p-value is less than
alpha (0.01 due to the large number of comparisons being made), the null hypothesis is rejected
indicating a relationship between the RBIS and the activity. In other words, when an activity is
“required” or “indicative” for a specific RBIS, we would expect a p-value less than 0.01 to
indicate discrimination between users and nonusers. (It is also possible that both users and
nonusers have a similar level of use that is not statistically significantly different. That could
indicate high fidelity of implementation without strong discrimination between RBIS users and
nonusers.)
For each of these significance tests, we also calculated the effect size using phi, the appropriate
test for our binary data. The effect size allows the Chi Square or Fisher’s exact test result to be
evaluated with respect to the number of tests that are run. It is generally accepted that an effect
size below 0.1 there is no significant relationship between the variables. Between 0.1 and 0.3,
there is a slight relationship between the variables. Between 0.3 and 0.5 represents a moderate
relationship, and above 0.5 is a strong relationship (Morgan, Leech, Gloeckner, & Barrett, 2011).
Limitations
As discussed in our other publications (Froyd, Borrego, Cutler, Henderson, & Prince, in press),
the limitations of this faculty survey approach include response bias from particularly
conscientious instructors and self-reports of RBIS use. Both would tend to overestimate the level

Borrego, Cutler, Prince, Henderson and Froyd Journal of Engineering Education
of RBIS use. However, the goal of this analysis is not to determine the proportion of engineering
faculty members using RBIS. Readers are cautioned against using the data for this purpose.
Rather, this analysis is focused on engineering faculty members’ understanding and adaptation of
the RBIS, many of which were not developed in engineering. Additional responses from faculty
members who do not use RBIS, though likely more representative of the population, would have
been of little use here. By triangulating two different types of survey items against each other, we
can better describe the inherent limitations to faculty surveys of teaching, which are unlikely to
go away any time soon, given the relative ease with which surveys generate large amounts of
quantitative data.
In general, it is difficult to estimate the degree to which response bias has skewed the results of
any survey, because survey analysts, in general, do not have data on the individuals who did not
respond. In surveys about health care, survey analysts often have an alternate source of data, i.e.,
health insurance databases (Etter & Perneger, 1997). However, we are unaware of an alternate
database that they could use for non-respondents in their study. In fact, we had to first create our
database of faculty members teaching core courses, because there was no existing database to
use.
Given this constraint, several precautions were taken to understand and reduce response bias.
First, the we followed established practices for increasing response rates and working with
professionals (Sudman, 1985). Without an alternate database to estimate response bias, a
common method of estimating likelihood of response bias influencing results is to compare
characteristics of the survey respondents to the general population, and if they are similar,
conclude that the effects of response bias are reduced (Groves, 2006). Since the demographics of
the survey respondents in this study are similar to the demographics of engineering faculty
(Froyd et al., in press; Prince et al., in press), there is some confidence in the value of the survey
results. Third, following established practice, the survey team contacted additional faculty
members who did not respond to the first rounds of surveys as a way to compare early and late
responders to estimate effects of response bias (Ferber, Winter, 1948-1949). As described above,
no differences were found between early and late responders that would indicate that response
bias influenced results.
Finally, this analysis assumes that if respondents reported using an RBIS and one of its critical
components that the activities are linked. The high number of RBIS and classroom activities
under investigation draws attention to the possibility of confounding factors that may tend to
overestimate both fidelity of implementation and the discrimination of critical components. We
note that the results are well-structured in the sense that they reflect expected relationships
consistent with literature definitions of the RBIS. Again, readers are cautioned against using
these results as representing the percentage of the engineering faculty population using RBIS.
Results
Table 3 and Figure 1 present summary results for the fidelity of engineering science faculty
members’ use of RBIS. Specifically, they present the percentage of self-reported RBIS users
who spent class time on 4, 3, 2, 1 and zero required critical components for each RBIS. (N/A in
Table 3 is used to designate RBIS with fewer than four critical components.) The highest levels

Borrego, Cutler, Prince, Henderson and Froyd Journal of Engineering Education
of fidelity were measured for case-based teaching (80%), just-in-time teaching (74%), concept
tests (73%) and inquiry learning (70%), which all had only one required critical component.
More moderate levels were measured for think-aloud-paired problem solving (62%, 2 required
components), cooperative learning (57%, 3 components), collaborative learning (53%, 3
components), problem-based learning (52%, 4 components) and think-pair-share (52%, 3
components). Lowest fidelity was measured for peer instruction (only 11% of users spent time
on all 4 required components) and service learning (50% of users spent time on the 1 required
component).
It is difficult to find benchmarking fidelity scores in the literature, since many are based on
rubrics developed by the researchers to study a specific program or intervention. These rubrics
are not typically normed to 100% (e.g., Blakely et al., 1987 ; Mills & Ragan, 2000). However,
Macias and coworkers reported percentages for their fidelity study of a specific model of mental
health community-based care. They reported that 95% of all sites reported following at least half
of the required practices (2001). By this standard, these fidelity results are quite low. (For
example, 18% of PBL users spent time on 2 of 4 required critical components, as compared to
95% in the mental health study.) Lack of results with which to benchmark is a limitation of this
study as well as an opportunity for future work. To explore these results in greater detail, we
discuss the critical and required components for each RBIS in more detail below.
In general, the percentage of RBIS users who spent class time on each critical component is
much higher than the combined percentages for multiple components reported in Table 3. The
RBIS-level tables are more appropriate for addressing the second research question of which
critical components discriminate between RBIS users and nonusers. Significance tests for every
combination of RBIS and classroom activity were run, regardless of their designation as critical
components (or not). The tables below report the results for every required and indicative
component. Unexpected significant relationships are reported in the text only.

Borrego, Cutler, Prince, Henderson and Froyd Journal of Engineering Education
Table 3: Percentage of users who spent time on required critical components for each
RBIS.
Percentage of users who spent time on required critical components
RBIS 4 components 3 components 2 components 1 component 0 components
Just-In-Time
Teaching
N/A N/A N/A 74% 26%
Case-Based
Teaching
N/A N/A N/A 80% 20%
Service
Learning
N/A N/A N/A 50% 50%
Think-aloud-
Paired Problem
Solving
N/A N/A 62% 29% 9.5%
Inquiry
Learning
N/A N/A N/A 70% 30%
Peer
Instruction*
11% 45% 37% 4.8% 1.6%
Concept Tests N/A N/A N/A 73% 27%
Think-Pair-
Share
N/A 52% 36% 11% 1.1%
Problem-Based
Learning
52% 24% 18% 4.9% 1.9%
Collaborative
Learning
N/A 53% 35% 10% 2.0%
Cooperative
Learning
N/A 57% 36% 6.0% 1.5%
*In statics survey, one critical component was separated into 2 items (uses clickers and uses other means)

Borrego, Cutler, Prince, Henderson and Froyd Journal of Engineering Education
Figure 1: Visualization of users who spent time on required critical components for each
RBIS.
Just-in-Time Teaching
Just-in-time teaching (JiTT) requires students to individually complete Web-based assignments a
few hours before class; then the instructor reads through their answers before class and adjusts
the lessons accordingly (“just in time”). The results for this RBIS are presented in Table 4. JiTT
demonstrated relatively high fidelity with 74% users and 49% of nonusers spending time on the
required activity (setting deadlines before class and adjusting their lecture). This activity also
discriminates between users and nonusers (p =0.001, phi = 0.163, a slight relationship), which is
to be expected since it is such a specific activity to JiTT. The indicative activity of engaging
students also showed a majority (76%) of users also spending time on the activity but did not
discriminate. (This activity was actually mapped to all 11 RBIS as indicative, so it would be
surprising if it was statistically significant here.)
An additional significant relationship was found between JiTT and having students “participate
in group work for which the assessments are designed so that individuals may earn different
scores for their work on the assignment” (p = 0.001). Half (50%) of faculty who use JiTT spent
time on this activity, while only 26% of nonusers spent time. It is possible that this is an

Borrego, Cutler, Prince, Henderson and Froyd Journal of Engineering Education
adaptation of JiTT worth further investigation, or JiTT users may simply tend to also assign
group work in their classes.
Table 4: Just-in-Time Teaching Required and Indicative Components
Student Activity Required /
Indicative
Faculty who
use RBIS (n =
46) and spent
time on
activity
Faculty who
don't use RBIS
(n = 341), but
spent time on
activity
p-value Phi
Spent time discussing pre-
class activities which helped
you re-evaluate student
learning and adjust your
lecture 'just in time'
Required 74% 49% 0.001* 0.163
Participate in activities that
engage them with course
content through reflection
and/or interaction with their
peers (other than watching,
listening, and/or taking
notes)
Indicative 76% 67% 0.222 0.062
* indicates significance with alpha = 0.01
Case-Based Teaching
Similarly, case-based teaching demonstrated high fidelity and discrimination for its one, unique
required critical component. As listed in Table 5, fully 80% of users but only 36% of nonusers
required students to analyze case studies, a statistically significant difference. For the indicative
components, RBIS users ranged from 60-88%, demonstrating relatively high fidelity but not
discrimination in most cases. Again, many of these activities overlap with other RBIS, and
nonusers also reported participating at high levels (43-70%).
An additional significant relationship was found between case-based teaching and having
students “participate in group work for which assessments are designed so that individuals may
earn different scores for their work on the assignment” (p = 0.008). About half (52%) of RBIS
users spent time on this activity, but less than a third (27%) of nonusers spent time on the
activity. It is reasonable to consider in future work that an adaptation of case-based teaching in
engineering may be to have students discuss cases in groups but have each student responsible
for their own written analysis of the case.

Borrego, Cutler, Prince, Henderson and Froyd Journal of Engineering Education
Table 5: Case-Based Teaching Required and Indicative Components from ECE/ChE
survey
Student Activity Required /
Indicative
Faculty who
use RBIS (n =
25) and spent
time on
activity
Faculty who
don't use RBIS
(n = 196), but
spent time on
activity
p-value Phi
Analyze case studies of
historical or hypothetical
situations that involve
solving problem or
making decisions
Required 80% 36% < 0.001 *1 0.282
Work on projects inspired
by problems or situations
from real engineering Indicative 88% 70% 0.062
1 0.128
Complete specifically
designed activities to
'learn' course concepts on
their own without being
explicitly told
Indicative 60% 43% 0.116 0.106
Participate in activities
that engage them with
course content through
reflection and/or
interaction with their
peers (other than
watching, listening and/or
taking notes)
Indicative 72% 62% 0.317 0.067
Discuss a problem in
pairs or groups Indicative 72% 70% 0.829 0.015
1 Fisher’s Exact Test used due to less than n=5 in a cell * indicates significance with alpha = 0.01
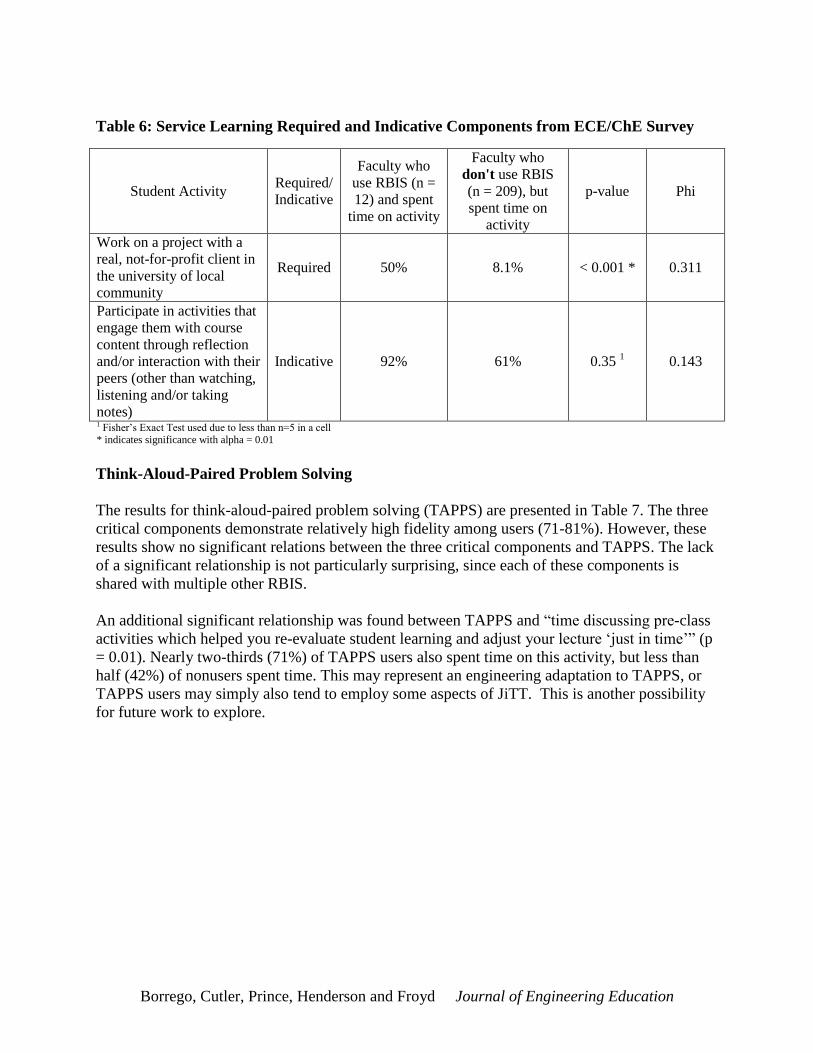
Service Learning
Although service learning is gaining traction in engineering education, we did not expect to see it
used extensively in engineering science courses. In fact, only 12 respondents said they currently
use it. As indicated in Table 6, only 50% of users reported spending time on the one required
critical component, assigning projects with real clients in the university or local community. The
relatively low 50% may be accounted for in part due to the changing nature of service learning,
which has an increasingly global focus. Nonetheless, this critical component effectively
discriminated between users and nonusers (p = 0.001, phi indicates a moderate relationship).
Finally, the indicative activity, although not statistically significant, demonstrates high fidelity
with 92% of users engaging students with course content.
Borrego, Cutler, Prince, Henderson and Froyd Journal of Engineering Education
Table 6: Service Learning Required and Indicative Components from ECE/ChE Survey
Student Activity Required/
Indicative
Faculty who
use RBIS (n =
12) and spent
time on activity
Faculty who
don't use RBIS
(n = 209), but
spent time on
activity
p-value Phi
Work on a project with a
real, not-for-profit client in
the university of local
community
Required 50% 8.1% < 0.001 * 0.311
Participate in activities that
engage them with course
content through reflection
and/or interaction with their
peers (other than watching,
listening and/or taking
notes)
Indicative 92% 61% 0.35 1 0.143
1 Fisher’s Exact Test used due to less than n=5 in a cell * indicates significance with alpha = 0.01
Think-Aloud-Paired Problem Solving
The results for think-aloud-paired problem solving (TAPPS) are presented in Table 7. The three
critical components demonstrate relatively high fidelity among users (71-81%). However, these
results show no significant relations between the three critical components and TAPPS. The lack
of a significant relationship is not particularly surprising, since each of these components is
shared with multiple other RBIS.
An additional significant relationship was found between TAPPS and “time discussing pre-class
activities which helped you re-evaluate student learning and adjust your lecture ‘just in time’” (p
= 0.01). Nearly two-thirds (71%) of TAPPS users also spent time on this activity, but less than
half (42%) of nonusers spent time. This may represent an engineering adaptation to TAPPS, or
TAPPS users may simply also tend to employ some aspects of JiTT. This is another possibility
for future work to explore.

Borrego, Cutler, Prince, Henderson and Froyd Journal of Engineering Education
Table 7: Think-Aloud-Paired Problem Solving Required and Indicative Components from
ECE/ChE survey
Student Activity Required/
Indicative
Faculty who
use RBIS (n =
21) and spent
time on
activity
Faculty who
don't use
RBIS (n =
200), but
spent time on
activity
p-value Phi
Explain their reasoning to
another student while
solving a specific problem Required 71% 54% 0.116 0.106
Discuss a problem in pairs or
groups Required 81% 69% 0.322
1 0.077
Participate in activities that
engage them with course
content through reflection
and/or interaction with their
peers (other than watching,
listening and/or taking notes)
Indicative 76% 62% 0.238 1 0.089
1 Fisher’s Exact Test used due to less than n=5 in a cell * indicates significance with alpha = 0.01
Inquiry Learning
The results for inquiry learning (Table 8) indicate high fidelity with significant relationships
between the RBIS and all three of its critical components. Inquiry learning users assign problems
or projects that require students to seek out new information (70% of users, p < 0.001, slight
relationship), design activities for students to learn material without being told (66% users, p <
0.001, slight relationship) and generally engage students with the material (84%, p < 0.001,
slight relationship).
Three additional statistically significant results were found for this RBIS. First, inquiry learning
users are more likely (54%) than nonusers (37%) to have students “report their group’s findings
to the entire class (formally or informally)” (p = 0.001). It is reasonable to consider this as a
potential adaptation of inquiry learning to investigate in future work.
Second, more inquiry learning users (86%) than nonusers (71%) have students “work on projects
inspired by problems or situations from real engineering practice” (p = 0.001). This is another
potential adaptation to consider that may be closely aligned to the practical and professional
nature of engineering (in contrast with other science education settings where inquiry learning
was first developed).
Third, inquiry learning users (65%) were more likely than nonusers (45%) to have their students
spent “time discussing pre-class activities which helped you re-evaluate student learning and

Borrego, Cutler, Prince, Henderson and Froyd Journal of Engineering Education
adjust your lecture ‘just in time’” (p < 0.001). This is yet another potential adaptation to explore
in future work, or it may be a correlation between inquiry learning and JiTT users.
Table 8: Inquiry Learning Required and Indicative Components
Student Activity Required/
Indicative
Faculty who
use RBIS (n
= 124) and
spent time on
activity
Faculty who
don't use RBIS
(n = 263), but
spent time on
activity
p-value Phi
Work on problems or projects
that require students to seek
out new information not
previously covered in class
Required 70% 51% < 0.001* 0.178
Complete specially designed
activities to 'learn' course
concepts on their own without
being explicitly told
Indicative 66% 42% < 0.001* 0.220
Participate in activities that
engage them with course
content through reflection
and/or interaction with their
peers (other than watching,
listening, and/or taking notes)
Indicative 84% 61% < 0.001* 0.231
* indicates significance with alpha = 0.01
Peer Instruction and Concept Tests
Peer instruction and concept tests (or “ConcepTests”) are closely related RBIS. In fact, many
STEM undergraduate education websites credit both to Eric Mazur. Consistent with the
literature, we mapped concept tests to the conceptual questions and peer instruction to the
activities of posing conceptual questions and having students discuss and report on their answers.
(These required components of peer instruction are indicative components for concept tests.)
The results presented in Tables 9 and 10 demonstrate many similarities in the responses related
to concept tests and peer instruction users, with slightly stronger evidence for the additional
required components for peer instruction. For both RBIS, multiple choice conceptual questions
were relatively high and statistically significant (71% of peer instruction users vs. 35% nonusers,
p < 0.001, slight relationship; 73% concept test users vs. 31% nonusers, p < 0.001, moderate
relationship). Discussing a problem in pairs or groups demonstrated high fidelity (92% of peer
instruction users and 81% of concept tests users) for both, but discriminated only between peer
instruction users and nonusers (p = 0.004). Clickers or similar means for students to report their
answers discriminated between peer instruction and concept tests users (p < 0.001 for both,
moderate relationship for peer instruction), but fidelity was not as high (61% peer instruction
users and 48% concept tests users). Requiring students to provide an answer before class can
proceed had high fidelity for both RBIS (92% of peer instruction users, 81% of concept test
users) but did not discriminate between users and nonusers. Reporting back to the class was
designated as an indicative activity for only peer instruction, with moderate fidelity (58% of

Borrego, Cutler, Prince, Henderson and Froyd Journal of Engineering Education
users) that nonetheless discriminated between users and nonusers (p = 0.006). Finally, engaging
students in course content demonstrated high fidelity (81% of peer instruction users and 76% of
concept test users) but did not discriminate. In summary, engineering science faculty report using
concept tests and peer instruction in similar ways, with perhaps some preference for clickers,
discussion and report-back in peer instruction, consistent with the literature. However, since peer
instruction had four required critical components and concept tests only one, the overall fidelity
of implementation of peer instruction (11%, Table 3) is much lower than concept tests (73%).
Beyond the critical components mapped to peer instruction, additional, unexpected statistically
significant relationships suggest that engineering faculty members are either adapting or
misinterpreting the label “peer instruction.” Specifically, there were differences for
having students “complete specially designed activities to ‘learn’ course concepts on their
own without being explicitly told” (69% peer instruction users vs. 47% nonusers, p =
0.001) and
having students “work on projects inspired by problems or situations from real
engineering practice” (94% users vs. 73% nonusers, Fisher’s Exact Test p < 0.001).
Based on the nature of these activities, namely their incompatibility with quick conceptual
questions discussed by students during a lecture, we consider the possibility that some
respondents are misinterpreting the term “peer instruction” to refer to tutoring or other group
work. We are currently analyzing transcripts of interviews with engineering science faculty
which suggest that one quarter to one third interpret peer instruction in this way, even when they
are discussing a handout with Mazur’s definition as part of the interview protocol. It is also
possible that further investigation would conclude that faculty members who use peer instruction
are also more likely to assign projects or inquiry learning experiences. Yet the fact that these
were not significant for concept tests reinforces that it is a phenomenon unique to peer
instruction, perhaps due to its potentially misleading name.

Borrego, Cutler, Prince, Henderson and Froyd Journal of Engineering Education
Table 9: Peer Instruction Required and Indicative Components
Student Activity Required/
Indicative
Faculty who
use RBIS (n =
62) and spent
time on activity
Faculty who
don't use
RBIS (n =
325), but
spent time
on activity
p-value Phi
Answer multiple-choice
conceptual questions with
distracters (incorrect
responses) that reflect
common student
misconceptions
Required 71% 35% < 0.001* 0.265
Discuss a problem in pairs or
groups Required 92% 76% 0.004* 0.145
Use clickers or similar means
to 'vote' on the correct answer
of a multiple choice question1
Required 61% 22% <0.001* 0.318
Provide answer(s) to a posed
problem or question before the
class can proceed Required 84% 77% 0.245 0.059
Report their group's findings
to the entire class (formally or
informally) Indicative 58% 23% 0.006* 0.141
Participate in activities that
engage them with course
content through reflection
and/or interaction with their
peers (other than watching,
listening and/or taking notes)
Indicative 81% 66% 0.022 0.117
* indicates significance with alpha = 0.01 1In statics survey, one critical component was separated into 2 items (uses clickers and uses other means)

Borrego, Cutler, Prince, Henderson and Froyd Journal of Engineering Education
Table 10: Concept Test Required and Indicative Components
Think-Pair-Share
The results for the individual critical components of think-pair-share (TPS), shown in Table 11,
demonstrate relatively high fidelity, even though the combined level of fidelity is 52% (Table 3).
TPS users report spending class time on discussing problems in pairs or groups (94%), reporting
the findings to the class (64%), and waiting for these answers before proceeding (82%).
Additionally, users report otherwise engaging students with course content (indicative, 86%).
Most of these discriminated between users and nonusers (p < 0.001), with the exception of
waiting for student answers to proceed with class. Again, this item was shared by several RBIS
and used by 78% of all respondents but not significant for any RBIS.
Four additional statistically significant relationships were found between think-pair-share use
and classroom activities. Each is related to the principles of think-pair-share and might be
considered either as a potential adaptation for future work, or as a close relationship between
TPS and other similar RBIS. First, more TPS users (63%) than nonusers (46%) have their
students “complete specially designed activities to ‘learn’ course concepts on their own without
being explicitly told” (p = 0.005). Second, 81% of TPS users and 67% of nonusers ask their
students to “work on problem sets or projects in pairs or small groups” (p < 0.001). Third, twice
Student Activity Required/
Indicative
Faculty who
use RBIS (n
= 95) and
spent time
on activity
Faculty who
don't use RBIS
(n = 292), but
spent time on
activity
p-value Phi
Answer multiple-choice
conceptual questions with
distracters (incorrect
responses) that reflect
common student
misconceptions
Required 73% 31% <0.001* 0.366
Discuss a problem in pairs or
groups Indicative 81% 77% 0.453 0.038
Use clickers or similar means
to 'vote' on the correct answer
of a multiple choice question1
Indicative 48% 22% < 0.001* 0.253
Provide answer(s) to a posed
problem or question before
the class can proceed Indicative 79% 78% 0.859 0.009
Participate in activities that
engage them with course
content through reflection
and/or interaction with their
peers (other than watching,
listening and/or taking notes)
Indicative 76% 66% 0.068 0.093
* indicates significance with alpha = 0.01 1 In statics survey, one critical component was separated into 2 items (uses clickers and uses other means)

Borrego, Cutler, Prince, Henderson and Froyd Journal of Engineering Education
as many TPS users (43%) as nonusers (24%) “use clickers or similar means to ‘vote’ on the
correct answer of multiple choice question” (p < 0.001). Fourth, 53% of TPS users and 37% of
nonusers ask their students to “answer multiple-choice conceptual questions with distracters
(incorrect responses) that reflect common student misconceptions” (p = 0.007).
Table 11: Think-Pair-Share Required and Indicative Components
Student Activity Required/
Indicative
Faculty who
use RBIS (n =
92) and spent
time on activity
Faculty who
don't use RBIS
(n = 295), but
spent time on
activity
p-value Phi
Discuss a problem in pairs or
groups Required 94% 65% < 0.001* 0.206
Report their group's findings
to the entire class (formally or
informally) Required 64% 35% < 0.001* 0.249
Provide the answer(s) to a
posed problem or question
before the class session can
proceed
Required 82% 77% 0.390 0.044
Participate in activities that
engage them with course
content through reflection
and/or interaction with their
peers (other than watching,
listening and/or taking notes)
Indicative 86% 63% < 0.001* 0.212
* indicates significance with alpha = 0.01
Problem-Based Learning
Although overall fidelity of implementation for problem-based learning (PBL) was moderate
(52%, Table 3), the fidelity of the individual required components was much higher, ranging
from 72-85% of users (Table 12). Three of four required activities discriminated between users
and nonusers (learning course concepts on own, working in groups and problems inspired by
engineering practice). Additionally, all three indicative components were statistically significant
(p < 0.001). The two indicative activities with the lowest fidelity (44% and 58%) are grading
schemes for group work that may be mutually exclusive for many faculty members (same or
different project grades for group members). Thus, a large percentage of PBL users also have
students participate in group work, but vary in how the group work is graded.

Borrego, Cutler, Prince, Henderson and Froyd Journal of Engineering Education
Table 12: Problem-Based Learning Required and Indicative Components
Student Activity Required/
Indicative
Faculty who use
RBIS (n = 124)
and spent time
on activity
Faculty who
don't use RBIS
(n = 263), but
spent time on
activity
p-value Phi
Complete specifically
designed activities to 'learn'
course concepts on their
own without being
explicitly told
Required 72% 42% < 0.001* 0.262
Work on problem sets or
projects in pairs or small
groups Required 78% 50% 0.001* 0.175
Work on projects inspired
by problems or situations
from real engineering
practice
Required 85% 73% 0.009* 0.133
Discuss a problem in pairs
or groups Required 84% 76% 0.076 0.090
Participate in group work
for which they earn the
same score as every other
member of the group
Indicative 58% 37% < 0.001* 0.187
Participate in group work
for which the assessments
are designed so that
individuals may earn
different scores for their
work on the assignment
Indicative 44% 23% < 0.001* 0.200
Participate in activities that
engage them with course
content through reflection
and/or interaction with
their peers (other than
watching, listening and/or
taking notes)
Indicative 84% 62% < 0.001* 0.210
* indicates significance with alpha = 0.01
Collaborative and Cooperative Learning
As demonstrated by similarities between Tables 13 and 14, collaborative learning and
cooperative learning share most of their critical components. For the purposes of this study, we
distinguished between the two by whether the same grade is earned by all students in the group
(collaborative learning) or if at least a portion of the grade is individual (cooperative learning).
(This distinction is not universally reflected in the literature.) Additionally, cooperative learning
includes reporting back to the class as an indicative component.

Borrego, Cutler, Prince, Henderson and Froyd Journal of Engineering Education
Overall, the results are very positive, with 60-96% of users spending time on required and
indicative components and statistically significant differences between users and nonusers (p <
0.001 for 9 of 10 tests, all with slight or moderate effect sizes). Again, waiting for students to
provide the answer before class can proceed was not statistically significant for any RBIS, but it
was practiced by 80-84% of collaborative and cooperative learning users.
However, the grading distinction between cooperative and collaborative learning was not
reflected in the results. Both collaborative and cooperative learning had statistically significant
relationships with both types of grading (same grade for all group members vs. different grades).
This can be explained in part because instructors who assign group work are more likely to
assign group grades than instructors who assign individual work. Yet more users of cooperative
learning assign group grades (66%) which we mapped to collaborative learning, than individual
grades (61%), which we mapped to cooperative learning. This distinction, as well as possible
overlaps in the data, should be explored further and reconsidered in future work.
Both RBIS were also found to have significant relationships with additional activities including:
working on problems inspired by real engineering practice (p < 0.001 for collaborative learning;
p < 0.001 using Fisher’s Exact Test for cooperative learning) and having students seek out new
information (p < 0.001 for collaborative learning; p < 0.001 for cooperative learning). Both of
these activities may help to characterize the types of group work assigned in engineering science
courses, that is, providing evidence that engineering group problems/projects are often based on
real engineering practice and require students to seek out new information.
Cooperative learning also presented an unexpected significant relationship with spending “time
discussing pre-class activities which helped you re-evaluate student learning and adjust your
lecture ‘just in time’” (p = 0.002). This activity was not significantly related to collaborative
learning. The relationship between cooperative learning and this activity may stem from having
students work cooperatively outside of class on an assignment, then individually turn in and
receive an individual grade for the assignment. This potential adaptation should be investigated
further in future work.

Borrego, Cutler, Prince, Henderson and Froyd Journal of Engineering Education
Table 13: Collaborative Learning Required and Indicative Components
Student Activity Required/
Indicative
Faculty who use
RBIS (n = 205)
and spent time on
activity
Faculty who
don't use RBIS
(n = 182), but
spent time on
activity
p-value Phi
Discuss a problem in pairs
or groups Required 91% 64% < 0.001* 0.320
Work on problem sets or
projects in pairs or small
groups Required 88% 53% < 0.001* 0.387
Participate in group work
for which they earn the
same score as every other
member of the group
Required 60% 24% < 0.001* 0.367
Complete specially
designed activities to 'learn'
course concepts on their
own without being
explicitly told
Indicative 60% 39% < 0.001* 0.210
Participate in activities that
engage them with course
content through reflection
and/or interaction with their
peers (other than watching,
listening and/or taking
notes)
Indicative 82% 53% < 0.001* 0.313
Provide the answer(s) to a
posed problem or question
before the class session can
proceed
Indicative 80% 77% 0.537 0.031
* indicates significance with alpha = 0.01

Borrego, Cutler, Prince, Henderson and Froyd Journal of Engineering Education
Table 14: Cooperative Learning Required and Indicative Components
Student Activity Required/
Indicative
Faculty who use
RBIS (n = 67)
and spent time
on activity
Faculty who
don't use RBIS
(n = 320), but
spent time on
activity
p-value Phi
Discuss a problem in pairs
or groups Required 96% 75% < 0.001*
1 0.191
Work on problem sets or
projects in pairs or small
groups Required 91% 67% < 0.001* 0.200
Participate in group work
for which the assessments
are designed so that
individuals may earn
different scores for their
work on the assignment
Required 61% 22% < 0.001* 0.329
Report their group's
findings to the entire class
(formally or informally) Indicative 79% 34% < 0.001* 0.343
Complete specifically
designed activities to 'learn'
course concepts on their
own without being
explicitly told
Indicative 76% 45% < 0.001* 0.238
Participate in activities that
engage them with course
content through reflection
and/or interaction with their
peers (other than watching,
listening and/or taking
notes)
Indicative 82% 65% 0.007* 0.136
Provide the answer(s) to a
posed question before the
class session can proceed Indicative 84% 77% 0.537 0.059
1 Fisher’s Exact Test used due to less than n=5 in one cell
* indicates significance with alpha = 0.01
Discussion and Future Work
This study used a faculty survey to explore fidelity of implementation of 11 RBIS in engineering
science courses. Fidelity was quantified as the percentage of RBIS users who also spent class
time on the required critical components. As indicated by the results in Table 3 and Figure 1,
overall fidelity is strongly influenced by the number of components. Four of five RBIS with one
required critical component earned overall fidelity scores of 70% or higher (case-based teaching,
just-in-time teaching, concept tests and inquiry learning). In contrast, many other RBIS with 3-4
required components scored 50-60% fidelity of implementation (cooperative learning,
collaborative learning, problem-based learning and think-pair-share). However, many of the

Borrego, Cutler, Prince, Henderson and Froyd Journal of Engineering Education
individual required components demonstrated much higher fidelity, above 70% and as high as
96%. Service learning demonstrated the lowest fidelity (50% of users spent time on the one
critical component).
There is precious little prior work on which to base judgment of whether these values are
favorable. For the purposes of discussion, we used arbitrary qualifiers “relatively high” for
values of 70-100%, “moderate” for 50-69% and “low” for values below 50%. Examples from the
mental health literature suggest that these are not particularly strong, and self-reporting and
response bias by enthusiastic instructors are both likely to overestimate RBIS use and time spent
on various activities. This study is an important first step, but clearly more work is needed to
identify benchmarks for fidelity of implementation in undergraduate education. We collected
more detailed information on the percentage of class time spent on each activity that could be
explored in future work. Depending on the RBIS, the amount of time spent on each activity will
vary. For example, with think-pair-share a limited percentage of the overall class time should be
spent utilizing the RBIS, but within that time students should discuss a problem in pairs and
share their discussion with the overall class. This data (and similar future work) could contribute
to understanding optimal times spent on various RBIS, as well as improve discrimination
between RBIS users and nonusers.
Most fidelity studies only examine users, but this study design allowed for comparison of RBIS
users and nonusers. An additional level of analysis included Chi Square and Fisher’s exact tests
to determine whether each critical component could discriminate between users and nonusers.
Due to the exploratory nature of this analysis and the high number of statistical tests run, a
conservative value of alpha (0.01) was selected and effect size was reported. Effect size scaled
with significance, indicating moderate relationships between variables at best, and suggesting
that an even more conservative alpha would have been appropriate (e.g., 0.001) to focus on
relationships with practical significance.
Table 15 summarizes the results of the statistical tests presented in Tables 4-14. A discrimination
score was calculated for each critical component by dividing the number of significant
relationships (based on alpha of 0.01) by the total number of RBIS for which it was a required or
indicative component. Five classroom activities discriminated between users and nonusers for
every RBIS to which they were mapped, as well as at least one additional RBIS:
Problems or projects that require students to seek out new information
Group work on problem sets or projects
Report back following group work
Group grades for group work
Use of clickers or similar means
It is interesting to note that although most of these are general strategies that are shared by many
RBIS (particularly working in groups or pairs), they nonetheless had high discriminatory power.
For this reason, these activities may be particularly important for future surveys, observations
and other measures of RBIS use. Nine of the remaining 11 also discriminated for every RBIS to
which they were designated as a required component. Only two were unable to discriminate for
any RBIS (provide answer to a posed problem before class can proceed and explain reasoning to

Borrego, Cutler, Prince, Henderson and Froyd Journal of Engineering Education
another student while working on a specific problem). Of these two, providing the answer to a
problem before class proceeds was employed by 78% of all respondents, while only 53% of all
respondents had students describe their reasoning to each other during class time. We might
conclude that the lack of discrimination for the component of providing the answer to a problem
is low because it is in such common use and shared by many RBIS. On the other hand, students
describing their reasoning to each other may be non-discriminating because it (and its
corresponding RBIS, TAPP) is not used widely in engineering. These items which did not
discriminate well should be considered for revision before similar studies are administered in the
future.
In their study of fidelity of community mental health care programs, Macias and coworkers also
used significance tests to discriminate between certified and non-certified programs (2001). They
found that 33 of 42 components effectively discriminated between certified and non-certified
programs. Most of their items that did not discriminate were practiced by less than 50% of
certified and non-certified sites (Macias et al., 2001). Although the overall fidelity values
(percentages) achieved in this study of engineering science faculty were much lower than this
example, our discrimination results were comparable if not significantly stronger (13 of 16 =
81% vs. 33 of 42 = 78%).
In addition to the procedures described in Methods, critical components can be validated by
comparing the expected and actual results. Overall, we can say that the survey results reflect a
pattern that is consistent with the critical components we identified. It would be inappropriate to
conclude that RBIS are being used in engineering science courses as intended by the original
developers. Yet the engineering faculty members who responded to this survey are
knowledgeable about these RBIS, and their knowledge is consistent with what we have identified
from the literature.
The final column of Table 15 also lists the unexpected statistically significant relationships
between RBIS and classroom activities, the details of which are presented in the corresponding
Results text (for each RBIS). In each case we offered some interpretation of whether these were
reasonable adaptations of the RBIS as applied in engineering sciences, a potential correlation
between various activities and RBIS, or, in the case of peer instruction, an alternative
interpretation to the developer’s original intention. These are of course merely conjecture, and
complementary approaches such as interviews and observations should be used to explore these
further.
More generally, future work should continue to explore many of the measurement issues
identified in this study. The limitations of faculty surveys can be better understood and addressed
using qualitative methods such as classroom observations. It is unlikely that surveys will be
abandoned altogether, despite the limitations identified in the DBER report (National Research
Council, 2012), because of the large volume of quantitative data they generate with relatively
little effort and the increasing focus on scaling up effective teaching practices.

Borrego, Cutler, Prince, Henderson and Froyd Journal of Engineering Education
Table 15: Summary of Chi Square Discrimination Test Results.
Student Activity (Critical Component)
# R
BIS
Req
uir
ed
# S
ign
ific
ant
# R
BIS
In
dic
ativ
e
# S
ign
ific
ant
Dis
crim
inat
ion
Unexpected significant
relationships
Work on problems or projects that require students
to seek out new information not previously covered
in class
1 1 0 0 100% Collaborative learning,
Cooperative learning
Report their group’s findings to the entire class
(formally or informally) 1 1 3 3 100% Inquiry learning
Work on problem sets or projects in pairs or small
groups 3 3 1 1 100% Think-pair-share
Participate in group work for which they earn the
same score as every other member of the group 1 1 2 2 100% Cooperative learning
Use clickers or similar means to ‘vote’ on the
correct answer of a multiple choice question 1 1 2 2 100% Think-pair-share
Complete specially designed activities to ‘learn’
course concepts on their own without being
explicitly told
1 1 5 4 83% Peer instruction, Think-pair-
share
Participate in group work for which the assessments
are designed so that individuals may earn different
scores for their work on the assignment
1 1 2 1 67%
Just-in-time teaching, Case-
based teaching, Collaborative
learning
Answer multiple-choice conceptual questions with
distracters (incorrect responses) that reflect common
student misconceptions
2 2 1 0 67% Think-pair-share
Discuss a problem in pairs or groups 6 4 3 1 56% None
Spent time discussing pre-class activities which
helped you re-evaluate student learning and adjust
your lecture ‘just in time’
1 1 1 0 50%
Think-aloud paired problem
solving, Inquiry learning,
Cooperative learning
Participate in activities that engage them with course
content through reflection and/or interaction with
their peers (other than watching, listening and/or
taking notes)
1 1 11 5 50% None
Work on a project with a real, not-for-profit client in
the university or local community 1 1 1 0 50% None
Analyze case studies of historical or hypothetical
situations that involve solving problems or making
decisions
1 1 1 0 50% None
Work on projects inspired by problems or situations
from real engineering practice 1 1 2 0 33%
Inquiry learning, Peer
instruction, Cooperative
learning, Collaborative
learning
Provide the answer(s) to a posed problem or
question before the class session can proceed 2 0 4 0 0% None
Explain their reasoning to another student while
solving a specific problem 1 0 1 0 0% None

Borrego, Cutler, Prince, Henderson and Froyd Journal of Engineering Education
Conclusion
Based on these results, we can conclude that fidelity of implementation is a useful framework for
continued study of undergraduate STEM instruction. A rich literature in K-12 education, social
work, counseling psychology and medicine provides guidance on identifying and validating
critical components and measuring fidelity, using quantitative, qualitative and mixed methods.
Fidelity of implementation literature acknowledges the balance between adaptation and faithful
replication (and communicates this through critical components and accompanying
documentation), as well as the need to revisit configurations to reflect changes over time.
Although this paper focused on research, the lessons are important to those who develop and use
RBIS and encourage other STEM faculty members to use them. Specifically, developers should
consider following the steps laid out by Hall and Loucks (1978) for developing a full innovation
configuration to completely describe their instructional strategy. Communication should include
not only evidence of efficacy but also details related to implementation and the underlying
educational research principles (to discourage inappropriate adaptation that would sacrifice the
documented benefits). Potential users should seek out this type of information to make informed
decisions and adaptations. User communities can help in distributing this information, which
doesn’t need to be hosted or generated by the original developer. Following these principles
guided by a fidelity of implementation perspective can help advance the agenda of improved
engineering and STEM education for a broader group of students.
Acknowledgements
This research was supported by the U.S. National Science Foundation through grants 1037671
and 1037724, and while M. Borrego was working for the Foundation. Any opinions, findings,
and conclusions or recommendations expressed in this material are those of the authors and do
not necessarily reflect the views of the National Science Foundation. The authors wish to thank
Virginia Tech Center for Survey Research, Anna Dollár, Susan Lord, Paul Steif, and Margot
Vigeant the for their partnership and assistance on this project.

Borrego, Cutler, Prince, Henderson and Froyd Journal of Engineering Education
References
American Society for Engineering Education (ASEE). (2009). Creating a Culture for Scholarly
and Systematic Innovation in Engineering Education: Ensuring U.S. engineering has the
right people with the right talent for a global society. Washington, DC: American Society
for Engineering Education.
Anderson, Stephen A. (1997). Understanding Teacher Change: Revisiting the Concerns Based
Adoption Model. Curriculum Inquiry, 27(3), 331-367.
ASEE. (2012). Innovation with Impact. Washington, DC: American Society for Engineering
Education.
Association of American Universities (AAU), (2011). (2011). Undergraduate STEM Initiative.
from http://www.aau.edu/policy/article.aspx?id=12588
Barkley, Elizabeth F., Cross, K. Patricia, & Major, Claire Howell. (2005). Collaborative
Learning Techniques: A Handbook for College Faculty. San Francisco: Jossey-Bass.
Bay View Alliance. (N.D.). Retrieved 26 November 2012, from http://bayviewalliance.org/
Bickman, Leonard, Manuel, Riemer, Brown, Joshua L., Jones, Stephanie M., Flay, Brian R., Li,
Kin-Kit, . . . Massetti, Greta. (2009). Approaches to Measuring Implementation Fidelity
in School-Based Program Evaluations. Journal of research on character education, 7(2),
75.
Blakely, Craig H, Payer, Jeffrey P, Gottschalk, Rand G, Schmitt, Neal, Davidson, William S,
Roitman, David B, & Emshoff, James G. (1987 ). The fidelity-adaptation debate:
Implications for the implementation of public sectos social programs. American Journal
of Community Psychology, 15(3), 253-268.
Blakey, Craig H. (1987). The Fidelity-Adaptation Debate: Implications for the Implementation
of Public Sector Social Programs. American Journal of Community Psychology, 15(3),
253-268. doi: 10.1007/bf00922697
Borrego, Maura, Froyd, Jeffrey E., & Hall, T. Simin. (2010). Diffusion of engineering education
innovations: A survey of awareness and adoption rates in U.S. engineering departments
Journal of Engineering Education, 99(3), 185-207.
Business-Higher Education Forum. (N.D.). Retrieved 26 November 2012, from
http://www.bhef.com/
Byerley, Aaron. (2001). Using Multimedia and "Active Learning" Techniques to "Energize" an
Introductory Engineering Thermodynamics Class. Paper presented at the 31st
ASEE/IEEE Frontiers in Education Conference, Reno, NV.
Carroll, Christopher, Patterson, Malcolm, Wood, Stephen, Booth, Andrew, Rick, Jo, & Balain,
Shashi. (2007). A conceptual framework for implementation fidelity. Implementation
science : IS, 2(1), 40-40. doi: 10.1186/1748-5908-2-40
Cashman, Eileen, & Eschenbach, Elizabeth. (2003). Active Learning with Wed Technology - Just
in Time! Paper presented at the 33rd ASEE/IEEE Frontiers in Education Conference,
Boulder, CO.
Century, Jeanne, Rudnick, Mollie, & Freeman, Cassie. (2010). A Framework for Measuring
Fidelity of Implementation: A Foundation for Shared Language and Accumulation of
Knowledge. American Journal of Evaluation, 31(2), 199 - 218.
Coller, B. D. . (2008). An Experiment in Hands-On Learning in Engineering Mechanics: Statics.
International Journal of Engineering Education, 24(3), 545-557.

Borrego, Cutler, Prince, Henderson and Froyd Journal of Engineering Education
Committee on Science Engineering and Public Policy. (2006). Rising above the gathering storm:
Energizing and employing America for a brighter economic future. Washington, D.C.:
National Academies Press.
Committee on Science Engineering and Public Policy. (2010). Rising Above the Gathering
Storm, Revisited: Rapidly Approaching Category 5. Washington, DC: National
Academies Press.
Crouch, C.H., & Mazur, Eric. (2001). Peer Instruction: Ten years of experience and results. American
Journal of Physics, 69(9), 970-977.
Dinan, F. (2002). Chemistry by the case. Journal of College Science Teaching, 32(1), 36-41.
Dochy, F., M., Segers, Van den Bossche, P., & Gijbels, D. . (2003). Effects of problem-based
learning: A meta-analysis. Learning and Instruction, 13, 533-568.
Duffy, Hohn, Barry, Carol, Barrington, Linda, & Heredia, Manuel. (2009). Service-learning in
engineering science courses: Does it work? Paper presented at the ASEE Annual
Conference & Exposition, Austin, TX.
Dukhan, N., Schumak, M. R. , & Daniels, J. J. . (2009). Service learning as pedogogy for
promoting social awareness of mechanical engineering students. International Journal of
Mechanical Engineering Education, 37(1), 78-86.
Emshoff, James G., Blakely, Craig, Gottschalk, Rand, Mayer, Jeffrey, Davidson, William S., &
Erickson, Stephen. (1987). Innovation in Education and Criminal Justice: Measuring
Fidelity of Implementation and Program Effectiveness. Educational Evaluation and
Policy Analysis, 9(4), 300-311.
Etter, Jean-François, & Perneger, Thomas V. (1997). Analysis of non-response bias in a mailed
health survey. Journal of Clinical Epidemiology, 50(10), 1123-1128. doi: 10.1016/S0895-
4356(97)00166-2
Fasko, D. (2003). Case studies and method in teaching and learning. Paper presented at the Annual
Meeting of the Society of Educators and Scholars, Louisville, KY.
Felder, Richard M., & Brent, Rebecca. (2009). Active Learning: An Introduction. ASQ Higher
Education Brief, 2(4).
Ferber, Robert. (Winter, 1948-1949). The Problem of Bias in Mail Returns: A Solution. Public
Opinion Quarterly, 12(4), 669-676.
Froyd, Jeffrey E. (2005). The Engineering Education Coalitions Program. In National Academy
of Engineering (Ed.), Educating the Engineer of 2020: Adapting Engineering Education
to the New Century. Washington, D.C.: National Academies Press.
Froyd, Jeffrey E., Borrego, Maura, Cutler, Stephanie, Henderson, Charles, & Prince, Michael. (in
press). Estimates of use of research-based instructional strategies in core electrical or
computer engineering courses. IEEE Transactions on Education.
Gabel, C. (1999). Using case studies to teach science. Paper presented at the Annual Meeting of the
National Association for Research in Science Teaching, Boston, MA.
Groves, Robert M. (2006). Nonresponse Rates and Nonresponse Bias in Household Surveys.
Public Opinion Quarterly, 70(5), 646-675. doi: 10.1093/poq/nfl033
Hake, R. R. . (1998). Interactive-Engagement vs. Traditional Methods: A Six-Thousand-Student
Survey of Mechanics Test Data for Introductory Physics Courses. American Journal of
Physics, 66(1), 64-74.
Hall, Gene E., & Loucks, Susan F. (1978). Innovation Configurations: Analyzing the
Adaptations of Innovations: Texas University, Austin Research Development Center for
Teacher Education.
Borrego, Cutler, Prince, Henderson and Froyd Journal of Engineering Education
Henderson, Charles, & Dancy, Melissa H. (2009). The impact of physics education research on
the teaching of introductory quantitative physics in the United States. Physical Review
Special Topics: Physics Education Research, 5(2), 020107.
Henderson, Charles, Dancy, Melissa H., & Niewiadomska-Bugaj, Magdalena. (2012). The use of
Research-Based Instructional Strategies in introductory physics: Where do faculty leave
the innovation-decision process? Physical Review Special Topics - Physics Education
Research, 8(2), 020104.
Hsiung, Chin-min. (2012). The Effectiveness of Cooperative Learning. Journal of Engineering
Education, 101(1), 119-137.
Jiusto, Scott, & DiBiasio, David. (2006). Experiential learning environments: Do they prepare
our students to be self-directed, life-long learners? Journal of Engineering Education,
95(3), 195-204.
Johnson, D. W., Johnson, R. T., & Smith, K. A. (1998a). Active Learning: Cooperation in the College
Classroom (2nd ed.). Edina, MN: Interaction Book Co.
Johnson, D. W., Johnson, R. T., & Smith, K. A. (1998b). Cooperative learning returns to college:
What evidence is there that it works? Change, 30(4), 26-35.
Kolb, D A. (1984). Experiential Learning: Experience as the Source of Learning and Development.
Englewood Cliffs, NJ: Prentice-Hall.
Koretsky, Milo, & Brooks, Bill. (2011). Comparison of Student Responses to Easy and DIfficult
Thermodynamics Conceptual Questions during Peer Instruction. International Journal of
Engineering Education, 27(4), 897-908.
Levin, B. (1997). The influence of context in case-based teaching: Personal dilemmas, moral issues or
real change in teachers’ thinking? Paper presented at the American Educational Research
Association, Chicago, IL.
Lochhead, J., & Whimbey, A. (1987). Teaching analytical reasoning through thinking aloud pair
problem solving. In J. E. Stice (Ed.), Developing Critical Thinking and Problem-Solving
Abilities (Vol. 30, pp. 73-92). San Francisco: Jossey-Bass.
Lundeberg, M.A., Levin, B., & Harrington, H. (1999). Who Learns What from Cases and How?
The Research Base for Teaching and Learning with Cases. Mahwah, NJ: Lawrence
Erlbaum Associates, Inc.
Lundeberg, M.A., & Yadav, A. (2006a). Assessment of case study teaching: Where do we go
from here? Part 1. Journal of College Science Teaching, 35(5), 10-13.
Lundeberg, M.A., & Yadav, A. (2006b). Assessment of case study teaching: Where do we go
from here? Part 2. Journal of College Science Teaching, 35(6), 8-13.
Macdonald, R. Heather, Manduca, Cathryn A., Mogk, David W., & Tewksbury, Barbara J.
(2005). Teaching methods in undergraduate geoscience courses: Results of the 2004 On
the Cutting Edge survey of U.S. faculty. Journal of Geoscience Education, 53(3), 237-
252.
Macias, Cathaleene, Propst, Rudyard, Rodican, Charles, & Boyd, Jeremy. (2001). Strategic
planning for ICCD clubhouse implementation: Development of the Clubhouse Research
and Evaluation Screening Survey (CRESS). Mental Health Services Research, 3(3), 155-
167.
Mazur, Eric. (1997). Peer Instruction: A User’s Manual. Englewood Cliffs, NJ: Prentice-Hall.
Mazur, Eric. (2009). Peer instruction: An overview. Retrieved February 15, 2010, from http://www.turning-talk.com/mazur/article-intro-jun09
McNamee, Lissa, Roberts, Tim, & Williams, Sallyanne. (N.D.). Online Collaborative Learning in
Higher Education. Retrieved December 3, 2003 from http://clp.cqu.edu.au/glossary.htm

Borrego, Cutler, Prince, Henderson and Froyd Journal of Engineering Education
Millis, B., & Cottell, P., Jr.,. (1998). Cooperative Learning for Higher Education Faculty:
American Council on Education, ORYX Press.
Mills, Steven C, & Ragan, Tillman J. (2000). A tool for analyzing implementation fidelity of an
integrated learning system. Educational Technology Research & Development, 48(4), 21-
41.
Modesitt, K.L., Maxim, B., & Akingbehin, K. (1999). Just-in-time learning in software engineering.
Journal of Computers in Mathematics and Science Teaching, 18(3), 287-301.
Morgan, George, Leech, Nancy, Gloeckner, Gene, & Barrett, Karen. (2011). IBM SPSS for
Introductory Statistics (4 ed.). New York: Taylor & Francis Group.
Mowbray, Carol T., Holter, Mark C., Teague, Gregory B., & Bybee, Deborah. (2003). Fidelity
Criteria: Development, Measurement, and Validation. American Journal of Evaluation,
24(3), 315-341. doi: 10.1177/109821400302400303
National Research Council. (2012). Discipline-Based Educational Research: Understanding and
Improving Learning in Undergraduate Science and Engineering. Washington, DC:
National Academies Press.
National Science Board. (2010). Preparing the Next Generation of STEM Innovators: Identifying
and Developing our Nation's Human Capital. Arlington, VA: National Science
Foundation.
Newson, Timothy, & Delatte, Norbert. (2011). Case methods in civil engineering teaching.
Canadian Journal of Civil Engineering, 38, 1016-1030.
Novak, G.M., Patterson, E.T., Gavrin, A.D., & Christian, W. (1999). Just-in-Time Teaching: Blending
Active Learning with Web Technology. Upper Saddle River, N.J.: Prentice-Hall.
O'Donnell, Carol L. (2008). Defining, conceptualizing, and measuring fidelity of implementation
and its relationship to outcomes in K-12 curriculum intervention research. Review of
Educational Research, 78(1), 33-84. doi: 10.3102/0034654307313793
Oakes, W.C. (2009). Creative effective and efficient learning experiences while addressing the needs of
the poor: An overview of service-learning in engineering education. Paper presented at the
American Society for Engineering Education Annual Conference, Austin, TX.
Pedhazur, E. J., & Schmelkin, L. P. (1991). Measurements, Design, and Analysis: An Integrated
Approach. Hillsdale, NJ: Lawrence Erlbaum Associates.
Pilzer, S. (2001). Peer Instruction in Mathematics. PRIMUS, 11(1), 185.
President’s Council of Advisors on Science and Technology. (2012). Engage to excel: Producing
one million additional college graduates with degrees in science, technology,
engineering, and mathematics. Washington, DC.
Prince, Michael. (2004). Does active learning work? A review of the research. Journal of
Engineering Education, 93(3), 223-231.
Prince, Michael, Borrego, Maura, Henderson, Charles, Cutler, Stephanie, & Froyd, Jeff. (in
press). Use of research-based instructional strategies in core chemical engineering
courses. Chemical Engineering Education.
Prince, Michael, & Felder, Richard. (2006). Inductive teaching and learning methods:
Definitions, comparisons, and research bases. Journal of Engineering Education, 95(2).
Prince, Michael, & Felder, Richard. (2007). The many faces of inductive teaching and learning. Journal
of College
Science Teaching, 36(5).
Reeves, Thomas, & Laffey, James. (1999). Design, Assessment, and Evaluation of a Problem-
based Learning Environment in Undergraduate Engineering. Higher Education Research
& Development, 18(2), 219-232.
Borrego, Cutler, Prince, Henderson and Froyd Journal of Engineering Education
Rogers, E.M. (2003). Diffusion of Innovations. New York: The Free Press.
Rozycki, W. (1999). Just-in-Time Teaching. Research & Creative Activity, XXII(1). http://www.indiana.edu/~rcapub/v22n1/p08.html
Rubin, S. (1996). Evaluation and Meta-Analysis of Selected Research Related to the Laboratory
Component of Beginning College Level Science. (Ph.D.), Temple University.
Santi, Paul. (2007). Have They Got It Yet? Assessing student understanding of difficult concepts.
Paper presented at the ASEE Annual Conference and Exposition, Honolulu, HI.
Shooter, Steven, & McNeill, Mark. (2002). Interdisciplinary Collaborative Learning in
Mechatronics at Bucknell University. Journal of Engineering Education, 91(3), 339-344.
Shymansky, J., Hedges, L., & Woodworth, G. (1990). A reassessment of the effects of inquiry-based
science curricula of the 60’s on student performance. Journal of Research in Science
Teaching, 27(2), 127-144.
Smith, D. (1996). A meta-analysis of student outcomes attributable to the teaching of science as
inquiry as compared to traditional methodology. (PhD dissertation), Temple University.
Springer, L., Stanne, M. E., & Donovan, S. S. . (1999). Effects of Small-Group Learning on
Undergraduates in Science, Mathematics, Engineering, and Technology: A Meta-
Analysis. Review of Educational Research, 69(1), 21-51.
Springer, L., Stanne, M.E., & Donovan, S. (1997). Effects of Small-Group Learning on
Undergraduates in Science, Mathematics, Engineering, and Technology: A Meta-
Analysis. Madison, WI: National Institute for Science Education.
Sudman, Seymour. (1985). Mail surveys of reluctant professionals. Evaluation Review, 9(3),
349-360. doi: 10.1177/0193841X8500900306
U.S. Department of Education. (2007). Report of the Academic Competitiveness Council.
Washington, D.C.
What Works Clearinghouse. (2011). Procedures and Standards Handbook. Washington, DC:
U.S. Department of Education Institute of Education Sciences.