boris documentation
TRANSCRIPT

BORIS DocumentationRelease latest
Jan 19, 2018

Contents
1 Follow BORIS 3
2 Legal 5
3 Install BORIS 73.1 Linux . . . . . . . . . . . . . . . . . . . . . . . . . . . . . . . . . . . . . . . . . . . . . . . . . . . 73.2 Microsoft-Windows . . . . . . . . . . . . . . . . . . . . . . . . . . . . . . . . . . . . . . . . . . . 73.3 Mac OS . . . . . . . . . . . . . . . . . . . . . . . . . . . . . . . . . . . . . . . . . . . . . . . . . . 83.4 VirtualBox virtual appliance . . . . . . . . . . . . . . . . . . . . . . . . . . . . . . . . . . . . . . . 8
4 Launch BORIS 9
5 Create a new project with BORIS 115.1 Set an ethogram . . . . . . . . . . . . . . . . . . . . . . . . . . . . . . . . . . . . . . . . . . . . . 125.2 Define the subjects . . . . . . . . . . . . . . . . . . . . . . . . . . . . . . . . . . . . . . . . . . . . 235.3 Define the Independent variables . . . . . . . . . . . . . . . . . . . . . . . . . . . . . . . . . . . . 245.4 Observations’ tab . . . . . . . . . . . . . . . . . . . . . . . . . . . . . . . . . . . . . . . . . . . . . 255.5 Converters’ tab . . . . . . . . . . . . . . . . . . . . . . . . . . . . . . . . . . . . . . . . . . . . . . 25
6 Open an existing project with BORIS 29
7 Observations 317.1 Create a new observation . . . . . . . . . . . . . . . . . . . . . . . . . . . . . . . . . . . . . . . . . 317.2 Observations list . . . . . . . . . . . . . . . . . . . . . . . . . . . . . . . . . . . . . . . . . . . . . 387.3 Delete observations . . . . . . . . . . . . . . . . . . . . . . . . . . . . . . . . . . . . . . . . . . . . 437.4 Import observations from a project file . . . . . . . . . . . . . . . . . . . . . . . . . . . . . . . . . 43
8 Coding your media 458.1 Media controls are available in the toolbar . . . . . . . . . . . . . . . . . . . . . . . . . . . . . . . . 458.2 Ethogram widget in the main window . . . . . . . . . . . . . . . . . . . . . . . . . . . . . . . . . 468.3 Subjects widget in the main window . . . . . . . . . . . . . . . . . . . . . . . . . . . . . . . . . . 468.4 Media player widget in the main window . . . . . . . . . . . . . . . . . . . . . . . . . . . . . . . . 498.5 Events widget in the main window . . . . . . . . . . . . . . . . . . . . . . . . . . . . . . . . . . . 508.6 Record an event . . . . . . . . . . . . . . . . . . . . . . . . . . . . . . . . . . . . . . . . . . . . . 508.7 Frame-by-frame mode . . . . . . . . . . . . . . . . . . . . . . . . . . . . . . . . . . . . . . . . . . 52
9 Exporting events data 539.1 Export events . . . . . . . . . . . . . . . . . . . . . . . . . . . . . . . . . . . . . . . . . . . . . . . 53
i
9.2 Export aggregated events . . . . . . . . . . . . . . . . . . . . . . . . . . . . . . . . . . . . . . . . . 539.3 Export events as behavioral strings . . . . . . . . . . . . . . . . . . . . . . . . . . . . . . . . . . . 549.4 Export events as Praat TextGrid . . . . . . . . . . . . . . . . . . . . . . . . . . . . . . . . . . . . . 549.5 Extract sequences from media files . . . . . . . . . . . . . . . . . . . . . . . . . . . . . . . . . . . 559.6 Export transitions matrix . . . . . . . . . . . . . . . . . . . . . . . . . . . . . . . . . . . . . . . . . 55
10 Playback menu 5710.1 Jump . . . . . . . . . . . . . . . . . . . . . . . . . . . . . . . . . . . . . . . . . . . . . . . . . . . 5710.2 Zoom . . . . . . . . . . . . . . . . . . . . . . . . . . . . . . . . . . . . . . . . . . . . . . . . . . . 57
11 Tools 5911.1 Geometric measurements . . . . . . . . . . . . . . . . . . . . . . . . . . . . . . . . . . . . . . . . 5911.2 Coding pad . . . . . . . . . . . . . . . . . . . . . . . . . . . . . . . . . . . . . . . . . . . . . . . . 6111.3 Converters for external data values . . . . . . . . . . . . . . . . . . . . . . . . . . . . . . . . . . . 6111.4 Transitions flow diagram . . . . . . . . . . . . . . . . . . . . . . . . . . . . . . . . . . . . . . . . . 6211.5 Re-encoding and resizing a video file . . . . . . . . . . . . . . . . . . . . . . . . . . . . . . . . . . 6411.6 Project server . . . . . . . . . . . . . . . . . . . . . . . . . . . . . . . . . . . . . . . . . . . . . . . 64
12 Coding map 6512.1 The Behaviors coding map . . . . . . . . . . . . . . . . . . . . . . . . . . . . . . . . . . . . . . . . 6512.2 The Modifiers coding map . . . . . . . . . . . . . . . . . . . . . . . . . . . . . . . . . . . . . . . . 69
13 Analysis 7313.1 Time budget . . . . . . . . . . . . . . . . . . . . . . . . . . . . . . . . . . . . . . . . . . . . . . . 7313.2 Synthetic time budget . . . . . . . . . . . . . . . . . . . . . . . . . . . . . . . . . . . . . . . . . . 7513.3 Plot events . . . . . . . . . . . . . . . . . . . . . . . . . . . . . . . . . . . . . . . . . . . . . . . . 7613.4 Inter-rater reliability . . . . . . . . . . . . . . . . . . . . . . . . . . . . . . . . . . . . . . . . . . . 78
14 Preferences 7914.1 General preferences . . . . . . . . . . . . . . . . . . . . . . . . . . . . . . . . . . . . . . . . . . . 7914.2 FFmpeg framework . . . . . . . . . . . . . . . . . . . . . . . . . . . . . . . . . . . . . . . . . . . 8014.3 Frame-by-frame mode . . . . . . . . . . . . . . . . . . . . . . . . . . . . . . . . . . . . . . . . . . 8114.4 Spectrogram . . . . . . . . . . . . . . . . . . . . . . . . . . . . . . . . . . . . . . . . . . . . . . . 8214.5 Plot colors . . . . . . . . . . . . . . . . . . . . . . . . . . . . . . . . . . . . . . . . . . . . . . . . 82
15 Various 8515.1 Citing BORIS . . . . . . . . . . . . . . . . . . . . . . . . . . . . . . . . . . . . . . . . . . . . . . 8515.2 Bug reports and features request . . . . . . . . . . . . . . . . . . . . . . . . . . . . . . . . . . . . . 8515.3 Docking . . . . . . . . . . . . . . . . . . . . . . . . . . . . . . . . . . . . . . . . . . . . . . . . . 85
16 Acknowledgement 8716.1 Valid keys for triggering behavior . . . . . . . . . . . . . . . . . . . . . . . . . . . . . . . . . . . . 87
ii
BORIS Documentation, Release latest
BORIS is an easy-to-use event logging software for video/audio coding and live observations. BORIS is a freeand open-source software available for GNU/Linux, Windows and Mac OS X.
version 6.0.1 PRE-RELEASE
www.boris.unito.it
Contents
• Behavioral Observation Research Interactive Software (BORIS) user guide
– Follow BORIS
– Legal
– Install BORIS
– Launch BORIS
– Create a new project with BORIS
– Open an existing project with BORIS
– Observations
– Coding your media
– Exporting events data
– Playback menu
– Tools
– Coding map
– Analysis
– Preferences
– Various
– Acknowledgement
Contents 1

BORIS Documentation, Release latest
2 Contents
CHAPTER 1
Follow BORIS
BORIS web site: www.boris.unito.it
BORIS GitHub repository
BORIS twitter feed
BORIS discussion group
BORIS Facebook page
BORIS Google+
3

BORIS Documentation, Release latest
4 Chapter 1. Follow BORIS
CHAPTER 2
Legal
Copyright 2012-2018 Olivier Friard - Marco Gamba
BORIS is free software; you can redistribute it and/or modify it under the terms of the GNU General Public Licenseas published by the Free Software Foundation; either version 2, or any later version.
BORIS is distributed in the hope that it will be useful, but WITHOUT ANY WARRANTY; without even the impliedwarranty of MERCHANTABILITY or FITNESS FOR A PARTICULAR PURPOSE. See the GNU General PublicLicense for more details.
5

BORIS Documentation, Release latest
6 Chapter 2. Legal
CHAPTER 3
Install BORIS
BORIS can be installed following instructions on the BORIS site at download page
3.1 Linux
BORIS is available as a DEB package for DEB based distributions based (like Debian and Ubuntu). After installationyou will find BORIS in the Education sub-menu.
You can also run BORIS from sources. See the download page for details about the dependencies to install.
3.2 Microsoft-Windows
BORIS is available for Windows in 32-bit and 64-bit versions. Check your OS before downloading.
Two versions are available: BORIS Setup and BORIS Portable
The BORIS Setup will install BORIS on your system (the default install path is located in your home directory, youdo not need administration rights to install BORIS).
The BORIS Portable will NOT install BORIS on your system but will run from a directory (find and launch boris.exe).Use this version if you want to test a new version of BORIS for example.
3.2.1 BORIS debugging version
Use this version if you want to report bug. In this case you should include screenshots or copy of the terminal output.This version will NOT install BORIS in your system.
7
BORIS Documentation, Release latest
3.3 Mac OS
BORIS is available for Mac OS only in 64-bit version (from >= 10.8)
3.4 VirtualBox virtual appliance
If you want to try BORIS without installing it you can download the VirtualBox virtual appliance from the BORISsite. In this case you must first install the VirtualBox virtualizer from Oracle (released under GPL 2).
8 Chapter 3. Install BORIS
CHAPTER 4
Launch BORIS
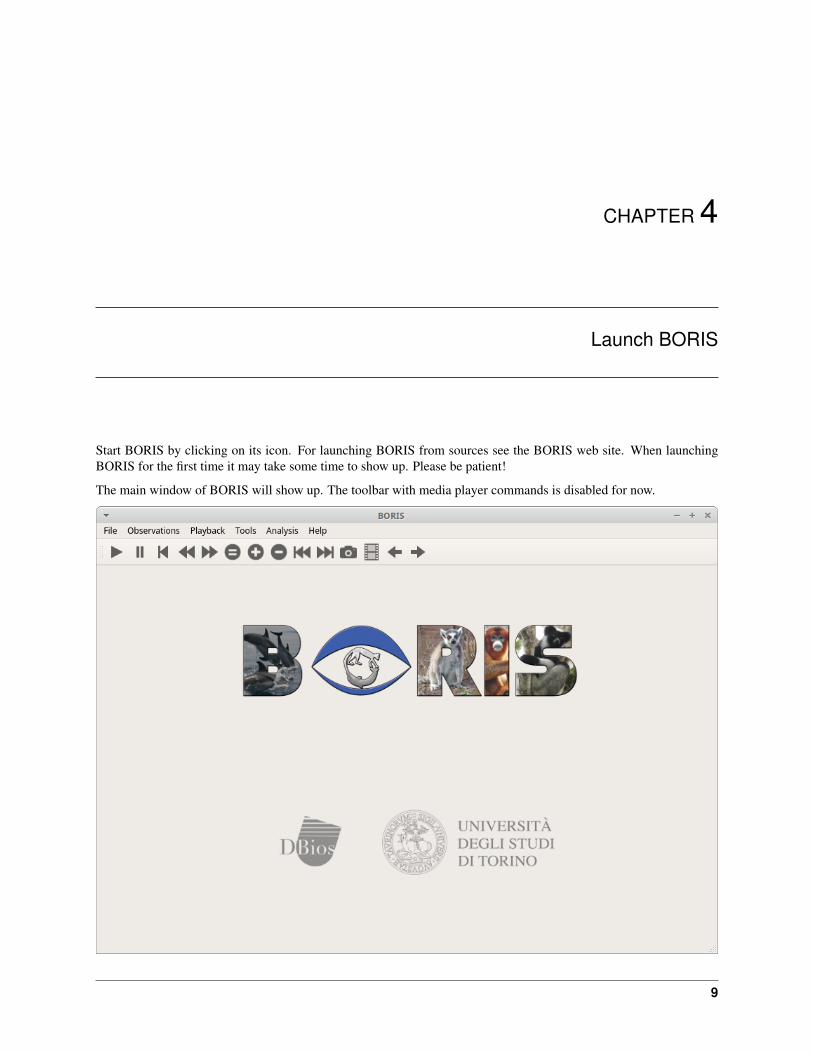
Start BORIS by clicking on its icon. For launching BORIS from sources see the BORIS web site. When launchingBORIS for the first time it may take some time to show up. Please be patient!
The main window of BORIS will show up. The toolbar with media player commands is disabled for now.
9
BORIS Documentation, Release latest
WARNING
On Mac OS X 10.9 and above, launching can be stopped according to the ‘Security & Privacy‘ settings ofyour computer. They can be changed opening ‘System Preferences. . . ‘ > ‘Security & Privacy‘ > ‘General‘ andselecting the option ‘Anywhere‘ in the frame ‘Allow apps downloaded from‘. Alternatively you can repeat theoperation right-clicking on the BORIS icon and then clicking ‘Open‘ in the following two dialog boxes.
WARNING
On Microsoft-Windows, launching can be stopped by a ‘Security warning: The publisher can not be verified.Are you sure you want to run this software?‘ Click the ‘Run‘ button to launch BORIS.
At the first launch, BORIS will ask you to allow the automatically check for new version. Internet access is requiredfor this feature. If you choose Yes BORIS will check for new version about every 15 days. This option can be changedon the Preferences window (See general preferences)
You can launch BORIS from command line by specifying the project file to open as the first argument.
10 Chapter 4. Launch BORIS
CHAPTER 5
Create a new project with BORIS
The BORIS project file is the container for all information related to the project. It contains the ethogram, theindependent variables, the subjects definition, the behaviors coding maps, the converters and all observationsdata. The save menu option (File > Save project or Save project as . . . ) will save the project in a path in your localfile system. You can also activate the automatic backup feature (see Preferences).
NOTE
It is very important to do regular backups of your project files to prevent the lost of data. Software can bereinstalled but your data could quite possibly be lost for ever.
BORIS allows creating an unlimited number of projects but only one project can be opened at a time.
A video tutorial about creating a project is available at https://www.youtube.com/watch?v=I97Dny5hFOE
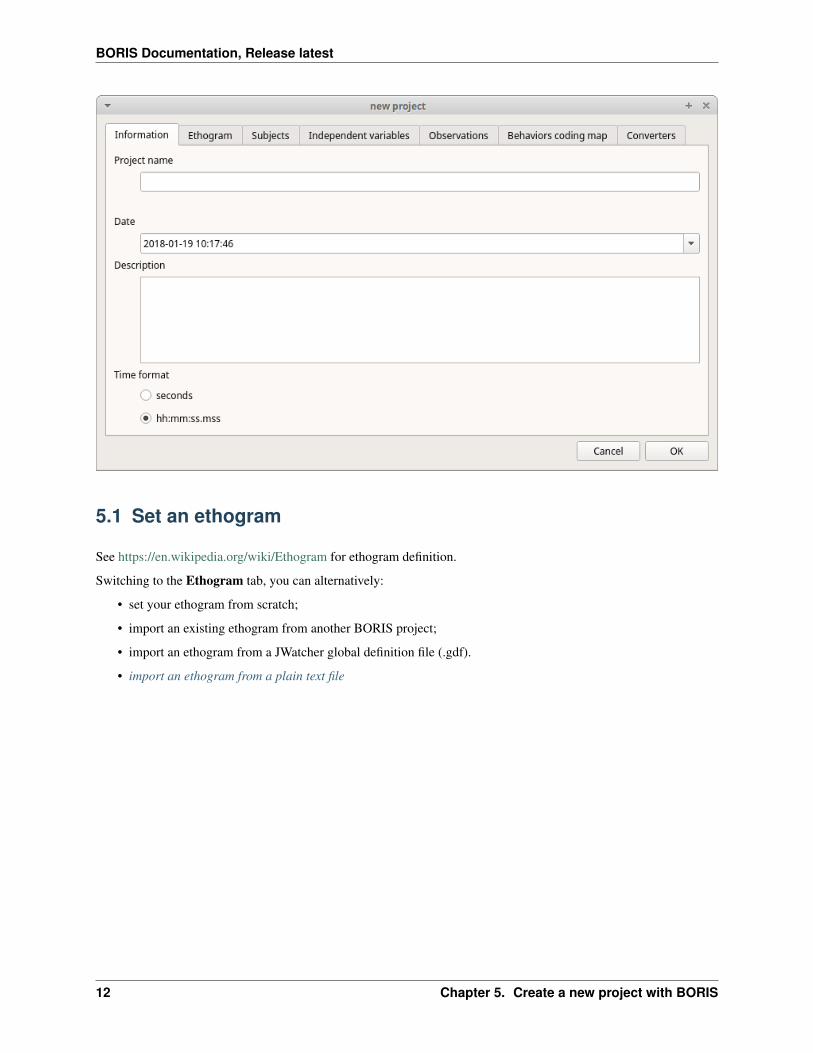
To create a new project, under the menu File , select New project. You can determine your project name by writingin the Project name field in the Information tab. Once the project will be saved, the Project file path will show thefull path to your project file. Date will automatically set on the current date and time, but you can alternatively set thisinfo on your media date and time, or whatever you prefer. Description can host all the relevant information about yourproject, can be also left empty. Time format can be alternatively set to seconds or to hh:mm:ss.mss. This choicecan be changed at anytime under File > Preferences (for MAC users, BORIS > Preferences) > Default project timeformat.
11
BORIS Documentation, Release latest
5.1 Set an ethogram
See https://en.wikipedia.org/wiki/Ethogram for ethogram definition.
Switching to the Ethogram tab, you can alternatively:
• set your ethogram from scratch;
• import an existing ethogram from another BORIS project;
• import an ethogram from a JWatcher global definition file (.gdf).
• import an ethogram from a plain text file
12 Chapter 5. Create a new project with BORIS
BORIS Documentation, Release latest
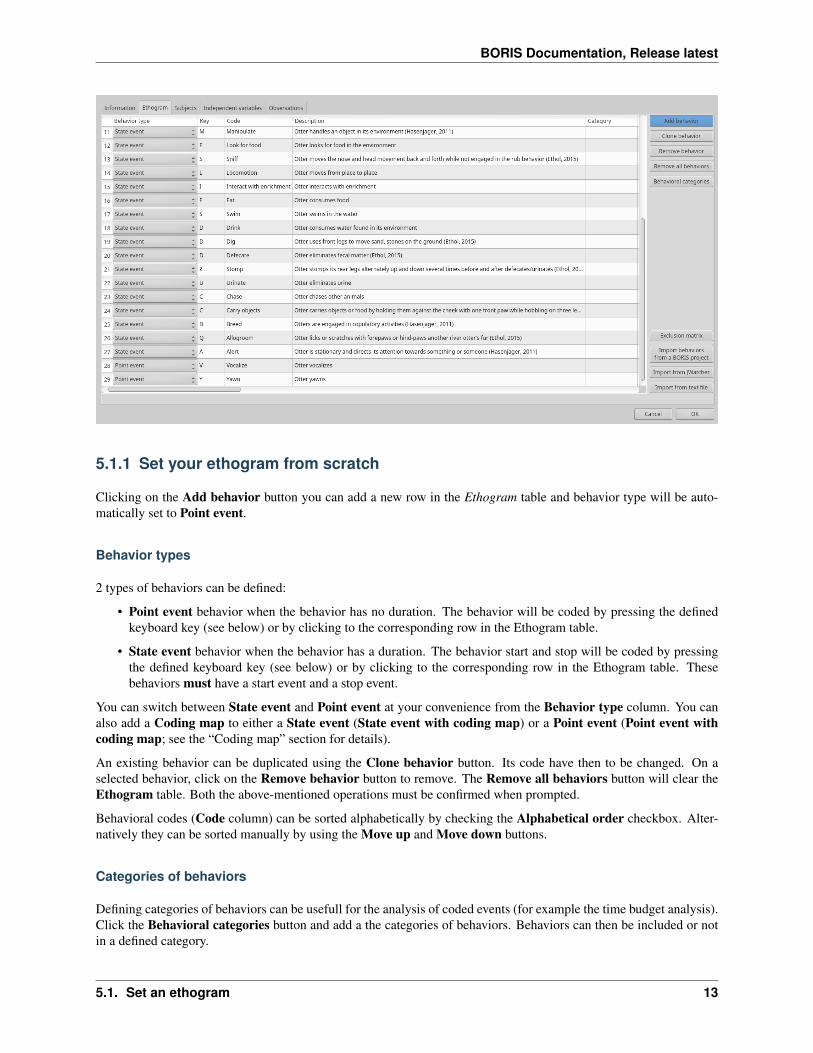
5.1.1 Set your ethogram from scratch
Clicking on the Add behavior button you can add a new row in the Ethogram table and behavior type will be auto-matically set to Point event.
Behavior types
2 types of behaviors can be defined:
• Point event behavior when the behavior has no duration. The behavior will be coded by pressing the definedkeyboard key (see below) or by clicking to the corresponding row in the Ethogram table.
• State event behavior when the behavior has a duration. The behavior start and stop will be coded by pressingthe defined keyboard key (see below) or by clicking to the corresponding row in the Ethogram table. Thesebehaviors must have a start event and a stop event.
You can switch between State event and Point event at your convenience from the Behavior type column. You canalso add a Coding map to either a State event (State event with coding map) or a Point event (Point event withcoding map; see the “Coding map” section for details).
An existing behavior can be duplicated using the Clone behavior button. Its code have then to be changed. On aselected behavior, click on the Remove behavior button to remove. The Remove all behaviors button will clear theEthogram table. Both the above-mentioned operations must be confirmed when prompted.
Behavioral codes (Code column) can be sorted alphabetically by checking the Alphabetical order checkbox. Alter-natively they can be sorted manually by using the Move up and Move down buttons.
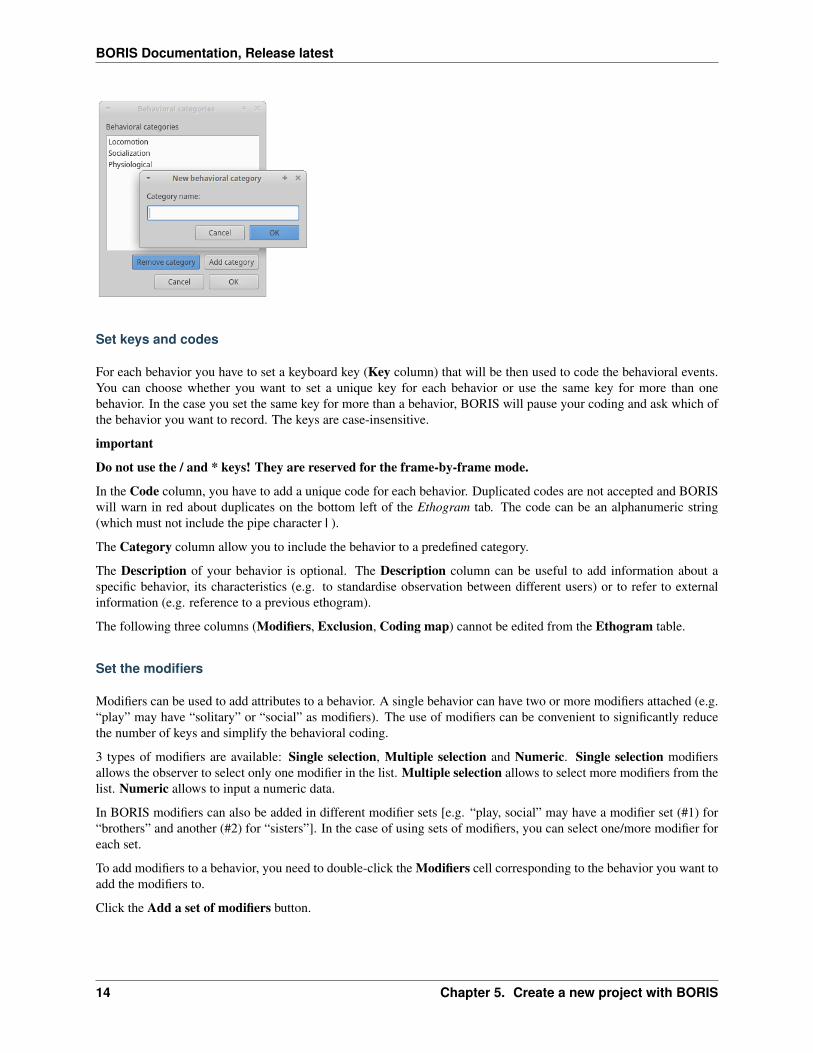
Categories of behaviors
Defining categories of behaviors can be usefull for the analysis of coded events (for example the time budget analysis).Click the Behavioral categories button and add a the categories of behaviors. Behaviors can then be included or notin a defined category.
5.1. Set an ethogram 13
BORIS Documentation, Release latest
Set keys and codes
For each behavior you have to set a keyboard key (Key column) that will be then used to code the behavioral events.You can choose whether you want to set a unique key for each behavior or use the same key for more than onebehavior. In the case you set the same key for more than a behavior, BORIS will pause your coding and ask which ofthe behavior you want to record. The keys are case-insensitive.
important
Do not use the / and * keys! They are reserved for the frame-by-frame mode.
In the Code column, you have to add a unique code for each behavior. Duplicated codes are not accepted and BORISwill warn in red about duplicates on the bottom left of the Ethogram tab. The code can be an alphanumeric string(which must not include the pipe character | ).
The Category column allow you to include the behavior to a predefined category.
The Description of your behavior is optional. The Description column can be useful to add information about aspecific behavior, its characteristics (e.g. to standardise observation between different users) or to refer to externalinformation (e.g. reference to a previous ethogram).
The following three columns (Modifiers, Exclusion, Coding map) cannot be edited from the Ethogram table.
Set the modifiers
Modifiers can be used to add attributes to a behavior. A single behavior can have two or more modifiers attached (e.g.“play” may have “solitary” or “social” as modifiers). The use of modifiers can be convenient to significantly reducethe number of keys and simplify the behavioral coding.
3 types of modifiers are available: Single selection, Multiple selection and Numeric. Single selection modifiersallows the observer to select only one modifier in the list. Multiple selection allows to select more modifiers from thelist. Numeric allows to input a numeric data.
In BORIS modifiers can also be added in different modifier sets [e.g. “play, social” may have a modifier set (#1) for“brothers” and another (#2) for “sisters”]. In the case of using sets of modifiers, you can select one/more modifier foreach set.
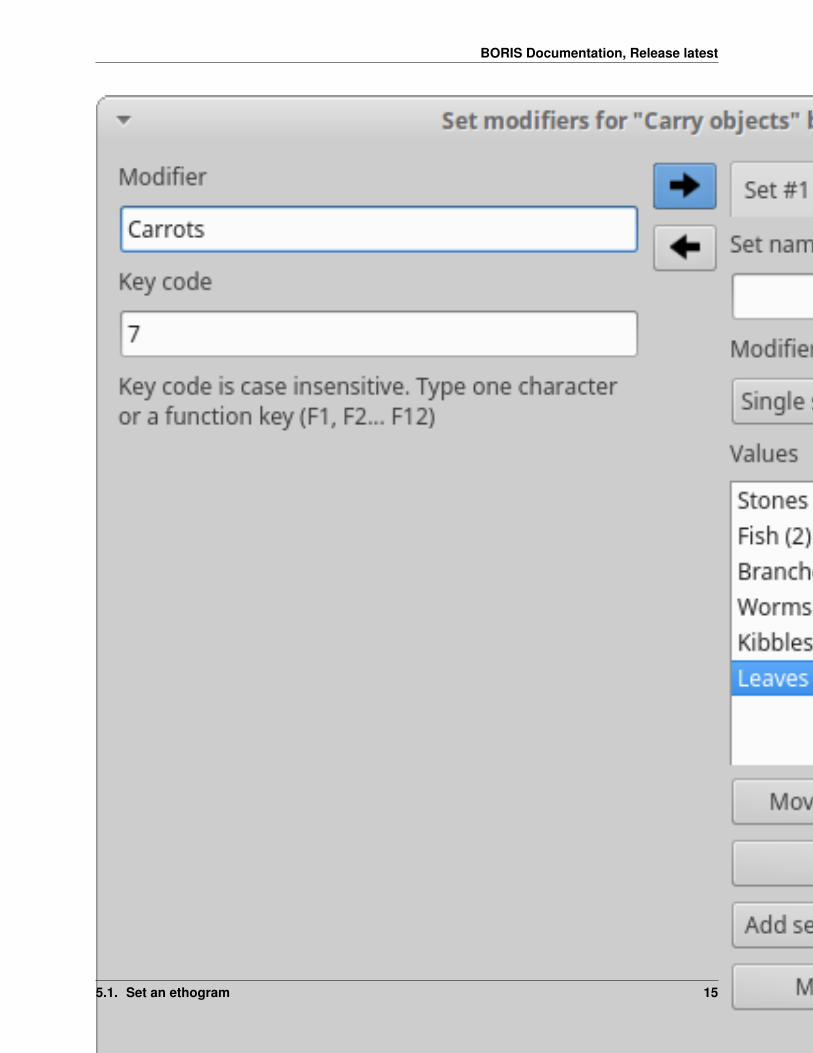
To add modifiers to a behavior, you need to double-click the Modifiers cell corresponding to the behavior you want toadd the modifiers to.
Click the Add a set of modifiers button.
14 Chapter 5. Create a new project with BORIS
BORIS Documentation, Release latest
5.1. Set an ethogram 15
BORIS Documentation, Release latest
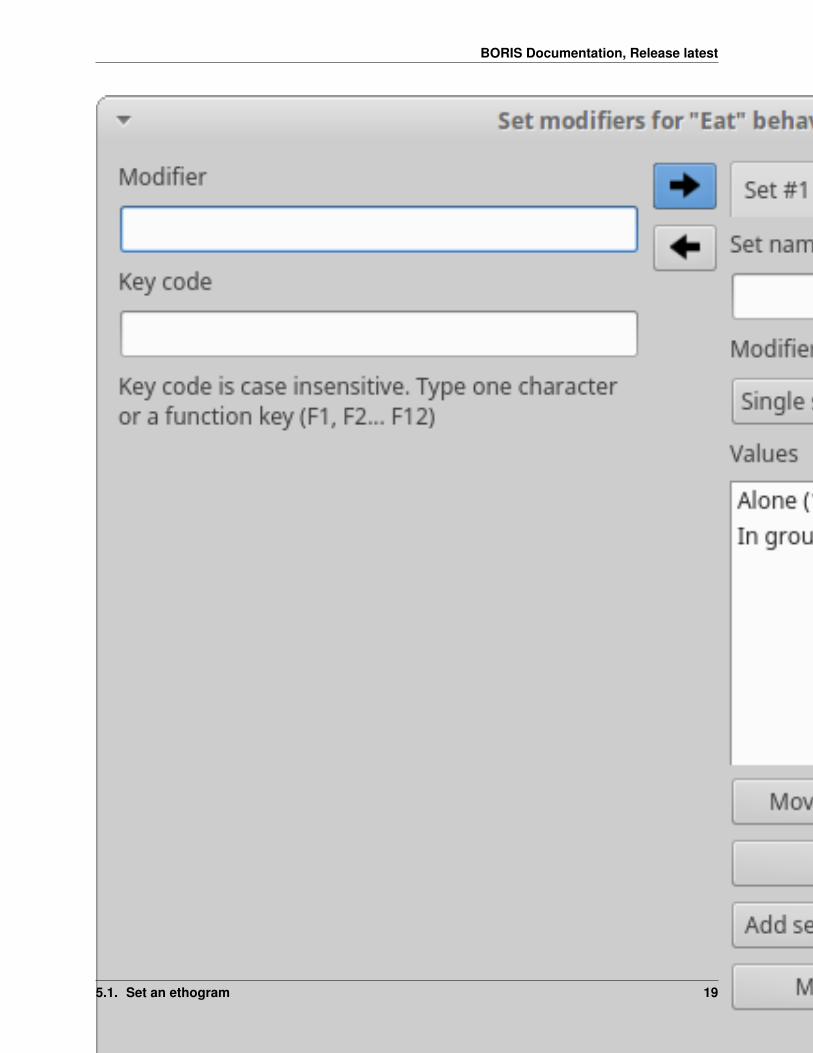
Set a name for the new modifiers set (new in v. 4) by typing it in the Set name edit box. Setting a modifiers’ set nameis not mandatory.
Select the modifier type using the Modifier type combo box. You can choose between Single selection, Multipleselection and Numeric
Within a set of modifiers, you can add and remove modifiers using the Modifier field and clicking on the right-arrowbutton (to add) and the Remove modifier button (to remove). The selected modifier can be edited using the left-arrowbutton. The Key code box can be used to set a shortcut key for the modifier (optionnal).
The modifier position into the modifiers’ set can be manually set using the Move modifier up and Move modifierdown buttons.
You can add and/or remove sets using the buttons Add set of modifiers and Remove set of modifiers.
The position of a modifiers’ set can be customized (using the Move set left and Move set right buttons)
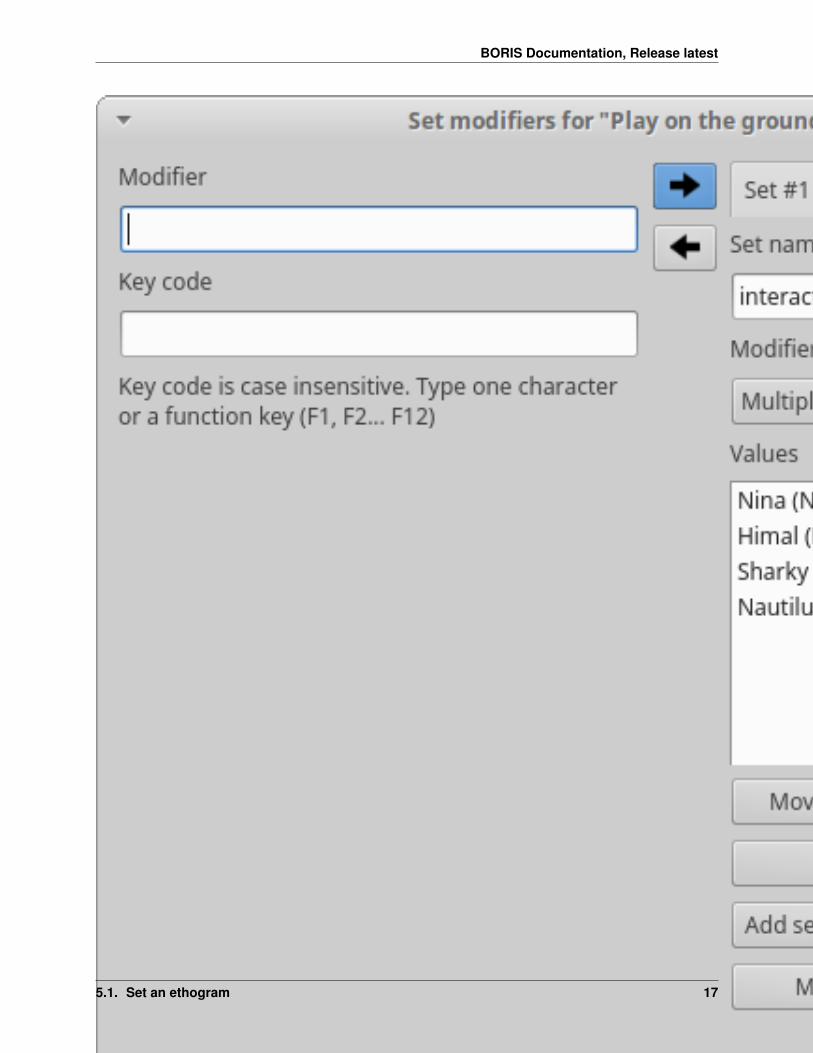
Modifiers can not contain the following characters: (|),‘~!
Example of a multiple selection modifiers set:
16 Chapter 5. Create a new project with BORIS
BORIS Documentation, Release latest
5.1. Set an ethogram 17

BORIS Documentation, Release latest
Many values can be selected together.
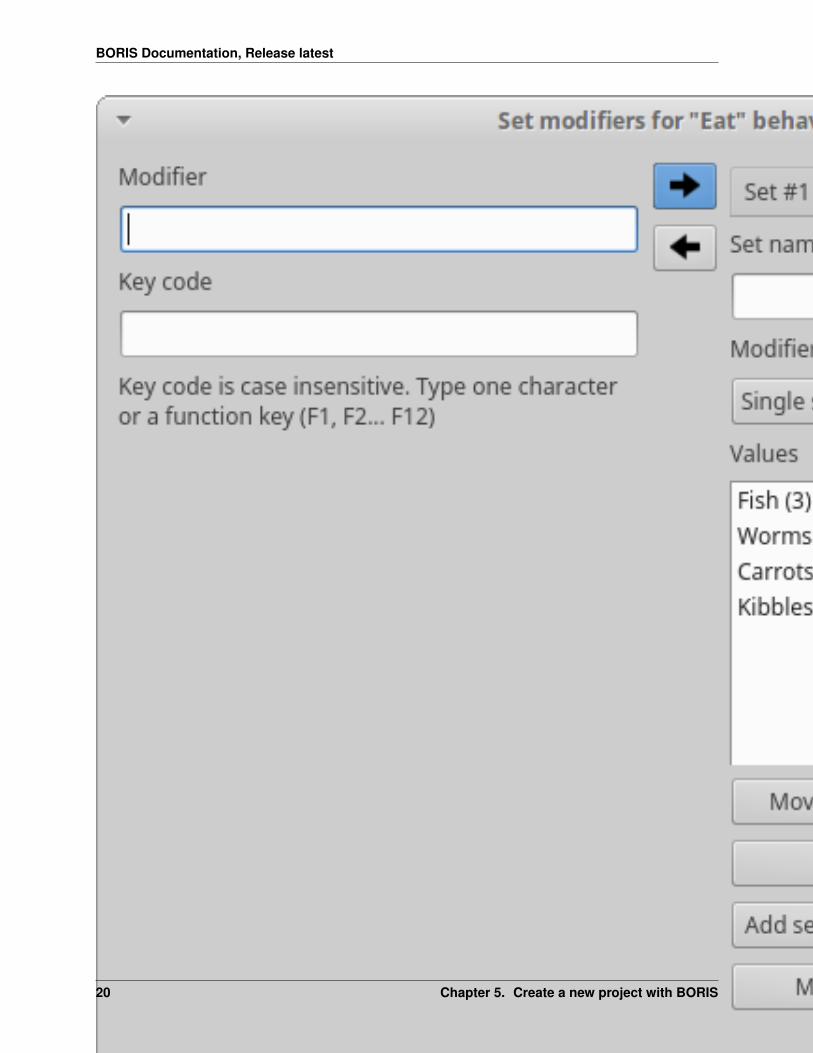
Example of a 2 sets of modifiers:
18 Chapter 5. Create a new project with BORIS
BORIS Documentation, Release latest
5.1. Set an ethogram 19
BORIS Documentation, Release latest
20 Chapter 5. Create a new project with BORIS
BORIS Documentation, Release latest
Click OK to save modifiers in the Ethogram table.
Set the exclusion matrix
The occurrence of an event (State or Point) can exclude the occurrence of a state event. This can be set using theBehaviors exclusion matrix window, which can be opened clicking on the Exclusion matrix button. BORIS will askfor including Point events or not and a new Exclusion matrix window will open.
Exclusive behavior may be selected by checking on the corresponding cell in the automatically-generated matrix. Wesuggest to work on the Exclusion matrix when all the behaviors have been added to your ethogram.
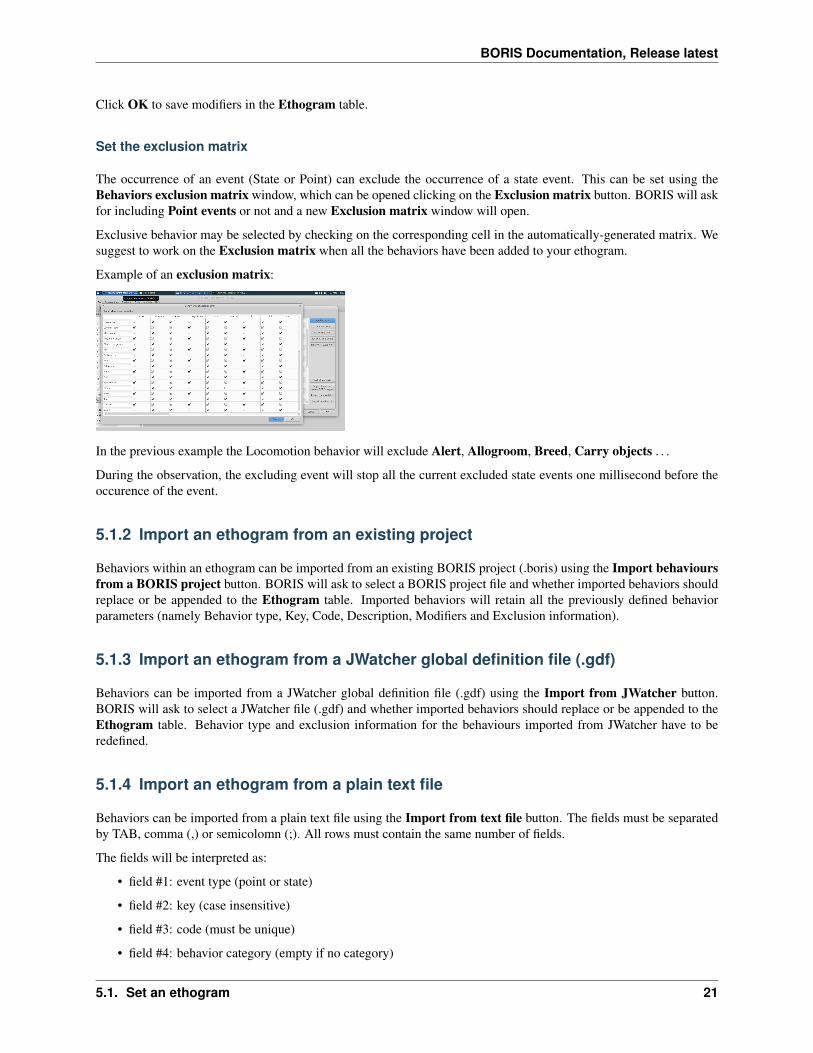
Example of an exclusion matrix:
In the previous example the Locomotion behavior will exclude Alert, Allogroom, Breed, Carry objects . . .
During the observation, the excluding event will stop all the current excluded state events one millisecond before theoccurence of the event.
5.1.2 Import an ethogram from an existing project
Behaviors within an ethogram can be imported from an existing BORIS project (.boris) using the Import behavioursfrom a BORIS project button. BORIS will ask to select a BORIS project file and whether imported behaviors shouldreplace or be appended to the Ethogram table. Imported behaviors will retain all the previously defined behaviorparameters (namely Behavior type, Key, Code, Description, Modifiers and Exclusion information).
5.1.3 Import an ethogram from a JWatcher global definition file (.gdf)
Behaviors can be imported from a JWatcher global definition file (.gdf) using the Import from JWatcher button.BORIS will ask to select a JWatcher file (.gdf) and whether imported behaviors should replace or be appended to theEthogram table. Behavior type and exclusion information for the behaviours imported from JWatcher have to beredefined.
5.1.4 Import an ethogram from a plain text file
Behaviors can be imported from a plain text file using the Import from text file button. The fields must be separatedby TAB, comma (,) or semicolomn (;). All rows must contain the same number of fields.
The fields will be interpreted as:
• field #1: event type (point or state)
• field #2: key (case insensitive)
• field #3: code (must be unique)
• field #4: behavior category (empty if no category)
5.1. Set an ethogram 21
BORIS Documentation, Release latest
• field #5: description (optional)
All fields after the 5th will be ignored.
BORIS will ask to select a plain text file (by default: *.txt *.csv *.tsv) and whether imported behaviors should replaceor be appended to the Ethogram table. The missing information for the behaviours imported from text file have to beredefined.
5.1.5 Export the ethogram
The entire ethogram can be exported in various formats (TSV, CSV, XLS, ODS, HTML). See File > Edit project >Ethogram tab > Export ethogram
22 Chapter 5. Create a new project with BORIS
BORIS Documentation, Release latest
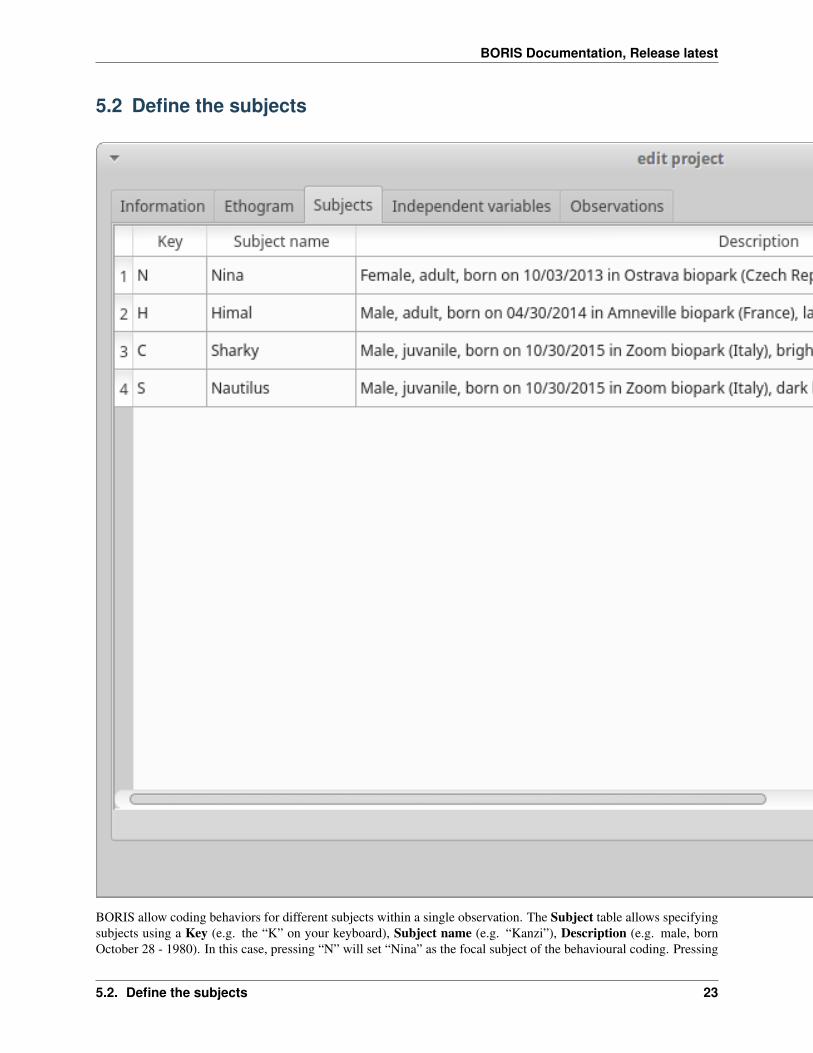
5.2 Define the subjects
BORIS allow coding behaviors for different subjects within a single observation. The Subject table allows specifyingsubjects using a Key (e.g. the “K” on your keyboard), Subject name (e.g. “Kanzi”), Description (e.g. male, bornOctober 28 - 1980). In this case, pressing “N” will set “Nina” as the focal subject of the behavioural coding. Pressing
5.2. Define the subjects 23
BORIS Documentation, Release latest
“N” again will deselect “Nina” and set to “no focal subject”. The definition of one or more subjects is not mandatory.Addition, removal and sorting of the subjects follows the same logic of the Ethogram table (see Set your ethogramfrom scratch for info). The subjects can also be imported from an existing BORIS project using the Import Subjectsfrom a BORIS project.
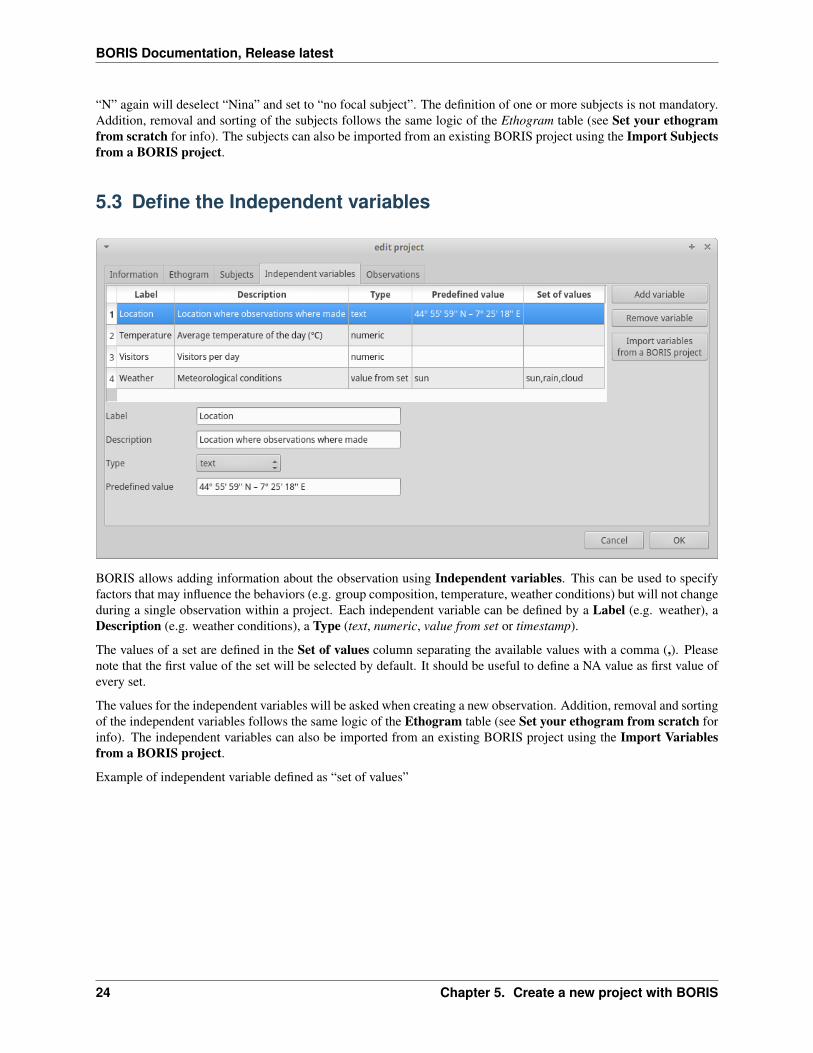
5.3 Define the Independent variables
BORIS allows adding information about the observation using Independent variables. This can be used to specifyfactors that may influence the behaviors (e.g. group composition, temperature, weather conditions) but will not changeduring a single observation within a project. Each independent variable can be defined by a Label (e.g. weather), aDescription (e.g. weather conditions), a Type (text, numeric, value from set or timestamp).
The values of a set are defined in the Set of values column separating the available values with a comma (,). Pleasenote that the first value of the set will be selected by default. It should be useful to define a NA value as first value ofevery set.
The values for the independent variables will be asked when creating a new observation. Addition, removal and sortingof the independent variables follows the same logic of the Ethogram table (see Set your ethogram from scratch forinfo). The independent variables can also be imported from an existing BORIS project using the Import Variablesfrom a BORIS project.
Example of independent variable defined as “set of values”
24 Chapter 5. Create a new project with BORIS
BORIS Documentation, Release latest
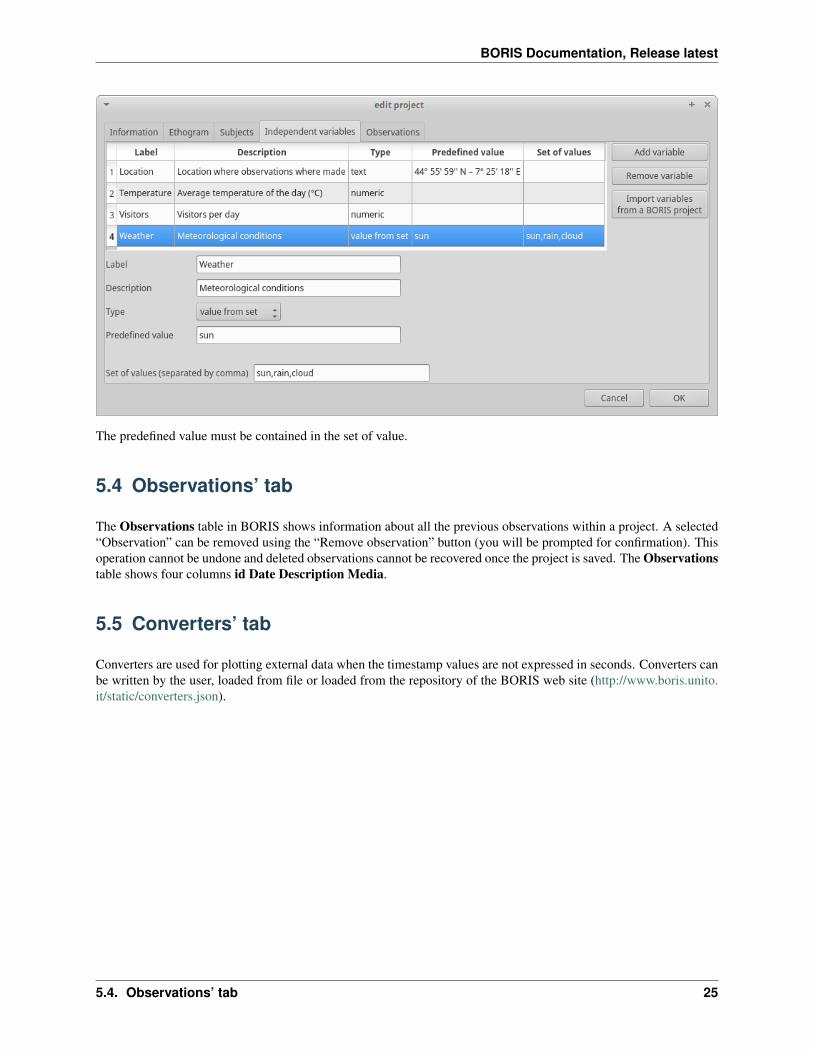
The predefined value must be contained in the set of value.
5.4 Observations’ tab
The Observations table in BORIS shows information about all the previous observations within a project. A selected“Observation” can be removed using the “Remove observation” button (you will be prompted for confirmation). Thisoperation cannot be undone and deleted observations cannot be recovered once the project is saved. The Observationstable shows four columns id Date Description Media.
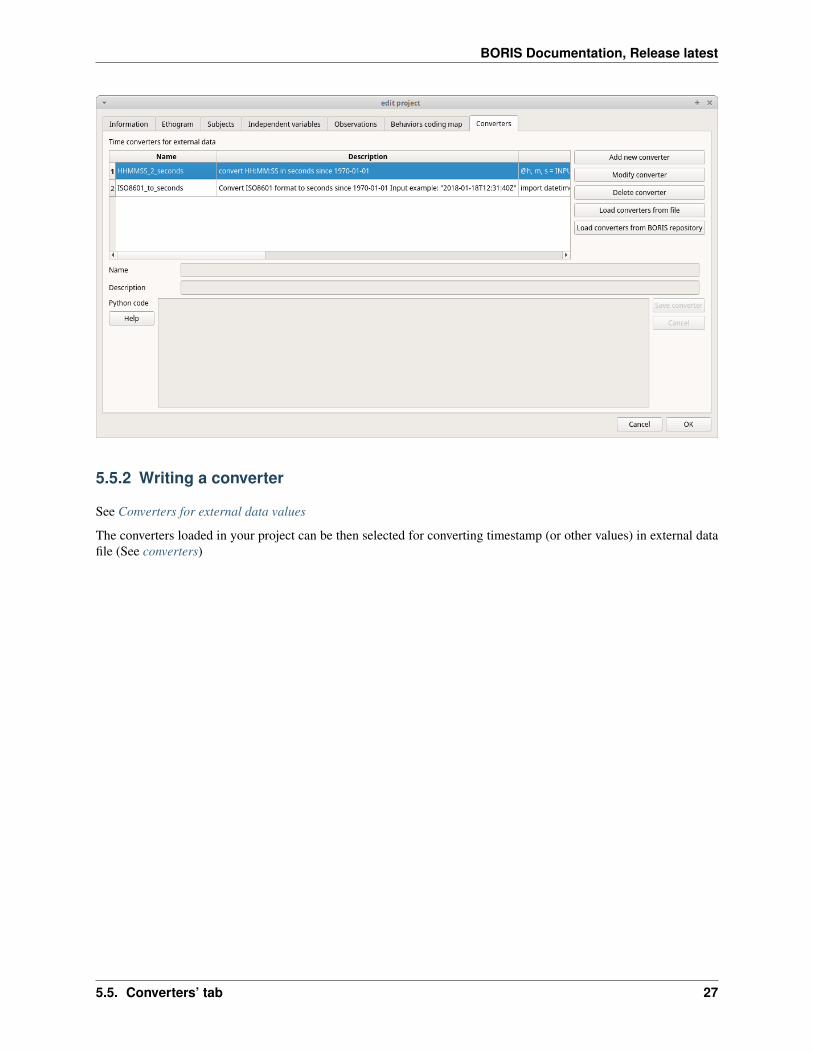
5.5 Converters’ tab
Converters are used for plotting external data when the timestamp values are not expressed in seconds. Converters canbe written by the user, loaded from file or loaded from the repository of the BORIS web site (http://www.boris.unito.it/static/converters.json).
5.4. Observations’ tab 25
BORIS Documentation, Release latest
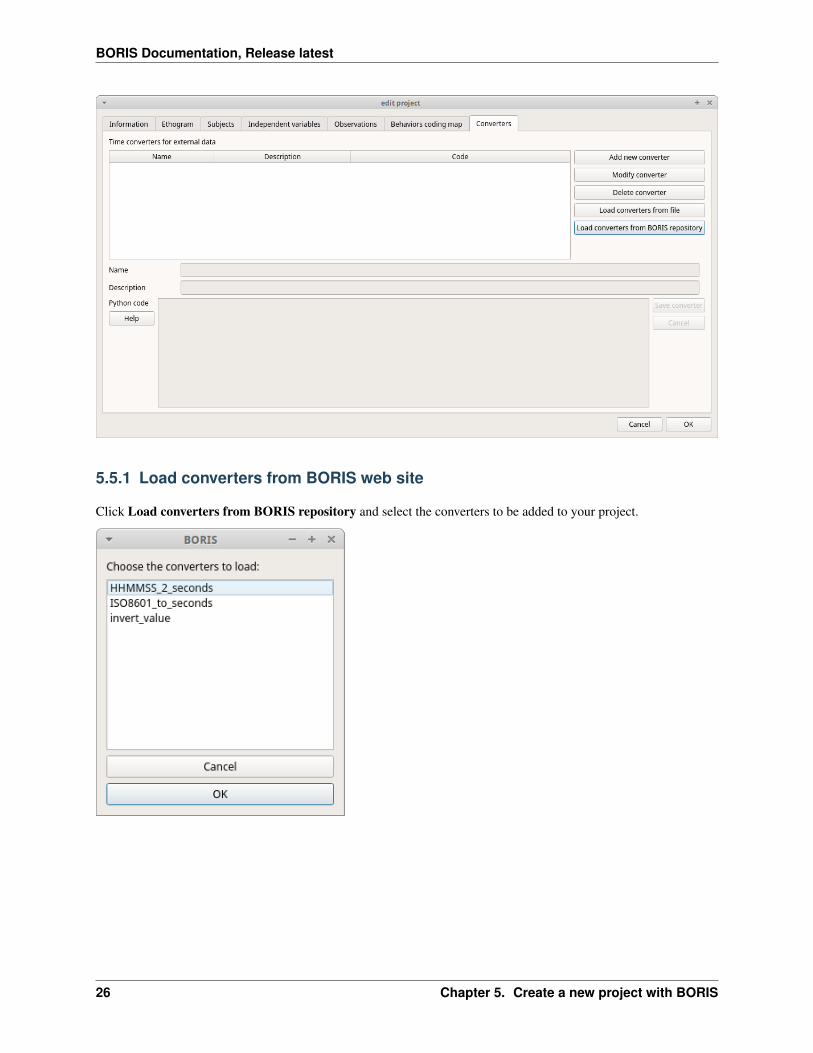
5.5.1 Load converters from BORIS web site
Click Load converters from BORIS repository and select the converters to be added to your project.
26 Chapter 5. Create a new project with BORIS
BORIS Documentation, Release latest
5.5.2 Writing a converter
See Converters for external data values
The converters loaded in your project can be then selected for converting timestamp (or other values) in external datafile (See converters)
5.5. Converters’ tab 27

BORIS Documentation, Release latest
28 Chapter 5. Create a new project with BORIS
CHAPTER 6
Open an existing project with BORIS
IMPORTANT
Due to changes in modifiers format all the projects created with v. 4+ will not be suitable for previous version ofBORIS. The v. 4 will open projects created with previous version and convert them. A copy of your old projectwill be kept.
To open an existing BORIS project, selct the menu File > Open project. A BORIS project file is a container forall information related to a set of observations as the ethogram, the independent variables, and the subjects. BORISallows creating an unlimited number of projects but only one project can be opened at a time.
29
BORIS Documentation, Release latest
30 Chapter 6. Open an existing project with BORIS
CHAPTER 7
Observations
7.1 Create a new observation
A video tutorial about making an observation is available at https://www.youtube.com/watch?v=ef-d6WEc0po
To create a new observation you must first Create a new project with BORIS or Open an existing project with BORIS.
Clicking on Observations > New observation will show the New observation window.
31
BORIS Documentation, Release latest
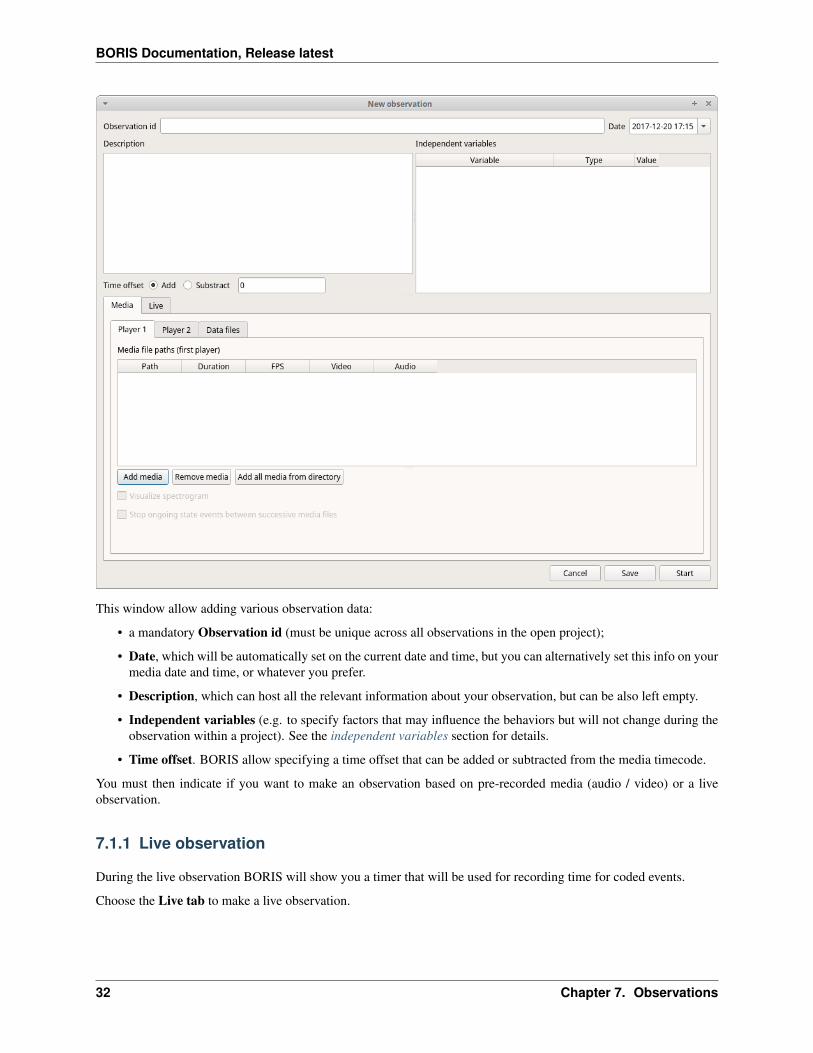
This window allow adding various observation data:
• a mandatory Observation id (must be unique across all observations in the open project);
• Date, which will be automatically set on the current date and time, but you can alternatively set this info on yourmedia date and time, or whatever you prefer.
• Description, which can host all the relevant information about your observation, but can be also left empty.
• Independent variables (e.g. to specify factors that may influence the behaviors but will not change during theobservation within a project). See the independent variables section for details.
• Time offset. BORIS allow specifying a time offset that can be added or subtracted from the media timecode.
You must then indicate if you want to make an observation based on pre-recorded media (audio / video) or a liveobservation.
7.1.1 Live observation
During the live observation BORIS will show you a timer that will be used for recording time for coded events.
Choose the Live tab to make a live observation.
32 Chapter 7. Observations
BORIS Documentation, Release latest
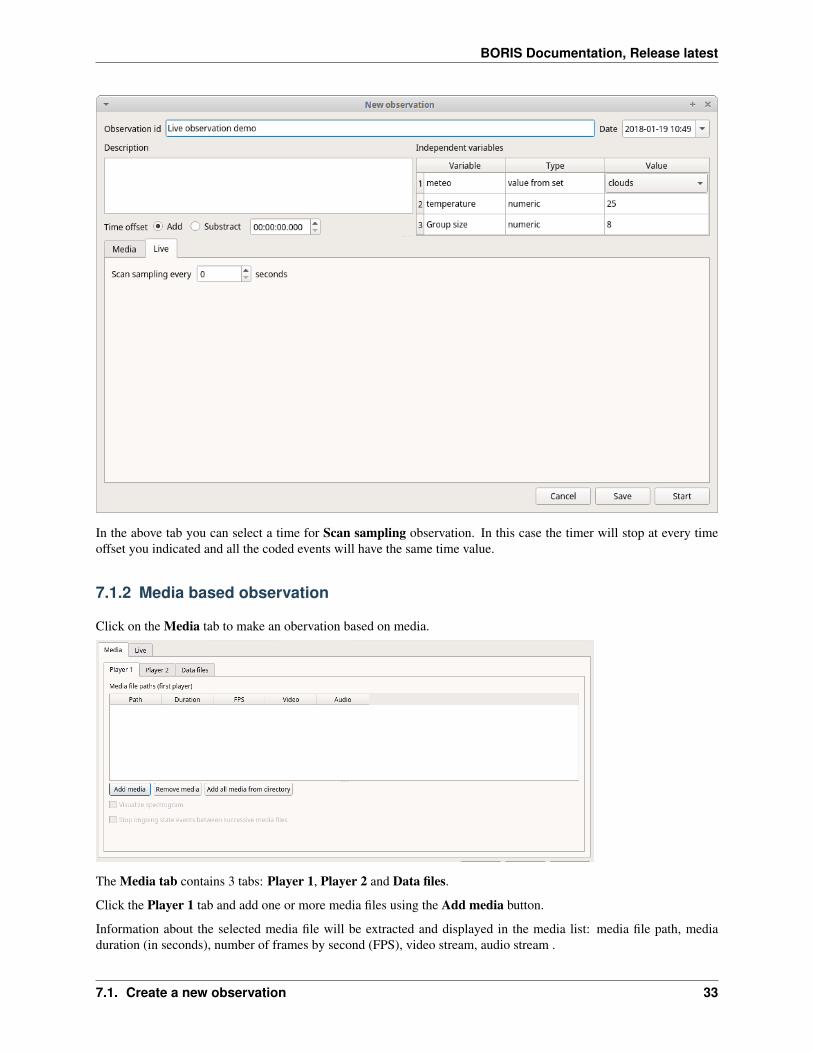
In the above tab you can select a time for Scan sampling observation. In this case the timer will stop at every timeoffset you indicated and all the coded events will have the same time value.
7.1.2 Media based observation
Click on the Media tab to make an obervation based on media.
The Media tab contains 3 tabs: Player 1, Player 2 and Data files.
Click the Player 1 tab and add one or more media files using the Add media button.
Information about the selected media file will be extracted and displayed in the media list: media file path, mediaduration (in seconds), number of frames by second (FPS), video stream, audio stream .
7.1. Create a new observation 33
BORIS Documentation, Release latest
If you have to add various media files, you can use the Add all media from directory button, in this case all the mediafiles found in the selected directory will be added in the playlist.
The Remove media button can be used to remove the selected media files.
All the media types reported at http://www.videolan.org/vlc/features.html can be played in BORIS. The media queuedin the Media file paths will be played sequentially. This means that an event occurring at time tx in the media filequeued as second (e.g. second_video.mp4) in the playlist will be scored as happening at time t1 + tx (where t1 is theduration of the first media file, e.g. first_video.mp4).
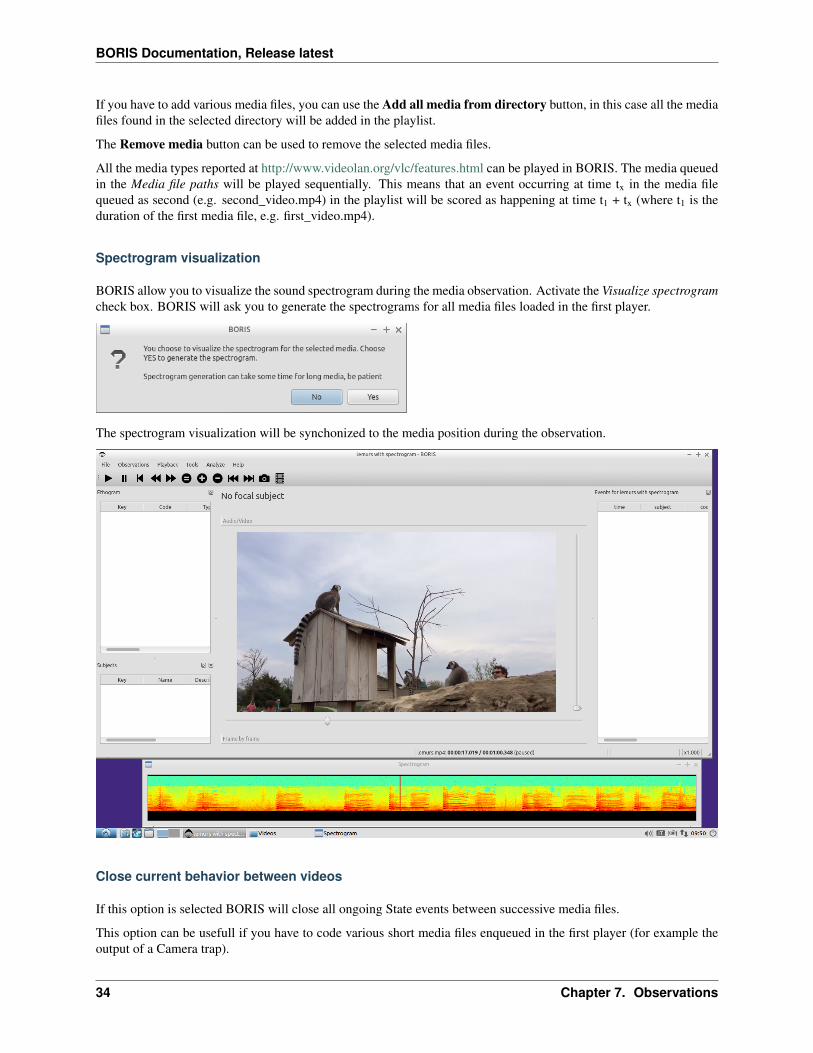
Spectrogram visualization
BORIS allow you to visualize the sound spectrogram during the media observation. Activate the Visualize spectrogramcheck box. BORIS will ask you to generate the spectrograms for all media files loaded in the first player.
The spectrogram visualization will be synchonized to the media position during the observation.
Close current behavior between videos
If this option is selected BORIS will close all ongoing State events between successive media files.
This option can be usefull if you have to code various short media files enqueued in the first player (for example theoutput of a Camera trap).
34 Chapter 7. Observations
BORIS Documentation, Release latest
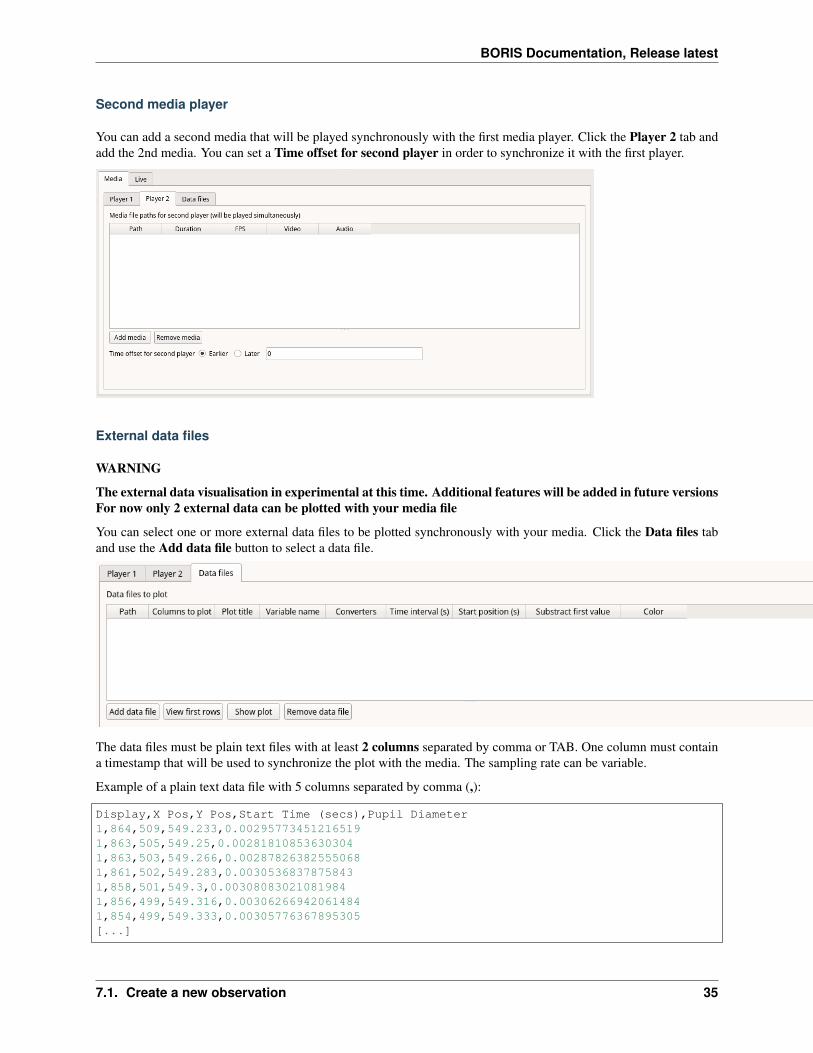
Second media player
You can add a second media that will be played synchronously with the first media player. Click the Player 2 tab andadd the 2nd media. You can set a Time offset for second player in order to synchronize it with the first player.
External data files
WARNING
The external data visualisation in experimental at this time. Additional features will be added in future versionsFor now only 2 external data can be plotted with your media file
You can select one or more external data files to be plotted synchronously with your media. Click the Data files taband use the Add data file button to select a data file.
The data files must be plain text files with at least 2 columns separated by comma or TAB. One column must containa timestamp that will be used to synchronize the plot with the media. The sampling rate can be variable.
Example of a plain text data file with 5 columns separated by comma (,):
Display,X Pos,Y Pos,Start Time (secs),Pupil Diameter1,864,509,549.233,0.002957734512165191,863,505,549.25,0.002818108536303041,863,503,549.266,0.002878263825550681,861,502,549.283,0.00305368378758431,858,501,549.3,0.003080830210819841,856,499,549.316,0.003062669420614841,854,499,549.333,0.00305776367895305[...]
7.1. Create a new observation 35
BORIS Documentation, Release latest
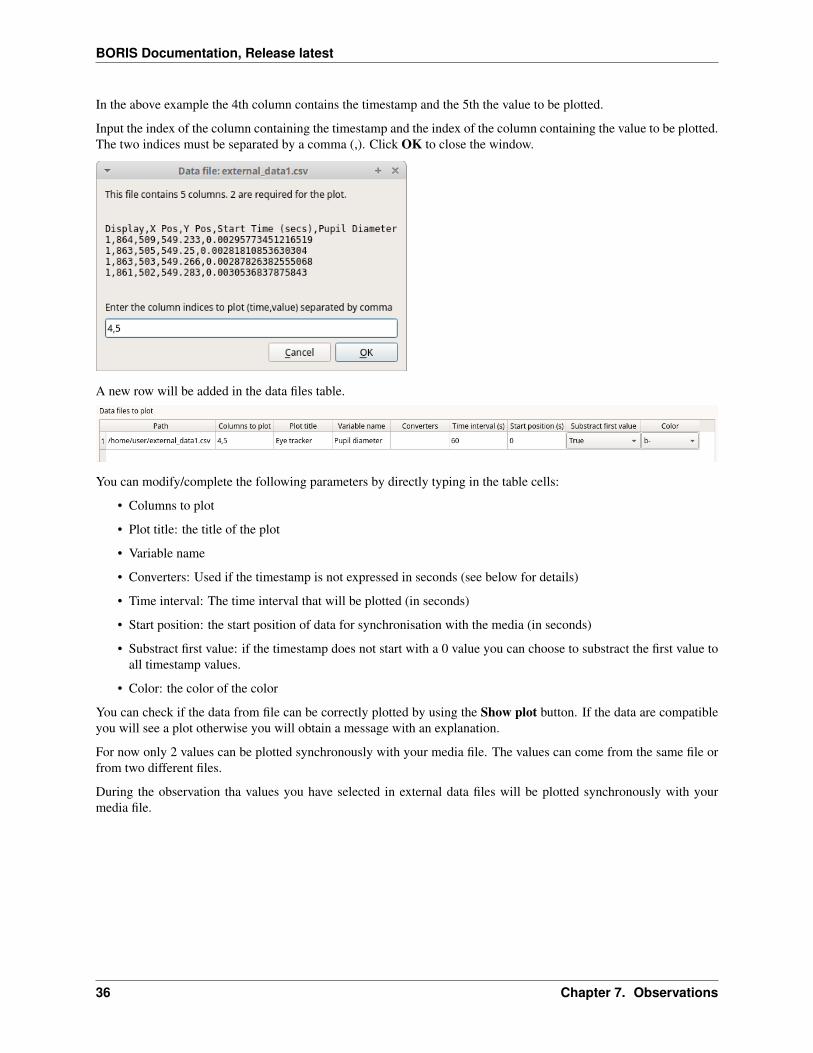
In the above example the 4th column contains the timestamp and the 5th the value to be plotted.
Input the index of the column containing the timestamp and the index of the column containing the value to be plotted.The two indices must be separated by a comma (,). Click OK to close the window.
A new row will be added in the data files table.
You can modify/complete the following parameters by directly typing in the table cells:
• Columns to plot
• Plot title: the title of the plot
• Variable name
• Converters: Used if the timestamp is not expressed in seconds (see below for details)
• Time interval: The time interval that will be plotted (in seconds)
• Start position: the start position of data for synchronisation with the media (in seconds)
• Substract first value: if the timestamp does not start with a 0 value you can choose to substract the first value toall timestamp values.
• Color: the color of the color
You can check if the data from file can be correctly plotted by using the Show plot button. If the data are compatibleyou will see a plot otherwise you will obtain a message with an explanation.
For now only 2 values can be plotted synchronously with your media file. The values can come from the same file orfrom two different files.
During the observation tha values you have selected in external data files will be plotted synchronously with yourmedia file.
36 Chapter 7. Observations
BORIS Documentation, Release latest
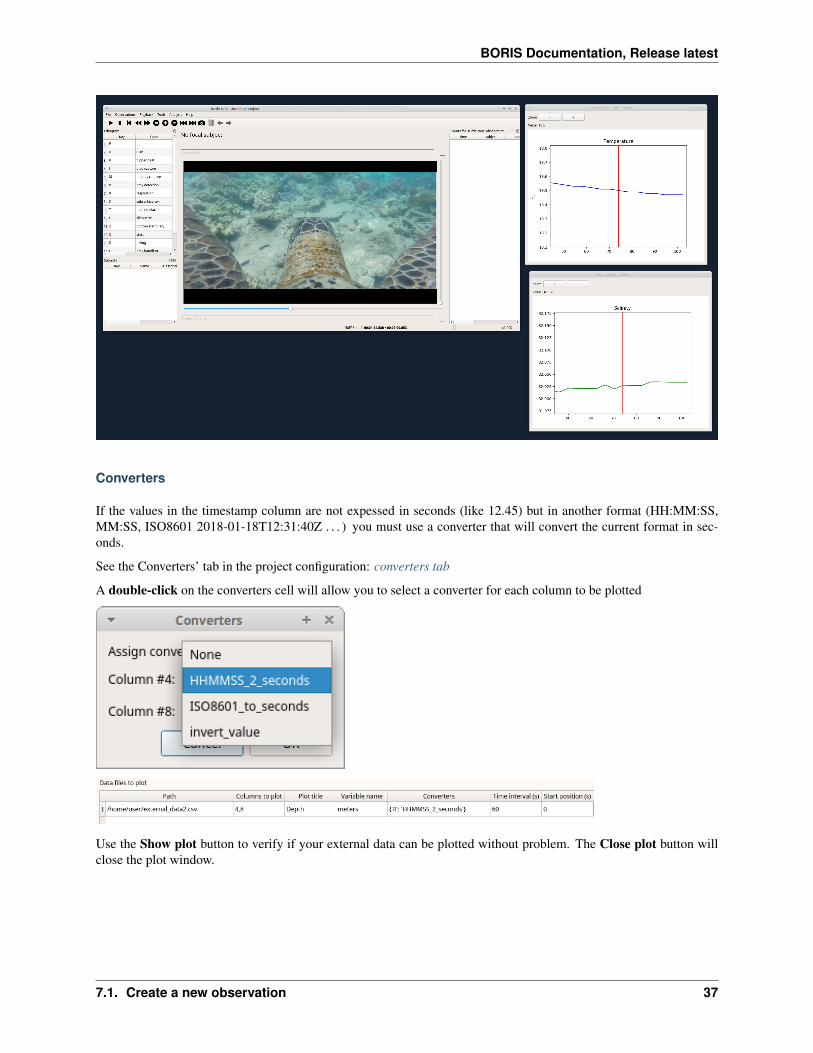
Converters
If the values in the timestamp column are not expessed in seconds (like 12.45) but in another format (HH:MM:SS,MM:SS, ISO8601 2018-01-18T12:31:40Z . . . ) you must use a converter that will convert the current format in sec-onds.
See the Converters’ tab in the project configuration: converters tab
A double-click on the converters cell will allow you to select a converter for each column to be plotted
Use the Show plot button to verify if your external data can be plotted without problem. The Close plot button willclose the plot window.
7.1. Create a new observation 37
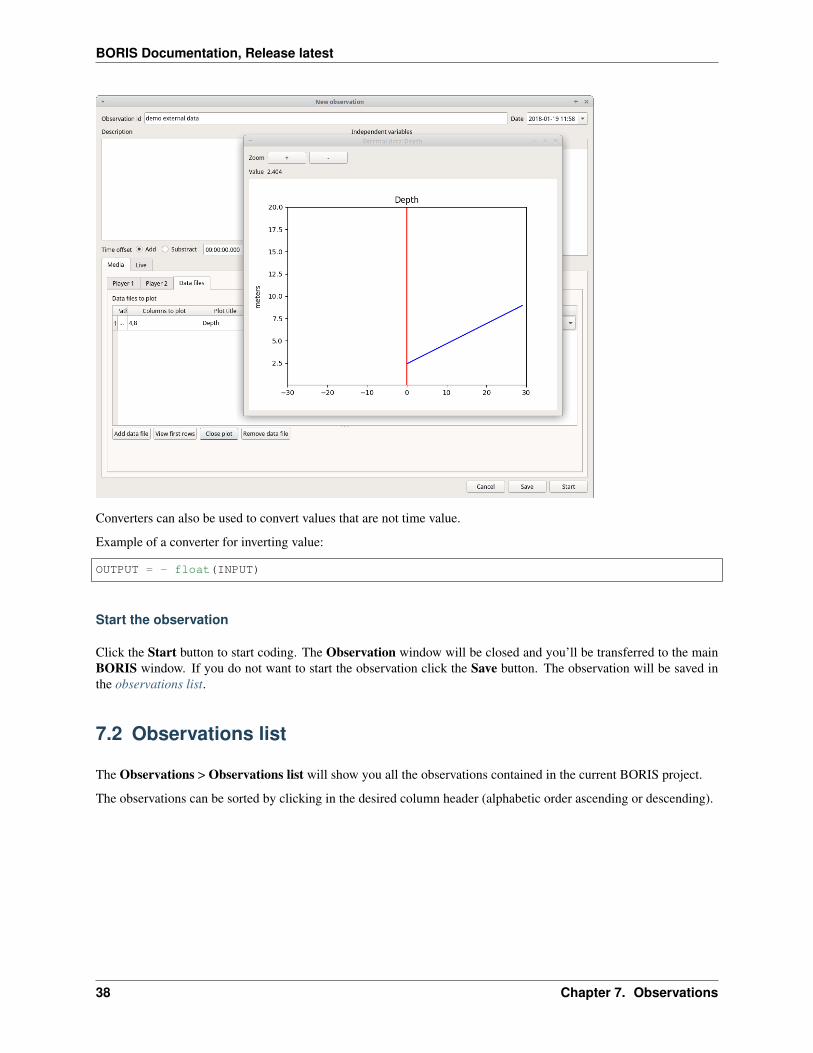
BORIS Documentation, Release latest
Converters can also be used to convert values that are not time value.
Example of a converter for inverting value:
OUTPUT = - float(INPUT)
Start the observation
Click the Start button to start coding. The Observation window will be closed and you’ll be transferred to the mainBORIS window. If you do not want to start the observation click the Save button. The observation will be saved inthe observations list.
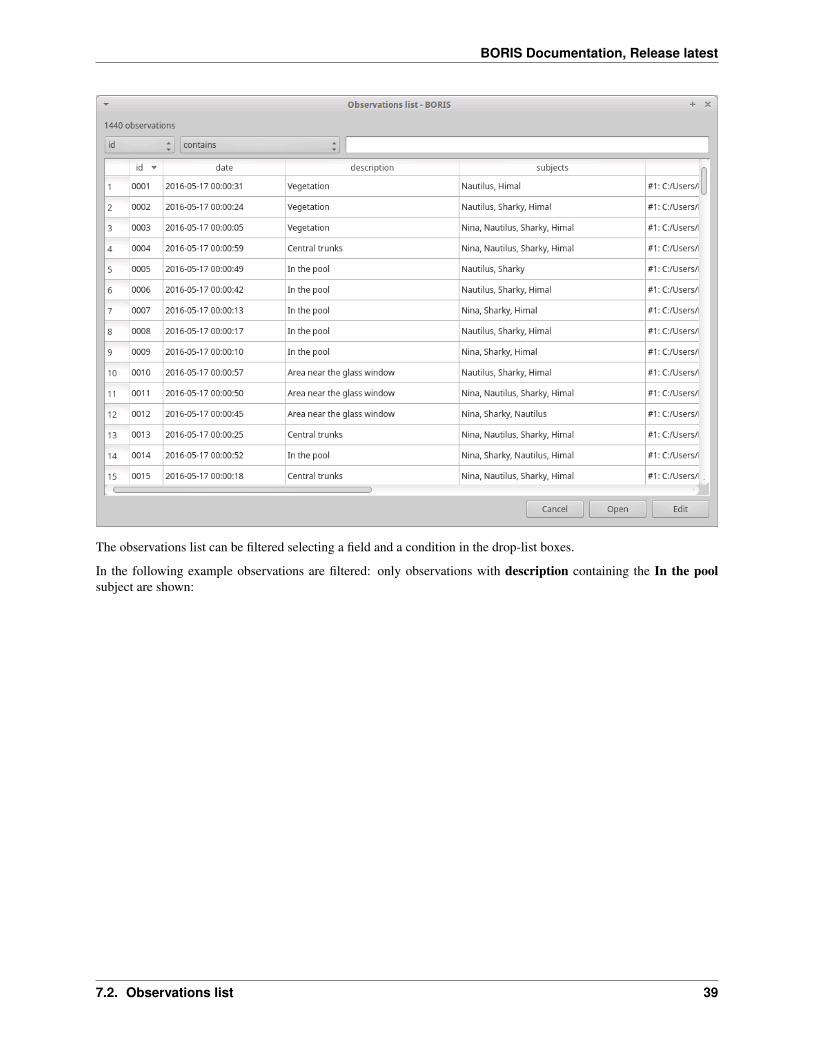
7.2 Observations list
The Observations > Observations list will show you all the observations contained in the current BORIS project.
The observations can be sorted by clicking in the desired column header (alphabetic order ascending or descending).
38 Chapter 7. Observations
BORIS Documentation, Release latest
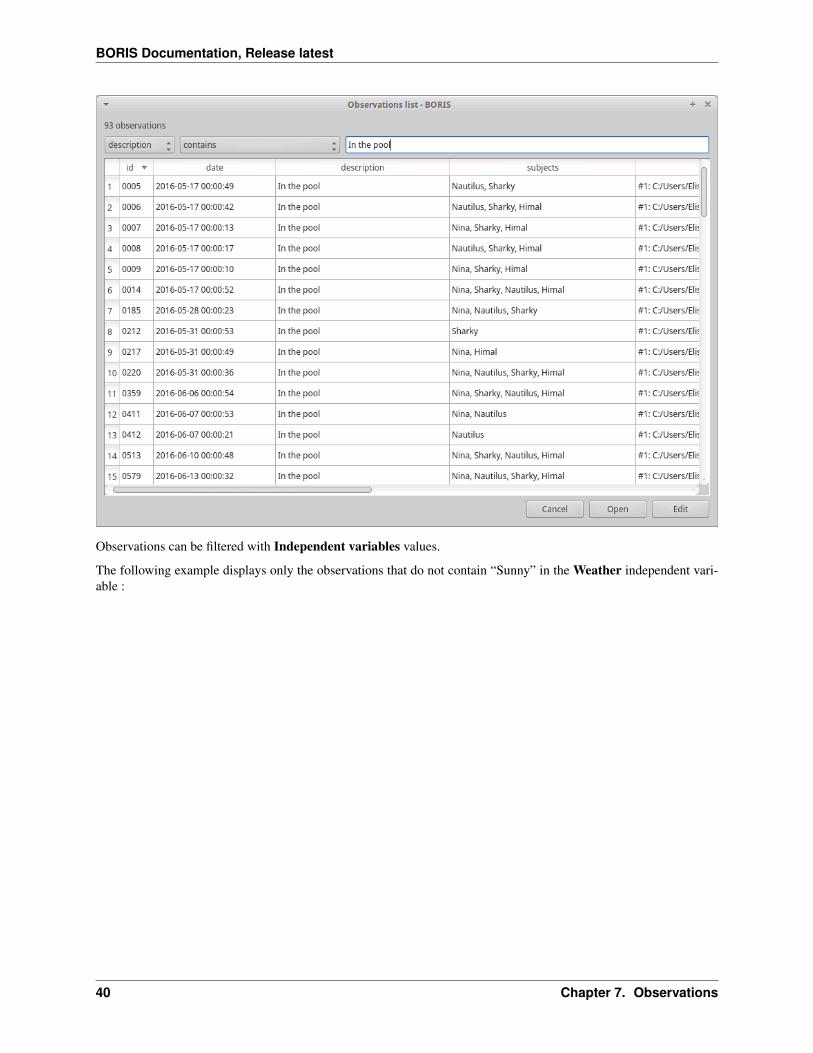
The observations list can be filtered selecting a field and a condition in the drop-list boxes.
In the following example observations are filtered: only observations with description containing the In the poolsubject are shown:
7.2. Observations list 39
BORIS Documentation, Release latest
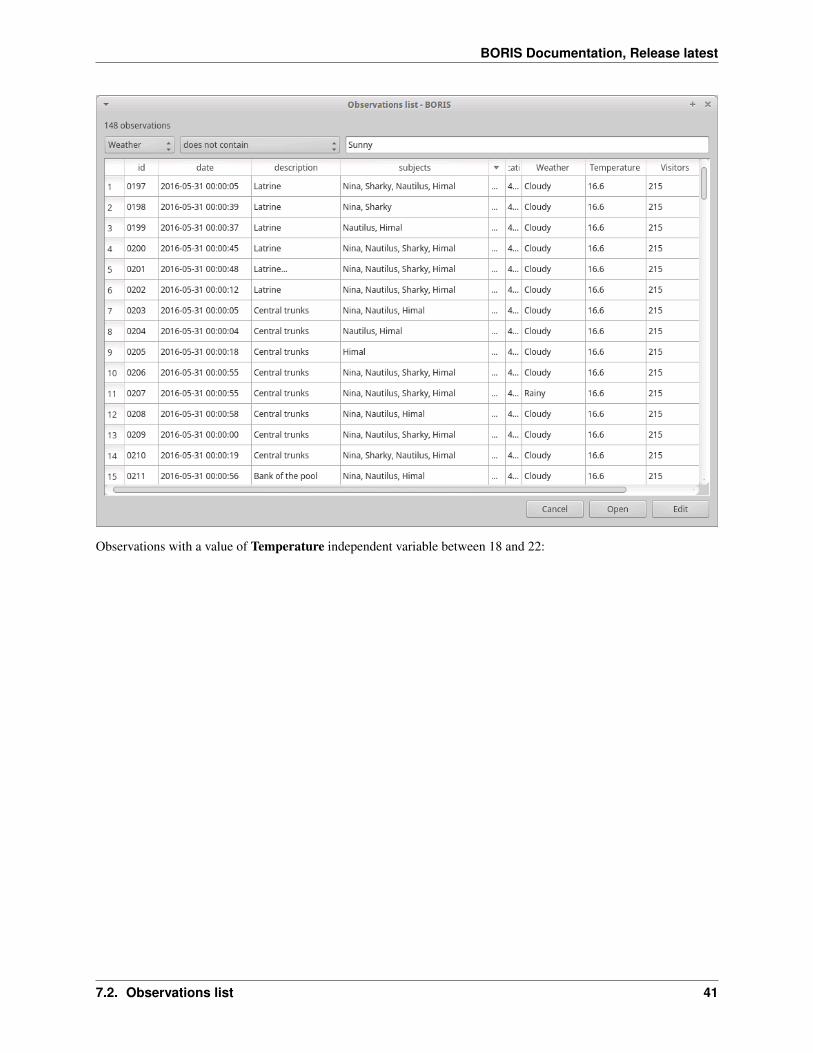
Observations can be filtered with Independent variables values.
The following example displays only the observations that do not contain “Sunny” in the Weather independent vari-able :
40 Chapter 7. Observations
BORIS Documentation, Release latest
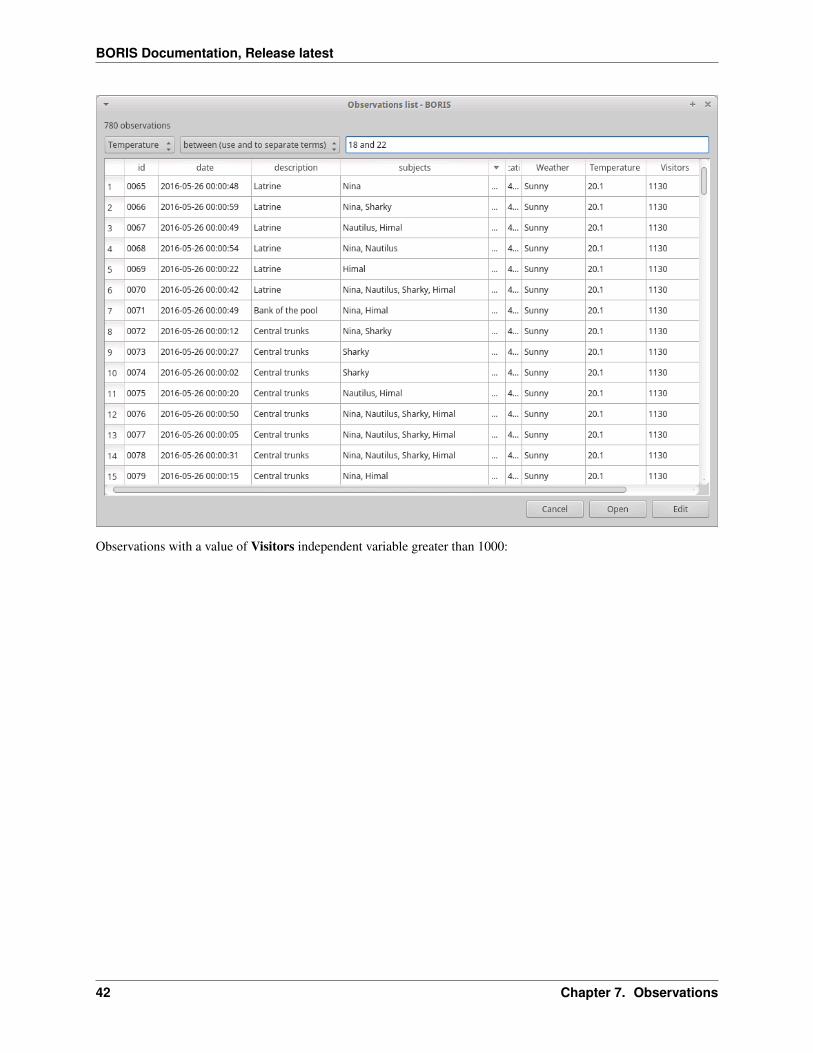
Observations with a value of Temperature independent variable between 18 and 22:
7.2. Observations list 41
BORIS Documentation, Release latest
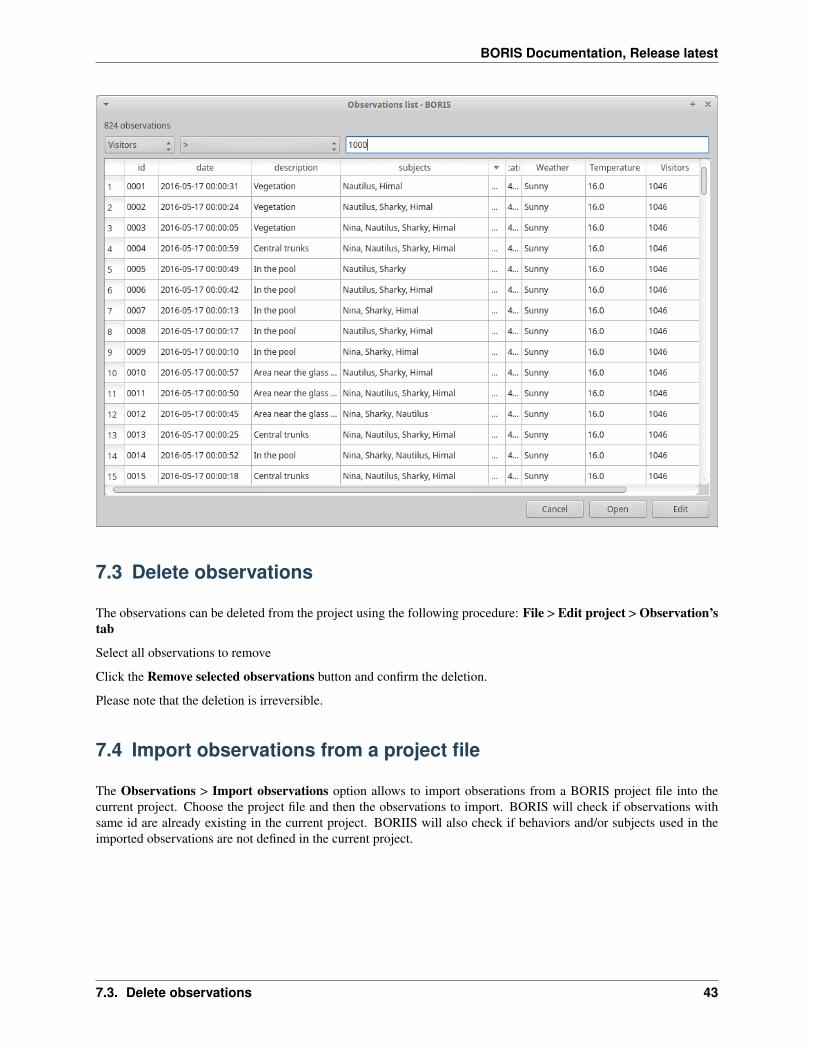
Observations with a value of Visitors independent variable greater than 1000:
42 Chapter 7. Observations
BORIS Documentation, Release latest
7.3 Delete observations
The observations can be deleted from the project using the following procedure: File > Edit project > Observation’stab
Select all observations to remove
Click the Remove selected observations button and confirm the deletion.
Please note that the deletion is irreversible.
7.4 Import observations from a project file
The Observations > Import observations option allows to import obserations from a BORIS project file into thecurrent project. Choose the project file and then the observations to import. BORIS will check if observations withsame id are already existing in the current project. BORIIS will also check if behaviors and/or subjects used in theimported observations are not defined in the current project.
7.3. Delete observations 43

BORIS Documentation, Release latest
44 Chapter 7. Observations
CHAPTER 8
Coding your media
When looking at the BORIS main window, the window title bar shows the Observation id - Project name - BORIS.The media (the first in the queue) will be loaded in the media player and paused.
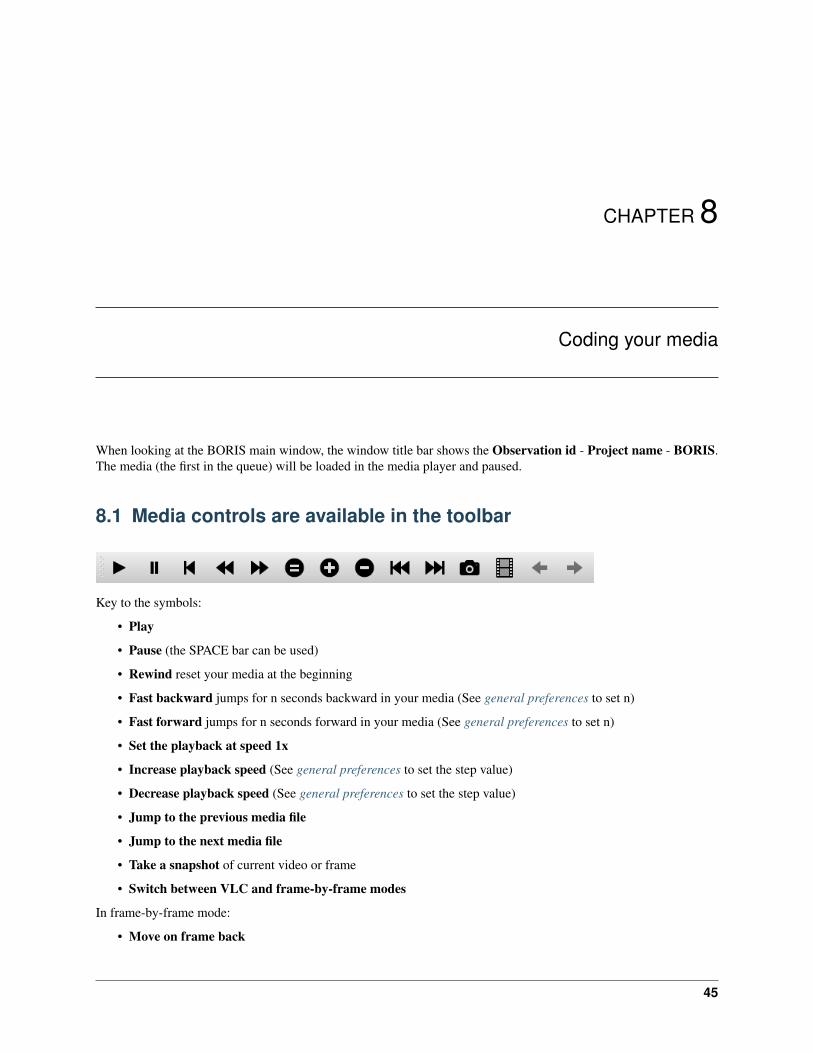
8.1 Media controls are available in the toolbar
Key to the symbols:
• Play
• Pause (the SPACE bar can be used)
• Rewind reset your media at the beginning
• Fast backward jumps for n seconds backward in your media (See general preferences to set n)
• Fast forward jumps for n seconds forward in your media (See general preferences to set n)
• Set the playback at speed 1x
• Increase playback speed (See general preferences to set the step value)
• Decrease playback speed (See general preferences to set the step value)
• Jump to the previous media file
• Jump to the next media file
• Take a snapshot of current video or frame
• Switch between VLC and frame-by-frame modes
In frame-by-frame mode:
• Move on frame back
45
BORIS Documentation, Release latest
• Move one frame forward
The media can be controlled by special keyboard keys:
• Page Up key: switch to the next media
• Page Down key: switch to the previous media
• Up arrow key: jump forward in the current media
• Down arrow key: jump backward in the current media
• ESC: switch between VLC and frame-by-frame mode
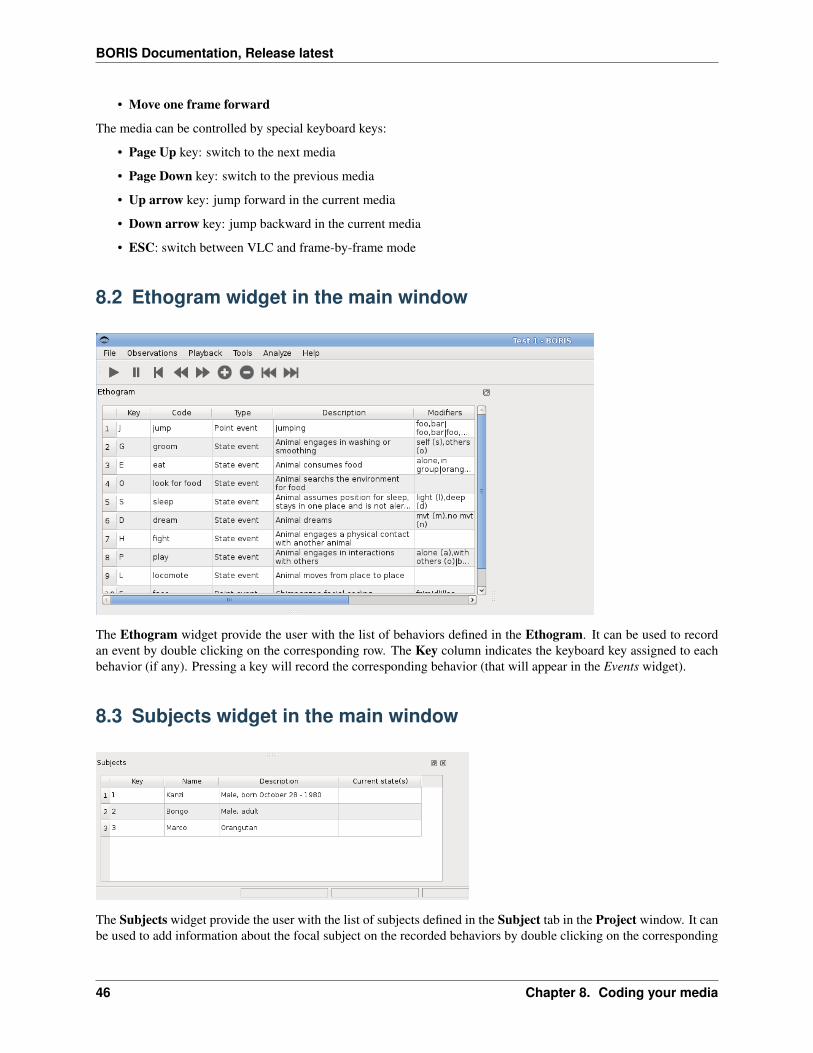
8.2 Ethogram widget in the main window
The Ethogram widget provide the user with the list of behaviors defined in the Ethogram. It can be used to recordan event by double clicking on the corresponding row. The Key column indicates the keyboard key assigned to eachbehavior (if any). Pressing a key will record the corresponding behavior (that will appear in the Events widget).
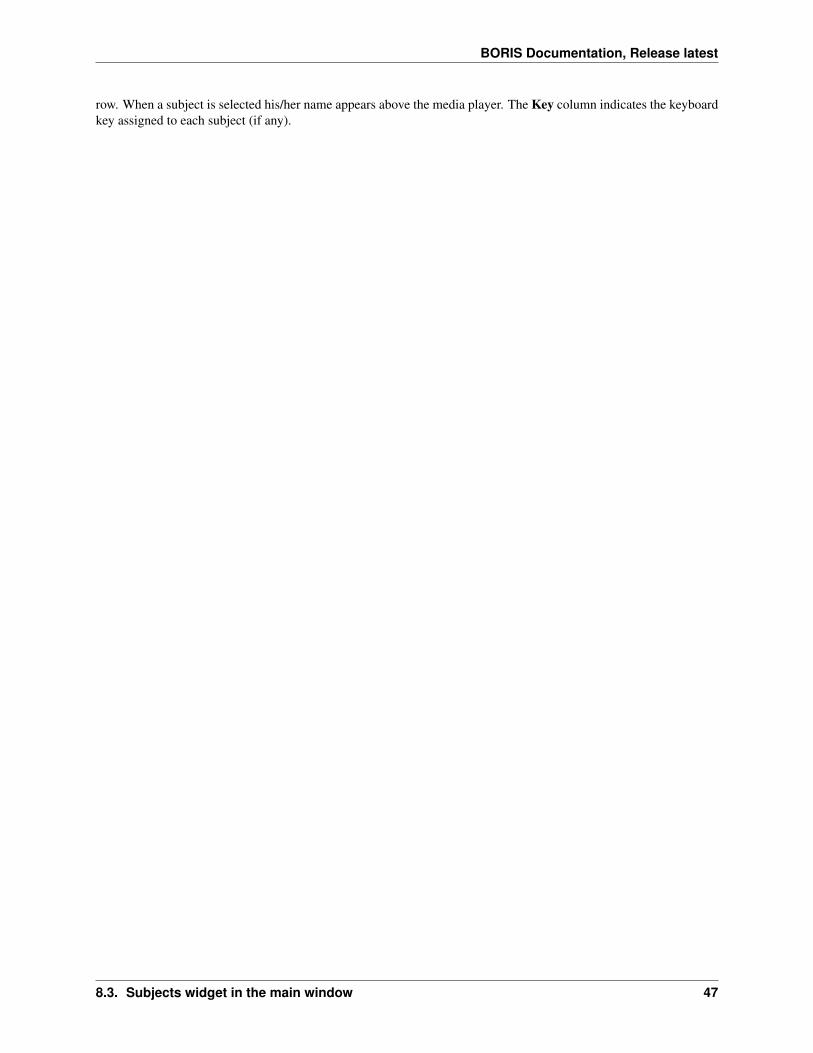
8.3 Subjects widget in the main window
The Subjects widget provide the user with the list of subjects defined in the Subject tab in the Project window. It canbe used to add information about the focal subject on the recorded behaviors by double clicking on the corresponding
46 Chapter 8. Coding your media
BORIS Documentation, Release latest
row. When a subject is selected his/her name appears above the media player. The Key column indicates the keyboardkey assigned to each subject (if any).
8.3. Subjects widget in the main window 47

BORIS Documentation, Release latest
48 Chapter 8. Coding your media
BORIS Documentation, Release latest
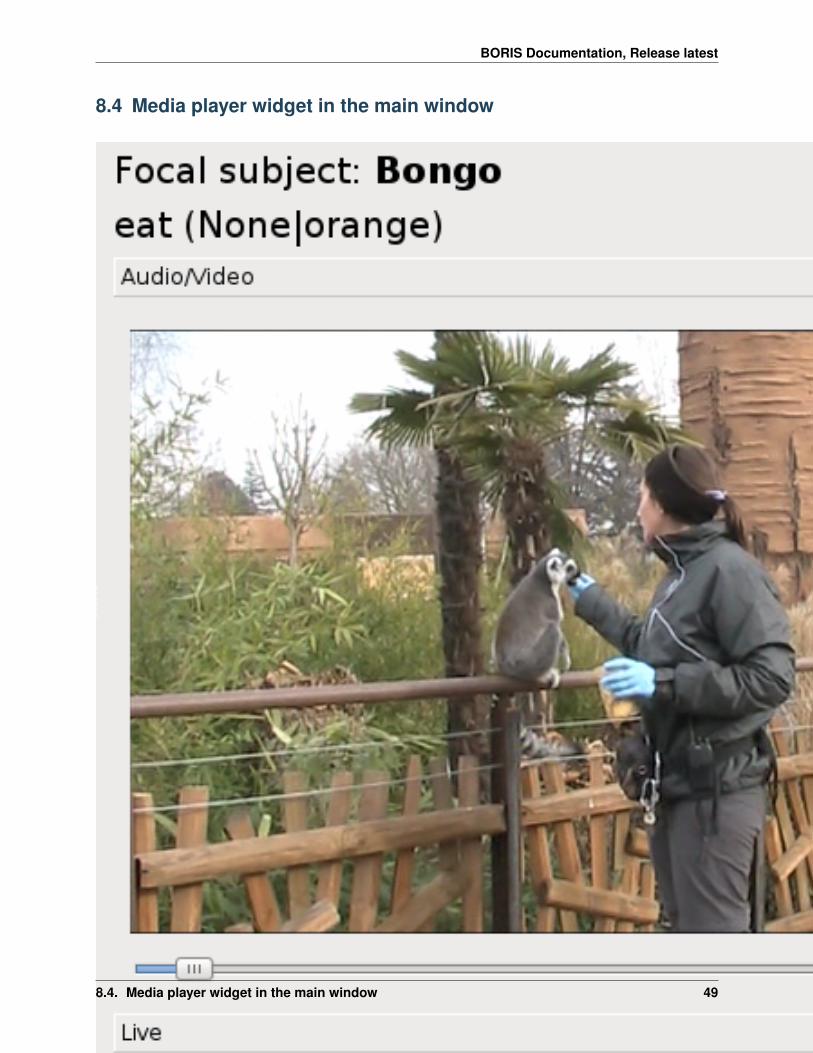
8.4 Media player widget in the main window
8.4. Media player widget in the main window 49
BORIS Documentation, Release latest
The Media player widget has two controls: the media position (horizontal slide bar) and the audio volume (verticalslide bar) provide the user with the list of subjects defined in the Subject tab in the Project window. The horizontalslide bar can be used to navigate the media file.
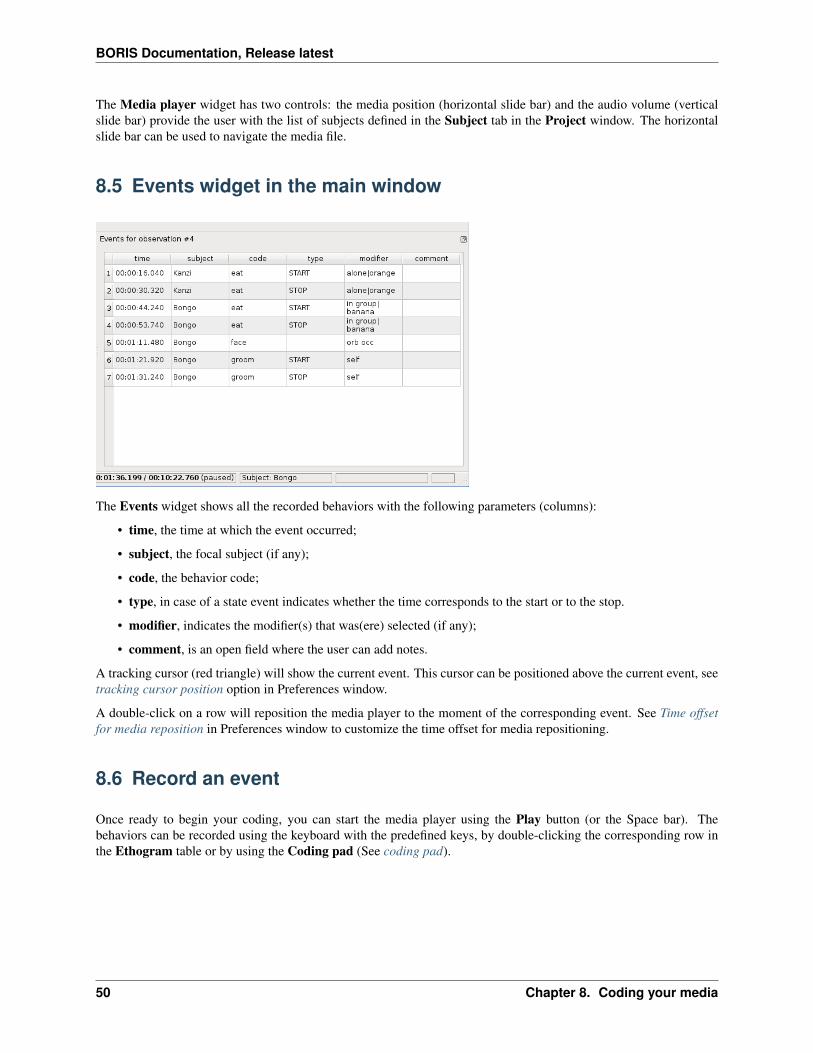
8.5 Events widget in the main window
The Events widget shows all the recorded behaviors with the following parameters (columns):
• time, the time at which the event occurred;
• subject, the focal subject (if any);
• code, the behavior code;
• type, in case of a state event indicates whether the time corresponds to the start or to the stop.
• modifier, indicates the modifier(s) that was(ere) selected (if any);
• comment, is an open field where the user can add notes.
A tracking cursor (red triangle) will show the current event. This cursor can be positioned above the current event, seetracking cursor position option in Preferences window.
A double-click on a row will reposition the media player to the moment of the corresponding event. See Time offsetfor media reposition in Preferences window to customize the time offset for media repositioning.
8.6 Record an event
Once ready to begin your coding, you can start the media player using the Play button (or the Space bar). Thebehaviors can be recorded using the keyboard with the predefined keys, by double-clicking the corresponding row inthe Ethogram table or by using the Coding pad (See coding pad).
50 Chapter 8. Coding your media
BORIS Documentation, Release latest
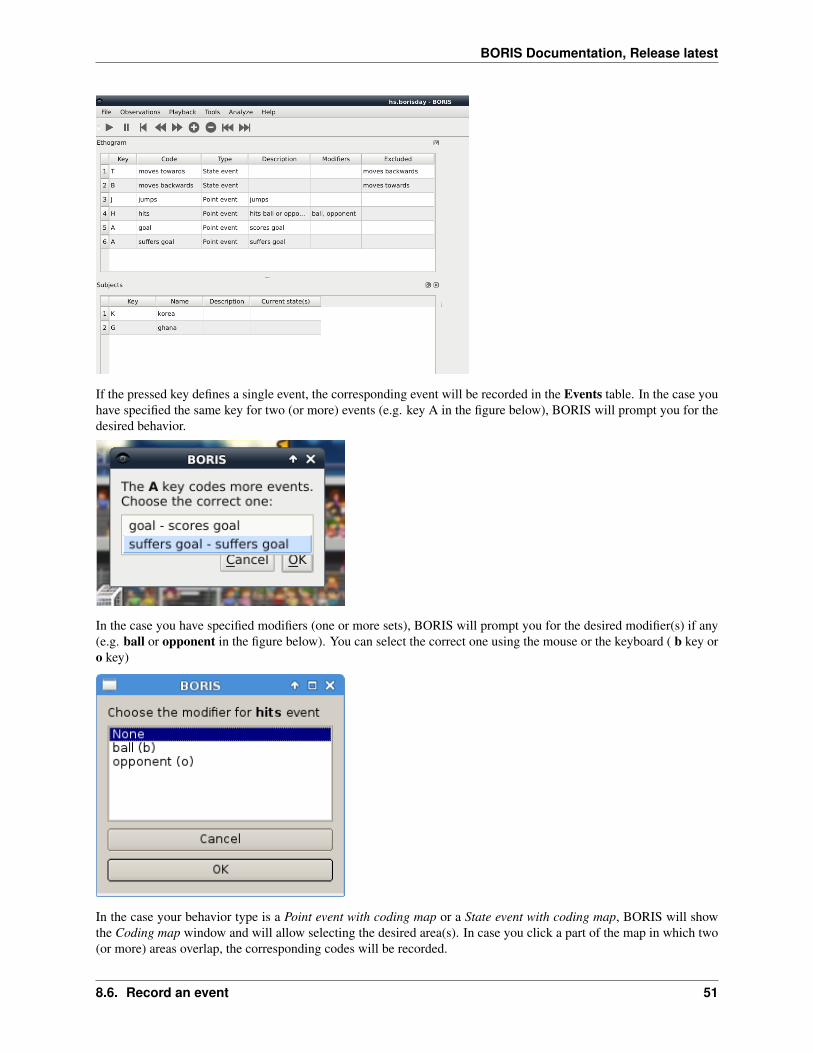
If the pressed key defines a single event, the corresponding event will be recorded in the Events table. In the case youhave specified the same key for two (or more) events (e.g. key A in the figure below), BORIS will prompt you for thedesired behavior.
In the case you have specified modifiers (one or more sets), BORIS will prompt you for the desired modifier(s) if any(e.g. ball or opponent in the figure below). You can select the correct one using the mouse or the keyboard ( b key oro key)
In the case your behavior type is a Point event with coding map or a State event with coding map, BORIS will showthe Coding map window and will allow selecting the desired area(s). In case you click a part of the map in which two(or more) areas overlap, the corresponding codes will be recorded.
8.6. Record an event 51
BORIS Documentation, Release latest
A recorded event can be edited (once selected) using the Observations > Edit event menu option. The resulting Editevent parameters allows modifying every parameter (e.g. time, subject, code, modifiers, and comment).
The Observations > Add event menu option allows adding a new event by specifying its time and the other parame-ters.
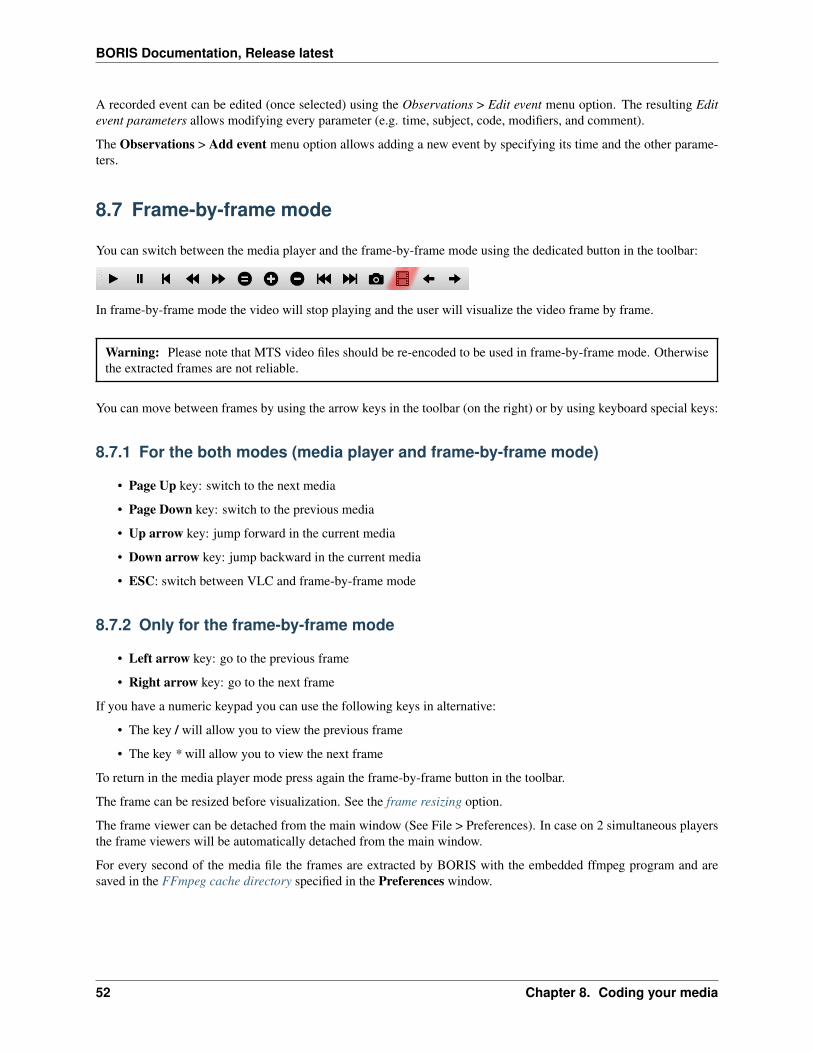
8.7 Frame-by-frame mode
You can switch between the media player and the frame-by-frame mode using the dedicated button in the toolbar:
In frame-by-frame mode the video will stop playing and the user will visualize the video frame by frame.
Warning: Please note that MTS video files should be re-encoded to be used in frame-by-frame mode. Otherwisethe extracted frames are not reliable.
You can move between frames by using the arrow keys in the toolbar (on the right) or by using keyboard special keys:
8.7.1 For the both modes (media player and frame-by-frame mode)
• Page Up key: switch to the next media
• Page Down key: switch to the previous media
• Up arrow key: jump forward in the current media
• Down arrow key: jump backward in the current media
• ESC: switch between VLC and frame-by-frame mode
8.7.2 Only for the frame-by-frame mode
• Left arrow key: go to the previous frame
• Right arrow key: go to the next frame
If you have a numeric keypad you can use the following keys in alternative:
• The key / will allow you to view the previous frame
• The key * will allow you to view the next frame
To return in the media player mode press again the frame-by-frame button in the toolbar.
The frame can be resized before visualization. See the frame resizing option.
The frame viewer can be detached from the main window (See File > Preferences). In case on 2 simultaneous playersthe frame viewers will be automatically detached from the main window.
For every second of the media file the frames are extracted by BORIS with the embedded ffmpeg program and aresaved in the FFmpeg cache directory specified in the Preferences window.
52 Chapter 8. Coding your media
CHAPTER 9
Exporting events data
The coded events can be exported in various format (Observations > Export ?):
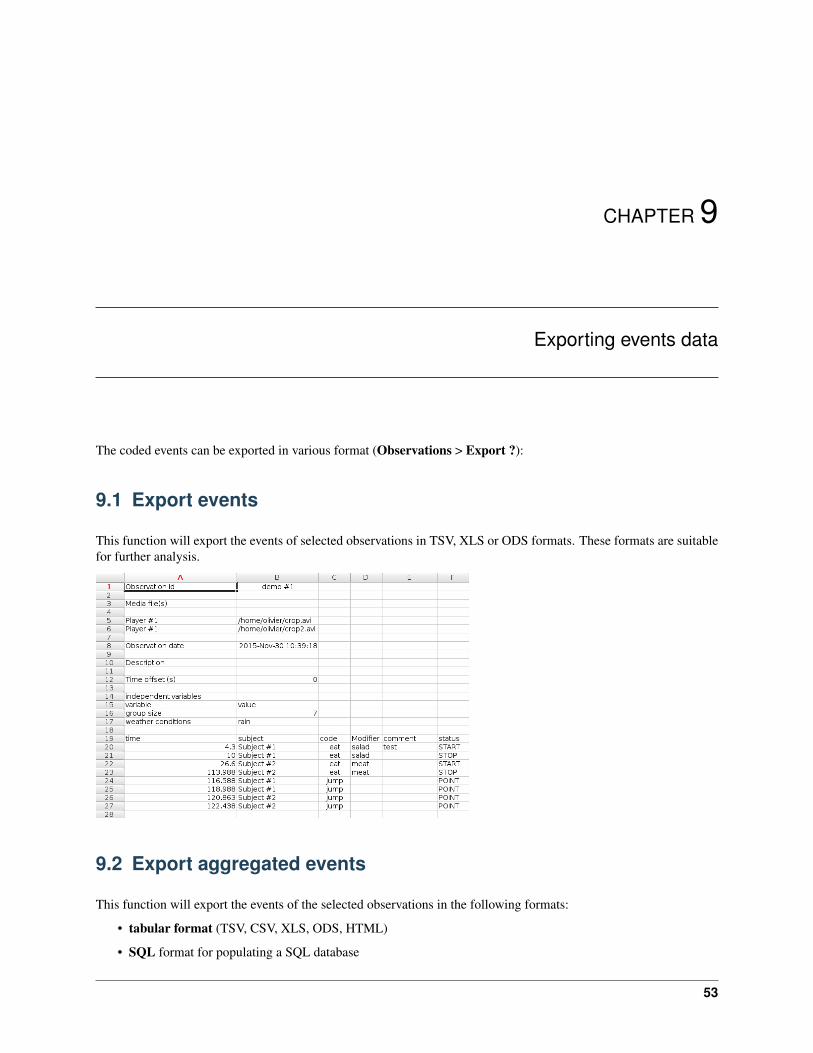
9.1 Export events
This function will export the events of selected observations in TSV, XLS or ODS formats. These formats are suitablefor further analysis.
9.2 Export aggregated events
This function will export the events of the selected observations in the following formats:
• tabular format (TSV, CSV, XLS, ODS, HTML)
• SQL format for populating a SQL database
53
BORIS Documentation, Release latest
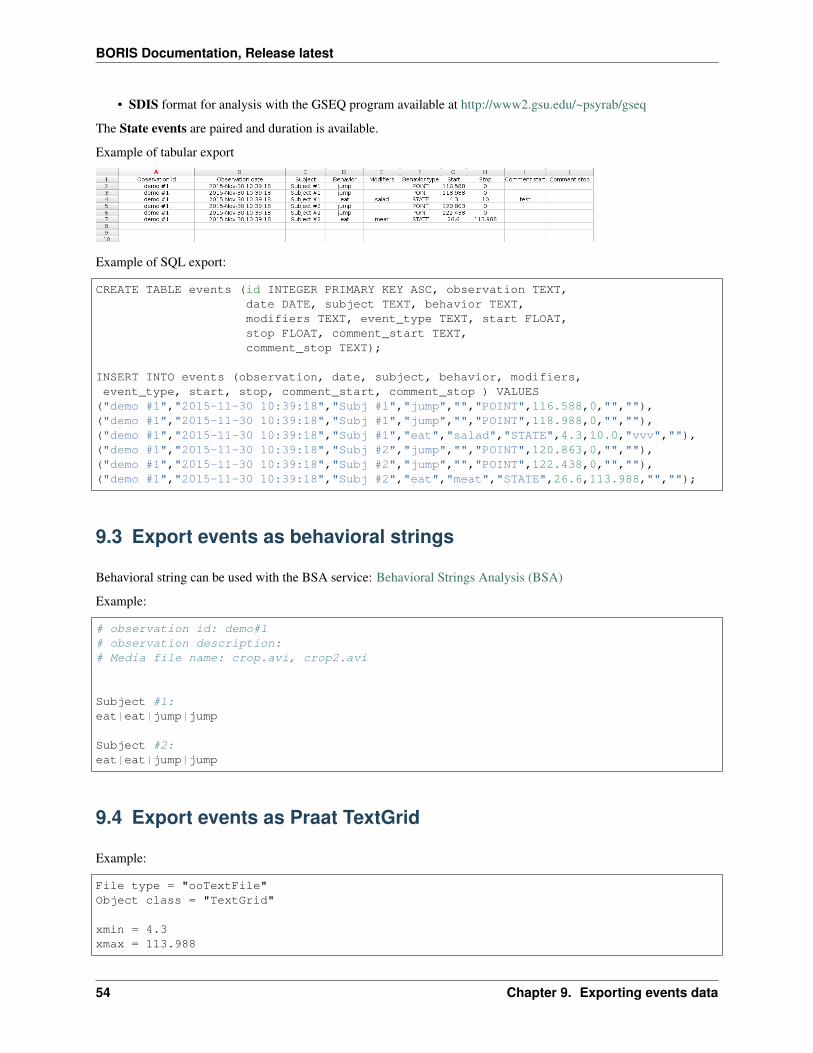
• SDIS format for analysis with the GSEQ program available at http://www2.gsu.edu/~psyrab/gseq
The State events are paired and duration is available.
Example of tabular export
Example of SQL export:
CREATE TABLE events (id INTEGER PRIMARY KEY ASC, observation TEXT,date DATE, subject TEXT, behavior TEXT,modifiers TEXT, event_type TEXT, start FLOAT,stop FLOAT, comment_start TEXT,comment_stop TEXT);
INSERT INTO events (observation, date, subject, behavior, modifiers,event_type, start, stop, comment_start, comment_stop ) VALUES
("demo #1","2015-11-30 10:39:18","Subj #1","jump","","POINT",116.588,0,"",""),("demo #1","2015-11-30 10:39:18","Subj #1","jump","","POINT",118.988,0,"",""),("demo #1","2015-11-30 10:39:18","Subj #1","eat","salad","STATE",4.3,10.0,"vvv",""),("demo #1","2015-11-30 10:39:18","Subj #2","jump","","POINT",120.863,0,"",""),("demo #1","2015-11-30 10:39:18","Subj #2","jump","","POINT",122.438,0,"",""),("demo #1","2015-11-30 10:39:18","Subj #2","eat","meat","STATE",26.6,113.988,"","");
9.3 Export events as behavioral strings
Behavioral string can be used with the BSA service: Behavioral Strings Analysis (BSA)
Example:
# observation id: demo#1# observation description:# Media file name: crop.avi, crop2.avi
Subject #1:eat|eat|jump|jump
Subject #2:eat|eat|jump|jump
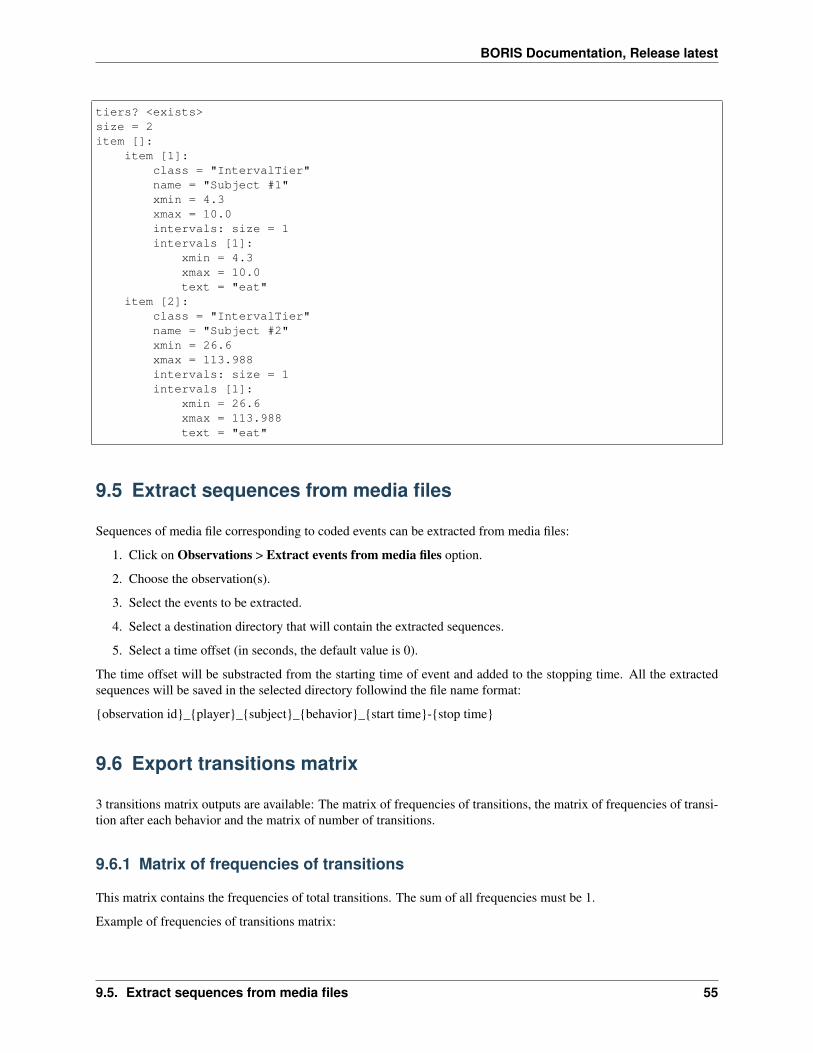
9.4 Export events as Praat TextGrid
Example:
File type = "ooTextFile"Object class = "TextGrid"
xmin = 4.3xmax = 113.988
54 Chapter 9. Exporting events data
BORIS Documentation, Release latest
tiers? <exists>size = 2item []:
item [1]:class = "IntervalTier"name = "Subject #1"xmin = 4.3xmax = 10.0intervals: size = 1intervals [1]:
xmin = 4.3xmax = 10.0text = "eat"
item [2]:class = "IntervalTier"name = "Subject #2"xmin = 26.6xmax = 113.988intervals: size = 1intervals [1]:
xmin = 26.6xmax = 113.988text = "eat"
9.5 Extract sequences from media files
Sequences of media file corresponding to coded events can be extracted from media files:
1. Click on Observations > Extract events from media files option.
2. Choose the observation(s).
3. Select the events to be extracted.
4. Select a destination directory that will contain the extracted sequences.
5. Select a time offset (in seconds, the default value is 0).
The time offset will be substracted from the starting time of event and added to the stopping time. All the extractedsequences will be saved in the selected directory followind the file name format:
{observation id}_{player}_{subject}_{behavior}_{start time}-{stop time}
9.6 Export transitions matrix
3 transitions matrix outputs are available: The matrix of frequencies of transitions, the matrix of frequencies of transi-tion after each behavior and the matrix of number of transitions.
9.6.1 Matrix of frequencies of transitions
This matrix contains the frequencies of total transitions. The sum of all frequencies must be 1.
Example of frequencies of transitions matrix:
9.5. Extract sequences from media files 55

BORIS Documentation, Release latest
eat sleep walkeat 0.0 0.286 0.143sleep 0.143 0.0 0.143walk 0.286 0.0 0.0
In this matrix you can see that the eat behavior precedes the sleep behavior with a frequency of 0.286 of the totalnumber of transitions.
9.6.2 Matrix of frequencies of transitions after behavior
This matrix contains the frequencies of transitions after each behavior. The sum of each row must be 1.
Example:
eat sleep walkeat 0.0 0.667 0.333sleep 0.5 0.0 0.5walk 1.0 0.0 0.0
In this example you can see that sleep follows eat with a frequency of 0.667 and walk follows with a frequency of0.333.
9.6.3 Matrix of number of transitions
This matrix contains the number of transitions after each behavior.
Example:
eat sleep walkeat 0 2 1sleep 1 0 1walk 2 0 0
56 Chapter 9. Exporting events data
CHAPTER 10
Playback menu
10.1 Jump
10.1.1 Jump forward
Allow to jump forward in the current media file. See File > Preferences for setting the jump value.
10.1.2 Jump backward
Allow to jump backward in the current media file. See File > Preferences for setting the jump value.
10.1.3 Jump to specific time
Allow to go to a specific time in the current media file.
10.2 Zoom
Allow to zoom into the current video file. The available zoom values are: 1:2, 1:4, 2:1 and 1:1. Fit to window adaptsthe zoom value to the current window size. In case of simultaneous playing you can set different values of zoom inplayer #1 and player #2.
The Zoom option is not available in frame-by-frame mode.
The Zoom function is not working on Mac
57

BORIS Documentation, Release latest
58 Chapter 10. Playback menu
CHAPTER 11
Tools
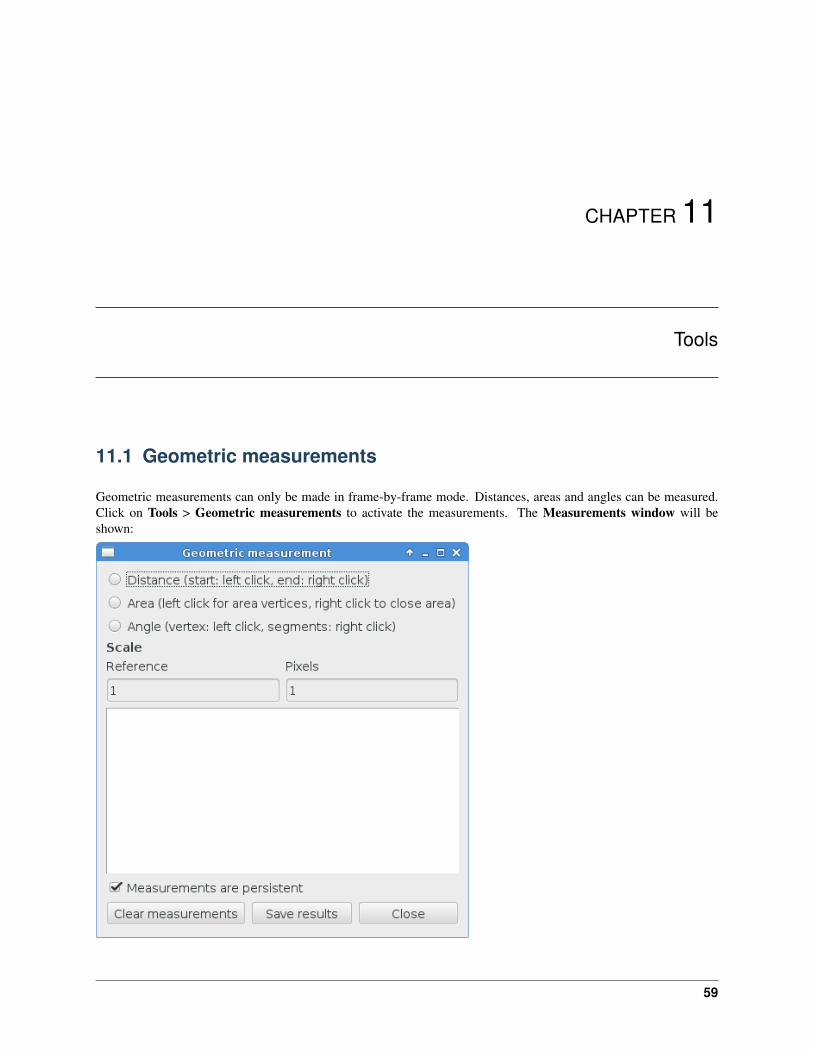
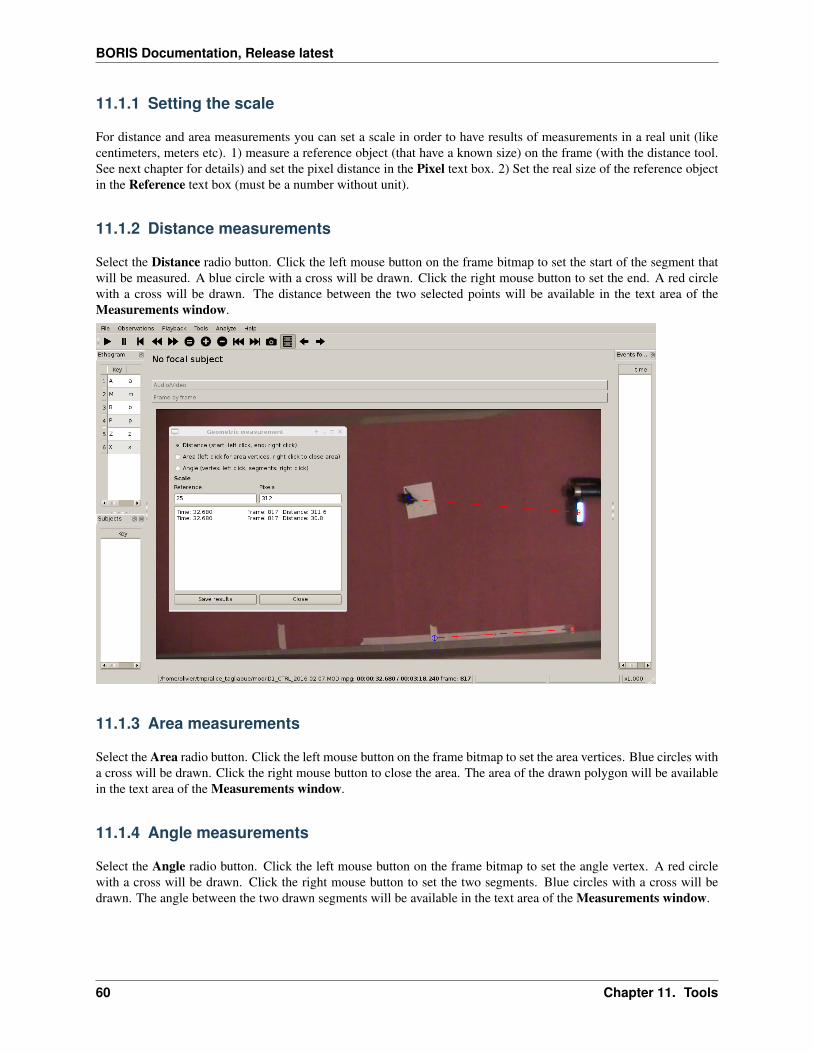
11.1 Geometric measurements
Geometric measurements can only be made in frame-by-frame mode. Distances, areas and angles can be measured.Click on Tools > Geometric measurements to activate the measurements. The Measurements window will beshown:
59
BORIS Documentation, Release latest
11.1.1 Setting the scale
For distance and area measurements you can set a scale in order to have results of measurements in a real unit (likecentimeters, meters etc). 1) measure a reference object (that have a known size) on the frame (with the distance tool.See next chapter for details) and set the pixel distance in the Pixel text box. 2) Set the real size of the reference objectin the Reference text box (must be a number without unit).
11.1.2 Distance measurements
Select the Distance radio button. Click the left mouse button on the frame bitmap to set the start of the segment thatwill be measured. A blue circle with a cross will be drawn. Click the right mouse button to set the end. A red circlewith a cross will be drawn. The distance between the two selected points will be available in the text area of theMeasurements window.
11.1.3 Area measurements
Select the Area radio button. Click the left mouse button on the frame bitmap to set the area vertices. Blue circles witha cross will be drawn. Click the right mouse button to close the area. The area of the drawn polygon will be availablein the text area of the Measurements window.
11.1.4 Angle measurements
Select the Angle radio button. Click the left mouse button on the frame bitmap to set the angle vertex. A red circlewith a cross will be drawn. Click the right mouse button to set the two segments. Blue circles with a cross will bedrawn. The angle between the two drawn segments will be available in the text area of the Measurements window.
60 Chapter 11. Tools
BORIS Documentation, Release latest
11.1.5 Persistent measurements
If the Measurements are persistent checkbox is checked the measurement schemes will be available on all framesotherwise they will be deleted between frames.
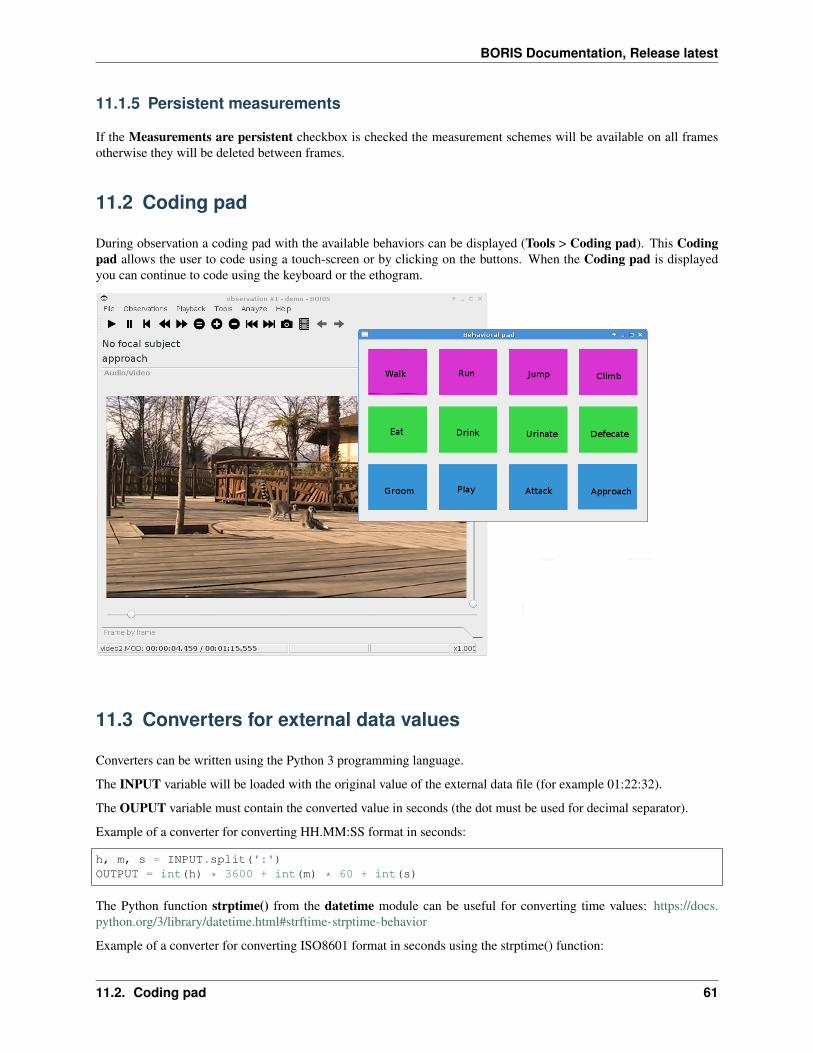
11.2 Coding pad
During observation a coding pad with the available behaviors can be displayed (Tools > Coding pad). This Codingpad allows the user to code using a touch-screen or by clicking on the buttons. When the Coding pad is displayedyou can continue to code using the keyboard or the ethogram.
11.3 Converters for external data values
Converters can be written using the Python 3 programming language.
The INPUT variable will be loaded with the original value of the external data file (for example 01:22:32).
The OUPUT variable must contain the converted value in seconds (the dot must be used for decimal separator).
Example of a converter for converting HH.MM:SS format in seconds:
h, m, s = INPUT.split(':')OUTPUT = int(h) * 3600 + int(m) * 60 + int(s)
The Python function strptime() from the datetime module can be useful for converting time values: https://docs.python.org/3/library/datetime.html#strftime-strptime-behavior
Example of a converter for converting ISO8601 format in seconds using the strptime() function:
11.2. Coding pad 61
BORIS Documentation, Release latest
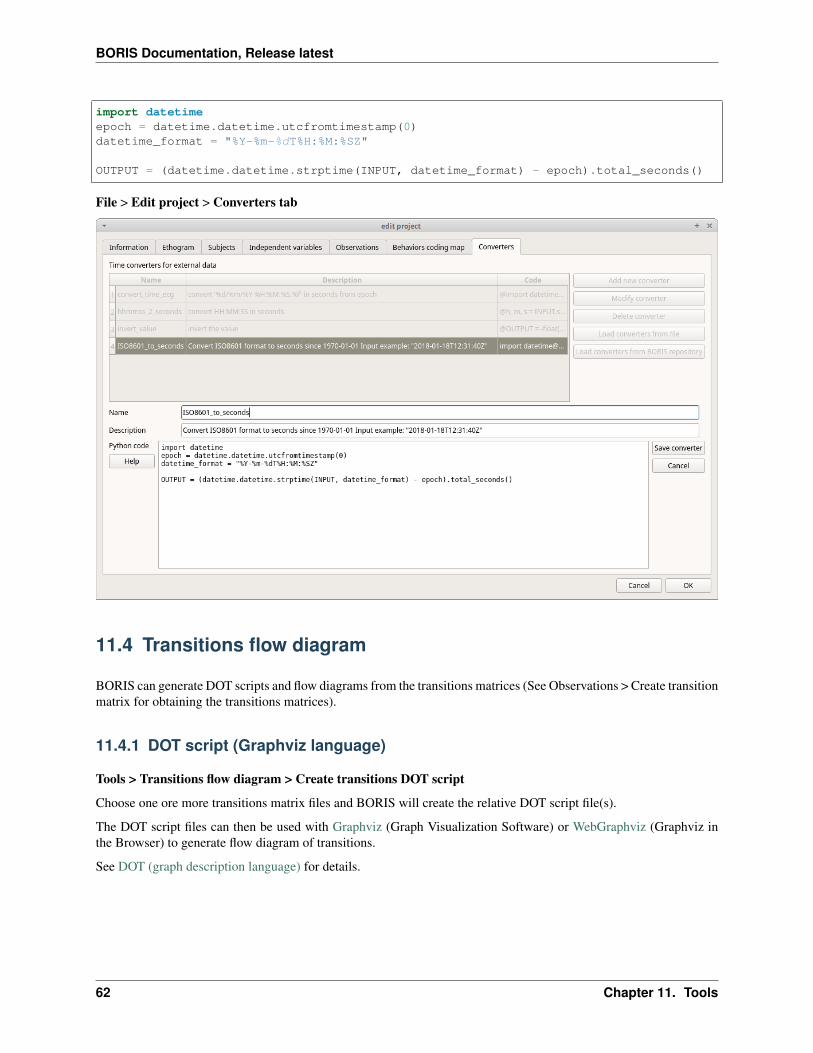
import datetimeepoch = datetime.datetime.utcfromtimestamp(0)datetime_format = "%Y-%m-%dT%H:%M:%SZ"
OUTPUT = (datetime.datetime.strptime(INPUT, datetime_format) - epoch).total_seconds()
File > Edit project > Converters tab
11.4 Transitions flow diagram
BORIS can generate DOT scripts and flow diagrams from the transitions matrices (See Observations > Create transitionmatrix for obtaining the transitions matrices).
11.4.1 DOT script (Graphviz language)
Tools > Transitions flow diagram > Create transitions DOT script
Choose one ore more transitions matrix files and BORIS will create the relative DOT script file(s).
The DOT script files can then be used with Graphviz (Graph Visualization Software) or WebGraphviz (Graphviz inthe Browser) to generate flow diagram of transitions.
See DOT (graph description language) for details.
62 Chapter 11. Tools
BORIS Documentation, Release latest
11.4.2 Flow diagram
If Graphviz (Graph Visualization Software) is installed on your system (and the dot program available in the path)BORIS can generate flow diagram (PNG format) from a transitions matrix file.
Tools > Transitions flow diagram > Create transitions flow diagram
Choose one ore more transition matrix files and BORIS will create the relative flow diagram.
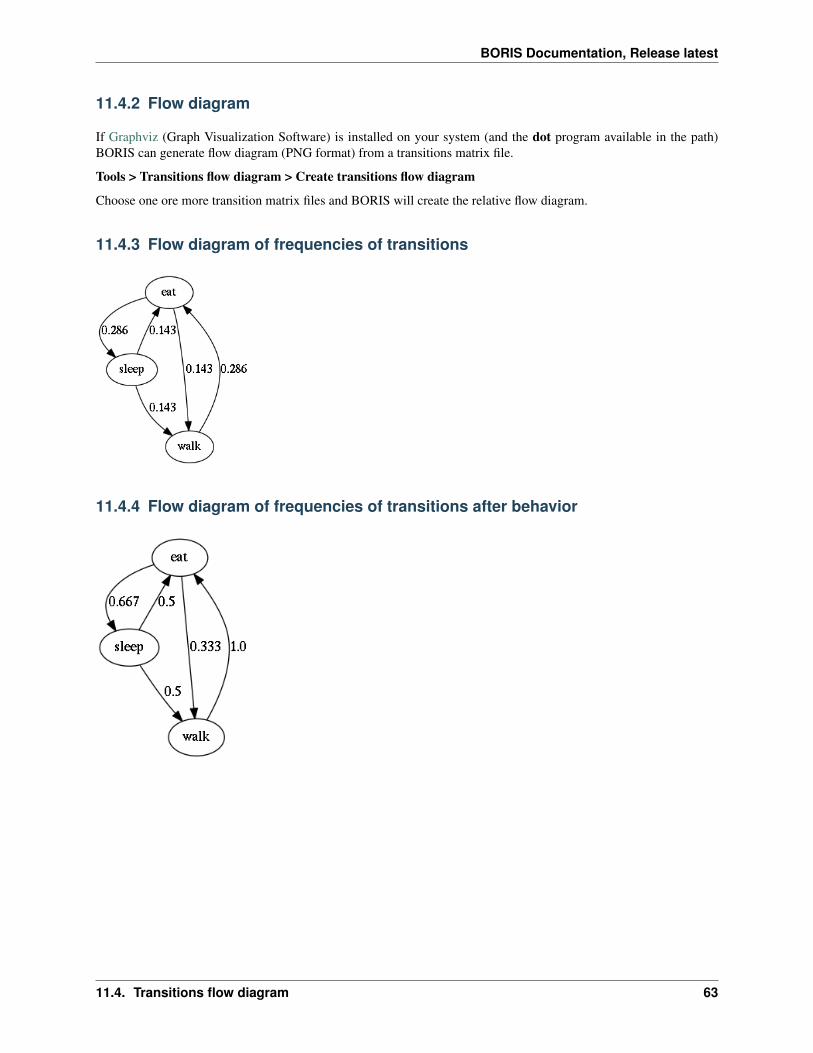
11.4.3 Flow diagram of frequencies of transitions
11.4.4 Flow diagram of frequencies of transitions after behavior
11.4. Transitions flow diagram 63
BORIS Documentation, Release latest
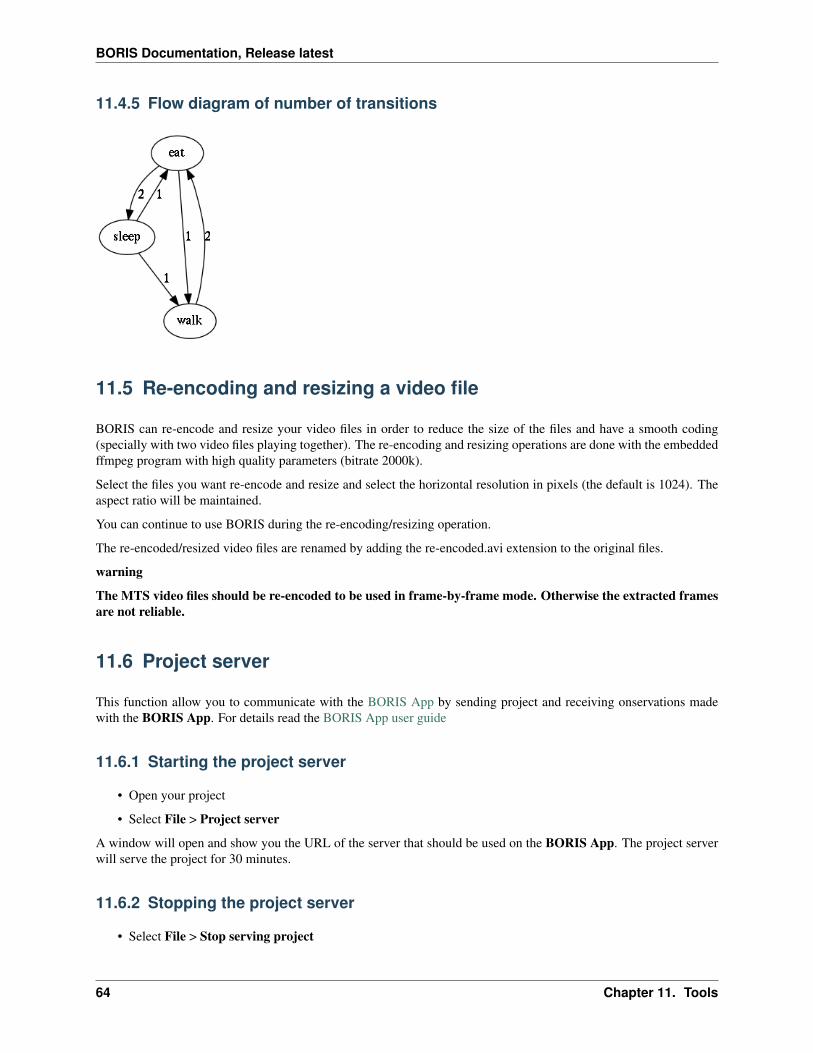
11.4.5 Flow diagram of number of transitions
11.5 Re-encoding and resizing a video file
BORIS can re-encode and resize your video files in order to reduce the size of the files and have a smooth coding(specially with two video files playing together). The re-encoding and resizing operations are done with the embeddedffmpeg program with high quality parameters (bitrate 2000k).
Select the files you want re-encode and resize and select the horizontal resolution in pixels (the default is 1024). Theaspect ratio will be maintained.
You can continue to use BORIS during the re-encoding/resizing operation.
The re-encoded/resized video files are renamed by adding the re-encoded.avi extension to the original files.
warning
The MTS video files should be re-encoded to be used in frame-by-frame mode. Otherwise the extracted framesare not reliable.
11.6 Project server
This function allow you to communicate with the BORIS App by sending project and receiving onservations madewith the BORIS App. For details read the BORIS App user guide
11.6.1 Starting the project server
• Open your project
• Select File > Project server
A window will open and show you the URL of the server that should be used on the BORIS App. The project serverwill serve the project for 30 minutes.
11.6.2 Stopping the project server
• Select File > Stop serving project
64 Chapter 11. Tools
CHAPTER 12
Coding map
A coding map is a bitmap image with user-defined clickable areas that will help to code for behaviors or modifiers fora behavior.
2 types of coding maps are available:
• Behaviors coding map
• Modifiers coding map
12.1 The Behaviors coding map
BORIS allows creating a Behaviors coding map using the Map creator tool (Tools > Create a coding map > forbehaviors).
A Behaviors coding map can be created only if you have defined behaviors in your ethogram.
12.1.1 Creating a Behaviors coding map
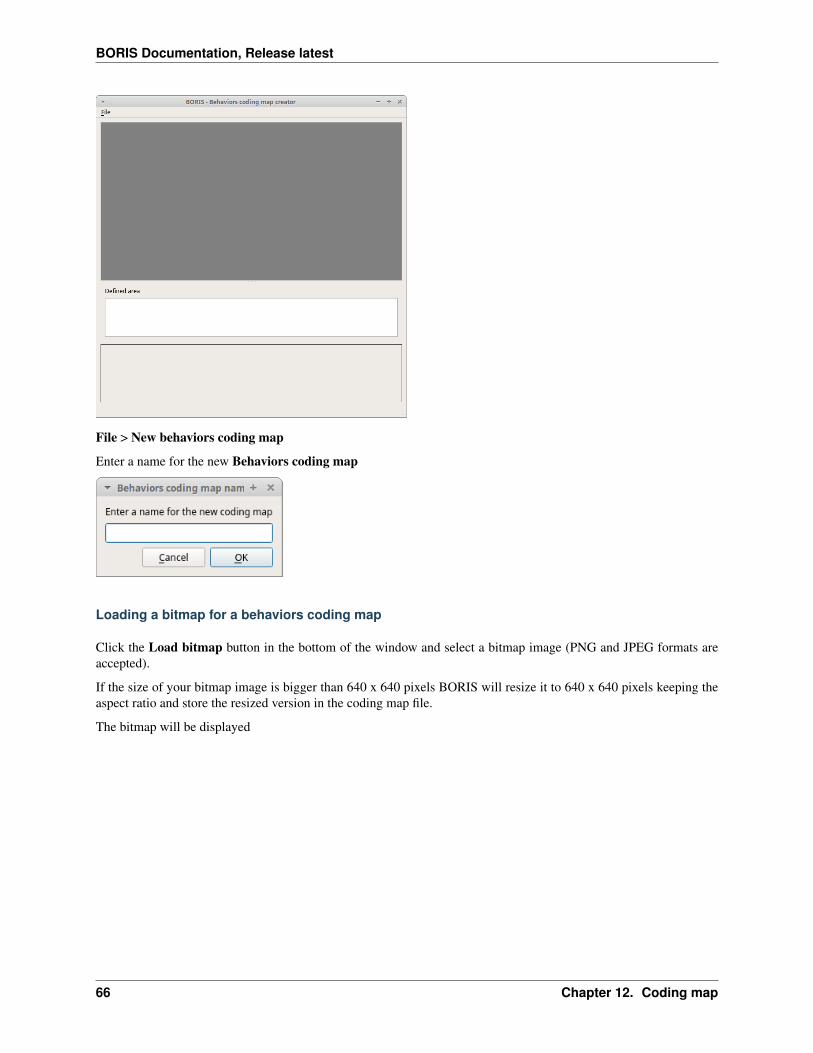
To create a new Behaviors coding map launch the Behaviors coding map creator
Tools > Create a coding map > for behaviors).
A new window will open
65
BORIS Documentation, Release latest
File > New behaviors coding map
Enter a name for the new Behaviors coding map
Loading a bitmap for a behaviors coding map
Click the Load bitmap button in the bottom of the window and select a bitmap image (PNG and JPEG formats areaccepted).
If the size of your bitmap image is bigger than 640 x 640 pixels BORIS will resize it to 640 x 640 pixels keeping theaspect ratio and store the resized version in the coding map file.
The bitmap will be displayed
66 Chapter 12. Coding map
BORIS Documentation, Release latest
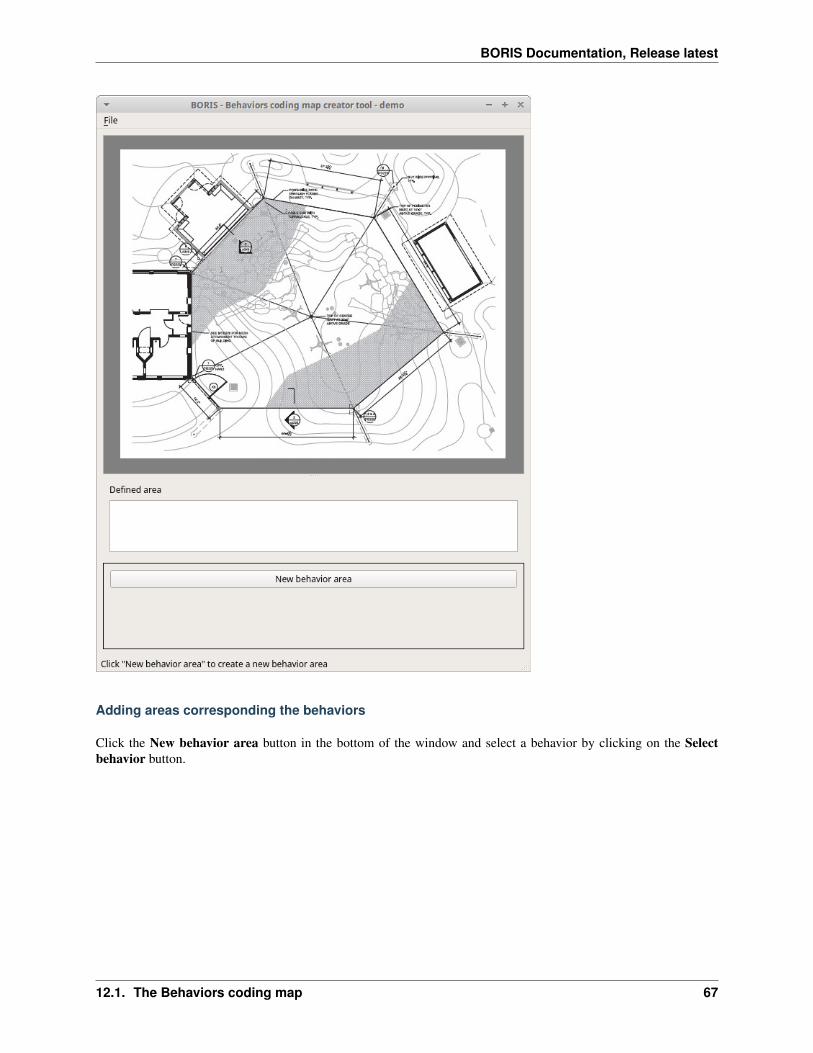
Adding areas corresponding the behaviors
Click the New behavior area button in the bottom of the window and select a behavior by clicking on the Selectbehavior button.
12.1. The Behaviors coding map 67
BORIS Documentation, Release latest
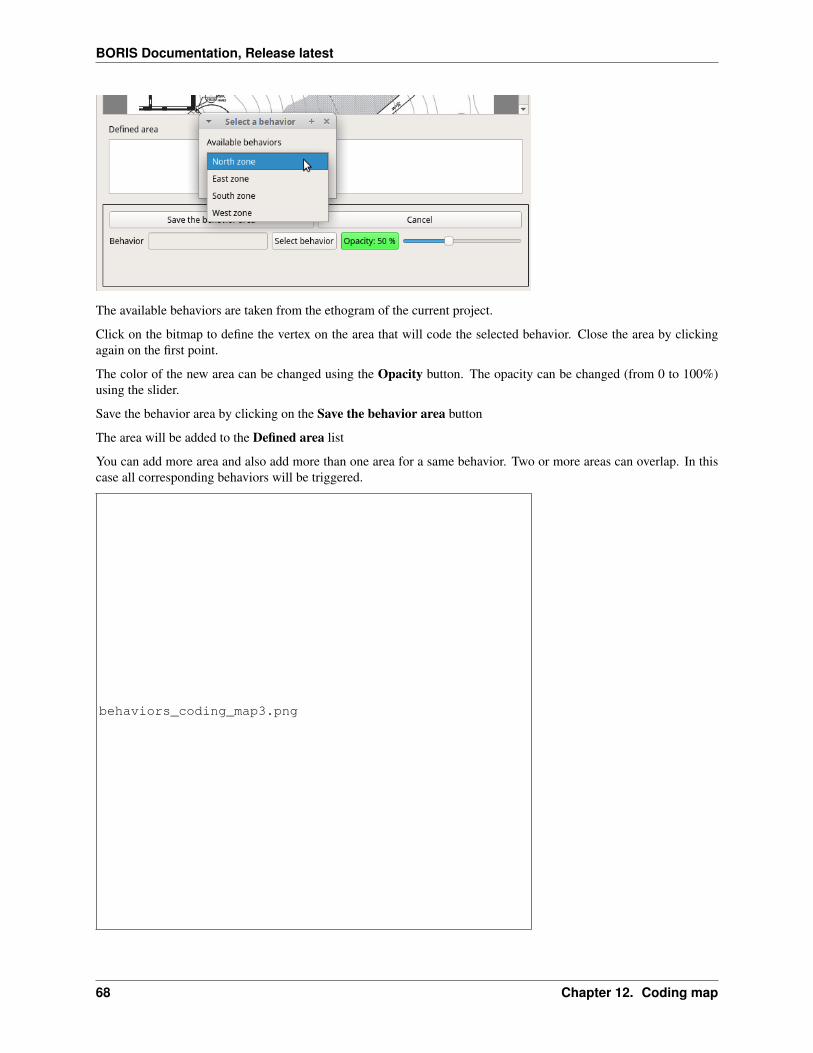
The available behaviors are taken from the ethogram of the current project.
Click on the bitmap to define the vertex on the area that will code the selected behavior. Close the area by clickingagain on the first point.
The color of the new area can be changed using the Opacity button. The opacity can be changed (from 0 to 100%)using the slider.
Save the behavior area by clicking on the Save the behavior area button
The area will be added to the Defined area list
You can add more area and also add more than one area for a same behavior. Two or more areas can overlap. In thiscase all corresponding behaviors will be triggered.
behaviors_coding_map3.png
68 Chapter 12. Coding map
BORIS Documentation, Release latest
Add the Behaviors coding map to the current project
File > Add coding map to project
The coding map will be added to the current project
You can add a Behaviors coding map to the current project from a file containing the coding map:
(File > Edit project > Behaviors coding map > Add a behaviors coding map )
Saving the Behaviors coding map
Saving the Behaviors coding map will create a file containing the Behaviors coding map including the bitmap image.
File > Save the current Behaviors coding map
The file containing the Behaviors coding map can be then reloaded in the Behaviors coding map creator or addedto a BORIS project (File > Edit project > Behaviors coding map > Add a behaviors coding map )
12.2 The Modifiers coding map
BORIS allows creating a modifiers coding map using the Modifiers Map creator tool (Tools > Create a coding map> for modifiers.) Clickable areas may correspond to specific modifiers that can be meaningful for the behavioralcoding. Facial expression is the case we thought to when developing this function.
12.2.1 Creating a modifiers coding map
Loading a bitmap for a modifiers coding map
To create a new Modifiers coding map, launch the Modifiers Map creator tool (Tools > Create a coding map > formodifiers). The BORIS main window will be replaced by the Modifiers Map creator window. Click on ModifiersMap creator > New Modifiers map and enter a name for the new map in the edit box. You have to load a bitmapimage (JPEG or PNG) using the Load bitmap button. The loaded image will be displayed.
12.2. The Modifiers coding map 69
BORIS Documentation, Release latest
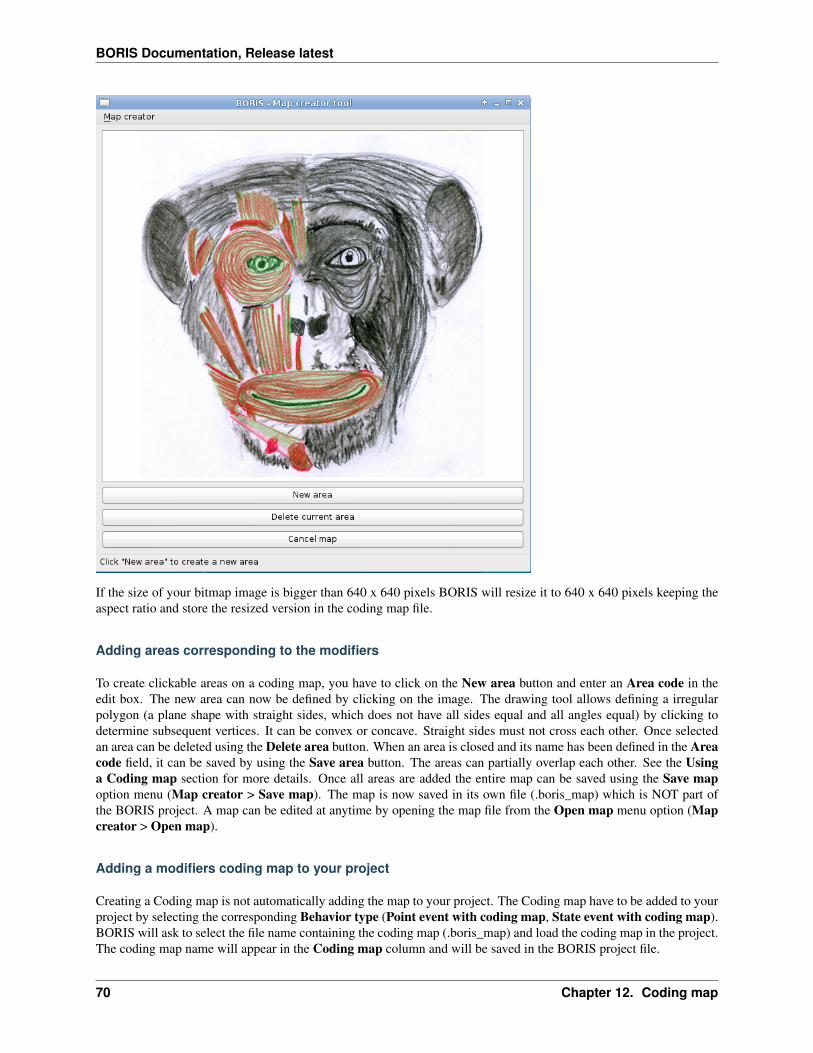
If the size of your bitmap image is bigger than 640 x 640 pixels BORIS will resize it to 640 x 640 pixels keeping theaspect ratio and store the resized version in the coding map file.
Adding areas corresponding to the modifiers
To create clickable areas on a coding map, you have to click on the New area button and enter an Area code in theedit box. The new area can now be defined by clicking on the image. The drawing tool allows defining a irregularpolygon (a plane shape with straight sides, which does not have all sides equal and all angles equal) by clicking todetermine subsequent vertices. It can be convex or concave. Straight sides must not cross each other. Once selectedan area can be deleted using the Delete area button. When an area is closed and its name has been defined in the Areacode field, it can be saved by using the Save area button. The areas can partially overlap each other. See the Usinga Coding map section for more details. Once all areas are added the entire map can be saved using the Save mapoption menu (Map creator > Save map). The map is now saved in its own file (.boris_map) which is NOT part ofthe BORIS project. A map can be edited at anytime by opening the map file from the Open map menu option (Mapcreator > Open map).
Adding a modifiers coding map to your project
Creating a Coding map is not automatically adding the map to your project. The Coding map have to be added to yourproject by selecting the corresponding Behavior type (Point event with coding map, State event with coding map).BORIS will ask to select the file name containing the coding map (.boris_map) and load the coding map in the project.The coding map name will appear in the Coding map column and will be saved in the BORIS project file.
70 Chapter 12. Coding map
BORIS Documentation, Release latest
NOTE: If you later modify your coding map you must reload the new version in your BORIS project.
12.2. The Modifiers coding map 71

BORIS Documentation, Release latest
72 Chapter 12. Coding map
CHAPTER 13
Analysis
13.1 Time budget
The Time budget analysis can be done by behavior or by category of behaviors. Choose the option from the Analysismenu.
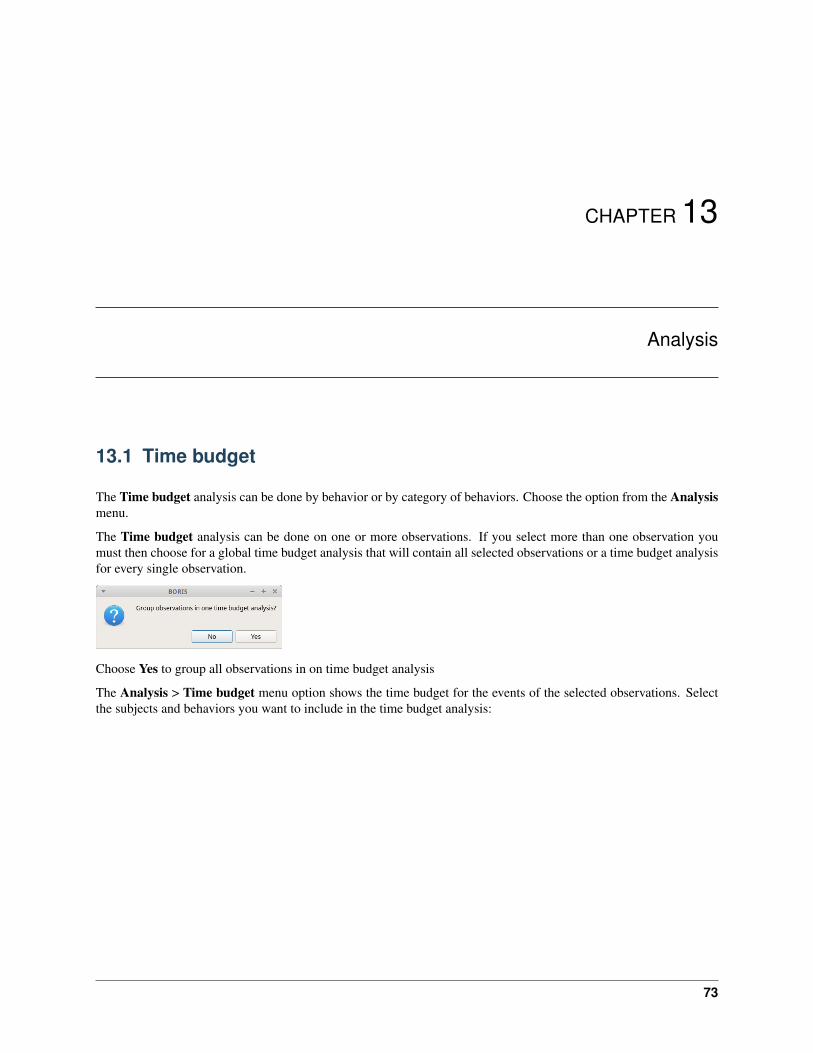
The Time budget analysis can be done on one or more observations. If you select more than one observation youmust then choose for a global time budget analysis that will contain all selected observations or a time budget analysisfor every single observation.
Choose Yes to group all observations in on time budget analysis
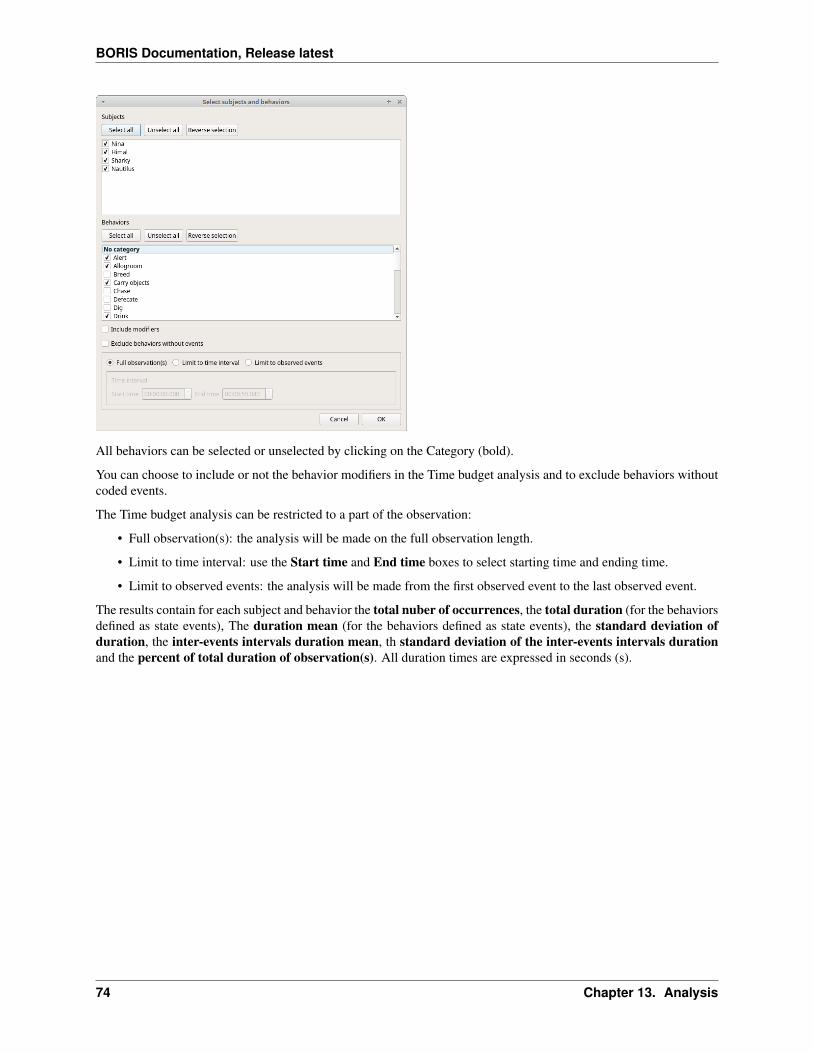
The Analysis > Time budget menu option shows the time budget for the events of the selected observations. Selectthe subjects and behaviors you want to include in the time budget analysis:
73
BORIS Documentation, Release latest
All behaviors can be selected or unselected by clicking on the Category (bold).
You can choose to include or not the behavior modifiers in the Time budget analysis and to exclude behaviors withoutcoded events.
The Time budget analysis can be restricted to a part of the observation:
• Full observation(s): the analysis will be made on the full observation length.
• Limit to time interval: use the Start time and End time boxes to select starting time and ending time.
• Limit to observed events: the analysis will be made from the first observed event to the last observed event.
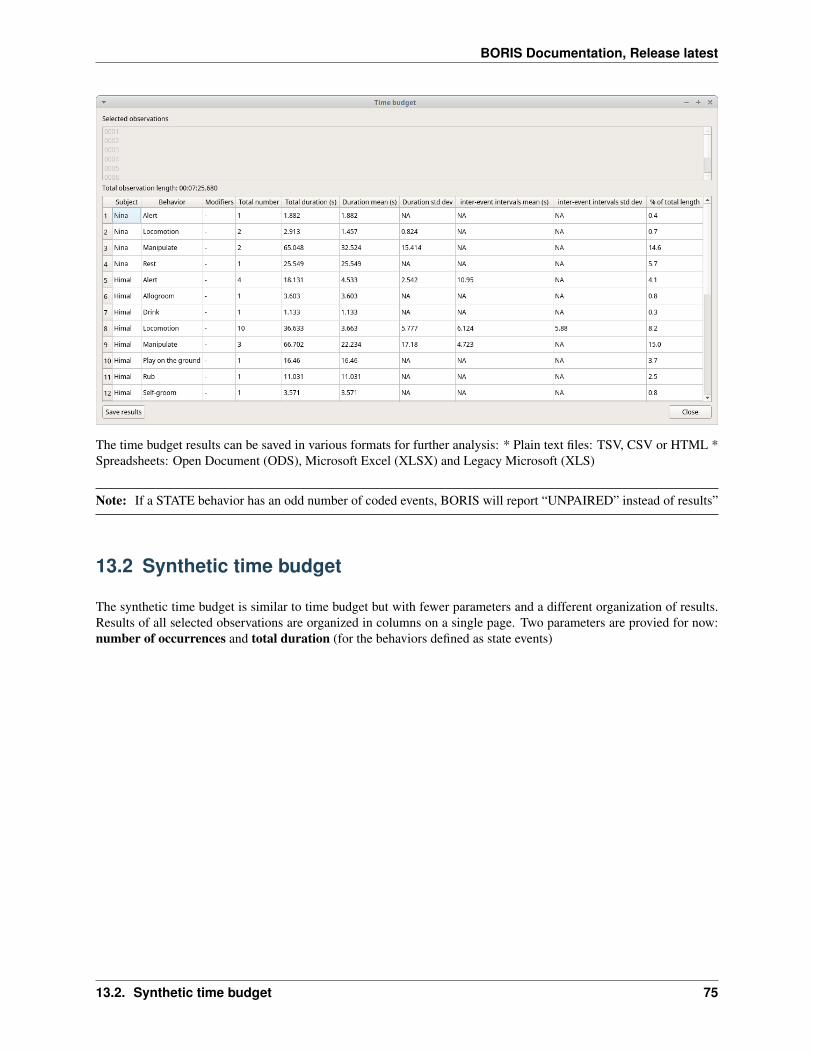
The results contain for each subject and behavior the total nuber of occurrences, the total duration (for the behaviorsdefined as state events), The duration mean (for the behaviors defined as state events), the standard deviation ofduration, the inter-events intervals duration mean, th standard deviation of the inter-events intervals durationand the percent of total duration of observation(s). All duration times are expressed in seconds (s).
74 Chapter 13. Analysis
BORIS Documentation, Release latest
The time budget results can be saved in various formats for further analysis: * Plain text files: TSV, CSV or HTML *Spreadsheets: Open Document (ODS), Microsoft Excel (XLSX) and Legacy Microsoft (XLS)
Note: If a STATE behavior has an odd number of coded events, BORIS will report “UNPAIRED” instead of results”
13.2 Synthetic time budget
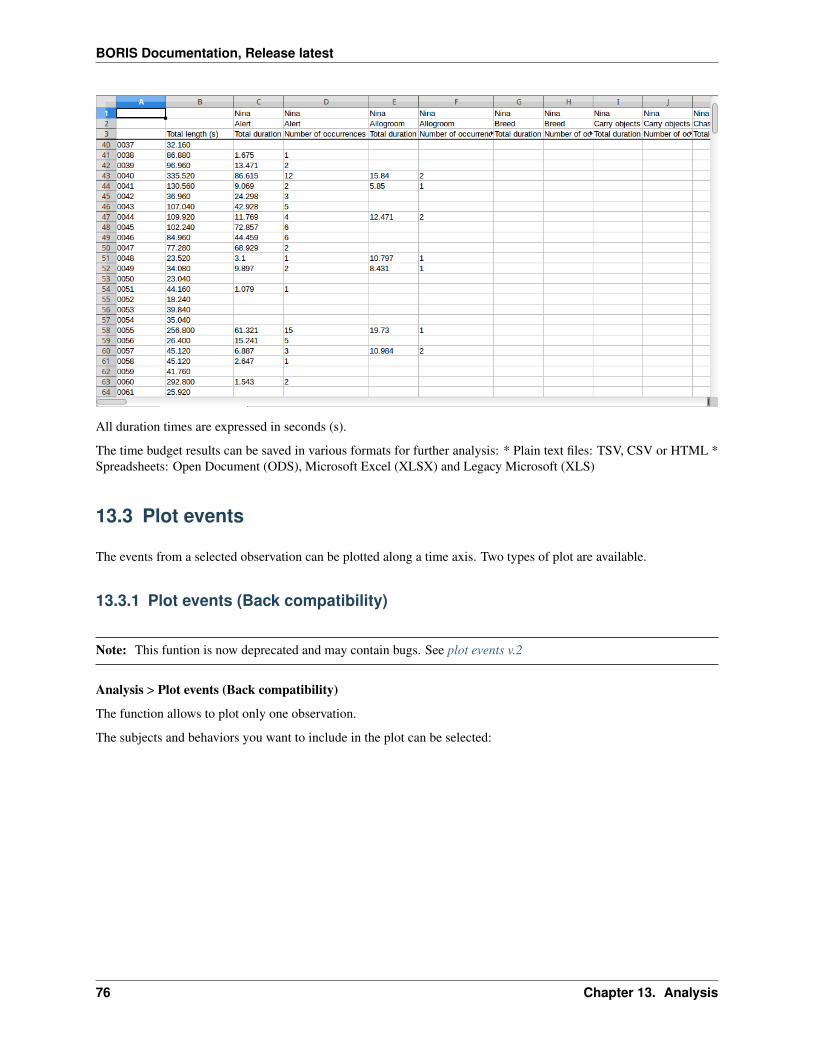
The synthetic time budget is similar to time budget but with fewer parameters and a different organization of results.Results of all selected observations are organized in columns on a single page. Two parameters are provied for now:number of occurrences and total duration (for the behaviors defined as state events)
13.2. Synthetic time budget 75
BORIS Documentation, Release latest
All duration times are expressed in seconds (s).
The time budget results can be saved in various formats for further analysis: * Plain text files: TSV, CSV or HTML *Spreadsheets: Open Document (ODS), Microsoft Excel (XLSX) and Legacy Microsoft (XLS)
13.3 Plot events
The events from a selected observation can be plotted along a time axis. Two types of plot are available.
13.3.1 Plot events (Back compatibility)
Note: This funtion is now deprecated and may contain bugs. See plot events v.2
Analysis > Plot events (Back compatibility)
The function allows to plot only one observation.
The subjects and behaviors you want to include in the plot can be selected:
76 Chapter 13. Analysis
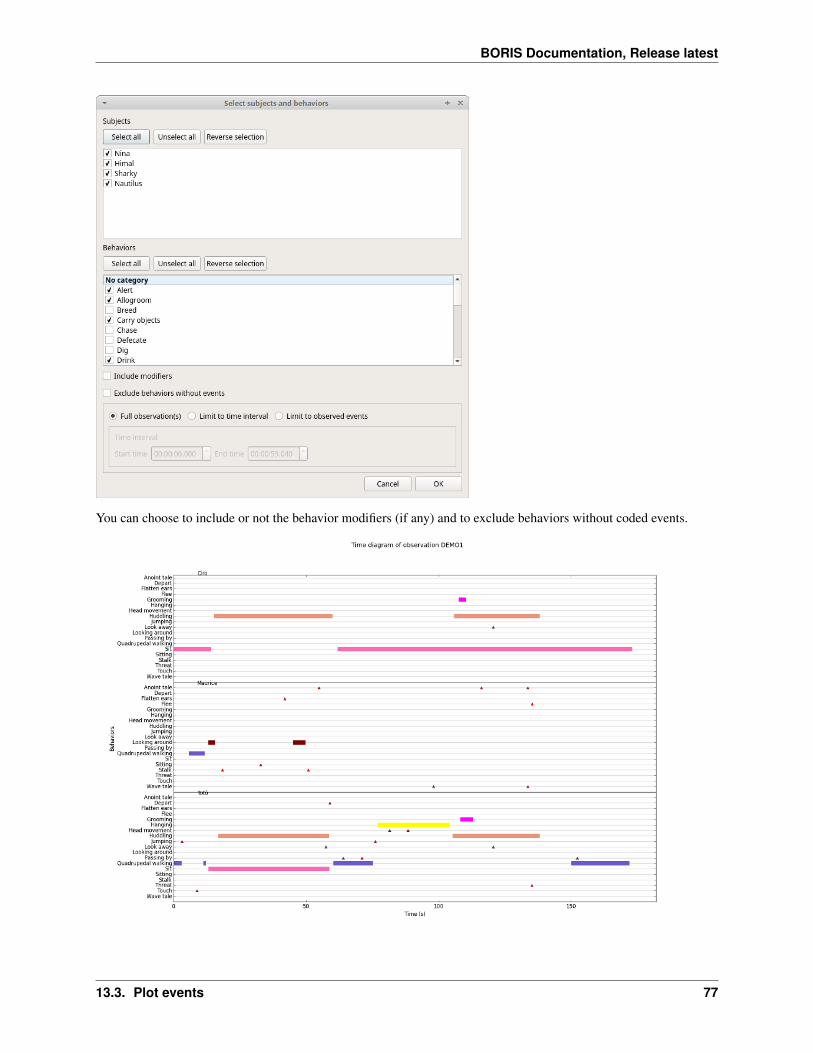
BORIS Documentation, Release latest
You can choose to include or not the behavior modifiers (if any) and to exclude behaviors without coded events.
13.3. Plot events 77
BORIS Documentation, Release latest
The color of behaviors can be customized. See plot colors
The plot can be exported in various formats like bitmap (PNG, JPG, TIFF) or vectorial graphic (SVG, PDF, EPS, PS).The SVG format can be further edited with the Inkscape vector graphics editor.
Note: If a STATE behavior has an odd number of coded events, you will see this error message: “The STATE behaviorXXX is not paired”
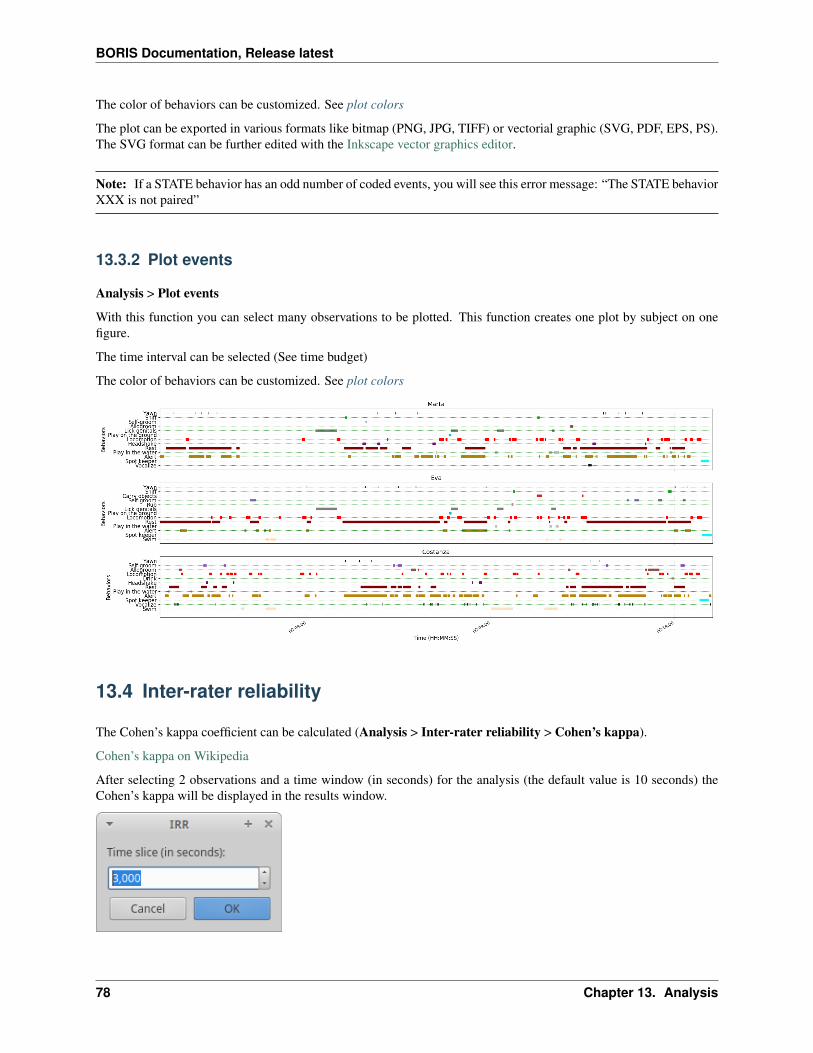
13.3.2 Plot events
Analysis > Plot events
With this function you can select many observations to be plotted. This function creates one plot by subject on onefigure.
The time interval can be selected (See time budget)
The color of behaviors can be customized. See plot colors
13.4 Inter-rater reliability
The Cohen’s kappa coefficient can be calculated (Analysis > Inter-rater reliability > Cohen’s kappa).
Cohen’s kappa on Wikipedia
After selecting 2 observations and a time window (in seconds) for the analysis (the default value is 10 seconds) theCohen’s kappa will be displayed in the results window.
78 Chapter 13. Analysis
CHAPTER 14
Preferences
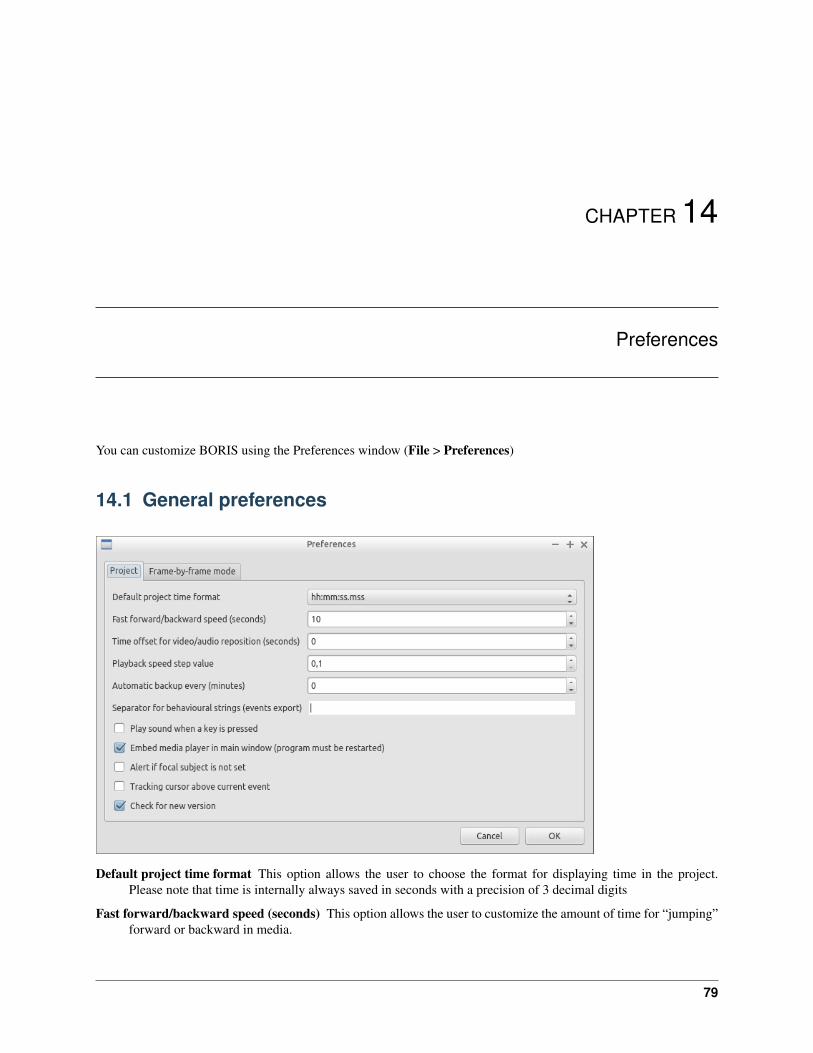
You can customize BORIS using the Preferences window (File > Preferences)
14.1 General preferences
Default project time format This option allows the user to choose the format for displaying time in the project.Please note that time is internally always saved in seconds with a precision of 3 decimal digits
Fast forward/backward speed (seconds) This option allows the user to customize the amount of time for “jumping”forward or backward in media.
79
BORIS Documentation, Release latest
Time offset for media reposition (seconds) This value indicates the time offset for repositioning the media afterdouble-click on a row event of the Events table. ‘for example -4 seconds indicates that after a double-click themedia will be repositioned 4 seconds before the recorded event.’
Playback speed step value This value indicate how much the speed will be increased or decreased after pressing thechange playback speed buttons.
Automatic backup every (minutes) if set BORIS will save your project automatically every n minutes. 0 indicateno automatic backup.
Play sound when a key is pressed Activate a sound signal after every keypress event
Embed media player This option allows the user to detach from the main window or embed the media player in themain window. On Mac OS the media player can not be detached from main window.
Alert if focal subject is not set If this option is activated BORIS will show an alert box if no focal subject is selected
Tracking cursor above current event Check this box to position the tracking cursor above the current event in eventslist table.
Check for new version Check for new version on BORIS web site every 15 days (internet access required)
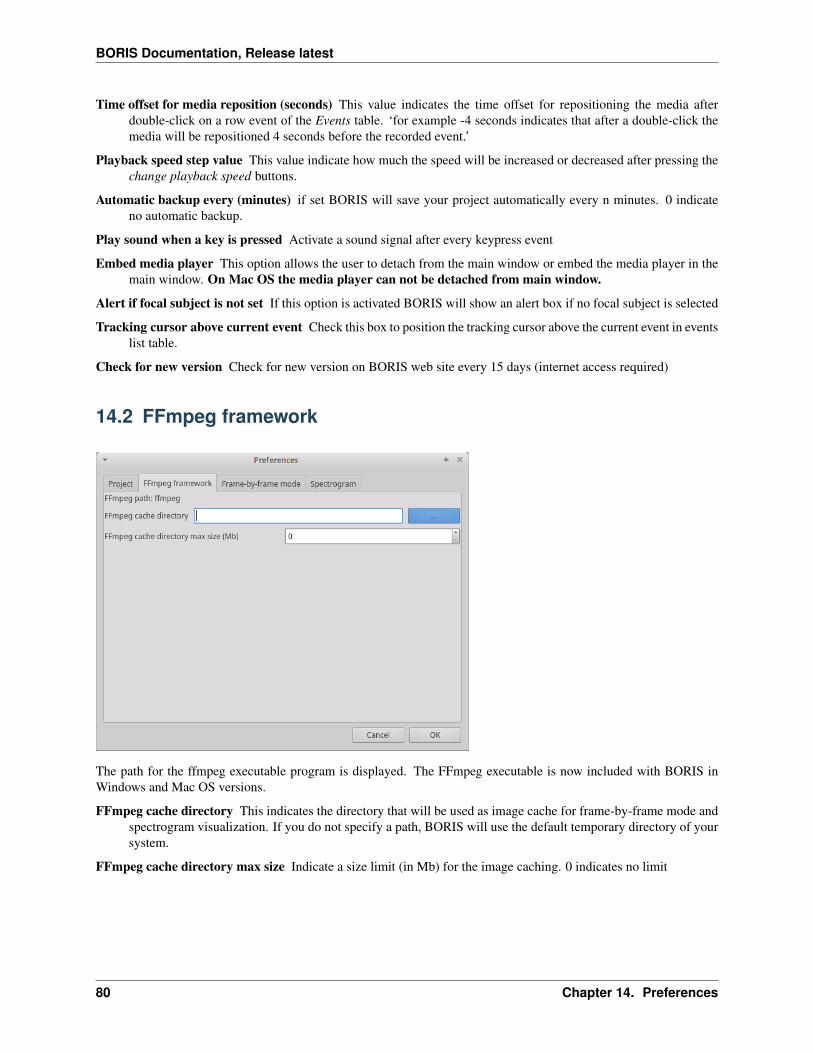
14.2 FFmpeg framework
The path for the ffmpeg executable program is displayed. The FFmpeg executable is now included with BORIS inWindows and Mac OS versions.
FFmpeg cache directory This indicates the directory that will be used as image cache for frame-by-frame mode andspectrogram visualization. If you do not specify a path, BORIS will use the default temporary directory of yoursystem.
FFmpeg cache directory max size Indicate a size limit (in Mb) for the image caching. 0 indicates no limit
80 Chapter 14. Preferences
BORIS Documentation, Release latest
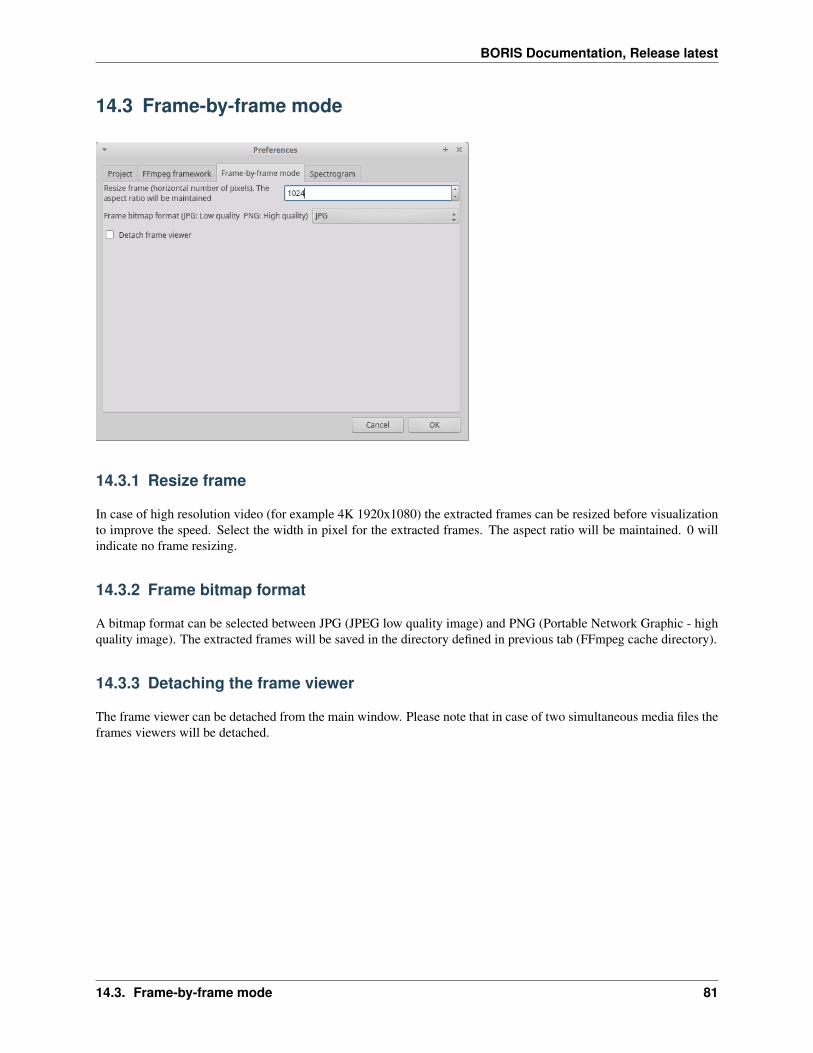
14.3 Frame-by-frame mode
14.3.1 Resize frame
In case of high resolution video (for example 4K 1920x1080) the extracted frames can be resized before visualizationto improve the speed. Select the width in pixel for the extracted frames. The aspect ratio will be maintained. 0 willindicate no frame resizing.
14.3.2 Frame bitmap format
A bitmap format can be selected between JPG (JPEG low quality image) and PNG (Portable Network Graphic - highquality image). The extracted frames will be saved in the directory defined in previous tab (FFmpeg cache directory).
14.3.3 Detaching the frame viewer
The frame viewer can be detached from the main window. Please note that in case of two simultaneous media files theframes viewers will be detached.
14.3. Frame-by-frame mode 81
BORIS Documentation, Release latest
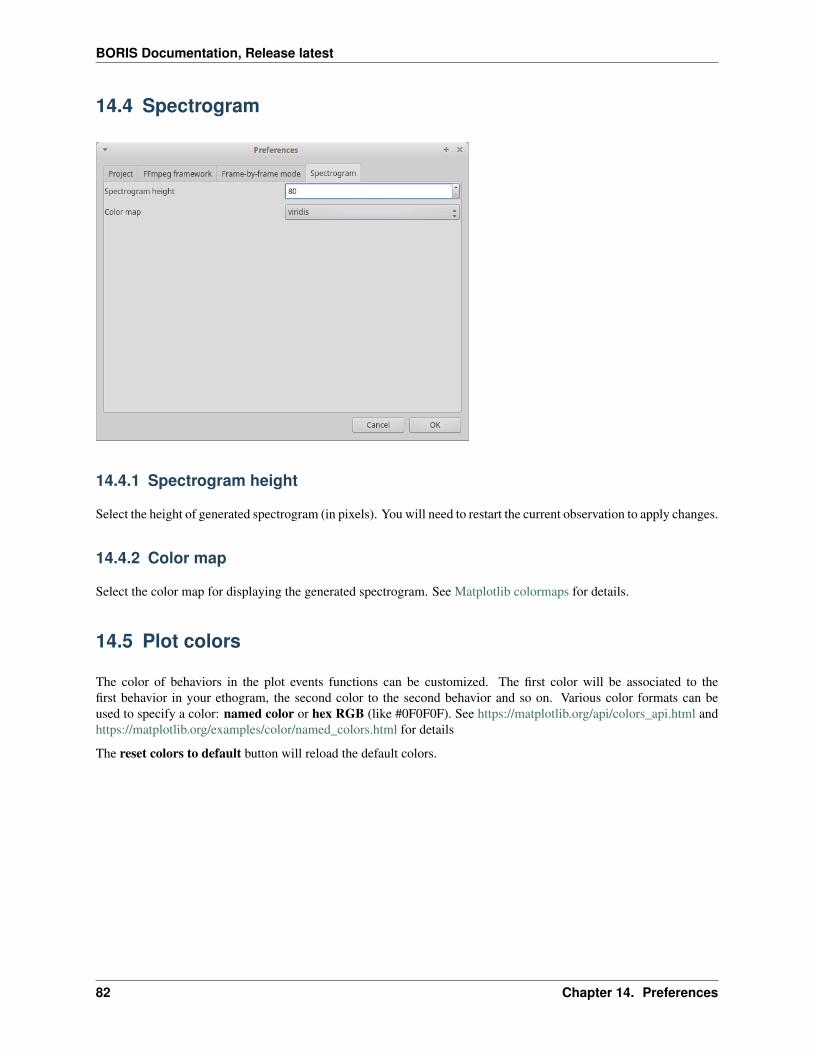
14.4 Spectrogram
14.4.1 Spectrogram height
Select the height of generated spectrogram (in pixels). You will need to restart the current observation to apply changes.
14.4.2 Color map
Select the color map for displaying the generated spectrogram. See Matplotlib colormaps for details.
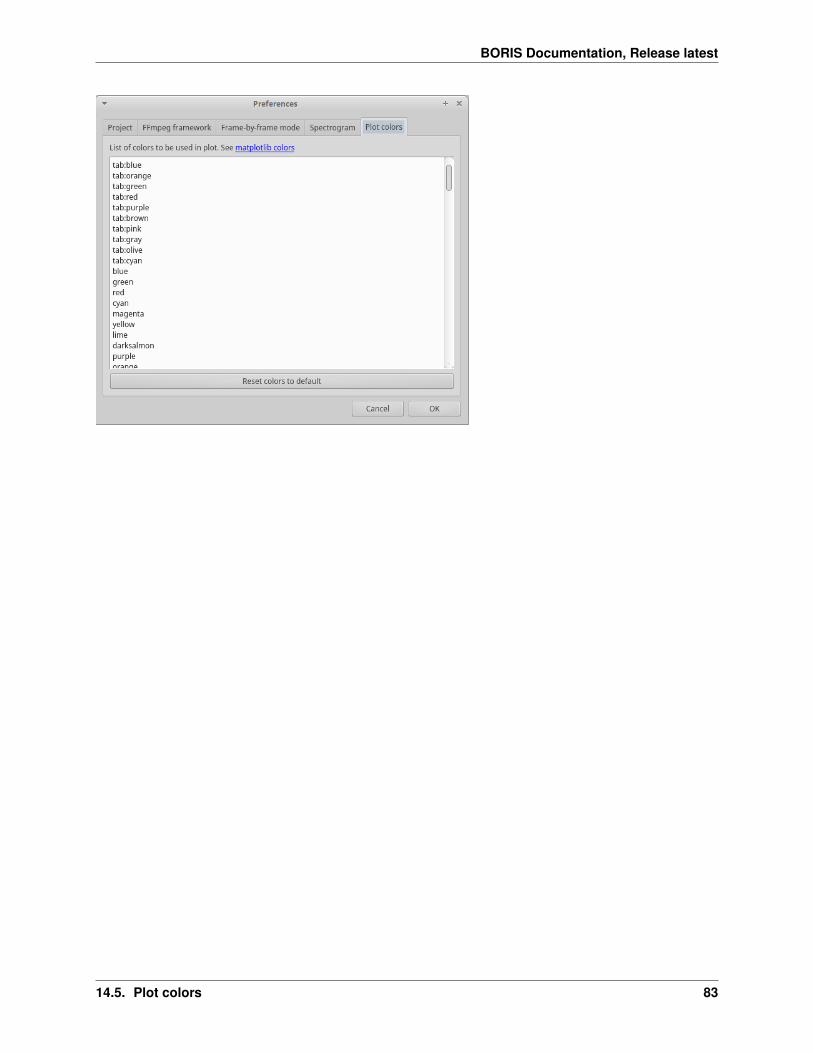
14.5 Plot colors
The color of behaviors in the plot events functions can be customized. The first color will be associated to thefirst behavior in your ethogram, the second color to the second behavior and so on. Various color formats can beused to specify a color: named color or hex RGB (like #0F0F0F). See https://matplotlib.org/api/colors_api.html andhttps://matplotlib.org/examples/color/named_colors.html for details
The reset colors to default button will reload the default colors.
82 Chapter 14. Preferences
BORIS Documentation, Release latest
14.5. Plot colors 83

BORIS Documentation, Release latest
84 Chapter 14. Preferences
CHAPTER 15
Various
15.1 Citing BORIS
If you have used BORIS for publications, please cite:
Olivier Friard and Marco Gamba. (2016) BORIS: a free, versatile open-sourceevent-logging software for video/audio coding and live observations.Methods in Ecology and Evolution, 7(11), 1324-1330DOI: 10.1111/2041-210X.12584
15.2 Bug reports and features request
Please send bug reports and features request using the BORIS GitHub repository (https://github.com/olivierfriard/BORIS) or by e-mail in english, french or italian (see web site http://www.boris.unito.it/pages/about.html).
In case of bug report please verify that you are using the last version of BORIS and indicate your operating system, itsversion and the CPU architecture (32/64 bits). You may also include the BORIS project that gave you an error. Anyinformation you will provide will not be disclosed to any third party.
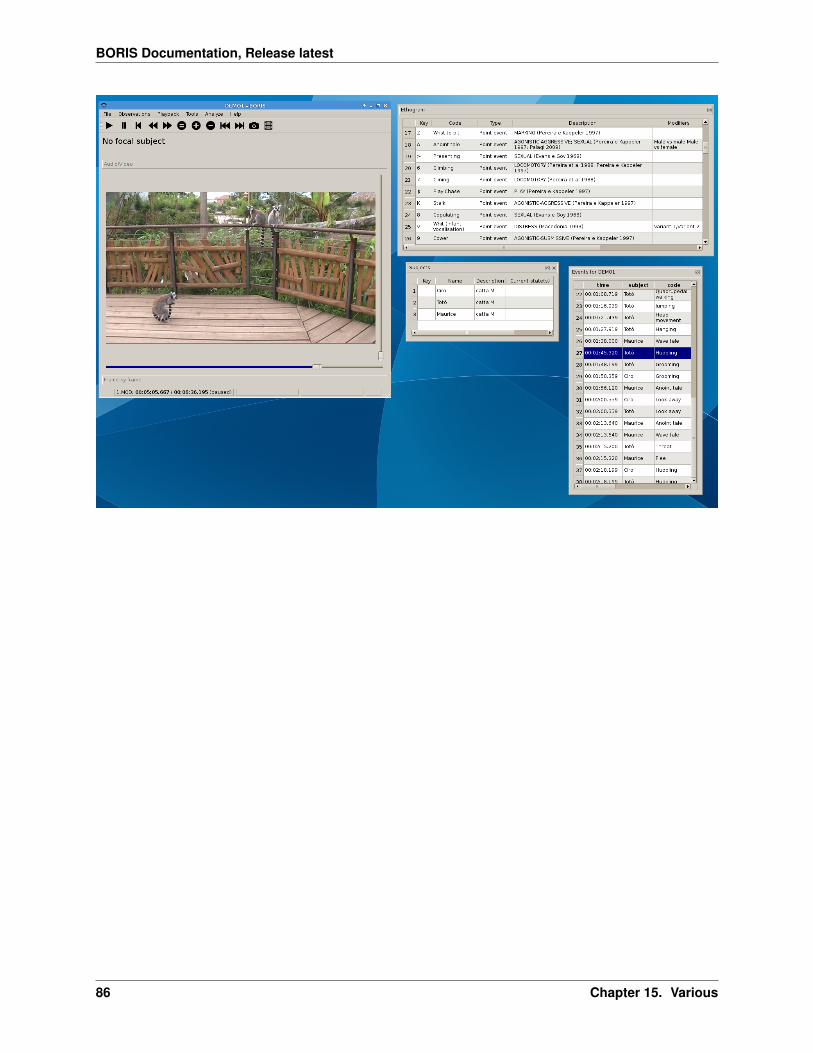
15.3 Docking
All elements, including the media player can be undocked from the main window and positioned where you prefer(e.g. they can be on the same desktop over one or two screens).
85
BORIS Documentation, Release latest
86 Chapter 15. Various
CHAPTER 16
Acknowledgement
The authors would like to acknowledge Sergio Castellano, Valentina Matteucci and Laura Ozella for their precioushelp.
16.1 Valid keys for triggering behavior
BORIS will not make difference between lower case and upper case characters
• keys from A to Z
• keys from 0 to 9
• function keys from F1 to F12
• à é è ù ì ç
• ! ” £ $ % & / ( ) = ? ^ [ ] @ | § ° #
87