border esk, river eden and solway firth fisheries … of 68 executive summary • salmon and sea...
TRANSCRIPT

Border Esk, River Eden and Solway Firth fisheries regulations review
January 2018

2 of 68
We are the Environment Agency. We protect and improve the environment.
We help people and wildlife adapt to climate change and reduce its impacts, including flooding, drought, sea level rise and coastal erosion.
We improve the quality of our water, land and air by tackling pollution. We work with businesses to help them comply with environmental regulations. A healthy and diverse environment enhances people's lives and contributes to economic growth.
We can’t do this alone. We work as part of the Defra group (Department for Environment, Food & Rural Affairs), with the rest of government, local councils, businesses, civil society groups and local communities to create a better place for people and wildlife.
Published by:
Environment Agency Horizon House, Deanery Road, Bristol BS1 5AH Email: [email protected] www.gov.uk/environment-agency
© Environment Agency 2018
All rights reserved. This document may be reproduced with prior permission of the Environment Agency.

3 of 68
Executive summary • Salmon and sea trout exploitation in the Solway Firth and the rivers Border Esk and Eden is
regulated by various legislative means including a time-limited package of byelaws and Net Limitation Order (NLO). The most recent time-limited regulatory package expired in November 2017 and there is an urgent need to introduce a new, replacement package of measures to ensure that stocks are adequately protected into the future.
• At the time of preparation and consultation of this Solway, Border Esk and Eden regulatory review, a national initiative is also underway (for English salmon rivers) to consider options for further reducing exploitation of salmon as part of the "Salmon Five Point Approach". This approach, which is being delivered jointly by key angling and fishery organisations, the Environment Agency and with the support of Government, is seeking to restore the abundance, diversity and resilience of salmon stocks throughout England. Informal consultation is complete and formal consultation will take place shortly (early 2018). Options for managing salmon exploitation in the national Approach may differ from our current (local) approach, as set out in in the Environment Agency's "Decision Structure for salmon fishery management in England".
• This report outlines the current state of salmon and sea trout stocks in the rivers Border Esk and Eden and the rod and net fisheries that depend on these fish populations. Due regard is given to the River Eden Special Area of Conservation (SAC), in particular with regard to salmon as a designated feature of this site.
• Over the past ten years, salmon stocks in both rivers have continued to decline, in particular over the last five years. These declines in stock sizes are consistent with those reported throughout much of England and further afield, and are primarily driven by factors within the marine environment. These declines are reflected in fishery catches, trap captures and juvenile survey data. Juvenile salmon densities across both catchments were considerably below potential population levels in 2016. Given this current low abundance of stocks, habitat within the rivers is under-utilised and any increase in numbers of spawning salmon is likely to increase juvenile fish stocks, smolt output and subsequent adult returns.
• Salmon Conservation Limit (CL) compliance assessments have determined that stocks in both rivers failed to exceed their CLs in at least four years out of the last five years, are currently “Probably at Risk” and, on the basis of statistical probability, are likely to remain “Probably at Risk” in five years' time.
• No equivalent stock assessment is available for sea trout populations in either catchment. However, sea trout catches remain significantly below historic levels in both catchments, Furthermore, the recently-expired, time-limited regulatory package has not resulted in sustained improvements in sea trout stocks, despite being intended to result in markedly reduced exploitation and therefore improved stocks.
• Juvenile sea / brown trout densities across both catchments were considerably below potential population levels in 2016. Given this current low abundance of stocks, habitat within the rivers is under-utilised and any increase in numbers of spawning sea trout is likely to increase juvenile fish stocks, smolt output and subsequent adult returns.
• On the basis of our review of migratory salmonid stocks in the rivers Border Esk and Eden, we believe there is a clear need to further reduce the numbers of salmon and sea trout killed (directly and indirectly) in the fisheries that exploit them for a period of up to ten years and commencing in 2018. However, in doing so we have sought to retain or increase the socio-economic benefits these fisheries bring wherever possible and therefore do not propose to close any of these fisheries at this time.
• With regards to salmon, we propose to introduce byelaws requiring that all salmon caught in the Solway Firth haaf net fishery, the rod fisheries of the Border Esk and River Eden, and the River Eden Corby Coops fishery are returned immediately and with least possible injury to the estuary or river that they were caught in. That is to say, we intend to continue to support fishing for salmon in these fisheries but on a 100% catch-and-release basis only.

4 of 68
• In the Solway Firth haaf net fishery we propose to introduce a new NLO limiting the number of licences available for this fishery to 75. We also propose to remove the fishery's current weekly close period by amending an existing byelaw, and we propose to introduce a shorter daily close period of midnight to 6am (by time-limited byelaw). These measures are intended limit the impact of this fishery on salmon and sea trout stocks, while increasing the amenity value of this fishery to licence holders.
• No additional measures to protect salmon, beyond the 100% catch and release byelaw, are proposed for rod fisheries in either river or for Corby Coops trap fishery.
• In order to further protect sea trout, we propose to introduce season-long kill limits in all four fisheries named above.
• In the Solway Firth haaf net fishery, we propose to introduce, by byelaw, a season-long, fishery-wide kill limit of 420 sea trout. This will be controlled by means of the existing (national) carcass tagging scheme and carcass tags will be evenly distributed to all licensees who purchase their licences by the 18th of May that year. If they so wish, licensees may continue to fish for sea trout after they have reached their kill limit but all fish caught must be released back into the estuary immediately and with least possible injury.
• In the Border Esk rod fishery, a season-long limit of four sea trout per angler is proposed by byelaw and in the River Eden a season-long limit of two sea trout per angler is proposed by byelaw. In both rod fisheries, we also propose to renew a byelaw requiring the release of all female sea trout caught on or after the 10th of September each year. Rod angling for sea trout will be permissible in each river after annual kill limit is reached but all sea trout caught must be released back into the river immediately and with least possible injury.
• In the Corby Coops trap fishery we propose to limit the number of sea trout that can be killed to six per season. Again, any sea trout caught once this total has been reached must be returned immediately to the river.
• The Environment Agency are of the opinion that this package of measures is balanced and appropriate to all fisheries concerned and is proportional to the level of risk these fish stocks are currently at. This package of measures will be in place for up to ten years with a mid-term review proposed after five years.

5 of 68
Contents Executive summary ...................................................................................................................... 3
List of Figures ............................................................................................................................... 6
1. Introduction ............................................................................................................................... 7
1.1. General ................................................................................................................................ 7
1.2. The Fisheries ........................................................................................................................ 8
2. Fish stocks .............................................................................................................................. 15
2.1. Net and trap fishery catches ............................................................................................... 15
2.2. Rod fishery catches ............................................................................................................ 22
2.3. Trap and counter data ........................................................................................................ 26
2.4. Juvenile fish stocks ............................................................................................................. 29
3. Stock assessment ................................................................................................................... 35
3.1. Salmon ............................................................................................................................... 35
3.2. Sea trout ............................................................................................................................. 42
4. Management options .............................................................................................................. 43
4.1. Introduction and broad options ........................................................................................... 43
4.2. Detailed options .................................................................................................................. 45
4.3 Regulatory measures to protect salmon .............................................................................. 48
4.4 Regulatory measures to protect sea trout ............................................................................ 50
5. Bibliography ............................................................................................................................ 53
6. Glossary .................................................................................................................................. 54
7. Appendices ............................................................................................................................. 55
Appendix 1 : The Decision Structure for developing fishing controls in England and Wales ...... 55
Appendix 2 : Site-by-site electrofishing surveys results ............................................................. 58
Appendix 3 : Managing salmon stocks in England and Wales ................................................... 66
Appendix 4 : Appropriate Assessment under the Habitats Regulations ..................................... 67

6 of 68
List of Figures Figure 1 : The inner Solway Firth.. .................................................................................................. 9 Figure 2 : The Border Esk catchment.. .......................................................................................... 11 Figure 3 : The River Eden catchment. ........................................................................................... 13 Figure 4 : Declared combined Solway salmon net and trap catches from 1956 to 2016. ............... 15 Figure 5 : Declared combined Solway sea trout net and trap catches from 1956 to 2016. ............. 16 Figure 6 : Declared salmon catches in the Solway haaf net fishery from 1994 to 2016. ................ 17 Figure 7 : Declared sea trout catches in the Solway haaf net fishery from 1994 to 2016. .............. 18 Figure 8 : Licence availability and uptake in the Solway Firth haaf net fishery. .............................. 18 Figure 9 : Average number of tides fished per licensee in the Solway Firth haaf net fishery. ......... 19 Figure 10 : Catch per unit effort data for the Solway Firth haaf net fishery from 1994 to 2016. ...... 20 Figure 11 : Salmon catches made in the coops fishery on the River Eden, 1994 to 2016.............. 21 Figure 12 : Sea trout catches from the coops fishery on the River Eden, 1994 to 2016. ................ 21 Figure 13 : Declared salmon rod catch from the Border Esk, 1993 to 2016. .................................. 22 Figure 14 : Declared sea trout rod catch from the Border Esk, 1993 to 2016. ............................... 23 Figure 15 : Border Esk rod fishing effort and cacth per licence day (CPLD), 1994 to 2016 ............ 23 Figure 16 : Declared salmon rod catch from the River Eden, 1993 to 2016. .................................. 24 Figure 17 : Declared sea trout rod catch from the River Eden, 1993 to 2016. ............................... 25 Figure 18 : River Eden rod fishing effort and catch per licence day (CPLD), 1994 to 2016 ............ 26 Figure 19 : Salmon catches in a whole-river trap on the River Caldew, 1991-2013. ...................... 27 Figure 20 : Sea trout catches in a whole-river trap on the River Caldew, 1991-2013. .................... 27 Figure 21 : Net upstream counts recorded at Great Corby fish counter, River Eden. .................... 28 Figure 22 : Mean salmon fry densities observed across England and the Border Esk. .................. 29 Figure 23 : Mean salmon parr densities observed across England and the Border Esk. ............... 30 Figure 24 : Salmon fry classifications for sites surveyed in 2016.. ................................................. 31 Figure 25 : Salmon parr classifications for sites surveyed in 2016. ............................................... 32 Figure 26 : Brown / sea trout fry classifications for sites surveyed in 2016. ................................... 33 Figure 27 : Brown / sea trout parr classifications for sites surveyed in 2016. ................................. 34 Figure 28 : Estimated salmon egg deposition in the Border Esk catchment. ................................. 37 Figure 29 : Estimated salmon egg deposition and Conservation Limit (CL) compliance in the Border Esk catchment.. ................................................................................................................. 38 Figure 30 : Estimated salmon egg deposition in the River Eden catchment. ................................. 39 Figure 31 : Estimated salmon egg deposition and Conservation Limit (CL) compliance in the River Eden catchment.. .......................................................................................................................... 40 Figure 32 : Estimated salmon egg deposition in the River Caldew from 1994 to 2013. ................. 41 Figure 33 : Estimated salmon egg deposition and Conservation Limit (CL) compliance in the River Eden catchment. ........................................................................................................................... 41 Figure 34 : Site-by-site juvenile salmon densities in the Border Esk and Eden catchments.. ......... 58 Figure 35 : Site-by-site juvenile sea / brown trout densities in the Border Esk and Eden catchments.. ................................................................................................................................. 62

7 of 68
1. Introduction 1.1. General This document summarises the recent status of salmon and sea trout stocks in the rivers Border Esk and Eden and sets out the need for increased protection of these stocks. This document explores a range of regulatory options for a new Net Limitation Order (NLO) for the Solway Firth and a time-limited byelaw package for the Solway Firth, the Border Esk and the River Eden in order to arrive at a preferred option for the regulation of these fisheries from 2018 onwards. Management measures for the Border Esk and Eden rod fisheries, the Eden coops fishery and the Solway haaf net fishery are considered together to ensure that both rivers’ stocks are protected to appropriate levels.
In addition to reviewing the recent stock status of salmon and sea trout populations of the rivers Border Esk and Eden, we have had a number of discussions with local stakeholder groups over the previous 24 months both to discuss these stock assessments and to identify and discuss possible management options. We believe that the preferred option presented in this document represents an equitable and balanced approach between both the rod and net interests, allowing both to continue to operate whilst reflecting the need to take a precautionary approach towards managing these stocks over the next 10 years.
It should be noted that this NLO and byelaw review process is separate to and in addition to the Environment Agency’s nationally-led Five Point Approach to Salmon Management (Environment Agency, 2015) which may introduce additional, complimentary measures. Local measures are necessary to ensure that local stocks of salmon and sea trout are adequately protected, particularly given the high conservation value of the River Eden salmon stock (see below).
The existing Solway Firth NLO and the existing byelaw package for the Solway Firth and the rivers Border Esk and Eden were confirmed by Defra in November 2007 and applied for a 10 year period from that date. The NLO limited the numerical size of the Solway Firth haaf net fishery to 105 licences while the time-limited byelaw package contained the following measures that variously regulated these net and rod fisheries:
• A daily close period in the haaf net fishery from 10pm to 10am the following day
• Daily bag limits of two salmon and two sea trout per day on the Border Esk and River Eden rod fisheries
• Requirement to release all rod-caught female salmon and sea trout caught on or after the 10th of September in either river
In addition to the above time-limited byelaws, permanent byelaws were confirmed at the same time as follows:
• The outer limit of the haaf net fishery was brought inland to reduce the likely number of fish populations (rivers) exploited.
• The weekly close period of the haaf net fishery was changed to 10pm on Friday through to 10am on Monday.
The full text of the current measures are contained in the North West Fisheries Byelaws (Environment Agency, 2014).
Since the introduction of the above measures in 2007, salmon stocks have declined across much of their UK distribution including the Solway area. As a consequence of this, catch conditions have been implemented in the Solway Firth haaf net fishery to reduce numbers of salmon killed, and the rod fisheries in both rivers have introduced tighter controls on the killing of fish which, although voluntary, have been backed-up by association and owner rules and a carcass tagging scheme. Since 2014 each haaf net licensee has been permitted to retain no more than 10 salmon per season and specific carcass tags have been issued to support this catch condition. Similarly, in the River Eden coops fishery each of the three licences has been limited to kill no more than five salmon per season with specific carcass tags issued accordingly.

8 of 68
In the River Eden rod fishery, the River Eden and District Fisheries Association (REDFA) has, since 2014, promoted voluntary limits of no more than one salmon per day and six salmon per season to anglers, backed-up by a self-administered carcass tagging scheme. Similar restrictions have been promoted on the Border Esk by the Esk and Liddel Improvement Association (ELIA).
These voluntary rod measures are likely to have contributed towards increased catch and release rates in both fisheries, although rod fishery interests have expressed concern that not all anglers are following these guidelines. Furthermore, some angling groups already require the return of all rod-caught salmon.
Finally, and again because of widespread concerns around declining salmon stocks over the previous decade, the government in Scotland introduced a new regulatory mechanism from 2016 based on stock status. For salmon stocks in the lowest of three stock status categories, including the River Annan which is the nearest Scottish river to the Border Esk and Eden, the killing of salmon within estuarial limits is not permitted. This includes the entire in-river rod fishery. In addition, there is currently a complete moratorium on salmon netting out-with estuarial limits anywhere in Scottish territorial waters. The Annan Common Good haaf net fishery operates within the defined estuary limits of the Solway Firth and, although no taking of salmon is ordinarily permitted, a small scientific study has allowed a limited take in 2016 and 2017 of three salmon per licensee. The Annan Common Good stake net fishery has not operated since 2015 because of concerns around its impact on the River Eden Special Area of Conservation (SAC).
A key consideration within the development of the 2018 measures is the potential for the Solway Firth haaf net fishery to kill fish destined for the Border Esk, the River Eden and potentially other Solway rivers including the River Annan. However, because the net fishery operates within the defined estuary limits of the Solway Firth and is believed to primarily only exploit fish from these local stocks, it does not pose the same management difficulties that coastal or high seas mixed stock fisheries do, fisheries that are of particular concern to ICES and NASCO.
Nonetheless, regulation of the Solway Firth haaf net fishery must take into account the exploitation of salmon (and sea trout) from each contributing stock to ensure that the weakest stock(s) is protected. This is particularly important where one or more stock is in poor health and protection is therefore required across the whole fishery to protect this stock(s). Although genetic studies have been carried out to help apportion net catches to individual Solway catchments, and in so doing to better understand the impact of the net fishery on these rivers, thus far these studies have not had sufficient resolution to do so.
Salmon are a qualifying feature of the River Eden Special Area of Conservation (SAC) and an interest feature of the River Eden Site of Special Scientific Interest (SSSI). The first of these designations is of particular importance as it requires the Environment Agency, as a competent authority, to apply the precautionary approach to ensure that any measures introduced have no likely significant effect on the integrity of the SAC to the satisfaction of Natural England. This applies equally to measures appropriate to the River Eden rod fishery and to the Solway Firth haaf net fishery. A Habitats Regulations Assessment (HRA) has been produced to support our preferred option. The citation and conservation objectives for this site can be found using the link below.
http://publications.naturalengland.org.uk/publication/5935614042046464
Although the Solway Firth is also an SAC, neither salmon nor sea trout are qualifying features of this site. Nonetheless an assessment of likely significant effect on this SAC has also been produced. The citation and conservation objectives for this site can be found using the link below.
http://publications.naturalengland.org.uk/publication/6556237919420416
1.2. The Fisheries
The Solway Firth haaf net fishery The Solway Firth straddles the border between England and Scotland. Although there are net fisheries on both sides of the border, the Environment Agency only regulates the haaf net fishery which operates in its area on the south side of the Firth. The geographical area that this fishery

9 of 68
operates in is defined by a seaward limit, landward limits and a northern limit (Figure 1). These limits are:
• The seaward extremity is a line drawn between the Eastern extremity of Barnkirk Point (NGR NY19196433) and Scargavel Point (NGR NY19786177).
• The landward extremities are, on the Border Esk, a line drawn across the river from NGR NY32456503 to NGR NY32456632 and, on the River Eden, a line drawn across the river from NGR NY33656182 to NGR NY33656155.
• The Northern extremity is a mobile boundary that follows the midstream (the “medium filum”) of the Esk channel, reflecting the ever-changing nature of the estuary's channels and enabling effective enforcement.
Figure 1 : The inner Solway Firth. The operational area of the Solway Firth haaf net fishery is indicated in red with the mobile northern boundary which follows the medium filum of the Esk channel shown as a dashed red line. Also shown are the indicative operational areas of the Annan Common Good and Dornock fisheries.
The only allowable method in this fishery is by means of a haaf net, the dimensions, mesh sizes and other details of which are set out in Environment Agency’s regional fisheries byelaws (Environment Agency, 2014). The haaf net season runs from the 1st of June to the 9th of September inclusive and, from 2008 to 2017, available fishing time was limited to 10am to 10pm Monday to Friday by a combination of weekly and daily close periods. The number of available licences over this period was limited to 105 by means of an NLO although fewer than 80 licences per year have been purchased since 2008.
In 2009, the Environment Agency introduced national byelaws which required all net caught salmon and sea trout to be carcass-tagged as soon as is practicable after capture and the details of these captures, any fish released and fishing effort to be entered into a log book. This has aided regulation of all net fisheries and provided traceability for captured fish.
More recently, and in light of declining runs across their range, the number of salmon retained by individual licensees has been limited to 10 fish per season by means of a catch condition applied to each licence. This additional measure has been in place from 2014 onwards.

10 of 68
We recognise there is a strong cultural and heritage aspect to the Solway Firth haaf net fishery, in particular because of the traditional method used. There is also a strong local element to the fishery with many of those actively involved in it having netted or been associated with netting here over many generations.
River Eden Corby Coops fishery The coops at Corby Castle (NGR NY4685553686) are a set of three traps that were granted a certificate of Privilege in 1867 by the Special Commissioners for English Fisheries. They have existed and remained largely unchanged since the 1100s when they were constructed by monks from the nearby Wetheral Priory. The fishing season for the coops is from the 1st of June to the 31st of August inclusive and they may only operate from 6am on a Monday morning to 6am on a Saturday morning (Environment Agency, 2014).
Since 2009 all fish caught in the coops are required to have been carcass-tagged at the time of capture and the details of these fish, any released fish, and fishing effort entered into a log book. From 2014 onwards, the coops fishery has also been further restricted in the number of salmon they can retain, again by means of a catch condition applied to each licence (five salmon per licence). However, the coops did not operate in 2016 or 2017 as a result of damage caused by flooding in December 2015.
The coops are currently used to provide locally caught salmon for the owners.
Border Esk rod fishery The Border Esk (Figure 2) straddles the national border between NW England and SW Scotland and has a catchment of some 1,177km2. Along with the River Eden in England and the rivers Annan and Nith in Scotland (and numerous smaller rivers in both countries) it drains into the Solway Firth and ultimately the Irish Sea. The Border Esk catchment comprises the main Border Esk (or River Esk) and two major tributaries, the River Liddel (or Liddel Water), and the River Lyne (Figure 2). Numerous other smaller tributaries join these principal rivers including the River Sark which joins the Border Esk in estuarine waters near Gretna and forms the national border between England and Scotland for much of its length.

11 of 68
Figure 2 : The Border Esk catchment, indicated by a bold red line. Also shown is the approximate line of the national border between England and Scotland (grey and black line).
The Border Esk is renowned not only as a salmon fishery but as a significant sea trout fishery. Anglers from throughout the UK and further afield visit the catchment to fish for these species although there has been considerable concern over numbers of sea trout returning to the Esk over the last twenty years. The majority of rod fishing for salmon and sea trout occurs on the mainstem Border Esk from Langholm downstream to the sea, a distance of some 26km, and on the River Liddel from Kershopefoot downstream to the Border Esk confluence, approximately 18km. Fishing is also carried out, to a lesser extent, upstream of Langholm on the Esk and Kershopefoot on the Liddel and in some of the larger tributaries of these rivers, and also on the River Lyne. The River Sark is not considered a significant migratory salmonid river and is not considered further.
The salmon angling season on the Border Esk runs from the 1st of February to the 31st of October inclusive and the sea trout season from the 1st of April to the 30th of September inclusive (Environment Agency, 2014). There are no daily or weekly close periods for rod angling on the Border Esk. Salmon may not be retained before the 16th of June and method restrictions apply during the spring period to maximise survival of released salmon. See the current North West Fisheries Byelaw booklet for further regulatory information (Environment Agency, 2014).

12 of 68
Since 2009, the sale of rod caught salmon and sea trout has been illegal.
There are significant differences between the control and regulation of the fisheries of the Border Esk and that of all other rivers in England and Wales. Most importantly, the Scotland Act 1998 (Border Rivers) Order 1999 (referred to as the Border Rivers Order 1999) gives the Environment Agency the ability to make byelaws in the freshwater Border Esk. These waters are all inland of a line drawn across the mouth of the Border Esk at Sarkfoot and include all of the River Sark, the Border Esk and their tributaries. Notably, byelaws made for these waters must be supported by the UK and Scottish Parliaments.
Issues impacting on fish stocks in the Border Esk catchment are largely habitat-related and, as with many other rivers, there remains significant scope to improve the quality (and to a lesser extent quantity) of salmon and sea trout spawning and juvenile rearing habitat here. The Border Esk catchment has relatively few artificial barriers preventing migratory fish accessing spawning areas but a number of these have been identified by the Environment Agency working in conjunction with ELIA and the Galloway Fisheries Trust (GFT), particularly in areas developed for commercial forestry. Actions to address habitat quantity and quality by ELIA, GFT, the Environment Agency and others continue as and when funds allow. Concerns have been expressed regarding the potential impact of bird predation on fish stocks and angling interests are pursuing this locally. In the upper Esk catchment, low flows associated with water abstraction remain a concern and one that may be exacerbated by climate change.
River Eden rod fishery Although the River Eden shares an estuary with the Border Esk, the Eden catchment is quite different in nature and this is reflected in its salmon and sea trout stocks. The River Eden rises on high limestone fells above Mallerstang Common. It then flows North in a wide and fertile valley sandwiched between the Lake District and North Pennines before joining the Irish Sea on the Solway Firth some 100km from its source (Error! Reference source not found.). Along the way the Eden is joined by a number of tributaries, including the rivers Eamont (and Lowther), Irthing, Petteril and Caldew. The catchment contains two major still waters, Ullswater and Haweswater Reservoir, as well as a number of smaller tarns and reservoirs. Large parts of the Eden catchment are protected under UK and European legislation with some 410km forming the River Eden SAC (Error! Reference source not found.). The Atlantic salmon is a qualifying feature of this designation.
The River Eden is renowned among salmon anglers, in particular for the large numbers of fish that used to return to the river in the spring of the year. Spring salmon runs declined dramatically in the late 1960s and early 1970s but in recent years have shown some tentative signs of recovery. While spring salmon now make up a larger proportion of angler catches than they have for several decades, the opposite is the case for later running salmon and in particular one-sea-winter grilse. Catches of sea trout from the River Eden are relatively low compared to the Border Esk. This is at least in part due to the lack of angling effort targeted towards sea trout, but also because the Eden predominantly contains non-migratory brown trout.
The salmon rod angling season on the River Eden runs from the 15th of January to the 14th of October inclusive, while that of sea trout is from the 1st of April to the 30th of September inclusive. There are no daily or weekly close periods for rod angling on the River Eden. Salmon may not be retained before the 16th of June and method restrictions apply during the spring period to maximise survival of released salmon. See the current North West Fisheries Byelaw booklet for further regulatory information (Environment Agency, 2014).
Since 2009, the sale of rod caught salmon and sea trout has been illegal.

13 of 68
Figure 3 : The River Eden catchment highlighting those parts of the catchment designated as a Special Area of Conservation (SAC). Major tributaries are shown as are the locations of the Corby Coops trap fishery, Great Corby fish counter and Holmehead fish pass on the River Caldew.
The River Eden catchment is largely rural in nature, but is relatively intensively farmed with dairy farming common throughout much of the catchment. The main issues affecting fish stocks in the catchment include habitat quantity and quality, and water quantity and quality. Considerable amounts of time and money have been spent addressing these issues over the last few decades by organisations including the Eden Rivers Trust, the Environment Agency, landowners, Natural England, REDFA and other angling associations and owners, the Royal Society for the Protection of Birds and United Utilities. Obstacles to fish migration have been removed, river channels renaturalised, abstraction licences reformed and riverbanks fenced off. However, there remains significant scope for further work around many of these issues. Concerns have been expressed regarding the potential impact of bird predation on fish stocks and angling interests are pursuing this locally with support from the Angling Trust.

14 of 68
Other neighbouring fisheries
There are other fisheries in the Solway area that are likely to impact on salmon and sea trout destined for the rivers Border Esk and Eden, in particular haaf and stake net fisheries on the Northern (Scottish) side of the Solway Firth. Those most local to the Border Esk and Eden are the Annan Common Good haaf and stake net fisheries and the Dornock haaf net fishery on the landward side of the Annan fishery and owned by Buccleuch Estate (Figure 1).
As described above, the management of these fisheries has changed significantly since 2014. The Scottish Government has introduced a stock status based regulatory mechanism for salmon fisheries and, because of the poor health of the salmon stock of the River Annan, no salmon are currently allowed to be removed from the Annan Common Good or Buccleuch net fisheries with the exception of a small allowable take of three salmon per licensee from the Annan fishery for scientific purposes. There are thirty licences available that permit this limited take of salmon and additional licences that allow the taking of sea trout only. In both cases sea trout take is limited to two fish per tide. The Buccleuch haaf net fishery is, we understand, limited to two netsmen only and only sea trout may be retained, again due to the poor health of the Annan salmon stock.
The Environment Agency is of the opinion that a significant proportion of salmon and sea trout caught by these two fisheries (Annan and Buccleuch) are destined for the rivers Border Esk and Eden. Due, at least in part, to concerns around impact on the River Eden SAC, the Annan Common Good stake net lease was not renewed at the end of 2015.
However, the Environment Agency has no direct involvement in the management of these fisheries. Therefore, we must manage the fisheries under our control to ensure that they do not result in the unsustainable killing of fish and / or prevent the recovery of salmon and sea trout stocks of the Border Esk and Eden, alone or in-combination with other Agency-regulated or Scottish fisheries. Of particular relevance here is the SAC status of Eden salmon, as this requires the Environment Agency to take the precautionary approach in managing this stock such that we can conclude no likely significant impact on site integrity, alone or in-combination with other Agency fisheries, Scottish fisheries or any other plans or projects.

15 of 68
2. Fish stocks 2.1. Net and trap fishery catches
General Figure 4 presents declared salmon net catches from the Solway area from 1956 onwards. These are the combined net and trap catches from the various fisheries that operated each year under the Environment Agency's (or its predecessors') control and include drift, haaf and seine net fisheries and Corby Coops. Data specific to each individual fishery are unavailable until 1994 (see below). It should be noted that catches presented below vary year-on-year as a result of changes in regulatory controls described earlier, varying numbers of returning salmon, environmental conditions and changes in licence uptake. While it is also unclear what proportion of total catches were declared in each fishery historically, we believe declared catches in currently operating fisheries are accurate (specifically since 2009). Details of numbers of fish released are only available from 2010 onwards when the national carcass tag and logbook scheme made this a statutory requirement.
Figure 4 : Declared combined Solway salmon net and trap catches from 1956 to 2016.
It is clear from the above catch data that declared salmon catches made in these fisheries from 2008 onwards were significantly lower than in previous decades, regardless of any concerns around reporting rates. Although this is likely to reflect reduced salmon runs to some extent, there are many other factors that are likely to have influenced these catches and for this reason this wider-area catch data is not considered further here.
Figure 5 presents the declared sea trout net catch data from the Solway area from 1978 onwards, again only for fisheries regulated by the Environment Agency or its predecessors. As described above, these catches cannot be split into individual fisheries prior to 1994. Netsmen were not required to declare sea trout catches until 1978 and details of numbers of fish released were not required until 2010.

16 of 68
Figure 5 : Declared combined Solway sea trout net and trap catches from 1956 to 2016.
There are many factors that have contributed to the apparent reduction in sea trout catches from 1990 onwards and for this reason this area-wide data is not considered further here.
Solway Firth Haaf net fishery As stated above, catch data specific to the Solway haaf net fishery are only available from 1994 onwards.
Figure 6 presents the declared salmon catches in the Solway Firth haaf net fishery from 1994 to 2016. Details of salmon released in the fishery are only available from 2009 onwards when national carcass tagging and logbook byelaws made the reporting of these fish a legal requirement.
Over the period 1994-2016, declared salmon catches varied from 3,049 fish in 1995 to 229 fish in 2014, the latter figure including 25 fish released. The highest declared catch recorded during the period that the 2007 NLO and byelaw package was in force was 1,090 salmon in 2010, 3 of which were returned, while the highest catch recorded from 2014 onwards when salmon catch limits were imposed was 366 fish in 2016 (65 of which were released).
Although changes in regulatory controls applied to the fishery will have influenced total declared catches over the years, catches will also have been influenced by numbers of fish available for capture i.e. fish returning to the estuary. It is notable that even with a kill limit of 10 salmon per licensee from 2014 onwards, lower proportions of licensees killed this number of fish when compared with the preceding years (Table 1). This may be because some licensees chose to return smaller fish alive in order to retain some carcass tags for larger fish but few licensees reported returning fish to support this possibility and proportions of licensees retaining close to the allowable limit were also considerably lower than in previous years (Table 1). This suggests that fewer fish were simply available to catch.

17 of 68
Figure 6 : Declared salmon catches in the Solway haaf net fishery from 1994 to 2016.
Table 1 : Proportions of haaf net licensees retaining numbers of salmon at, or close to, kill limits before and after the introduction of this regulatory control in 2014.
Salmon killed
2010 2011 2012 2013 2014 2015 2016
8 68% 32% 27% 47% 11% 17% 36%
9 63% 25% 25% 43% 6% 13% 29%
10 58% 25% 25% 37% 2% 8% 15%
Figure 7 presents the declared sea trout catches in the Solway haaf net fishery from 1994 to 2016. Details of sea trout released in the fishery are only available from 2010 onwards and numbers of sea trout released have been low in all years. Although total sea trout catches over this period have shown occasional increases, in all years they were much lower over the last 20 years than in previous years (1995 and earlier). Catches were particularly low in 2006 and 2007 (prior to the introduction of a daily close period) and from 2011 to 2014 (after the introduction of a daily close period). Catches increased in 2015 and 2016 but remain considerably below historic levels. The maximum recorded number of sea trout released by the fishery was seven in 2015 out of a total catch of 763 fish (0.9%).

18 of 68
Figure 7 : Declared sea trout catches in the Solway haaf net fishery from 1994 to 2016.
Figure 8 shows the number of licences available and utilised from 1994 onwards as well as the total number of tides fished by all licensees. Although successive NLOs have reduced the number of licences available, full licence uptake has not occurred since 1995. In most years since 2000, approximately 50 of the haaf net licences available under the NLO have not been purchased. In general, the total number of tides fished over the years reflects the total number of licences purchased (Figure 8).
Figure 8 : Licence availability and uptake in the Solway Firth haaf net fishery from 1994 to 2016. Also shown is the total number of tides fished per year over this period.

19 of 68
Figure 9 presents fishing effort (i.e. the number of tides fished per licensee) over the period 1994 to 2016. As can be seen, there is no over-riding trend in the average number of tides fished per licensee over this period. Fishing effort was particularly low in 1998, 2006 to 2008, 2012 and, most recently in 2014 to 2016. The periods of low effort may, to some extent, reflect changes in regulations over this period, for example in 2008 and 2009 following the introduction of a daily close period and again from 2014 onwards following the introduction of a kill limit. However, similarly low levels of effort were reported prior to these regulatory changes, for example in 1998 and 2007. It is therefore likely that fishing effort was also influenced by fish availability and weather conditions.
Figure 9 : Average number of tides fished per licensee in the Solway Firth haaf net fishery from 1994 to 2016.
Figure 10 below shows the average number of salmon and sea trout caught per tide each year from 1994 to 2016 (i.e. catch per unit effort, CPUE). As can be seen, there is considerable variability in CPUE for both species over this time period. However, there has been an overall decline in CPUE for salmon since 2005, indicating a declining salmon stock in the Solway Firth and therefore the rivers Border Esk and Eden. This apparent decline in salmon is mirrored in rod and trap catch data (see below).
Sea trout CPUE in the haaf net fishery was generally lower than that for salmon over the period 1994 to 2016. From 1994 to 2014, the overall trend in CPUE for sea trout was downwards, although in some years CPUE was relatively high (e.g. 1995, 2001, 2009 and 2010) and corresponded to years when sea trout catches were relatively high. Overall, the highest CPUEs reported for sea trout were in 2015 and 2016 when catches were the highest recorded in over ten years (Figure 7). These high sea trout catches were not mirrored in rod catches.

20 of 68
Figure 10 : Catch per unit effort data for the Solway Firth haaf net fishery from 1994 to 2016.
River Eden Corby Coops fishery
As stated above, catch data specific to Corby Coops is only available from 1994 onwards. Figure 11 presents salmon catches by the coops for the period 1994 to 2016. It should be noted that regulations affecting the operation of the coops have varied considerably over this time as described earlier. The principal changes of note are the introduction of national spring salmon byelaws in 1999 and the application of catch conditions to the fishery in 2014-2016. The coops have not operated in some years for various reasons including 1996 and 2016. The coops were operated by the Environment Agency in 1999 as part of a radio-tracking project and were modified to greatly improve their capture efficiency so catches from that year (64 salmon were radio-tagged) are not included here.

21 of 68
Figure 11 : Salmon catches made in the coops fishery on the River Eden, 1994 to 2016.
Sea trout catches from the coops fishery are presented in Figure 12 below. In addition to comments provided above regarding the operation of the coops, it should be noted that the coops are relatively ineffective at trapping sea trout because of the design of the traps (specifically bar spacings in the traps). Consequently, catches of sea trout in the coops are low. As can be seen, annual catch of sea trout in the Corby Coops varied from zero to six fish over the period 1994 to 2016 (Figure 12).
Figure 12 : Sea trout catches from the coops fishery on the River Eden, 1994 to 2016.

22 of 68
2.2. Rod fishery catches
Border Esk
The catches presented here are declared rod catch data collated from Environment Agency rod licence returns. It should be noted that these data are incomplete from the Border Esk due to cross-border issues relating to rod licences and that as a consequence of this, catches prior to 2004 in particular are under-represented i.e. total catches were considerably higher than those presented and in particular prior to 2004. Catchment-wide data is currently unavailable from any alternative sources.
Figure 13 below presents declared salmon rod catch from the Border Esk over the period 1993 to 2016. Although there appears to be no over-arching trend in salmon catches over this period based on the data as presented, catches in each of the last four years (2013 to 2016) have been amongst the lowest on record. Noting the historic catch declaration issues described above for 2003 and earlier, it is likely that salmon catches in the last four years have been considerably and consistently below those experienced throughout much of this time period. Indeed, the average rod catch of salmon from 2004 to 2012 was 919 salmon but was just 367 salmon between 2013 and 2016.
Proportions of salmon released by Border Esk anglers have improved considerably since 1993. In 1993 anglers released just 10% of fish, while in 2016 72% of fish were released. However, catch and release remains relatively poor when compared to the overall proportion of salmon released across Agency (and NRW)-regulated rivers (80% in 2016).
Figure 13 : Declared salmon rod catch from the Border Esk, 1993 to 2016.
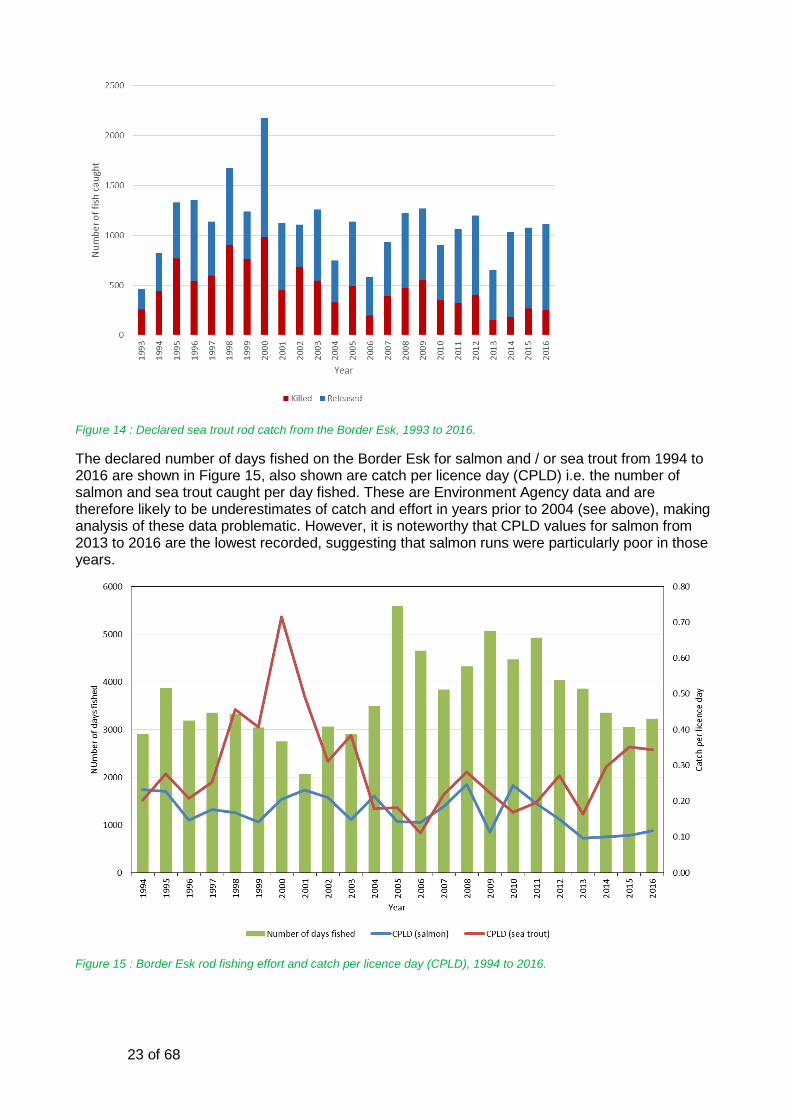
Figure 14 below presents declared sea trout rod catches from the Border Esk over the period 1993 to 2016. As described above, rod catches from the Border Esk are incomplete prior to 2004 and were likely to have been significantly higher than reported here over the period 1993 to 2003. Hence, although sea trout rod catch from the Border Esk appears to have remained relatively stable over the period 1993 to 2016 (Figure 14), it is likely that actual catches over the last ten years were considerably lower than those made during the 1990s and earlier. Importantly, and based on available rod catch data and anecdotal information, there is no evidence of any improvement in sea trout stocks in the Border Esk since 2008 i.e. over the lifespan of the recently-expired regulatory package for the catchment.
The proportion of sea trout released by anglers fishing the Border Esk has increased steadily from 1993 (44%) to 2016 (77%), peaking at 83% in 2014.
23 of 68
Figure 14 : Declared sea trout rod catch from the Border Esk, 1993 to 2016.
The declared number of days fished on the Border Esk for salmon and / or sea trout from 1994 to 2016 are shown in Figure 15, also shown are catch per licence day (CPLD) i.e. the number of salmon and sea trout caught per day fished. These are Environment Agency data and are therefore likely to be underestimates of catch and effort in years prior to 2004 (see above), making analysis of these data problematic. However, it is noteworthy that CPLD values for salmon from 2013 to 2016 are the lowest recorded, suggesting that salmon runs were particularly poor in those years.
Figure 15 : Border Esk rod fishing effort and catch per licence day (CPLD), 1994 to 2016.
24 of 68
River Eden
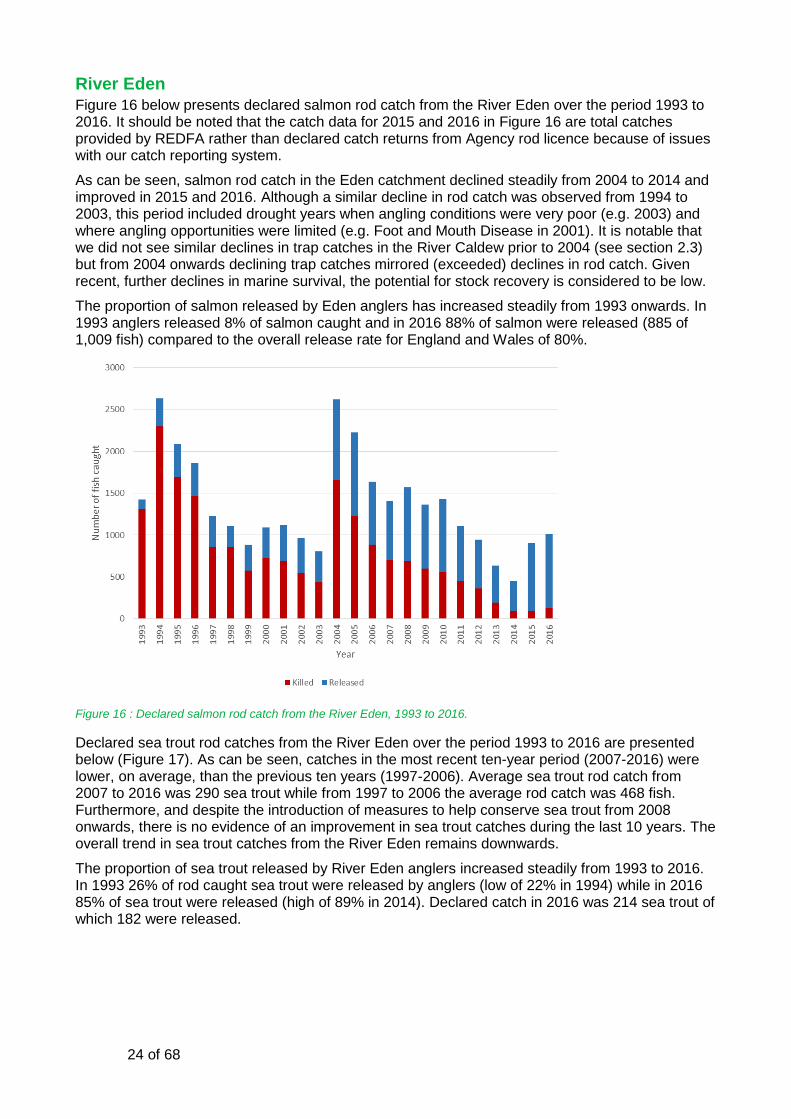
Figure 16 below presents declared salmon rod catch from the River Eden over the period 1993 to 2016. It should be noted that the catch data for 2015 and 2016 in Figure 16 are total catches provided by REDFA rather than declared catch returns from Agency rod licence because of issues with our catch reporting system.
As can be seen, salmon rod catch in the Eden catchment declined steadily from 2004 to 2014 and improved in 2015 and 2016. Although a similar decline in rod catch was observed from 1994 to 2003, this period included drought years when angling conditions were very poor (e.g. 2003) and where angling opportunities were limited (e.g. Foot and Mouth Disease in 2001). It is notable that we did not see similar declines in trap catches in the River Caldew prior to 2004 (see section 2.3) but from 2004 onwards declining trap catches mirrored (exceeded) declines in rod catch. Given recent, further declines in marine survival, the potential for stock recovery is considered to be low.
The proportion of salmon released by Eden anglers has increased steadily from 1993 onwards. In 1993 anglers released 8% of salmon caught and in 2016 88% of salmon were released (885 of 1,009 fish) compared to the overall release rate for England and Wales of 80%.
Figure 16 : Declared salmon rod catch from the River Eden, 1993 to 2016.
Declared sea trout rod catches from the River Eden over the period 1993 to 2016 are presented below (Figure 17). As can be seen, catches in the most recent ten-year period (2007-2016) were lower, on average, than the previous ten years (1997-2006). Average sea trout rod catch from 2007 to 2016 was 290 sea trout while from 1997 to 2006 the average rod catch was 468 fish. Furthermore, and despite the introduction of measures to help conserve sea trout from 2008 onwards, there is no evidence of an improvement in sea trout catches during the last 10 years. The overall trend in sea trout catches from the River Eden remains downwards.
The proportion of sea trout released by River Eden anglers increased steadily from 1993 to 2016. In 1993 26% of rod caught sea trout were released by anglers (low of 22% in 1994) while in 2016 85% of sea trout were released (high of 89% in 2014). Declared catch in 2016 was 214 sea trout of which 182 were released.

25 of 68
Figure 17 : Declared sea trout rod catch from the River Eden, 1993 to 2016.
The declared number of days fished on the River Eden for salmon and / or sea trout from 1994 to 2016 are shown in Figure 18, also shown are the catch per licence day (CPLD) for both species i.e. the number of salmon and sea trout caught per day fished. As can be seen, fishing effort has remained relatively stable from the late 1990s onwards. It should be noted that fishing effort in 2015 and 2016 may be under-estimated as a result of issues with our rod licence data collection system.
Salmon CPLD has declined steadily since 2004, indicating a declining population. Although CPLD appears to have increased in 2015 and 2016, it is unclear how much of this apparent improvement is as a result of increased numbers of salmon available to catch and how much of this is related to data collection issues and effort being under-estimated as described above. Sea trout CPLD has remained relatively stable throughout the period 1993 to 2016.

26 of 68
Figure 18 : River Eden rod fishing effort and catch per licence day (CPLD), 1994 to 2016
2.3. Trap and counter data
Caldew Trap
The River Caldew is a major tributary of the lower River Eden which it joins in Carlisle. Fish passes were built at two previously impassable, large weirs on the Caldew in the 1980s and a fish trap was installed in the lower of these (Holmehead Weir, Carlisle, see Error! Reference source not found.) and operated continuously from 1991 to early 2014 when health and safety and resourcing issues meant that trapping was no longer possible. Note that the trap was not operated in 2001 because the outbreak of Foot and Mouth Disease prevented site access (instead, the fish pass was open for fish to ascend).
As the weir was previously impassable, the fish pass was (is) the only means for fish to pass over this obstacle. Hence, the fish trap caught all salmon and sea trout ascending the River Caldew and provided us with very accurate data on runs of these fish into this part of the catchment. Salmon runs into the River Caldew were found to be predominantly composed of autumn-running one-sea-winter fish in contrast to the much broader run-timing of salmon ascending the mainstem Eden beyond Carlisle.
Figure 19 below presents total numbers of salmon caught in the Caldew trap from 1991 onwards. As can be seen, significant numbers of salmon ascended the Caldew from the start of sustained monitoring in 1991, peaking in 2004 with 1,699 salmon counted. However, the overall trend in run size since 2004 was downwards, culminating in the lowest recorded catch of just 84 salmon in 2012.

27 of 68
Figure 19 : Salmon catches in a whole-river trap on the River Caldew, 1991-2013. No trapping was carried out in 2001 (see text) and trapping unfortunately ceased in early 2014.
Figure 20 below presents total sea trout catches made in the Caldew trap from 1991 onwards. As can be seen, catches of sea trout in the Caldew were relatively low and peaked at 131 fish in 1995. Catches of sea trout declined steadily from 2002 onwards and in the last season of monitoring were the lowest on record at just nine fish.
Figure 20 : Sea trout catches in a whole-river trap on the River Caldew, 1991-2013. No trapping was carried out in 2001 (see text) and trapping unfortunately ceased in early 2014.

28 of 68
Great Corby fish counter Great Corby fish counter is located on the mainstem River Eden near Wetheral (Error! Reference source not found.), 25km above the tidal limit. It is an electronic resistivity fish counter featuring three separate counting channels each of which is approximately 13m wide. As a result of its large channel widths, it has proved impossible to apportion fish counts to species. As a result of this, total salmon (or sea / brown trout) runs over the counter have never been obtained from this installation.
Significant issues with counter malfunction and flood damage have also been experienced at this site, further limiting the usefulness of the information it provides. Of particular note is the absence of any data from mid-July 2014 to mid-October 2014 due to an electronics issue, and incomplete data for 2016 due to flood damage succumbed during Storm Desmond in December 2015. The fish counter has not been repaired following this flood damage as it is likely that fish counting will cease here in the coming years due to issues with fish passage at the site.
Notwithstanding the issues outlined above, data from Great Corby fish counter for the period 2000-2015 is presented below (Figure 21). The data presented in Figure 21 are net upstream counts (i.e. taking into account descending fish) but are not species-specific and therefore include salmon, sea / brown trout, grayling, sea lamprey and other species that could potentially pass over the fish counter.
Figure 21 : Net upstream counts recorded at Great Corby fish counter, River Eden, 2000-2015. Please see text for more information.
Because it is not possible to split counter data into individual species counts, no further analysis of this data has been carried out.

29 of 68
2.4. Juvenile fish stocks
General - a national context
The Environment Agency carry out a programme of juvenile salmonid monitoring across all principal salmon and sea trout rivers to identify spatial and temporal changes in fish populations. At present, sites are surveyed every two years for temporal monitoring and every six years for spatial monitoring.
Figure 22 below presents the mean salmon fry densities recorded across all survey sites in England and the Border Esk from 2001 onwards. Although data does not come from an identical set of sites in each year, salmon are expected to be present at all sites included in this analysis. Nonetheless, these data provide the best general indication of overall changes in juvenile recruitment throughout England and Wales over the period. As can be seen, the mean salmon fry density recorded in 2016 was the lowest over the period and is probably the lowest ever recorded. This highlights the poor salmon recruitment that was observed throughout this area in 2016. The reasons for reduced salmon densities in 2016 vary across the country but are likely to include the impacts of extreme winter floods in late 2015 and early 2016 and high water temperatures over the winter, exacerbated by low numbers of returning adult salmon.
Figure 22 : Mean salmon fry densities observed across England and the Border Esk, 2002-2016. Error bars show the 95% confidence intervals around these means.
Salmon parr densities in 2016 were also among the lowest recorded nationally (Figure 23). It is likely that the factors influencing salmon fry densities (above) have also influenced parr densities, in particular several years of poor adult returns leading up to 2016.

30 of 68
Figure 23 : Mean salmon parr densities observed across England and the Border Esk, 2001-2016. Error bars show the 95% confidence intervals around these means.
Salmon - Border Esk and River Eden
As described above, salmon fry densities recorded in 2016 were probably the lowest ever recorded nationally. Electrofishing information from the rivers Border Esk and Eden are presented below to provide a local context and additional, more detailed information (site-by-site data) are presented in Appendix 2. Note that data are only presented for sites accessible to salmon and that we expect salmon to be found at.
Comparison of fry densities observed in streams across the Border Esk and Eden catchments in 2016 with potential capacities in these streams (i.e. the highest densities observed from 2002 onwards, Figure 24) shows that fry densities were considerably below capacity in most parts of the catchment. This confirms that fry recruitment was poor from the 2015/16 spawning season.

31 of 68
Figure 24 : Salmon fry classifications for sites surveyed in 2016. The left map shows the best classifications recorded at each site since 2002 and the right map shows the 2016 classifications of the same sites.
Table 2 below presents the number of survey sites in each salmon fry density class at recent potential densities and as recorded in 2016. In both catchments fry densities were considerably below potential (i.e. the highest densities observed from 2002 onwards) in 2016 with few sites containing fry densities in the upper three density classifications. This was particularly marked in the Border Esk where no sites were recorded with salmon fry densities of grades A to C in 2016 while 87.5% of sites have demonstrated this potential in recent years. In the River Eden, more than half the sites surveyed in 2016 had no salmon fry present at all.
Table 2 : Proportions of survey sites in each salmon fry density class at recent site potential and as recorded in 2016. Recent site potential is assumed to be at the highest densities recorded from 2002 onwards.
Salmon fry classification
Border Esk River Eden
Potential 2016 Potential 2016
A (Excellent) 75% 0% 40% 4%
B (Good) 6% 0% 15% 4%
C (Fair) 6% 0% 11% 4%
D (Fair) 6% 31% 13% 13%
E (Poor) 6% 56% 17% 21%
F (Absent) 0% 13% 4% 53%
Figure 25 below presents salmon parr density classifications recoded in 2016 alongside recent site potential classifications (i.e. the best densities recorded at each site from 2002 onwards). As

32 of 68
described above for salmon fry, salmon parr densities recorded in 2016 were significantly below site potential densities in most parts of both catchments. These data, when considered in combination with salmon fry data above, indicate that to populations of at least two year-classes of juvenile salmon are in poor health.
Figure 25 : Salmon parr classifications for sites surveyed in 2016. The left map shows the best classifications recorded at each site since 2002 and the right map shows the 2016 classifications of the same sites.
Table 3 below contains the number of survey sites in each salmon parr density class at recent potential densities and as recorded in 2016. Like salmon fry, salmon parr densities in the Border Esk and Eden catchments were considerably below site potentials (i.e. the highest densities observed from 2002 onwards) in 2016. In the Border Esk, few sites were class A in 2016 and there were no sites in class B yet these are the dominant classes with regard to site potential. This pattern was broadly similar in the River Eden but, as with fry, a significant proportion of survey sites (32%) had no salmon parr present in them in 2016.
Table 3 : Proportions of survey sites in each salmon parr density class at recent site potential and as recorded in 2016. Recent site potential is assumed to be at the highest densities recorded from 2002 onwards.
Salmon parr classification
Border Esk River Eden
Potential 2016 Potential 2016
A (Excellent) 63% 6% 36% 9%
B (Good) 31% 0% 26% 15%
C (Fair) 0% 44% 17% 17%
D (Fair) 0% 31% 11% 9%
E (Poor) 0% 13% 11% 19%
F (Absent) 6% 6% 0% 32%

33 of 68
Taking all of the above into account, we conclude that juvenile salmon densities across both catchments are considerably below potential population levels. Given the general, relatively low juvenile densities across both catchments it is likely that potential density dependent effects (i.e. competition between juveniles for space and resources) are much reduced. Consequently, any increase in numbers of salmon spawning in either catchment is likely to increase juvenile fish stocks, smolt output and subsequent adult returns.
Sea trout - Border Esk and River Eden Figure 26 below contains sea / brown trout fry density classifications across the rivers Border Esk and Eden catchments, both for recent site potential and as recorded in 2016. Recent site potential classifications are the best results recorded at each site from 2002 and are used as a surrogate for site carrying capacity. As can be seen in Figure 26, trout fry densities were below site capacities across parts of both catchments. Although this is most apparent in the River Eden, it should be noted that many of these sites are likely to be dominated by non-migratory brown trout rather than sea trout, particularly in Southern parts of the catchment.
Figure 26 : Brown / sea trout fry classifications for sites surveyed in 2016. The left map shows the best classifications recorded at each site since 2002 and the right map shows the 2016 classifications of the same sites.
Table 4 below contains the proportion of survey sites in each brown / sea trout fry density class at recent potential densities and as recorded in 2016. As might be expected, fewer sites in both catchments were in the top three classification grades in 2016 when compared to site potentials (i.e. the highest densities observed from 2002 onwards). Notably, on the Border Esk, which is predominantly a sea trout (rather than brown trout) river, the proportion of sites in class A or B in 2016 was just 38% compared to 100% at site potential.

34 of 68
Table 4 : Proportions of survey sites in each sea / brown trout fry density class at recent site potential and as recorded in 2016. Recent site potential is assumed to be at the highest densities recorded from 2002 onwards.
Sea / brown trout fry classification
Border Esk River Eden
Potential 2016 Potential 2016
A (Excellent) 94% 38% 47% 6%
B (Good) 6% 0% 21% 15%
C (Fair) 0% 25% 9% 11%
D (Fair) 0% 19% 15% 13%
E (Poor) 0% 19% 6% 28%
F (Absent) 0% 0% 2% 28%
Figure 27 below presents sea / brown trout parr density classifications for the rivers Border Esk and Eden in 2016 alongside the recent potential densities (i.e. best densities recorded from 2002 onwards). As can be seen, trout parr classifications in parts of both catchments were below recent potential levels. Again, it should be noted that many sites in the Eden catchment are likely to be dominated by non-migratory brown trout rather than sea trout, particularly in Southern parts of the catchment.
Figure 27 : Brown / sea trout parr classifications for sites surveyed in 2016. The left map shows the best classifications recorded at each site since 2002 and the right map shows the 2016 classifications of the same sites.
Table 5 below contains the number of survey sites in each brown / sea trout parr density class at recent potential densities and as recorded in 2016. Considerably fewer sites in each catchment

35 of 68
were class A or B in 2016 when compared to recent site potentials (i.e. the highest densities observed from 2002 onwards). This was most noticeable for the Border Esk where previous results found that 63% of sites had the potential to be class A for trout parr but no class A sites were recorded in 2016.
Table 5 : Proportions of survey sites in each sea / brown trout parr density class at recent site potential and as recorded in 2016. Recent site potential is assumed to be at the highest densities recorded from 2002 onwards.
Sea / brown trout parr classification
Border Esk River Eden
Potential 2016 Potential 2016
A (Excellent) 63% 0% 36% 9%
B (Good) 31% 25% 26% 9%
C (Fair) 0% 44% 17% 21%
D (Fair) 0% 19% 11% 19%
E (Poor) 0% 13% 11% 23%
F (Absent) 6% 0% 0% 19%
Taking all of the above into account, we conclude that juvenile sea trout densities across both catchments are considerably below potential population levels. Given the relatively low juvenile densities across both catchments it is likely that potential density dependent effects (i.e. competition between juveniles for space and resources) are much reduced. Consequently, any increase in numbers of sea trout spawning in either catchment is likely to increase juvenile fish stocks, smolt output and subsequent adult returns.
3. Stock assessment 3.1. Salmon
General Salmon Conservation Limits (CLs), expressed in numbers of salmon eggs, have been developed by the Environment Agency to ensure that enough salmon exist in the river to sustain the salmon population above a Minimum Biologically Acceptable Level (MBAL). This assessment procedure has been internationally agreed with ICES and NASCO. Salmon stock CLs represent the minimum desirable spawning levels below which stocks should not be allowed to fall as there is a progressively increasing risk of long-term damage to fish stocks. Note that no equivalent stock levels (CLs or similar) have been defined for sea trout as yet, although an ICES working group has recently been established to develop biological reference points for this species.
Salmon stock performance on each principal salmon river is assessed annually using a CL compliance scheme that is designed to give an early warning that a stock has fallen or is likely to fall below its CL. Regression analyses are applied to egg deposition estimates from the last 10 years to determine whether or not there is an underlying statistical trend in the data over this period. Annual egg deposition estimates are calculated from a Returning Stock Estimate (RSE) derived from adult rod and trap catch data (accounting for released fish) and estimates of rod exploitation rate, natural in-river mortality, salmon run composition, marine survival, fecundity and sex ratios.
The salmon stock Management Objective (MO), which defines whether a salmon stock is at a sustainable level, requires each river’s CL to be achieved in four years out of five, on average. To enable achievement of this objective, a Management Target (MT) has also been defined which

36 of 68
represents an aspirational stock level set above the CL that should be aimed at when introducing management measures. The salmon CL and MT for each river therefore provide essential reference points to guide the need for management of stocks and the fisheries that exploit them.
Compliance failures of the CL require the Environment Agency to take action to reduce the numbers of salmon killed to maximise salmon spawning escapement through voluntary and / or regulatory measures. In defining any required actions, the Agency must adhere to its Decision Structure (Appendix 1). Annual stock compliance assessments are published annually and jointly by Cefas, the Environment Agency and Natural Resources Wales (e.g. Cefas et al, 2017). Further information to aid with interpretation of our compliance assessments can also be found in Appendix 3.
The salmon CL for the River Eden was first published in the River Eden Salmon Action Plan (SAP) consultation document in 1997 (Environment Agency, 1997). This CL was subsequently revised downwards in 2003 to reflect reduced marine survival and to help focus conservation measures towards issues that could be locally managed (Cefas et al, 2003). The current CL for the Eden is 200 eggs per 100m2 of accessible wetted area (688 Ha), equating to a total of 13.75 million eggs. The Eden’s MT is currently calculated to be 18.82 million eggs (Cefas et al, 2017).
The salmon CL for the Border Esk was first published in the Border Esk Fisheries Plan (equivalent to a SAP) consultation document in 2003 (Environment Agency, 2003). The current CL for the Border Esk is 255 eggs per 100m2 of accessible wetted area (306 Ha), equating to a total of 7.79 million eggs. The Border Esk’s MT is currently calculated to be 10.81 million eggs (CEFAS et al, 2017).
It should be noted that the actual number of adult fish required to fulfil the CL can vary considerably between years, reflecting annual variation in the ratio of one sea winter (1SW) grilse to multi sea winter (MSW) fish and differences in fish sizes within these age classes. Not only are MSW fish larger but a larger proportion are female so the overall contribution of MSW fish to total egg deposition is disproportionately large. These annual differences in run composition are incorporated within calculations of annual egg depositions.
As stated above, no equivalent benchmark for the assessment of sea trout stocks is currently available.
Border Esk
Figure 28 presents estimated salmon egg deposition in the Border Esk catchment from 1994 to 2016. As can be seen, estimated egg deposition levels from 2013 onwards have all been considerably below CL. This is despite reductions in the numbers of salmon killed in coastal and riverine fisheries over the last 10 years, and likely improvements in rod catch data since 2004. These recent poor years are mirrored in rivers throughout the salmon’s Southern range which includes the UK.

37 of 68
Figure 28 : Estimated salmon egg deposition in the Border Esk catchment, split into fishery escapement (i.e. “uncaught” fish) and contribution for catch and release angling. Also shown is the Conservation Limit for the Border Esk.
Figure 29 presents the Border Esk salmon CL compliance from 2007 to 2016. As can be seen, salmon egg deposition in the Border Esk has failed to achieve the river’s CL in each of the last four years (2013 to 2016 inclusive), and the overall statistical trend over the ten year assessment period is downwards. For more information on interpreting this information please see Appendix 3.
The Border Esk’s salmon stock is currently classified as “Probably at Risk” of failing the Management Objective and is predicted to remain so in five years’ time.
The stock has not met the management objective (MO) of meeting CL in four years out of five and therefore cannot be considered to be at a sustainable and safe level. The earliest that the Border Esk can meet this MO is following the 2020 salmon stock assessment that will be carried out in 2021, and this is dependent on the river achieving its CL each year until then.
Historically, the Border Esk salmon stock had a significant grilse component (e.g. 87.5% in 2006 based on Environment Agency rod catch data). The grilse stock component has, in recent years, undergone a notable decline nationally (Cefas et al, 2017) and this also is evident from Border Esk rod catch data. In 2016, an estimated 41.0% of rod caught salmon were grilse.
On the basis of the 2016 salmon CL stock assessment and predicted future stock status as described above, the national salmon management decision structure requires the Environment Agency to identify a range of options to ensure that the observed trend in spawning escapement is reversed within five years.

38 of 68
Figure 29 : Estimated salmon egg deposition and Conservation Limit (CL) compliance in the Border Esk catchment. Annual egg deposition estimates are presented as black circles and the CL as a solid red line. The thick black line shows the 20th percentile trend line and the yellow shaded area the upper and lower bound of the confidence interval around this.
River Eden Up to and including 2013, salmon egg deposition in the River Eden was estimated using a combination of rod catch data for the bulk of the catchment and trap catch data for the River Caldew. Egg depositions were estimated from these two sets of data and added together to produce a catchment-wide total. However, it is likely that a proportion of rod catches in the mainstem Eden were also of salmon destined for the River Caldew, resulting in a small degree of double-reporting in egg deposition estimates and slightly exaggerated CL compliance.
From 2014 onwards and in the absence of trap catch data from the River Caldew (see Section 2.3 above), an additional correction was made to the rod-based assessment to account for the lack of trap data. This correction, the total egg deposition scaled up by the size of the Caldew catchment, is very likely to have overestimated egg deposition in the River Caldew and the Eden as a whole because in the last few years of trap operation, runs into the Caldew were very poor. It is therefore likely that egg depositions from 2014 to 2016 are also over-estimated and consequently CL compliance exaggerated.
Nonetheless, Figure 30 presents the published estimated salmon egg depositions in the River Eden from 1994 to 2016 in relation to the river’s CL. As can be seen, estimated egg deposition in the Eden has fallen considerably and consistently since 2004 to an all-time low in 2014. In 2013 and 2014 the river failed to achieve its CL by a significant margin and failed again in 2015 although by the narrowest of margins (just over 1%).
Although low levels of egg deposition were observed in the River Eden from 1998 to 2003, the more recent decline since 2004 is considerably more concerning because on this occasion similar trends have been reported throughout the Southern range of the salmon (e.g. CEFAS et al, 2017) and because of ongoing measures to reduce exploitation. Furthermore, marine survival has continued to decline, reducing the potential for the stock to recover. The decline since 2004 has occurred despite reductions in the numbers of salmon killed in coastal and riverine fisheries over

39 of 68
this period, including the introduction of the current NLO and byelaw package in 2008 and a significant increase in catch-and-release angling through statutory and voluntary means.
Figure 30 : Estimated salmon egg deposition in the River Eden catchment, split into fishery escapement (i.e. “uncaught” fish) and contribution for catch and release angling. Also shown is the Conservation Limit for the River Eden.
Figure 31 presents the River Eden salmon CL compliance from 2007 to 2016. As can be seen, salmon egg deposition in the River Eden failed to achieve the river’s CL by a significant margin in two of the last four years (2013 and 2014). It narrowly failed to achieve its CL in 2015 too (98.9% CL attained) and the overall statistical trend over the ten year assessment period is downwards. For more information on interpreting this information please see Appendix 3.
The River Eden’s salmon stock is currently classified as “Probably at Risk” of failing the Management Objective and is predicted to remain so in five years’ time.
The stock has not met the management objective (MO) of meeting CL in four years out of five and therefore cannot be considered to be at a sustainable and safe level. The earliest that the River Eden can meet this MO is following the 2018 salmon stock assessment that will be carried out in 2019, and this is dependent on the river achieving its CL each year until then.
In addition, because the River Eden failed to achieve its CL in 2013 and 2014, the River Eden SAC is considered to be in “Unfavourable Condition” for salmon because the achievement of the MO for salmon also dictates condition status of the SAC. Consequently, the earliest that the SAC can be considered to be in “Favourable Condition” is also 2019 and again this is dependent on no further failures to achieve CL in the years leading up to this. This reinforces the need to take significant action to address the shortfall in salmon egg deposition in this catchment.

40 of 68
Figure 31 : Estimated salmon egg deposition and Conservation Limit (CL) compliance in the River Eden catchment. Annual egg deposition estimates are presented as black circles and the CL as a solid red line. The thick black line shows the 20th percentile trend line and the yellow shaded area the upper and lower bound of the confidence interval around this.
As mentioned above, egg deposition in the River Caldew sub-catchment was calculated using trap catch data up to and including 2013 (Figure 32). These data show that from 2009 to 2013 inclusive, the River Caldew failed its CL and that this failure was particularly significant from 2011 to 2013 when less than half of the river’s CL was attained. Thus, the only independent adult run-size data we have in the Solway area very clearly demonstrates an acute and rapid decline in salmon stocks since 2004.
Trapping ceased after 2013 and since then egg deposition in the River Caldew has been estimated based on the rod catch from the wider Eden catchment.
As stated above, incorporation of Caldew trap data into catchment-wide egg deposition estimates is complicated (inflated) by likely double-reporting of fish up to 2013 and over-correction from 2014 onwards in the absence of any trap data. To remove the influence of this and to verify the River Eden's current and future predicted risk categories, CL compliance was reassessed excluding egg deposition estimates from the River Caldew (Figure 33). Although reassessment of the River Eden's CL compliance results in an additional clear CL failure in 2015 and the narrow avoidance of a fourth failure in 2016 it does not affect the risk category of the river either now (Probably At Risk) or in five years' time (Probably At Risk).

41 of 68
Figure 32 : Estimated salmon egg deposition in the River Caldew from 1994 to 2013, assessed by trap captures. The Conservation Limit for the River Caldew is indicated by a red, horizontal line. No trapping was carried out in 2001 due to access restrictions.
However, because 2015 becomes a clear CL failure, the earliest that the River Eden SAC can move into "Favourable Condition" is spring 2020 following the 2019 compliance assessment. Again, this is dependent on there being no additional CL failures up to and including 2019.
Figure 33: Estimated salmon egg deposition and Conservation Limit (CL) compliance in the River Eden catchment, excluding a separate Caldew contribution. Annual egg deposition estimates are presented as black circles and the CL as a solid red line. The thick black line shows the 20th percentile trend line and the yellow shaded area the upper and lower bound of the confidence interval around this.

42 of 68
Salmon stock assessment - conclusion
Salmon stocks in both the Border Esk and the River Eden are currently classified as "Probably at Risk" of failing to achieve the Management Objective and predicted to remain so in five years' time. The Environment Agency is therefore required to identify a range of options to ensure that the observed trend in spawning escapement is reversed within five years on each river.
3.2. Sea trout As stated above, no similar biological benchmarks are available against which to assess sea trout stocks in the rivers Border Esk or Eden (or any other river in England). In lieu of this, the Environment Agency has developed a method of assessing recent performance in the rod fishery against longer term data. This method uses two criteria: the trend in catch per unit effort (CPUE) over the last 10 years and the current CPUE relative to the previous 10 years. The results are placed into one of four categories: “At risk”, “Probably at risk”, “Probably not at risk” and “Not at risk”. There is no forward projection for status in five years’ time as there is with salmon.
Sea trout stock assessments as described above have been carried out each year since 2008. The sea trout rod fisheries of the rivers Border Esk and Eden were considered to be either At Risk or Probably at Risk up to and including 2014. In 2015 and 2016, the rod fisheries of both rivers were considered to be Probably Not At Risk or Not At Risk. Although this suggests that both stocks are now in a relatively healthy condition, it should again be noted that these assessments are not evaluated against any habitat related targets (i.e. the number of sea trout of a given life stage each river should be producing) but only reflect relatively recent changes in rod catches and effort (changes over the most recent ten years). They do not, for example, take into account the considerably higher rod catches reported from the Border Esk in the 1980s and 1990s when anecdotal information suggests that catches of over 5,000 sea trout per year were not unusual. Instead, they only reflect changes over the most recent ten years when catches have been relatively low and static.
Furthermore, sea trout rod fishery assessments have only improved to Not at Risk or Probably Not at Risk for the 2015 and 2016 assessment periods which does not cover the length of the sea trout’s life cycle. Therefore, caution is required to ensure that apparent improvements in stocks are real and allowed to improve into the future.
Overall, we consider sea trout stocks in both rivers remain at threat and requiring further protection. No sustained improvements in catches have been observed during the ten-year lifespan of the recently-expired, time-limited package of regulatory measures that controlled fishery-related sea trout losses in the Solway Firth haaf net fishery or rod fisheries, and recent juvenile fish population surveys demonstrate considerable scope for increased juvenile production.

43 of 68
4. Management options 4.1. Introduction and broad options The salmon and sea trout stock assessment process has considered net, trap and rod fishery and juvenile stock performance since the introduction of the previous NLO and byelaw package in 2007. As described earlier, salmon stocks in the rivers Border Esk and Eden are currently both classified as “Probably at Risk” and predicted to remain so in five years’ time. As such, our Decision Structure (Appendix 1) guides us to identify a range of options to ensure that, within a five-year period, sufficient spawning escapement occurs such that there is a less than 50% probability of failure of meeting the management objective (CL exceeded in four out of five years).
It is our opinion that to further protect these salmon populations, we need to reduce the number of fish being killed in the net, trap and rod fisheries for up to the next ten years. In addition, sea trout stocks require sufficient protection to ensure that apparent stock improvements in recent years are not undermined. Consequently, the numbers of sea trout killed should not be allowed to increase as a result of any package of measures introduced.
However, where possible we need to find a balance to ensure that the socio-economic importance of the fisheries and the benefits they provide to the wider community are recognised and that any impacts are balanced between all fisheries concerned. The Environment Agency’s national salmon management decision structure (Appendix 1) requires the Agency to maximise socio-economic benefits wherever possible and to balance this against the need to adequately manage fish stocks.
The broad options below have been considered for the management of salmon and sea trout stocks in the Solway Firth and the rivers Border Esk and Eden from 2018 onwards.
Option 1: Do nothing If we do nothing, the existing time-limited NLO and byelaw package that regulates, in part, numbers of fish killed in the Solway Firth and the rivers Border Esk and Eden will not be renewed. As a result of this, there is unmanageable risk that numbers of fish killed will increase in all fisheries concerned, further threatening salmon stocks that are “Probably at Risk” now and predicted to remain so in five years’ time, and impacting on sea trout stocks that have only recently shown signs of recovery. In doing so, we will have contravened our own management decision structure, our requirements under the Habitats Directive and, crucially, increased the threat to fish stocks.
Although the national regulatory proposals for salmon that are currently being considered that may, at least in part, address these risks, at the time of writing there is no certainty around what this national package of measures will deliver and when, and whether or not these measures will adequately protect sea trout.
Consequently, the option to “Do nothing” is not considered any further here as it is not a viable management option.
Option 2: Renew current time-limited NLO and byelaws
The 2007 time-limited NLO and byelaw package could be renewed “as is”. Although this option would maintain the socio-economic benefit of the fisheries at their current levels, it will not result in a sufficient reduction in numbers of fish killed and therefore will be in contravention of the Agency’s management decision structure, non-compliant with our obligations under the Habitats Directive and, crucially, will fail to improve fish stocks.
Consequently the option to renew the current (November 2007) time-limited NLO and byelaw package is not considered further here as it is not considered a viable management option.

44 of 68
Option 3: Limited (reduced) numbers of salmon killed, and maintained or reduced numbers of sea trout killed This option would require reductions in numbers of salmon killed in all rod, net and trap fisheries to levels that are compliant with the Agency’s management decision structure and compliant with our obligations under the Habitats Directive while maintaining the socio-economic and heritage values of the fisheries concerned where possible.
This option will be taken forward for further consideration in section 0 below.
Option 4: Mandatory catch and release of salmon, and maintained or reduced numbers of sea trout killed This option would require all rod, net and trap fisheries to immediately and safely release any salmon caught back into the river or estuary they were caught in. Method restrictions would be considered as a means to improve survival of salmon released. Numbers of sea trout killed could be controlled by means of a daily and / or seasonal bag limit, close periods, licence availability and / or a requirement to release female sea trout after a given date.
This option would be compliant with the Agency’s management decision structure and is likely to be compliant with our obligations under the Habitats Directive. This option would also allow all fisheries to continue to operate and therefore, at least in part, protect the socio-economic and heritage value of these fisheries.
This option will be taken forward for further consideration in section 0 below.
Option 5: Time-limited closure of one or more fishery, mandatory catch and release of salmon and maintained or reduced sea trout kill in remaining fishery(s)
This option would require rod fisheries in the rivers Border Esk and Eden to release all salmon caught immediately and safely back into the river where they were caught. The killing of sea trout would be controlled by means of a daily or seasonal bag limit and / or a requirement to release female sea trout caught after a given date.
The Solway Firth haaf net fishery and / or the River Eden Corby Coops fishery would not operate for a period of years.
This option would be compliant with the Agency’s management decision structure and is likely to be compliant with our obligations under the Habitats Directive. Furthermore, by allowing the rod fisheries of the rivers Border Esk and Eden to continue to operate it would, at least in part, maintain the socio-economic value of these fisheries. However, it would not maintain any socio-economic or heritage value from either the net or coops fishery and would result in a clear disparity between rod and other fisheries. Consequently, this option is not considered further here as it is not considered an appropriate management option.
Option 6: Close all fisheries The most protective time-limited package of measures that we could seek to introduce to protect salmon and sea trout stocks in the river Border Esk and Eden is the complete closure of all net, trap and rod fisheries that kill fish from these stocks for up to ten years. While such an option would clearly reduce numbers of fish killed, be compliant with our obligations under the Habitats Directive and provide the maximum protection of stocks, this option would also have a disproportionate and large socio-economic impact on the fisheries concerned and the wider local economy. This option would therefore also be in breach of our own management decision structure and the requirement to maintain socio-economic benefits where possible.
Consequently, the option to close all fisheries concerned for a period of years is not considered further here as it is not considered an appropriate management option.

45 of 68
4.2. Detailed options As stated above, it is our opinion that to further protect these salmon populations, we need to further reduce numbers of salmon killed in the net, trap and rod fisheries for up to the next ten years while ensuring that sea trout are adequately protected too. Broad options ranging from “do nothing” to complete closure of all relevant fisheries were considered above, with two of these broad options being deemed worthy of further consideration: a limited (reduced) kill of salmon in all fisheries, and 100% catch and release of salmon in these fisheries. Both options include reducing the numbers of sea trout killed.
4.2.1 Appropriate level of exploitation of salmon
In order to further consider the two options outlined above (Options 3 and 4), we must first determine what level of salmon (and sea trout) exploitation is an appropriate outcome from this process. As described earlier, salmon stocks in both the Border Esk and the River Eden are currently “Probably at Risk” and predicted to remain so in five years’ time. And, the River Eden SAC is currently in “unfavourable condition” for salmon and will remain so until at least 2019.
In line with recent regulatory reviews carried out elsewhere (e.g. River Ribble, River Tavy), the level of allowable exploitation of each stock is most easily defined as a proportion of the river's Conservation Limit that can be removed without a likely significant effect on future fish stocks.
On the River Tavy, an SAC for salmon that at the time (2014) was predicted to improve towards "Probably Not At Risk" by 2017, the allowable exploitation for the net fishery there was set at 1% of recent egg deposition levels on the basis that this was deemed unlikely to significantly impact on future stock levels. As noted above though, this stock was predicted to improve, unlike current predictions for the Border Esk or River Eden salmon stocks.
On the River Ribble which is not an SAC, this allowable exploitation level in the net fishery was set at a higher 2% of the CL at a time when the stock was considered to be “Probably at Risk” (2015) and predicted to remain so five years hence (2020).
Given the levels of exploitation permitted in the examples outlined above, we have investigated both 1% and 2% of egg deposition at CL as likely maximum levels of exploitation that we can consider in a single fishery. These equate to a maximum potential exploitation of 2% or 4% across both major fisheries affecting each river in most years (i.e. the Solway haaf net fishery and that river’s rod fishery). A key requirement in any regulatory package is that exploitation should be balanced between these major fisheries with a lower level of exploitation permitted in the Corby Coops fishery.
The numbers of eggs equivalent to 1% and 2% of CL of the rivers Border Esk and Eden are presented in Table 6 below.
Table 6 : Allowable exploitation of salmon from the rivers Border Esk and Eden expressed as number of eggs at 1% and 2% of Conservation Limit.
River Conservation Limit 1% of CL 2% of CL
Border Esk 13,750,166 137,502 275,003
Eden 7,794,854 77,949 155,897
Table 7 below presents estimated numbers of adult fish that correspond to 1% and 2% of each river's CL. It should be noted that the adult losses presented in Table 7 are the numbers of fish killed that are equivalent to 1% or 2% of CL. Importantly, any post-release losses in these fisheries (i.e. catch and release mortalities) are included in the figures presented in Table 7. These totals were calculated using the following information:
• CL equivalents as presented in Table 6.
• Mean fecundity of female fish in each catchment, estimated from rod catch data from the last five years (2012-2016).
• Proportion of returning adults that are female, estimated from rod catch data from the last five years (2012-2016).

46 of 68
• Net catch split between Border Esk (36%) and River Eden (64%), based on relative CLs.
In addition, two figures are presented for the haaf net fishery, the second to allow for a likely by-catch of salmon destined for rivers other than the Border Esk or River Eden. An assumed by-catch equivalent to 20% of total net catch was used.
Table 7 : Estimated number of adult salmon lost to each fishery that are equivalent to 1% or 2% of each river's Conservation Limit. These estimates include any fish lost as a result of catch and release mortality, including delayed mortality.
Proportion of CL lost to each fishery
Rod fisheries Haaf net fishery
Border Esk River Eden Border Esk and Eden exploited only
Catch composed of 20% other rivers
1% 25 42 66 82
2% 50 84 132 164
Thus, for example, 25 adult salmon is the approximate number of adult losses in the Border Esk rod fishery that is equivalent to removing 1% of CL. As stated above, this total includes fish killed directly in the fishery as well as any post-release mortalities associated with catch and release angling. Similarly, 66 fish is the total loss of adult fish from the haaf net fishery that equates to 1% of CL of each of the rivers Border Esk and Eden, and 82 fish is the equivalent loss if we assume that 20% of fish caught in the haaf net fishery are not destined for the Border Esk or River Eden.
Although, as stated above, we have considered an allowable kill in each major fishery equivalent to 2% of CL, we do not believe we can currently justify such levels of exploitation on salmon stocks from either the Border Esk or River Eden. In discounting this higher level of exploitation we have considered stock status and trend in each river and juvenile salmon abundance, considered comparable cases from elsewhere (most notably the then improving River Tavy example described above), and sought the advice of the Environment Agency's national fisheries teams. It should also be noted that even with such a precautionary approach, the salmon stock of the River Tavy subsequently declined rather than improving. In the case of the River Eden, we have also considered the currently unfavourable condition of the SAC and sought the advice of Natural England.
To summarise this section, we believe that we must introduce a regulatory package that is sufficiently robust to reduce allowable losses of salmon to no more than 1% of CL of each river in each major fishery. These losses include the direct killing of salmon and losses associated with catch-and-release fishing.
4.2.2 Recent levels of exploitation Table 8 below contains estimates of the proportion of CL removed by each fishery from each stock based on declared catches. Figures are presented for the three years immediately before and after the application of catch conditions in the haaf net fishery. To provide additional context, these are also expressed as proportions of total egg deposition in each year. It should be noted that these calculations include direct kills in each fishery and post-release mortalities. Rod fishery catch and release survival was assumed to be 90% based on previous studies and, in the absence of fishery-specific information, the same value was used for the net fishery. With respect to net fishery losses, these assume that 20% of net catches are not destined for either the Border Esk or the River Eden.

47 of 68
Table 8 : Estimated proportion of salmon eggs lost from the rivers Border Esk and Eden as a result of the operation of net and rod fisheries. Values are expressed as proportions of each river's Conservation Limit and estimated egg deposition (in parenthesis), see accompanying text for more information.
Year Border Esk River Eden
Net fishery Rod fishery Total loss Net fishery Rod fishery Total loss
2011 4.9% (2.5%) 18.7% (8.9%) 23.7% (11.4%) 5.2% (4.3%) 11.2% (8.9%) 16.4% (13.2%)
2012 3.7% (2.8%) 12.3% (8.9%) 16.0% (11.8%) 3.9% (3.6%) 9.1% (8.0%) 13.0% (11.6%)
2013 6.1% (8.3%) 6.7% (9.1%) 12.8% (17.5%) 6.4% (9.0%) 5.1% (7.3%) 11.5% (16.3%)
2014 2.2% (3.0%) 5.3% (7.1%) 7.4% (10.1%) 2.3% (4.2%) 3.0% (5.5%) 5.3% (9.8%)
2015 1.9% (2.6%) 5.9% (7.6%) 7.8% (10.3%) 2.1% (2.0%) 3.8% (3.7%) 5.9% (5.8%)
2016 3.2% (3.7%) 5.8% (6.5%) 9.1% (10.1%) 3.4% (2.9%) 4.6% (3.9%) 8.0% (6.8%)
As can be seen, catches in most years and from most fisheries greatly exceeded the desired level of allowable losses of 1% per fishery (Table 8). For each river's stock, losses attributable to rod fisheries exceeded those from the net fishery, although it should be noted that participation in each of the rod fisheries is significantly greater than in the net fishery. Total losses associated with these fisheries over this six year period ranged from 7.4% to 23.7% of CL in the Border Esk, and from 5.3% to 16.4% of CL in the River Eden (Table 8). In most years losses from the Border Esk were higher than from the River Eden. It is likely that this difference at least in part reflects lower catch and release rates in the Border Esk rod fishery.
Option 3: Limited (reduced) numbers of salmon killed
During a meeting with stakeholders in October 2017, we discussed proposals to allow limited salmon kills in each fishery to levels equivalent to approximately 1% of each river's CL. These limits were for one salmon per licensee per season in the haaf net fishery and fixed total kill limits in the rod fisheries of 25 fish per season across the Border Esk rod fishery and 42 fish per season across the River Eden rod fishery. We have modelled the impacts of these kill limits on egg deposition, including additional catch-and-release losses. These results are presented in Table 9 below and, like Table 8, these are expressed as the proportion of CL and egg deposition removed by each fishery. It is assumed that total catches are the same as declared, that catch-and release survival in all fisheries was 90%, that there is no increase or decrease in allowable effort, and that 20% of net catches are not of Border Esk or River Eden origin.
Table 9 : Estimated proportion of salmon eggs lost from the rivers Border Esk and Eden had the net and rod fisheries operated with kill limits equivalent to 1% of CL(s). These figures include additional losses through catch-and-release mortalities. Values are expressed as proportions of each river's Conservation Limit and estimated egg deposition (in parenthesis), see accompanying text for more information.
Year Border Esk River Eden
Net fishery Rod fishery Total loss Net fishery Rod fishery Total loss
2011 1.5% (0.6%) 5.2% (2.5%) 6.5% (3.1%) 1.3% (1.1%) 2.9% (2.3%) 4.2% (3.4%)
2012 1.1% (0.8%) 3.9% (2.8%) 4.9% (3.6%) 1.1% (1.0%) 2.5% (2.2%) 3.7% (3.3%)
2013 1.3% (1.8%) 2.8% (3.8%) 4.1% (5.6%) 1.4% (1.9%) 1.9% (2.7%) 3.3% (4.6%)
2014 0.9% (1.3%) 2.8% (3.7%) 3.7% (5.0%) 1.0% (1.9%) 1.5% (2.7%) 2.5% (4.5%)
2015 1.0% (1.3%) 2.8% (3.7%) 3.8% (5.0%) 1.0% (1.0%) 2.4% (2.4%) 3.5% (3.4%)
2016 1.1% (1.2%) 3.0% (3.3%) 4.1% (4.5%) 1.2% (1.0%) 2.7% (2.3%) 3.8% (3.2%)
As can be seen in Table 9 above, even the limited allowable kills described above would not have consistently resulted in the required low levels of losses in relation to CLs i.e. losses of no more than 1% of CL. This is particularly true of the rod fisheries in both rivers due to additional losses
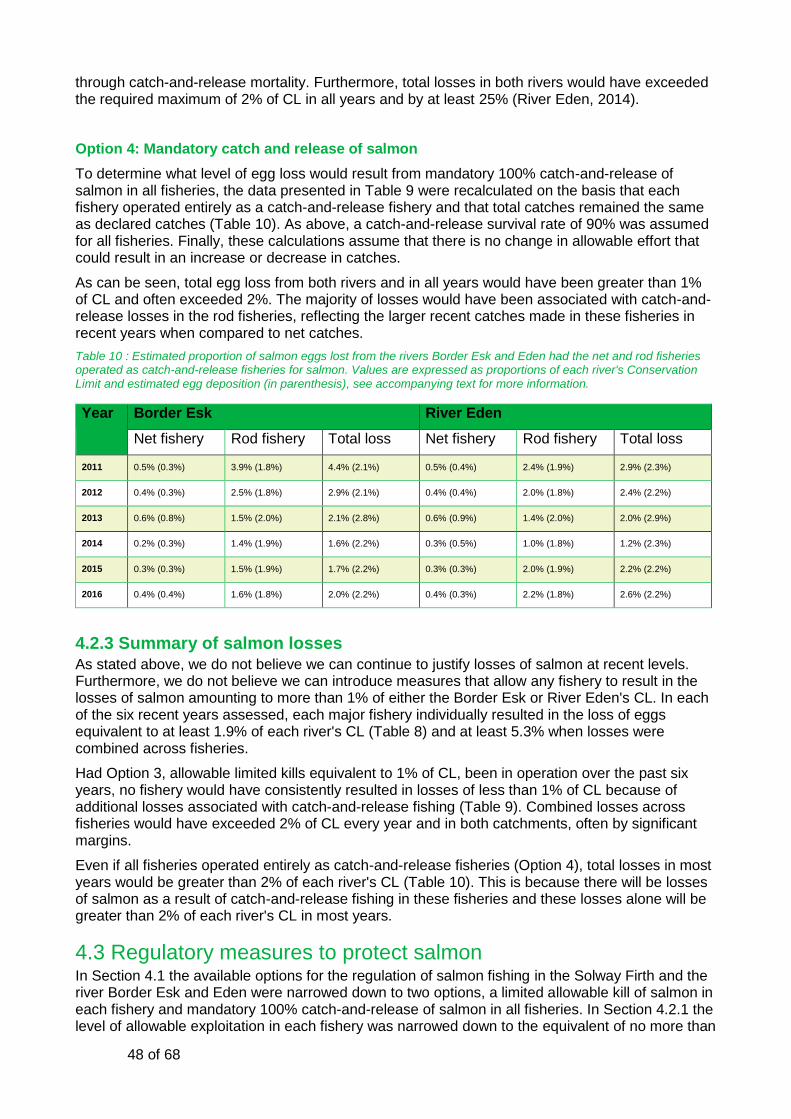
48 of 68
through catch-and-release mortality. Furthermore, total losses in both rivers would have exceeded the required maximum of 2% of CL in all years and by at least 25% (River Eden, 2014).
Option 4: Mandatory catch and release of salmon
To determine what level of egg loss would result from mandatory 100% catch-and-release of salmon in all fisheries, the data presented in Table 9 were recalculated on the basis that each fishery operated entirely as a catch-and-release fishery and that total catches remained the same as declared catches (Table 10). As above, a catch-and-release survival rate of 90% was assumed for all fisheries. Finally, these calculations assume that there is no change in allowable effort that could result in an increase or decrease in catches.
As can be seen, total egg loss from both rivers and in all years would have been greater than 1% of CL and often exceeded 2%. The majority of losses would have been associated with catch-and-release losses in the rod fisheries, reflecting the larger recent catches made in these fisheries in recent years when compared to net catches.
Table 10 : Estimated proportion of salmon eggs lost from the rivers Border Esk and Eden had the net and rod fisheries operated as catch-and-release fisheries for salmon. Values are expressed as proportions of each river's Conservation Limit and estimated egg deposition (in parenthesis), see accompanying text for more information.
Year Border Esk River Eden
Net fishery Rod fishery Total loss Net fishery Rod fishery Total loss
2011 0.5% (0.3%) 3.9% (1.8%) 4.4% (2.1%) 0.5% (0.4%) 2.4% (1.9%) 2.9% (2.3%)
2012 0.4% (0.3%) 2.5% (1.8%) 2.9% (2.1%) 0.4% (0.4%) 2.0% (1.8%) 2.4% (2.2%)
2013 0.6% (0.8%) 1.5% (2.0%) 2.1% (2.8%) 0.6% (0.9%) 1.4% (2.0%) 2.0% (2.9%)
2014 0.2% (0.3%) 1.4% (1.9%) 1.6% (2.2%) 0.3% (0.5%) 1.0% (1.8%) 1.2% (2.3%)
2015 0.3% (0.3%) 1.5% (1.9%) 1.7% (2.2%) 0.3% (0.3%) 2.0% (1.9%) 2.2% (2.2%)
2016 0.4% (0.4%) 1.6% (1.8%) 2.0% (2.2%) 0.4% (0.3%) 2.2% (1.8%) 2.6% (2.2%)
4.2.3 Summary of salmon losses
As stated above, we do not believe we can continue to justify losses of salmon at recent levels. Furthermore, we do not believe we can introduce measures that allow any fishery to result in the losses of salmon amounting to more than 1% of either the Border Esk or River Eden's CL. In each of the six recent years assessed, each major fishery individually resulted in the loss of eggs equivalent to at least 1.9% of each river's CL (Table 8) and at least 5.3% when losses were combined across fisheries.
Had Option 3, allowable limited kills equivalent to 1% of CL, been in operation over the past six years, no fishery would have consistently resulted in losses of less than 1% of CL because of additional losses associated with catch-and-release fishing (Table 9). Combined losses across fisheries would have exceeded 2% of CL every year and in both catchments, often by significant margins.
Even if all fisheries operated entirely as catch-and-release fisheries (Option 4), total losses in most years would be greater than 2% of each river's CL (Table 10). This is because there will be losses of salmon as a result of catch-and-release fishing in these fisheries and these losses alone will be greater than 2% of each river's CL in most years.
4.3 Regulatory measures to protect salmon In Section 4.1 the available options for the regulation of salmon fishing in the Solway Firth and the river Border Esk and Eden were narrowed down to two options, a limited allowable kill of salmon in each fishery and mandatory 100% catch-and-release of salmon in all fisheries. In Section 4.2.1 the level of allowable exploitation in each fishery was narrowed down to the equivalent of no more than

49 of 68
1% of Conservation Limit of either river, or 2% of CL in total. Finally, in Section 4.2.2, estimates of recent exploitation and exploitation under the two available options were presented in terms of the proportion of each CL lost in each fishery and the combination of them. The evidence presented demonstrates that even at 100% catch-and-release in all fisheries, total exploitation of the salmon stock in each river exceeds 2% of CL.
We therefore propose that in order to provide sufficient protection to salmon stocks in both catchments, the net, rod and trap fisheries that exploit these fish operate as catch-and-release fisheries for up to the next ten years. The proposed regulations affecting each fishery are set out below in detail.
4.3.1 Solway Firth Haaf Net Fishery With regards to limiting salmon exploitation in the Solway Haaf Net Fishery, we propose to introduce the following regulatory measures for a ten year period commencing early 2018:
• A Net Limitation Order to limit the number of haaf net licences available for this fishery to 75 licences. This limit was determined following discussion with fishery interests and is intended to allow limited scope for new licensees to enter the fishery in order to continue this tradition.
• A time-limited, ten-year byelaw requiring all salmon caught in the fishery to be released back into the estuary with least possible harm.
• A time-limited, ten-year byelaw defining a daily close period in the fishery from midnight to 6am each day. This has been determined following discussion with fishery interests to allow a period during each day when fish are able to pass through the Firth without risk of capture whilst increasing opportunity to partake in the fishery.
• Removal of the weekly close period to increase fishing opportunity in the fishery. This requires the amendment to the permanent byelaw that currently imposes a weekly close period of 10pm on Friday evening to 10am on Monday morning.
• No method restrictions (e.g. changes in mesh sizes) are included as part of the package of measures proposed. However, this may be reviewed in the future if, for example, any issues with post-release survival of salmon emerge.
It should be noted that these measures will be reviewed five years after introduction to ensure that they remain appropriate.
4.3.2 Border Esk and River Eden rod fisheries With regards to limiting salmon exploitation in the Border Esk and River Eden rod fisheries, we propose to introduce the following regulatory measures for a ten-year period commencing early 2018:
• A time-limited ten-year byelaw requiring all salmon caught in both rod fisheries to be released back into the river with least possible harm.
• No additional method restrictions (e.g. limitations on numbers or sizes of hooks) are proposed as part of this proposed package of measures. However method restrictions are currently under consideration via a national package of regulations and may be applied to these fisheries in future, subject to separate, national consultation.
It should be noted that these measures will be reviewed five years after introduction to ensure that they remain appropriate.
4.3.3 Corby Coops trap fishery, River Eden Discussions have taken place between the Environment Agency and the owner licensee of Corby Coops trap fishery, a Privileged Engine certified under the Salmon Fishery Act 1865. Recognising the challenges facing salmon at present, it is proposed that these will operate with the following licence conditions from 2018 onwards and for a period of up to ten years:
• Mandatory 100% catch-and-release of all salmon caught in the Corby coops fishery.

50 of 68
4.3.4 Compliance with the Habitats Directive
As described earlier, salmon are a designated feature of the River Eden Special Area of Conservation (SAC). Therefore, any measures proposed for the Solway Firth haaf net fishery or for the rod and / or coops fisheries in the River Eden must be assessed accordingly. An Appropriate Assessment of the measures we propose to introduce has been produced and is provided in Appendix 4. Although these measures do allow salmon fishing to continue in all three fisheries, albeit on a 100% catch-and-release basis, we have concluded that there will be no likely adverse impact on site integrity from this regulatory package.
4.4 Regulatory measures to protect sea trout As described above, a fundamental requirement of the regulatory package for the next ten years is to provide sufficient protection for sea trout stocks such that fewer fish are killed than were killed under the recently-expired 2007 NLO and byelaw package. Crucially, we do not believe that the 2007 regulatory package resulted in any sustained improvement in numbers of adult sea trout returning to either catchment.
4.4.1 Measures to protect sea trout in the Solway Firth Haaf Net Fishery Discussions with haaf netting interests have focussed on the introduction of a season-long catch limit in this fishery, noting that this would have to be balanced against any changes in allowable fishing effort. Critically, we must be able to demonstrate that any sea trout kill limit will not result in higher sea trout kills than have occurred over the lifetime of the previous time-limited regulatory package, as those measures have not resulted in a sustained improvement in sea trout stocks.
Mean sea trout catch in the haaf net fishery over the lifetime of the 2007 regulatory package (2008-2017) was 462 sea trout. To ensure that total catches for the next ten years (i.e. from 2018 onwards) are demonstrably lower than this, we propose to set the total allowable kill for the fishery at 90% of the above 10 year average kill which equates to 416 fish. We propose to round this to 420 sea trout as an annual allowable kill.
We propose to distribute this allowable sea trout kill amongst all valid haaf net licence holders before the season commences. Carcass tags will be provided to each licence holder in line with current logbook and carcass tagging requirements. We will only consider holders of licences purchased up to and including the 18th of May for inclusion in this kill (carcass tag) allocation process. Licences purchased after this date will not receive carcass tags and will therefore not be permitted to kill sea trout caught in this fishery. We consider this cut-off date to be a reasonable approach, particularly as we ordinarily require haaf net application forms to be submitted to the Environment Agency by 15 November the year before.
As an example of how this kill allocation scheme would operate, if 50 licences are purchased by the 18th of May, the allowable kill per licensee is 420 ÷ 50 = 8 fish. Note that in all cases the allowable kill will be rounded down to the nearest whole number to ensure that total kill cannot exceed the stated 420 sea trout fishery maximum.
We propose to introduce this kill restriction and allocation method as a time-limited, ten-year byelaw from 2018 onwards. These byelaws will be reviewed five years after introduction.
4.4.2 Measures to protect sea trout in the Border Esk and River Eden Rod fisheries During discussions with rod angling interests, we proposed the introduction of a one sea trout per day (per rod angler) limit, on the basis that this offered increased protection over the previous two sea trout per day kill limit that formed part of the 2007 package of measures. A byelaw requiring anglers to release all female sea trout caught after the 9th of September would also be renewed for a further ten years. However, while rod angling stakeholders from both catchments were in

51 of 68
agreement with the proposed renewal of this latter byelaw, they expressed concerns that a daily limit of even one fish per day would not offer sufficient protection to sea trout stocks.
Instead, angling groups from both catchments proposed more stringent season-long kill limits. For the Border Esk, a season-long sea trout kill limit of four fish was proposed, and for the River Eden a season-long kill limit of two fish was proposed.
We have modelled the effects of the proposed season limits on declared sea trout catches (and kills) from both catchments to confirm that these limits will reduce numbers of sea trout killed in these fisheries. Declared and modelled results from 2010 onwards are presented in Table 11 below. The proposed season-long sea trout kill limits would have resulted in reduced kills in all years, based on declared catch returns. From 2010 onwards these would have resulted in between 13% and 40% fewer sea trout having been killed in the Border Esk, and between 3% and 40% fewer being killed in the River Eden. Table 11 : Declared and modelled sea trout kill in the Border Esk and River Eden rod fisheries, 2010 onwards. A limit of four sea trout per year is modelled for the Border Esk and two sea trout per year for the River Eden.
Border Esk River Eden
Year Declared catch
Declared kill Modelled kill (4 fish per year)
Declared catch
Declared kill Modelled kill (2 fish per year)
2010 905 354 225 461 127 89
2011 1059 324 230 303 87 64
2012 1199 400 291 217 51 42
2013 650 149 130 210 32 31
2014 1033 180 139 393 43 26
2015 1079 270 162 331 43 37
2016 1111 250 173 214 32 30
We therefore propose to introduce a time-limited (ten-year) byelaw on the Border Esk to limit individual angler sea trout kill to no more than four sea trout per season from 2018 onwards. And, on the River Eden, we propose to introduce a similar byelaw limiting sea trout kill to no more than two sea trout per season per individual angler.
We also propose to reintroduce a time-limited (ten-year) byelaw on both rivers that requires all female sea trout caught after the 9th of September to be returned alive to the river. These byelaws will be reviewed five years after introduction.
During stakeholder meetings, angling interests also proposed a maximum takeable size limit for sea trout. Whilst recognising that there is considerable merit in this approach, we do not propose to include such a size limit as part of the proposed package of measures for 2018 onwards to reduce the risk of selection bias in catches.
4.4.3 Measures to protect sea trout in the Corby Coops trap fishery To maintain balance across all three fisheries that kill River Eden sea trout, we propose a kill limit of six sea trout per year for the Corby Coops trap fishery, two each per coop licence. This will be applied as a licence condition. It should be noted that few sea trout are caught in this fishery as a consequence of the physical dimensions of the traps. Over the lifespan of the previous 2007 measures, average sea trout catch in the coops fishery was fewer than two fish per year.

52 of 68
4.4.4 Measures to protect sea trout - closing remarks
We believe that the measures proposed above represent a balanced approach between the various fisheries involved. We must ensure that the proposed package of measures does not increase numbers of sea trout killed through the lifespan of these measures.

53 of 68
5. Bibliography Anon. (1999). The Scotland Act 1998 (Border Rivers) Order 1999. Available from: http://www.legislation.gov.uk/uksi/1999/1746/contents/made
Anon. (2016). The Eden Fisheries Plan. Available from: http://www.edenfishing.co.uk/docs/efp-april2016.pdf
The Centre for Environment, Fisheries and Aquatic Sciences and the Environment Agency, 2004. Annual assessment of salmon stocks and fisheries in England and Wales, 2003.
The Centre for Environment, Fisheries and Aquatic Sciences, the Environment Agency and Natural Resources Wales, 2017. Annual assessment of salmon stocks and fisheries in England and Wales, 2016.
Environment Agency (1997). The River Eden Salmon Action Plan ~ Consultation Draft.
Environment Agency (2003). The Border Esk Fisheries Plan ~ Consultation Draft.
Environment Agency (2014). North West Fisheries Byelaws 41pp. Available from https://www.gov.uk/government/publications/environment-agency-rod-fishing-byelaws-north-west-region
Environment Agency (2015). Salmon Five Point Approach – restoring salmon in England. Available from http://www.anglingtrust.net/core/core_picker/download.asp?id=7320&filetitle=Salmon+Five+Point+Approach
NASCO (2004). Guidelines for incorporating social and economic factors in decisions under the Precautionary Approach CNL(04)57. http://www.nasco.int/pdf/agreements/socioeconomics.pdf
NASCO (2009). CNL (09) 43 NASCO guidelines for the management of salmon fisheries. http://www.nasco.int/pdf/far_fisheries/Fisheries%20Guidelines%20Brochure.pdf
Wyatt, R. J. and S. Barnard. 1997. The transportation of maximum gain salmon spawning target from the River Bush (N.I.) to England and Wales. Environment Agency R&D Technical Report W65, Environment Agency, Bristol.

54 of 68
6. Glossary 1SW Adult salmon that have spent one winter at sea i.e. one sea winter. Commonly referred to as grilse.
CEFAS The Centre for Environment, Fisheries and Aquaculture Science.
CL Conservation Limit
CPLD Catch per licence day
CPUE Catch per unit effort
DEFRA The Department for the Environment, Food and Rural Affairs. Government department that has overall responsibility for salmon and sea trout. The Environment Agency and Natural England are part of the DEFRA group.
ERT The Eden Rivers Trust. Very well established Charitable trust has and continues to carry out significant
ELIA The Esk and Liddle Improvements Association. Organisation that represents the majority of angling interests on the Border Esk and is actively involved in the conservation and improvement of the catchment for fish and other wildlife.
Fry Juvenile fish less than one year old i.e. from the previous year’s spawning. For salmonids in the Solway area, this stage typically ends at the start of the first winter in freshwater.
ICES The International Council for the Exploration of the Sea
MBAL Minimum Biologically Acceptable Level
MO Management Objective - to achieve or exceed CL in four years out of five.
MSW Adult salmon that have spent more than one winter at sea i.e. multi sea winter.
MT Management Target
NASCO The North Atlantic Salmon Conservation Organisation
NE Natural England. Government agency that has the specific responsibility to ensure the conservation of protected sites including SSSIs and SACs.
NLO Net Limitation Order. Legal instrument that stipulates the maximum number of licences that can be issued for a fishery and whether or not this is a reducing NLO.
NRW Natural Resources Wales
Parr Older freshwater stage of salmonids which follows the fry stage. In the Solway area, salmon and sea trout are typically known as parr from the first winter in freshwater.
REDFA The River Eden and District Angling Association
RSE Returning Stock Estimate
SAC Special Area of Conservation. European designation…
Smolt A young salmon (or trout) after the parr stage, when it becomes silvery and migrates to the sea for the first time.
SSSI Site of Special Scientific Interest. UK designation…

55 of 68
7. Appendices
Appendix 1 : The Decision Structure for developing fishing controls in England and Wales
The compliance assessment approach described above for determining the performance of each salmon river is now incorporated into a national decision structure for guiding decisions on the need for fishery regulations. The ‘Decision Structure’ is applied annually to each salmon river in April following publication of this “Annual Assessment of Salmon Stocks in England and Wales” report. Fishery managers for each river are then advised of these assessments and the outcome of applying the ‘Decision Structure’. They then begin the process of deciding what changes in regulation are appropriate as guided by the Decision Structure outputs. Recovering rivers that do not yet have CLs set are deemed to be ‘at risk’.
The ‘Decision Structure’ is shown in the schematic flow chart below, together with explanatory notes for its use.

56 of 68

57 of 68
NOTES TO ACCOMPANY DECISION STRUCTURE
1. Initial stage - stock assessment (red boxes)
This is the assessment of the probability that the salmon river will be meeting its CL four years out of five (the management objective) in five years time. The information to answer these questions comes from this “Annual Assessment of Salmon Stocks and Fisheries in England & Wales” report (see Section 8).
2. Second stage – initial screening for potential options (blue boxes)
This stage screens options appropriate to those rivers that have a <50% probability of failing the management objective taking into consideration socio-economic concerns and stakeholder support. Management options that would not be supported by stakeholders can be ruled out. One of the possible options is to ‘do nothing’.
For rivers where there is >50% probability of failing the management objective, all options must be carried through to the next (evaluation) stage.
3. Third stage - option evaluation (purple boxes)
The purpose of this stage is to set out and evaluate options to realise the required changes in exploitation.
For rivers where 50% ≤ p < 95% (where p= probability of failing the management objective) and the trend is down and with an annual catch of >20 salmon and C&R rate < 90%, then voluntary catch and release (C&R) will be promoted for 1 year. If this fails to significantly improve C&R rates, mandatory C&R or closure of the fishery will be considered. Protected rivers such as SACs (Special Areas of Conservation) are given particular emphasis
For rivers where the above criteria apply, except that the annual mean salmon catch is <20 salmon, voluntary measures will be promoted
For rivers where p>95% (i.e. the management objective is clearly being failed) and with an annual catch of >20 salmon and a C&R rate < 90%, then voluntary C&R will be promoted for 1 year. If this fails to significantly improve C&R, mandatory C&R or closure of the fishery will be considered.
For rivers where p ≤ 95% for 5 consecutive years (i.e. the management objective is clearly being met), the possibility of relaxing controls including on nets will be considered if stakeholders agree.
Rivers that are recovering from historical degradation that do not yet have CLs set are deemed to have a >95% probability that they are failing unless there is better information available. Fishers on such rivers are encouraged to practice 100% C&R at the same time as regulators and partner organisations work on the necessary environmental improvements. If the potential for these rivers is greater than an average rod catch of 20 salmon, then mandatory C&R is considered throughout the season as an interim measure. However, controlled development of fisheries may be permitted on these rivers in parallel with the recovery of stocks.
4. Final stage – selection and implementation (green boxes)
The final stage of the Decision Structure is the selection and implementation of the appropriate regulatory action.

58 of 68
Appendix 2 : Site-by-site electrofishing surveys results The figures below contain electrofishing data for the rivers Border Esk and Eden from 2002 onwards. Data are presented from survey sites visited in 2016 only and separate figures are provided for salmon fry and parr (Figure 34) and sea / brown trout fry and parr (Figure 35). Only sites with salmon access are presented here.
Figure 34 : Site-by-site juvenile salmon densities in the Border Esk and Eden catchments. All densities are expressed as estimated numbers of fish per 100m2. Note that the fish density (y) axis varies for each site due to the large differences in fish densities between sites. A red circle identifies a survey where no fish were caught and a black X indicates a year when a site was not surveyed.
(a) Salmon fry density, Border Esk

59 of 68
(b) Salmon parr density, Border Esk

60 of 68
(c) Salmon fry density, River Eden

61 of 68
(d) Salmon parr density, River Eden

62 of 68
Figure 35 : Site-by-site juvenile sea / brown trout densities in the Border Esk and Eden catchments. All densities are expressed as estimated numbers of fish per 100m2. Note that the fish density (y) axis varies for each site due to the large differences in fish densities between sites. A red circle identifies a survey where no fish were caught and a black X indicates a year when a site was not surveyed.
(a) Sea / brown trout fry density, Border Esk

63 of 68
(b) Sea / brown trout parr density, Border Esk

64 of 68
(c) Sea / brown trout fry density, River Eden

65 of 68
(d) Sea / brown trout parr density, River Eden

66 of 68
Appendix 3 : Managing salmon stocks in England and Wales
This document is provided separately.

67 of 68
Appendix 4 : Appropriate Assessment under the Habitats Regulations
This document is provided separately.

68 of 68