bootstrapping identify some of the forces behind the move to quantify reserve variability. review...
TRANSCRIPT

Bootstrapping• Identify some of the forces behind the move to quantify
reserve variability.
• Review current regulatory requirements regarding reserves and how they have been traditionally addressed.
• Walk through an example of the traditional chain-ladder reserving approach.
• Contrast the differences between the chain-ladder and bootstrap approaches (or deterministic and stochastic models more generally).
• Walk through an example of a Bootstrap iteration.

All Booked Reserves are “Estimates” of the Ultimate
Liability.

Partial List of Sources• CAS Working Party on Quantifying Variability in Reserve
Estimates. The Analysis and Estimation of Loss & ALAE Variability: A Summary Report. CAS Forum (Fall 2005): 29-146.
• England, P. D. and R. J. Verrall. 2002. Stochastic Claims Reserving in General Insurance. British Actuarial Journal 8:443-544.
• Kirschner, Gerald S., Colin Kerley, and Belinda Isaacs. Two Approaches to Calculating Correlated Reserve Indications Across Multiple Lines of Business. CAS Forum (Fall 2002): 211-46.
Reserve Estimation Variability• Actuaries dissatisfied with “point estimates”.
• Companies Developing ERM Practices.
• Technology Allows for Company Simulations.
• Rating Bureaus (like AM Best) and Regulators have an interest in Reserve Variability.

RED ALERT!!
Australia’s Prudential Regulatory Authority:
“Technical Reserves To Be Determined as the Present value of a Central Estimate, with a Risk Margin to approximate the 75% Confidence Level.”
Statements of Statutory Accounting Principles
• “Management’s best estimate” of its liabilities is to be recorded.
• Accrue the midpoint of range when no single estimate is better than any other.
• Accrue best estimate by line of business. Redundancies in one line cannot offset inadequacies in another.

Statement of Actuarial Opinion • Governed by Actuarial Standard of Practice
(that is ASOP) 36.
• When reserve is within “range of reasonable estimates”, it is assumed the reserve is reasonable.
• Range of Reasonable Estimates determined by appropriate methods or sets of assumptions judged to be reasonable.

Historically, the Range of Reasonable Estimates have been developed by varying methods and/or assumptions,
NOT by using statistics to evaluate the loss distribution.
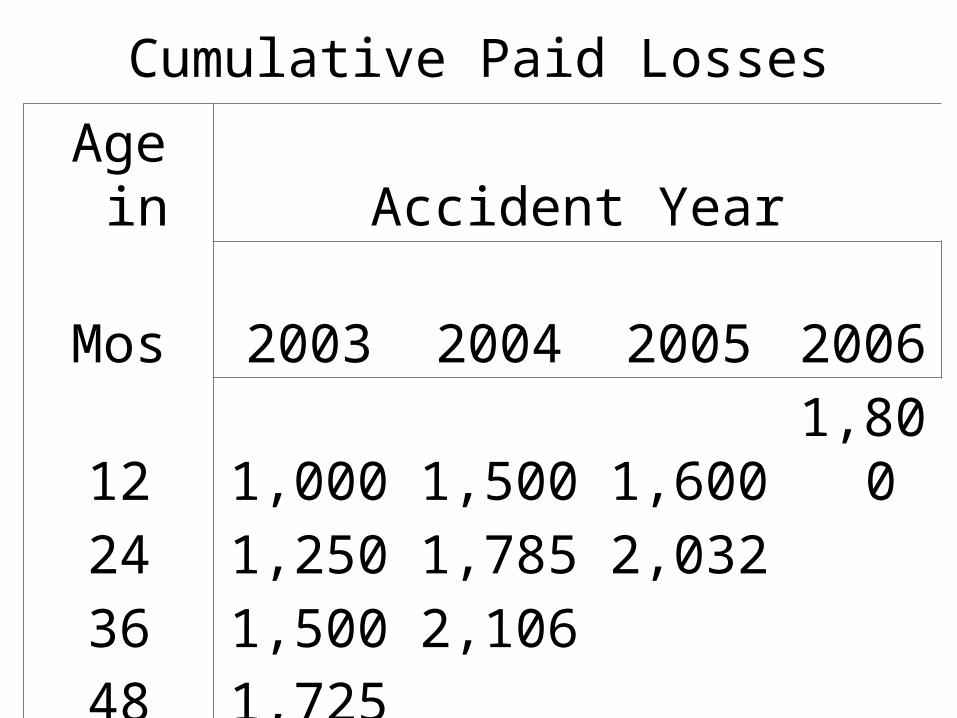
Cumulative Paid Losses
Age in Accident Year
Mos 2003 2004 2005 200612 1,000 1,500 1,600 1,80024 1,250 1,785 2,03236 1,500 2,10648 1,725

Age to Age Factor (Link Ratio)
Age in Accident Year Average
Mos 2003 2004 2005 2006
12 to 24 1.250 1.190 1.270 1.237
24 to 36 1.200 1.180 1.190
36 to 48 1.150 1.150
Tail Selected ……… …………… ………… 1.000

Age to Age Factor (Link Ratio)
Age in Accident Year
Mos 2003 2004 2005 2006
12 to 24 1.250 1.190 1.270 1.237
24 to 36 1.200 1.180 1.190 1.190
36 to 48 1.150 1.150 1.150 1.150
Tail(48-Ult) 1.000 1.000 1.000 1.000

Cumulative Paid Losses
Age in Accident Year
Mos 2003 2004 2005 2006
12 1,000 1,500 1,600 1,800
24 1,250 1,785 2,032 2,226
36 1,500 2,106 2,418 2,649
48 1,725 2,422 2,781 3,046
Ultimate 1,725 2,422 2,781 3,046

Cumulative Paid Losses
Age in Accident Year
Mos 2003 2004 2005 2006
12 1,000 1,500 1,600 1,800
24 1,250 1,785 2,032 2,226
36 1,500 2,106 2,418 2,649
48 1,725 2,422 2,781 3,046
Ultimate 1,725 2,422 2,781 3,046
Reserve 0 316 749 1,246
Total Reserve = 2,311

Traditional Reserving vs. Bootstrapping
Traditional Approaches:Deterministic – No
Randomness In Outcomes.
Bootstrapping:Stochastic – Randomness
is allowed to influence the outcomes.
• Allows for the estimation of the Probability Distribution.
Stochastic models complement
Deterministic methods by providing more
information on the possible outcomes.
Bootstrapping
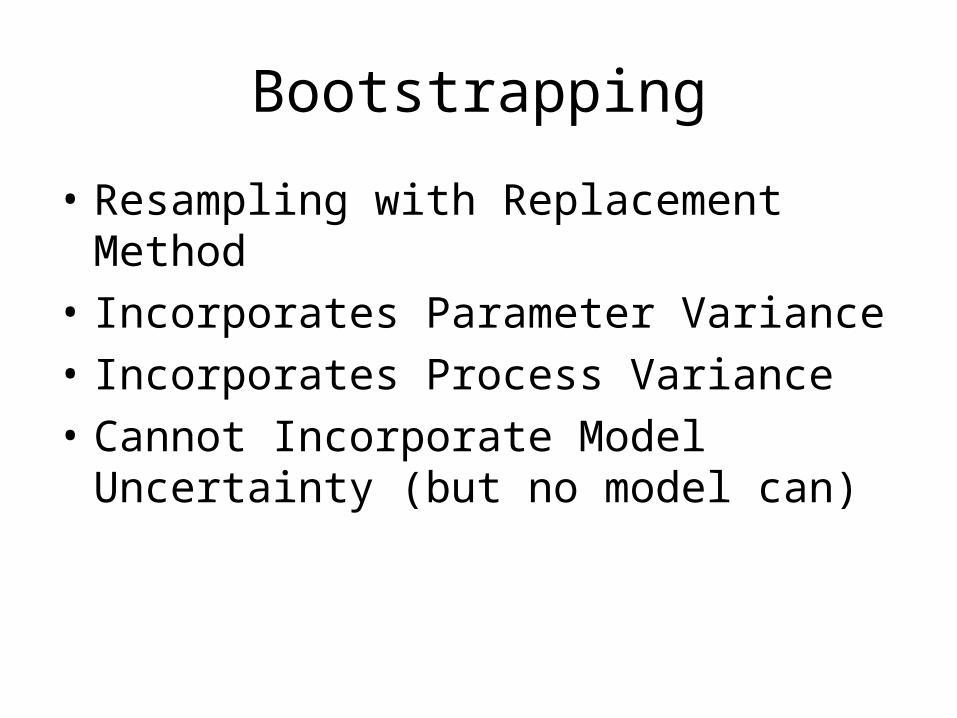
• Resampling with Replacement Method• Incorporates Parameter Variance• Incorporates Process Variance• Cannot Incorporate Model Uncertainty (but
no model can)
Bootstrapping
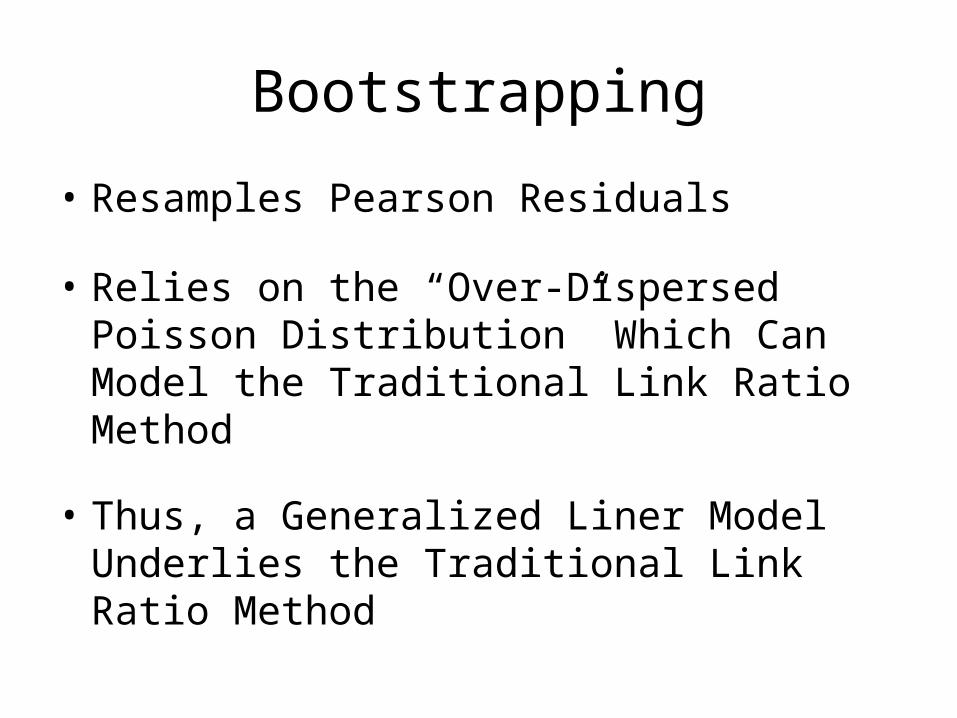
• Resamples Pearson Residuals
• Relies on the “Over-Dispersed Poisson Distribution” Which Can Model the Traditional Link Ratio Method
• Thus, a Generalized Liner Model Underlies the Traditional Link Ratio Method

The Gamma Distribution• Used in place of Over-Dispersed Poisson Distribution in Bootstrapping• Models Process Variance in Bootstrapping• Sum of n exponentially distributed random variables• Described by a shape parameter and a scale parameter • Mean = , Variance = 2
• Always > 0• Moderately Skewed

“Original” Incremental Paid Loss Triangle
Age in Accident Year
Mos 2003 2004 2005 2006
12 1,000 1,500 1,600 1,800
24 250 285 432
36 250 321
48 225
Cumulative Paid Loss Triangle
Age in Accident Year
Mos 2003 2004 2005 2006
12 1,000 1,500 1,600 1,800
24 1,250 1,785 2,032
36 1,500 2,106
48 1,725
Age to Age Factor (Link Ratio)
Age in Accident Year Average
Mos 2003 2004 2005 2006
12 to 24 1.250 1.190 1.270 1.237
24 to 36 1.200 1.180 1.190
36 to 48 1.150 1.150
Tail Selected ………………… ………………… ………………… 1.000

Create New Triangle through Backward Recursion
Original Cumulative Paid Loss Diagonal
Age in Accident Year
Mos 2003 2004 2005 2006 Selected
12 1,800 1.237
24 2,032 1.190
36 2,106 1.150
48 1,725 1.000

New Triangle Preserves Parameter Variance
“New” Cumulative Paid Loss Triangle
Age in Accident Year
Mos 2003 2004 2005 2006 Selected
12 1,019 1,431 1,643 1,800 1.237
24 1,261 1,770 2,032 1.190
36 1,500 2,106 1.150
48 1,725 1.000
1,500=1,725 / 1.150

“New” Incremental Paid Loss Triangle
Age in Accident Year
Mos 2003 2004 2005 2006
12 1,019 1,431 1,643 1,800
24 241 339 389
36 239 336
48 225
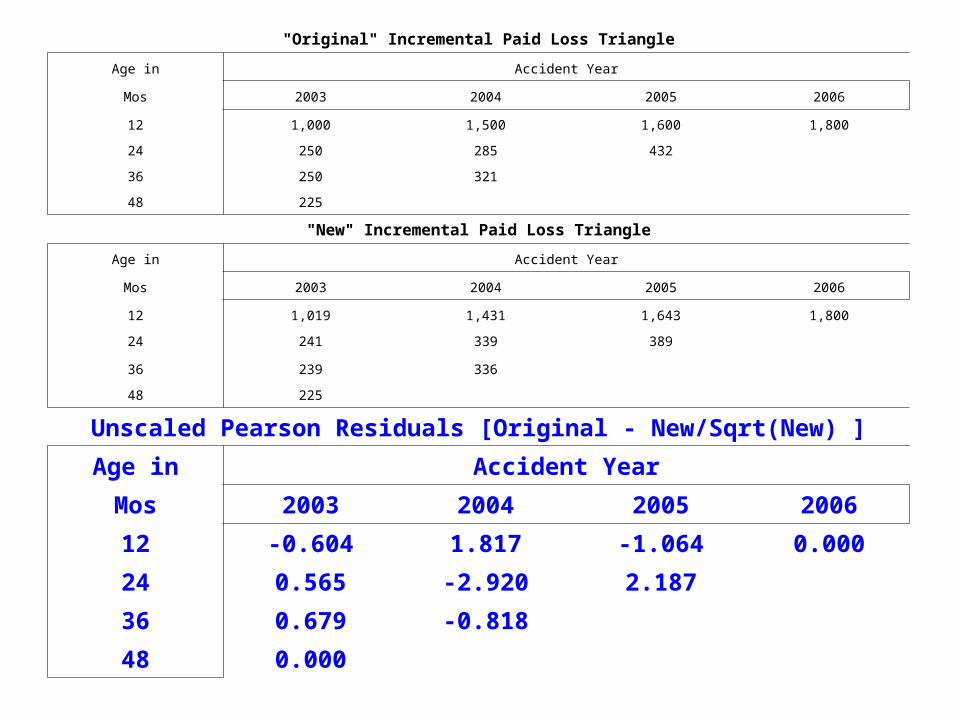
"Original" Incremental Paid Loss Triangle
Age in Accident Year
Mos 2003 2004 2005 2006
12 1,000 1,500 1,600 1,800
24 250 285 432
36 250 321
48 225
"New" Incremental Paid Loss Triangle
Age in Accident Year
Mos 2003 2004 2005 2006
12 1,019 1,431 1,643 1,800
24 241 339 389
36 239 336
48 225
Unscaled Pearson Residuals [Original - New/Sqrt(New) ]
Age in Accident Year
Mos 2003 2004 2005 2006
12 -0.604 1.817 -1.064 0.000
24 0.565 -2.920 2.187
36 0.679 -0.818
48 0.000

Scale Factor & Bias AdjustmentSquare of Unscaled Pearson Residuals
Age in Accident Year
Mos 2003 2004 2005 2006
12 0.365 3.301 1.132 0.000
24 0.319 8.524 4.783
36 0.461 0.669
48 0.000
Sum of Squares = 19.552
N = # of Data Points In Triangle 10
P=# Parameters Estimated = 2x(# Accident Years)-1= 7
Scale Factor = Sum of Squares / (N - P) = 6.517
Bias Adjustment = Sqrt(N) / (N - P) = 1.054

Triangle From Which Random Draws Will Be Made (excluding top right and
bottom left zeros)Bias Adjustment x Unscaled Pearson Residuals
Age in Accident Year
Mos 2003 2004 2005 2006
12 -0.636 1.915 -1.121 0.000
24 0.595 -3.077 2.305
36 0.715 -0.862
48 0.000 Exclude These

Iteration Begins: First Cell in “Pseudo” Triangle
Bias Adjusted Unscaled Pearson Residuals (select a random draw)
Age in Accident Year
Mos 2003 2004 2005 2006
12 -0.636 1.915 -1.121 0.000
24 0.595 -3.077 2.305 Random Draw
"New" Incremental Paid Loss Triangle
Age in Accident Year
Mos 2003 2004 2005 2006
12 1,019 1,431 1,643 1,800
"Pseudo" Incremental Paid Loss Triangle
Age in Accident Year
Mos 2003 2004 2005 2006
12 1,093
36 1,019 + [ 2.305 x Sqrt(1,019) ]
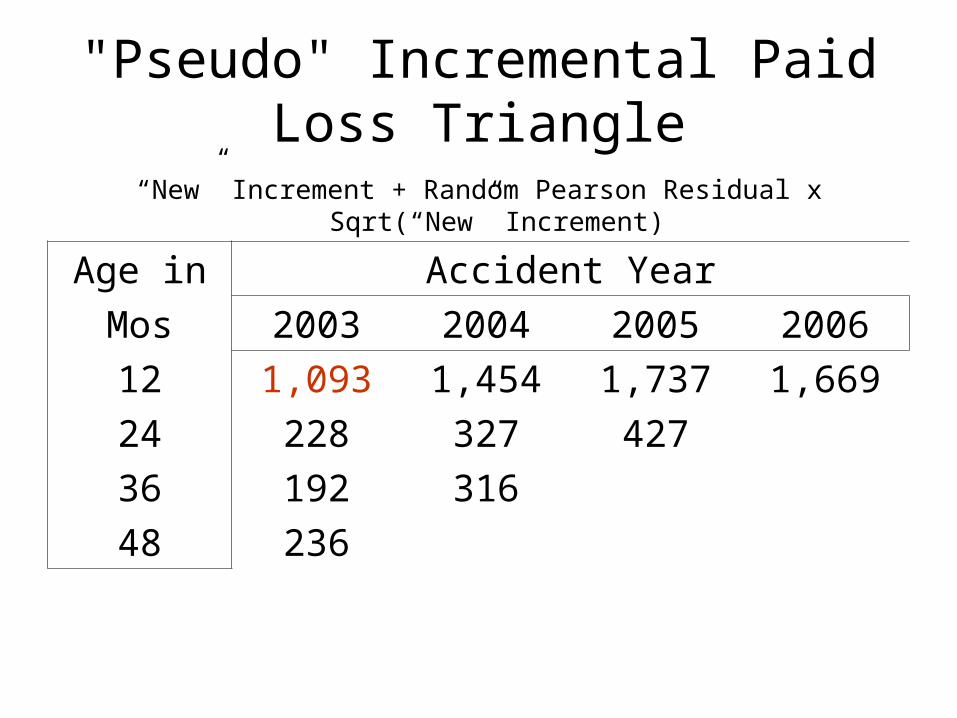
"Pseudo" Incremental Paid Loss Triangle
“New” Increment + Random Pearson Residual x Sqrt(“New” Increment)
Age in Accident Year
Mos 2003 2004 2005 2006
12 1,093 1,454 1,737 1,669
24 228 327 427
36 192 316
48 236

Completed “Pseudo Square
"Pseudo" Incremental Paid Loss Square
Age in Accident Year
Mos 2003 2004 2005 2006
12 1,093 1,454 1,737 1,669
24 228 327 427 378
36 192 316 349 330
48 236 327 392 371

Process Variance (Random Paid Loss)"Pseudo" Incremental Paid Loss Square
Age in Accident Year
Mos 2003 2004 2005 2006
48 236 327 392 371
Random Number for Each Future "Pseudo Cell"
48 0.154 0.417 0.980
"Pseudo" Incremental Paid Loss Square
48 280 379 478
Scale = = 6.517
= 327 / = 50.13313
Gamma Inverse (0.154, , ) = 280

"Pseudo" Cumulative Paid Losses with Process Variance
Age in Accident Year
Mos 2003 2004 2005 2006
12 1,093 1,454 1,737 1,669
24 1,321 1,781 2,163 2,021
36 1,513 2,097 2,565 2,340
48 1,748 2,376 2,944 2,818
Ultimate 1,748 2,376 2,944 2,818
Reserve 0 280 781 1,149
Total Reserve = 2,210
End of First Iteration

AFTER 5,000 BOOTSTRAP ITERATIONS:
Comparison of Bootstrapped Percentiles
Vs. The Point Estimate From Average Link Ratios
Bootstrap Point
Percentile Reserve Reserve
0 1,410 2,311
25 2,080 2,311
50 2,271 2,311
Mean 2,279 2,311
75 2,473 2,311
100 3,380 2,311
Std Dev = +/- 288