boomers' retirement income prospects - urban … women have worked and dearned more ... 281...
TRANSCRIPT

Program on Retirement Policy
http://www.retirementpolicy.org
The Program on Retirement Policy addresses how current and proposed retirement policies,
demographic trends, and private-sector practices affect the well-being of older individuals,
the economy, and government budgets.
Copyright © February 2012
The views expressed are those of the authors and do not necessarily reflect those of the
Urban Institute, its trustees, or its funders. Permission is granted for reproduction of this
document, with attribution to the Urban Institute.
URbAn InstItUte
2100 M street, nW ●
Washington, DC 20037-1231
(202) 833-7200 ●
[email protected] ● www.urban.org
Boomers face increasingly uncertain
retirement prospects. Traditional
employer-sponsored pensions that
pay a fixed benefit from retirement
until death—once a mainstay for middle-class
retirees—have been disappearing, replaced by
401(k)-type plans whose payout depends on
unpredictable investment returns. The 2008
stock market crash wiped out trillions of dol-
lars in retirement savings, and stock values still
hadn’t recovered by the end of 2011. The worst
housing slump since the Great Depression
combined with widespread mortgage borrow-
ing when home values were increasing has sup-
pressed home equity values. Rising health care
costs, stagnant wages, and potential Social
Security cutbacks add to boomers’ concerns.
But there also is encouraging news.
Boomer women have worked and earned more
than ever before, propping up family incomes
and boosting retirement wealth. Average
earnings grew earlier in boomers’ careers,
health status improved (especially at older ages),
and strong economic growth propelled home
and stock market values to new highs, despite
recent setbacks.
How will these conflicting forces play out?
This brief shows how changing patterns
of lifetime earnings, pension participation,
and wealth accumulation outside of retire-
ment plans will combine to shape boomers’
economic well-being by the time they reach
age 70, when most have retired and accrued all
their retirement savings. Our focus on age 70,
however, generates a somewhat rosier retire-
ment picture than if we considered boomers at
a younger age, since high-income, better edu-
cated people tend to live longer.2
Using DYNASIM3, the Urban Institute’s
dynamic microsimulation model, we compare
Program onRetirement Policy
The debate over the economic security of future retirees has special meaning for baby boomers, the 77 million surviving
Americans born between 1946 and 1964. Many of the oldest boomers, who began turning 65 last year, have already retired or will
soon. The youngest boomers are now in their late forties, prime earning years when retirement savings typically ramp up. Because
of their sheer numbers, the boomers’ exit from the labor force and reliance on public retirement benefits will reverberate through
society, affecting business, government, and younger taxpayers as well as retirees themselves. By 2030, when the last boomers
have turned 65, the share of Americans age 65 or older will rise by almost half, from 13 percent today to 19 percent.1
Social Security
historically has
provided the bulk
of retirement income,
at least for lower-
and moderate-income
retirees, and will
continue to play this
role for boomers.
bR I e f #
34feb. 2012
I n s I D e t h I s I s s U e•boomer women have worked more than ever before,boosting family incomes and retirement wealth.
•the shift from pensions paying regular retirement income for life to 401(k) plans subjectto market volatility adds uncertainty to boomers’retirement income.
•30 to 40 percent of the youngest boomers will not replace 75 percent of earnings received in their early fifties, making it difficult to maintainpreretirement living standards.
www.urban.org
About the AuthorsMelissa M. Favreault is a senior
fellow in the Urban Institute’s
Income and Benefits Policy Center.
Richard W. Johnson is a senior
fellow in the Urban Institute’s
Income and Benefits Policy Center.
Karen E. Smith is a senior research
associate in the Urban Institute’s
Income and Benefits Policy Center.
Sheila R. Zedlewski is an institute
fellow; she directed the Urban
Institute’s Income and Benefits
Policy Center for 20 years.
boomers’ Retirement Income ProspectsMelissa M. Favreault, Richard W. Johnson, Karen E. Smith, and Sheila R. Zedlewski
Case-Shiller. 2011. “S&P Case-Shiller Home Price
Indices.” Standard and Poors Financial Services.
http://www.standardandpoors.com/indices/sp-case-
shiller-home-price-indices/en/us/?indexId=spusa-cash-
pidff--p-us---. (Downloaded December 01, 2011.)
Foote, Bruce. 2010. “Reverse Mortgages: Background
and Issues.” CRS Report for Congress 7-5700.
Washington, DC: Congressional Research Service.
Friedberg, Leora, and Anthony Webb. 2005.
“Retirement and the Evolution of Pension Structure.”
Journal of Human Resources 40(2): 281–308.
Johnson, Richard W., and Corina Mommaerts. 2010.
“Will Health Care Costs Bankrupt Aging Boomers?”
Washington, DC: The Urban Institute.
Lakdawalla, Darius N., Jayanta Bhattacharya, and
Dana P. Goldman. 2004. “Are the Young Becoming
More Disabled?” Health Affairs 26(1): 168–76.
Martin, Linda G., Vicki A. Freedman, Robert F.
Schoeni, and Patricia M. Andreski. 2009. “Health and
Functioning among Baby Boomers Approaching 60.”
Journal of Gerontology: Social Sciences 64B(3): 369–77.
Meara, Ellen R., Seth Richards, and David M.
Cutler. 2008. “The Gap Gets Bigger: Changes in
Mortality and Life Expectancy, by Education,
1981–2000.” Health Affairs 27(2): 350–60.
Munnell, Alicia H., Anthony Webb, and Francesca
Golub-Sass. 2009. “The National Retirement
Income Risk Index: After the Crash.” CRR Issue in
Brief Number 9-22. Chestnut Hill, MA: Center for
Retirement Research.
National Center for Health Statistics. 1985. U.S.
Decennial Life Tables for 1979–81, United States Life
Tables.Washington, DC: Government Printing Office.
–––––. 2011a. “Health Data Interactive.”
http://www.cdc.gov/nchs/hdi.htm. (Downloaded
December 1, 2011.)
–––––. 2011b. United States Life Tables, 2007.
Hyattsville, MD: National Center for Health Statistics.
Pension and Welfare Benefits Administration.
2001/2002. “Private Pension Plan Bulletin: Abstract
of 1998 Form 5500 Annual Reports.” Washington,
DC: U.S. Department of Labor.
Program on Retirement Policy. 2011a. “Female Labor
Force Participation Rates by Age, 1948–2010.”
Washington, DC: The Urban Institute.
http://www.urban.org/retirement_policy/
datawarehouse/olderworkers.cfm.
–––––. 2011b. “Male Labor Force Participation Rates
by Age, 1948–2010.” Washington, DC: The Urban
Institute. http://www.urban.org/retirement_policy/
datawarehouse/olderworkers.cfm.
–––––. 2011c. “Number of Persons by Age,
1950–2050.” Washington, DC: The Urban Institute.
http://www.urban.org/retirement_policy/
datawarehouse/population.cfm.
Scholz, John Karl, and Ananth Seshadri. 2009.
“What Replacement Rates Should Households Use?”
MRRC Working Paper 2009-214. Ann Arbor:
University of Michigan Retirement Research Center.
Scholz, John Karl, Ananth Seshadri, and Surachai
Khitatrakun. 2006. “Are Americans Saving
‘Optimally’ for Retirement?” Journal of Political
Economy 114(4): 607–43.
Smith, Karen E. 2012. “Projection Methods Used
in the Dynamic Simulation Model of Income
(DYNASIM3).” Washington, DC: The Urban
Institute.
VanDerhei, Jack. 2011. “A Post-Crisis Assessment of
Retirement Income Adequacy for Baby Boomers
and Gen Xers.” Washington, DC: Employee Benefit
Research Institute.
Waldron, Hilary. 2007. “Trends in Mortality
Differentials and Life Expectancy for Male Social
Security–Covered Workers, by Socioeconomic
Status.” Social Security Bulletin 67(3): 1–28.
BriefRetirement#34-Rd4_Layout 1 2/10/12 10:46 AM Page 1
early boomers, born between 1946 and 1955,
and late boomers, born between 1956 and 1965,
with the pre-boomer cohort born between
1936 and 1945. The projections begin with
recent patterns in earnings, retirement, and
financial assets and then base future growth
on the intermediate assumptions in the 2011
Social Security Trustees report.
The results from the projection are
mixed: boomers will receive more income at
age 70 than their predecessors, but that
income will replace a somewhat smaller share
of their preretirement earnings. Compared
with their pre-boomer counterparts, boomer
men will have less in retirement assets while
boomer women will have more. The projec-
tions indicate 30 to 40 percent of late
boomers will not reach a 75 percent replace-
ment rate, suggesting that they may be
unable to maintain their preretirement
living standards at age 70. However, the pre-
dicted share at risk is only slightly higher
than for their predecessors.
Changing DemographicsShifting demographics at older ages will play
an important role in boomers’ retirement
income security. Americans are living longer.
Between 1980 and 2007, life expectancy at age
62 increased three years for men and two years
for women.3 Reduced mortality is a significant
achievement, although the gains have been
concentrated among well-educated and high-
income Americans.4 Longer life expectancy has
lengthened retirements, even though some
people have begun working longer. Longer
lives in turn boost the cost of Social Security
and traditional pensions, and mean that
retirees’ savings must last longer.
Lower mortality reflects better health at
older ages and greater investments in health
care. The share of Americans age 65 to 74
reporting fair or poor health fell from 32.5 per-
cent in 1983 to 21.6 percent in 2008.5 It’s not
clear, however, whether this trend will con-
tinue. The gains occurred mostly before 2000.
Reported health hasn’t improved much since
then and disability rates are now inching up for
people in their forties and fifties.6 Nonetheless,
the Social Security trustees project that age-62
life expectancy will increase another two years
for men and one year for women by 2025.7
Other analysts predict that future generations
will live even longer.8
Marriage, divorce, and widowhood patterns
are also changing and will influence financial
security at older ages. Retirees often lose some
of their spouse’s Social Security and pension
benefits when they become widowed or
divorced and singles forgo the financial security
of a second paycheck and the cost savings from
shared expenses. As a result, widowed, divorced,
and never-married seniors have much higher
poverty rates than married couples.
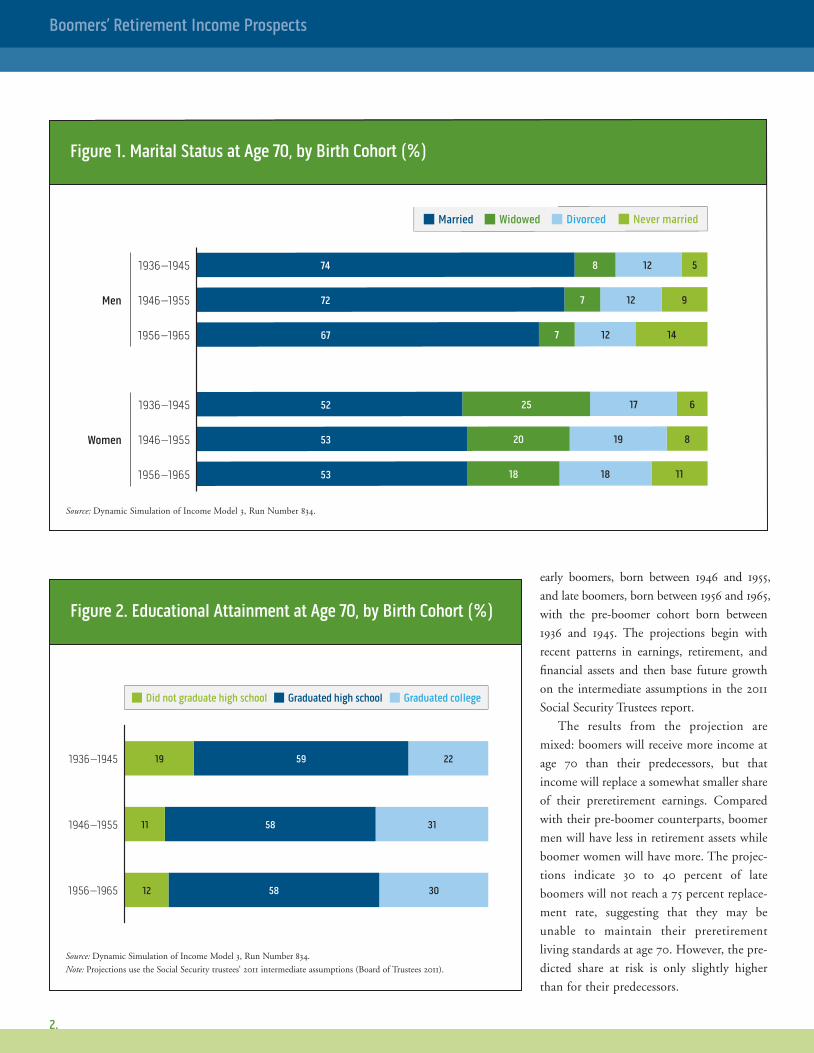
As men’s life expectancy rises, the gender
gap in mortality will shrink and widowhood
will become less common among older
women. The projections indicate that only 18
percent of late-boomer women will be wid-
owed at age 70, down from 25 percent among
pre-boomer women (figure 1). Falling mar-
riage rates, especially among boomers born
after 1955, will increase the share of singles at
age 70 compared with earlier cohorts—an
uptick that will be offset by the decline in
widowhood among older women. However, a
smaller share of boomer men (and especially
late-boomer men) will be married at age 70
than in earlier generations.
Adult children often support their retired
parents, sometimes with financial assistance
but more often with chores and personal care
when their parents become frail. However,
declining fertility rates will leave about one
in six late-boomer women childless, com-
pared with only about 1 in 12 pre-boomer
women. With fewer adult children, more
boomers will need to pay for help if they
become frail.
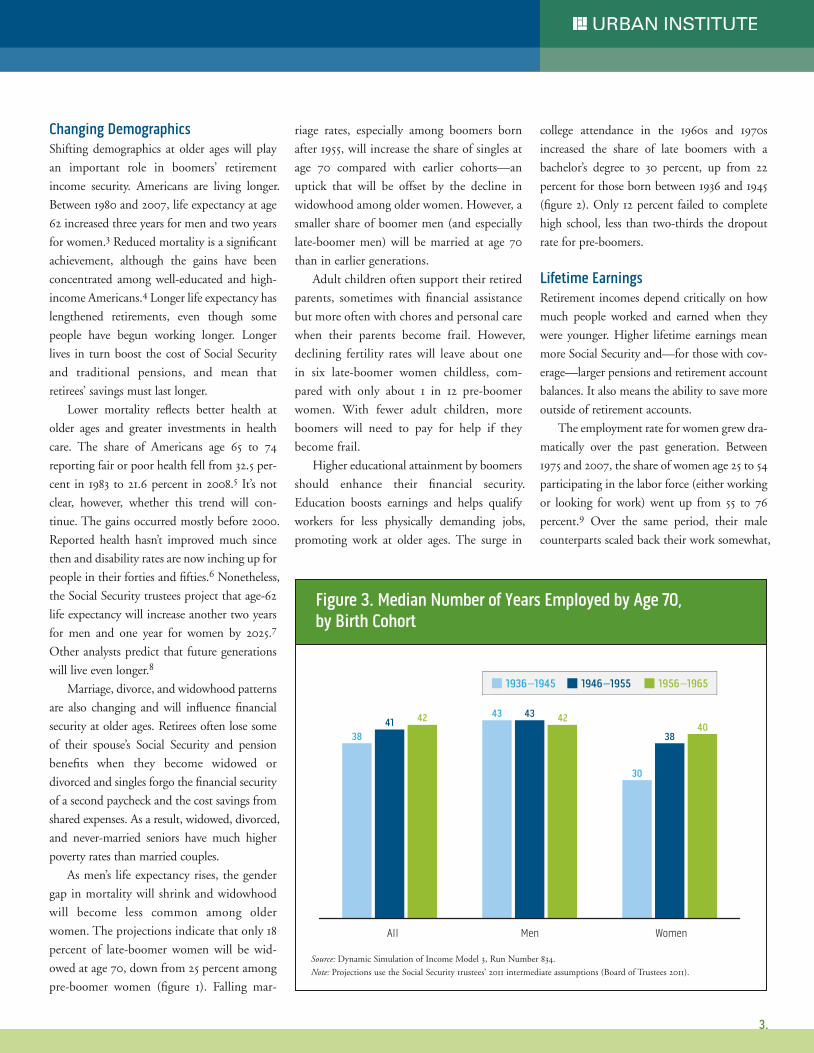
Higher educational attainment by boomers
should enhance their financial security.
Education boosts earnings and helps qualify
workers for less physically demanding jobs,
promoting work at older ages. The surge in
college attendance in the 1960s and 1970s
increased the share of late boomers with a
bachelor’s degree to 30 percent, up from 22
percent for those born between 1936 and 1945
(figure 2). Only 12 percent failed to complete
high school, less than two-thirds the dropout
rate for pre-boomers.
Lifetime earningsRetirement incomes depend critically on how
much people worked and earned when they
were younger. Higher lifetime earnings mean
more Social Security and—for those with cov-
erage—larger pensions and retirement account
balances. It also means the ability to save more
outside of retirement accounts.
The employment rate for women grew dra-
matically over the past generation. Between
1975 and 2007, the share of women age 25 to 54
participating in the labor force (either working
or looking for work) went up from 55 to 76
percent.9 Over the same period, their male
counterparts scaled back their work somewhat,
3.2.
boomers’ Retirement Income Prospects
1936–1945
1946–1955
1956–1965
Graduated collegeDid not graduate high school Graduated high school
19 2259
11 3158
12 3058
figure 2. educational Attainment at Age 70, by birth Cohort (%)
Source: Dynamic Simulation of Income Model 3, Run Number 834.
Note: Projections use the Social Security trustees’ 2011 intermediate assumptions (Board of Trustees 2011).
1936–1945
1946–1955
1956–1965
1936–1945
1946–1955
1956–1965
Men
Women
74
72
67
52
53
53
8
7 12
14127
25 17 6
81920
18 18 11
12 5
9
DivorcedWidowed Never marriedMarried
Source: Dynamic Simulation of Income Model 3, Run Number 834.
figure 1. Marital status at Age 70, by birth Cohort (%)
All Men Women
3841 42 4343 42
38
30
40
1956–19651946–19551936–1945
Source: Dynamic Simulation of Income Model 3, Run Number 834.
Note: Projections use the Social Security trustees’ 2011 intermediate assumptions (Board of Trustees 2011).
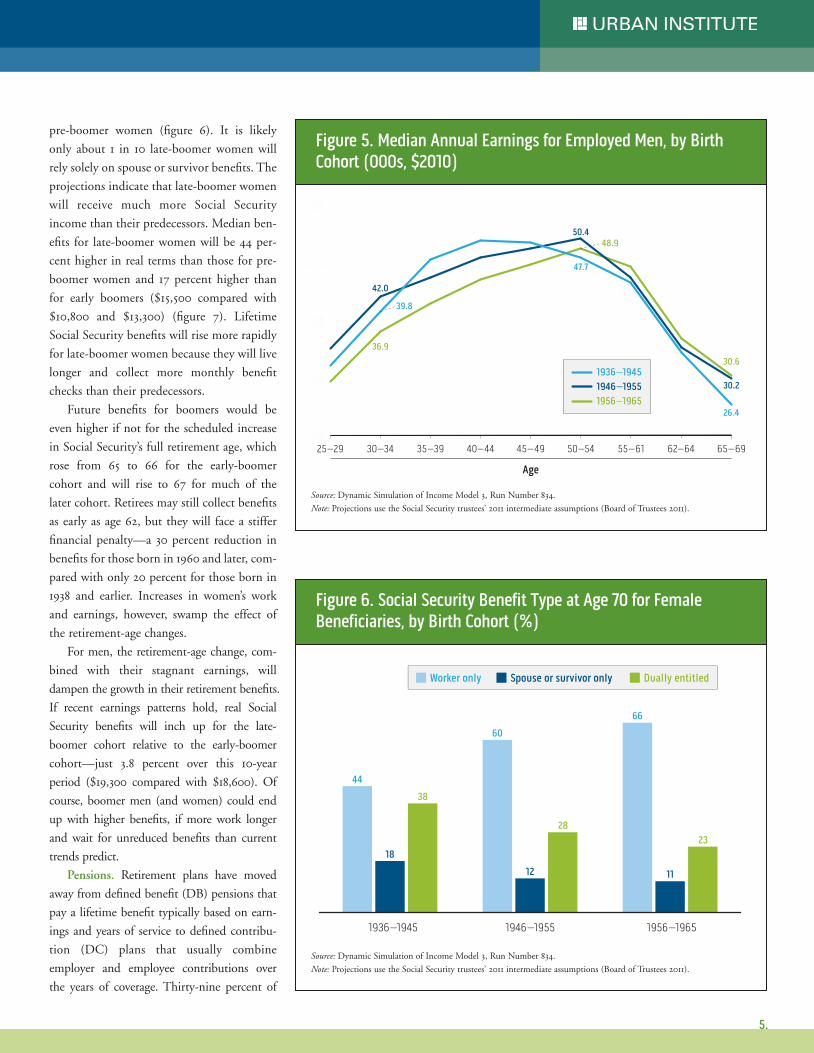
figure 3. Median number of Years employed by Age 70, by birth Cohort
BriefRetirement#34-Rd4_Layout 1 2/10/12 10:46 AM Page 3
early boomers, born between 1946 and 1955,
and late boomers, born between 1956 and 1965,
with the pre-boomer cohort born between
1936 and 1945. The projections begin with
recent patterns in earnings, retirement, and
financial assets and then base future growth
on the intermediate assumptions in the 2011
Social Security Trustees report.
The results from the projection are
mixed: boomers will receive more income at
age 70 than their predecessors, but that
income will replace a somewhat smaller share
of their preretirement earnings. Compared
with their pre-boomer counterparts, boomer
men will have less in retirement assets while
boomer women will have more. The projec-
tions indicate 30 to 40 percent of late
boomers will not reach a 75 percent replace-
ment rate, suggesting that they may be
unable to maintain their preretirement
living standards at age 70. However, the pre-
dicted share at risk is only slightly higher
than for their predecessors.
Changing DemographicsShifting demographics at older ages will play
an important role in boomers’ retirement
income security. Americans are living longer.
Between 1980 and 2007, life expectancy at age
62 increased three years for men and two years
for women.3 Reduced mortality is a significant
achievement, although the gains have been
concentrated among well-educated and high-
income Americans.4 Longer life expectancy has
lengthened retirements, even though some
people have begun working longer. Longer
lives in turn boost the cost of Social Security
and traditional pensions, and mean that
retirees’ savings must last longer.
Lower mortality reflects better health at
older ages and greater investments in health
care. The share of Americans age 65 to 74
reporting fair or poor health fell from 32.5 per-
cent in 1983 to 21.6 percent in 2008.5 It’s not
clear, however, whether this trend will con-
tinue. The gains occurred mostly before 2000.
Reported health hasn’t improved much since
then and disability rates are now inching up for
people in their forties and fifties.6 Nonetheless,
the Social Security trustees project that age-62
life expectancy will increase another two years
for men and one year for women by 2025.7
Other analysts predict that future generations
will live even longer.8
Marriage, divorce, and widowhood patterns
are also changing and will influence financial
security at older ages. Retirees often lose some
of their spouse’s Social Security and pension
benefits when they become widowed or
divorced and singles forgo the financial security
of a second paycheck and the cost savings from
shared expenses. As a result, widowed, divorced,
and never-married seniors have much higher
poverty rates than married couples.
As men’s life expectancy rises, the gender
gap in mortality will shrink and widowhood
will become less common among older
women. The projections indicate that only 18
percent of late-boomer women will be wid-
owed at age 70, down from 25 percent among
pre-boomer women (figure 1). Falling mar-
riage rates, especially among boomers born
after 1955, will increase the share of singles at
age 70 compared with earlier cohorts—an
uptick that will be offset by the decline in
widowhood among older women. However, a
smaller share of boomer men (and especially
late-boomer men) will be married at age 70
than in earlier generations.
Adult children often support their retired
parents, sometimes with financial assistance
but more often with chores and personal care
when their parents become frail. However,
declining fertility rates will leave about one
in six late-boomer women childless, com-
pared with only about 1 in 12 pre-boomer
women. With fewer adult children, more
boomers will need to pay for help if they
become frail.
Higher educational attainment by boomers
should enhance their financial security.
Education boosts earnings and helps qualify
workers for less physically demanding jobs,
promoting work at older ages. The surge in
college attendance in the 1960s and 1970s
increased the share of late boomers with a
bachelor’s degree to 30 percent, up from 22
percent for those born between 1936 and 1945
(figure 2). Only 12 percent failed to complete
high school, less than two-thirds the dropout
rate for pre-boomers.
Lifetime earningsRetirement incomes depend critically on how
much people worked and earned when they
were younger. Higher lifetime earnings mean
more Social Security and—for those with cov-
erage—larger pensions and retirement account
balances. It also means the ability to save more
outside of retirement accounts.
The employment rate for women grew dra-
matically over the past generation. Between
1975 and 2007, the share of women age 25 to 54
participating in the labor force (either working
or looking for work) went up from 55 to 76
percent.9 Over the same period, their male
counterparts scaled back their work somewhat,
3.2.
boomers’ Retirement Income Prospects
1936–1945
1946–1955
1956–1965
Graduated collegeDid not graduate high school Graduated high school
19 2259
11 3158
12 3058
figure 2. educational Attainment at Age 70, by birth Cohort (%)
Source: Dynamic Simulation of Income Model 3, Run Number 834.
Note: Projections use the Social Security trustees’ 2011 intermediate assumptions (Board of Trustees 2011).
1936–1945
1946–1955
1956–1965
1936–1945
1946–1955
1956–1965
Men
Women
74
72
67
52
53
53
8
7 12
14127
25 17 6
81920
18 18 11
12 5
9
DivorcedWidowed Never marriedMarried
Source: Dynamic Simulation of Income Model 3, Run Number 834.
figure 1. Marital status at Age 70, by birth Cohort (%)
All Men Women
3841 42 4343 42
38
30
40
1956–19651946–19551936–1945
Source: Dynamic Simulation of Income Model 3, Run Number 834.
Note: Projections use the Social Security trustees’ 2011 intermediate assumptions (Board of Trustees 2011).
figure 3. Median number of Years employed by Age 70, by birth Cohort
BriefRetirement#34-Rd4_Layout 1 2/10/12 10:46 AM Page 3

with labor force participation rates falling from
94 to 91 percent as job opportunities for low-
skilled men eroded.10
Older men and women are both working
more. Between 1990 and 2010, labor force par-
ticipation rates at ages 62 and older increased
from 22 to 29 percent for men and from 12 to
20 percent for women.11 This growth reflects
Social Security changes that boosted work
incentives (by raising the full retirement age
and eliminating the work penalty for older
beneficiaries), as well as the shift away from
traditional private-sector pension plans that
reward early retirement.12 Older women’s
employment growth also reflects the aging of a
generation that has always worked much more
than earlier ones.
These trends will significantly boost life-
time employment and earnings for boomer
women, according to our projections. By age
70, late-boomer women will have worked a
median 40 years of employment, compared
with 30 years for pre-boomer women (figure 3).
By contrast, a typical boomer man will work
roughly the same amount as a typical pre-
boomer man. Employed early-boomer women
ages 50 to 54 earn 36 percent more per year in
inflation-adjusted dollars than their pre-
boomer counterparts ($30,000 versus $22,100),
while late-boomer women will earn 59 percent
more ($35,100) (figure 4).
Median earnings have been falling or stag-
nant for men, however. Through age 50, work-
ing boomer men earn less than their pre-
boomer counterparts (figure 5). Earnings for
the three cohorts generally converge after age
50, when most estimated boomer earnings are
based on model projections (that assume infla-
tion-adjusted earnings rise 1.2 percent per year,
somewhat faster than actual recent growth)
rather than direct observation. The long-term
stagnation in men’s median earnings, which
has been widely debated among scholars and
policymakers, has been driven by the poor job
prospects for men with no more than a high
school diploma.
Retirement IncomesWhile more retirees will rely on earnings to
augment their incomes at age 70 and beyond,
most will still rely primarily on traditional
sources of retirement income. Social Security
historically has provided the bulk of retire-
ment income, at least for lower- and moder-
ate-income retirees, and will continue to play
this role for boomers. Many will receive some
income from traditional pensions, although
more will have riskier 401(k)-type plans.
Most boomers also will have some other
financial assets and housing equity. Whether
these income sources will adequately replace
preretirement income, though, depends on
how much retirees will spend, especially on
health care.
Social Security. Social Security will con-
tinue to be the primary income source for
boomer retirees, despite the ongoing contro-
versy over its financing. The system now pays
more benefits than it collects in taxes, but is
paid for through 2036 by a reserve fund built
up over the past 25 years when taxes exceeded
benefit payments.13While some scaling back of
Social Security may be necessary to ensure ben-
efits beyond 2036, any changes likely will affect
boomers far less than later retirees.
Social Security retirement benefits are
based on earnings (up to the taxable maxi-
mum) over 35 years. Retirees who have worked
at least 10 years qualify for these worker bene-
fits. Those who have not worked enough to
qualify on their own can receive a benefit equal
to half their spouse’s benefit, but divorced
spouses must have been married for at least 10
years. Widows and widowers may receive the
spouse’s full benefit. Those with small worker
benefits receive partial spouse or survivor ben-
efits so that the combined payment equals the
full spouse or survivor benefit.
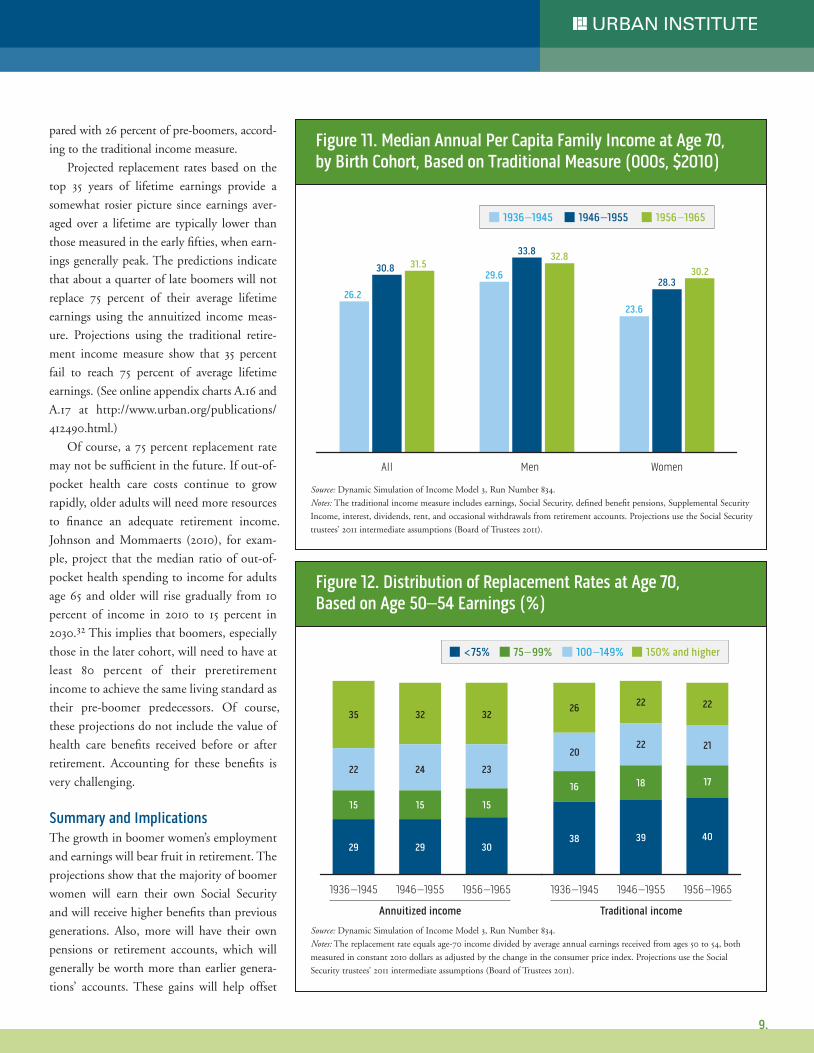
The projections show that boomer
women’s higher labor force participation and
earnings will boost their Social Security
benefits. Two-thirds of women in the late-
boomer cohort will qualify solely for a
worker benefit, compared with 44 percent of
pre-boomer women (figure 6). It is likely
only about 1 in 10 late-boomer women will
rely solely on spouse or survivor benefits. The
projections indicate that late-boomer women
will receive much more Social Security
income than their predecessors. Median ben-
efits for late-boomer women will be 44 per-
cent higher in real terms than those for pre-
boomer women and 17 percent higher than
for early boomers ($15,500 compared with
$10,800 and $13,300) (figure 7). Lifetime
Social Security benefits will rise more rapidly
for late-boomer women because they will live
longer and collect more monthly benefit
checks than their predecessors.
Future benefits for boomers would be
even higher if not for the scheduled increase
in Social Security’s full retirement age, which
rose from 65 to 66 for the early-boomer
cohort and will rise to 67 for much of the
later cohort. Retirees may still collect benefits
as early as age 62, but they will face a stiffer
financial penalty—a 30 percent reduction in
benefits for those born in 1960 and later, com-
pared with only 20 percent for those born in
1938 and earlier. Increases in women’s work
and earnings, however, swamp the effect of
the retirement-age changes.
For men, the retirement-age change, com-
bined with their stagnant earnings, will
dampen the growth in their retirement benefits.
If recent earnings patterns hold, real Social
Security benefits will inch up for the late-
boomer cohort relative to the early-boomer
cohort—just 3.8 percent over this 10-year
period ($19,300 compared with $18,600). Of
course, boomer men (and women) could end
up with higher benefits, if more work longer
and wait for unreduced benefits than current
trends predict.
Pensions. Retirement plans have moved
away from defined benefit (DB) pensions that
pay a lifetime benefit typically based on earn-
ings and years of service to defined contribu-
tion (DC) plans that usually combine
employer and employee contributions over
the years of coverage. Thirty-nine percent of
5.
boomers’ Retirement Income Prospects
1936–1945 1946–1955 1956–1965
44
18
38
12
60
28
11
66
23
Dually entitledSpouse or survivor onlyWorker only
figure 6. social security benefit type at Age 70 for femalebeneficiaries, by birth Cohort (%)
Source: Dynamic Simulation of Income Model 3, Run Number 834.
Note: Projections use the Social Security trustees’ 2011 intermediate assumptions (Board of Trustees 2011).
25–29 30–34 35–39 40–44 45–49 50–54 55–61 62–64 65–6922.00
30.25
38.50
46.75
55.00
Age
42.0
39.8
36.9
50.4
47.7
48.9
30.2
26.4
30.61936–19451946–19551956–1965
Source: Dynamic Simulation of Income Model 3, Run Number 834.
Note: Projections use the Social Security trustees’ 2011 intermediate assumptions (Board of Trustees 2011).
figure 5. Median Annual earnings for employed Men, by birthCohort (000s, $2010)
25–29 30–34 35–39 40–44 45–49 50–54 55–61 62–64 65–69
Age
1936–19451946–19551956–1965
21.1
23.0
16.0
30.0
35.1
22.1
27.5
32.0
16.6
figure 4. Median Annual earnings for employed Women, by birth Cohort (000s, $2010)
Source: Dynamic Simulation of Income Model 3, Run Number 834. Note: Projections use the Social Security trustees’ 2011 intermediate assumptions (Board of Trustees 2011).
4.
BriefRetirement#34-Rd4_Layout 1 2/10/12 10:46 AM Page 5
with labor force participation rates falling from
94 to 91 percent as job opportunities for low-
skilled men eroded.10
Older men and women are both working
more. Between 1990 and 2010, labor force par-
ticipation rates at ages 62 and older increased
from 22 to 29 percent for men and from 12 to
20 percent for women.11 This growth reflects
Social Security changes that boosted work
incentives (by raising the full retirement age
and eliminating the work penalty for older
beneficiaries), as well as the shift away from
traditional private-sector pension plans that
reward early retirement.12 Older women’s
employment growth also reflects the aging of a
generation that has always worked much more
than earlier ones.
These trends will significantly boost life-
time employment and earnings for boomer
women, according to our projections. By age
70, late-boomer women will have worked a
median 40 years of employment, compared
with 30 years for pre-boomer women (figure 3).
By contrast, a typical boomer man will work
roughly the same amount as a typical pre-
boomer man. Employed early-boomer women
ages 50 to 54 earn 36 percent more per year in
inflation-adjusted dollars than their pre-
boomer counterparts ($30,000 versus $22,100),
while late-boomer women will earn 59 percent
more ($35,100) (figure 4).
Median earnings have been falling or stag-
nant for men, however. Through age 50, work-
ing boomer men earn less than their pre-
boomer counterparts (figure 5). Earnings for
the three cohorts generally converge after age
50, when most estimated boomer earnings are
based on model projections (that assume infla-
tion-adjusted earnings rise 1.2 percent per year,
somewhat faster than actual recent growth)
rather than direct observation. The long-term
stagnation in men’s median earnings, which
has been widely debated among scholars and
policymakers, has been driven by the poor job
prospects for men with no more than a high
school diploma.
Retirement IncomesWhile more retirees will rely on earnings to
augment their incomes at age 70 and beyond,
most will still rely primarily on traditional
sources of retirement income. Social Security
historically has provided the bulk of retire-
ment income, at least for lower- and moder-
ate-income retirees, and will continue to play
this role for boomers. Many will receive some
income from traditional pensions, although
more will have riskier 401(k)-type plans.
Most boomers also will have some other
financial assets and housing equity. Whether
these income sources will adequately replace
preretirement income, though, depends on
how much retirees will spend, especially on
health care.
Social Security. Social Security will con-
tinue to be the primary income source for
boomer retirees, despite the ongoing contro-
versy over its financing. The system now pays
more benefits than it collects in taxes, but is
paid for through 2036 by a reserve fund built
up over the past 25 years when taxes exceeded
benefit payments.13While some scaling back of
Social Security may be necessary to ensure ben-
efits beyond 2036, any changes likely will affect
boomers far less than later retirees.
Social Security retirement benefits are
based on earnings (up to the taxable maxi-
mum) over 35 years. Retirees who have worked
at least 10 years qualify for these worker bene-
fits. Those who have not worked enough to
qualify on their own can receive a benefit equal
to half their spouse’s benefit, but divorced
spouses must have been married for at least 10
years. Widows and widowers may receive the
spouse’s full benefit. Those with small worker
benefits receive partial spouse or survivor ben-
efits so that the combined payment equals the
full spouse or survivor benefit.
The projections show that boomer
women’s higher labor force participation and
earnings will boost their Social Security
benefits. Two-thirds of women in the late-
boomer cohort will qualify solely for a
worker benefit, compared with 44 percent of
pre-boomer women (figure 6). It is likely
only about 1 in 10 late-boomer women will
rely solely on spouse or survivor benefits. The
projections indicate that late-boomer women
will receive much more Social Security
income than their predecessors. Median ben-
efits for late-boomer women will be 44 per-
cent higher in real terms than those for pre-
boomer women and 17 percent higher than
for early boomers ($15,500 compared with
$10,800 and $13,300) (figure 7). Lifetime
Social Security benefits will rise more rapidly
for late-boomer women because they will live
longer and collect more monthly benefit
checks than their predecessors.
Future benefits for boomers would be
even higher if not for the scheduled increase
in Social Security’s full retirement age, which
rose from 65 to 66 for the early-boomer
cohort and will rise to 67 for much of the
later cohort. Retirees may still collect benefits
as early as age 62, but they will face a stiffer
financial penalty—a 30 percent reduction in
benefits for those born in 1960 and later, com-
pared with only 20 percent for those born in
1938 and earlier. Increases in women’s work
and earnings, however, swamp the effect of
the retirement-age changes.
For men, the retirement-age change, com-
bined with their stagnant earnings, will
dampen the growth in their retirement benefits.
If recent earnings patterns hold, real Social
Security benefits will inch up for the late-
boomer cohort relative to the early-boomer
cohort—just 3.8 percent over this 10-year
period ($19,300 compared with $18,600). Of
course, boomer men (and women) could end
up with higher benefits, if more work longer
and wait for unreduced benefits than current
trends predict.
Pensions. Retirement plans have moved
away from defined benefit (DB) pensions that
pay a lifetime benefit typically based on earn-
ings and years of service to defined contribu-
tion (DC) plans that usually combine
employer and employee contributions over
the years of coverage. Thirty-nine percent of
5.
boomers’ Retirement Income Prospects
1936–1945 1946–1955 1956–1965
44
18
38
12
60
28
11
66
23
Dually entitledSpouse or survivor onlyWorker only
figure 6. social security benefit type at Age 70 for femalebeneficiaries, by birth Cohort (%)
Source: Dynamic Simulation of Income Model 3, Run Number 834.
Note: Projections use the Social Security trustees’ 2011 intermediate assumptions (Board of Trustees 2011).
25–29 30–34 35–39 40–44 45–49 50–54 55–61 62–64 65–6922.00
30.25
38.50
46.75
55.00
Age
42.0
39.8
36.9
50.4
47.7
48.9
30.2
26.4
30.61936–19451946–19551956–1965
Source: Dynamic Simulation of Income Model 3, Run Number 834.
Note: Projections use the Social Security trustees’ 2011 intermediate assumptions (Board of Trustees 2011).
figure 5. Median Annual earnings for employed Men, by birthCohort (000s, $2010)
25–29 30–34 35–39 40–44 45–49 50–54 55–61 62–64 65–69
Age
1936–19451946–19551956–1965
21.1
23.0
16.0
30.0
35.1
22.1
27.5
32.0
16.6
figure 4. Median Annual earnings for employed Women, by birth Cohort (000s, $2010)
Source: Dynamic Simulation of Income Model 3, Run Number 834. Note: Projections use the Social Security trustees’ 2011 intermediate assumptions (Board of Trustees 2011).
4.
BriefRetirement#34-Rd4_Layout 1 2/10/12 10:46 AM Page 5

private-sector workers were covered by DB
plans in 1980, compared with 19 percent in
2010. During the same period, the share partic-
ipating in DC plans rose from 19 to 41 per-
cent.14Nonetheless, many boomers will receive
a traditional pension because many work in
industries where DB plans are common,
including the public sector.15
The shift toward DC plans and away from
DB plans will have mixed effects for boomers’
retirement income security. Workers who often
change employers typically do not earn much
of a DB benefit because these benefits typically
accrue most rapidly in the years immediately
before retirement age. Benefits accrued early
on erode with inflation. In contrast, DC
balances earn investment returns even after
workers change jobs, but the uncertainty of
investment returns makes DC plans more risky.
Prolonged market downturns, for example,
can leave workers with a small account that
generates little retirement income. Retirement
account assets (DC and IRAs) dropped by $2.7
trillion (31 percent) from the third quarter of
2007 through the end of the first quarter of
2009.16 While most of this aggregate loss was
recovered in subsequent years, by the end of
2011 account balances remained below their
peak in 2007. Another potential risk in DC
plans relative to DB plans is the temptation
they present for workers to withdraw assets
before retirement.17
Since more women boomers worked, more
women will qualify for a pension based on their
own earnings, improving retirement income
security for themselves and their families.
Pension coverage among women has steadily
increased since the late 1980s so that it is now
on a par with coverage for men.18 Because
future pension benefits are tied to earnings,
these benefits grow as women earn more.
The shift away from DB pensions, the
increases in boomer women’s pension coverage,
and assumptions about rates of return on
account assets will substantially affect future
pension wealth, according to our projections.19
For example, median predicted pension wealth
for those with DB pensions will drop by nearly
half between the pre-boomer cohorts and the
late boomers ($141,600 to $75,600) (figure 8).
In contrast, projected DC pension wealth
will rise by 51 percent (from $68,700 for the
pre-boomers to $103,900 for the late boomers)
and the share of 70-year-olds with DC wealth
will increase slightly from 52 to 54 percent.
The combined pension picture shows that 63
percent of late boomers will have some pen-
sion wealth at age 70. Projected pension own-
ership and wealth will go up slightly between
the pre- and the early-boomer cohorts, and
then decline for the later boomers.
The share of women with pension wealth
at age 70 increases across the three cohorts,
while the share of men with pension wealth
declines somewhat.20 Projected pension wealth
also grows for women but not for men,
although men will continue to outpace
women in total accumulations. For example,
total pension wealth for women with pensions
increases from $91,400 to $111,200 between the
pre- and later-boomer cohorts (22 percent),
while wealth for men falls from $197,700 to
$164,500 (17 percent).
Ownership and levels of pension wealth
differ dramatically by education and income
quintile, our detailed projections show. Only
3 in 10 individuals without a high school
diploma have some pension ownership
among later boomers and their median pen-
sion wealth is only $24,500—less than half
the pension wealth of early boomers without
a high school diploma. These results reflect
the steady erosion in unionized, lower-skilled
manufacturing jobs that typically provided
pension coverage. Today, higher-skilled jobs
more often provide pensions. Predicted pen-
sion wealth rises dramatically with income.
Late boomers in the bottom income quintile
with any pension wealth typically accumulate
only $16,600 compared with $58,800 for
those in the second income quintile. Nearly 9
in 10 individuals in the top income quintile
have projected pension wealth, and median
accumulations reach $388,500, about 23 times
the median wealth of those in the bottom
income quintile.
Financial and housing wealth. Financial
assets and housing equity are especially difficult
to project. Recent stock market volatility shows
that savings held in equities can dramatically
fall (or grow) in any given year. Housing values
began declining in 2007 and continued to fall
in most markets through 2011.21 However, the
history of market indexes suggests an eventual
return to long-term average growth. Our pro-
jections capture the falloff in financial and
housing wealth through 2011, and assume that
real rates of return eventually stabilize at their
historic levels.22 The projections also capture
how changes in individual characteristics likely
will affect these accumulations.23
While quite low, predicted median finan-
cial wealth per person grows across the three
cohorts (figure 9). The median 70-year-old will
have financial assets outside of retirement
accounts valued at $42,300 for the late-boomer
cohort, compared with $29,100 for the pre-
boomer cohort. Predicted financial assets will
be quite low for those in the bottom income
quintiles and rise dramatically with income.24
For example, the late boomers in the top
income quintile have 100 times the projected
median financial wealth of those in the bottom
income quintile ($555,300 compared with
$5,400). Boomer men will hold more financial
assets than boomer women. Projections show
that widowed and never-married women in all
three cohorts will have accumulated few assets
in financial accounts by age 70. For example,
median values will reach just $29,500 for late-
boomer widows and $23,500 for late-boomer
women who never marry.
While most retirees do not tap into the
equity in their homes, doing so can generate
income through a reverse annuity mortgage or
home equity line of credit.25 The projections
show that boomers, like their predecessors, will
have high rates of homeownership, with about
8 in 10 owning a home. Early boomers benefit-
ted from rising housing prices during their
6. 7.
boomers’ Retirement Income Prospects
(100)(100) (100) (80) (81)(82)
Financial Housing
29.1
39.042.3
114.5
93.5 96.0
1936–1945
1946–1955
1956–1965
(percentage with wealth)
Source: Dynamic Simulation of Income Model 3, Run Number 834.
Note: Projections use the Social Security trustees’ 2011 intermediate assumptions (Board of Trustees 2011).
1956–19651946–19551936–1945
(37)(35) (34) (52) (54) (63) (63)(56)
(percentage with pension wealth)
(65)
Defined benefit Defined contribution Either
141.6
117.9
75.684.3
68.7
103.9
142.7136.0 137.1
figure 8. Median Own Pension Wealth among Pension Owners at Age 70, by birth Cohort (000s, $2010)
Source: Dynamic Simulation of Income Model 3, Run Number 834.
Note: Projections use the Social Security trustees’ 2011 intermediate assumptions (Board of Trustees 2011).
All
Men
Women
14.0
15.8
17.3
19.3
17.3
18.6
15.5
10.8
13.3
1956–19651946–19551936–1945
Source: Dynamic Simulation of Income Model 3, Run Number 834.
Note: Projections use the Social Security trustees’ 2011 intermediate assumptions (Board of Trustees 2011).
figure 7. Median Own Annual social security Income amongbeneficiaries at Age 70, by birth Cohort (000s, $2010)
figure 9. Median Per Capita financial and housing Wealth among Owners at Age 70, by birth Cohort (000s, $2010)
BriefRetirement#34-Rd4_Layout 1 2/10/12 10:46 AM Page 7

careers, while late boomers were affected more
by the housing bust since 2006.26 Projected
median per capita housing wealth increases
from $93,500 for pre-boomers to $114,500 for
early boomers, and then drops to $96,000 for
later boomers. The predicted equity decline for
late boomers also reflects trends in increased
borrowing against homes prior to retirement.
Will these Resources be Adequate?Will boomers have enough to retire comfort-
ably? Some analysts unequivocally conclude
that the majority of boomers will have too lit-
tle, while others argue that many boomers are
saving too much.27 Others conclude that
retirement income security will gradually erode,
and Gen Xers (born between 1966 and 1975)
will be less likely than today’s retirees to have
enough retirement income to maintain their
preretirement standard of living.28
The answer depends on assumptions about
future retirement-income resources and the
amount needed to maintain preretirement liv-
ing standards. Projected retirement income
depends on retirement ages; growth rates for
pension, financial, and housing assets; the use
of home equity as an income stream; assump-
tions about how Congress will handle Social
Security underfunding; and assumptions about
whether retirees annuitize their pension and
financial assets. The amount of retirement
income required, typically called a replacement
rate, depends on expenditure estimates. A 75
percent replacement rate is often used as an
adequacy rule of thumb, assuming that spend-
ing declines in retirement, especially since
retirees do not pay payroll taxes or save in
retirement accounts.29 Others argue that
retirees need at least as much income as they
had before retiring to cover rising medical costs
(as prices and health care use increase).30
We use two measures to predict future
retirement income. The first, a traditional
measure, counts income retirees receive from
their financial assets (interest, dividends, and
rent) plus money withdrawn from retirement
accounts (based on historic withdrawal trends
and required minimum distributions) and cash
income (earnings, Social Security, and pen-
sions). The second measure assumes that
retirees receive the income generated by annu-
itizing 80 percent of their retirement and finan-
cial assets in addition to cash income. The
annuitized measure is higher because it assumes
that retirees draw down most of their assets dur-
ing retirement (except for home equity), leaving
just 20 percent of their savings.31
Annuitized income projections at age 70
again show rising household income for
women in each cohort (figure 10). Early
boomer men will receive more income than
their pre-boomer counterparts, but late
boomers will receive less than early boomers.
Although the gender gap in retirement income
is shrinking, projected annuitized income for
late-boomer men will still exceed that for
women ($39,000 compared with $36,000).
Overall, the projections indicate that early
boomers will do better than their predecessors,
but this trend will flatten between the early and
late boomers. The traditional income measure
presents a similar picture, although predicted
incomes will be about $5,000 (13 percent)
lower for all cohorts than if boomers annuitize
assets (figure 11).
Estimating how many boomers will be able
to replace 75 percent of their preretirement
earnings depends on how the measure is con-
structed. With a replacement rate based on
average earnings received between age 50 and
54, the annuitized income measure predicts
that about 3 in 10 late boomers will fall short of
a 75 percent replacement rate (figure 12). The
traditional measure of retirement income finds
that nearly 4 in 10 will be at risk. The replace-
ment rate projections do not vary much
between the pre- and late boomers. The projec-
tions also show that relatively few boomers
receive enough income at age 70 to replace
more than 150 percent of their preretirement
income—22 percent of late boomers, com-
pared with 26 percent of pre-boomers, accord-
ing to the traditional income measure.
Projected replacement rates based on the
top 35 years of lifetime earnings provide a
somewhat rosier picture since earnings aver-
aged over a lifetime are typically lower than
those measured in the early fifties, when earn-
ings generally peak. The predictions indicate
that about a quarter of late boomers will not
replace 75 percent of their average lifetime
earnings using the annuitized income meas-
ure. Projections using the traditional retire-
ment income measure show that 35 percent
fail to reach 75 percent of average lifetime
earnings. (See online appendix charts A.16 and
A.17 at http://www.urban.org/publications/
412490.html.).
Of course, a 75 percent replacement rate
may not be sufficient in the future. If out-of-
pocket health care costs continue to grow
rapidly, older adults will need more resources
to finance an adequate retirement income.
Johnson and Mommaerts (2010), for exam-
ple, project that the median ratio of out-of-
pocket health spending to income for adults
age 65 and older will rise gradually from 10
percent of income in 2010 to 15 percent in
2030.32 This implies that boomers, especially
those in the later cohort, will need to have at
least 80 percent of their preretirement
income to achieve the same living standard as
their pre-boomer predecessors. Of course,
these projections do not include the value of
health care benefits received before or after
retirement. Accounting for these benefits is
very challenging.
summary and ImplicationsThe growth in boomer women’s employment
and earnings will bear fruit in retirement. The
projections show that the majority of boomer
women will earn their own Social Security
and will receive higher benefits than previous
generations. Also, more will have their own
pensions or retirement accounts, which will
generally be worth more than earlier genera-
tions’ accounts. These gains will help offset
8. 9.
boomers’ Retirement Income Prospects
1946–1955 1956–19651936–1945
Annuitized income
1946–1955 1956–19651936–1945
Traditional income
29
15
22
35
29
15
24
32
30
15
23
32
38
16
20
26
39
18
22
22
40
17
21
22
100–149%75–99% 150% and higher<75%
Source: Dynamic Simulation of Income Model 3, Run Number 834.
Notes: The replacement rate equals age-70 income divided by average annual earnings received from ages 50 to 54, both
measured in constant 2010 dollars as adjusted by the change in the consumer price index. Projections use the Social
Security trustees’ 2011 intermediate assumptions (Board of Trustees 2011).
Men WomenAll
29.6
33.8 32.8
28.3
23.6
30.230.8
26.2
31.5
1956–19651946–19551936–1945
Source: Dynamic Simulation of Income Model 3, Run Number 834.
Notes: The traditional income measure includes earnings, Social Security, defined benefit pensions, Supplemental Security
Income, interest, dividends, rent, and occasional withdrawals from retirement accounts. Projections use the Social Security
trustees’ 2011 intermediate assumptions (Board of Trustees 2011).
figure 11. Median Annual Per Capita family Income at Age 70, by birth Cohort, based on traditional Measure (000s, $2010)
Men WomenAll
35.1
40.339.0
34.2
28.2
36.037.2
31.1
37.3
1956–19651946–19551936–1945
figure 10. Median Annual Per Capita family Income at Age 70, by birth Cohort, based on Annuitized Measure (000s, $2010)
figure 12. Distribution of Replacement Rates at Age 70, based on Age 50–54 earnings (%)
Source: Dynamic Simulation of Income Model 3, Run Number 834.
Notes: The annuitized income measure includes earnings, Social Security, defined benefit pensions, Supplemental Security
Income, and the annual income from an annuity valued at 80 percent of financial assets and retirement accounts.
Projections use the Social Security trustees’ 2011 intermediate assumptions (Board of Trustees 2011).
BriefRetirement#34-Rd4_Layout 1 2/10/12 10:46 AM Page 9

anemic growth in benefits for boomer men,
who will have little more Social Security than
their predecessors because of their stagnant
wages and somewhat reduced labor market
activity at earlier ages.
The shift in employer coverage from DB
pensions to DC plans means that more men
and women with coverage will retire on ben-
efits subject to the volatility of stocks and
bonds. Although risky, these accounts will
bolster retirement income security if workers
participate, assets are invested prudently, and
financial markets provide positive long-term
rates of return.
Although projected age-70 incomes will
be higher for boomers than for their prede-
cessors, the picture of retirement income
security that emerges from these trends is
worrisome. Counting regular cash income
plus income generated from assets and peri-
odic withdrawals from retirement accounts
suggests that 4 in 10 late boomers will lack
sufficient income at age 70 to replace 75 per-
cent of what they earned between ages 50 and
54. An alternative measure that annuitizes
most financial and retirement assets reduces
the share that falls below the 75 percent tar-
get to 3 in 10. Measures of predicted retire-
ment income adequacy based on earnings
averaged over a lifetime—typically less than
the average at ages 50 to 54—also paint a
somewhat rosier picture. Despite the high
share of boomers predicted to be ill-prepared
for retirement, the picture is not much worse
than for their predecessors.
These predicted outcomes for the typical
boomer mask significant differences across
groups. Those with limited education will
have less retirement income and will rely pri-
marily on Social Security. Also the gap
between the rich and poor is striking. For
example, boomers in the top income quin-
tile will accrue more than 100 times the
financial wealth and 10 times the per capita
annuity income held by those in the bottom
income quintile.
How boomers really fare in retirement will
hinge on several unknowns. How much will
stocks and bonds earn over the coming
decades? Will more boomers than we expect
end up working well into old age? Will a sig-
nificant share end up dipping into their hous-
ing wealth? Will Congress cut boomers’ Social
Security? And perhaps most important, how
much will boomers need to spend on health
and long-term care? One estimate suggests that
out-of-pocket medical costs will consume 15
percent of income for the median boomer
retiree, up from 10 percent for the pre-boomer
retirees—which suggests that boomers will
need more than their predecessors to enjoy a
comfortable retirement. A benchmark of 75
percent of preretirement income may no
longer be adequate.
The projections lead to some important
policy implications:
• Boomers, especially those with limited
education and income and those who are
divorced, are widowed, or never married,
will continue to rely primarily on Social
Security. Policymakers need to ensure
the system’s long-term financial health.
• Boomers should be encouraged to work
as long as they can. Policymakers and
employers need to recognize the impor-
tance of jobs for older adults, promoting
retraining and flexible work schedules
that can accommodate their needs.
• Boomers should be encouraged to
annuitize some of their retirement
accounts and savings when they retire
to boost their incomes and produce
a guaranteed income stream until death.
Policymakers should consider policies
that make annuities more attractive
and increase trust in these products.
• A significant share of boomers will reach
age 70 with very little retirement income.
Policy remedies such as modernizing
the Supplemental Security Income
program and boosting minimum Social
Security benefits would help the most
vulnerable retirees for modest cost.
• Whether boomers are better off than
their predecessors, they will comprise
a much larger portion of the total
population, straining public resources to
meet their needs. Remedies that address
this fiscal strain must be mindful of
the vulnerability of many older adults,
especially those with limited education,
widows, and other singles.•
AcknowledgmentsThis brief was funded by a generous grant
from the Rockefeller Foundation. The authors
are grateful to Serena Lei for editorial assis-
tance, Janice Park for help with the graphics,
and Barbara Butrica and Gene Steuerle for
helpful comments.
10. 11.
boomers’ Retirement Income Prospects
notes1. Program on Retirement Policy (2011c).
2. For example, our projections show that 58 per-
cent of individuals born between 1936 and 1965
who die between ages 56 to 69 have no more
than a high school diploma, compared with 50
percent of those who survive to age 70.
3. National Center for Health Statistics (1985, 2011b).
4. Meara, Richards, and Cutler (2008); Waldron
(2007).
5. National Center for Health Statistics (2011a).
6. Lakdawalla, Bhattacharya, and Goldman (2004);
Martin et al. (2009).
7. Unpublished 2011 tabulations from SSA.
8. 2011 Technical Panel on Assumptions and
Methods (2011).
9. Bureau of Labor Statistics (2011).
10. Between 2007 and 2011 participation rates for men
and women fell slightly as unemployment surged
and pushed some workers out of the labor force.
11. Program on Retirement Policy (2011a, 2011b).
12. Friedberg and Webb (2005).
13. Board of Trustees (2011). The trust fund is
invested in government securities, and the draw-
down in the fund will force the government to
redeem these bonds, increasing pressure on the
federal budget.
14. Bureau of Labor Statistics (2010); Pension and
Welfare Benefits Administration (2001/2002).
15. In 2010, DB plans covered 79 percent of state and
local government employees (Bureau of Labor
Statistics 2010).
16. Butrica (2012).
17. Butrica, Zedlewski, and Issa (2010).
18. Butrica and Johnson (2010).
19. As explained in Smith (2012), the model accounts
for recent market volatility and subsequently
assumes real long-run rates of return of 6.5 per-
cent for stocks, 3.5 percent for corporate bonds,
and 3.0 percent for government bonds with stan-
dard deviations around these averages based on
historic experience.
20. See online appendix tables A.6 through A.11 at
http://www.urban.org/publications/412490.html
for our detailed projections.
21. Case-Shiller (2011).
22. As explained in Smith (2012), financial assets
and home equity projections are based on the
experiences of recent cohorts documented in
numerous datasets.
23. See Smith (2012). For example, lifetime earnings
and unemployment spells affect wealth.
24. See online appendix table A.12 at
http://www.urban.org/publications/412490.html.
25. While the use of reverse annuity mortgages has
increased over the last decade, they are still rela-
tively uncommon. The cost of taking out these
mortgages, the lack of knowledge about them,
and the requirement that they be repaid when
holders vacate their houses all contribute to low
adoption (Foote 2010). Before the mortgage crisis
some older adults tapped into home equity
through home equity loans, but these now are
less commonly available.
26. Real housing prices more than tripled between
1987 and 2007 and then dropped about 30
percent (Case-Shiller 2011).
27. Scholz, Seshadri, and Khitatrakun (2006) con-
clude that fewer than 20 percent of households
have less wealth than their optimal targets;
Munnell, Webb, and Golub-Sass (2009) estimate
that half of today’s households will not have
enough retirement income to maintain their
preretirement living standards; and VanDerhei
(2011) estimates that nearly half of early boomers
will be at risk of having insufficient retirement
income to pay for the basics, including
uninsured health care costs.
28. Butrica, Smith, and Iams (2012).
29. See Scholz and Seshadri (2009) for a discussion
of replacement rates.
30. VanDerhei (2011).
31. Some analysts also include the annuitized value of
home equity in these calculations. We exclude
home equity because historically few retirees have
actually tapped into this wealth.
32. Out-of-pocket health spending includes premi-
ums (Medicare and private), deductibles and
copays, and miscellaneous spending. Johnson and
Mommaerts (2010) use the Medicare trustees’
2009 intermediate assumptions (2.2 percent real
growth between 2010 and 2020 and 2.9 percent
from 2021 through 2030) to project costs.
References2011 Technical Panel on Assumptions and Methods.
2011. Report to the Social Security Advisory Board.
Washington, DC: Social Security Advisory Board.
Board of Trustees. 2011. The 2011 Annual Report of
the Board of Trustees of the Federal Old-Age and
Survivors Insurance and Federal Disability Insurance
Trust Funds.Washington, DC: U.S. Government
Printing Office.
Bureau of Labor Statistics. 2010. National
Compensation Survey: Employee Benefits in the
United States, March 2010.Washington, DC: U.S.
Department of Labor.
———. 2011. “Labor Force Statistics from the
Current Population Survey.” Washington, DC:
U.S. Department of Labor.
http://data.bls.gov/pdq/querytool.jsp?survey=ln.
(Downloaded December 01, 2011.)
Butrica, Barbara A. 2012. “Retirement Account
Balances.” Washington, DC: The Urban Institute.
Butrica, Barbara A., and Richard W. Johnson. 2010.
“Racial, Ethnic, and Gender Differentials in Employer-
Sponsored Pensions.” Statement to the ERISA
Advisory Council, U.S. Department of Labor, June 30.
Butrica, Barbara A., Karen E. Smith, and Howard
Iams. 2012. “This Is Not Your Parents’ Retirement:
Comparing Retirement Income across Generations.”
Social Security Bulletin 72(1): 1–22.
Butrica, Barbara A., Sheila Zedlewski, and Philip
Issa. 2010. Understanding Early Withdrawals from
Retirement Accounts.Washington, DC: The Urban
Institute. Retirement Policy Center Discussion
Paper 10-02.
BriefRetirement#34-Rd4_Layout 1 2/10/12 10:46 AM Page 11

Program on Retirement Policy
http://www.retirementpolicy.org
The Program on Retirement Policy addresses how current and proposed retirement policies,
demographic trends, and private-sector practices affect the well-being of older individuals,
the economy, and government budgets.
Copyright © February 2012
The views expressed are those of the authors and do not necessarily reflect those of the
Urban Institute, its trustees, or its funders. Permission is granted for reproduction of this
document, with attribution to the Urban Institute.
URbAn InstItUte
2100 M street, nW ●
Washington, DC 20037-1231
(202) 833-7200 ●
[email protected] ● www.urban.org
Boomers face increasingly uncertain
retirement prospects. Traditional
employer-sponsored pensions that
pay a fixed benefit from retirement
until death—once a mainstay for middle-class
retirees—have been disappearing, replaced by
401(k)-type plans whose payout depends on
unpredictable investment returns. The 2008
stock market crash wiped out trillions of dol-
lars in retirement savings, and stock values still
hadn’t recovered by the end of 2011. The worst
housing slump since the Great Depression
combined with widespread mortgage borrow-
ing when home values were increasing has sup-
pressed home equity values. Rising health care
costs, stagnant wages, and potential Social
Security cutbacks add to boomers’ concerns.
But there also is encouraging news.
Boomer women have worked and earned more
than ever before, propping up family incomes
and boosting retirement wealth. Average
earnings grew earlier in boomers’ careers,
health status improved (especially at older ages),
and strong economic growth propelled home
and stock market values to new highs, despite
recent setbacks.
How will these conflicting forces play out?
This brief shows how changing patterns
of lifetime earnings, pension participation,
and wealth accumulation outside of retire-
ment plans will combine to shape boomers’
economic well-being by the time they reach
age 70, when most have retired and accrued all
their retirement savings. Our focus on age 70,
however, generates a somewhat rosier retire-
ment picture than if we considered boomers at
a younger age, since high-income, better edu-
cated people tend to live longer.2
Using DYNASIM3, the Urban Institute’s
dynamic microsimulation model, we compare
Program onRetirement Policy
The debate over the economic security of future retirees has special meaning for baby boomers, the 77 million surviving
Americans born between 1946 and 1964. Many of the oldest boomers, who began turning 65 last year, have already retired or will
soon. The youngest boomers are now in their late forties, prime earning years when retirement savings typically ramp up. Because
of their sheer numbers, the boomers’ exit from the labor force and reliance on public retirement benefits will reverberate through
society, affecting business, government, and younger taxpayers as well as retirees themselves. By 2030, when the last boomers
have turned 65, the share of Americans age 65 or older will rise by almost half, from 13 percent today to 19 percent.1
Social Security
historically has
provided the bulk
of retirement income,
at least for lower-
and moderate-income
retirees, and will
continue to play this
role for boomers.
bR I e f #
34feb. 2012
I n s I D e t h I s I s s U e•boomer women have worked more than ever before,boosting family incomes and retirement wealth.
•the shift from pensions paying regular retirement income for life to 401(k) plans subjectto market volatility adds uncertainty to boomers’retirement income.
•30 to 40 percent of the youngest boomers will not replace 75 percent of earnings received in their early fifties, making it difficult to maintainpreretirement living standards.
www.urban.org
About the AuthorsMelissa M. Favreault is a senior
fellow in the Urban Institute’s
Income and Benefits Policy Center.
Richard W. Johnson is a senior
fellow in the Urban Institute’s
Income and Benefits Policy Center.
Karen E. Smith is a senior research
associate in the Urban Institute’s
Income and Benefits Policy Center.
Sheila R. Zedlewski is an institute
fellow; she directed the Urban
Institute’s Income and Benefits
Policy Center for 20 years.
boomers’ Retirement Income ProspectsMelissa M. Favreault, Richard W. Johnson, Karen E. Smith, and Sheila R. Zedlewski
Case-Shiller. 2011. “S&P Case-Shiller Home Price
Indices.” Standard and Poors Financial Services.
http://www.standardandpoors.com/indices/sp-case-
shiller-home-price-indices/en/us/?indexId=spusa-cash-
pidff--p-us---. (Downloaded December 01, 2011.)
Foote, Bruce. 2010. “Reverse Mortgages: Background
and Issues.” CRS Report for Congress 7-5700.
Washington, DC: Congressional Research Service.
Friedberg, Leora, and Anthony Webb. 2005.
“Retirement and the Evolution of Pension Structure.”
Journal of Human Resources 40(2): 281–308.
Johnson, Richard W., and Corina Mommaerts. 2010.
“Will Health Care Costs Bankrupt Aging Boomers?”
Washington, DC: The Urban Institute.
Lakdawalla, Darius N., Jayanta Bhattacharya, and
Dana P. Goldman. 2004. “Are the Young Becoming
More Disabled?” Health Affairs 26(1): 168–76.
Martin, Linda G., Vicki A. Freedman, Robert F.
Schoeni, and Patricia M. Andreski. 2009. “Health and
Functioning among Baby Boomers Approaching 60.”
Journal of Gerontology: Social Sciences 64B(3): 369–77.
Meara, Ellen R., Seth Richards, and David M.
Cutler. 2008. “The Gap Gets Bigger: Changes in
Mortality and Life Expectancy, by Education,
1981–2000.” Health Affairs 27(2): 350–60.
Munnell, Alicia H., Anthony Webb, and Francesca
Golub-Sass. 2009. “The National Retirement
Income Risk Index: After the Crash.” CRR Issue in
Brief Number 9-22. Chestnut Hill, MA: Center for
Retirement Research.
National Center for Health Statistics. 1985. U.S.
Decennial Life Tables for 1979–81, United States Life
Tables.Washington, DC: Government Printing Office.
–––––. 2011a. “Health Data Interactive.”
http://www.cdc.gov/nchs/hdi.htm. (Downloaded
December 1, 2011.)
–––––. 2011b. United States Life Tables, 2007.
Hyattsville, MD: National Center for Health Statistics.
Pension and Welfare Benefits Administration.
2001/2002. “Private Pension Plan Bulletin: Abstract
of 1998 Form 5500 Annual Reports.” Washington,
DC: U.S. Department of Labor.
Program on Retirement Policy. 2011a. “Female Labor
Force Participation Rates by Age, 1948–2010.”
Washington, DC: The Urban Institute.
http://www.urban.org/retirement_policy/
datawarehouse/olderworkers.cfm.
–––––. 2011b. “Male Labor Force Participation Rates
by Age, 1948–2010.” Washington, DC: The Urban
Institute. http://www.urban.org/retirement_policy/
datawarehouse/olderworkers.cfm.
–––––. 2011c. “Number of Persons by Age,
1950–2050.” Washington, DC: The Urban Institute.
http://www.urban.org/retirement_policy/
datawarehouse/population.cfm.
Scholz, John Karl, and Ananth Seshadri. 2009.
“What Replacement Rates Should Households Use?”
MRRC Working Paper 2009-214. Ann Arbor:
University of Michigan Retirement Research Center.
Scholz, John Karl, Ananth Seshadri, and Surachai
Khitatrakun. 2006. “Are Americans Saving
‘Optimally’ for Retirement?” Journal of Political
Economy 114(4): 607–43.
Smith, Karen E. 2012. “Projection Methods Used
in the Dynamic Simulation Model of Income
(DYNASIM3).” Washington, DC: The Urban
Institute.
VanDerhei, Jack. 2011. “A Post-Crisis Assessment of
Retirement Income Adequacy for Baby Boomers
and Gen Xers.” Washington, DC: Employee Benefit
Research Institute.
Waldron, Hilary. 2007. “Trends in Mortality
Differentials and Life Expectancy for Male Social
Security–Covered Workers, by Socioeconomic
Status.” Social Security Bulletin 67(3): 1–28.
BriefRetirement#34-Rd4_Layout 1 2/10/12 10:46 AM Page 1