boom and bust? a political economy reading of india's ...iegindia.org/upload/pdf/wp342.pdf ·...
TRANSCRIPT

lR;eso ijeks /eZ% IEG Working Paper No. 342 2014
Kunal SenSabyasachi Kar
Boom and Bust? A Political EconomyReading of India's Growth Experience,
1993-2013

lR;eso ijeks /eZ% IEG Working Paper No. 342 2014
Kunal SenSabyasachi Kar
Boom and Bust? A Political EconomyReading of India's Growth Experience,
1993-2013

ACKNOWLEDGMENTS
This study forms a part of a global project on the political economy determinants of economicgrowth. It is funded by the Effective States and Inclusive Development (ESID) research centre,based at the University of Manchester. More information on ESID can be found at effective-
states.org. We thank Jagadish Sahu for his able research assistance We thank the participants
of the workshop on Beyond Policy Paralysis on 23 July 2014 at the India International
Centre Delhi for their comments and particularly thank Dr Pratap Bhanu Mehta for his
comments We also thank Surit Das for his assistance with copy-editing. The usual disclaimerapplies.
Kunal Sen is Professor at Institute for Development Policy and Management,University of Manchesteremail: [email protected]
Sabyasachi Kar is Associate Professor at the Institute of Economic Growth, Delhiemail: [email protected]
.
' '
, ,
.

Boom and Bust? A Political EconomyReading of India's Growth Experience,
1993-2013
ABSTRACT
We examine the political economy causes of India's growth acceleration in the early 1990s,and the periods of high growth in the 1990s and early 2000s, and the subsequent slowdownsince 2011. We argue that India's post-reform growth experience can be separated into threedistinct growth episodes. The first growth episode was from 1993 to 2002 and wascharacterised by a set of predictable informal relationships (which we call 'ordered deals')between political and economic elites, which were relatively open as well. The secondepisode was from 2002 to 2010, and deals in this period became increasingly closed, leadingto negative feedback effects from accountability institutions, the middle class and non-elites,along with structural retrogression of the economy. The third episode, beginning in 2011, wasone of an incipient growth deceleration, and was characterised by increasingly disordereddeals. We argue that this is the outcome of two separate phenomena: (1) increasing politicalde-legitimation of the growth process that was seen as highly predatory and corruption-intensive; and (2) the pushback from accountability institutions in the post-2010 period,leading to greater uncertainty in the deals environment in 2011–2014. For growth to return,we argue that more than economic reforms or infrastructure spending, it is necessary for a re-alignment of the relationships between political and economic elites and between elites andnon-elites such that there is a return to 'open ordered deals' that are politically legitimate andprovide an enabling environment for structural transformation.
Keywords: economic growth, boom and bust, India, deals, institutions
JEL Codes: O11, O43, P16


1 INTRODUCTION
For much of the 1990s and 2000s, India was seen as the 'new kid on the block' amongcountries that were growth success stories, and was one of the three fastest growingeconomies in the world, along with China and Vietnam (Sen 2009). This narrative of India'semerging growth miracle came to a sudden stop in 2011–2014, as growth slowed downconsiderably. The conventional wisdom on why economic growth in India stagnated usuallyattributes the growth slowdown to a combination of internal factors, such as the 'policyparalysis' that befell the central government in recent years and increased macroeconomicuncertainty, and external factors, such as the slowdown in global economic growth since2008. In this paper, we provide a different reading of India's growth experience in the 1990sand 2000s, emphasising political economy and institutional factors that have received less
scholarly and media attention in the current discourse on India's economic stagnation. Wedo so by situating the growth experience of India within a wider understanding of the natureof economic growth in developing countries. Since the seminal work of Pritchett (2000),there has been the realisation that a view of economic growth that is more consistent with thestylised facts of economic growth is one that takes economic growth as movements betweendifferent growth phases, rather than characterised by a 'steady state' rate of economic
growth . Massive discrete changes in growth are common in developing countries, and mostdeveloping countries experience distinct growth episodes: growth accelerations anddecelerations or collapses (Kar et al. 2013a). If economic growth in developing countries isstrongly episodic, it is not surprising that India's growth has followed a similar pattern.
But why do we see such 'boom and bust' economic growth in developing countries? Inthis paper, we first provide an argument for why we see what we call 'boom and bust' growthin developing countries. We then identify India's growth episodes, using standard statisticalmethods to identify structural breaks in India's GDP per capita time-series. Using thismethod, we show that India's post-independence growth experience can be divided intothree phases:
(1) a period of slow growth till 1993;
(2) a period of growth acceleration from 1993 to 2002; and
(3) a period of further acceleration in economic growth from 2002 onwards.
1
2
3
1
2
Most conventional explanations of India's growth slowdown attribute it to external factors or to macroeconomicvariables, such as higher borrowing costs brought about by a contractionary monetary policy, but do not find muchsupport. For example, the IMF (2014) states that two-thirds of India's slowdown is due to internal factors, and not to aworsening external environment. In addition, Tokuoka (2012) and Anand and Tulin (2014) find that the primarydeterminant of the investment slowdown is not an increase in the real interest rate but heightened policy uncertainty. Thisleaves open the question: what explains this increasedpolicy uncertainty? Our paper tries toaddress thisquestion.
As Jones and Olken (2008: 582) point out: 'Almost all countries in the world have experienced rapid growth lastinga decade or longer, during which they converge towards income levels in the United States. Conversely, nearly allcountries have experienced periods of abysmal growth. Circumstances or policies that produce ten years of rapideconomic growth appear easily reversed, often leaving countries no better off than they were prior to the expansion.'

Based on more recent GDP data, we argue that India has entered a period of an incipientgrowth deceleration from 2011 to date. Next, we apply our framework of 'boom and bust'growth to India's growth experience, arguing that the institutional causes of India's growth inthe 1993–2002 growth episode were different from those observed for the 2002–2010
growth episode . Using our framework, we also provide an argument for why India'seconomic growth slowed down in the post-2011 period. Finally, we highlight someimplications that emerge from our research.
As the recent empirical literature on economic growth shows, economic growth in manydeveloping countries involves discrete and quantitatively massive transitions betweenperiods of high growth, periods of negative growth, and periods of stagnation (Kar et al.2013a). To fix our ideas on transition paths around growth regimes, we provide a simplesketch of these transition paths in Figure 1 below. Using a rough-and-ready way to demarcategrowth regimes, we classify growth regimes into four categories:
1. a growth regime which we call 'miracle growth' where the average increase in per capitaincome is 5 per cent per annum or more;
2. a growth regime which we call 'stable growth', where the average increase in per capitaincome is between 0 and 5 per cent per annum;
3. a growth regime which we call 'stagnant growth, where the average increase in percapita income is around 0 per cent per annum; and
4. agrowthregimewecall'growthcrisis'wheretheaveragechangeinpercapitaincomeisnegative.
Transition paths between growth phases
3
2 AFRAMEWORK FOR UNDERSTANDING 'BOOM AND BUST' GROWTH
Figure 1
Source: Authors' illustration
4
Miracle Growth
Stable Growth
Stagnation
Crisis
Miracle Growth
Stable Growth
Stagnation
Crisis
Miracle Growth
Stable Growth
Stagnation
Crisis
TIME t-1 t t+1
GrowthAcceleration
GrowthCollapse
3 We base our reading of India's growth experience on key informant interviews we conducted with representativesof the business sector and the media as well as on document analysis.
Growth acceleration is the transition from stagnation or crisis to stable growth or miraclegrowth. The ability of a country to sustain stable growth or miracle growth in period t+1 if ithas experienced the same in period t determines its ability to avoid growth collapses and canbe defined as growth maintenance. If a country does not transition from growth accelerationto maintenance, it faces a growth collapse. It is necessary to understand the factors underlyingthese dynamics to characterise a country's growth dynamics. Figure 1 makes this clear.
It is not obvious that the factors that lead to growth acceleration will lead to growthmaintenance as well, as Rodrik (2005: 3) argues: 'Igniting economic growth and sustaining itare somewhat different enterprises. The former generally requires a limited range of (oftenunconventional) reforms that need not overly tax the institutional capacity of the economy.The latter challenge is in many ways harder, as it requires constructing a sound institutionalunderpinning to maintain productive dynamism and endow the economy with resilience toshocks over the longer term.'
Once we view economic growth as transitions between the above growth phases, and inparticular, the transitions from crisis/stagnant growth to stable/miracle growth, the keyquestions that need to be addressed are:
(1) what are the institutional determinants of growth acceleration? and
(2) how are they different from the institutional determinants of growth maintenance?
We turn to these two questions next.
What explains the move of the economy from regimes of stagnation or crisis to regimes ofstable or miracle growth? Following the work of Acemoglu and Robinson (2008) and othernew institutional economists, the conventional economic explanation for economic growthto occur is that formal institutions—such as written contracts, laws that protect privateproperty, and properly functioning courts—need to emerge. However, institutions in mostdeveloping countries are weak, and even if formal institutions exist, they are unlikely to beenforced properly. More important in the explanation of growth acceleration is the existenceof informal institutions in the form of personalised relationships between political andeconomic elites, which we call the 'deals' space. A deal is defined as 'a specific actionbetween two (or more) entities in which actions are not the result of the impersonalapplication of a rule but rather of characteristics or sanctions of specific individuals which donot spillover with any precedential value to any other future transaction between otherindividuals' (Pritchett and Werker 2013: 45). An 'ordered deal' is a deal that is honoured,once negotiated between investors and state officials. A 'disordered deal' between investorsand the political elite is where there is no certainty that the deal will be delivered. Economicgrowth is likely to accelerate when there is a movement in the deals space from disordereddeals to ordered deals.Through 'ordered deals', the state can ensure that investors commit to
2.1 The Institutional Determinants of 'Boom and Bust' Growth
5

the investment decision and engage in production, so that rents can be generated through theproduction process. Investors need to consider this commitment to 'ordered deals' credible.In other words, investors must believe that the state or its agents will deliver on its implicit orexplicit promise not to expropriate all or most of the rents accruing from the productionprocess in the future, especially after investors have made investment decisions involvingsunk costs in fixed capital. Investors also need to commit to share a part of their rents to thestate (or its constituents, such as politicians) and to pay the state the necessary taxes when itraises revenue (Sen 2013).
What now explains the ability of the economy to stay in a positive growth process andfor growth not to slow down or collapse? To understand this, we define 'open deals' as dealsthat are widely available to all investors, large or small, and not confined to an elite or a smallgroup of favoured investors (Pritchett and Werker 2013). On the other hand, 'closed deals' areoffered by the political elite only to a small group of investors. The move from growthacceleration to growth maintenance would depend on the movement in the deals space fromclosed ordered deals to open ordered deals, or from disordered deals to open ordered deals.An ordered deals environment, even if closed, may be able to sustain growth for aconsiderable period. But for growth to be sustained over the long run, the deals spacemust—while maintaining order—also become more open. This is because openness in thedeals space drives economic competition and facilitates the entry of , which leadsto structural transformation as countries produce more complex products and as resourcesshift from low productivity sectors to high productivity sectors and firms. We set out the dealsspace in a 2X2 matrix, as in Figure 2 below, and how it relates to different phases of growth. Ashift from disordered deals to ordered deals is associated with growth acceleration, and a shiftfrom closed ordered to open ordered deals is associated with growth maintenance.
The deals space
new firms
Figure 2
Maintaining Growth
Closed Deals Open Deals
DisorderedDeals political connections make a deal, but no
get to make deals, one is certain thatand even they officials will deliverbe certainwill deliver
Ordered Only those with Anyone can makeDeals political connections a deal, and they and
get to make deals, they can be certainbut they can be that officials willconfident that deliverofficials will deliver
Kickstarting Growth Only those with Any can
cannotthat officials
Source: Authors' illustration, based on Pritchett and Werker (2013)
6

However, there is nothing pre-ordained in the evolution of institutions that suggest that amove from a closed ordered deals environment or a disordered deals environment to an openordered deals environment is linear. As economic growth originates in a country, twofeedback loops occur from the growth process to the deals space. These feedback loops canbe either positive or negative; in other words, whether with further economic growth, thedeals space may turn from being open ordered to being closed ordered or being disordered.The first of these feedback loops is economic in nature, and would depend on the 'rentsspace', or the structure of economic opportunities in the economy. We characterise the rentsspace in Figure 3, categorising the economic structure of the economy in a 2X2 matrix, in twodimensions—whether the sectors in the economy are in exporting and/or import-competingsectors or not affected by international trade and whether the sectors are characterised byhigh rents (that is, excess profits) or are competitive.
The rents space
High rent Competitive
Export-orientedor Import-competing
exporters
Domestic market POWER BROKERSLegislative monopolies oroligopolies, naturalmonopolies or oligopolies,mostly in non-tradablesectors
We call the export-oriented high rent sectors 'rentiers' (the upper left cell of the 2X2matrix), and the competitive tradable sectors 'magicians' (the upper right cell of the 2X2matrix). We call the monopolistic or oligopolistic domestically oriented or non-tradablesectors 'powerbrokers' (the lower left cell of the 2X2 matrix), and the competitivedomestically oriented sectors as 'workhorses' (the upper right cell of the 2X2 matrix). Rentiersare more likely to be natural resource-exporting sectors and magicians are likely to bemanufacturing sectors such as apparel and electronics as well as tradable service sectors suchas information technology (IT). Power brokers are likely to be real estate, construction,infrastructure, utilities and telecommunications, while workhorses are likely to besmallholder agriculturists and the informal manufacturing and services sectors.
We would expect firms in the 'rentier' and 'power broker' sectors to be the types ofprivate sector actors more likely to push for closed deals than open deals, as these firms wouldlose out in an open deals environment, in which rents in these sectors dissipate with
Figure 3
RENTIERS MAGICIANSNatural resource exporters Manufacturing and service
exporters, other agricultural
WORKHORSESTraders, retailers, subsistencefarmers, the informal sector
the entry
Source: Pritchett and Werker (2013)
7

of new firms or from more open and transparent regulatory institutions. Since the state plays alarge role in allocating licences and controlling the entry of new firms in these sectors, firms inthese sectors are likely to strike close personalised relationships with the political elite, tocapture the process of licence allocation or to create artificial barriers to entry.
On the other hand, firms in the 'magician' and 'workhorse' sectors are more likely topush for open deals than closed deals, for three reasons. First, these sectors are the mostdynamic and 'creative destruction' is most likely to occur here, and firms in these sectorswould benefit the most from an open deals environment. Secondly, given the inherentcontestability of these sectors and the presence of a large number of economic actors, aclosed deals space that excludes many of these actors is not likely to find political traction.Finally, these two sectors depend on an efficient power broker sector for cheap and highquality inputs to their production process, such as well functioning roads and reliableelectricity provision, and would benefit from the competitive pressures that an open dealsenvironment would bring to power broker firms.
Therefore, if the growth acceleration episode is biased towards the rentier and powerbroker sectors (say, due to a commodity price boom or due to the high growth of non-tradablesectors such as infrastructure and real estate), the economic feedback loop through the rentsspace could have a negative effect on the deals environment, making it more closed. On theother hand, a growth acceleration episode biased towards the magician and workhorsesectors is more likely to lead to further opening of the deals space.
The second of the feedback loops would be mostly political in nature, and woulddepend on how influential groups such as civil society, judiciary, the middle class, and themedia view the growth process, as well as how non-elites mobilise themselves againstelements of the growth process that they see as politically illegitimate. Particularly incountries with strong civil society presence and electoral politics, the political feedback loopcan be negative if the deals environment underpinning the growth episode is seen asexclusionary or if the nature of economic growth is highly predatory. The political feedbackloop can lead to changes in the distribution of power, as groups such as civil society, themiddle class, and those excluded from the growth process begin to gain de facto politicalpower, with greater political mobilisation and pushback from accountability institutions suchas the judiciary and the media. Therefore, while a shift from a disordered deals environmentto a closed ordered deals environment is often necessary for growth to accelerate, thepolitical feedback effect may turn negative if the deals space remains closed for too long,especially in democracies.
If the positive growth episode is underpinned by closed ordered deals that do not
become open over time, both economic and political feedback loops will likely turn negative
and the closed ordered deals environment may become increasingly disordered, ending the
positive growth episode. On the other hand, economic and political feedback loops can be
8

positive if the deals space becomes increasingly open, and the magician and workhorse
sectors become increasingly important in the growth process, leading to structural
transformation, as new firms, products, and industries emerge in the growth process. In this
case, the positive growth episode will carry on, and sustained economic growth will result.
We depict the different possibilities in Figure 4, which sets out visually our framework for
understanding 'boom' and 'bust' growth.
A framework for understanding 'boom' and 'bust' growthFigure 4
Source: Authors' illustration3.
9
1. DISTRIBUTION OFPOWER
2. RENT-SPACE
DISORDERED TOCLOSED ORDERED
DISORDEREDTO OPENORDERED
GROWTHACCELARATION
ORDERED TODISORDERED
CLOSE ORDEREDPERSIST
OPEN TO CLOSEORDERED
CLOSE TO OPENORDERED
GROWTHCOLLAPSE
GROWTHSTAGNATION
GROWTHPERSISTENCE
PH
ASE
ON
EPH
ASE
TW
O
DEALS SPACE GROWTH OUTCOME
FEEDBACKLOOPS

3 IDENTIFYING INDIA'S GROWTH EPISODES
4 UNDERSTANDING THE 1993–2002 GROWTH EPISODE
Before we examine the causes of boom and bust growth in India, we first need to periodiseIndia's growth and, in particular, establish when their growth accelerations and decelerationsoccurred. We follow our own procedure, set out in Kar et al. (2013). This procedure differsfrom previous approaches that have attempted to identify the timing of India's growthacceleration, which have been ad hoc, in that they have simply eyeballed the data toestablish the timing of the break (such as Sen 2007), or used a statistical method (Bai-Perron1998) mechanistically (such as Balakrishnan and Parameswaran 2007). Our approachcombines the statistical approach with an economic filter to provide a more unified way of
establishing breaks in GDP per capita data (see the appendix for details).
Our procedure identifies 1993 as the beginning of the first growth acceleration episode,and 2002 as the beginning of the second growth acceleration episode. In India, GDP percapita growth accelerated in 1993 to 4.23 per cent per annum (ppa) versus a predicted rate of2.34 ppa and then accelerated again in 2002 to 6.29 ppa versus a predicted rate of 2.91ppa.The net present value (NPV) (at a 5 percent discount rate) of the additional output from the2002 growth acceleration was USD 2.65 trillion (PPP).The NPV of output gained from the1993 acceleration was USD 1.05 trillion. Therefore, the total NPV gained from growthaccelerations since 1993 was USD 3.7 trillion. Taken together, India's two growthaccelerations added about USD 4000 in PPP terms to the average Indian's income ascompared to the counter-factual of what the income would have been without the twogrowth accelerations.
We plot India's real GDP per capita growth in Figure 5 (five-year moving average to smoothenout spikes in growth rates). As is clear from the figure, economic growth starts increasingsteadily since the 1990s to 2010. However, economic growth declines sharply in the period2011-2013 (the most recent year for which we have GDP data), and the average for thesethree years is 3.35 per cent as compared to 6.33 per cent in 2002–2010. While the economicgrowth slowdown may well be a temporary one, we will argue later in the paper that thedecline in economic growth may well be medium-term and, thus, constitutes a growthdeceleration phase.
India's political economy has been supportive of pro-business and pro-growth policies sincethe 1980s (Kohli 2012; Mehta and Walton 2014). When Indira Gandhi returned to power in1980, the government's economic policy focussed on promoting economic growth. This ledto a growing alliance between the political and economic elites. As Kohli (2012: 30–31)notes: 'Just after coming to power in January 1980, … Indira Gandhi let it be known that
either
4
10
4 Most previous studies on structural breaks in growth rates in India find evidence of breaks in the late 1970s. Ourprocedure shows a possible growth break in 1979, but that this break is not significant enough statistically.

improving production was now her top priority. In meeting after meeting with privateindustrialists, she clarified that what the government was most interested in was production.'Therefore, beginning in the 1980s, the Indian state clearly signalled to domestic capitalists itsintention to credibly commit to an environment where private enterprise would be supportedand growth-enhancing policies followed. This was reflected in changes in economicpolicies, such as the slow but steady liberalisation of import controls, especially on capitaland intermediate goods. The shift in the relationship between political and economic elitesfrom one of mutual distrust to a more collaborative and synergistic relationship was furtheraccentuated with coming to power in 1985. Gandhi took particular interest inmodern sectors, such as IT and engineering, and tried to bring in new economic elites fromthese emerging sectors into the relationship that the political elite had with the businesssector. In addition, with the rise of non-traditional business groups in southern and westernIndia, there was a growing diversification of business ownership, leading to a broadening ofthe political connectivity of the business elite (Mehta and Walton 2014).
Therefore, by the late 1980s, the macro-level deals environment had already becomedistinctly 'ordered' and more open, with the emergence of new economic elites in bothmodern sectors and in regions outside the industrial heartlands of Gujarat and Maharashtra.
Rajiv Gandhi's
India's economic growth (annual change in per capita GDP, %, 1961–2013, five-year moving average)Figure 5
Source: World Bank, World Development Indicators 2014, for 1960-2012, and IMF's World Economic Outlook for2013, our calculations.
11
4.1 The 1993 Growth Acceleration Episode
Two further developments in the early 1990s led to a strengthening of the ordered nature ofthe deals environment, particularly at the micro level.
First, the dismantling of the industrial licensing system in 1991 removed an importantsource of 'disorder' in the deals environment at the micro level. This development ensuredthat the approval of applications that firms made for their expansion or that new firms made toenter the industrial sector during the previous licensing regime no longer depended on thewhims and fancies of individual bureaucrats in the government.
Secondly, the removal of the import licensing system in the early 1990s for most commoditiesalso meant that the highly discretionary and case-by-case nature of imports that were not on OpenGeneral Licence was done away with. As Bhagwati (1993: 50) noted: 'The industrial-cum-tradelicensing system …had degenerated into a series of arbitrary, indeed inherently arbitrary, decisions,where for instance one activity would be chosen over another simply because the administeringbureaucratsweresoempoweredandindeedobligatedtochoose.'
The growth acceleration of 1993 was in great part due to the 'ordered deals'environment that had already taken shape in the 1980s and was enhanced by the dismantlingof the industrial-cum-trade licensing system in 1991. These deals were largely open, asbarriers of entry to many industries were removed. This was reflected in the entry of new firmsin manufacturing and services, and especially in pharmaceuticals and IT (Alfaro and Chari2009). At the same time, the Indian state's collusive relationship with certain sections of thebusiness elite in the pre-reform period remained, and may have been accentuated by the riseof increasingly powerful regional business groups closely connected with regional politicalelites (Mehta and Walton 2014). Thus, during the 1990s, closed deals existed side by sidewith open deals and, consequently, many traditional industries (such as consumer durables)were still dominated by entrenched business groups that had emerged in the licence raj(Alfaro and Chari 2009).
There is evidence from detailed firm-level analysis of the 1990s of significant dynamismin the corporate sector in this period. Harrison et al. (2012) find a large allocation of marketshare from less productive firms to more productive firms in the first half of the 1990s, but notin subsequent years. Mody, Nath, and Walton (20011) find significant entry of new firms invirtually all industrial sectors in the early-to-mid 1990s, which stops in the late 1990s, with
very little entry of new firms in the 2000s. Kathuria, Raj, and Sen (2013) show that theimprovement in productivity performance in the manufacturing sector in the 1990s was notconfined to the formal sector but encompassed the informal sector as well.
5
12
5However, as Goldberg et al. (2010) show, much of the product churning in the 1990s was due to product additionsrather than product shedding. In this sense, India's experience of the 1990s with 'creative destruction' was more'creative' and less 'destruction'.

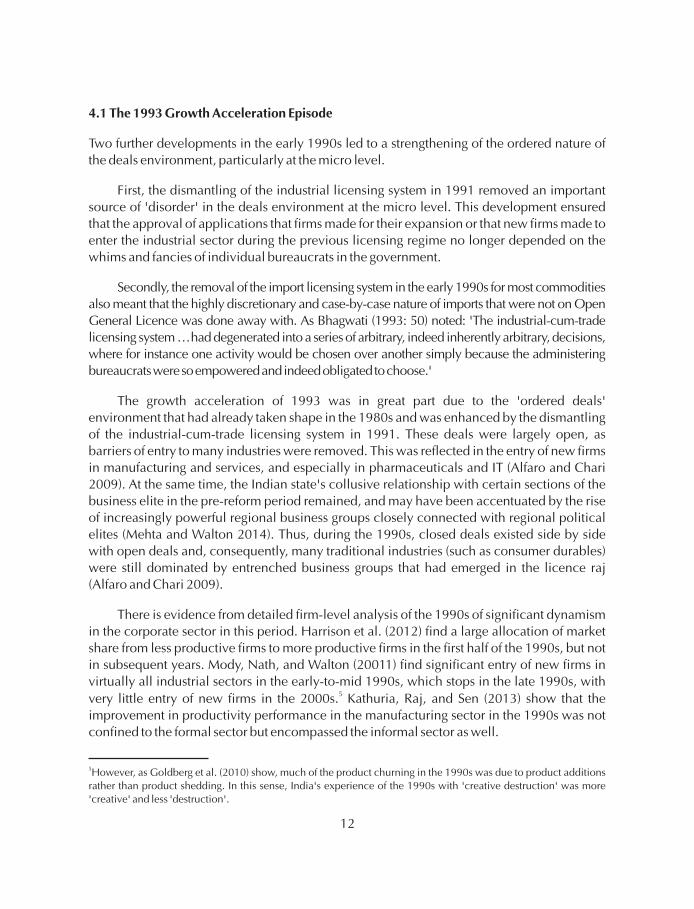
The dynamism that one observes in the private sector in the 1990s is also reflected inindicators of growth and structural transformation. Thus, in the 1993–2002 growthacceleration phase, economic growth was mostly driven by the exporting competitive sectors(such as IT and chemicals) and domestically oriented service sectors such as hotels andrestaurants (see Tables 1 and 2).
There were two distinct growth episodes in the post-2002 period; (1) a further growthacceleration episode from 2002 to 2010; and (2) an incipient growth deceleration from 2011onwards. We discuss the features of these two episodes in turn.
In the 2002–2010 episode, India's per capita economic growth (6.42 per cent per annum) wasfaster than during 1993–2002 (4.15 per cent per annum on average). However, there was a shiftin the pattern of growth towards non-tradable sectors such as construction, communications,and banking and insurance—the average growth rates of these sectors in 2002–2010 were 8.6per cent, 23.1 per cent, and 11.2 per cent respectively, as compared to 3.4 per cent, 15.7 percent, and 7.4 per cent in 1993–2002 (Table 1). Within the manufacturing sector, the importanceof the refined petroleum sector in total gross real value added also increased sharply, with itsshare increasing from 5.6 per cent in 1993–2001 to 13.0 per cent in 2002–2007 (Table 2). Therewas also a shift in India's exports towards more resource-intensive sectors, such as refinedpetroleum and minerals, with the share of natural resource intensive exports in India's totalexports increasing from 14.6 per cent in 1993–2002 to 19,5 per cent in 2002–2010 (Table 3).Thus, economic growth in the second growth episode was qualitatively different from the firstepisode, in that it relied more on rentier sectors (such as mining and petroleum refining) andother high rent power broker sectors (such as telecommunications and real estate). There was,however, strong growth in magician sectors such as IT (or business) services, which observed anincrease in average growth from 2.9 per cent during 1993–2002 to 17.4 per cent during2002–2010 (Table 1). At the same time, there was a larger increase in new firm entry during the1993–2002 episode than in the 2002–2010 episode—a 53 per cent increase in new firms in the1993-2002 episode, and 9.8 per cent decrease in new firms in the post-2002 period, as seen inTable 4 (Alfaro and Chari 2009).
In Figure 6, we plot the relative importance of the rentier, power broker, magician, andworkhorse sectors as reflected in their shares in GDP over time. We see that both the power
5 UNDERSTANDING THE POST-2002 GROWTH EPISODES
5.1 The 2002–2010 Growth Acceleration Episode
6
13
6 We use GDP factor cost at constant price to calculate the shares of the four sectors. We include only sectors wheremuch of the economic activity is produced by the private sector, as the rents space in Figure 3 does not apply to thepublic sector. In the rentier sector, we include mining and quarrying (only from 2002, as mining was under stateownership before 2002). For the power broker sector, we include utilities, construction, communications, and realestate (again, only from 2002, as these sectors were mostly under state ownership before 2002). For the magiciansector, we include registered manufacturing and business services (IT). For the workhorse sector, we includeagriculture, forestry, fishing, unregistered manufacturing, trade, hotels and restaurants, transport by other means,storage, dwellings, and other services.

broker and magician sectors have increased their importance in economic activity over time,and especially in the post-2002 period. This has been mirrored by a steady decline in theworkhorse sector until 2002, followed by a sharp drop in the share of this sector in total outputfrom 2002 onwards (the rentier sector has marginally increased its importance in the post-2002 period). The fall in the share of the workhorse sector, where most of India's poor arelocated, has negative implications for a growth strategy that favours the working poor, andsuggests that this sector had less of a role in influencing the deals environment in the post-2002 period. Since this sector has a strong interest in an open deals environment, the declinein this sector implied that one important source of pressure for open deals was graduallydiminishing over time. On the other hand, the net effect on deals with the growingimportance of the magician sector (which characteristically asks for open deals) and thepower broker sector (which characteristically asks for closed deals) was less certain.
What happened to structural transformation during this period? Hidalgo et al. (2007)view structural transformation as the upgrading of products in a country's economic structuresuch that firms in that country move over time to more complex products. Following thisview, and using data on product complexity from the Atlas of Economic Complexity, we plotthe five-year moving average of product complexity for India between 1993–94 and 2007–08in Figure 7. We find that structural transformation (as captured in increasing productcomplexity) mostly increased during the 1993–2002 growth episode but fell during the2002–2010 episode.
There was also a shift in the deals environment in this period from relatively open toclosed deals. This was most evident in the increasing level of 'crony capitalist' deals thatpolitical elites struck with economic elites in 'high rent' natural resource sectors such asbauxite, coal, iron ore, manganese ore, and natural gas, at both national and regional levels.In various ore-rich states such as Jharkhand, Karnataka, Goa and Odisha, influential,politically connected business elites systematically underpaid mining royalties to stateagencies (along with extracting iron and bauxite in excess of the amounts stipulated by theleases that the private mining firms held with the state governments). There was a successionof such scams, highlighted by the media. In 2010, the central government constituted acommission to investigate irregularities in the extraction, trade, and transportation of iron oreand manganese ore across the country. It was headed by Justice M.B. Shah of the SupremeCourt of India. The Commission found evidence of 'enormous and large scale multi-stageillegal mining of iron ore and manganese ore running into thousands of crores of rupees everyyear' (Shah Commission 2012: 1). The Shah Commission also found clear evidence ofcollusion between ruling politicians at the state and national level and private mining firms,stating that 'the State has “gifted” property of thousands of crores in the hands of privatecompanies/firms/individuals' (Shah Commission 2012: 604). There were similar concerns inthe allocation of licences for coal deposit blocks to private firms by the Central Governmentin the 2004–2011 period, which were done preferentially at lower-than-market rates, insteadof a competitive bidding process, according to investigations on the nature of the allocationprocess by the Comptroller and Auditor General (CAG).
14
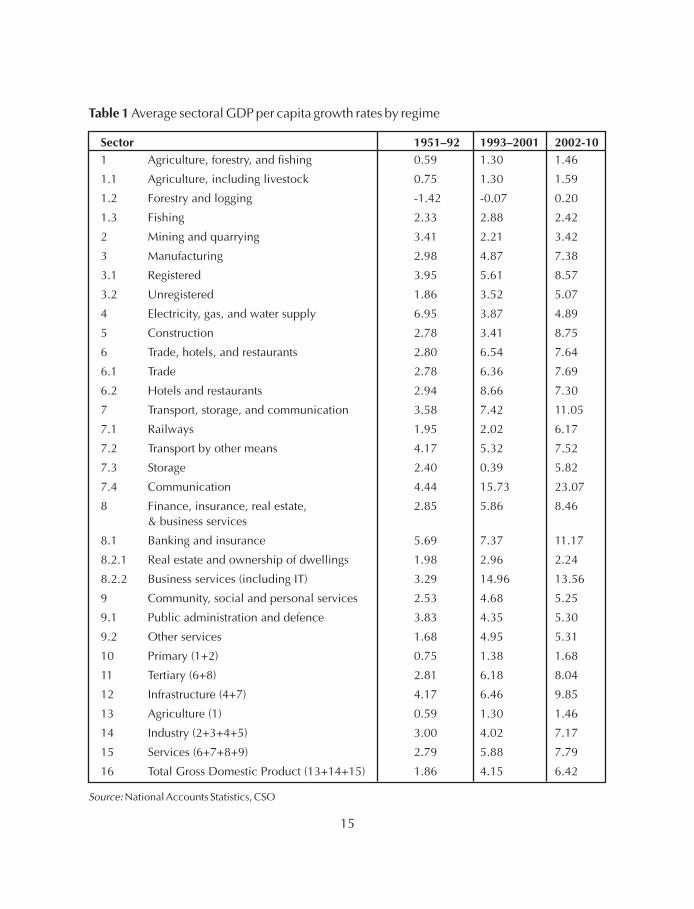
Table 1 Average sectoral GDP per capita growth rates by regime
Sector 1951–92 1993–2001 2002-10
1 Agriculture, forestry, and fishing 0.59 1.30 1.46
1.1 Agriculture, including livestock 0.75 1.30 1.59
1.2 Forestry and logging -1.42 -0.07 0.20
1.3 Fishing 2.33 2.88 2.42
2 Mining and quarrying 3.41 2.21 3.42
3 Manufacturing 2.98 4.87 7.38
3.1 Registered 3.95 5.61 8.57
3.2 Unregistered 1.86 3.52 5.07
4 Electricity, gas, and water supply 6.95 3.87 4.89
5 Construction 2.78 3.41 8.75
6 Trade, hotels, and restaurants 2.80 6.54 7.64
6.1 Trade 2.78 6.36 7.69
6.2 Hotels and restaurants 2.94 8.66 7.30
7 Transport, storage, and communication 3.58 7.42 11.05
7.1 Railways 1.95 2.02 6.17
7.2 Transport by other means 4.17 5.32 7.52
7.3 Storage 2.40 0.39 5.82
7.4 Communication 4.44 15.73 23.07
8 Finance, insurance, real estate, 2.85 5.86 8.46& business services
8.1 Banking and insurance 5.69 7.37 11.17
8.2.1 Real estate and ownership of dwellings 1.98 2.96 2.24
8.2.2 Business services (including IT) 3.29 14.96 13.56
9 Community, social and personal services 2.53 4.68 5.25
9.1 Public administration and defence 3.83 4.35 5.30
9.2 Other services 1.68 4.95 5.31
10 Primary (1+2) 0.75 1.38 1.68
11 Tertiary (6+8) 2.81 6.18 8.04
12 Infrastructure (4+7) 4.17 6.46 9.85
13 Agriculture (1) 0.59 1.30 1.46
14 Industry (2+3+4+5) 3.00 4.02 7.17
15 Services (6+7+8+9) 2.79 5.88 7.79
16 Total Gross Domestic Product (13+14+15) 1.86 4.15 6.42
Source: National Accounts Statistics, CSO
15
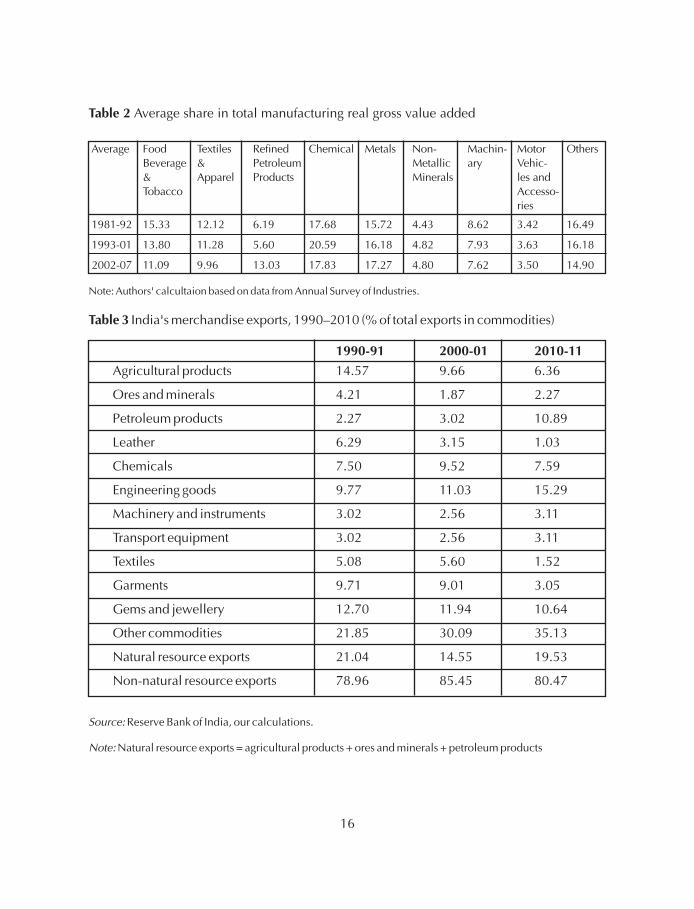
Table 2
Table 3
1990-91 2000-01 2010-11
Average share in total manufacturing real gross value added
India's merchandise exports, 1990–2010 (% of total exports in commodities)
Agricultural products 14.57 9.66 6.36
Ores and minerals 4.21 1.87 2.27
Petroleum products 2.27 3.02 10.89
Leather 6.29 3.15 1.03
Chemicals 7.50 9.52 7.59
Engineering goods 9.77 11.03 15.29
Machinery and instruments 3.02 2.56 3.11
Transport equipment 3.02 2.56 3.11
Textiles 5.08 5.60 1.52
Garments 9.71 9.01 3.05
Gems and jewellery 12.70 11.94 10.64
Other commodities 21.85 30.09 35.13
Natural resource exports 21.04 14.55 19.53
Non-natural resource exports 78.96 85.45 80.47
Average Food Textiles Refined Chemical Metals Non- Machin- Motor OthersBeverage & Petroleum Metallic ary Vehic-& Apparel Products Minerals les andTobacco Accesso-
ries
1981-92 15.33 12.12 6.19 17.68 15.72 4.43 8.62 3.42 16.49
1993-01 13.80 11.28 5.60 20.59 16.18 4.82 7.93 3.63 16.18
2002-07 11.09 9.96 13.03 17.83 17.27 4.80 7.62 3.50 14.90
Reserve Bank of India, our calculations.
Natural resource exports = agricultural products + ores and minerals + petroleum products
Note: Authors' calcultaion based on data from Annual Survey of Industries.
Source:
Note:
16

Figure 6
Figure 7
The relative importance of the rentier, power broker, magician and workhorsesectors
India's product complexity in exports, five-year moving average
Source:
Source:
Authors' calculations, from National Accounts Statistics, CSO
Authors' calculations, from Atlas of Economic Complexity, http://atlas.cid.harvard.edu
17
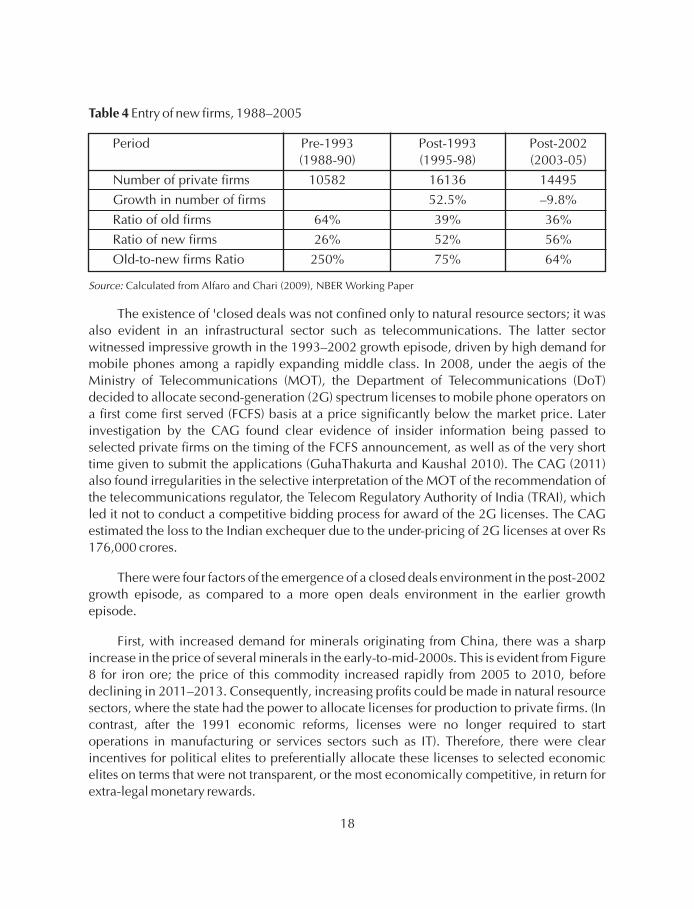
Table 4 Entry of new firms, 1988–2005
Period Pre-1993 Post-1993 Post-2002(1988-90) (1995-98) (2003-05)
Number of private firms 10582 16136 14495
Growth in number of firms 52.5% –9.8%
Ratio of old firms 64% 39% 36%
Ratio of new firms 26% 52% 56%
Old-to-new firms Ratio 250% 75% 64%
The existence of 'closed deals was not confined only to natural resource sectors; it wasalso evident in an infrastructural sector such as telecommunications. The latter sectorwitnessed impressive growth in the 1993–2002 growth episode, driven by high demand formobile phones among a rapidly expanding middle class. In 2008, under the aegis of theMinistry of Telecommunications (MOT), the Department of Telecommunications (DoT)decided to allocate second-generation (2G) spectrum licenses to mobile phone operators ona first come first served (FCFS) basis at a price significantly below the market price. Laterinvestigation by the CAG found clear evidence of insider information being passed toselected private firms on the timing of the FCFS announcement, as well as of the very shorttime given to submit the applications (GuhaThakurta and Kaushal 2010). The CAG (2011)also found irregularities in the selective interpretation of the MOT of the recommendation ofthe telecommunications regulator, the Telecom Regulatory Authority of India (TRAI), whichled it not to conduct a competitive bidding process for award of the 2G licenses. The CAGestimated the loss to the Indian exchequer due to the under-pricing of 2G licenses at over Rs176,000 crores.
There were four factors of the emergence of a closed deals environment in the post-2002growth episode, as compared to a more open deals environment in the earlier growthepisode.
First, with increased demand for minerals originating from China, there was a sharpincrease in the price of several minerals in the early-to-mid-2000s. This is evident from Figure8 for iron ore; the price of this commodity increased rapidly from 2005 to 2010, beforedeclining in 2011–2013. Consequently, increasing profits could be made in natural resourcesectors, where the state had the power to allocate licenses for production to private firms. (Incontrast, after the 1991 economic reforms, licenses were no longer required to startoperations in manufacturing or services sectors such as IT). Therefore, there were clearincentives for political elites to preferentially allocate these licenses to selected economicelites on terms that were not transparent, or the most economically competitive, in return forextra-legal monetary rewards.
Source: Calculated from Alfaro and Chari (2009), NBER Working Paper
18
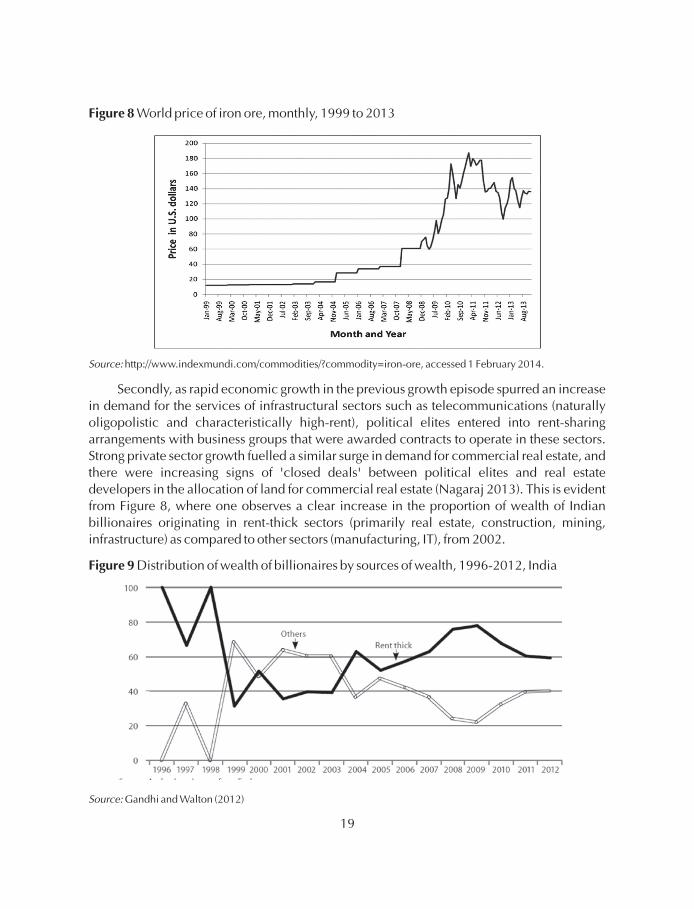
Figure 8
Figure 9
World price of iron ore, monthly, 1999 to 2013
Secondly, as rapid economic growth in the previous growth episode spurred an increasein demand for the services of infrastructural sectors such as telecommunications (naturallyoligopolistic and characteristically high-rent), political elites entered into rent-sharingarrangements with business groups that were awarded contracts to operate in these sectors.Strong private sector growth fuelled a similar surge in demand for commercial real estate, andthere were increasing signs of 'closed deals' between political elites and real estatedevelopers in the allocation of land for commercial real estate (Nagaraj 2013). This is evidentfrom Figure 8, where one observes a clear increase in the proportion of wealth of Indianbillionaires originating in rent-thick sectors (primarily real estate, construction, mining,infrastructure) as compared to other sectors (manufacturing, IT), from 2002.
Distribution of wealth of billionaires by sources of wealth, 1996-2012, India
Source:
Source:
http://www.indexmundi.com/commodities/?commodity=iron-ore, accessed 1 February 2014.
Gandhi and Walton (2012)
19

Thirdly, with the increased fractionalisation of the political system at the national level(see Figure 10), and the growing importance of regional political elites in the coalitiongovernments of the 2000s, 'closed deals' between these elites and powerful economicinterests both at the national and at the regional levels become more prevalent in the post-2002 period. This was accentuated by the rapid turnover of governments and closelycontested elections, both at the national and regional levels, which led to a shortening of thetime horizon of political elites, who were more interested in finding ways to extract rents tofinance elections that they would have to fight in the immediate future.
Measures of total fractionalisation and proportion of seats won by the majorityparty, national elections, 1975-2009, India
Fourth, related to the previous point, election campaigns became increasingly
expensive as in the competitive Indian political system, political parties tried to outspend
each other to attract voters with various inducements. Reforms in Indian election expenditure
laws in 1975 and 2003 put the expenditures of party and supporters of individual candidates
outside the purview of the expenditure limits on these candidates and banned corporate
donations. These led to increased informal financing of election campaigns, and a greater
reliance on informal deals to finance costly election campaigns. This was also reflected in the
Figure 10
Note:
Source:
Total fractionalisation measures the probability that two randomly chosen members of the parliament belongto two different parties
Quality of Government Database, Gothenburg University. http://www.qog.pol.gu.se Accessed 1 February2014.
20

increasing participation of criminals in electoral politics, as political parties preferred
wealthy candidates who had the 'deep pockets' to finance their own campaigns. The growing
reliance of informal private funding in the absence of state funding also meant that parties and
politicians raised funds from businesses informally in return for discretionary contracts and
regulatory favours (Gowda and Sridharan 2012).
Per capita economic growth slipped to 3.4 per cent over 2011–2013, due mostly to the onset
of a disordered deals environment brought about by the negative feedback effects of the
nature of the closed ordered deals that characterised the 2002–2010 growth episode, which
was reflected in several corruption cases against the ruling elite. These cases of corruption
were mostly observed in rentier and power broker sectors, where there were high rents to be
shared between economic and political elites. As media accounts of corruption became
widespread, and there was growing popular discontent at the flagrantly excessive levels of
rents shared between political and economic elites in these deals, state legitimacy was being
gradually eroded towards the end of the 2002–2010 growth episode. There was also strong
social and political mobilisation of the masses against the attempts by the political elite in
states such as Odisha and West Bengal to obtain land through extra-legal and often coercive
means for mining or for providing land to large business groups to set up manufacturing
plants. In addition, there was strong pushback from accountability institutions; for example,
the Supreme Court of India banned iron ore exports, and the CAG investigated corruption in
the allocation of 2G and coal block licenses.
All these developments made the 'closed deals' environment unsustainable towards the
end of the first decade of the 2000s. In addition, with increasing uncertainty over the nature of
deals, and as the ruling party at the centre lacked the authority to credibly commit to new
deals in the face of both popular and legal challenges, deals became increasingly disordered
as well. This is evident from the behaviour of investor perception of the risk of investment.
After rapid improvement in the 1990s (except for a drop during 1998–2000) and during
2000–2005, investor perception of the viability of contracts started falling 2006 onwards.
This suggests that, towards the end of the 2002–2010 growth episode, investors were
increasingly concerned about the credibility of deals (Figure 11). In addition, in Figure 12, we
plot investors' perception of the viability of contracts, which captures the risk of
expropriation—a measure of institutional quality widely used in the literature (e.g. Acemoglu
et al. 2001) as well as the probability of the repudiation of contracts. We note a sharp drop in
this measure of investors' perception of institutional quality pertaining to investment from
2011 onwards.
5.2 The Post-2010 Growth Slowdown
21

Figure 11 Evolution of investors' perception of risks of investment
Note:
Source:
The variable plotted is investment profile obtained from the ICRG database, which is captures the viability ofcontracts, the restrictions on repatriation of funds, and payment delays. Higher values imply lower risk.
Authors' calculations from ICRG database.
Figure 12 Investors' perception of the viability of contracts
Source: Authors' calculations from ICRG database.
22

Thus, the post-2002 episodes were qualitatively different from the 1993–2002 episodein that the deals environment had shifted decisively from being open to closed and, as weprogressed into the 2000s, from ordered to disordered deals as well. This was also reflected inthe increasing importance of natural resource sectors in India's export basket, the importanceof sectors such as construction in India's economic growth, as well as a decline in structuraltransformation. As investor uncertainty increased, there was a fall in private corporate fixedinvestment in the second half of the 2000s (see Figure 13), and the rapid economic growth ofthe 2000s ended in 2010.
Gross fixed capital formation (GFCF), public sector (PUB), private corporate sector(PCS) and household sector (HHS), as ratios of GDP, constant price
It is premature to identify the slow growth period of 2011–2013 as the beginning of agrowth deceleration episode, as there may well be a turnaround in economic growth in thepost-2013 period. However, our discussion of the causes of 'boom and bust' growth indeveloping countries suggests that the decline in economic growth may well persist for sometime to come and is not transitory.
Sustained rapid economic growth of well over a decade is a feature that we do not observe
frequently in developing countries. India's per capita income gain over 1993–2011 is among
Figure 13
Note:
Source:
GFCF: Gross fixed capital formation; PUB: public fixed investment; PCS: private corporate sector; householdsector (HHS)
Authors' calculations based on the National Income Accounts of the Central Statistical Organisation, India.
6 IMPLICATIONS
23

the largest income gains in growth episodes witnessed in the developing world in the post-
World War II period (Pritchett et al. 2013). Yet, there are clear signs that India's growth
acceleration ended in 2010. In this paper, we examine the political and institutional causes of
India's growth acceleration and its possible end. We argue that India's post-reform growth
experience can be separated into three distinct growth episodes: the first growth episode was
from 1993 to 2002 and characterised by a set of relatively open 'ordered' deals between
political and economic elites. The second episode was from 2002 to 2010 and deals in this
period became increasingly closed, leading to pushback from accountability institutions and
the middle class. The third episode, beginning in 2011, was one of an incipient growth
deceleration, and was characterised by increasingly disordered deals. We argue that this is
the outcome of two separate phenomena:
(1) increasing political de-legitimation of the growth process that was seen as highly
predatory and corruption-intensive; and
(2) the pushback from accountability institutions in the post-2010 period, leading to greater
uncertainty in the deals environment in 2011–2014.
A clear implication of our analysis is that the fundamental cause of India's current
economic stagnation is related to the institutional environment underpinning the 2002–2010
growth episode, and that relying only on greater infrastructural spending or more economic
reforms will not suffice to revive economic growth. Our analysis suggests that the high growth
episode of the 2000s contained seeds of its own destruction, and that it was inevitable that the
growth boom of the first decade of the 2000s was bound to end. The 'policy paralysis' in the
national government that one observes in the 2011–2014 period is simply an outward
manifestation of a closed deals environment falling apart, with the increasing challenge from
the middle class and other social groups and actors and the interventions of 'rule of law'
institutions in India.
A second implication of our analysis is that it is necessary to return to the ordered open
deals environment observed in the 1990s to revive and sustain economic growth. For this to
happen, a reconfiguration is required in the settlement between political and economic elites
(who straddle both rentier/power broker and magician/workhorse sectors, such as business
groups in natural resource extraction, telecommunications, and retail trade). In this
reconfiguration, economic elites should see an interest in moving from closed to open deals,
as the rents available from the closed deals diminish over time. Simultaneously, the political
elites should be more interested to invest in the state's capacity to regulate and discipline
these economic elites and allocate licences with greater transparency. In addition, there
needs to be a more open deals environment for the few magician sectors in India (such as IT
and pharmaceuticals) to grow, and new magician sectors in export-oriented labour-intensive
manufacturing need to be created.
24

At the same time, the relationship between the political class and the private sector onthe one hand and accountability groups such as the professional middle class and civilsociety actors on the other needs to be realigned. In this realignment, there must be therecognition that 'ordered deals' between the state and the business sector are essential foreconomic growth to return as long as these deals do not lead to outright corruption or to theexploitation of socially marginalised groups such as tribal populations.
Impersonal rule-based institutions are not likely to be enforced in India for some time tocome. The re-emergence of credible and repeated personalised relationships betweeneconomic and political elites that are neither exclusionary nor politically illegitimate isessential for economic growth to revive so that the predatory growth episode of the 2000s isnot repeated. Only if all important actors—the private sector, political class, bureaucracy,media, judiciary, civil society and middle class—can recognise this reality and find a 'realisticmiddle ground' in the deals environment will economic growth return to India and besustained.
25

REFERENCES
Alfaro, L. & A. Chari (2009) India Transformed? Insights from the Firm Level 1988-2005.NBER Working Papers 15448, National Bureau of Economic Research, Inc.
Acemoglu, Daron, Simon Johnson, and James Robinson (2001) 'The Colonial Origins ofComparative Development', , Vol. 91 pp. 1369-1401
Acemoglu, Daron and James Robinson (2008), 'The Role of Institutions in Growth andDevelopment', Working Paper No. 10, Commission for Growth and Development,Washington D.C.
Anand, R. and V. Tulin (2014), 'Disentangling India's growth slowdown', IMF Working Paper,www.imf.org.
Bai, Jushan and Pierre Perron (1998), 'Estimating and Testing Linear Models with MultipleStructural Change', , Vol. 66, pp. 47-78.
Balakrishnan, P. and M. Parameswaran (2007), 'Understanding Economic Growth in India: APrerequisite', , July 14, pp. 2915-2921.
Bhagwati, J. (1993), India in Transition, Oxford: Oxford University Press.
Comptroller and Auditor General (CAG, 2011), Report No. -19 of 2010-11 for the periodended March 2010 Performance Audit of Issue of Licences and Allocation of 2GSpectrum by the Department of Telecommunications ( Ministry of Communications andInformation Technology), available at: http://www.saiindia.gov.in/english/index.html
Gandhi, Aditi, and Michael Walton (2012), 'Where do India's Billionaires Get Their Wealth?'Vol - XLVII No. 40, October 06, 2012, pp. 1-15.
Goldberg, P., A. Khandelwal, N. Pavnik, and P. Topalova (2010) Multi-Product and ProductTurnover in the Developing World: Evidence from India.
92(4), pp. 1042-1049.
Gowda, R. and E. Sridharan (2012), 'Reforming India's Party Financing and ElectionExpenditure Laws', Vol. 11, No. 2., pp. 226-240.
GuhaThakurta, P. and A. Kaushal (2010), 'Underbelly of the Great Indian TelecomRevolution', December 4, Vol., No. XLV. No. 49, pp.49-55.
Harrison, A., L.A. Martin and S. Nataraj (2012), 'Learning versus Stealing: How Important AreMarket-Share Reallocations to India's Productivity Growth',
pp. 2012-228.
American Economic Review
Econometrica
Economic and Political Weekly
Review of Economics andStatistics,
Election Law Journal,
Economic and Political Weekly,
World Bank EconomicReview,
Economic and Political Weekly,
26
Hidalgo, C., L. Klinger, A-L.Barabasi and R. Hausmann (2007), 'The Product SpaceConditions the Development of Nations', Vol. 307, pp. 482-487.
International Monetary Fund (IMF, 2014), India: Article IV Consultation, available atwww.imf.org.
Jones, Ben and Ben Olken (2008), 'The Anatomy of Start-Stop Growth',Vol. 90, No. 3, pp. 582-587.
Kar, Sabyasachi, Lant Pritchett, Selim Raihan and Kunal Sen (2013a), The Dynamics ofEconomic Growth: A Visual Handbook of Growth Rates, Regimes, Transitions andVolatility, Effective States and Inclusive Development (ESID) Research Centre:University of Manchester, available at: http://www.effective-states.org/.
Kar, Sabyasachi, Lant Pritchett, Selim Raihan and Kunal Sen (2013b) 'Looking for a Break:Identifying Transitions in Growth Regimes', 2013, Vol. 38,pp. 151-166.
Kathuria, V. Raj, R.S.N. and K. Sen (2010), Organised versus Unorganised ManufacturingPerformance Growth in the Post-Reform Period', Vol.X:V. No. 24, pp. 55-64.
Kohli, Atul (2012), Poverty amid Plenty in the New India, Cambridge: Cambridge UniversityPress.
Mehta, PratapBhanu and Michael Walton (2014), 'India's Political Settlement andDevelopment Path', Effective States and Inclusive Development working paper,forthcoming, www.effective-states.org.
Mody, Asoka, Anisha Nath and Michael Walton (2011), Sources of Corporate Profits in India:Business Dynamism or Advantages of Entrenchment?, in S. Bery, B. Bosworth and A.Panagariya (eds.), India Policy Forum 2010-2011, Washington D.C.: BrookingsInstitute.
Nagaraj, R. (2013), 'India's Dream Run, 2003-2008: Understanding the Boom and itsAftermath', Vol - XLVIII No. 20, May 18, 2013, pp. 10-18.
Pritchett, Lant (2000), 'Understanding Patterns of Economic Growth: Searching for Hillsamong Plateaus, Mountains and Plains', Vol. 14, No. 2,pp. 221-250.
Pritchett, Lant and Eric Werker (2013), 'Developing the guts of GUT (Grand Unified Theory):Elite Commitment and Inclusive Growth', ESID Working Paper No. 16/12,www.effective-states.org.
Science,
Review of Economicsand Statistics,
Journal of Macroeconomics,
Economic and Political Weekly,
Economic and Political Weekly,
World Bank Economic Review,
27

Pritchett, Lant, Kunal Sen, Sabyasachi Kar and Selim Raihan (2014), 'Trillions Gained andLost: Estimating the Magnitude of Growth Episodes', ESID Working Paper No. 26/12,www.effective-states.org.
Rodrik, D. (2005), 'Growth Strategies', in P. Aghion and S. Durlauf (eds.),Amsterdam: Elsevier.
Shah Commission (2012), Final Report on Illegal Mining in the State of Goa, Government ofIndia.
Sen, Kunal (2007) Why Did the Elephant Start to Trot? India's Growth Acceleration Re-Examined, 43, pp. 37-49.
Sen, Kunal. (2009), 'What a Long, Strange Trip It's Been: Reflections on the Causes of India'sGrowth Miracle', 2009, Vol. 17, No. 4, pp. 363-377.
Sen, Kunal (2013), 'The Political Dynamics of Economic Growth', Vol.47, pp. 71–86.
Tokuoka, K. (2012), 'Does the Business Environment Affect Corporate Investment in India?,IMF Working Paper No 12/70, www.imf.org.
Handbook ofEconomic Growth,
Economic and Political Weekly,
Contemporary South Asia,
World Development,
28
APPENDIX
IDENTIFYING BREAKS IN ECONOMIC GROWTH
To identify episodes of growth accelerations in India, we use a procedure for identifyingstructural breaks in economic growth that uses the Bai-Perron (BP, 1998) procedure ofmaximizing the F-statistic to identify candidate years for structural breaks in growth withthresholds on the magnitude of the shift to determine which are actual breaks. This procedureinvolves the best fit of the BP method to the data in the first stage, and the application of a filterto the breaks identified in the first stage in the second stage. Our procedure avoids theweakness of the pure statistical approach to identifying breaks, that is, the BP methodology,which has low statistical power, leading to rejection of structural breaks even when they are'true' breaks. Combining the BP test with a filter-based approach (where the filter is obtainedfrom economic priors) provides an unified approach to identifying growth episodes (see Karet al 2013 for an explanation of why the unified approach avoids the pitfalls of pure statisticaland filter-based approaches). The magnitude filter was that the absolute value of the changein the growth rate after a BP potential break had to be (a) 2 percentage points if it was the firstbreak, (b) 3 percentage points if the potential break was of the opposite sign of the previousbreak (an acceleration that followed a deceleration had to have accelerated growth by morethan 3 ppa to qualify as a break), and (c) 1 percentage point if the BP potential break was of thesame sign as the previous break, so if BP identified an acceleration that directly followed anacceleration (or deceleration that followed a previous deceleration) the magnitude had to belarger than 1 ppa to qualify as a break. To estimate potential breaks, we assumed that a'growth regime' lasts a minimum of eight years (as in Berg et al (2012)). The use of shorterperiods (e.g. 3 or 5 years) risk conflation with 'business cycle fluctuations' or truly 'short run'shocks (e.g. droughts). Longer periods (e.g. 10 or 12 years) reduce the number of potentialbreaks.
29

RECENT WORKING PAPERS
Title Name of Author(s) Paper No.
Nira Ramachandran E/330/2013Are Women’s Issues Synonymous withGender in India? Looking AcrossGeographic Space
Bimal Kishore Sahoo E/331/2013Total Factor Productivity of theSoftware Industry in India
Sabyasachi KarLant PritchettSelim RaihanKunal Sen
E/332/2013Looking for a Break: Identifyingtransitions in growth regimes
E/333/2013Determinants of India's ServicesExports
Pradeep AgrawalSeema Sangita
E/334/2013India and Central Asia: Trade Routesand Trade Potential
Bishwanath GoldarBasanta K PradhanAkhilesh K Sharma
E/335/2014Elasticity of Substitution betweenCapital and Labour in Major Sectorsof the Indian Economy
E/336/2014Changing Livelihoods in Delhi'sPeriphery, circa 1930–2012
Devesh Vijay
E/337/2014Socioeconomic BackwardnessIncreases Vulnerability to ClimateChange: Evidence from Uttar Pradesh
Amarnath Tripathi
Heat Waves Decrease Labour Supply:
Evidence on low-income urban
workers in weather-exposed occupations
E/339/2014
E/340/2014
E/338/2014Saudamini Das
Pravakar SahooRanjan Kumar DashPrabhu Prasad Mishra
The Reserve Bank of India's Reaction
to Exchange Rate Variation: A time-
varying parametric approach
A Vadivel
M Ramachandran
Thiagu Ranganathan
Sarthak Gaurav
Ashish Singh
Demand for Price Insurance among
Farmers in India: A Choice
Experiment-based Approach
Michael LevienSocial Capital as Obstacle to
Development: Brokering Land,
Norms, and Trust in Rural India
E/341/2014

lR;eso ijeks /eZ%
Institute of Economic Growth
University Enclave, University of Delhi
Delhi 110007, India
Tel: 27667101/288/424; Fax : 27667410
Website : www.iegindia.org