book sample - training the street
TRANSCRIPT

1
© 1999-2010 Training The Street, Inc.All rights reserved.
Training The Street, Inc. (“TTS”) owns all rights, including copyright, in this publication. This publication may not be reproduced or redistributed, in whole or in part, in any format or by any means without TTS’s prior written consent. No TTS seminar, workshop, or other instructional activity may be recorded or transmitted in any format or by any means without TTS’s prior written consent.
Preparing Financial Professionals for Successwww.trainingthestreet.com

TRA
ININ
G T
HE
STR
EET
Table of Contents
1. BeFore We Get Started… ..........................................................................................................................7 1.1 Who Is This Course For? ............................................................................................................................8 1.2 How Is This Course Organized? ............................................................................................................... 9 1.3 Optimizing the Way You Use This Course .............................................................................................. 9 1.4 What Exactly is a Financial Model? ....................................................................................................... 10 Core skills you will need: Accounting .................................................................................................... 11 Core skills you will need: Corporate finance and financial statement analysis ................................. 11 What are you trying to do? End goal of a model. ................................................................................. 12
2. FoundationS oF Financial ModelinG ............................................................................................... 15 2.1 Setting Up a Model ................................................................................................................................. 15 Good versus bad models ........................................................................................................................ 15 Vertical versus horizontal models .......................................................................................................... 16 Cell comments ......................................................................................................................................... 18 2.2 Working with Assumptions .................................................................................................................... 19 Assumptions as drivers .......................................................................................................................... 19 Entering exact figures ............................................................................................................................. 21 Never input the same number twice ..................................................................................................... 21 Breaking out inputs ................................................................................................................................. 22 Using a consistent color scheme ........................................................................................................... 23 Using consistent number formats ......................................................................................................... 24 2.3 Writing Basic Formulas........................................................................................................................... 25 Historical ratios ........................................................................................................................................ 25 Growth rates ..................................................................................................................................... 25 Margins ............................................................................................................................................. 25 Using other kinds of ratios .............................................................................................................. 26 Forecasting methods ............................................................................................................................... 27 Growth rates .................................................................................................................................... 27

4
Margins .............................................................................................................................................. 27 Dollar amounts ................................................................................................................................. 27 2.4 Safety Checks .......................................................................................................................................... 28 Stress testing ..................................................................................................................................... 28 Auditing tools .................................................................................................................................... 28
3. Get SMart .................................................................................................................................................... 31 3.1 Top-down Analysis: Know Your Target Company’s Industry ............................................................... 31 3.2 Know Your Company ............................................................................................................................... 33 Navigating the 10-K .................................................................................................................................. 33 The 10-K Sherpa Guide: What’s where ........................................................................................... 34 The three biggies .............................................................................................................................. 34 Beyond the 10-K ....................................................................................................................................... 36 3.3 Choosing Assumptions ........................................................................................................................... 37
4. let’S Start ModelinG ............................................................................................................................... 39 4.1 The Core Statements ............................................................................................................................... 44 4.2 Working Capital Schedule ....................................................................................................................... 56 4.3 Depreciation Schedule ............................................................................................................................. 78 4.4 Amortization Schedule ............................................................................................................................ 82 4.5 Other Long-Term Items Schedule ........................................................................................................... 92 4.6 Completing the Income Statement Logic .............................................................................................. 99 4.7 Shareholders’ Equity Schedule ............................................................................................................. 106 4.8 Shares Outstanding Schedule .............................................................................................................. 120 4.9 Preparing for Debt and Interest ........................................................................................................... 127 4.10 Debt and Interest Schedule ................................................................................................................. 138
5. FiniShinG toucheS ................................................................................................................................... 161 5.1 Troubleshooting Your Model................................................................................................................. 161 5.2 The Finished Product ............................................................................................................................. 169 5.3 Conclusion .............................................................................................................................................. 179
Financial Modeling Core– TABLE OF CONTENTS

7
Before We Get Started…
Congratulations on acquiring to Training The Street’s ttS Financial Modeling course Pack. Training The Street (TTS for short) is the world’s foremost provider of instructor-led courses in financial modeling and valuation training. We work with Wall Street investment banks, Fortune 500 companies, business schools, and colleges.
This self-study book is a response to a need many of you have expressed—a need for a course pack you could use on your own if you could not attend one of our live classes. What you have in your hands is the very best out-of-classroom experience possible—a distillation of all the knowledge we’ve gained from training thousands of professionals and students in live seminars. This is a complete, self-contained course. You won’t need any other resources to become proficient at Excel-based core financial modeling. Welcome aboard, and let’s get started.
1.1 Who iS thiS courSe For?
First off, you don’t have to work on Wall Street—or be planning to—in order to benefit from this course. Financial modeling has a vast range of applications, and our course is designed for professionals and students from many backgrounds and with very different goals. We’ve focused on transferable skills and techniques that can be applied in a diverse range of industries and businesses. For sure, these include traditional areas such as investment banking, investment research, and sales and trading, but financial modeling is also used in:
• consulting – Financial models help management and strategy consultants develop and deliver value-added advice to their clients.
• industry Finance – Financial modeling is used extensively in the internal finance departments of companies ranging from small technology start-ups to large multinationals.
• retail industry – Managers use models to forecast volumes and trends both on the buy side (for example, a fashion buyer) and on the sell side (for example, a fashion label).
• accounting – Models are critical in preparing and auditing financial statements. TRA
ININ
G T
HE
STR
EET

8
This package is designed for:
• People new to modeling, • Intermediate modelers, and • Experienced modelers.
new to modeling – Perhaps you are transitioning to a job that requires financial modeling skills or preparing for an interview where you will be tested on modeling. If you’re new to Excel-based financial modeling, don’t worry. You’ll find that our materials provide an intuitive, step-by-step approach. Regardless of your comfort level with the subject, we will be there to walk you through the challenges. We’ve seen them a thousand times in our live classes, and we’ve figured out the clearest and quickest ways to get these concepts across to you.
intermediate modelers – Perhaps it’s been a while since you last built a financial model. You can use this guide as a quick refresher, or to introduce yourself to a different application of modeling. There are plenty of sophisticated challenges in this how-to guide to sharpen the skills of the intermediate user.
experienced modelers – If you’re already an experienced financial modeler, you’ll very likely find some new ideas throughout this book that will make you faster and more efficient and equip you with a more powerful and logical approach.
1.2 hoW iS thiS courSe orGanized?
With years of professional teaching experience behind us, we have assembled what we believe is the optimal way to teach you financial modeling. Our complete ttS Financial Modeling Package comes in two sets of materials:
1. excel Best Practices course Pack – This dedicated module, which comes in a separate course pack, covers Excel-based best practices in financial modeling. Through a series of carefully chosen exercises, it teaches you how to use Excel to find your way around a financial model. It introduces you to navigational efficiencies, keyboard shortcuts, formulas and functions, and data table analysis.
2. Financial Modeling course Pack – The course pack you have in your hands teaches you how to construct an integrated financial model from scratch. It assumes you have very limited knowledge in financial model building. In the appropriate sections, it also introduces you to Excel-based best practices.
Both course packs blend a traditional hard-copy book format with Excel templates and online media. In each case, the hard-copy book is a resource guide you can access even when you are away from your computer. The Excel
Before We Get Started – CHAPTER 1
Included in the Excel Best Practices Course Pack are an Excel Best Practices Flip Chart, Excel Drills and an Online Companion.
Included in the Financial Modeling Course Pack are the Self-Study Book, Case Studies and an Online Companion.

9
exercises, templates, and model reinforce the concepts covered in the books. For trickier concepts and modeling techniques, we offer a library of online media designed to walk you through these more difficult topics and to illustrate efficiencies. Our online media library is continually updated with the latest software, functionality, and support.
SPecial FeatureS
Multimedia – This icon indicates that you can find multimedia clips in the Online Companion. Please log in to the website to view the Online Companion. You can pause to watch the multimedia clips and then return to the book.
Key Formulas – To accelerate your learning, we have also identified key formulas we regard as especially critical to financial modeling. You will recognize them by the “key” icon next to them.
excel Shortcut – We are big fans of using shortcut keys! It makes you more efficient. For more tips and tricks, we recommend purchasing our Excel Best Practices Course Pack.
1.3 oPtiMizinG the Way you uSe thiS courSe
Throughout this guide, you will encounter practical, how-to questions aimed at keeping you focused and helping you get the most out of the course. Some examples:
• Have you ever seen this particular type of model? Can you use it in your current or future job?
• There are often different ways to accomplish a given modeling task. Can you imagine a different way of doing this particular task?
• As you examine the structural details of the model you are building, can you discern a predictable sequence in it? Can you apply that sequence? This question gets you to ‘play architect’ and to take a “Big Picture” view.
• Can you perform this task or build this model faster? One thing that separates advanced modelers from intermediate modelers is their ability to create a model quickly and efficiently.
• Now that you’ve worked on modeling a bit, can you time yourself? A clock is the “bathroom scale” of modeling. This guide will push you to find the most efficient ways to complete modeling tasks. It’s the only way to improve.
• How long does it take you to complete the whole model? A seasoned financial modeler could complete the following model in just a few hours.
Please view the online companion for related supplementary media.
Before We Get Started – CHAPTER 1
This is your first opportunity to use the Online Companion. Please log on and view the TTS introduction and how to use the online media player.

10
1.4 What exactly iS a Financial Model?
A financial model is a simplif ied, mathematical representation of a company’s financial and operational performance over a number of historical (past) and projected (future) periods. Business professionals use models to predict the outcome of a financial decision or to forecast how a company will respond to various hypothetical economic events.
Typically, to get a sense of past trends a financial modeler examines three years of historical data. The reason for this is practical: Most public companies provide three years of information in their annual financial disclosures. But the length of the projection period ultimately depends on what the model will be used for. For example:
1. Are you an equity research analyst trying to get a sense of the company’s immediate future? Then you may need to forecast its earnings using a 3- to 5-year projection model.
2. Or do you need, instead, to be able to assess a company’s future performance or value when it matures and reaches a steady state of growth? Then your projection model may need to forecast the next 5 to 10 years. Indeed, you may need an even longer-term model if you are forecasting a “growth” company. Growth companies often take more than 10 years to reach steady state.
We believe generally that five years is generally an approximately long enough projection period to get a good sense of a company’s immediate future. But in your real-world work, the important thing to ask yourself is what the
model’s purpose is. Effective modelers make every decision with this end goal in mind.
Length of projection period is just one factor, however. There are many kinds of models to choose from. Here are a few basic ones:
• Corporate Finance Model – earnings model/Profit and loss model – Debt/Recapitalization/Financing model – Merger consequences model – Comps model – discounted cash flow model
• Sales and Trading Model – Bond pricing model – Option pricing model
• Industry Finance Model
• Detailed budgets/Profit and loss
In this book, we will guide you through the creation of one particular type of model: the earnings model. Its primary goal is to examine a company’s earnings per share (EPS) and earnings per share growth over the immediate future. Why did we choose this kind of model? Several reasons:
First, it’s everywhere: It is the most common type of model among financial practitioners. For instance, at many companies internal finance teams use it to forecast its profit and loss (P&L). Investment bankers forecast the same information, using the model to pitch value-added products and services to a client. Research analysts use it to forecast EPS to support an investment recommendation.
Before We Get Started – CHAPTER 1

15
Foundations of Financial Modeling
2.1 SettinG uP a Model
Good versus bad modelsIn financial modeling, there are, as the old saying goes, many roads up the same mountain. Over time, as you model more companies in different industries, you will come to develop your own modeling style and preferences. For example, you may prefer a vertically laid-out model to the horizontal one we present in this book. In modeling, there are often no right or wrong answers. But there are certainly good and bad models! The preferences, style choices, and other modeling decisions you make are up to you, but they should reflect the three core characteristics of a good model. A good model is:
• Realistic and robust – It uses reasonable, defensible assumptions to make realistic projections of a company’s future performance. A realistic forecast of a company’s future is one that “fits” the company’s past performance well. It builds on historical precedents and discernible trends to tell a cohesive, coherent, and credible story about where the company has been, and where it’s headed.
• Flexible and dynamic – We touched on this earlier. A good model has a dynamic, adaptable architecture. For example, the model we’ll build in this book employs a “modular” approach in which certain “supporting” schedules—the depreciation schedule, for instance—are built separately from the “core” financial statements that they support. (By “core” we mean the income statement, balance sheet, and statement of cash flows.) This modular approach makes the model dynamic. Why? Because any change to a supporting schedule—for instance, a switch from straight-line depreciation to an accelerated depreciation method on the depreciation schedule—will “flow through.” It will automatically update any relevant line items that are on the core statements.
• easy to follow – A good model simplifies the complex—yet without oversimplifying. Many enthusiastic modelers feel driven to come up with a big, complicated, detailed, robust recreation of a given company’s business. Robustness is certainly a part of our goal, but true mastery lies in the modeler’s ability to simplify where it would improve clarity, in order to communicate the TR
AIN
ING
TH
E S
TREE
T

16
story embodied in that recreation to an end user who isn’t an expert, or who wasn’t involved in building the model. Whether the end user is an internal manager or an external client, they should be able to follow the logic of your model’s calculations, assumptions, and forecasts with enough clarity that they can use it on their own. A good model, in short, has an orderly progression—or “flow”—that is continuous, intuitive, and logical, and which makes it intelligible to many people, not just the person who built it. The power of a good model lies in its simplicity. Make your model no more complicated than it needs to be.
Vertical versus horizontal modelsVertical ModelsAlthough there is no single correct way to lay out a model, two approaches are commonly used. One is to lay it out vertically. That means all the schedules are laid out on a single Excel worksheet.
exhibit 2.1
Sheet1
incoMe StateMent
Balance Sheet
caSh FloW StateMent
Compared to a horizontal layout, this layout confines you to one or a small number of worksheets and uses many more rows. There are advantages and downsides to this approach:
• Advantage – It’s compact! You can have all of your analysis on one worksheet. This allows you to keep your focus in one area and in one view. A vertical layout is ideal for what’s often called a “one pager” analysis or model. Example: An operating income model that forecasts from revenue to EBIT using mainly operating drivers. One can easily visualize keeping this analysis on a single worksheet. (A “one pager” is not always literally one page; it refers loosely to the fact that it’s compact.)
• Advantage – It allows for easy alignment of columns and headings. A modeling best practice is, whenever possible, to keep the same column letters for the same projected years on different sheets or analyses. For example, you could make column K correspond to the first projected year on all the schedules. This would make it easier to audit cell references and to maintain consistency throughout the model.
• Downside – They can be tough to navigate. This is especially true if the model takes up many rows. But several Excel best practices exist that can help you navigate through a vertical model more quickly.
Foundations of Financial Modeling – CHAPTER 2

17
Horizontal ModelsThe second approach is to lay out your model horizontally.
exhibit 2.2
In a horizontal model, each individual worksheet contains its own schedule and is linked to other schedules. The model we will create in this book is a horizontal one. This layout too has advantages and downsides:
• Advantage – Great readability! A horizontal model offers a cleaner, more intuitive layout. A user can readily access different schedules by simply reading the different tab labels.
• Advantage – It is easier to set up. To add functionality, you can simply insert new worksheets instead of building downward as you would in a vertical model.
• Downside – The model spreads out as worksheets are added, and too many sheets can begin to make it unwieldy and hard to navigate. But as with vertical models, there are Excel best practices that can help you navigate a horizontal model more quickly.
a hybrid layoutAs we said, there’s no universal best way to build a model. The question you should ask when constructing one is: What is it going to be used for? For example, the template we’ve created for your earnings model uses multiple supporting schedules. We could have opted for
a vertical model instead, but it probably would have been more cumbersome and less readable. What we could have done, however, is to create a hybrid model by combining elements of a horizontal layout and a vertical layout to suit our purposes Take a look at Exhibit 2.3:
exhibit 2.3
What are the strengths of this hybrid layout? In our opinion, it makes better sense to keep the core statements in a single (vertical) location. That way, you or a colleague can quickly scroll though income statement, balance sheet, and cash flow statement. But the supporting schedules are laid out horizontally, making them more readable and easier to access. There’s no one correct way: The idea behind the hybrid is that you can mix and match the best parts of each, but let purpose be your over arching guide. What you’re trying to do is to communicate, not stick to a rigid convention or a preconception of what’s best.
Please view the online companion for related supplementary media.
Foundations of Financial Modeling – CHAPTER 2
Sheet1
WorKinG caPital
Sheet1
PP&e, dePreciation
Sheet1
intanGiBleS, aMortization
Sheet1
deBt and intereSt
Sheet1
ShareholderS equity
Sheet1
other lonG terM iteMS
Sheet1
incoMe StateMent
Balance Sheet
caSh FloW StateMent
Sheet 1 Sheet 2 Sheet 3
Sheet 1 Sheet 2 Sheet 3
Sheet 1 Sheet 2 Sheet 3
incoMe StateMent
Sheet 1 Sheet 2 Sheet 3
Sheet 1 Sheet 2 Sheet 3
Sheet 1 Sheet 2 Sheet 3
Balance Sheet
Sheet 1 Sheet 2 Sheet 3
Sheet 1 Sheet 2 Sheet 3
Sheet 1 Sheet 2 Sheet 3
caSh FloW StateMent

18
cell commentsYou can use cell comments to document or annotate a worksheet. Comments are like little digital Post-Its®. You can use them for many things: for example, to clarify some result or complexity within your model, leave a note or an instruction for another user, explain why you used a particular formula, or leave a general paper trail. When you insert a comment in a cell, Excel places a small red triangle in the upper right-hand corner of the cell to indicate that there is a comment in the cell (see Exhibit 2.5).
The model you will be working on uses comments extensively to source information from the financial statements, explain complexities, and highlight various concepts. Our models and templates are loaded with comments.
To view a comment, first switch on your Comment Indicator using the Office Button, Excel Options, Advanced menu: Af i a (Alt F, I, A):
exhibit 2.4
exhibit 2.5
To make the comment temporarily visible, hover your cursor over the cell (see Exhibit 2.6).
To view the comment without using the mouse, navigate to the cell using your arrow keys and then hold down B + @ (Shift + F2).
To get out of comment viewing mode, hit the Esc key twice.
To insert a comment in a cell, use the same shortcut B + @ (Shift + F2)
exhibit 2.6
Please view the online companion for related supplementary media.
Foundations of Financial Modeling – CHAPTER 2

39
Let’s Start Modeling…
Imagine you are building a house from the ground up and are responsible for all aspects of construction. You can’t just start to build without a blueprint. You’ll need to look at the project on what we might call a “macro” and a “micro” level. The “macro” level involves conceiving the structure and layout of the entire building, and drawing floor plans from an architectural standpoint. Once you have the structure and floor plans laid out, then you can tackle the “micro” level. This involves designing the layout of specific rooms and figuring out the best way to put in the plumbing, ventilation systems, dry wall, and electrical wiring. Even after this, you still can’t just go in and start building. In all aspects of the home building, there are building codes, architectural standards, and engineering best practices that you’ll need to familiarize yourself with and follow. You’ll also discover that, although all construction companies follow roughly the same sequence of steps, there is some room for discretionary choice. Each group of practitioners brings their own set of approaches and styles.
Financial model construction is somewhat like building a house. As you build this model, a discernible pattern will emerge on both a “macro” and a “micro” level. The macro level reflects the particular sequence in which we create our core statements and supporting schedules. We begin by setting up the core statements. Next, we look at the company’s internal sources for funding growth (working
capital, property, plant & equipment, intangibles, and other long-term assets and liabilities). Finally, we schedule the company’s external funding from equity and debt holders. This is like creating the rooms in a home. And yet within each room, there is a specific layout of where things should go and in what order. This is the “micro” level of model building.
The key thing to keep in mind is that the end result is mostly the same across practitioners: most earnings models are similar, but how they are built reflects the personal style of the modeler, and the needs of the end user.
i. “Macro” level: Modular approachIn this course, we’ll use a modular approach to construct our earnings model. This means that many items on our core statements (i.e., the income statement, balance sheet, and cash flow statement) will be forecasted using information contained on ‘supporting’ schedules (see Exhibit 4.1).
exhibit 4.1
Let’s Start Modeling... – CHAPTER 4
Sheet1
incoMe StateMent
Sheet1
Balance Sheet
Sheet1
caSh FloW StateMent
core Statements
Sheet1
WorKinG caPital
Sheet1
PP&e, dePreciation
Sheet1
other SuPPortinGStateMentS
Supporting Statements
44
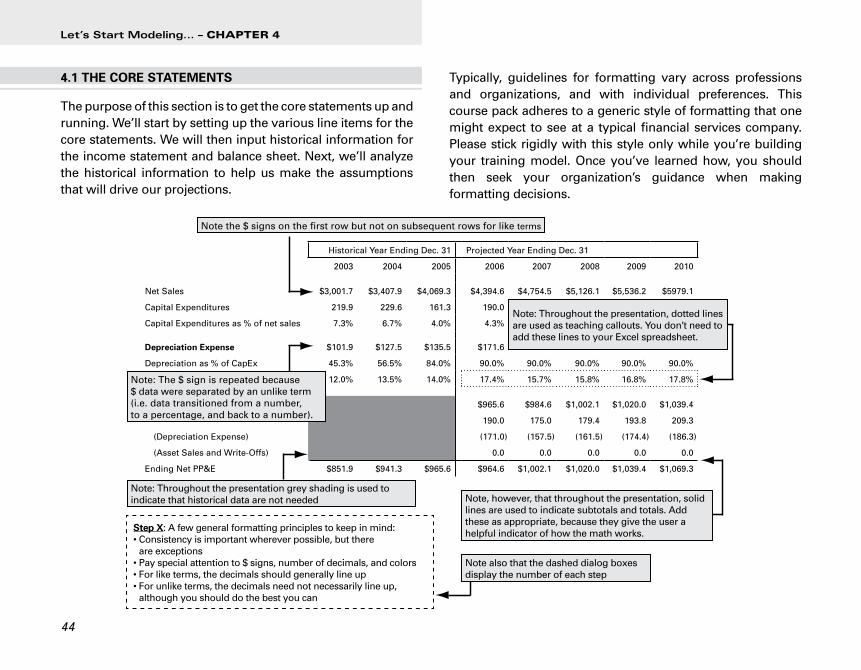
4.1 the core StateMentS
The purpose of this section is to get the core statements up and running. We’ll start by setting up the various line items for the core statements. We will then input historical information for the income statement and balance sheet. Next, we’ll analyze the historical information to help us make the assumptions that will drive our projections.
Typically, guidelines for formatting vary across professions and organizations, and with individual preferences. This course pack adheres to a generic style of formatting that one might expect to see at a typical financial services company. Please stick rigidly with this style only while you’re building your training model. Once you’ve learned how, you should then seek your organization’s guidance when making formatting decisions.
Step x: A few general formatting principles to keep in mind:• Consistency is important wherever possible, but there
are exceptions• Pay special attention to $ signs, number of decimals, and colors• For like terms, the decimals should generally line up• For unlike terms, the decimals need not necessarily line up,
although you should do the best you can
Historical Year Ending Dec. 31 Projected Year Ending Dec. 31
2003 2004 2005 2006 2007 2008 2009 2010
Net Sales $3,001.7 $3,407.9 $4,069.3 $4,394.6 $4,754.5 $5,126.1 $5,536.2 $5979.1
Capital Expenditures 219.9 229.6 161.3 190.0
Capital Expenditures as % of net sales 7.3% 6.7% 4.0% 4.3%
depreciation expense $101.9 $127.5 $135.5 $171.6
Depreciation as % of CapEx 45.3% 56.5% 84.0% 90.0% 90.0% 90.0% 90.0% 90.0%
12.0% 13.5% 14.0% 17.4% 15.7% 15.8% 16.8% 17.8%
$965.6 $984.6 $1,002.1 $1,020.0 $1,039.4
190.0 175.0 179.4 193.8 209.3
(Depreciation Expense) (171.0) (157.5) (161.5) (174.4) (186.3)
(Asset Sales and Write-Offs) 0.0 0.0 0.0 0.0 0.0
Ending Net PP&E $851.9 $941.3 $965.6 $964.6 $1,002.1 $1,020.0 $1,039.4 $1,069.3
Note the $ signs on the first row but not on subsequent rows for like terms
Note: The $ sign is repeated because $ data were separated by an unlike term (i.e. data transitioned from a number, to a percentage, and back to a number).
Note: Throughout the presentation grey shading is used to indicate that historical data are not needed Note, however, that throughout the presentation, solid
lines are used to indicate subtotals and totals. Add these as appropriate, because they give the user a helpful indicator of how the math works.
Note also that the dashed dialog boxes display the number of each step
Let’s Start Modeling... – CHAPTER 4
Note: Throughout the presentation, dotted lines are used as teaching callouts. You don’t need to add these lines to your Excel spreadsheet.

48
Use company filings, company-provided financial reports, or research reports to determine the appropriate line items.
Use simplifications or a more detailed breakout of line items as appropriate. Base your decision on how you intend to project these items in future periods.
In general, intangibles should be broken out into three categories: (1) goodwill, (2) definite life intangibles, and (3) indefinite life intangibles. We’ll discuss this in more detail on the amortization and other long-term items schedules. For now, suffice it to say that we break these items out because they are projected differently. As always, you will want to search the financial footnotes for greater detail on these items.
You will also notice that, in our suggested layout, there is no debt listed under current liabilities. Instead, you should model debt separately using two categories: (1) long-term debt, which includes interest bearing liabilities with maturities that are greater than one year; and (2) the revolver, which includes interest-bearing liabilities with maturities that are less than one year.
To simplify, consider adding the current portion of long term-debt to the long-term debt category. Also, again to simplify, consider placing only the revolving credit facility in the revolver line item and moving all other types of debt to long-term.
The following is an example of a typical template, but feel free to customize it for your particular work circumstances.
STEP 2Set up the balance sheet
NOTES
Please view the online companion for related supplementary media.

54
NOTES
Forecast operating expenses (cost of goods sold, SG&A) by flatlining margin assumptions, for example, gross margin or SG&A as a percentage of sales.
– Cost of goods sold is calculated as:
cost of Goods Sold = Sales x (1 – Gross margin driver)
– SG&A is calculated as:
SG & a = Sales x SG&a as a % of Sales
Use historical data or research reports to obtain guidance on appropriate assumptions for drivers.
– Remember, the key question to ask is: Are the chosen assumptions reasonable and defensible?
The line item other operating expenses/(income) is usually forecast as a number, based on research or historical data, because it is a mixture of income and expense items that, together, are difficult to project as a percentage of sales (or of any other item).
Calculate down to EBITDA, but leave depreciation and amortization blank for now. Depreciation and amortization expenses will be referenced from separate, supporting schedules once they are completed.
STEP 6Project operating expenses
down to EBITDA
Flatline BlacK references: set equal to previous year if kept constant
Only one Blue inputcell if a constant forecast assumption
Drivers
CalculationsForecasts
Please view the online companion for related supplementary media.

TRA
ININ
G T
HE
STR
EET
Finishing Touches
Now that you’ve completed the steps for building your model, it is tempting to believe that you are done. It is at this stage, however, that an experienced modeler realizes their work is, in a sense, really just beginning. In the remaining sections of this guide, we will discuss techniques for troubleshooting your ‘finished’ model to make sure it is truly in working condition.
Next, we will explore applications of the finished product to answer a fundamental question: What can I actually do with this completed financial model? How can I apply it to solve the everyday problems and challenges I’m faced with as a financial practitioner?
Keep in mind that some of the concepts we are about to cover are somewhat advanced; they may take additional study and practice to truly understand and master. Our goal is to give you a working knowledge of the approach proficient modelers take to ‘finish’ their models and put them to practical use.
Let’s begin with troubleshooting your model.
Please view the online companion for related supplementary media.

162
5.1 trouBleShootinG your Model
the three Safety checksBefore you can consider your model fully functional and ready to be used, there are a number of safety checks that you need to apply to it. Let’s explore three of these safety checks, outlined below:
1. circularity check – Your completed model is ‘circular.’It is important to understand what circularity is and how to ’jump start’ a circular model that is broken, or that has ’blown up.’
2. Parity check – A fully functional model must be balanced, or ‘in parity.’ That is, assets must equal the sum of liabilities and equity on the balance sheet (a = l + e).
3. check for ‘deal’ readiness – Once you are satisfied that your circular model is functioning properly and is balanced, look it over again to ensure it is truly ready for a deal, for client presentation, or for some other similarly ‘mission-critical’ purpose.
i. the circularity checkWhen you calculated interest expense and linked it to the income statement on step 76, you created what is called a ‘circular reference.’ Excel defines a circular reference as a formula that “refers back to its own cell, either directly or indirectly.” This is important because the program cannot calculate such a formula on its own. That is, circular references cannot be calculated automatically using Excel’s default settings. in a moment, we will expand our discussion of iterations and how to activate them in excel.
For now, just understand that because our model is circular, Excel has difficulty calculating a solution.
Before we describe how to calculate formulas in a circular model, let’s pause here and first explain why your model is circular. The above diagram (Exhibit 5.1) illustrates how your model connects the income statement to the cash flow statement, the cash flow statement to the debt and interest schedule, and the debt and interest schedule back to the income statement in a circular way: As an example of circularity in your current model, let’s say that in a given year the company you are modeling has a financing ‘need’ or cash flow ‘deficit.’ That is, it needs more cash to fund its operations, investments, and scheduled debt payments than it is currently generating. In such a scenario, your model’s ‘cash sweep’ logic causes the revolver to kick in, or be ‘drawn down,’ generating increased short-term borrowings.
Finishing Touches – CHAPTER 5
interest expense and
interest income
average revolverand
cash Balances
Free cash Flow
net income
exhibit 5.1