bonus lecture: what is my program doing? - parallel...
TRANSCRIPT


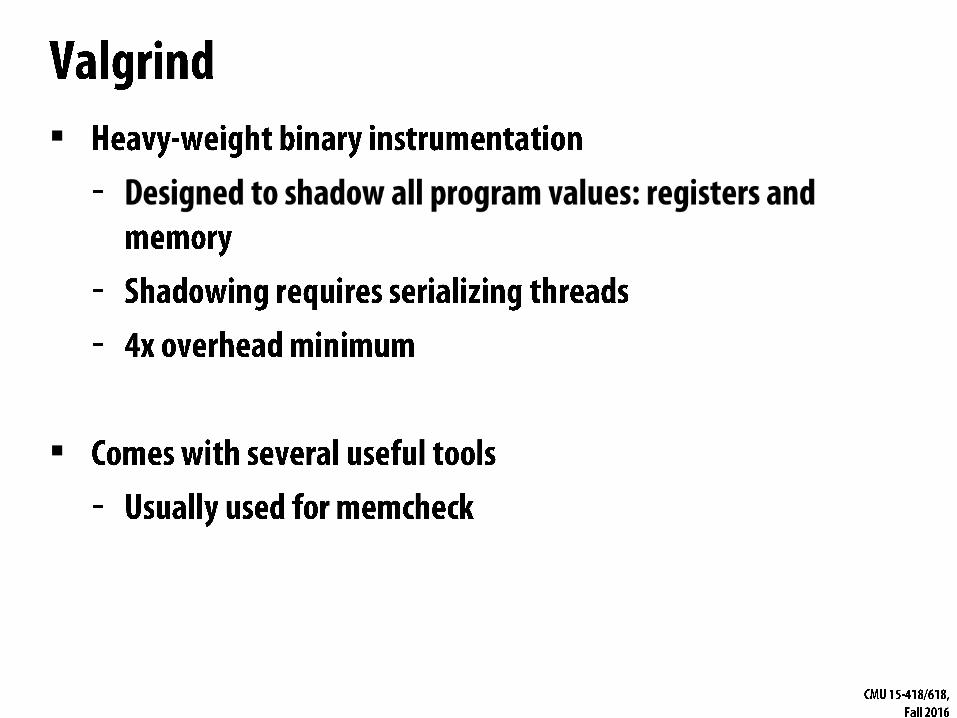
▪
▪

▪
▪

▪
▪
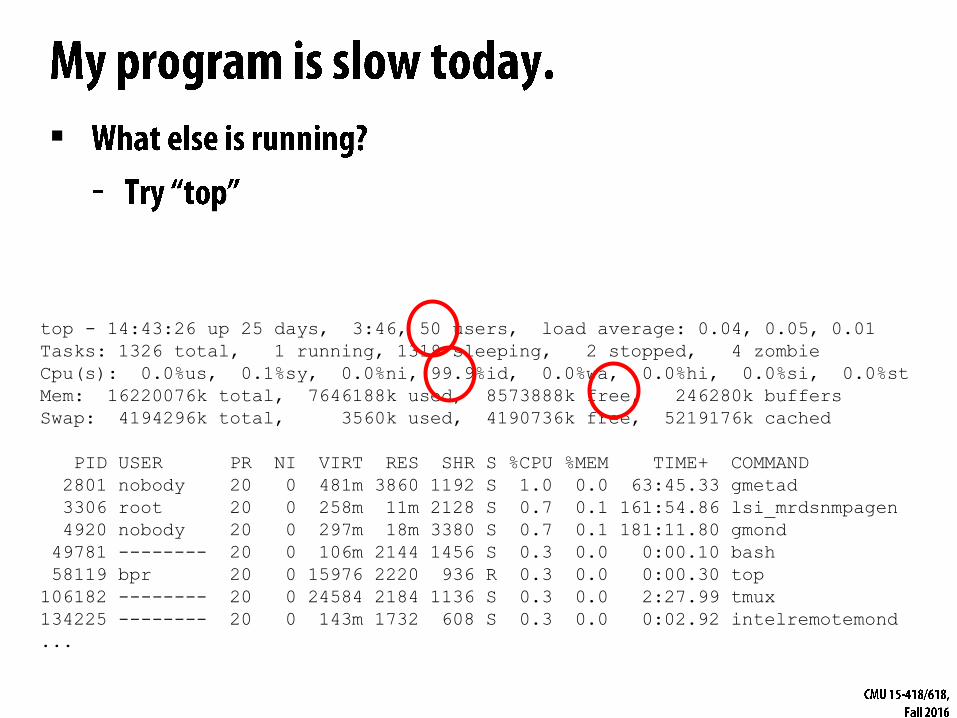
top - 14:43:26 up 25 days, 3:46, 50 users, load average: 0.04, 0.05, 0.01
Tasks: 1326 total, 1 running, 1319 sleeping, 2 stopped, 4 zombie
Cpu(s): 0.0%us, 0.1%sy, 0.0%ni, 99.9%id, 0.0%wa, 0.0%hi, 0.0%si, 0.0%st
Mem: 16220076k total, 7646188k used, 8573888k free, 246280k buffers
Swap: 4194296k total, 3560k used, 4190736k free, 5219176k cached
PID USER PR NI VIRT RES SHR S %CPU %MEM TIME+ COMMAND
2801 nobody 20 0 481m 3860 1192 S 1.0 0.0 63:45.33 gmetad
3306 root 20 0 258m 11m 2128 S 0.7 0.1 161:54.86 lsi_mrdsnmpagen
4920 nobody 20 0 297m 18m 3380 S 0.7 0.1 181:11.80 gmond
49781 -------- 20 0 106m 2144 1456 S 0.3 0.0 0:00.10 bash
58119 bpr 20 0 15976 2220 936 R 0.3 0.0 0:00.30 top
106182 -------- 20 0 24584 2184 1136 S 0.3 0.0 2:27.99 tmux
134225 -------- 20 0 143m 1732 608 S 0.3 0.0 0:02.92 intelremotemond
...
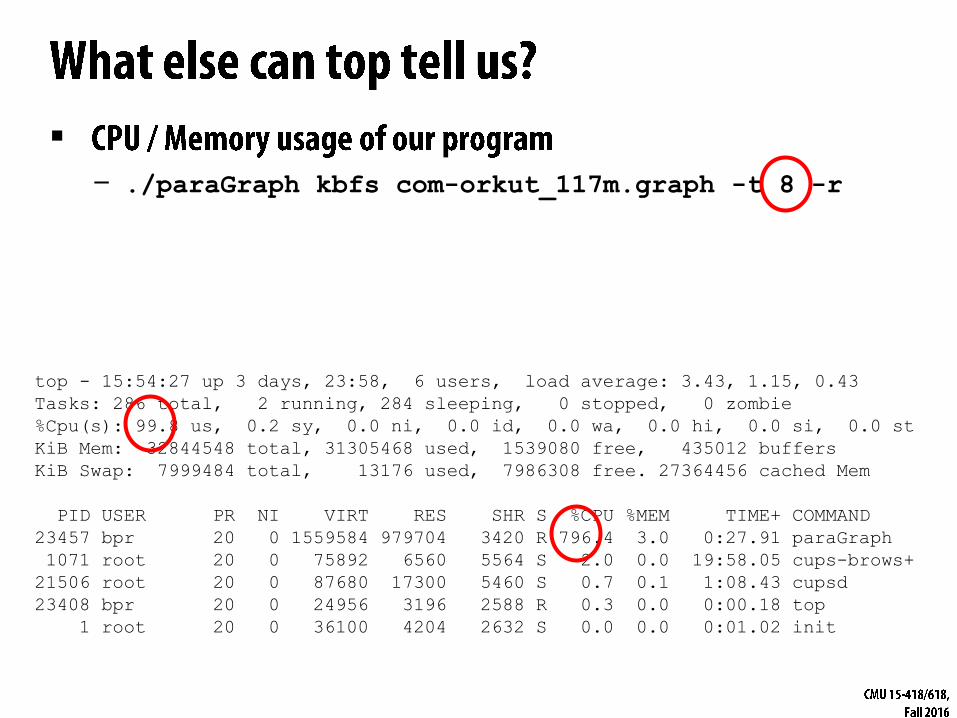
▪- ./paraGraph kbfs com-orkut_117m.graph -t 8 -r
top - 15:54:27 up 3 days, 23:58, 6 users, load average: 3.43, 1.15, 0.43
Tasks: 286 total, 2 running, 284 sleeping, 0 stopped, 0 zombie
%Cpu(s): 99.8 us, 0.2 sy, 0.0 ni, 0.0 id, 0.0 wa, 0.0 hi, 0.0 si, 0.0 st
KiB Mem: 32844548 total, 31305468 used, 1539080 free, 435012 buffers
KiB Swap: 7999484 total, 13176 used, 7986308 free. 27364456 cached Mem
PID USER PR NI VIRT RES SHR S %CPU %MEM TIME+ COMMAND
23457 bpr 20 0 1559584 979704 3420 R 796.4 3.0 0:27.91 paraGraph
1071 root 20 0 75892 6560 5564 S 2.0 0.0 19:58.05 cups-brows+
21506 root 20 0 87680 17300 5460 S 0.7 0.1 1:08.43 cupsd
23408 bpr 20 0 24956 3196 2588 R 0.3 0.0 0:00.18 top
1 root 20 0 36100 4204 2632 S 0.0 0.0 0:01.02 init

▪$ tail -n 1 bpr_grade_performance.job
time ./grade_performance.py ./$exe
▪
▪ /usr/bin/time ./paraGraph kbfs com-orkut_117m.graph -t 8 –r
...
33.16user 0.10system 0:05.54elapsed 600%CPU
(0avgtext+0avgdata 979708maxresident)k 0inputs+0outputs
(0major+5624minor)pagefaults 0swaps

▪
▪

▪

▪
▪
▪

▪
▪
▪
▪

▪
▪
▪
▪

▪
▪
▪ $./paraGraph pagerank -t 8 -r soc-pokec_30m.graph
▪ $gprof
% cumulative self self total
time seconds seconds calls ms/call ms/call name
69.35 0.43 0.43 1 430.00 430.00 build_incoming_edges(graph*)
30.65 0.62 0.19 18 10.56 10.56 pagerank(graph*, ...)
0.00 0.62 0.00 1632803 0.00 0.00 addVertex(VertexSet*, int)
0.00 0.62 0.00 7 0.00 0.00 newVertexSet(T, int, int)
0.00 0.62 0.00 7 0.00 0.00 freeVertexSet(VertexSet*)
▪
▪
▪
▪
▪

./paraGraph -t 8 -r pagerank /afs/cs/academic/class/15418-s16/public/asst3_graphs/soc-
pokec_30m.graph':
2366.633970 task-clock (msec) # 1.758 CPUs utilized
109 context-switches # 0.046 K/sec
9 cpu-migrations # 0.004 K/sec
6,168 page-faults # 0.003 M/sec
7,513,900,068 cycles # 3.175 GHz (83.23%)
6,327,732,886 stalled-cycles-frontend # 84.21% frontend cycles idle (83.42%)
4,019,403,839 stalled-cycles-backend # 53.49% backend cycles idle (66.86%)
3,222,030,372 instructions # 0.43 insns per cycle
# 1.96 stalled cycles per insn (83.43%)
457,170,532 branches # 193.173 M/sec (83.30%)
12,354,902 branch-misses # 2.70% of all branches (83.24%)
So what is the bottleneck?

▪
201,493,787 cache-references
49,347,882 cache-misses # 24.491 % of all cache refs
▪
▪

▪
▪
▪

▪
Samples: 11K of event 'cache-misses', Event count (approx.):
181771931
Overhead Command Shared Object Symbol
47.18% paraGraph paraGraph [.] edgeMapS<State<float> >
46.84% paraGraph paraGraph [.] build_incoming_edges
2.70% paraGraph [unknown] [k] 0xffffffff813b2537
1.37% paraGraph [unknown] [k] 0xffffffff813b2915

▪
Samples: 13K of event 'cycles', Event count (approx.): 11108635969
Overhead Command Shared Object Symbol
65.93% paraGraph paraGraph [.] edgeMapS<State<float> >
27.66% paraGraph paraGraph [.] build_incoming_edges
1.85% paraGraph paraGraph [.] vertexMap<Local<float> >
1.02% paraGraph [kernel.kallsyms] [k] clear_page_c
0.88% paraGraph paraGraph [.] addVertex
0.60% paraGraph [kernel.kallsyms] [k] copy_user_generic_string
▪

▪| bool update(Vertex s, Vertex d)
| {
| float add = pcurr[s] / outgoing_size(graph, s);
2.97 | divss %xmm1,%xmm0
5.22 | jmp 162
| nop
|160: mov %eax,%edx
| #pragma omp atomic
| pnext[d] += add;
0.16 |162: mov %edx,0x18(%rsp)
1.28 | mov %edx,%eax
0.01 | movss 0x18(%rsp),%xmm2
2.71 | addss %xmm0,%xmm2
4.63 | movss %xmm2,0x18(%rsp)
1.16 | mov 0x18(%rsp),%r15d
3.99 | lock cmpxchg %r15d,(%rcx)
25.22 | cmp %eax,%edx
| jne 160
1. OMP atomic -> lock cmpxchg
2. This instruction is 25%*65% of
execution time

▪Samples: 48K of event 'cycles', Event count (approx.):
39218498652
Overhead Command Shared Object Symbol
63.78% paraGraph paraGraph [.] edgeMapS<RadiiUpdate>
19.33% paraGraph paraGraph [.] edgeMap<RadiiUpdate>
8.21% paraGraph paraGraph [.] build_incoming_edges
3.88% paraGraph paraGraph [.] vertexMap<VisitedCopy>
▪

▪bool update(Vertex src, Vertex dst) {
| bool changed = false;
| for (int j = 0; j < NUMWORDS; j++) {
| if (visited[dst][j] != visited[src][j]) {
0.11 | mov 0x0(%r13),%rax
0.21 | mov (%rax,%rdi,1),%rbp
0.20 | mov (%rax,%rcx,8),%rax
14.88 | mov 0x0(%rbp),%ebp
1.15 | mov (%rax),%eax
68.27 | cmp %eax,%ebp
0.02 | je 108
| // word-wide or
| __sync_fetch_and_or(&(nextVisited[dst][j]), visited[dst]
1.54 | mov 0x8(%r13),%rcx
0.34 | or %eax,%ebp
0.02 | mov (%rcx,%rdi,1),%rcx
0.31 | lock or %ebp,(%rcx)
| int oldRadius = radii[dst];
| if (radii[dst] != iter) {
6.45 | mov 0x18(%r13),%ebp

▪
▪

▪
▪


▪
DR
AM
Ba
nd
wid
th (
GB
/se
c)
Execution Time (ms)
Graph Initialization kBFS Iterations

▪
DR
AM
Ba
nd
wid
th (
GB
/se
c)
Execution Time (s)
Graph Initialization kBFS Iterations

▪
▪
▪
▪
▪

▪
▪...
==29991== HEAP SUMMARY:
==29991== in use at exit: 2,694,466,576 bytes in 2,596 blocks
==29991== total heap usage: 16,106 allocs, 13,510 frees, 3,001,172,305 bytes allocated
==29991==
==29991== LEAK SUMMARY:
==29991== definitely lost: 112 bytes in 1 blocks
==29991== indirectly lost: 0 bytes in 0 blocks
==29991== possibly lost: 7,340,200 bytes in 7 blocks
==29991== still reachable: 2,687,126,264 bytes in 2,588 blocks
==29991== suppressed: 0 bytes in 0 blocks

▪
▪==1902== ERROR: AddressSanitizer: heap-buffer-overflow on address 0x7f683e4c008c
at pc 0x41cb77 bp 0x7f683bc14a20 sp 0x7f683bc14a18
READ of size 4 at 0x7f683e4c008c thread T6
#0 0x41cb76 (paraGraph+0x41cb76)
#1 0x7f6852efdf62 (/usr0/local/lib/libiomp5.so+0x89f62)
#2 0x7f6852ea7ae3 (/usr0/local/lib/libiomp5.so+0x33ae3)
#3 0x7f6852ea620a (/usr0/local/lib/libiomp5.so+0x3220a)
#4 0x7f6852ecab80 (/usr0/local/lib/libiomp5.so+0x56b80)
#5 0x7f684fdb7b97 (/usr/lib/x86_64-linux-gnu/libasan.so.0.0.0+0x18b97)
#6 0x7f684efa4181 (/lib/x86_64-linux-gnu/libpthread-2.19.so+0x8181)
#7 0x7f684f2b447c (/lib/x86_64-linux-gnu/libc-2.19.so+0xfa47c)
...

▪
▪
▪

▪
▪
▪

▪
▪

▪
▪
▪

▪
// Pin calls this function every time a new basic block is encountered.
// It inserts a call to docount.
VOID Trace(TRACE trace, VOID *v)
{
// Visit every basic block in the trace
for (BBL bbl = TRACE_BblHead(trace); BBL_Valid(bbl); bbl = BBL_Next(bbl))
{
// Insert a call to docount for every bbl, passing the number of
instructions.
BBL_InsertCall(bbl, IPOINT_ANYWHERE, (AFUNPTR)docount,
IARG_FAST_ANALYSIS_CALL, IARG_UINT32, BBL_NumIns(bbl), IARG_THREAD_ID, IARG_END);
}
}

▪
▪

▪▪
▪
▪
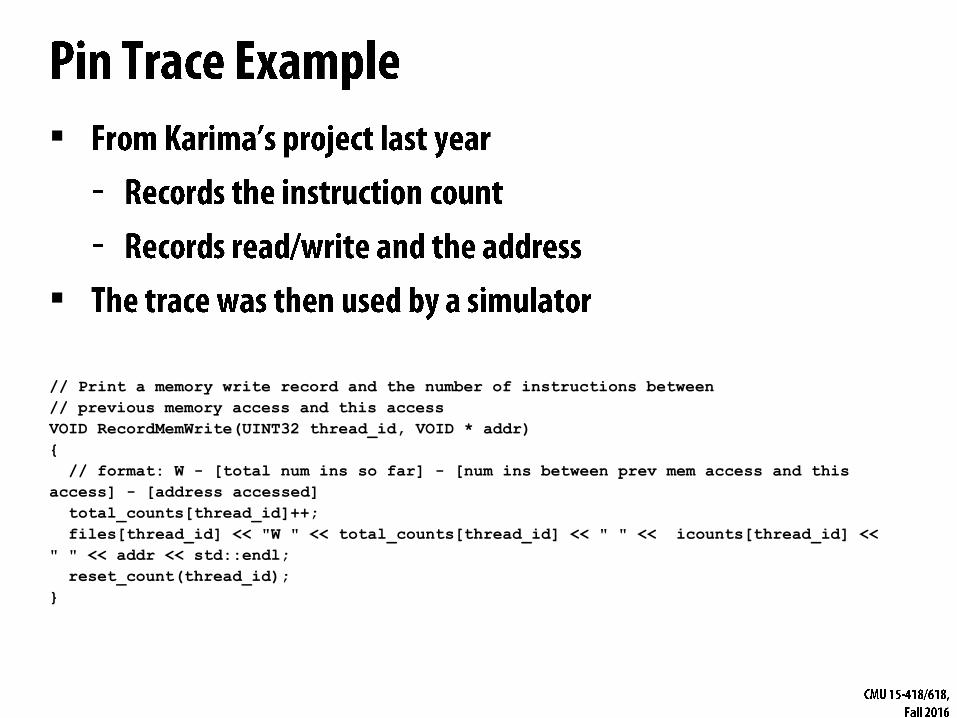
// Print a memory write record and the number of instructions between
// previous memory access and this access
VOID RecordMemWrite(UINT32 thread_id, VOID * addr)
{
// format: W - [total num ins so far] - [num ins between prev mem access and this
access] - [address accessed]
total_counts[thread_id]++;
files[thread_id] << "W " << total_counts[thread_id] << " " << icounts[thread_id] <<
" " << addr << std::endl;
reset_count(thread_id);
}

▪
▪
▪
▪

▪
▪

▪
Taskgraphs

▪ ./paraGraph bfs -t 8 -r soc-
pokec_30m.graph

▪
time / top
gprof / perf
▪
▪
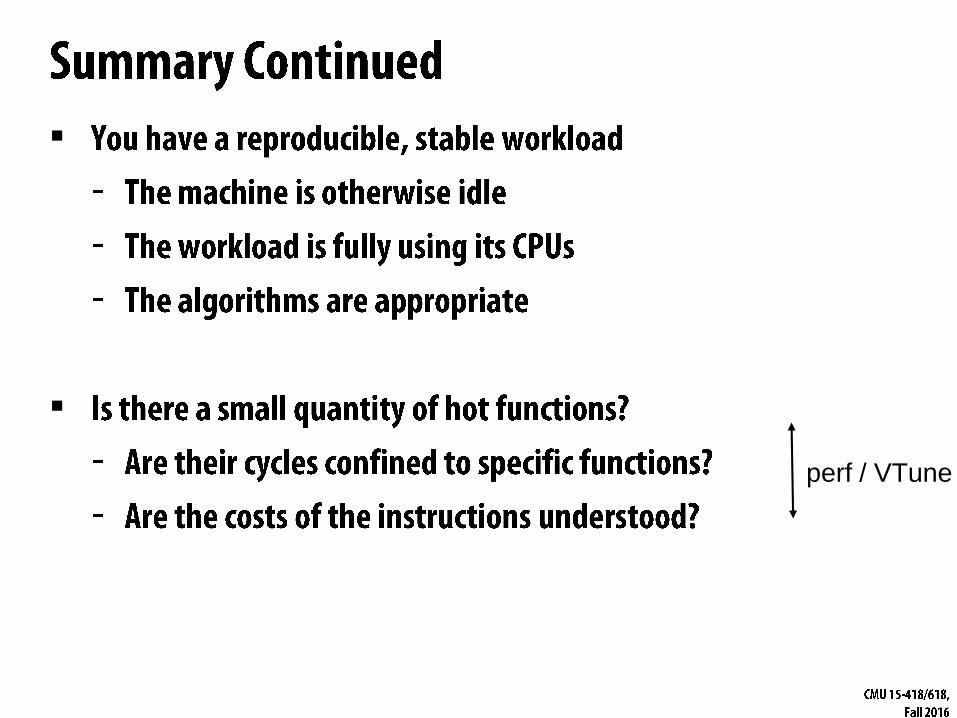
perf / VTune

▪
▪
▪
▪
▪
▪
▪
